

Submitted:
04 June 2026
Posted:
05 June 2026
You are already at the latest version
Abstract
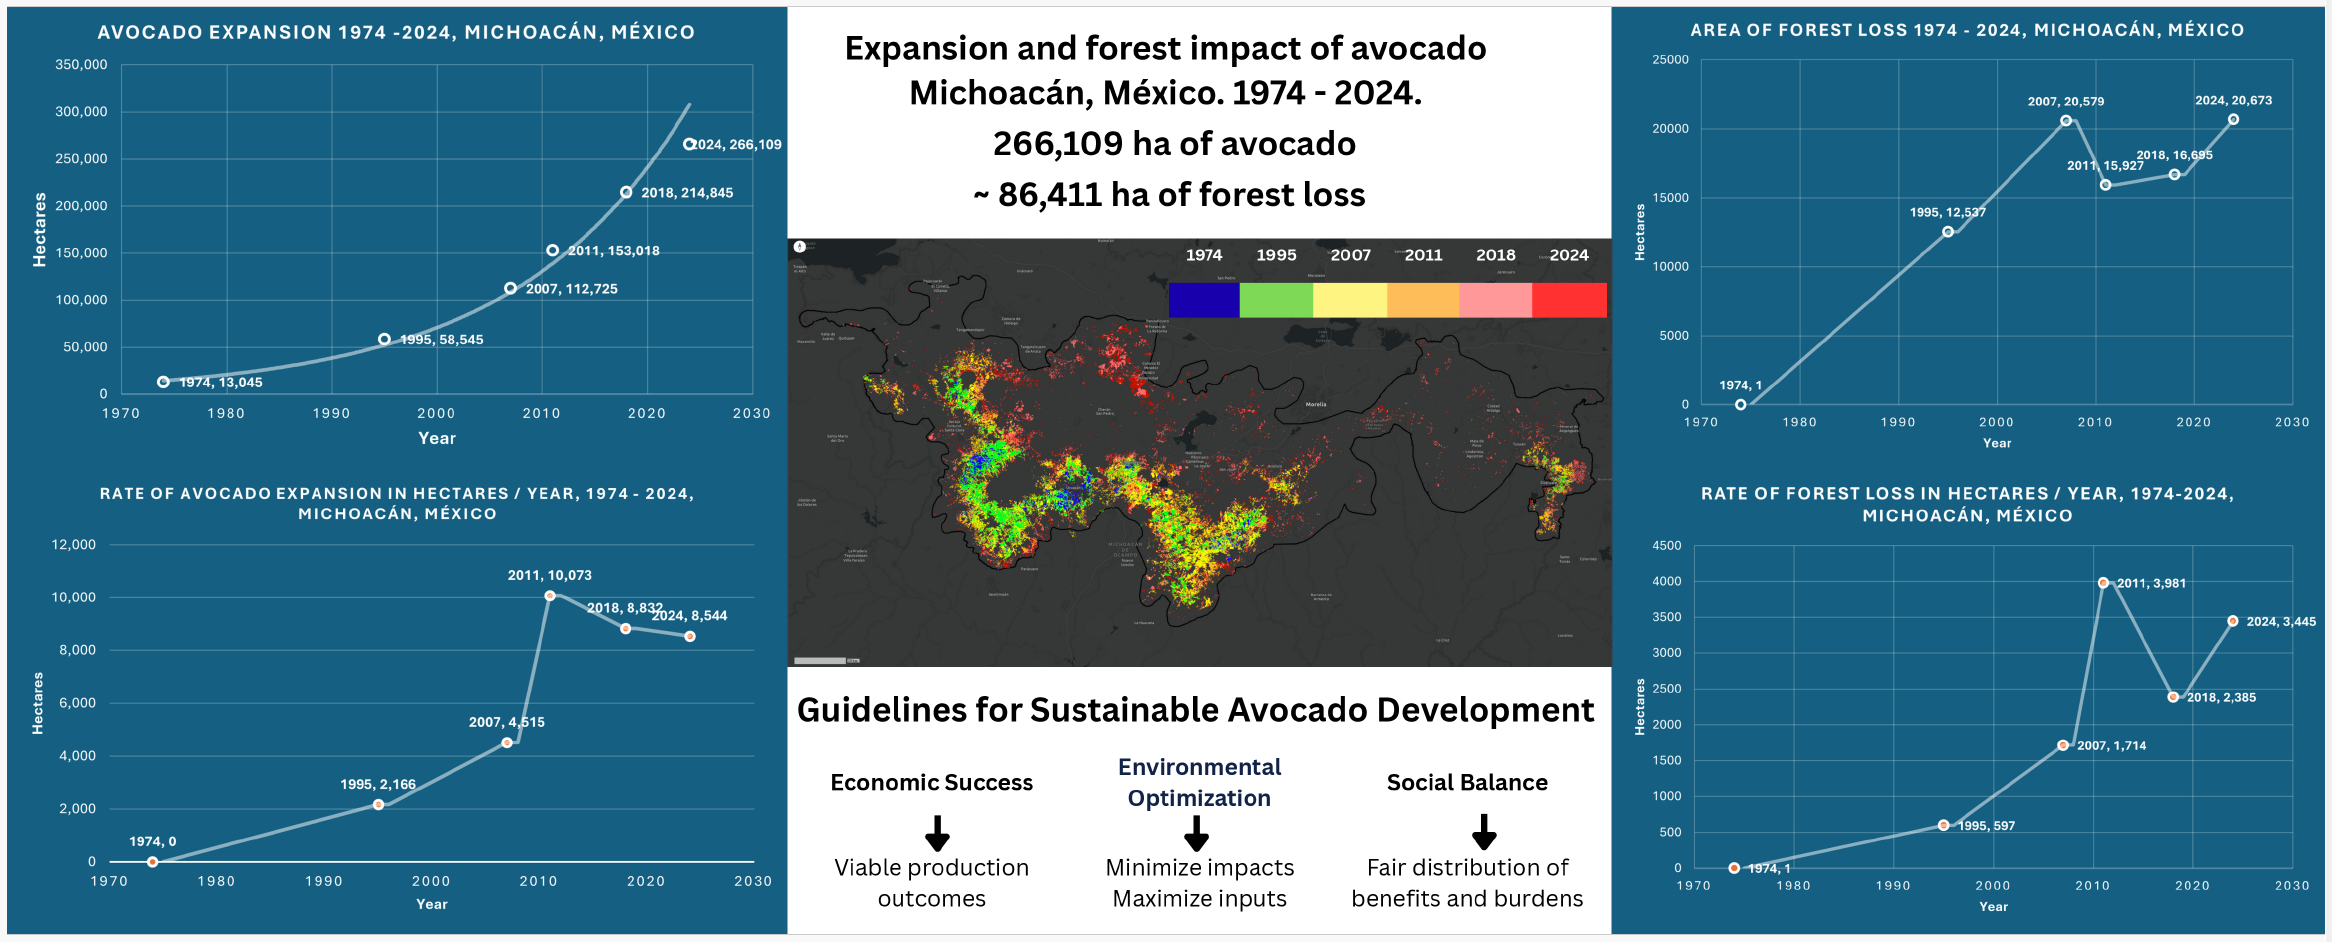
Avocado cultivation in Michoacán, Mexico, has undergone rapid expansion over the past five decades, transforming regional landscapes and economies. This study analyzes the spatial and environmental dynamics of avocado growth from 1974 to 2024, drawing on high-resolution geospatial data. Results show a 20-fold increase in cultivated areas (from 13,000+ to ~266,109 ha) accompanied by significant forest loss (~86,411 hectares) and fragmentation. While avocado production offers economic benefits, it raises concerns about ecological integrity, water access, and social equity. Although the study makes emphasis only on expansion-derived forest cover impacts, these findings underscore the need for spatially explicit governance tools to reconcile agricultural productivity with long-term territorial sustainability. We propose a conceptual framework for avocado sustainable territorial development using the planning principles known as the Triple E: efficacy, efficiency and equity.
Keywords:
avocado expansion
; forest loss
; forest fragmentation
; territorial sustainability
; Michoacán
1. Introduction
Avocado cultivation in Mexico dates to pre-Hispanic times. The Spanish word for avocado, aguacate, derives from the Nahuatl word ahuacatl, meaning “testicles.” Large-scale commercial production began in the second half of the 20th century, initially focused on local and national markets. The creation of guacamole, a distinctive preparation, played a key role in popularizing avocado beyond Mexico’s borders, especially among the U.S. population, influenced in part by growing Mexican migration. Additionally, the widely publicized nutritional benefits of avocado contributed to a surge in global consumption [1,2]. This rising demand facilitated the opening of the U.S. market, followed by other international markets. Today, Mexico and the United States are the primary consumers of Mexican avocado, with over 1,488 thousand tons and 1,226 thousand tons consumed in 2022, respectively [2].
Mexico is the world’s leading avocado producer, accounting for 26.6% of global output, with the state of Michoacán responsible for 75% of Mexico’s total production [2-3}. Located in Central Mexico, Michoacán offers ideal edaphoclimatic conditions for avocado cultivation, thanks to the coexistence of volcanic ash-derived soils (Andosols) and optimal ranges of temperature and humidity {4]. The region with these conditions forms an elongated strip due to its physiographic characteristics, commonly referred to as the “avocado belt.”
Unfortunately, the accelerated and unregulated development has led to a range of negative impacts {5-13]:
- Impacts on the public health of neighboring communities
- Impacts on the occupational health of people involved in agricultural practices
- Impacts on water availability and disruption of the hydrological cycle,
- Impacts on soil degradation
- Impacts on the archaeological heritage
- Impacts on the plant and animal ecology, particularly on forest ecosystems and pollinators
- Impacts on forest cover due to replacement and fragmentation by avocado orchards
There is a growing body of literature, both scientific and non-scientific, documenting the severity of the environmental issues associated with avocado cultivation. Local communities and environmental organizations have frequently voiced concerns, particularly through newspaper articles, condemning the unsustainable practices tied to the industry. One of the most recent and comprehensive accounts is the CRI Mexico Report [14], which details a range of environmental problems, especially those linked to avocado exports to the United States. The report prompted a formal petition from the U.S. Senate to the U.S. Department of State and the U.S. Department of Agriculture, urging action to prevent the sale of Mexican avocados associated with deforestation and other illegal activities [15].
Some mitigation efforts are being undertaken by producers, but they remain largely insufficient. The main avocado growers’ association, APEAM, has recently launched a strategic plan titled “The Route to Sustainability”, which includes a pledge to achieve zero net deforestation by 2035 [16]. As part of this initiative, APEAM reports having reforested 4,470 hectares [17], a figure that pales in comparison to the nearly twenty-fold area of forest lost due to avocado expansion.
One contributing factor to the absence of effective regulatory policy is the lack of accurate, context-specific studies that producers and authorities can reliably consult and trust. This study aims to help fill that gap by offering a grounded analysis of avocado development and its environmental implications. Also, while numerous studies have identified general pathways toward sustainability in avocado production, they often fall short of providing a structured, actionable framework. In contrast, our approach seeks to offer a conceptual foundation that can serve as a starting point for more methodical planning, informed decision-making, and policy development.
2. Materials and Methods
The history of avocado expansion in Mexico began in the 1970s, originating from a few focal areas in the state of Michoacán. Two decades later, with the imminent opening of the U.S. market, the industry experienced its first wave of expansion. However, it was not until the early 2000s, when the U.S. market became fully consolidated and other international markets began to open, that avocado cultivation entered a second wave of growth. More recently, a third expansion wave has been driven by the rise of domestic consumption, seasonal demand spikes linked to the American Super Bowl, and widespread promotion of the fruit’s nutritional benefits, despite slightly declining product prices [2].
Several efforts to map the expansion of avocado cultivation have been undertaken by various researchers and official agencies. However, many of these studies suffer from partial geographic coverage or limited accuracy, often due to the use of data with insufficient spatial or temporal resolution. As a result, estimates of the total area occupied by avocado during the expansion period remain inconsistent and difficult to reconcile.
This work draws upon the results of several studies conducted by members of the research team over two decades of investigation into avocado expansion and its impact [18]. These studies utilize the most reliable data available and offer comprehensive territorial coverage. In the following section, we present a series of six maps that chronicle the spatial history of avocado expansion in Mexico, spanning the period from 1974 to 2024.
2.1. Study Area
The identification of the avocado agricultural frontier required the delineation of two distinct study areas, with the larger area encompassing the smaller one. Both are depicted in Figure 1.
The use of two distinct study areas was necessary due to the spatial dynamics of avocado expansion. Between 1974 and 2011, orchards were predominantly concentrated within Study Area A. It was only in the subsequent years that cultivation expanded northward, as captured in Study Area B.
In both cases, the boundaries and dimensions of the study areas were delineated through a rapid exploratory analysis of available satellite imagery, aimed at identifying regions where avocado cultivation was visibly present.
2.2. Regional History of Avocado 1974–2024
Visual interpretation and on-screen digitizing of aerial photographs were used to prepare the 1974 map of the avocado agricultural frontier (Figure 2). At that time, avocado cultivation was confined to a handful of isolated production centers, which were spatially unconnected and collectively covered only 13,045 hectares. Production during this period was primarily oriented towards local and regional markets, with limited distribution to national markets.
Avocado production continued to expand rapidly throughout the final decades of the 20th century. Despite a longstanding phytosanitary ban on exports to the United States, limited shipments had occurred prior to formal market access. In 1993, under the framework of the North American Free Trade Agreement (NAFTA), trade barriers were lifted for avocado imports. However, the prohibition remained in effect for the states of California, Hawaii, and Florida, which are domestic avocado producers.
As a result of the imminent opening of the U.S. market in 1993, avocado cultivation entered a first wave of accelerated expansion. By 1995, the total area occupied by avocado orchards had reached 58,145 hectares, an increase of 45,500 hectares since 1974. This expansion is clearly illustrated in Figure 3, where the distribution of orchards begins to resemble a contiguous belt. Notably, production had already commenced at both ends of the study area, signaling the early stages of territorial connectivity. To identify avocado orchards, we used black-and-white aerial orthophotographs produced by the National Institute of Geography, Statistics, and Informatics [19].
The next phase in the investigation of avocado expansion relied on 2007 imagery from the French SPOT satellite. We employed a combination of false-color infrared imagery pansharpened with the panchromatic band, achieving a spatial resolution of 2 meters. Although this imagery lacked the fine detail of earlier aerial photographs, the inclusion of the near-infrared band provided sufficient spectral information to accurately identify avocado orchards. This approach allowed for effective discrimination between avocado plantations and forested areas. However, some underestimation of total avocado coverage remains for this year, due to the persistent difficulty in distinguishing very recent orchards from grasslands or sparsely vegetated zones.
In early 2007, the remaining import restrictions on Mexican avocados, previously in place for California, Hawaii, and Florida, were officially lifted. By this time, avocado cultivation continued its rapid expansion, increasingly encroaching upon forested areas. This overlap is largely due to the fact that the most favorable edaphic and climatic conditions for avocado production coincide with regions of natural forest cover. That year, the total area under avocado cultivation reached 112,725 hectares, an increase of 54,180 hectares since 1995. As shown in Figure 4, this marks the consolidation of what was beginning to be recognized as the ‘avocado belt’ of Michoacán.
The increasing availability of very high-resolution imagery with full coverage of Study Area A enabled the acquisition of WorldView-2 satellite data at 50 cm resolution. This significantly improved the identification of avocado orchards, resulting in the highest level of accuracy yet in delineating the avocado agricultural frontier for 2011. This latter case revealed a critical environmental and agricultural issue: avocado production was uneven across the cultivated territory, and in some instances, forested land had been cleared, incurring environmental damage, without yielding any economic return. A double loss.
The full opening of the U.S. market, along with access to other international markets, primarily in Europe and Asia, and the complete absence of territorial planning guidelines for avocado cultivation, triggered a second wave of expansion. Within just four years, an additional 40,293 hectares were incorporated, bringing the agricultural frontier to a total of 153,018 hectares. This phase of expansion extended into forested areas at unusually high altitudes (up to 2,600 m.a.s.l.) and into soils not naturally suited for avocado cultivation. A new technique, imported from Chile, was applied to overcome these limitations: Acrisol and Luvisol soils, characterized by high clay content, were inverted to form elevated ridges, improving root aeration. The map in Figure 5 illustrates this significant expansion phase.
To better understand the changes that occurred between 2011 and the final year of analysis, 2024, a new reference year, 2018, was introduced. For this purpose, we leveraged the extensive availability of free, very high-resolution satellite imagery accessible through digital platforms such as ESRI’s Wayback and Google Earth. This imagery, primarily sourced from WorldView-2 and WorldView-3 satellites, enabled us to maintain the high level of accuracy previously achieved in the identification of avocado orchards in 2011.
As suitable lands for avocado cultivation became increasingly scarce over previous decades, production began expanding into previously unconsidered areas north of the main growing region. This shift, driven by rising demand in both international and domestic markets, triggered a third wave of expansion, occurring sometime between 2011 and 2018. However, the move toward the northern portion of the territory also marked a departure from the optimal environmental conditions found in the southern zones. As a result, many of the newly cultivated areas range from marginally suitable to entirely unsuitable for avocado production, leading to lower yields and a growing dependence on agrochemicals to sustain productivity.
Figure 6 shows the early stage of this shift in avocado expansion. In total, the areas under avocado cultivation depicted in the map amount to 214,845 hectares, with 61,827 hectares introduced since 2011.
The final year of analysis, 2024, conducted through visual interpretation of very high-resolution imagery, some with spatial detail up to 30 cm, also revealed a severe environmental issue that had been noted in previous decades of expansion: downstream water retention.
As rainfall patterns have become increasingly variable, both throughout the year and from one year to the next, avocado cultivation, particularly that geared toward international markets, has come to rely heavily on intensive irrigation. This is especially critical given that avocado plants exhibit higher water consumption and evapotranspiration rates than the native forest cover they often replace. With groundwater largely inaccessible, irrigation depends on phreatic water and stored rainfall. This practice disrupts the natural water cycle, threatening downstream water availability for remaining natural vegetation as well as for other human uses.
The image in Figure 7 exemplifies the severity of the problem through the presence of numerous water storage areas, known locally as ‘hoyas de agua’ (water bowls), which are essential for maintaining adequate production levels, especially in the newly cultivated northern portions of the avocado belt. A count conducted in 2011 within Study Area A identified more than 14,000 storage sites [20]. Current estimates, considering Study Area B, place this figure at over 30,000.
The final map of the avocado frontier (Figure 8) illustrates the current trend in avocado expansion. This pattern reflects unplanned development, which has been a key driver of severe environmental impacts and now poses risks to the long-term sustainability of avocado cultivation itself. The map shows a total of 266,109 hectares under cultivation, with 51,264 hectares added since 2018.
3. Results
3.1. Trends and Rates of Avocado Expansion
Avocado expansion has followed an almost exponential trendline, except for the final year of this study, 2024, where a noticeable deviation from that trajectory begins to emerge (Figure 10). This trend not only reflects a significant increase in avocado demand over the past fifty years, largely driven by population growth and rising consumption across broad sectors, but also signals the onset of a new phase marked by decline in the last two periods. This downturn may be attributed to a reduction in the availability of suitable land for avocado cultivation, as well as a shift in operations toward a neighboring state. Notably, this latter explanation applies specifically to the study area in Michoacán, Mexico.
The rate of expansion, as shown in Figure 11, confirms the observed decline in avocado cultivation. Although the figure suggests that the downturn began in 2011, it most likely occurred sometime between 2011 and 2018. However, due to the absence of data for that interval, the exact timing remains uncertain. The observed decline in the rate of expansion is addressed in the following section.
3.2. Forest Cover Impact
One of the most significant impacts of avocado cultivation is the alteration of forest cover in the territories where it is introduced. The term impact is used here in both its positive and negative senses. In the case of avocado:
• Positive impact occurs when avocado is introduced into areas previously occupied by rainfed seasonal crops or sparse vegetation.
• Negative impact arises when avocado replaces forest cover, leading to loss, fragmentation and degradation of native ecosystems.
Unfortunately, the positive impact of avocado cultivation is far less significant than its negative counterpart. Arborizing areas of sparse or seasonally absent vegetation may seem beneficial, but the environmental gains are delayed, as avocado trees take considerable time to reach substantial size, especially given the common practice of pruning. Moreover, the use of agrochemicals in avocado production is often more intensive than in seasonal crops, offsetting many of the potential benefits associated with increased tree cover.
Negative impacts begin the moment forest cover is removed, well before avocado cultivation is even established. Vegetation clearance triggers the immediate loss of macro- and micro-organisms, followed by the disruption of critical ecosystem functions: biodiversity, carbon storage, soil protection against pluvial and concentrated erosion, hydrological cycle regulation, slope stability, climate moderation, and pollination services. Additionally, it results in the loss of natural resources such as timber, water harvesting potential, and recreational and aesthetic values that offer substantial psychological benefits. Once avocado is introduced, the intensive use of agrochemicals further compounds the damage: polluting air, soil, and water, harming pollinators, and creating serious occupational and public health risks.
This section presents the results of forest cover loss and fragmentation analyses, with only marginal reference to potential positive effects. Due to data availability, forest cover loss was assessed for the following periods: 1974–1995, 1974–2007, 1974–2011, 2011–2018, and 2018–2024. It should be noted that figures for the 2011–2018 interval are inferred. Forest fragmentation analysis was conducted exclusively for the year 2024.
3.3. Forest Loss
For the forest loss analysis, we used the avocado expansion results presented in the previous section alongside two baseline datasets for forest cover: 1974 and 2018. The first baseline, from 1974, was derived from the land use/land cover map shown in Figure 12. As illustrated, this dataset covers only the extent of Study Area A, since avocado cultivation had not yet expanded beyond that region at the time.
The first analysis of forest loss due to avocado replacement is shown in Figure 13. By overlaying the 1995 avocado frontier map onto the 1974 forest cover map, an estimated forest loss of 12,537 hectares was identified. Note the incipient development of avocado cultivation in regions west and east of the 1974 land use/land cover map. Although still limited in extent, these areas likely include additional forest loss not accounted for in this estimate.
In addition to forest replacement, we identified areas where avocado cultivation supplanted other land use/land cover classes. Specifically, avocado was introduced in at least 34,895 hectares of seasonal rainfed agriculture and small patches of barren land. This is a significant finding, as it reflects a ‘positive’ impact, indicating that, during the first two decades of the 50-year period analyzed, avocado expansion did not exert a major negative effect on forest cover. In fact, this type of land conversion accounted for roughly one-third of all avocado-related land use changes. However, this balance was soon to shift.
For the next period of analysis, overlaying the 2007 avocado frontier map onto the 1974 forest cover map resulted in an estimated forest loss of 33,116 hectares. These areas of forest conversion are depicted in Figure 14. It is important to note that avocado cultivation expanded beyond the boundaries of the 1974 land use/land cover map, and those newly cultivated zones are likely to include additional forest loss not captured in this estimate.
At this stage, avocado cultivation had replaced an additional 30,020 hectares of other land use/land cover classes, bringing the total to 64,915 hectares, still outweighing the 33,116 hectares of forest loss. However, the balance was shifting by 2007: more than half of the land converted to avocado was already coming at the expense of forest cover, signaling a turning point in the environmental impact of expansion.
The third period of analysis, based on the overlay of the 2011 avocado frontier map onto the 1974 forest cover map, revealed an estimated forest loss of 49,043 hectares. These areas of forest conversion are shown in Figure 15. By this point, the impact on forest cover had become clearly significant, with extensive tracts of continuous forest already replaced by avocado cultivation.
During this period, avocado cultivation also replaced an additional 25,930 hectares of other land use/land cover classes, bringing the total converted area to 90,845 hectares. However, the already substantial forest loss had now tipped the balance, with more than half of the total land converted to avocado coming at the expense of forest cover. It is important to note that forest loss estimates still exclude avocado expansion zones to the west and east, which by this time had experienced significant growth and likely contributed further to unaccounted deforestation.
By 2018, avocado cultivation had expanded well beyond the boundaries of Study Area A, necessitating the establishment of a new forest cover baseline. Figure 16 illustrates the extent of forest cover in that year, alongside the distribution of avocado plantations, now encompassing the entirety of Study Area B.
The overlay of the 2024 avocado frontier map onto the 2018 forest cover baseline revealed an estimated forest loss of 20,673 hectares. These areas of conversion are depicted in Figure 17. While the spatial distribution of forest loss may appear less dramatic compared to the large contiguous deforestation observed between 1974 and 2011, it is important to recognize that this loss is now dispersed across a territory twice the size of the earlier study area, indicating a more diffuse but still significant impact.
To grasp the significance of this loss, it is important to recall that between 1974 and 2011, forest cover declined by 49,043 hectares over a span of 37 years. In contrast, the 2018–2024 period saw nearly half that amount, 20,673 hectares, lost in just six years. Combined, these two periods account for a total forest loss of 60,716 hectares. However, this figure remains incomplete, as it does not yet include the forest loss that occurred between 2011 and 2018, which must still be added to fully assess the cumulative impact. To estimate forest loss for the missing period of 2011–2018, figures must be inferred using the forest loss rates outlined in the following section.
3.4. Trends and Rates of Forest Loss
Using forest loss data from the five defined periods of analysis, we calculated the corresponding rates of forest loss and used these to infer figures for the 2011–2018 interval. Table 1 presents the evolution of forest loss rates across all periods, providing a basis for estimating the missing data and highlighting the acceleration of deforestation over time.
To estimate forest loss for the missing 2011–2018 period, we applied three scenario-based calculations using annual forest loss rates from adjacent periods:
• Minimal scenario: Based on the annual rate from 1974–2011 (49,043 ha / 37 years ≈ 1,325 ha/year), multiplied by 7 years, resulting in an estimated loss of 9,275 ha.
• Maximal scenario: Based on the annual rate from 2018–2024 (20,673 ha / 6 years ≈ 3,452 ha/year), multiplied by 7 years, resulting in an estimated loss of 24,115 ha.
• Average scenario: Using the mean of the two rates (≈ 2,385 ha/year), multiplied by 7 years, resulting in an estimated loss of 16,695 ha.
By adding these inferred values to the forest loss from the other two periods, 49,043 ha (1974–2011) and 20,673 ha (2018–2024), we estimate that total forest loss from 1974 to 2024 ranges between 78,991 ha and 93,831 ha, with an average of 86,411 ha.
While the average estimate of 86,411 hectares of forest loss is likely the closest approximation to the real figure, it is important to acknowledge a systematic underestimation in the first three periods of analysis. This is due to the absence of forest cover data in the outermost regions of the study area for the years 1995, 2007, and 2011. Accounting for this data gap would likely shift the total forest loss closer to 90,000 hectares over the 50-year period analyzed.
Figure 18 illustrates the trajectory of forest cover replacement by avocado cultivation over the 50-year analysis period. The trend shows a steady linear increase during the first three intervals, followed by a brief decline around 2011. This dip was temporary, as the rate of forest conversion gradually returned to levels comparable to those observed in 2007, signaling a resurgence in expansion pressure.
Forest loss rates, however, reveal a slightly different narrative. Despite a temporary reduction in the absolute area of forest loss around 2011, the annual rate of forest cover replacement by avocado continued to follow an almost exponential trajectory (Figure 19). This seemingly counter-intuitive trend underscores the distinction between absolute magnitude and rate: while total forest loss measures the extent of change between two points in time, the rate reflects the speed at which that change occurs. In this context, it becomes clear that even when the area lost is smaller than in previous periods, the rate of loss may still increase, particularly when the time span under analysis is relatively short.
Additional evidence of the decline around 2018 can be observed in the volume and value of Mexican avocado exports, as shown in Figure 20 [2]. This economic slowdown aligns with the reduced rate of avocado expansion identified in this research and previously illustrated in Figure 11. Together, these indicators suggest a temporary deceleration in both market momentum and land conversion pressure during that period.
The observed decline in avocado expansion around 2018 can be attributed to a strategic migration of capital and operational shifts by Michoacán producers toward the neighboring state of Jalisco. This transition was driven by several key factors:
• Heightened regulatory pressures in Michoacán, where producers faced stricter enforcement of land-use regulations, particularly concerning deforestation and illegal orchard expansion. Expansion became riskier and more costly due to fines imposed on orchards established on deforested land, active removal of non-compliant orchards by environmental authorities, and the implementation of a deforestation-free certification program.
• Jalisco’s emergence as a viable alternative, offering abundant suitable lands for avocado cultivation, primarily converted from corn, wheat, and pasture, without triggering deforestation-related restrictions [21].
• Superior water availability and regulatory flexibility in Jalisco, where 88.6% of avocado orchards are irrigated, compared to just 37.6% in Michoacán [2].
3.5. Forest Fragmentation
Unlike forest loss, the impacts of forest fragmentation tend to emerge over medium to long-term timescales. Although numerous methodologies are documented in the literature, we opted for a rapid appraisal approach using two widely employed indicators: fragment size and fragment distance. These metrics provide a practical and interpretable means of assessing spatial disruption and ecological isolation within the forest matrix.
The partitioning of a continuous forest mass into smaller, spatially disconnected fragments has profound ecological consequences, both for individual fragments and for the integrity of the broader forest system. Fragmented forest patches, depending on their size and connectivity, exhibit reduced capacity to perform essential environmental functions and are more susceptible to both internal and external disturbance agents. Fringe areas, in particular, experience greater stress than core zones due to increased exposure and edge effects. When disturbances exceed a fragment’s ecological resilience, the patch may ultimately degrade and disappear, contributing to long-term landscape-level fragmentation.
In the fragmentation analysis, two base maps were developed to assess impact levels: one based on fragment size and the other on inter-fragment distance. These maps capture distinct dimensions of spatial disruption, area reduction and ecological isolation. A third map was then generated to integrate both indicators into a consolidated measure of fragmentation impact. All analyses were conducted using the forest cover map prepared for the year 2024, ensuring consistency with the most recent spatial baseline.
To translate fragment size into impact levels, forest fragment areas were calculated and grouped into five classes using the Iterative Self-Organizing Data Analysis Technique (ISODATA). This algorithm, an extension of the K-means clustering method, aims to minimize internal variation within each group, producing a more robust classification of spatial impact. Table 2 presents the resulting fragment size classes and their corresponding impact levels, providing a foundational layer for assessing fragmentation severity.
It is important to note the inverse relationship in this case: the larger the fragment size, the lower the assigned impact level. This indicator reflects the ecological feasibility of a forest fragment to sustain key environmental functions. Although physically diminished, larger fragments retain a greater capacity to support biodiversity, regulate microclimates, and buffer against external disturbances. In contrast, smaller fragments are more vulnerable to edge effects and ecological degradation, making their long-term viability significantly lower.
Based on this classification, the map in Figure 21 was generated to depict the spatial distribution of forest fragments and their corresponding impact levels. It is essential to clarify that, for the purpose of attributing forest fragmentation to avocado expansion, only those fragments directly adjacent to avocado fields are considered relevant. If no spatial adjacency exists, the fragmentation is likely attributable to other drivers, such as wildfires, logging, or conversion to alternative crops, and should be excluded from avocado-related impact assessments.
The map illustrates spatial distribution and impact levels of forest fragments based on size classification. Larger fragments show lower impact, while smaller, disconnected patches reflect higher vulnerability. Inset provides detailed view of localized fragmentation patterns.
To translate fragment distance into impact levels, the minimum distance between forest fragments was calculated and classified into five groups using the ISODATA algorithm. This clustering technique, designed to minimize internal variation, allowed for a data-driven segmentation of spatial isolation levels. Table 3 presents the resulting classification and corresponding impact levels, offering a structured approach to assess the degree of ecological disconnection across the forest landscape.
In this case, the relationship is direct: the shorter the distance between fragments, the lower the impact level. This indicator reflects the potential for ecological connectivity, where physically disconnected fragments may still function as part of a broader forest network if separation distances remain relatively low. Such proximity allows for species movement, gene flow, and shared ecological processes, helping maintain functional integrity despite spatial discontinuity. Conversely, greater distances increase isolation, reducing the likelihood of interaction and amplifying fragmentation impacts.
Using this classification, the map in Figure 22 was generated to depict the spatial distribution of forest fragments and their corresponding impact levels based on inter-fragment distance. For attributing fragmentation to avocado expansion, it is essential to consider only those forest fragments that are spatially adjacent to avocado fields. In the absence of such adjacency, fragmentation is likely driven by other factors, such as wildfires, logging, or conversion to alternative crops, and should be excluded from avocado-related impact assessments.
The map displays forest fragments classified by minimum inter-fragment distance, indicating levels of ecological isolation. Lower distances reflect higher connectivity and reduced impact, while greater separation signals increased fragmentation risk. Inset provides a detailed view of localized patterns.
Finally, both indicators, fragment size and inter-fragment distance, were integrated into a unified impact level scale to assess forest cover fragmentation. Table 4 presents the combined impact classification, derived from the intersection of size and distance metrics.
The guiding rule for this integration is straightforward: the smaller the fragment and the greater its distance from the nearest neighboring fragment, the higher the impact level. This approach captures both the internal vulnerability of isolated patches and their diminished potential for ecological connectivity, offering a consolidated measure of fragmentation severity.
The combined impact measures, derived from fragment size and inter-fragment distance, were used to generate the Forest Cover Impact map for 2024, presented in Figure 23. This map integrates fragmentation severity with forest loss data from the 2018–2024 period, offering a comprehensive spatial overview of forest cover disruption. By visualizing both structural fragmentation and direct land conversion, the map provides a more complete assessment of ecological pressure across the study area.
To gain deeper insight into the conversion of forest fragments into avocado plantations, Figure 24 presents a detailed view of the Forest Cover Impact map. Notably, the size of forest areas lost during the 2018–2024 period closely mirrors the size of remanent fragments classified as having Very High and High fragmentation impact. This spatial correspondence suggests that these highly impacted fragments face a significant risk of being replaced by avocado cultivation. The same vulnerability may extend to fragments within the Moderate impact class, which share similar structural characteristics. Additionally, the map reveals that several larger remanent fragments from the 2018 forest cover were converted to avocado, further intensifying fragmentation and reducing the ecological integrity of the remaining forest landscape.
4. Discussion
The most widely accepted and foundational definition of sustainability is: “Meeting the needs of the present without compromising the ability of future generations to meet their own needs” [23. A more comprehensive understanding of sustainability encompasses three interdependent dimensions, environmental, social, and economic, commonly referred to as the ‘three pillars of sustainability’ [24. This study places particular emphasis on the environmental dimension, but even within this dimension, however, sustainability requires grappling with the complex interplays between ecological systems and societal dynamics.
A practical pathway toward environmental sustainability must consider the concept of Planetary Boundaries, which seeks to ensure that human activities remain within safe ecological limits [25]. These boundaries define the thresholds beyond which irreversible environmental degradation may occur. In the case of avocado-driven economic development, it is evident that such expansion has largely disregarded these ecological borders. The unchecked conversion of forest cover, water-intensive cultivation practices, and fragmentation of ecosystems reflect a model of growth that operates outside the environmental constraints necessary for long-term sustainability.
4.1. Sustainable Objectives for Avocado Development
To align avocado production with long-term environmental sustainability, it is essential to establish clear objectives that respect ecological thresholds, promote responsible land use, and ensure intergenerational equity. Drawing from the foundational definition of sustainability [23] and the three-pillar framework [24] this section outlines key objectives focused on the environmental dimension, while acknowledging its interdependence with social and economic factors.
Objective 1: Operate Within Planetary Boundaries. Ensure that avocado expansion remains within safe ecological limits, particularly regarding deforestation, water use, and biodiversity loss. This includes avoiding conversion of primary forest, maintaining ecological corridors, and respecting regional conservation priorities [25].
Objective 2: Promote Deforestation-Free Production. Implement and enforce deforestation-free certification schemes that prevent the establishment of orchards on recently deforested land. Strengthen traceability systems and incentivize compliance through market access and premium pricing.
Objective 3: Safeguard Forest Fragment Integrity. Prioritize the protection of remanent forest fragments, especially those classified with High and Very High fragmentation impact. Develop ecological buffers and restoration programs to reduce edge effects and enhance connectivity.
Objective 4: Integrate Land-Use Planning and Zoning. Coordinate avocado development with regional land-use plans to avoid encroachment into ecologically sensitive areas. Encourage conversion of low-impact agricultural lands (e.g., pasture, corn) rather than forested zones.
Objective 5: Foster Community-Based Stewardship. Engage local communities in sustainable land management through participatory governance, benefit-sharing mechanisms, and agroecological training. Recognize traditional knowledge and promote inclusive decision-making.
Objective 6: Monitor and Report Environmental Performance. Establish transparent monitoring systems to track forest loss, fragmentation, and water use. Use geospatial tools and remote sensing to inform adaptive management and policy interventions.
Achieving these sustainability objectives first demands a clear understanding of the current environmental context surrounding avocado development. This includes mapping the extent of forest loss, fragmentation, water use, and regulatory compliance. Equally important is a deliberate reflection on the necessary actions to realign production with ecological limits. Through such introspection, producers may uncover the root causes of avocado’s unsustainability, whether they stem from unchecked expansion, weak governance, market-driven pressures, or systemic disregard for environmental thresholds. Recognizing these drivers is a critical step toward designing interventions that are not only corrective but transformative.
Very likely, most producers have prioritized economic gain when deciding to convert land for avocado cultivation. While pursuing financial benefit is entirely legitimate, it must not come at the expense of others’ rights, particularly the right to a healthy environment and sustainable resource access. Sustainability, in this sense, requires remaining within ecological limits or returning to them when exceeded.
From our perspective, the root causes of avocado’s environmental unsustainability stem from two interrelated aspects of producer behavior:
1. Ignorance whether deliberate or due to lack of awareness, regarding the environmental consequences of their actions. Many producers fail to recognize how their decisions contribute to ecological degradation, particularly through cumulative and synergistic effects. These impacts often manifest gradually, making them harder to detect in the short term. Yet, the compounding nature of forest loss, fragmentation, and water stress can lead to irreversible damage if left unchecked.
2. Absence of planning frameworks, whether formal regulation or, ideally, self-regulation. The lack of clear land-use guidelines, environmental safeguards, and proactive planning mechanisms allows unsustainable practices to persist. While responsibility lies with producers, individually and collectively, it also extends to environmental authorities and institutions tasked with rural development. Their involvement is crucial to establish enforceable standards, promote sustainable alternatives, and foster a culture of accountability.
To address the first root cause of avocado unsustainability, ignorance of environmental consequences, producers must gain access to reliable, actionable knowledge. Academic institutions possess the human capital and technical expertise necessary to generate and disseminate this knowledge. However, it is the responsibility of producers, particularly through associations and cooperatives, to actively participate in and support the implementation of ongoing educational campaigns. This includes providing logistical and financial backing to ensure continuity and reach. Simultaneously, environmental protection and rural development authorities must establish a normative framework that legitimizes and reinforces these efforts, guiding producers toward informed, responsible decision-making.
The second root cause, absence of planning guidelines, must be addressed through a scientific and structured approach. This involves the application of theoretical and methodological planning frameworks that can guide avocado development within sustainable limits.
4.2. Sustainable Planning of Avocado Development
Effective planning requires the capacity to envision the future of avocado development, identifying not only what is desirable, but also what is achievable within ecological and social constraints. Several conceptual frameworks exist to support this foresight, each offering distinct advantages and limitations. Among them, a foundational triad widely applied in public policy, urban planning, and environmental governance is the ‘Triple E’ framework: Efficacy, Efficiency, and Equity [26]. We propose that avocado development be guided by this framework as a practical mechanism for achieving sustainability.
The principles of the Triple E framework—Efficacy, Efficiency, and Equity—correspond to distinct capacities for achieving planning objectives. In the context of building a sustainable future for avocado development, these principles can be articulated as follows:
• Efficacy refers to the capacity to achieve the core objective of cultivating avocado effectively. It encompasses the ability to produce desired outcomes—such as yield, quality, and market access—while maintaining ecological viability. This principle is sometimes referred to as effectiveness in planning literature.
• Efficiency involves the capacity to meet avocado production goals while optimizing the use of natural, economic, and human resources. It emphasizes minimizing waste, reducing environmental footprints, and maximizing returns per unit of input—whether land, water, labor, or capital.
• Equity relates to the fair distribution of both the benefits and burdens associated with avocado cultivation. It calls for inclusive decision-making, recognition of community rights, and mechanisms that ensure no group—human or ecological—is disproportionately impacted by development.
Sustainability in avocado development requires that the principles of efficacy, efficiency, and equity be respected to some meaningful degree, though not necessarily in equal measure. In practice, these principles may occasionally appear to be in tension. For example, achieving efficacy, successfully growing avocado, can lead to inefficiencies in resource use or infringe upon the rights of others, particularly when expansion occurs without regard for environmental limits or social equity. This is precisely the situation observed in Michoacán, where the pursuit of economic success has often come at the cost of ecological degradation and community well-being. Such imbalances reflect a model that is fundamentally unsustainable. True sustainability demands a deliberate effort to harmonize these principles, recognizing that long-term viability depends not only on production outcomes, but on how those outcomes are achieved and distributed.
To begin translating the principles of sustainability into a practical planning framework for avocado development, it is essential to understand what each principle seeks and contributes. Moving from theory to method, we propose three guiding principles—success, optimization, and balance—as operational anchors for sustainable avocado production. These principles align with both the three pillars of sustainability (environmental, social, and economic) and the Triple E framework (efficacy, efficiency, and equity), offering a coherent structure for planning and evaluation (Table 5).
5. Conclusions
In summary, the sustainable development of avocado production demands more than isolated interventions, it requires a coherent planning framework grounded in success, optimization, and balance. These guiding principles, aligned with the Triple E and the three pillars of sustainability, offer a practical pathway for producers, institutions, and regulators to move beyond reactive measures and toward systemic change. While this work does not attempt to exhaustively list all sustainable practices, it lays the conceptual and methodological foundation for future efforts, anchored in foresight, responsibility, and the shared commitment to preserving ecological integrity for generations to come.
Author Contributions
Morales-Manilla: Conceptualization, Methodology, Formal Analysis, Writing- Original draft preparation, Funding acquisition.: Barajas-Espino: Formal Analysis, Visualization.: López-Sánchez: Formal Analysis, Software.: Coba-Pérez: Validation, Writing-Review & Editing, Project administration.: Dueñas-Cabrera: Resources, Visualization.
Funding
This work was funded by the Secretaría de Ciencia, Humanidades, Tecnología e Innovación (SECIHTI), Mexican Federal Government. Grant number: PRONACE PEE 322772.
Data Availability Statement
The original data presented in the study are openly available in CIGA, UNAM at https://experience.arcgis.com/experience/d890ac506e484f2784725ecce6acbe45/.
Acknowledgments
During the preparation of this work the authors used Microsoft Copilot to improve the readability and language of the manuscript. After using this tool, the authors reviewed and edited the content as needed, taking full responsibility for the content of the published article.
Conflicts of Interest
The authors declare no conflicts of interest.
References
- USDA. Fruit and Tree Nuts Outlook. USDA, 2006. Last access 22 August 2025: https://downloads.usda.library.cornell.edu/usda-esmis/files/7h149p84n/9p290c50m/m039k7465/FTS-03-29-2006.pdfAuthor 1, A.; Author 2, B. Title of the chapter. In Book Title, 2nd ed.; Editor 1, A., Editor 2, B., Eds.; Publisher: Publisher Location, Country, 2007; Volume 3, pp. 154–196.
- FIRA. Panorama agroalimentario 2024. Aguacate. Last access 25 August 2025: https://www.fira.gob.mx/InvYEvalEcon/EvaluacionIE.
- SADER. Michoacán produce el 75% del aguacate mexicano. Last access 25 August 2025: https://sader.michoacan.gob.mx/michoacan-produce-el-75-del-aguacate-mexicano-sader/Author 1, A.B. (University, City, State, Country); Author 2, C. (Institute, City, State, Country). Personal communication, 2012.
- Anguiano, C. J., J. J. Alcántar, B. R. Toledo, L. M. Tapia, J. A. Vidales-Fernández, and R. J. Alcántar. “Caracterización Edafoclimática Del Área Productora de Aguacate de Michoacán, México.” Proceeding VI World Avocado Congress, 2007. https://www.avocadosource.com/WAC6/es/Extenso/3c-112.pdf.Author 1, A.B. Title of Thesis. Level of Thesis, Degree-Granting University, Location of University, Date of Completion.
- ESSFeed. The impact of avocado monocultures on soil and water resources. Last access 25 August 2025: https://essfeed.com/the-impact-of-avocado-monocultures-on-soil-water-resources/.
- Fuerte-Velázquez, D.; Gómez-Tagle, A. Water footprint and water sustainability of agroindustrial avocado production in a warm tropical climate municipality: A case study in the Michoacán avocado belt in Central México. Water 2024, 16(12), 1719. [CrossRef]
- Bravo-Espinosa, M.; Mendoza, M.E.; Carlón Allende, T.; Medina, L.; Sáenz-Reyes, J.T.; Páez, R. Effects of converting forest to avocado orchards on topsoil properties in the trans-Mexican volcanic system, Mexico. Land Degrad. Dev. 2012, 25(5), 452–467. [CrossRef]
- Eldridge, H.M. The Avocado Debate, 1st ed.; Routledge: London, UK, 2023. [CrossRef]
- Baca-Patiño, B.; González-Rodríguez, A.; García-Oliva, F.; García, A.; Lara-De La Cruz, I.; Garibay-Orijel, R.; Poret-Peterson, A.; Maldonado-López, Y.; Cuevas-Reyes, P.; Gómez-Tagle, A.; Tapia-Torres, Y. Land-use change from native forest to avocado orchards: Effects on soil nutrient transformation and microbial communities. Appl. Soil Ecol. 2025, 205, 105748. [CrossRef]
- Pérez-Solache, A.; Vaca-Sánchez, M.S.; Maldonado-López, Y.; Lopes De Faria, M.; Borges, M.A.Z.; Fagundes, M.; Oyama, K.; Méndez-Solórzano, M.I.; Aguilar-Peralta, J.S.; Hernández-Guzmán, R.; Cuevas-Reyes, P. Changes in land use of temperate forests associated to avocado production in Mexico: Impacts on soil properties, plant traits and insect-plant interactions. Agric. Syst. 2023, 204, 103556. [CrossRef]
- Sáenz-Ceja, J.E.; Sáenz-Reyes, J.T.; Castillo-Quiroz, D. Pollinator species at risk from the expansion of avocado monoculture in Central Mexico. Conserv. 2022, 2(3), 457–472. [CrossRef]
- Alcalá, C.S.; Armendáriz-Arnez, C.; Mora, A.M.; Rodriguez-Zamora, M.G.; Bradman, A.; Fuhrimann, S.; Lindh, C.; Rosa, M.J. Association of pesticide exposure with respiratory health outcomes and rhinitis in avocado farmworkers from Michoacán, Mexico. Sci. Total Environ. 2024, 945, 173855. [CrossRef]
- Punzo Díaz, J.L. Cultivo del aguacate en Michoacán y patrimonio arqueológico: aplicación del LiDAR en Tingambato, México. Arqueología Iberoamericana 2023, 52, 15–20. Last access 25 August 2025: https://archive.org/details/ai-52/page/n13/mode/2up.
- CRI. CRI Mexico Report. Unholy Guacamole. Deforestation, Water Capture, and Violence Behind Mexico’s Avocado Exports to the U.S. and Other Major Markets. Climate Rights International, November 2023. Last access 25 August 2025: https://cri.org/reports/unholy-guacamole/.
- CRI. US/Mexico: U.S. Senators Urge Action on Mexican Avocados. Last access 25 August 2025: https://cri.org/us-senators-urge-action-on-mexican-avocados/.
- APEAM. La industria del aguacate mexicano de exportación se une para revelar una nueva ruta hacia la sostenibilidad. Last access 25 August 2025: https://apeamac.com/la-industria-del-aguacate-mexicano-de-exportacion-se-une-para-revelar-una-nueva-ruta-hacia-la-sostenibilidad/.
- APEAM. Aguacate mexicano fortalece la balanza comercial del país y dinamiza la economía regional. Last access 25 August 2025: https://apeamac.com/aguacate-mexicano-fortalece-la-balanza-comercial-del-pais-y-dinamiza-la-economia-regional/.
- Morales Manilla, L.M.; Espino Barajas, L.A.; Dueñas Cabrera, A.M.; López Sánchez, J.G.; Coba Pérez, P.C.; Cuevas García, G.; Reyes-González, A. Expansion of avocado agricultural frontier in the avocado belt of Michoacán, México, 1974–2024. Terra Digit. 2025, 9(2), 1–8. [CrossRef]
- INEGI. Orthoimages. Geography and Environment. Last access 25 August 2025: https://en.www.inegi.org.mx/temas/imagenes/ortoimagenes/.
- Morales Manilla, L.M.; Reyes González, A.; Cuevas García, G.; Onchi Ramuco, M. Inventario 2011 del cultivo del aguacate y evaluación del impacto ambiental forestal en el estado de Michoacán. Centro de Investigaciones en Geografía Ambiental, UNAM–COFUPRO: Morelia, MICH., 2012; 108 pp. Last access 25 August 2025: https://lae.ciga.unam.mx/aguacate2/Informe%20Final%202011%20Aguacate%20Etapa%202%20Componente%201.pdf.
- USDA-FAS. Mexico Avocado Annual. April 2024. Last access 25 August 2025: https://apps.fas.usda.gov/newgainapi/api/Report/DownloadReportByFileName?fileName=Avocado%20Annual_Mexico%20City_Mexico_MX2024-0018.pdf.
- El Economista. Jalisco duplica a Michoacán en productividad por hectárea de aguacate: APEAJAL. Last access 25 August 2025: https://www.eleconomista.com.mx/estados/jalisco-duplica-michoacan-productividad-hectarea-aguacate-apeajal-20250821-773765.html.
- United Nations. Our Common Future. The Brundtland Report. United Nations, World Commission on Environment and Development. Oxford University Press, October 1987; 383 pp. ISBN 019282080X.
- Purvis, B.; Mao, Y.; Robinson, D. Three pillars of sustainability: In search of conceptual origins. Sustain. Sci. 2019, 14(3), 681–695. [CrossRef]
- Rockström, J.; Steffen, W.; Noone, K.; Persson, Å.; Chapin, F.S.; Lambin, E.F.; Lenton, T.M.; Scheffer, M.; Folke, C.; Schellnhuber, H.J.; Nykvist, B. A safe operating space for humanity. Nature 2009, 461(7263), 472–475. [CrossRef]
- Hartnett, M. Effectiveness, Efficiency, and Equity: the Three “E”s of Policy Analysis. Scioto Analysis Newsletter, January 2023. Last access 25 August 2025: https://www.sciotoanalysis.com/news/2023/1/11/effectiveness-efficiency-and-equity-the-three-es-of-policy-analysis.
Figure 1.
Study areas. A: 1974–2011 (blue); B: 2018–2024 (green), both located within the state of Michoacán, Mexico (grey). The map can be interactively explored at https://ciga-unam.maps.arcgis.com/apps/instant/insets/index.html?appid=37be7525943447d980d6f7de15af35f0.
Figure 1.
Study areas. A: 1974–2011 (blue); B: 2018–2024 (green), both located within the state of Michoacán, Mexico (grey). The map can be interactively explored at https://ciga-unam.maps.arcgis.com/apps/instant/insets/index.html?appid=37be7525943447d980d6f7de15af35f0.
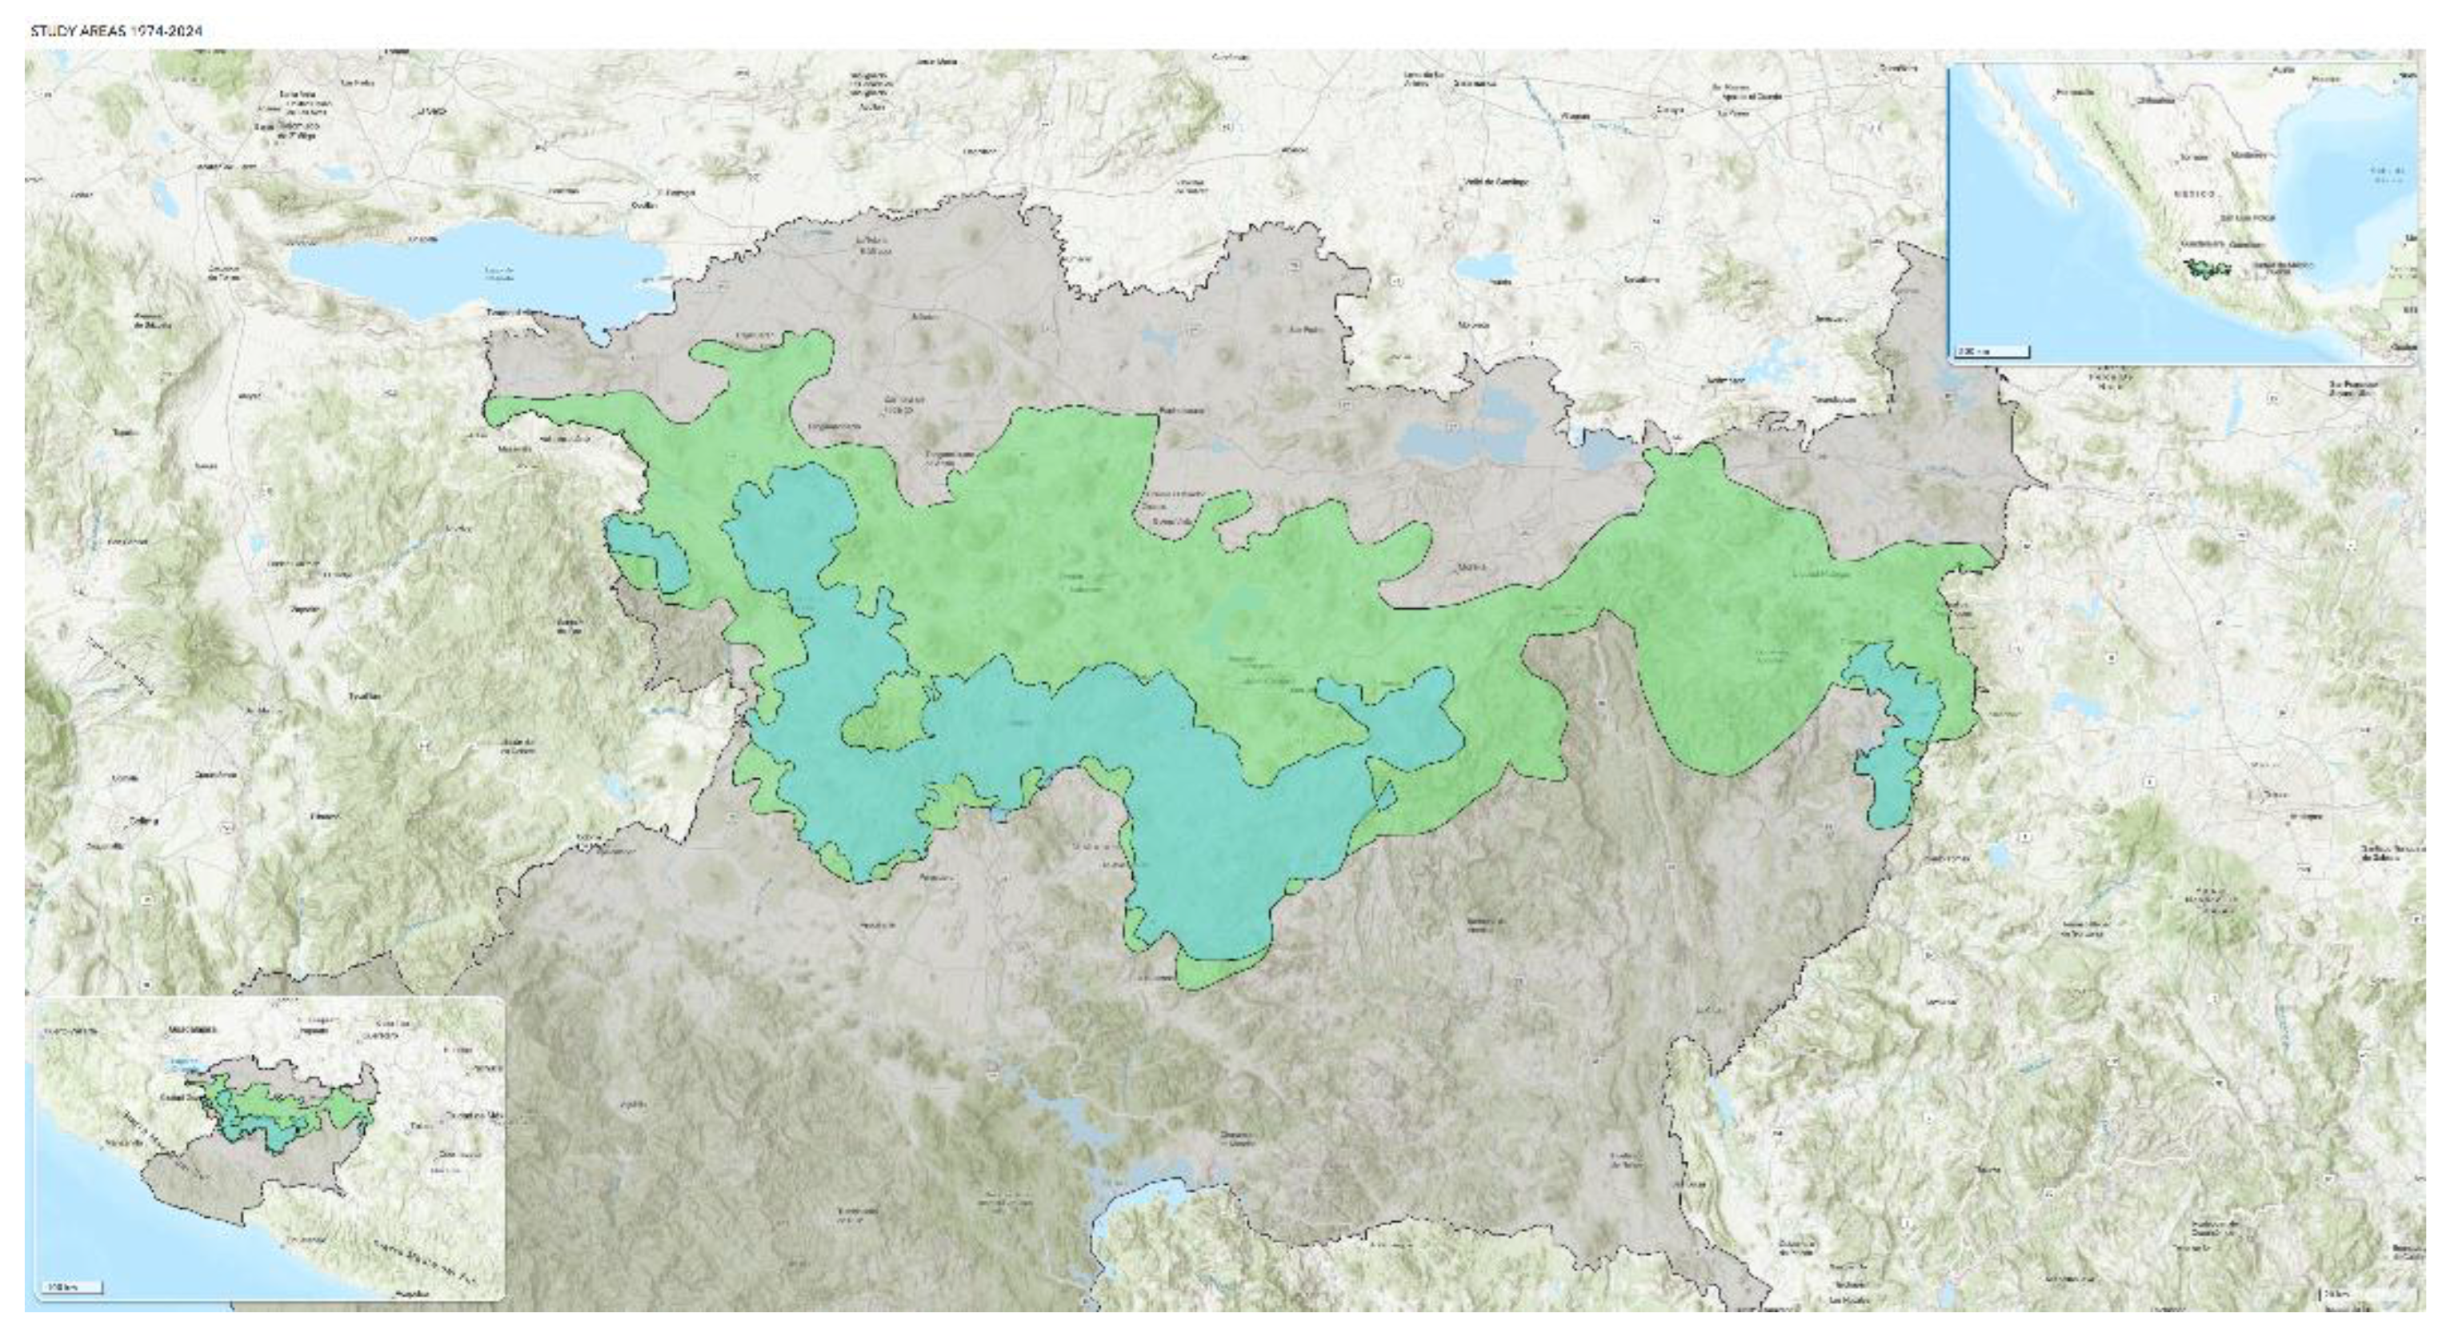
Figure 2.
Expansion of avocado frontier of 1974. The map can be interactively explored at https://ciga-unam.maps.arcgis.com/apps/instant/basic/index.html?appid=7872fbf61aba452782da35616d167ae7.
Figure 2.
Expansion of avocado frontier of 1974. The map can be interactively explored at https://ciga-unam.maps.arcgis.com/apps/instant/basic/index.html?appid=7872fbf61aba452782da35616d167ae7.
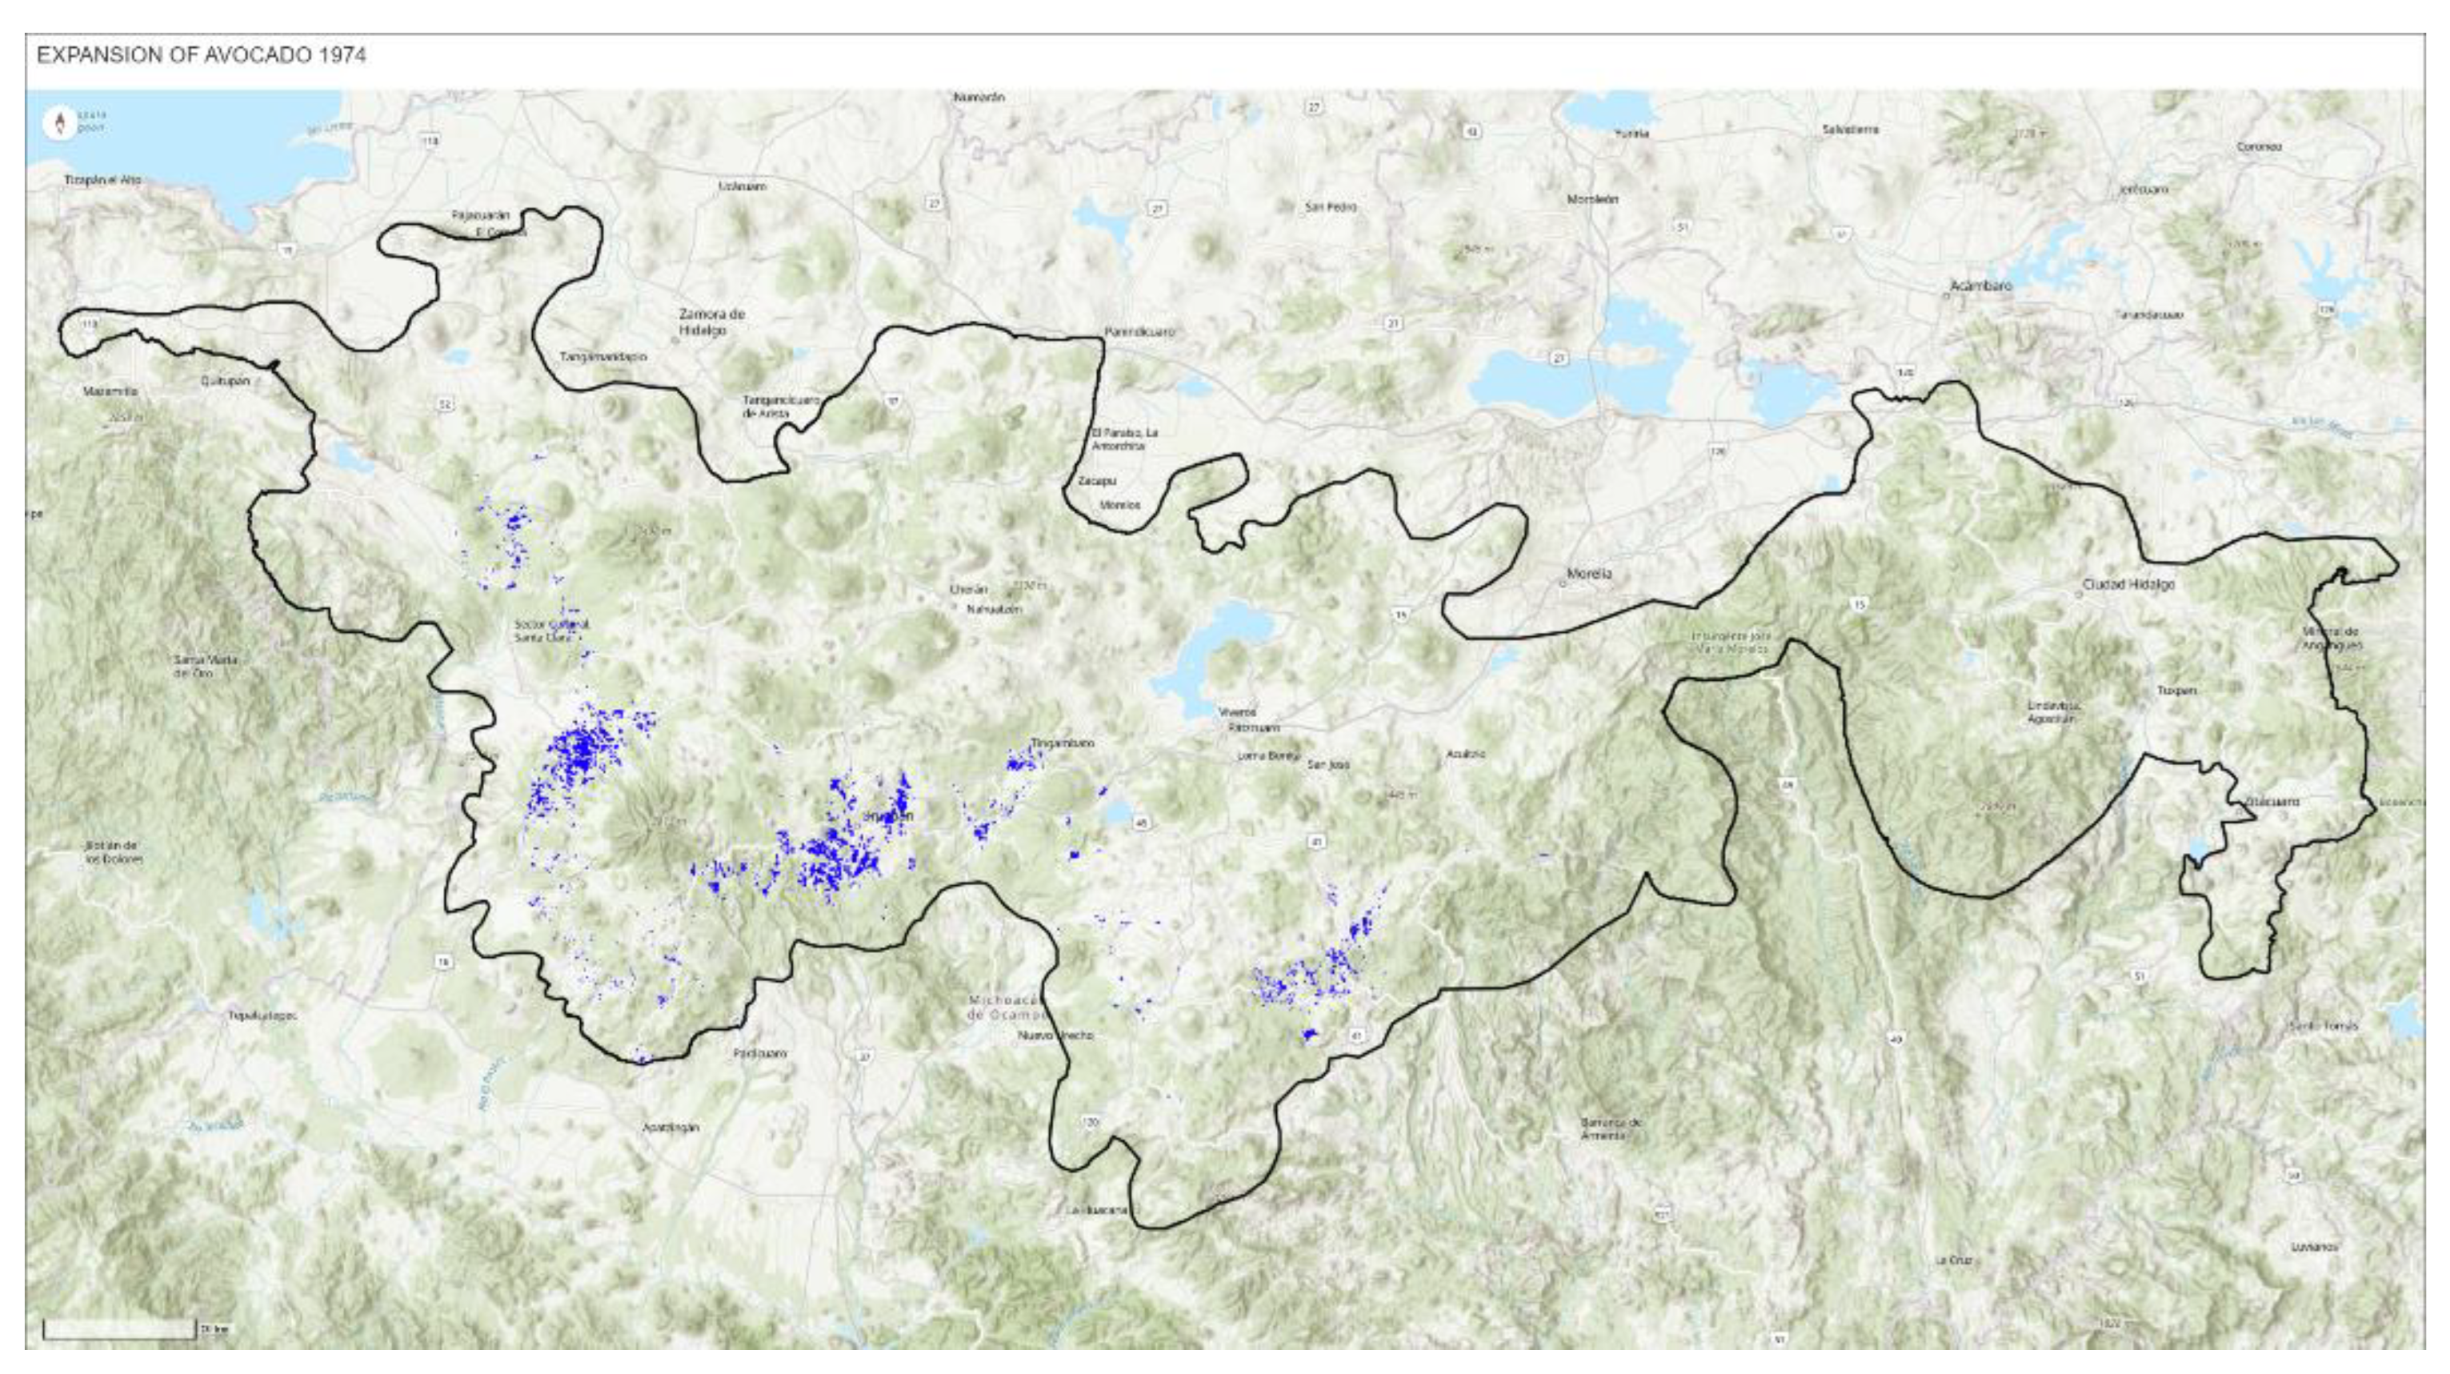
Figure 3.
Expansion of avocado frontier of 1995. The map can be interactively explored at https://ciga-unam.maps.arcgis.com/apps/instant/basic/index.html?appid=a90463ab7182411d97198d3dbe7088bc.
Figure 3.
Expansion of avocado frontier of 1995. The map can be interactively explored at https://ciga-unam.maps.arcgis.com/apps/instant/basic/index.html?appid=a90463ab7182411d97198d3dbe7088bc.
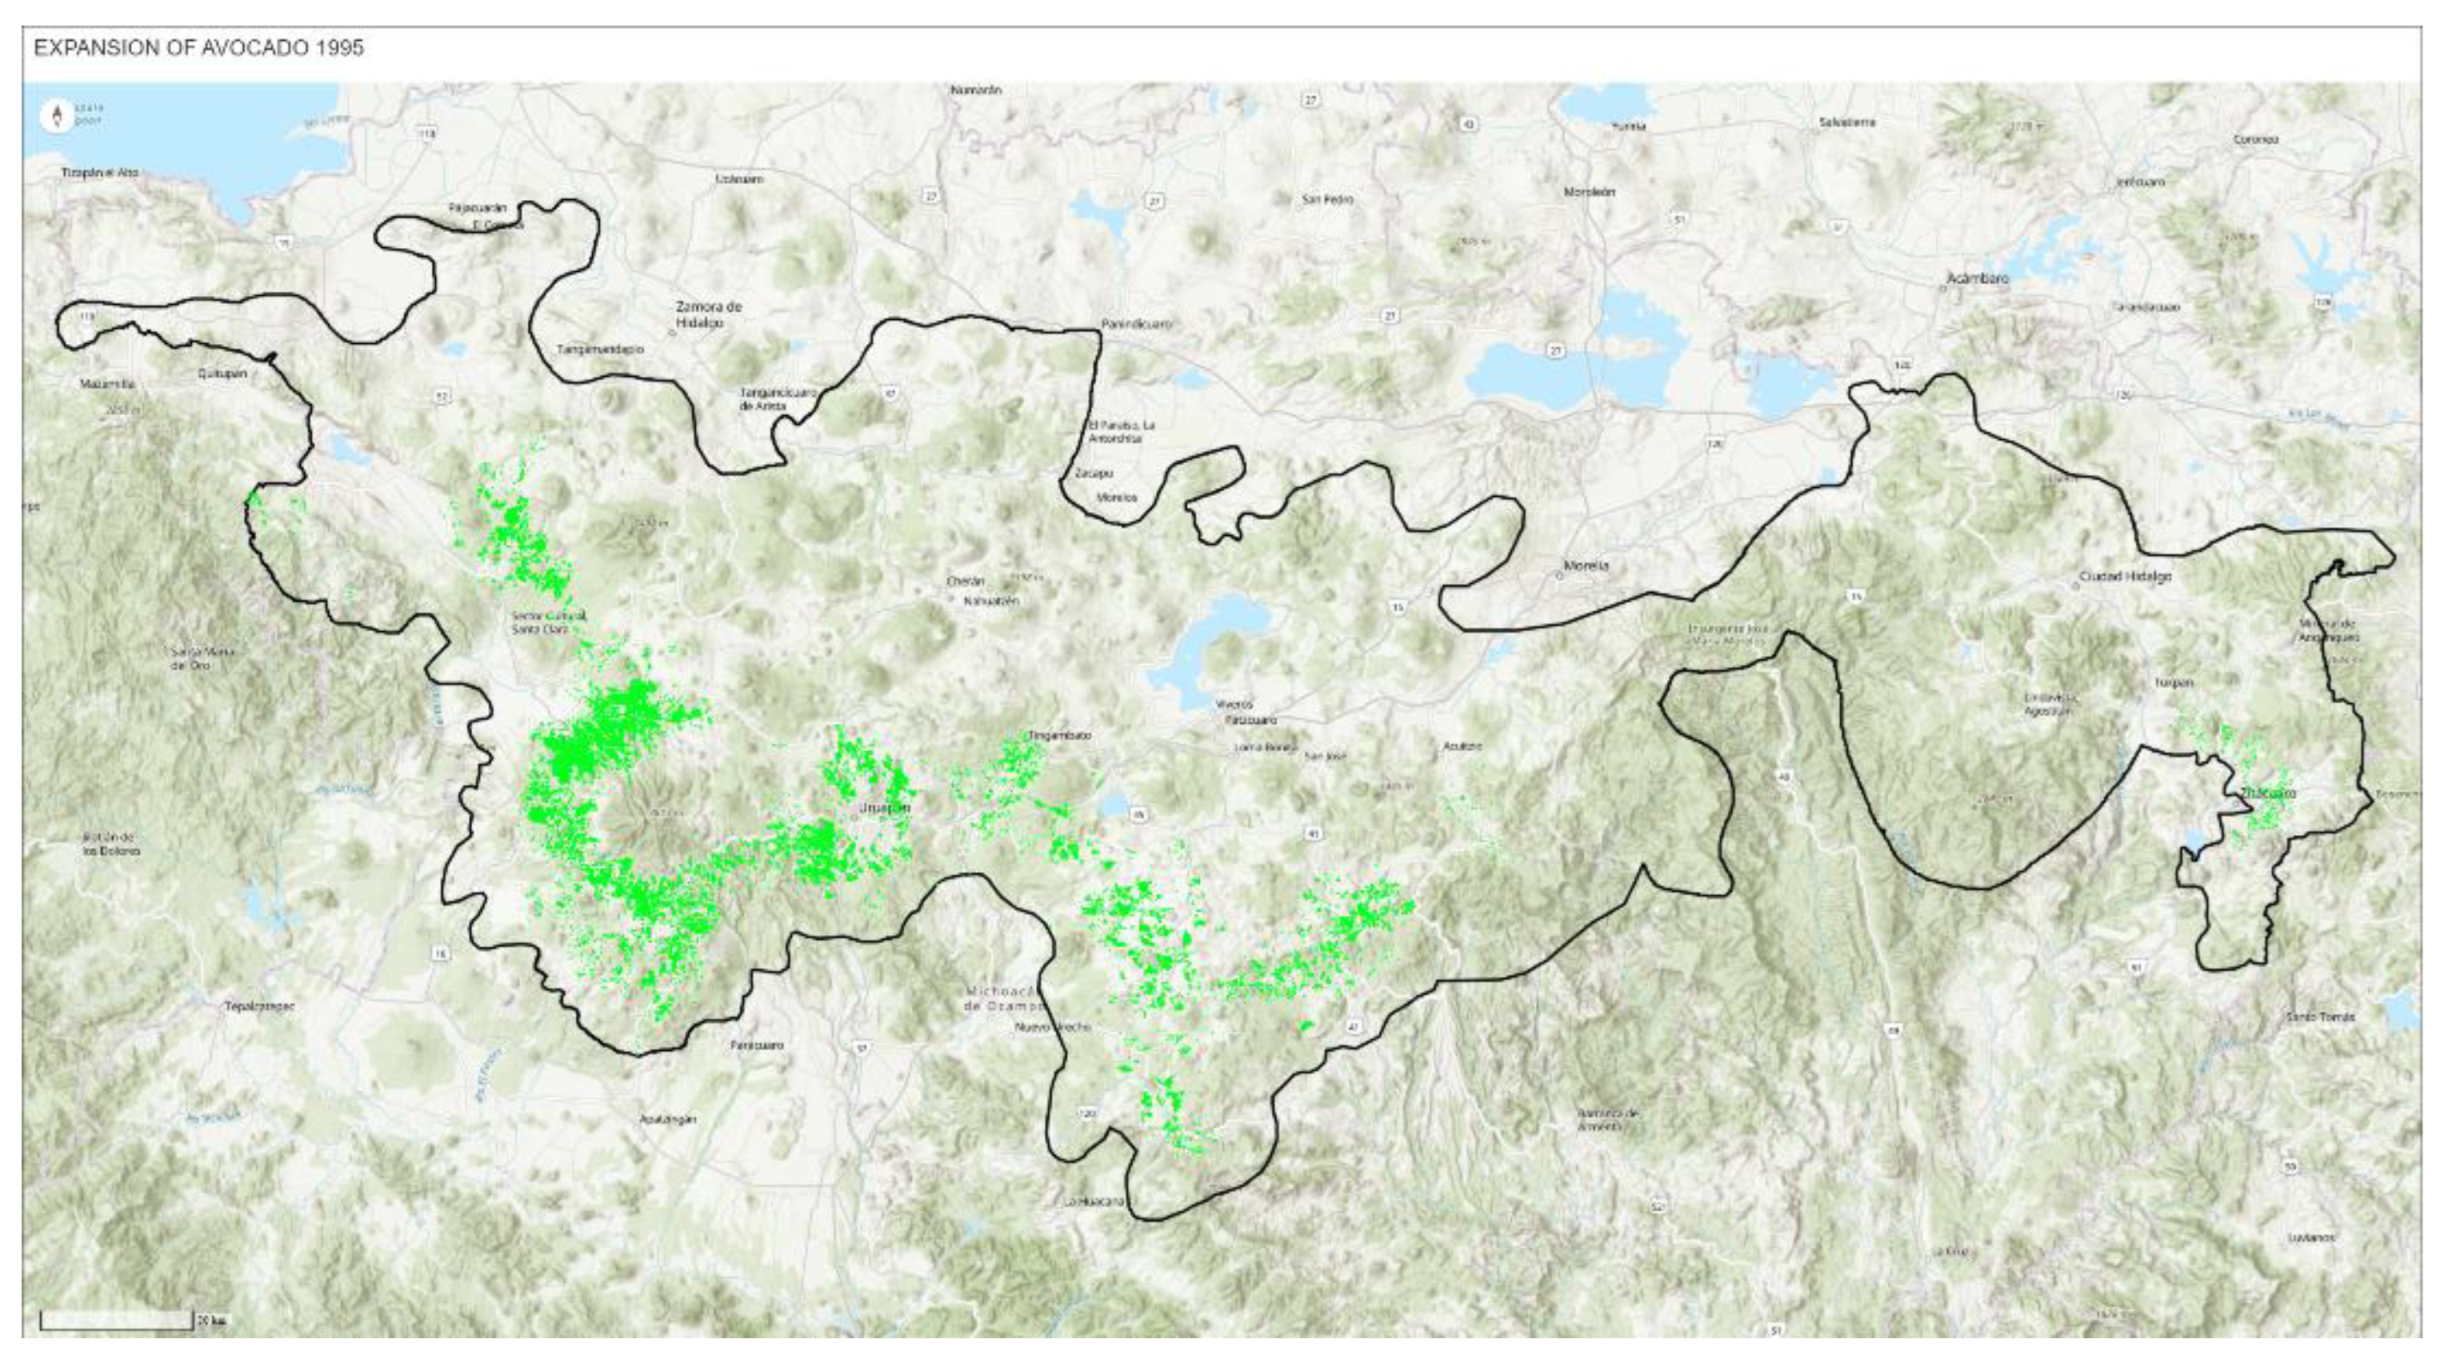
Figure 4.
Expansion of avocado frontier of 2007. The map can be interactively explored at https://ciga-unam.maps.arcgis.com/apps/instant/basic/index.html?appid=63380cdce21f4fe79a713ceb63e33587.
Figure 4.
Expansion of avocado frontier of 2007. The map can be interactively explored at https://ciga-unam.maps.arcgis.com/apps/instant/basic/index.html?appid=63380cdce21f4fe79a713ceb63e33587.
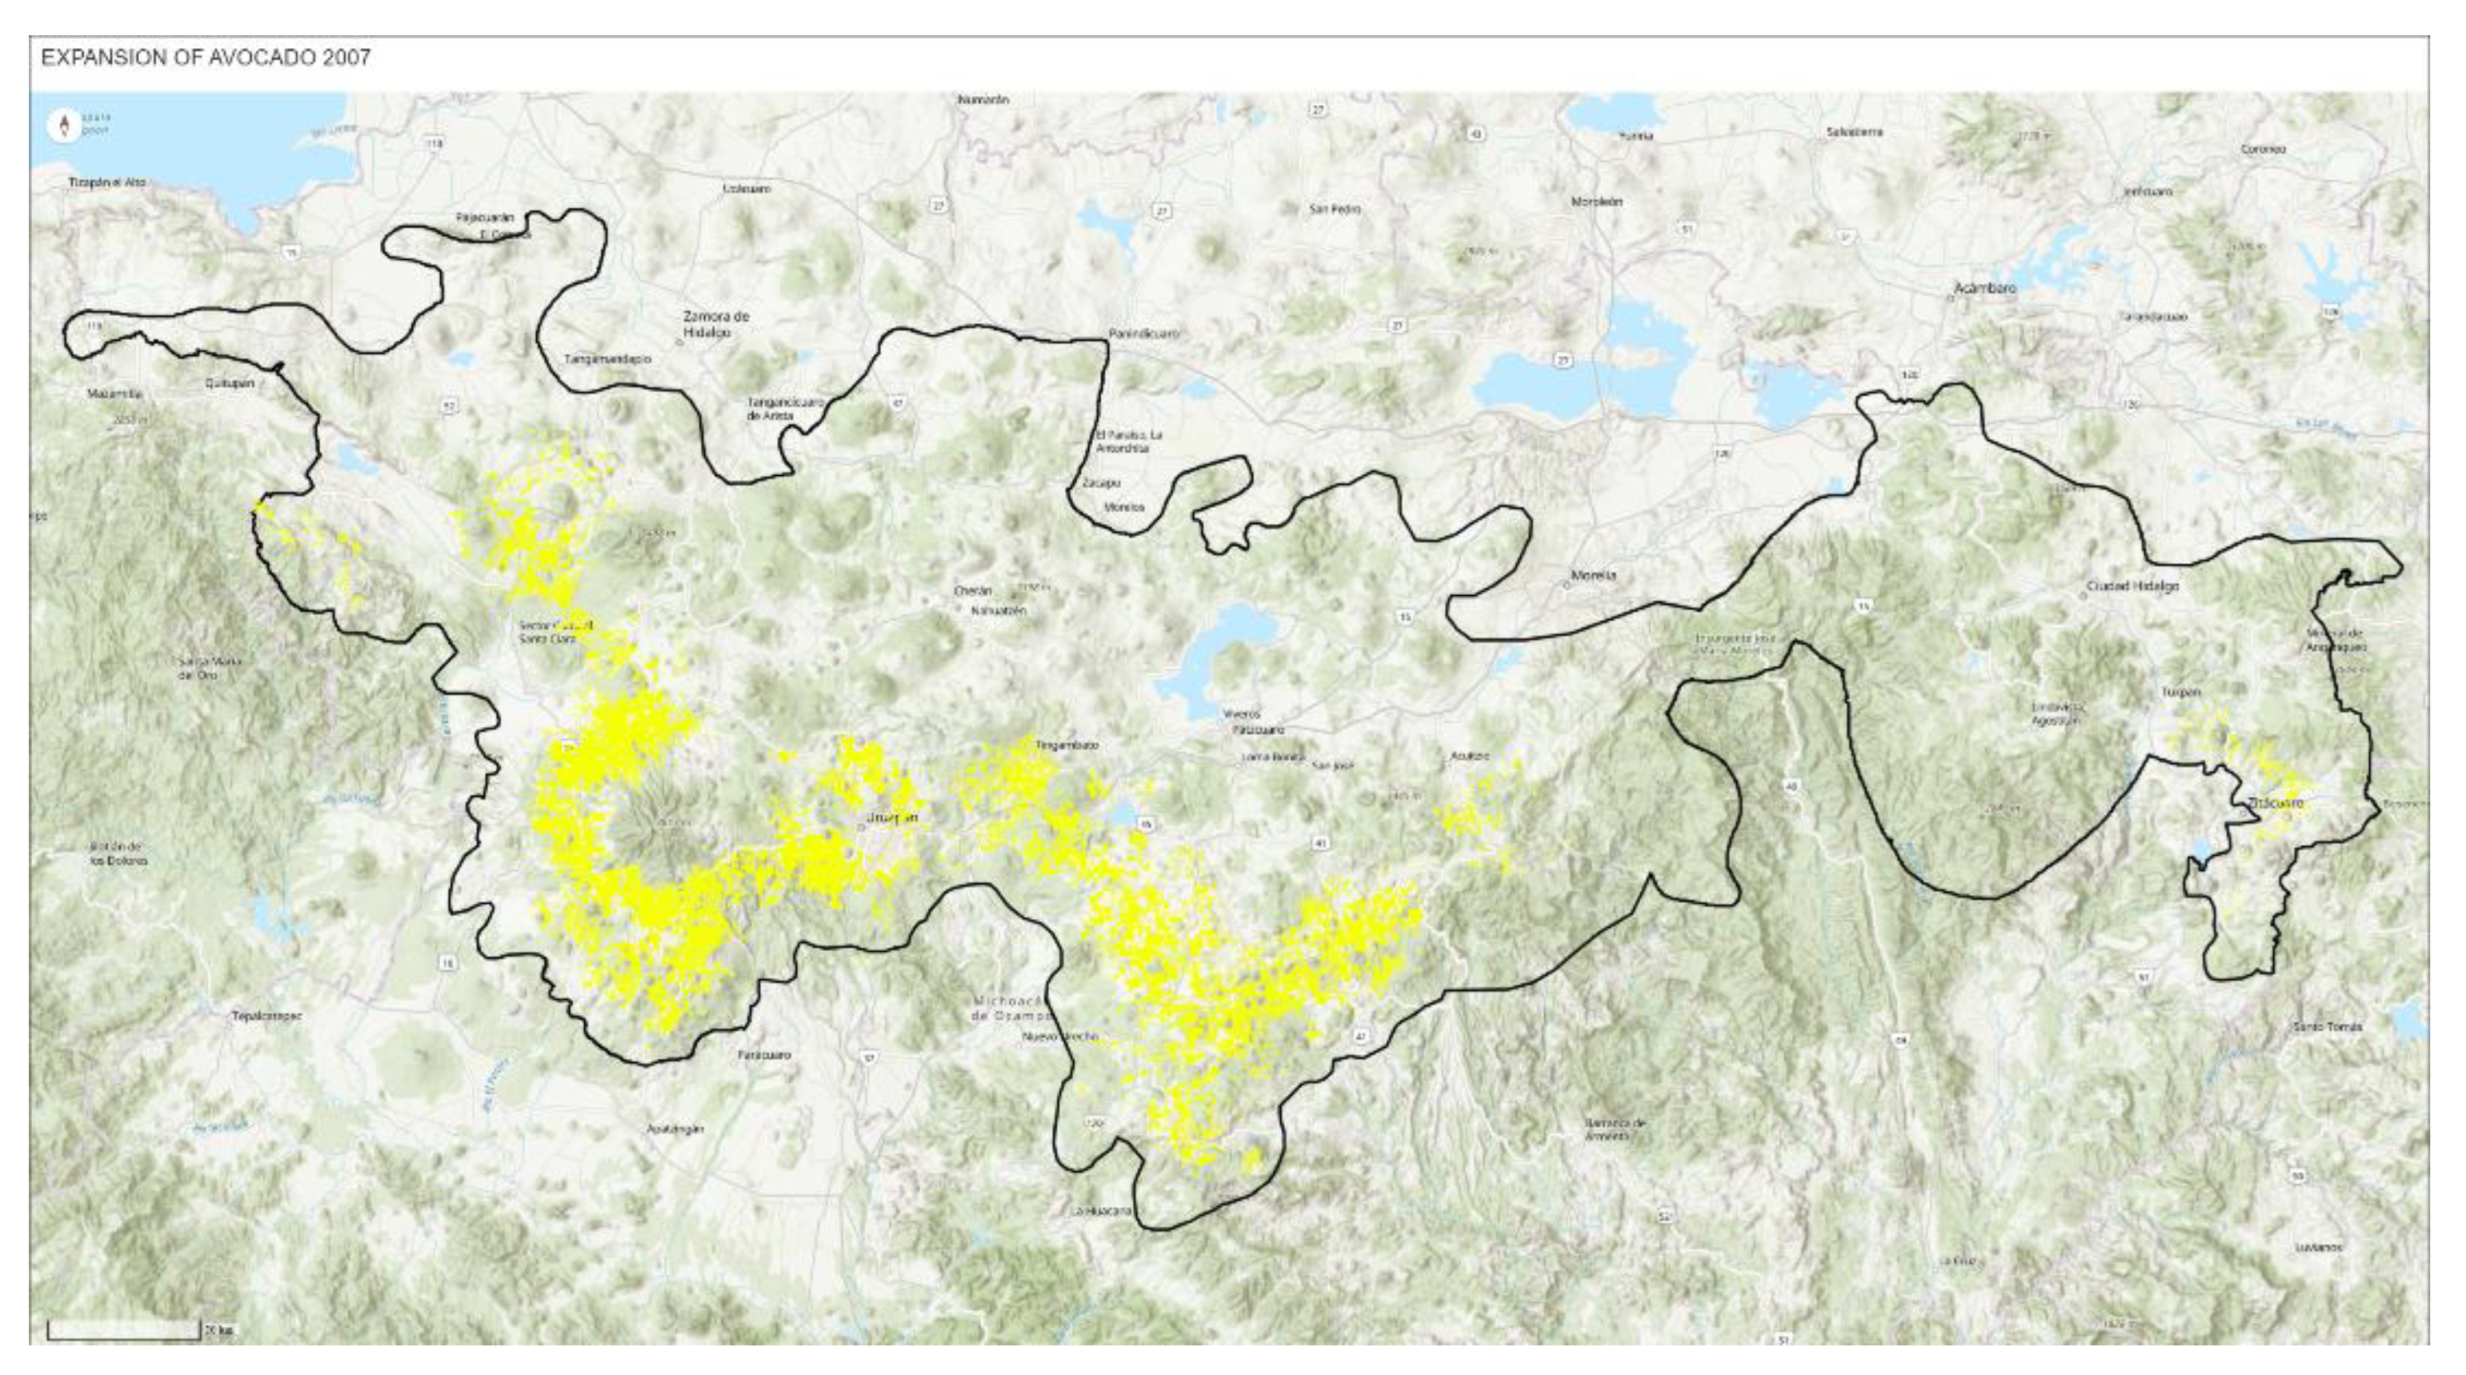
Figure 5.
Expansion of avocado frontier of 2011. The map can be interactively explored at https://ciga-unam.maps.arcgis.com/apps/instant/basic/index.html?appid=9e41d5c916c94af191a245838821bb82.
Figure 5.
Expansion of avocado frontier of 2011. The map can be interactively explored at https://ciga-unam.maps.arcgis.com/apps/instant/basic/index.html?appid=9e41d5c916c94af191a245838821bb82.
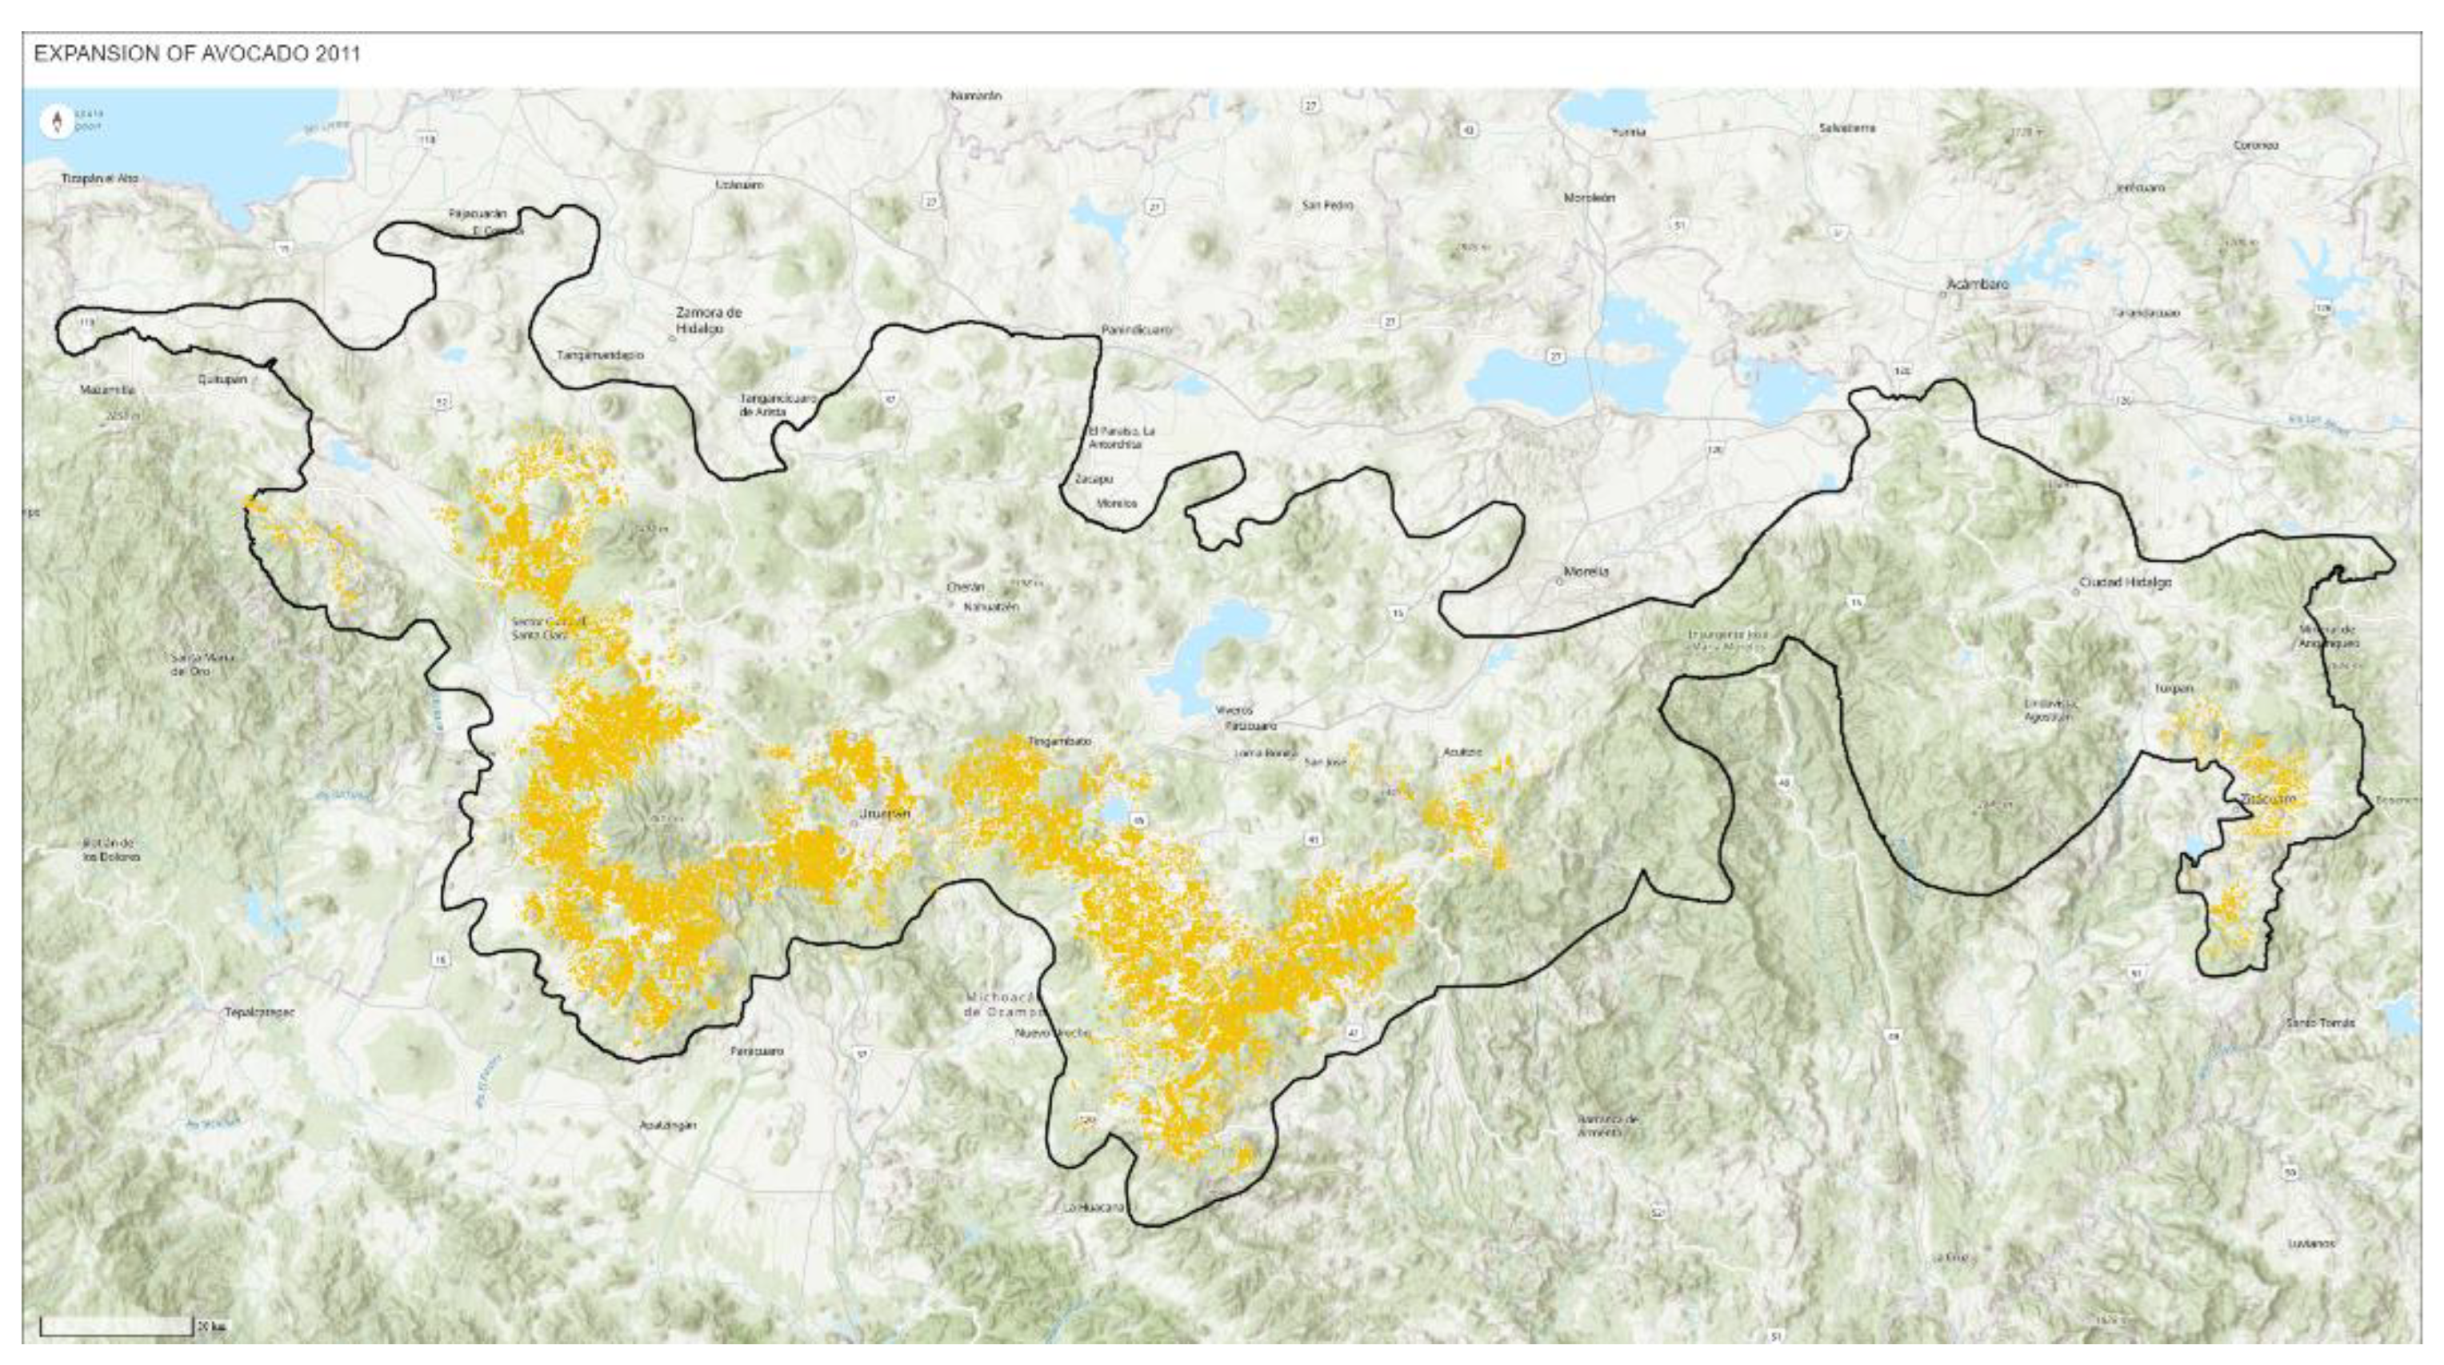
Figure 6.
Expansion of avocado frontier of 2018. The map can be interactively explored at https://ciga-unam.maps.arcgis.com/apps/instant/basic/index.html?appid=7ca1844fc9d4442090023ed77cff9fd9.
Figure 6.
Expansion of avocado frontier of 2018. The map can be interactively explored at https://ciga-unam.maps.arcgis.com/apps/instant/basic/index.html?appid=7ca1844fc9d4442090023ed77cff9fd9.
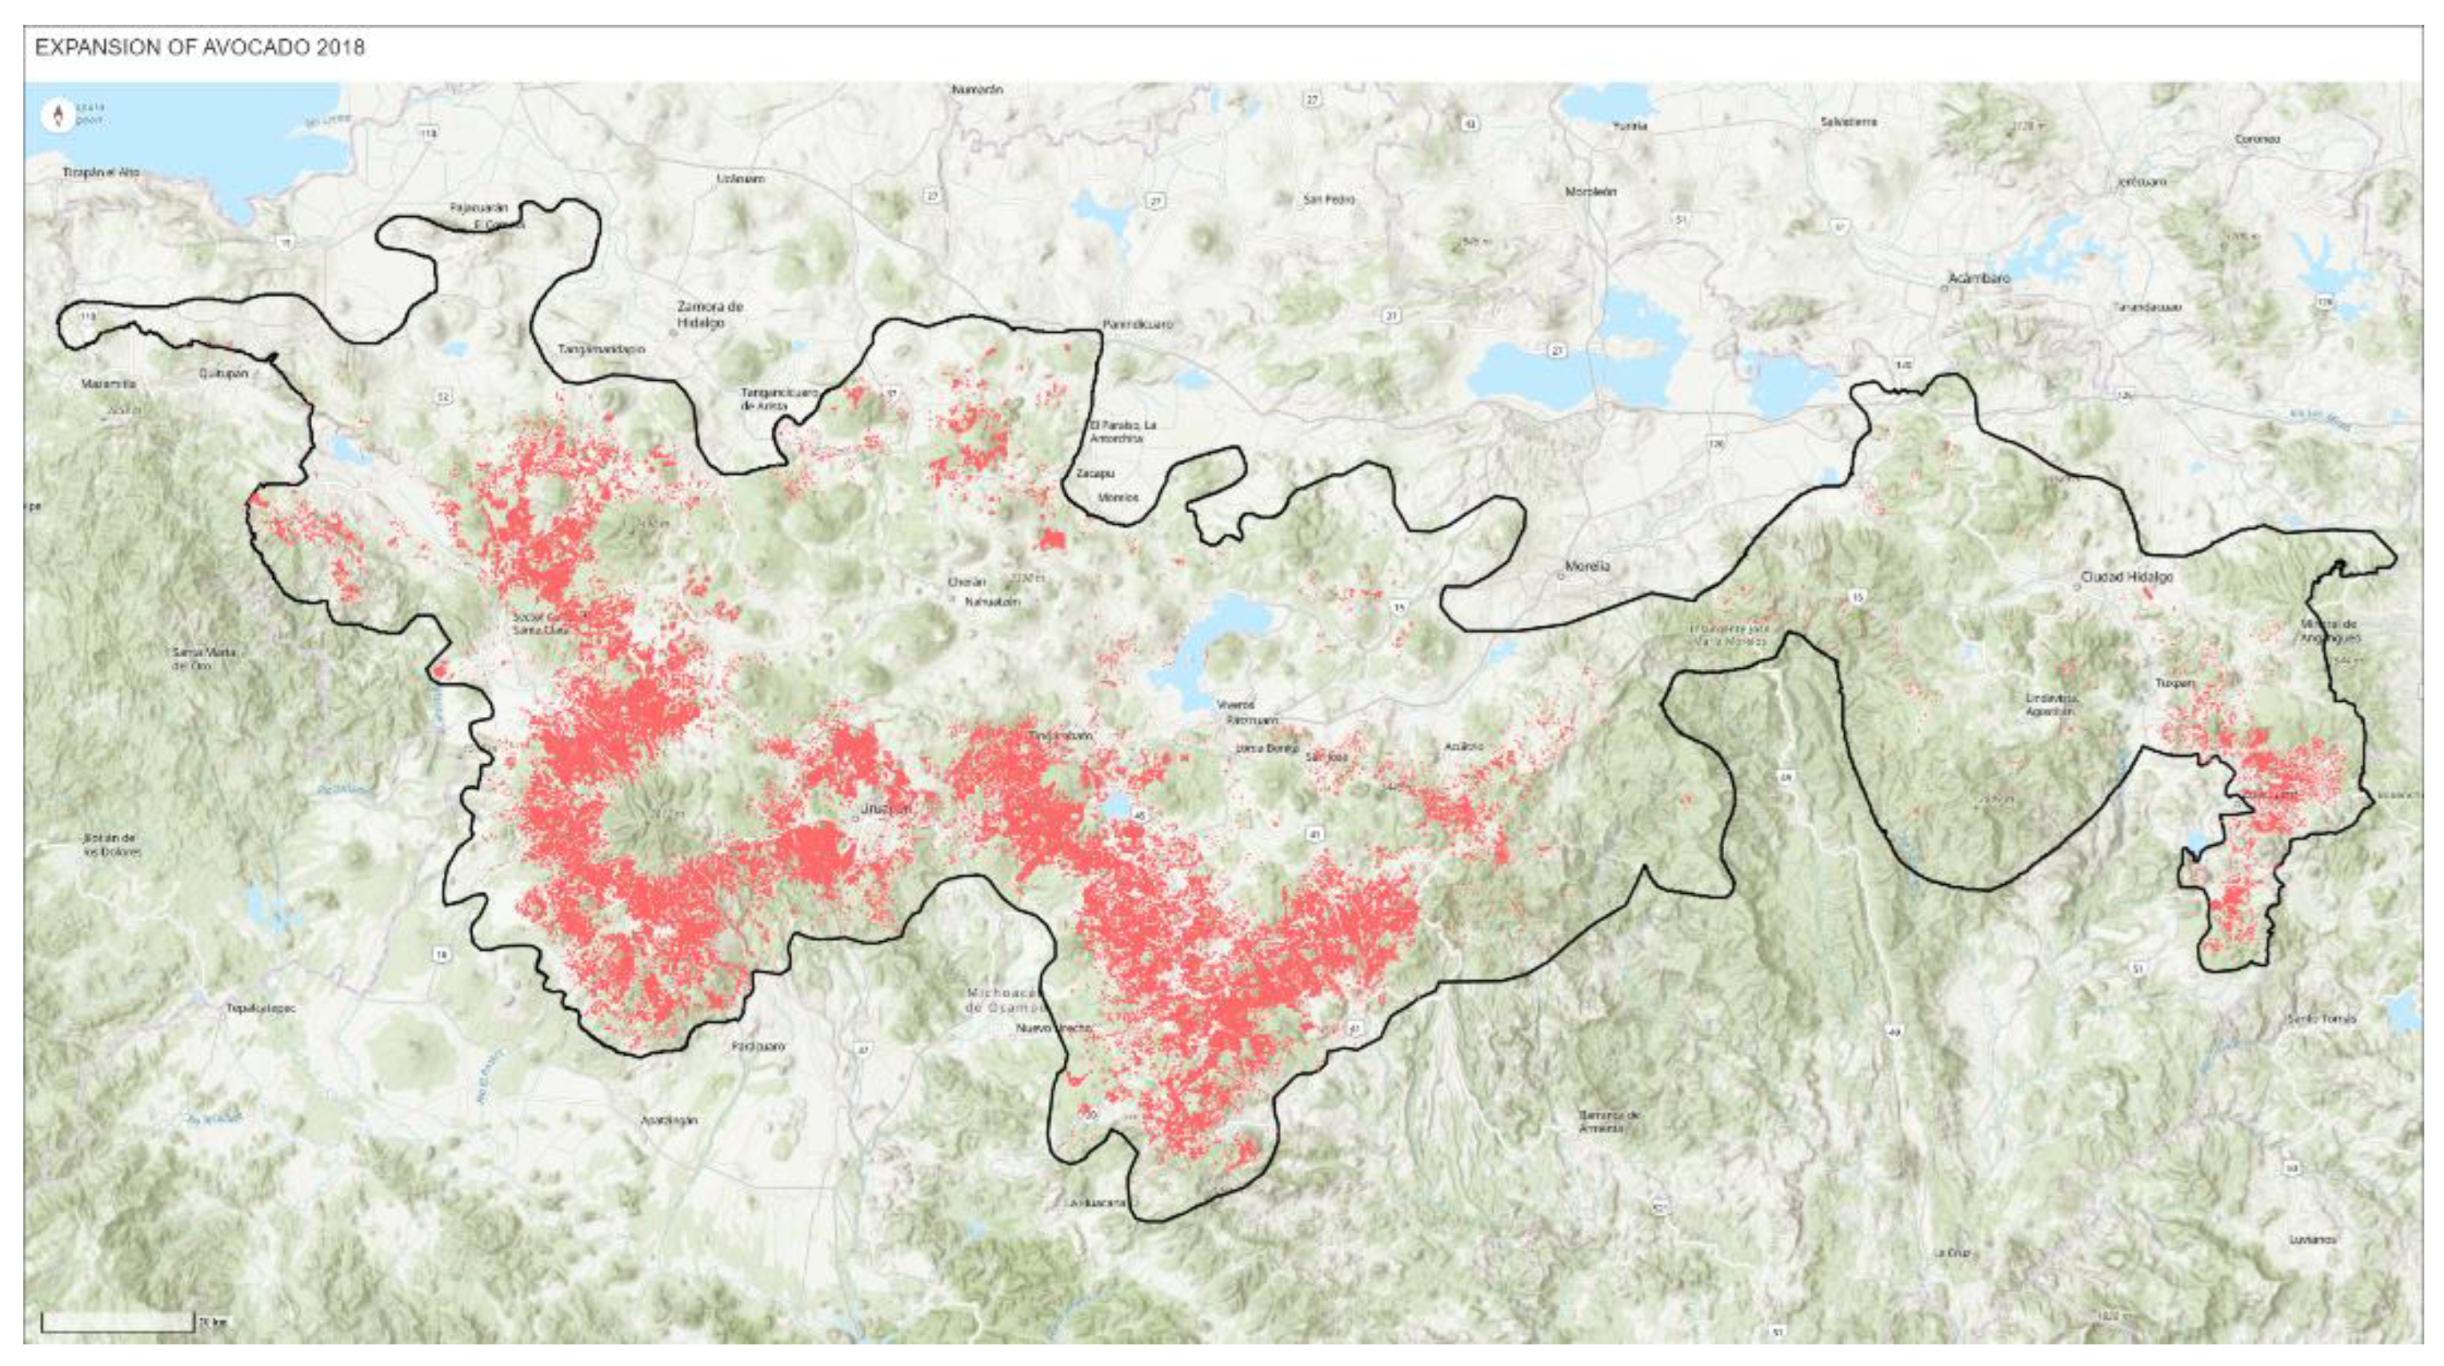
Figure 7.
Fragment of natural-color satellite imagery, available on the Google Earth platform, used in the preparation of the avocado frontier map for the year 2024.
Figure 7.
Fragment of natural-color satellite imagery, available on the Google Earth platform, used in the preparation of the avocado frontier map for the year 2024.
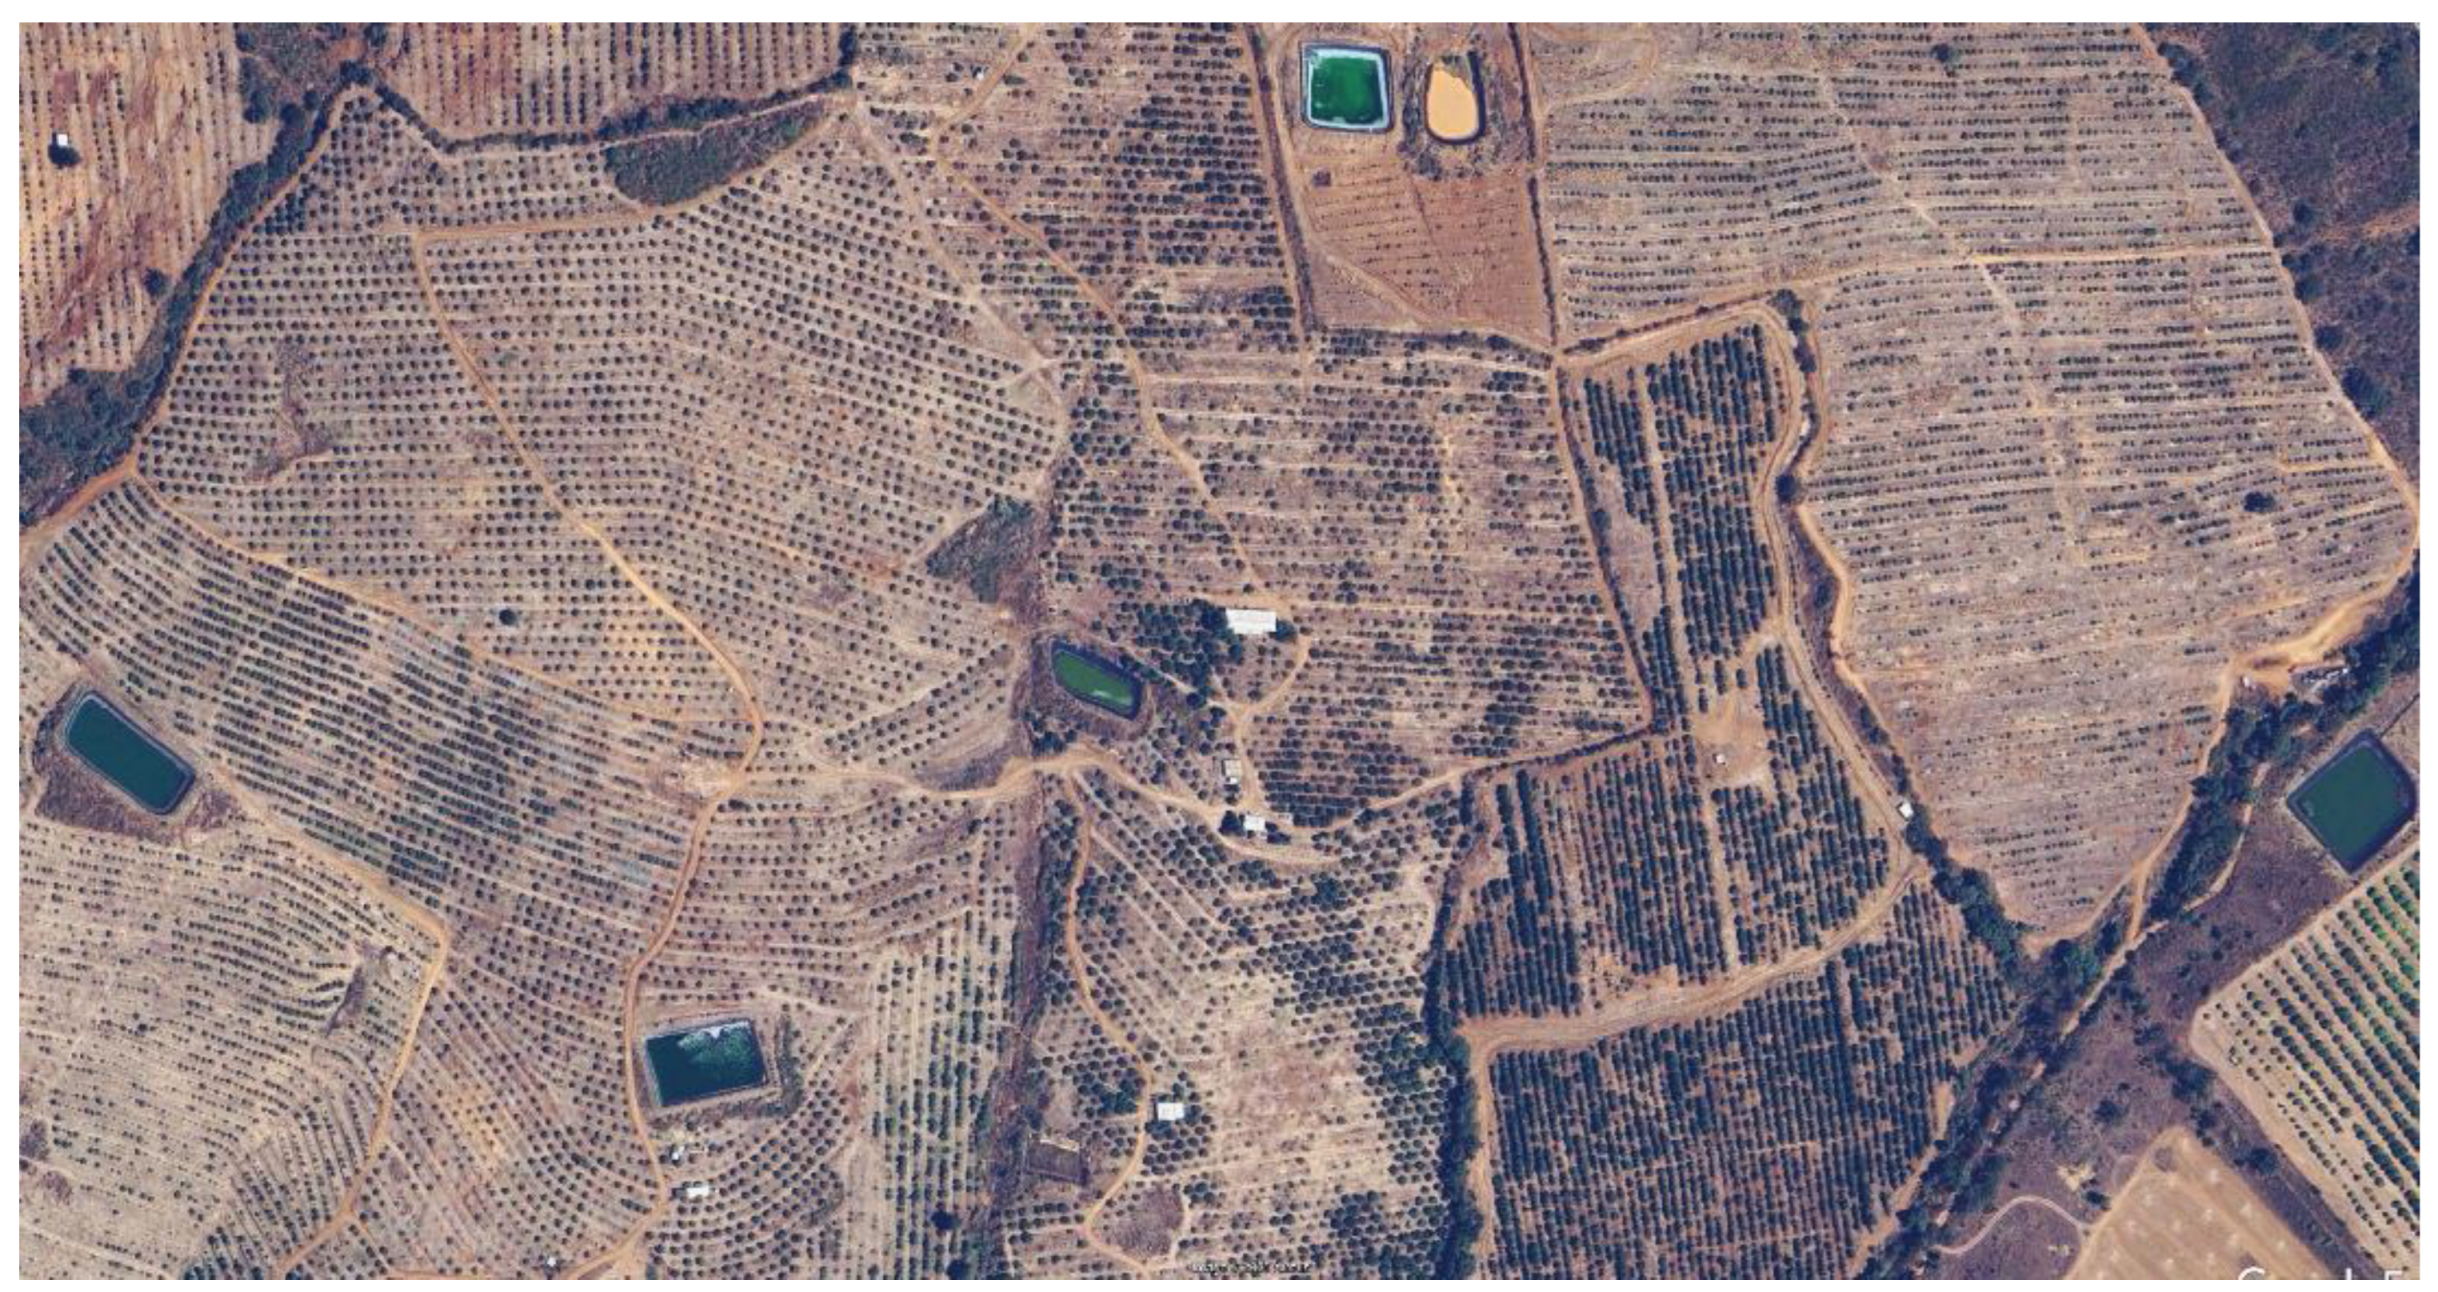
Figure 8.
Expansion of avocado frontier of 2024. The map can be interactively explored at https://ciga-unam.maps.arcgis.com/apps/instant/basic/index.html?appid=b7343d3cdfee4f0599c04fd098888a4c.
Figure 8.
Expansion of avocado frontier of 2024. The map can be interactively explored at https://ciga-unam.maps.arcgis.com/apps/instant/basic/index.html?appid=b7343d3cdfee4f0599c04fd098888a4c.
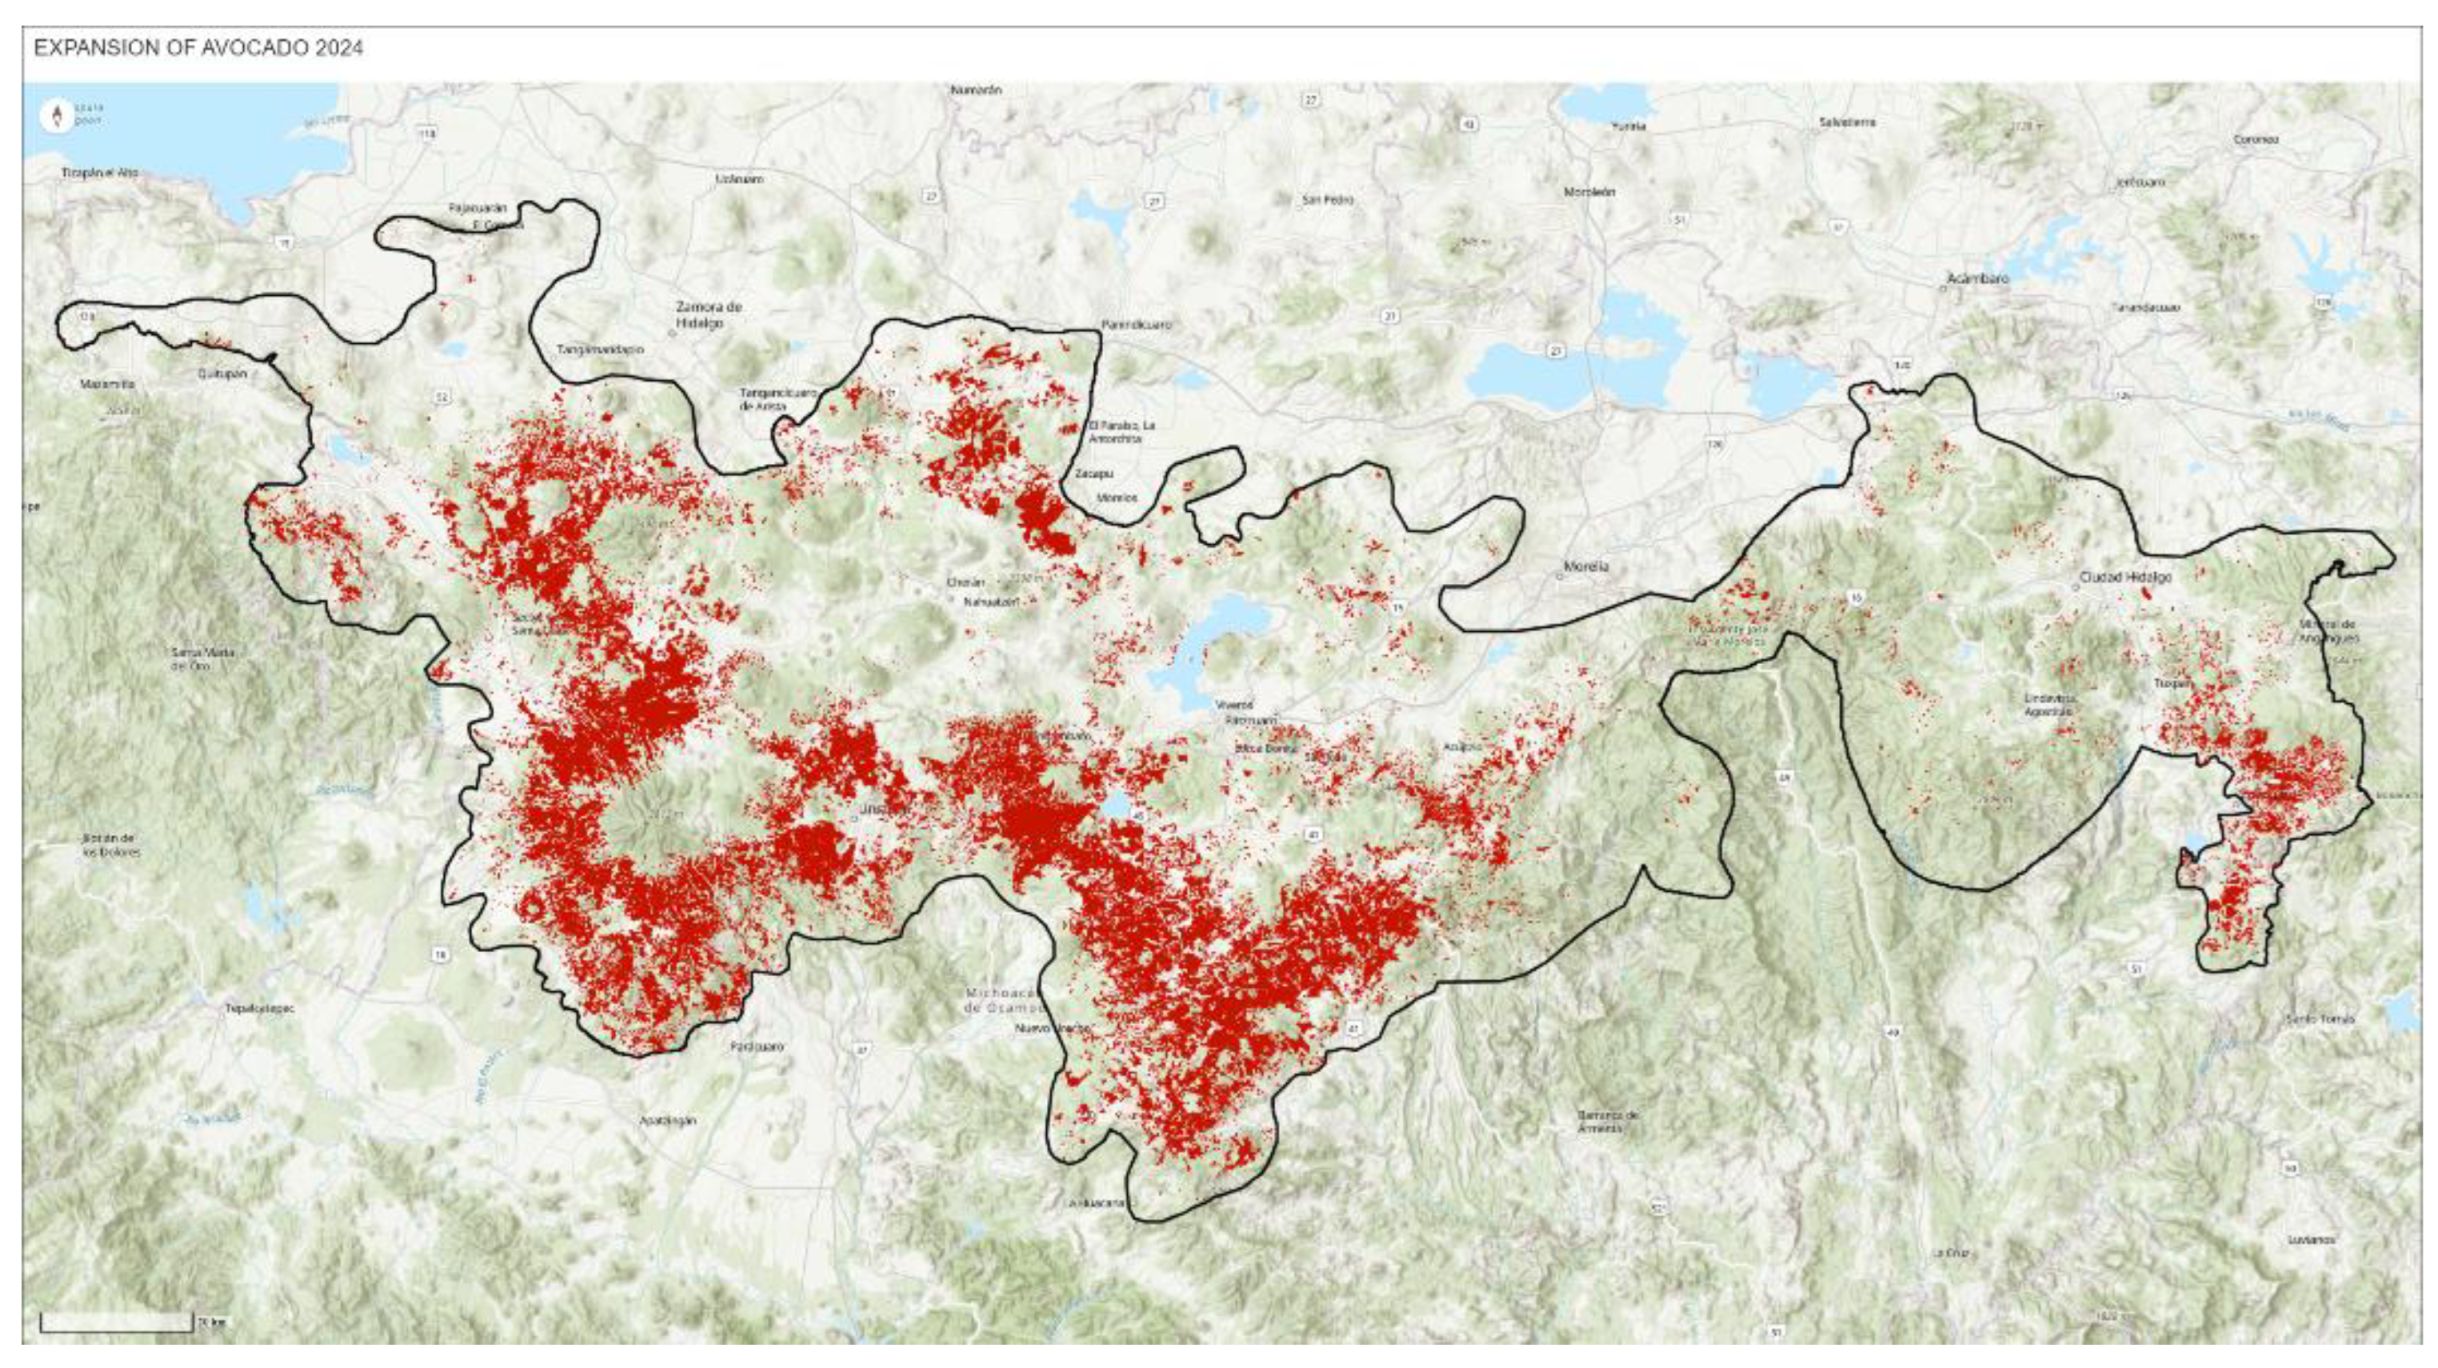
Figure 9.
Spatial evolution of avocado expansion from 1974 to 2024 in Michoacán, Mexico [18]. This map can be explored online at the following address: https://arcg.is/0vmmGP.
Figure 9.
Spatial evolution of avocado expansion from 1974 to 2024 in Michoacán, Mexico [18]. This map can be explored online at the following address: https://arcg.is/0vmmGP.
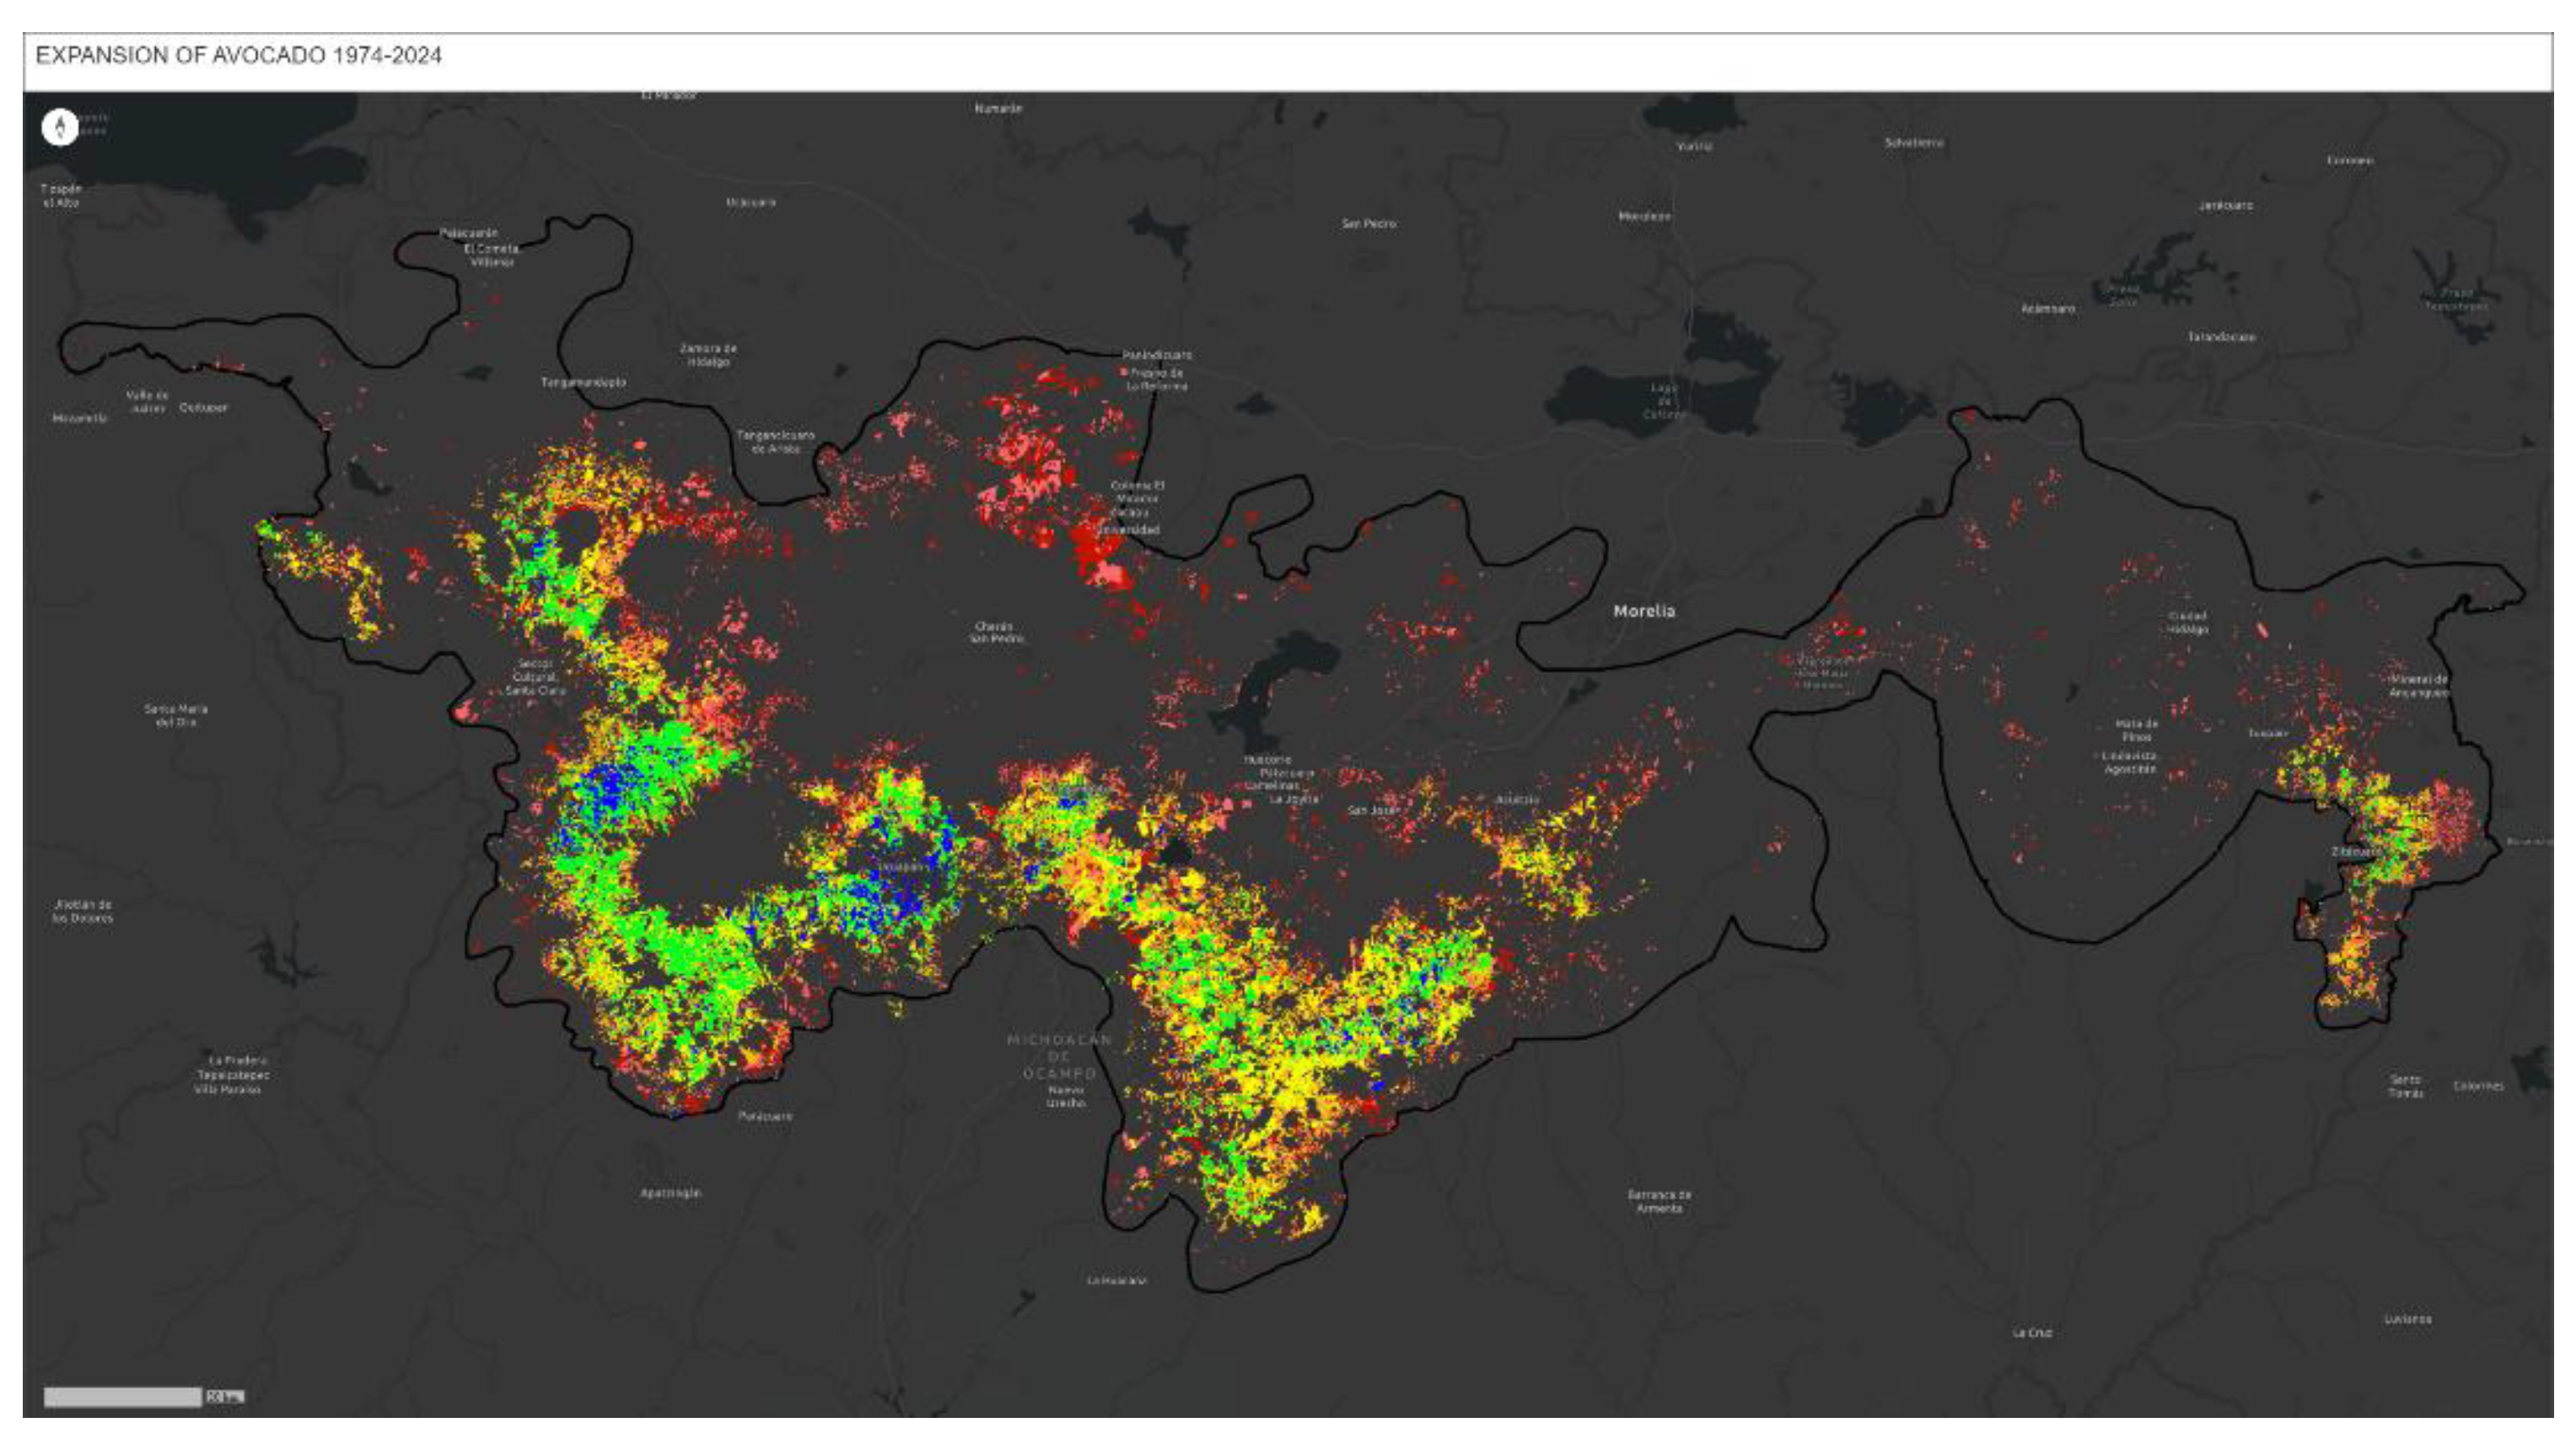
Figure 10.
Avocado Expansion in Michoacán, Mexico (1974–2024).
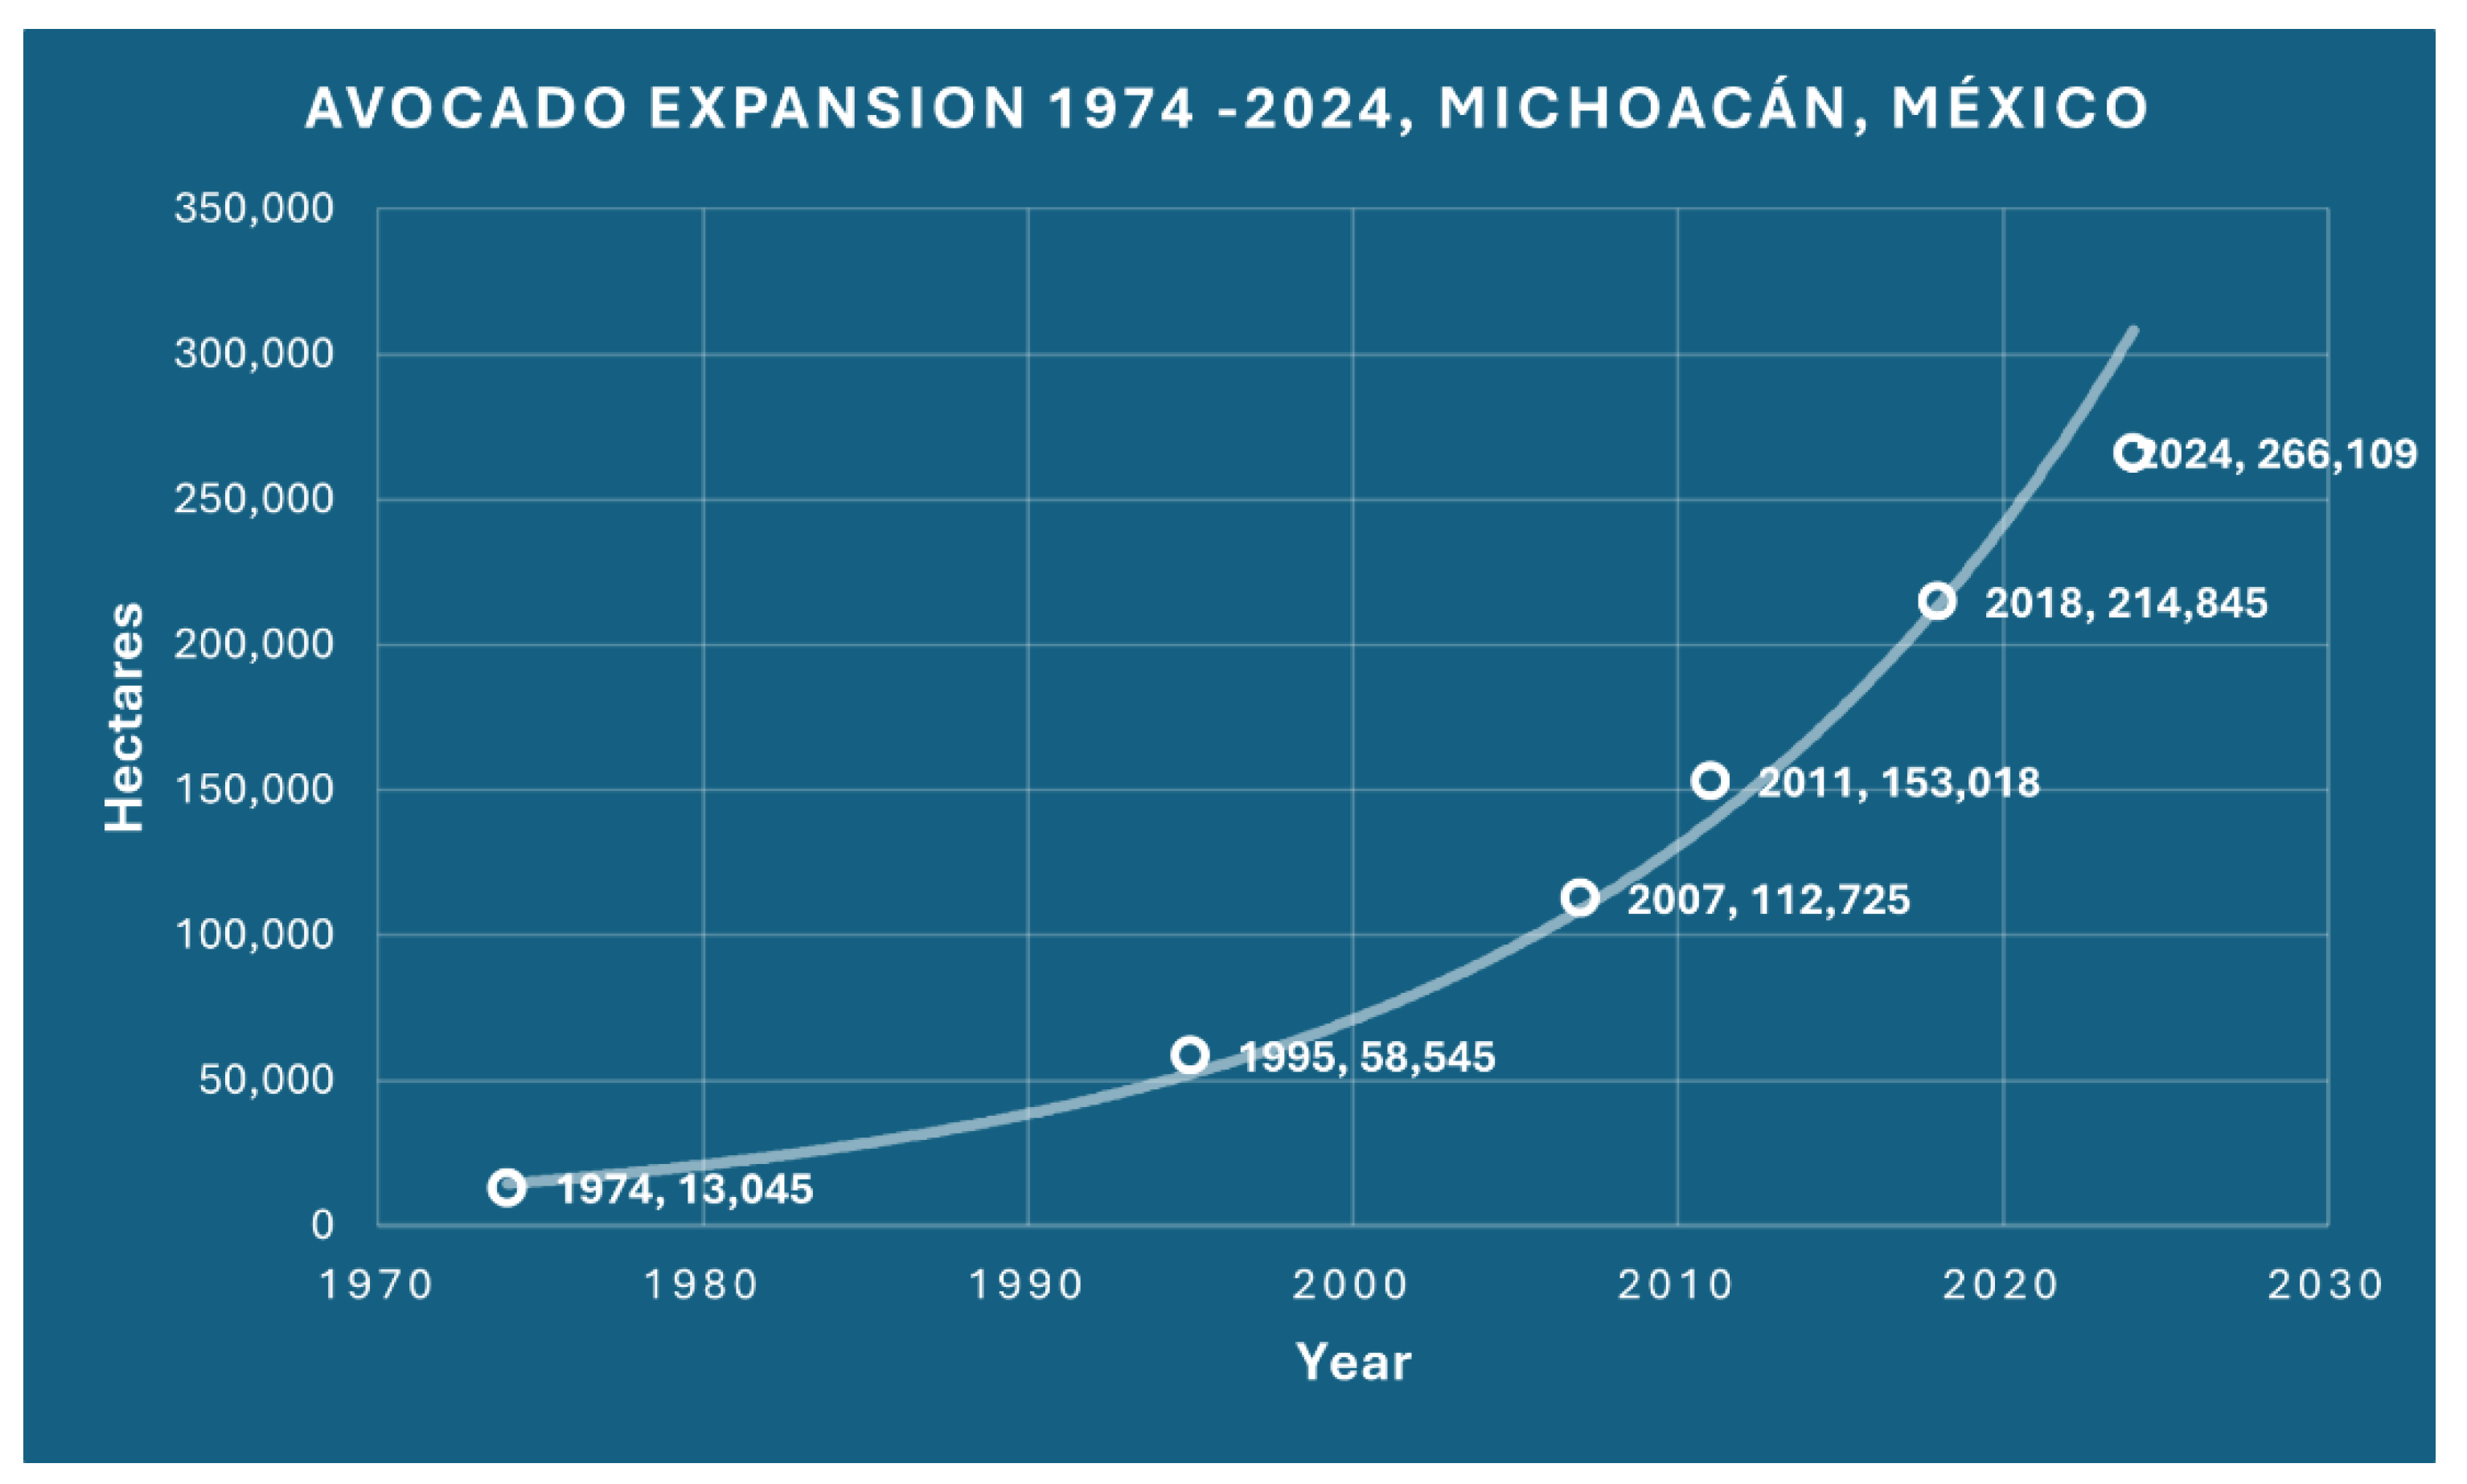
Figure 11.
Rate of Avocado Expansion in Michoacán, Mexico (1974–2024).
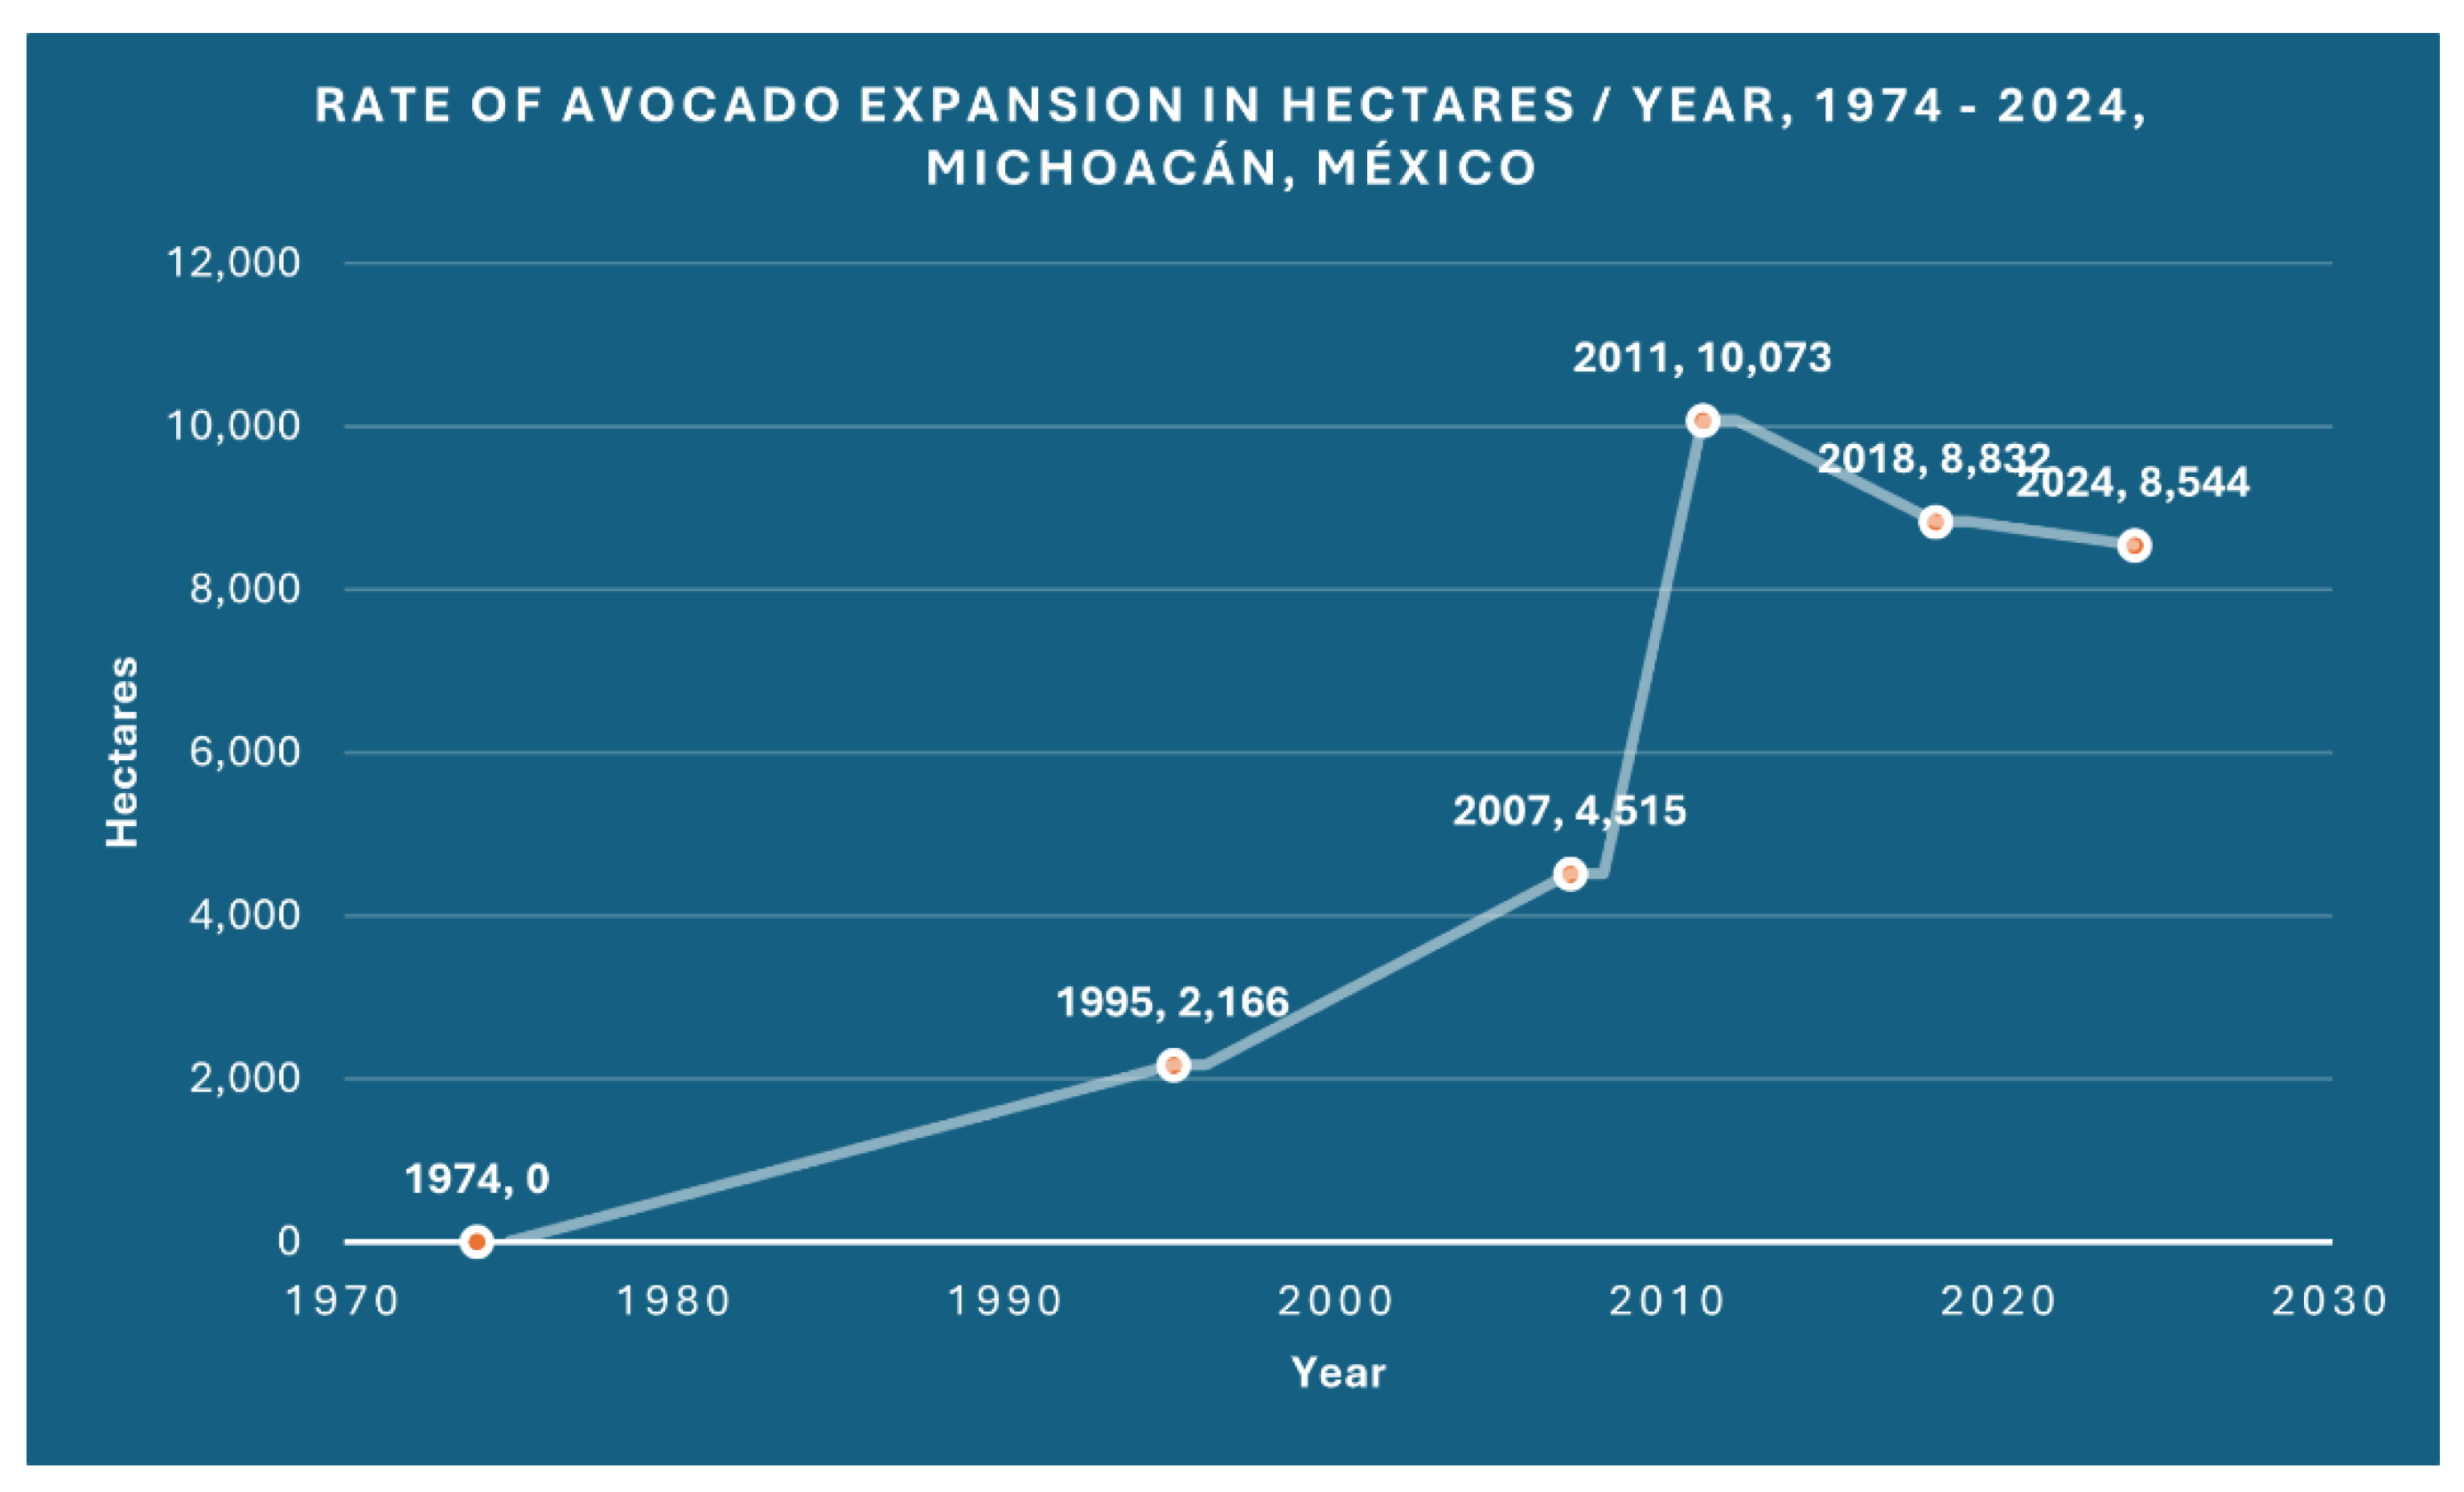
Figure 12.
Land Use / Land Cover map of the year 1974. The map can be interactively explored at https://ciga-unam.maps.arcgis.com/apps/instant/basic/index.html?appid=ac0385b07fb24d1e8d289b59225870f2.
Figure 12.
Land Use / Land Cover map of the year 1974. The map can be interactively explored at https://ciga-unam.maps.arcgis.com/apps/instant/basic/index.html?appid=ac0385b07fb24d1e8d289b59225870f2.
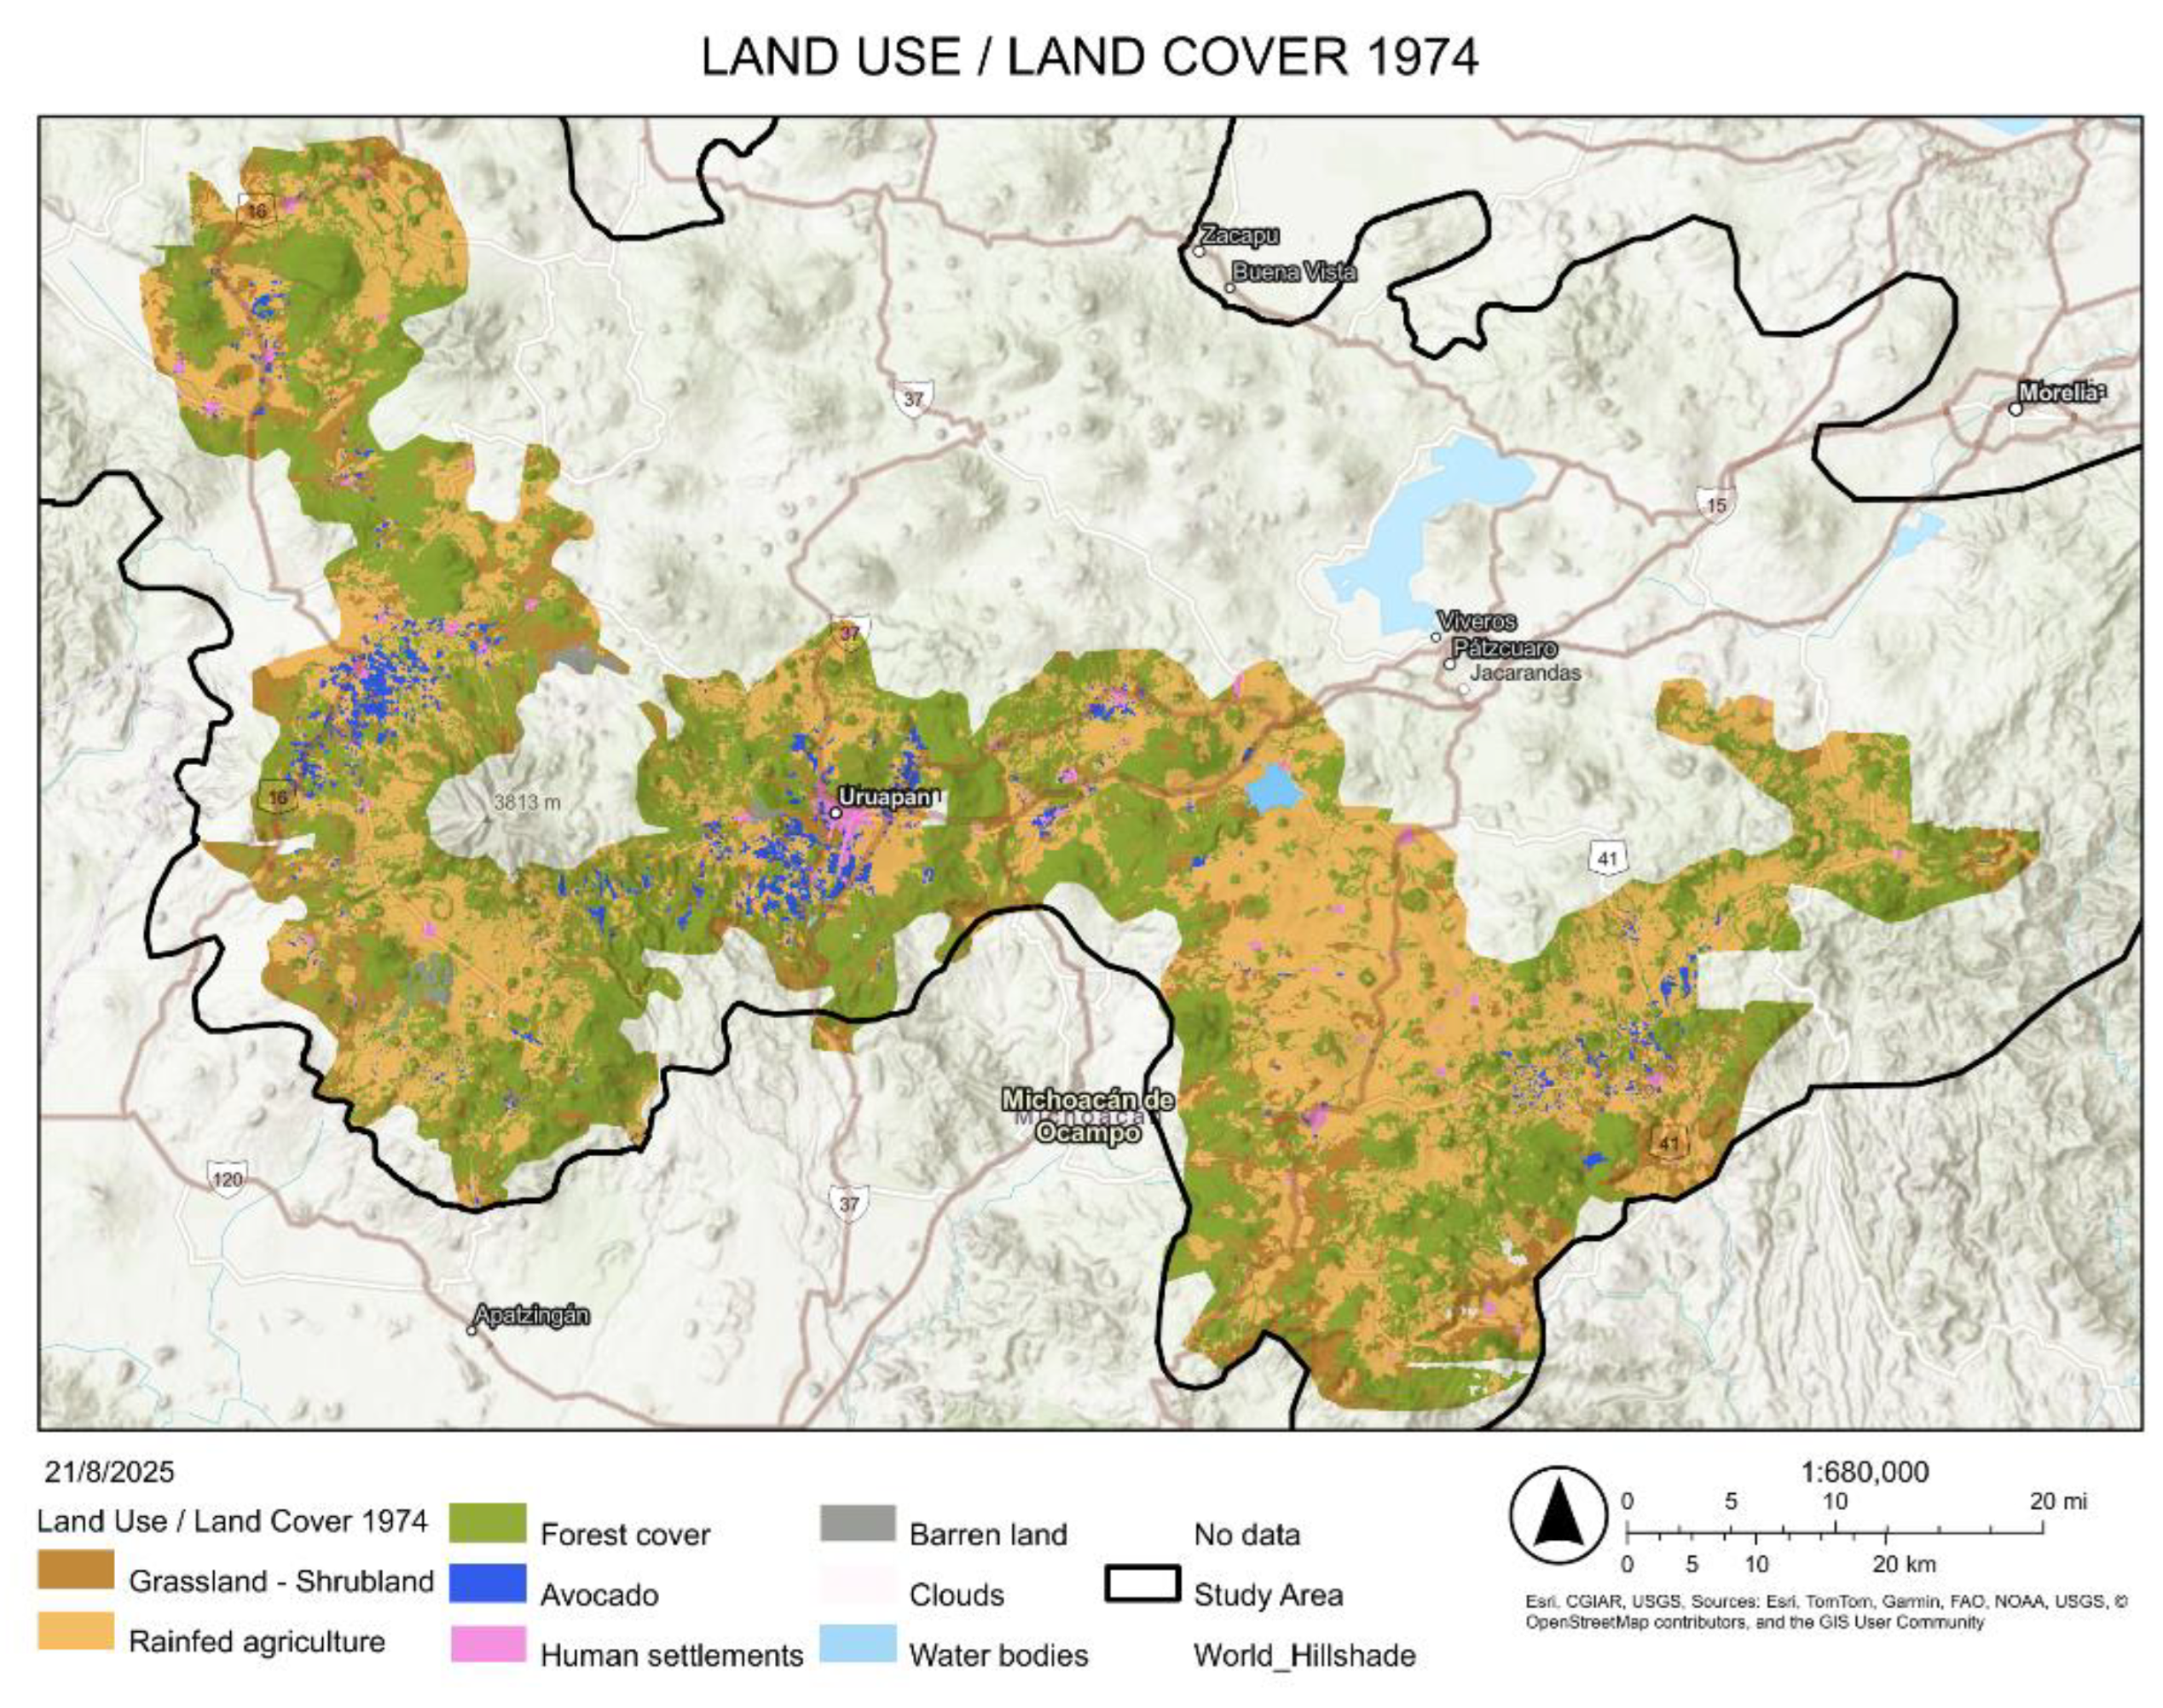
Figure 13.
Forest loss map for the period 1974–1995, showing an estimated 12,537 hectares of forest cover replaced by avocado cultivation. The map can be interactively explored at https://ciga-unam.maps.arcgis.com/apps/instant/basic/index.html?appid=45aca17399c942fdbbd910d26aa80487.
Figure 13.
Forest loss map for the period 1974–1995, showing an estimated 12,537 hectares of forest cover replaced by avocado cultivation. The map can be interactively explored at https://ciga-unam.maps.arcgis.com/apps/instant/basic/index.html?appid=45aca17399c942fdbbd910d26aa80487.
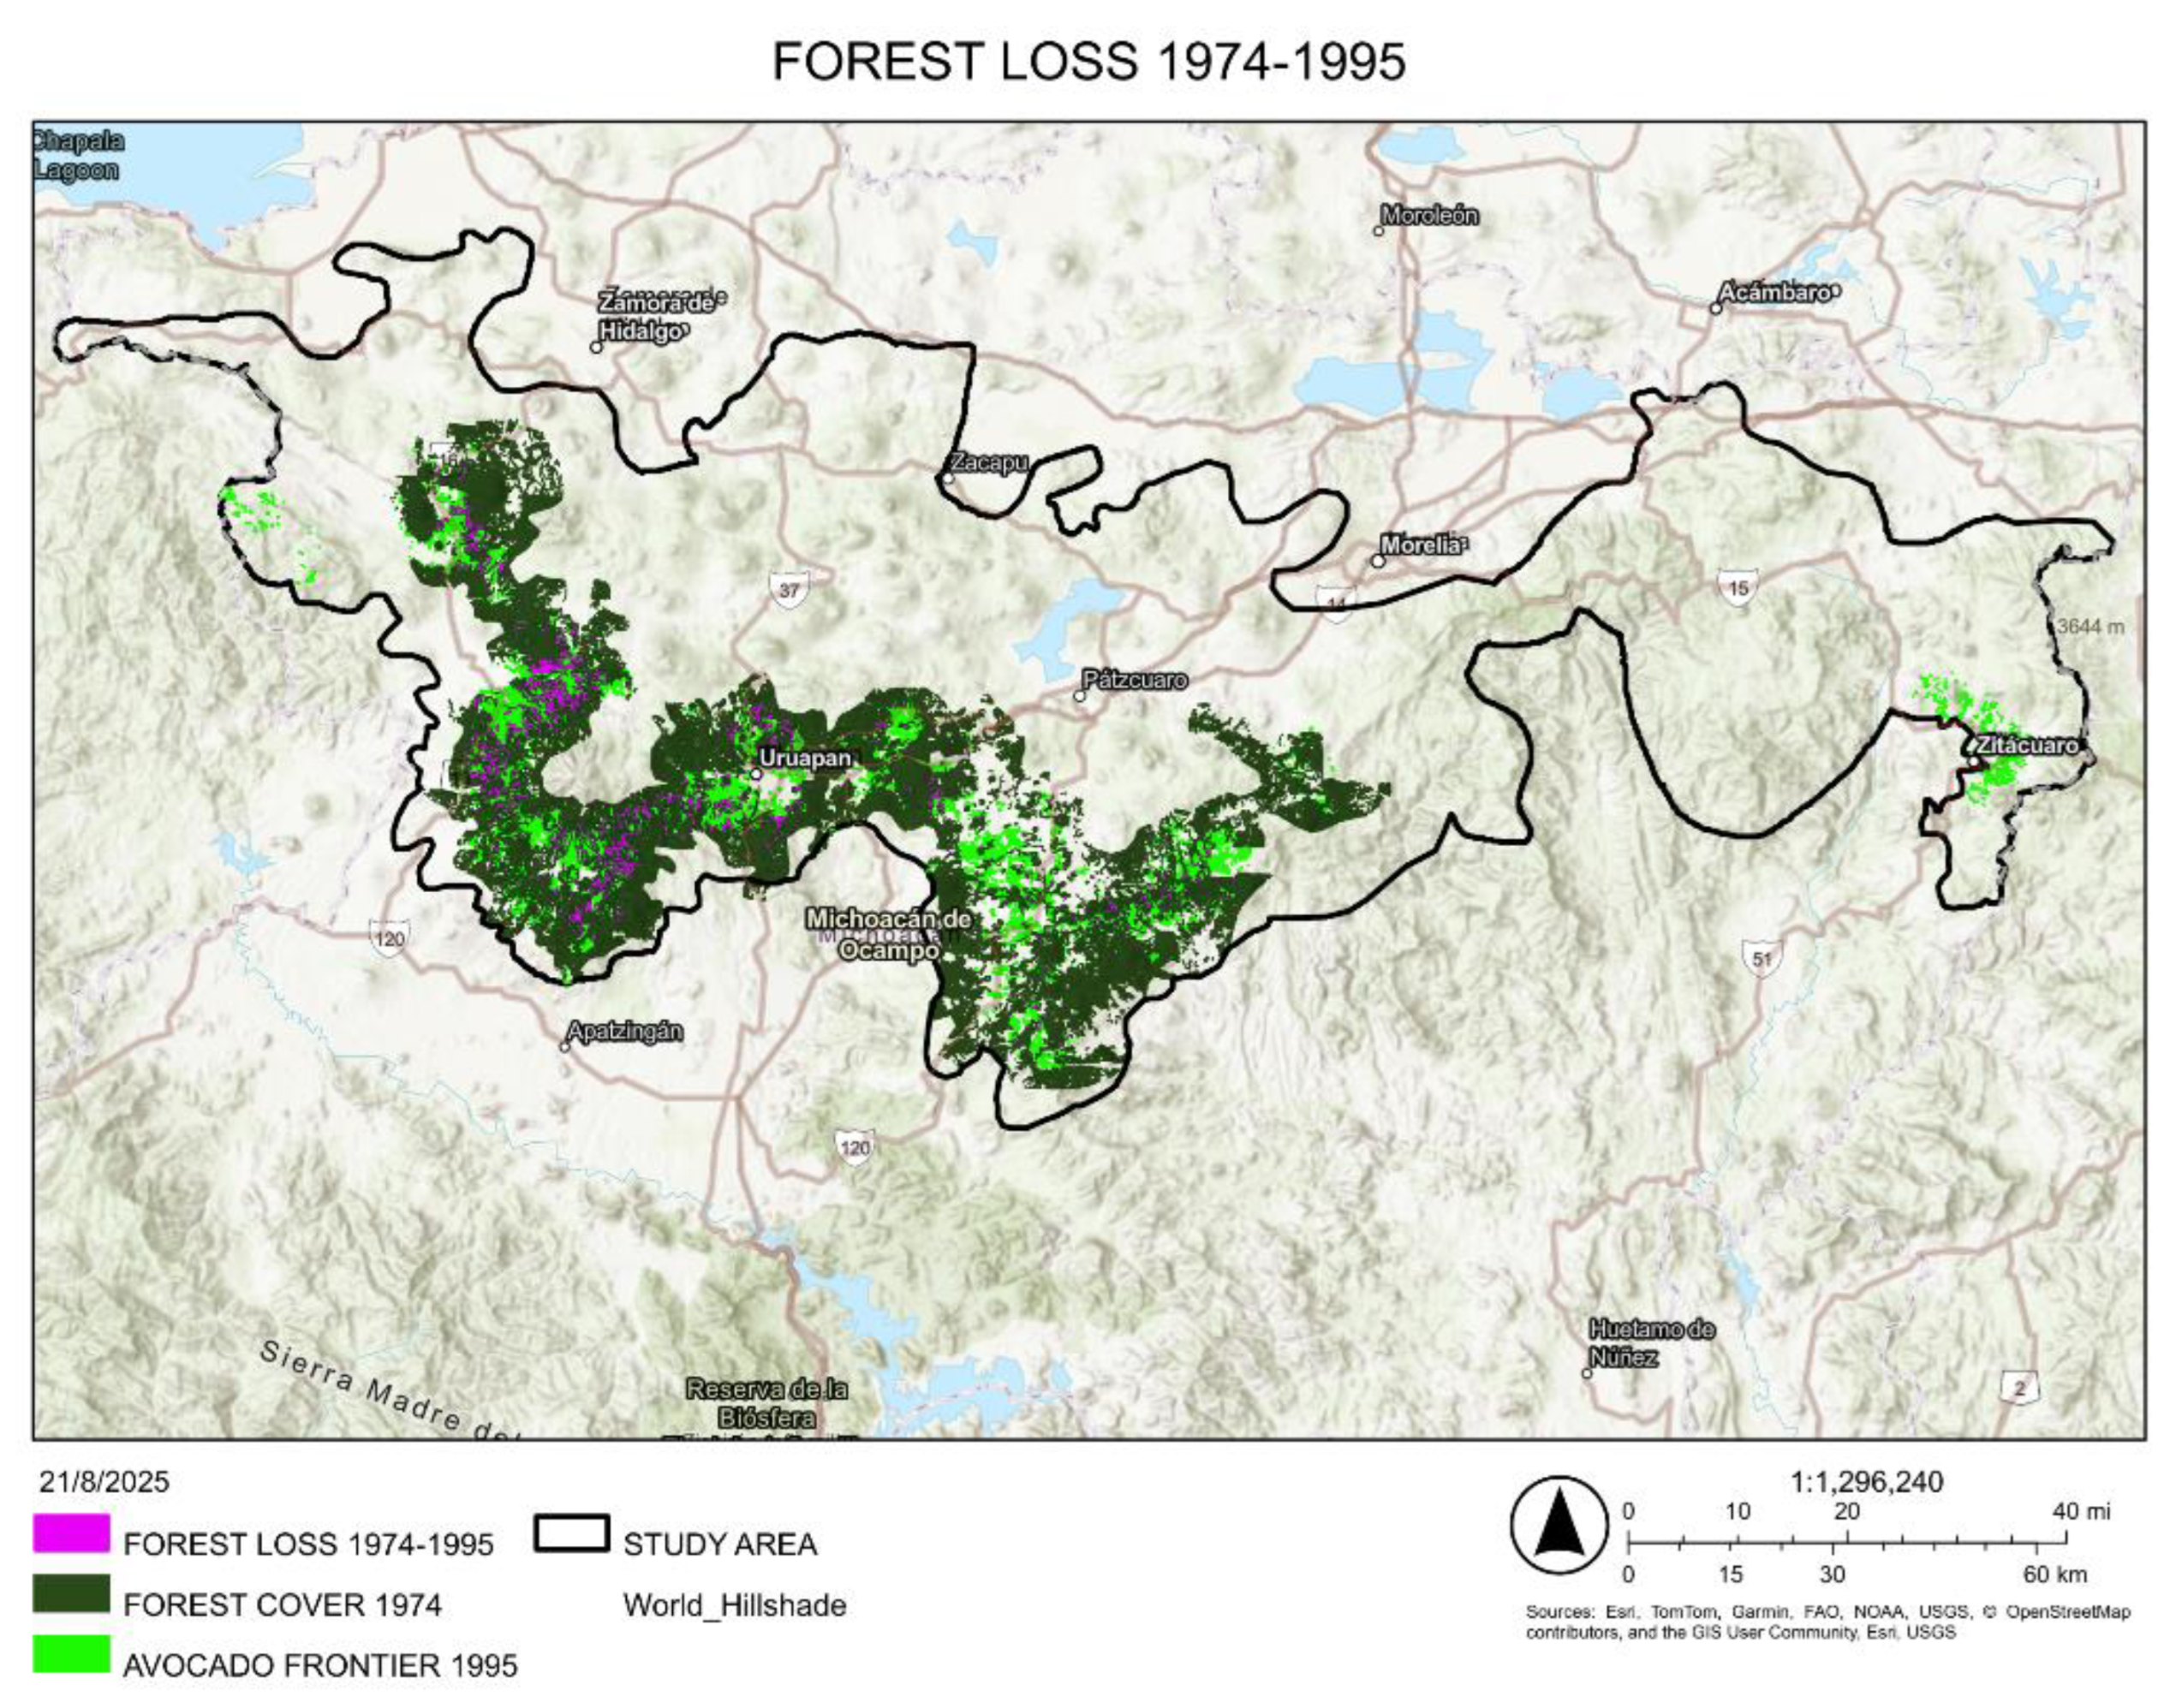
Figure 14.
Forest loss map for the period 1974–2007, showing an estimated 33,116 hectares of forest cover replaced by avocado cultivation. The map can be interactively explored at https://ciga-unam.maps.arcgis.com/apps/instant/basic/index.html?appid=7f97cdebbeff40caae4f16ef2621b06e.
Figure 14.
Forest loss map for the period 1974–2007, showing an estimated 33,116 hectares of forest cover replaced by avocado cultivation. The map can be interactively explored at https://ciga-unam.maps.arcgis.com/apps/instant/basic/index.html?appid=7f97cdebbeff40caae4f16ef2621b06e.
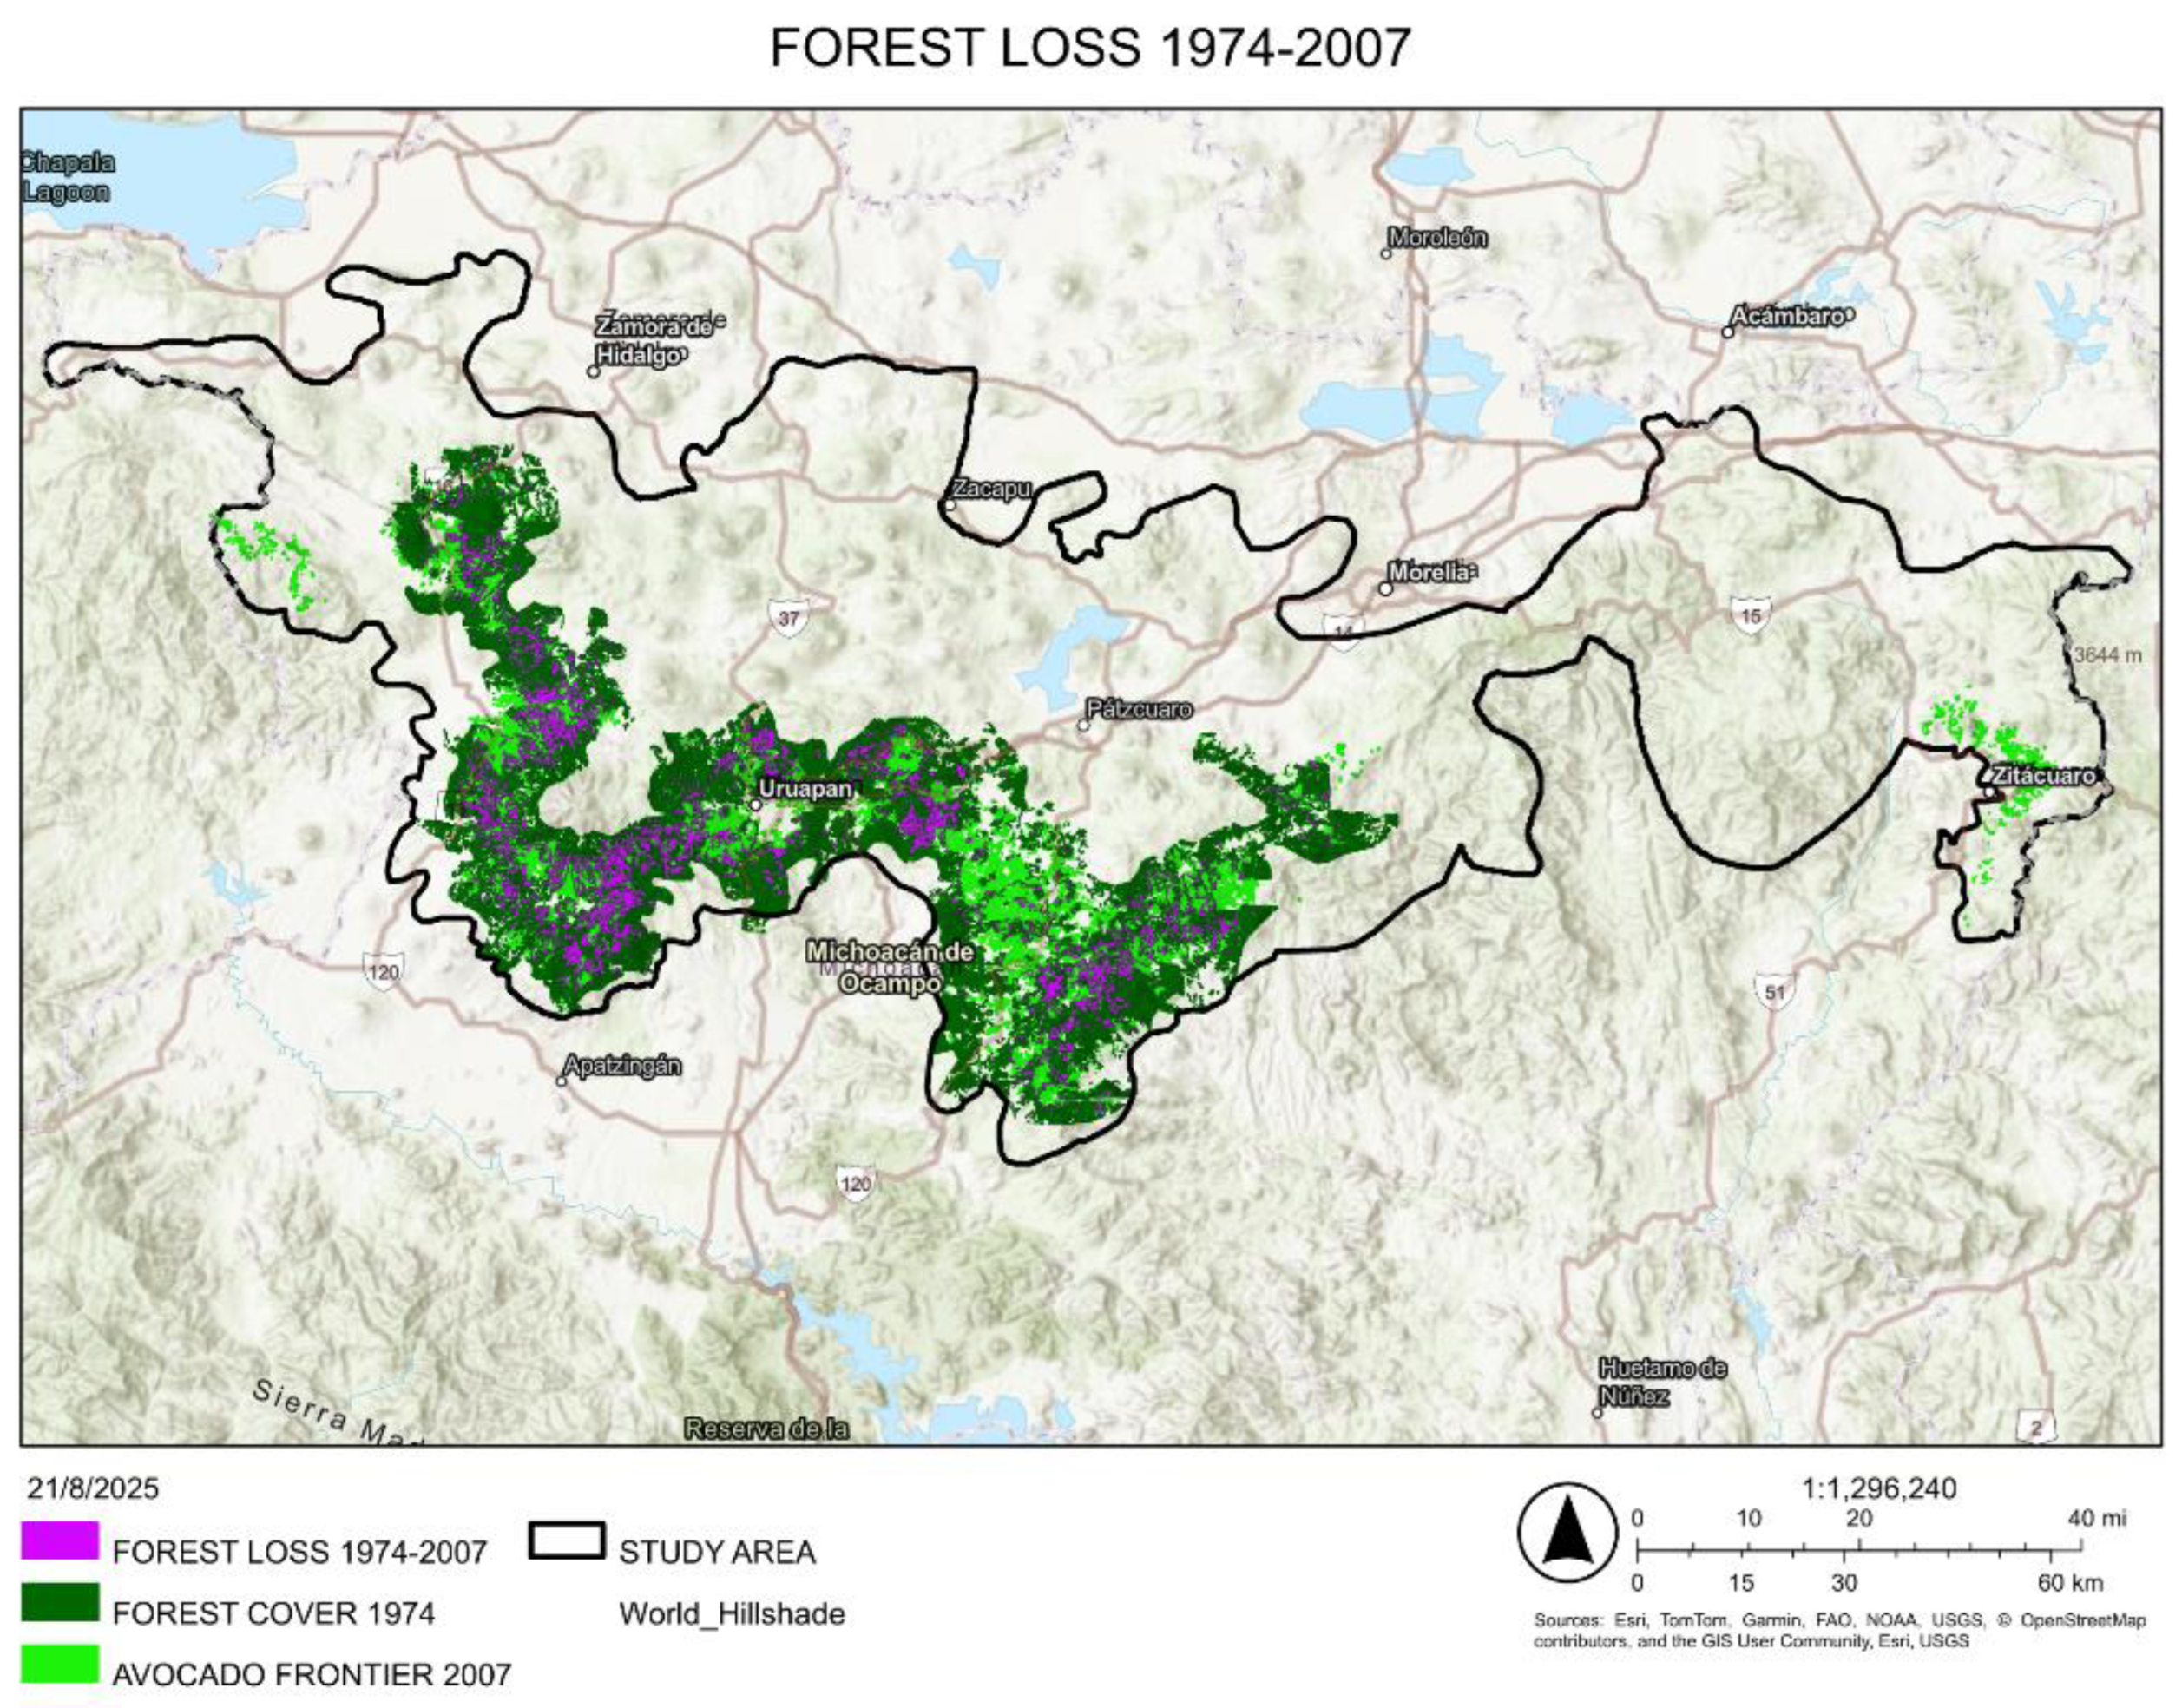
Figure 15.
Forest loss map for the period 1974–2011, showing an estimated 49,043 hectares of forest cover replaced by avocado cultivation. The map can be interactively explored at https://ciga-unam.maps.arcgis.com/apps/instant/basic/index.html?appid=fcc5cf8cdd944434a061f69884127294.
Figure 15.
Forest loss map for the period 1974–2011, showing an estimated 49,043 hectares of forest cover replaced by avocado cultivation. The map can be interactively explored at https://ciga-unam.maps.arcgis.com/apps/instant/basic/index.html?appid=fcc5cf8cdd944434a061f69884127294.
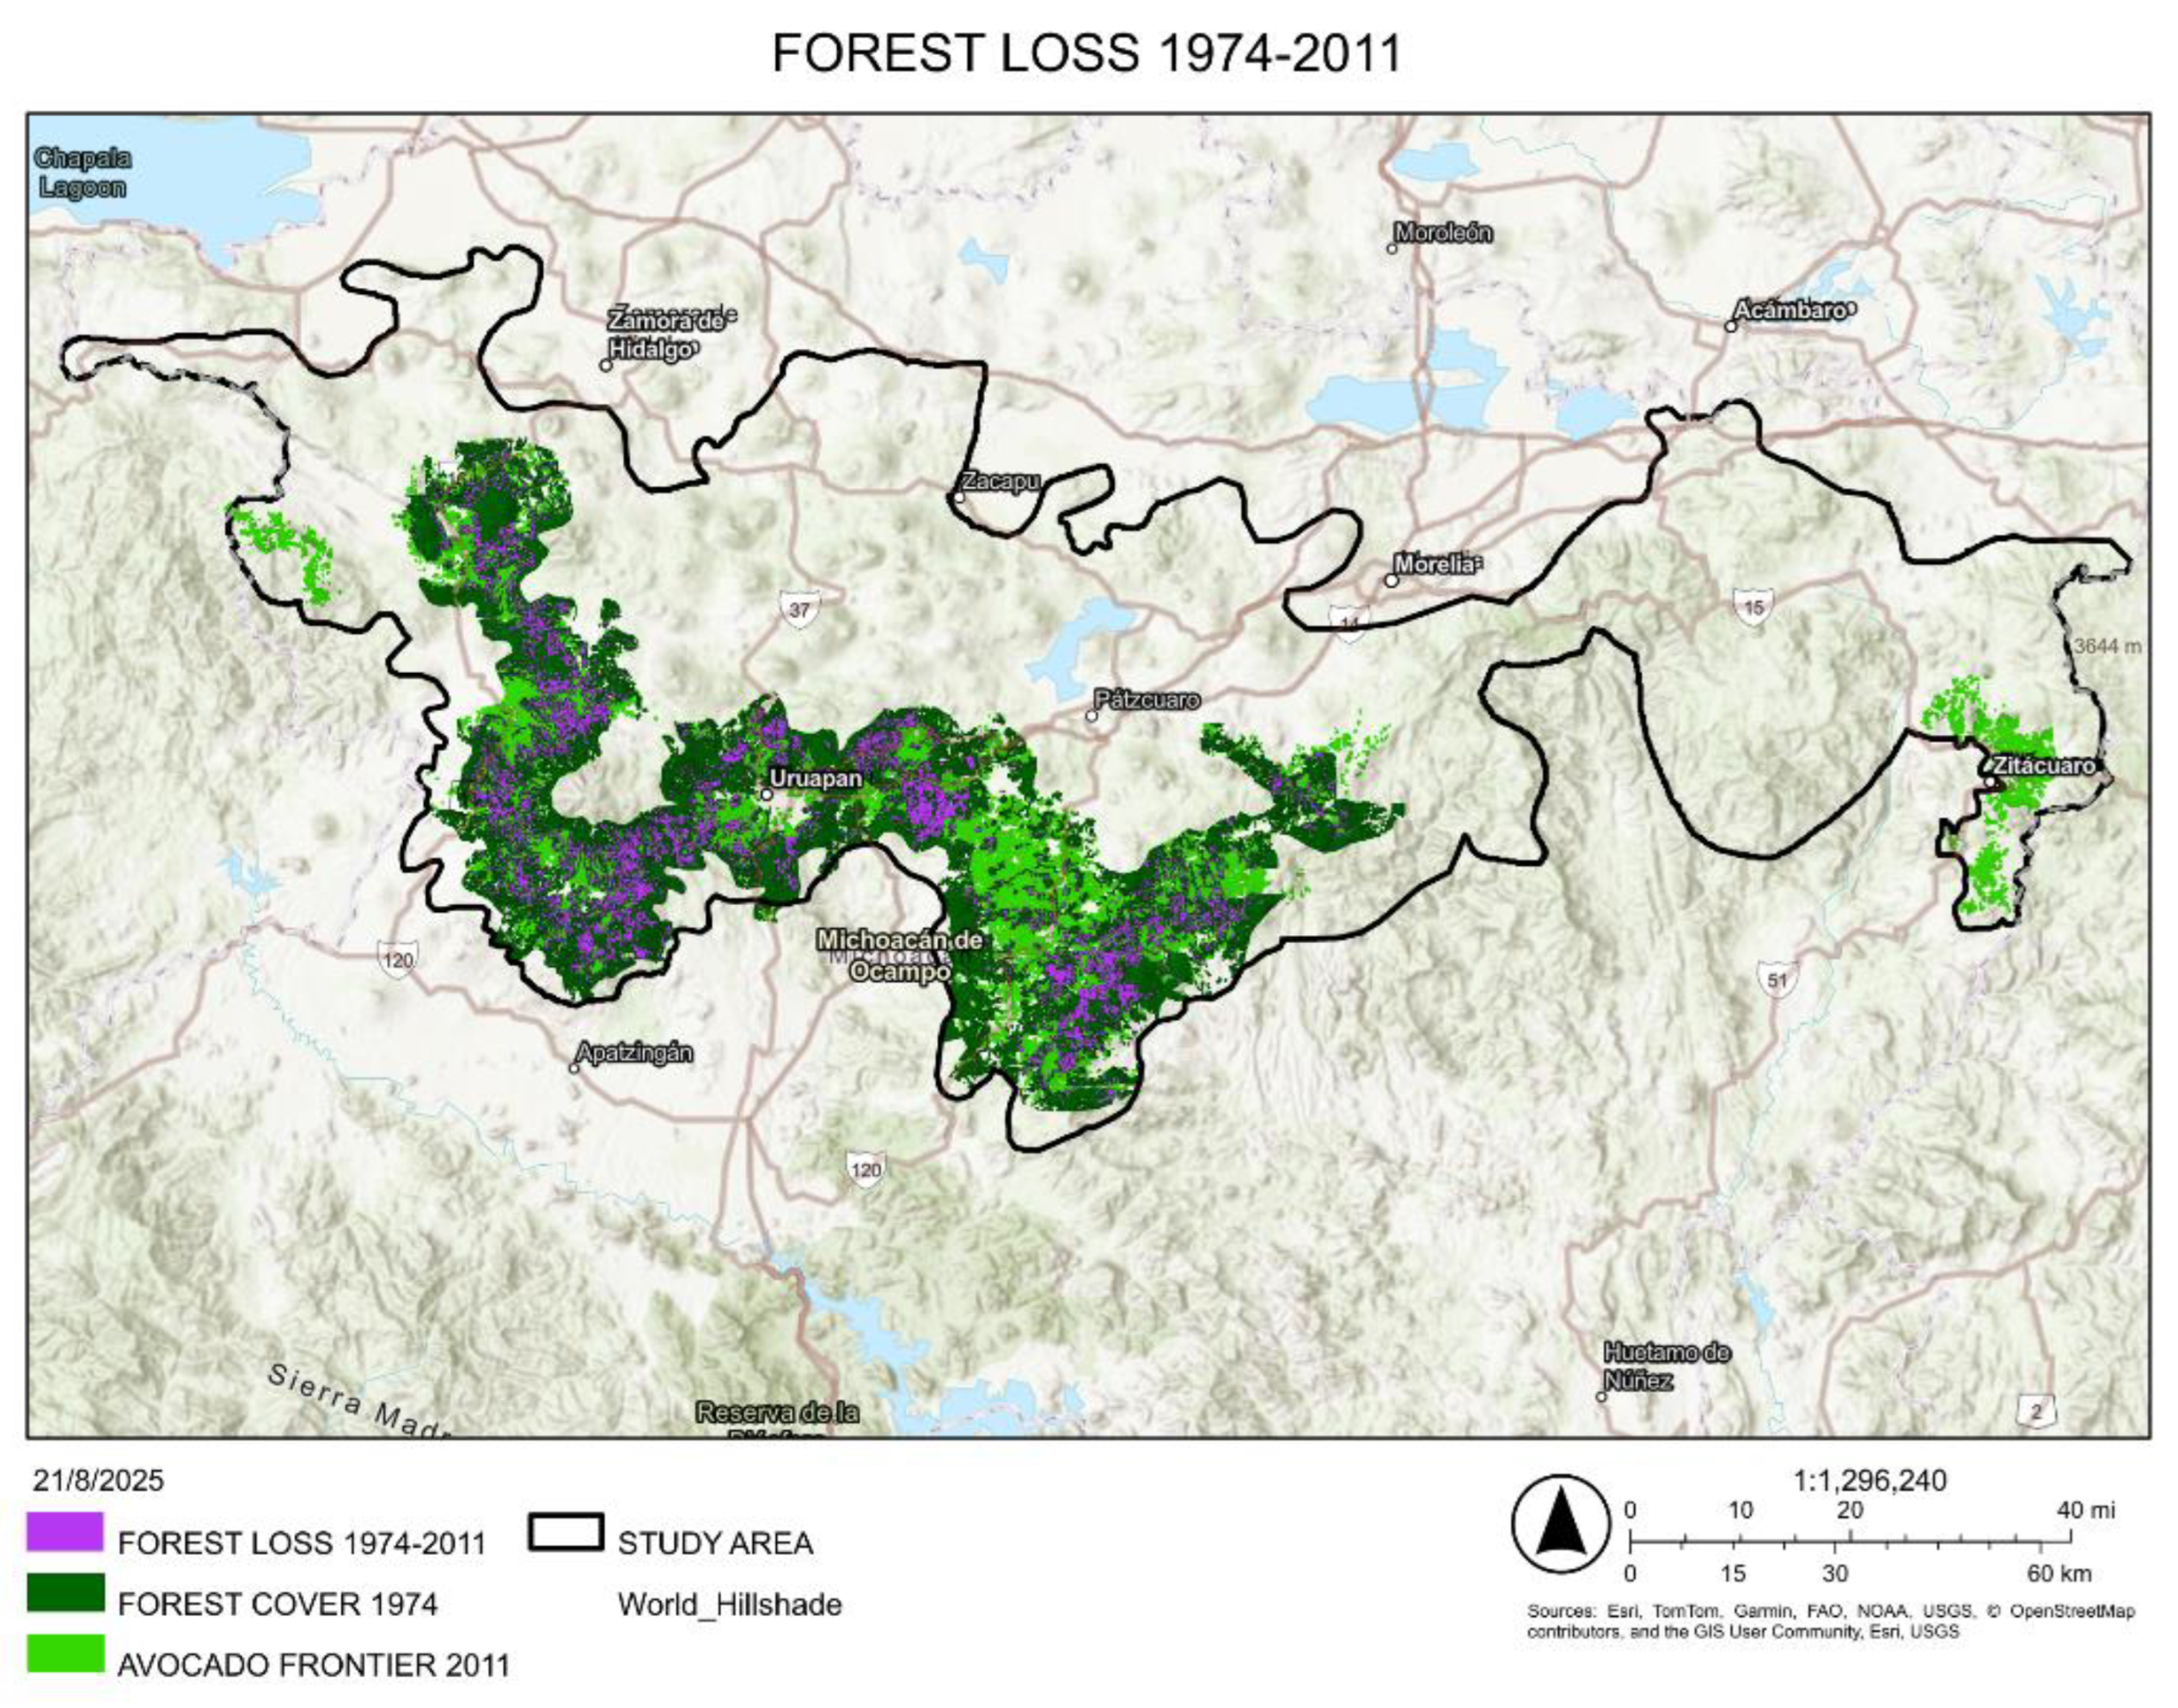
Figure 16.
Forest cover map for the year 2018, illustrating the spatial extent of forested areas across Study Area B in relation to avocado cultivation. The map can be interactively explored at https://ciga-unam.maps.arcgis.com/apps/instant/basic/index.html?appid=8d407ca819f74647a516ea84cc27d128.
Figure 16.
Forest cover map for the year 2018, illustrating the spatial extent of forested areas across Study Area B in relation to avocado cultivation. The map can be interactively explored at https://ciga-unam.maps.arcgis.com/apps/instant/basic/index.html?appid=8d407ca819f74647a516ea84cc27d128.
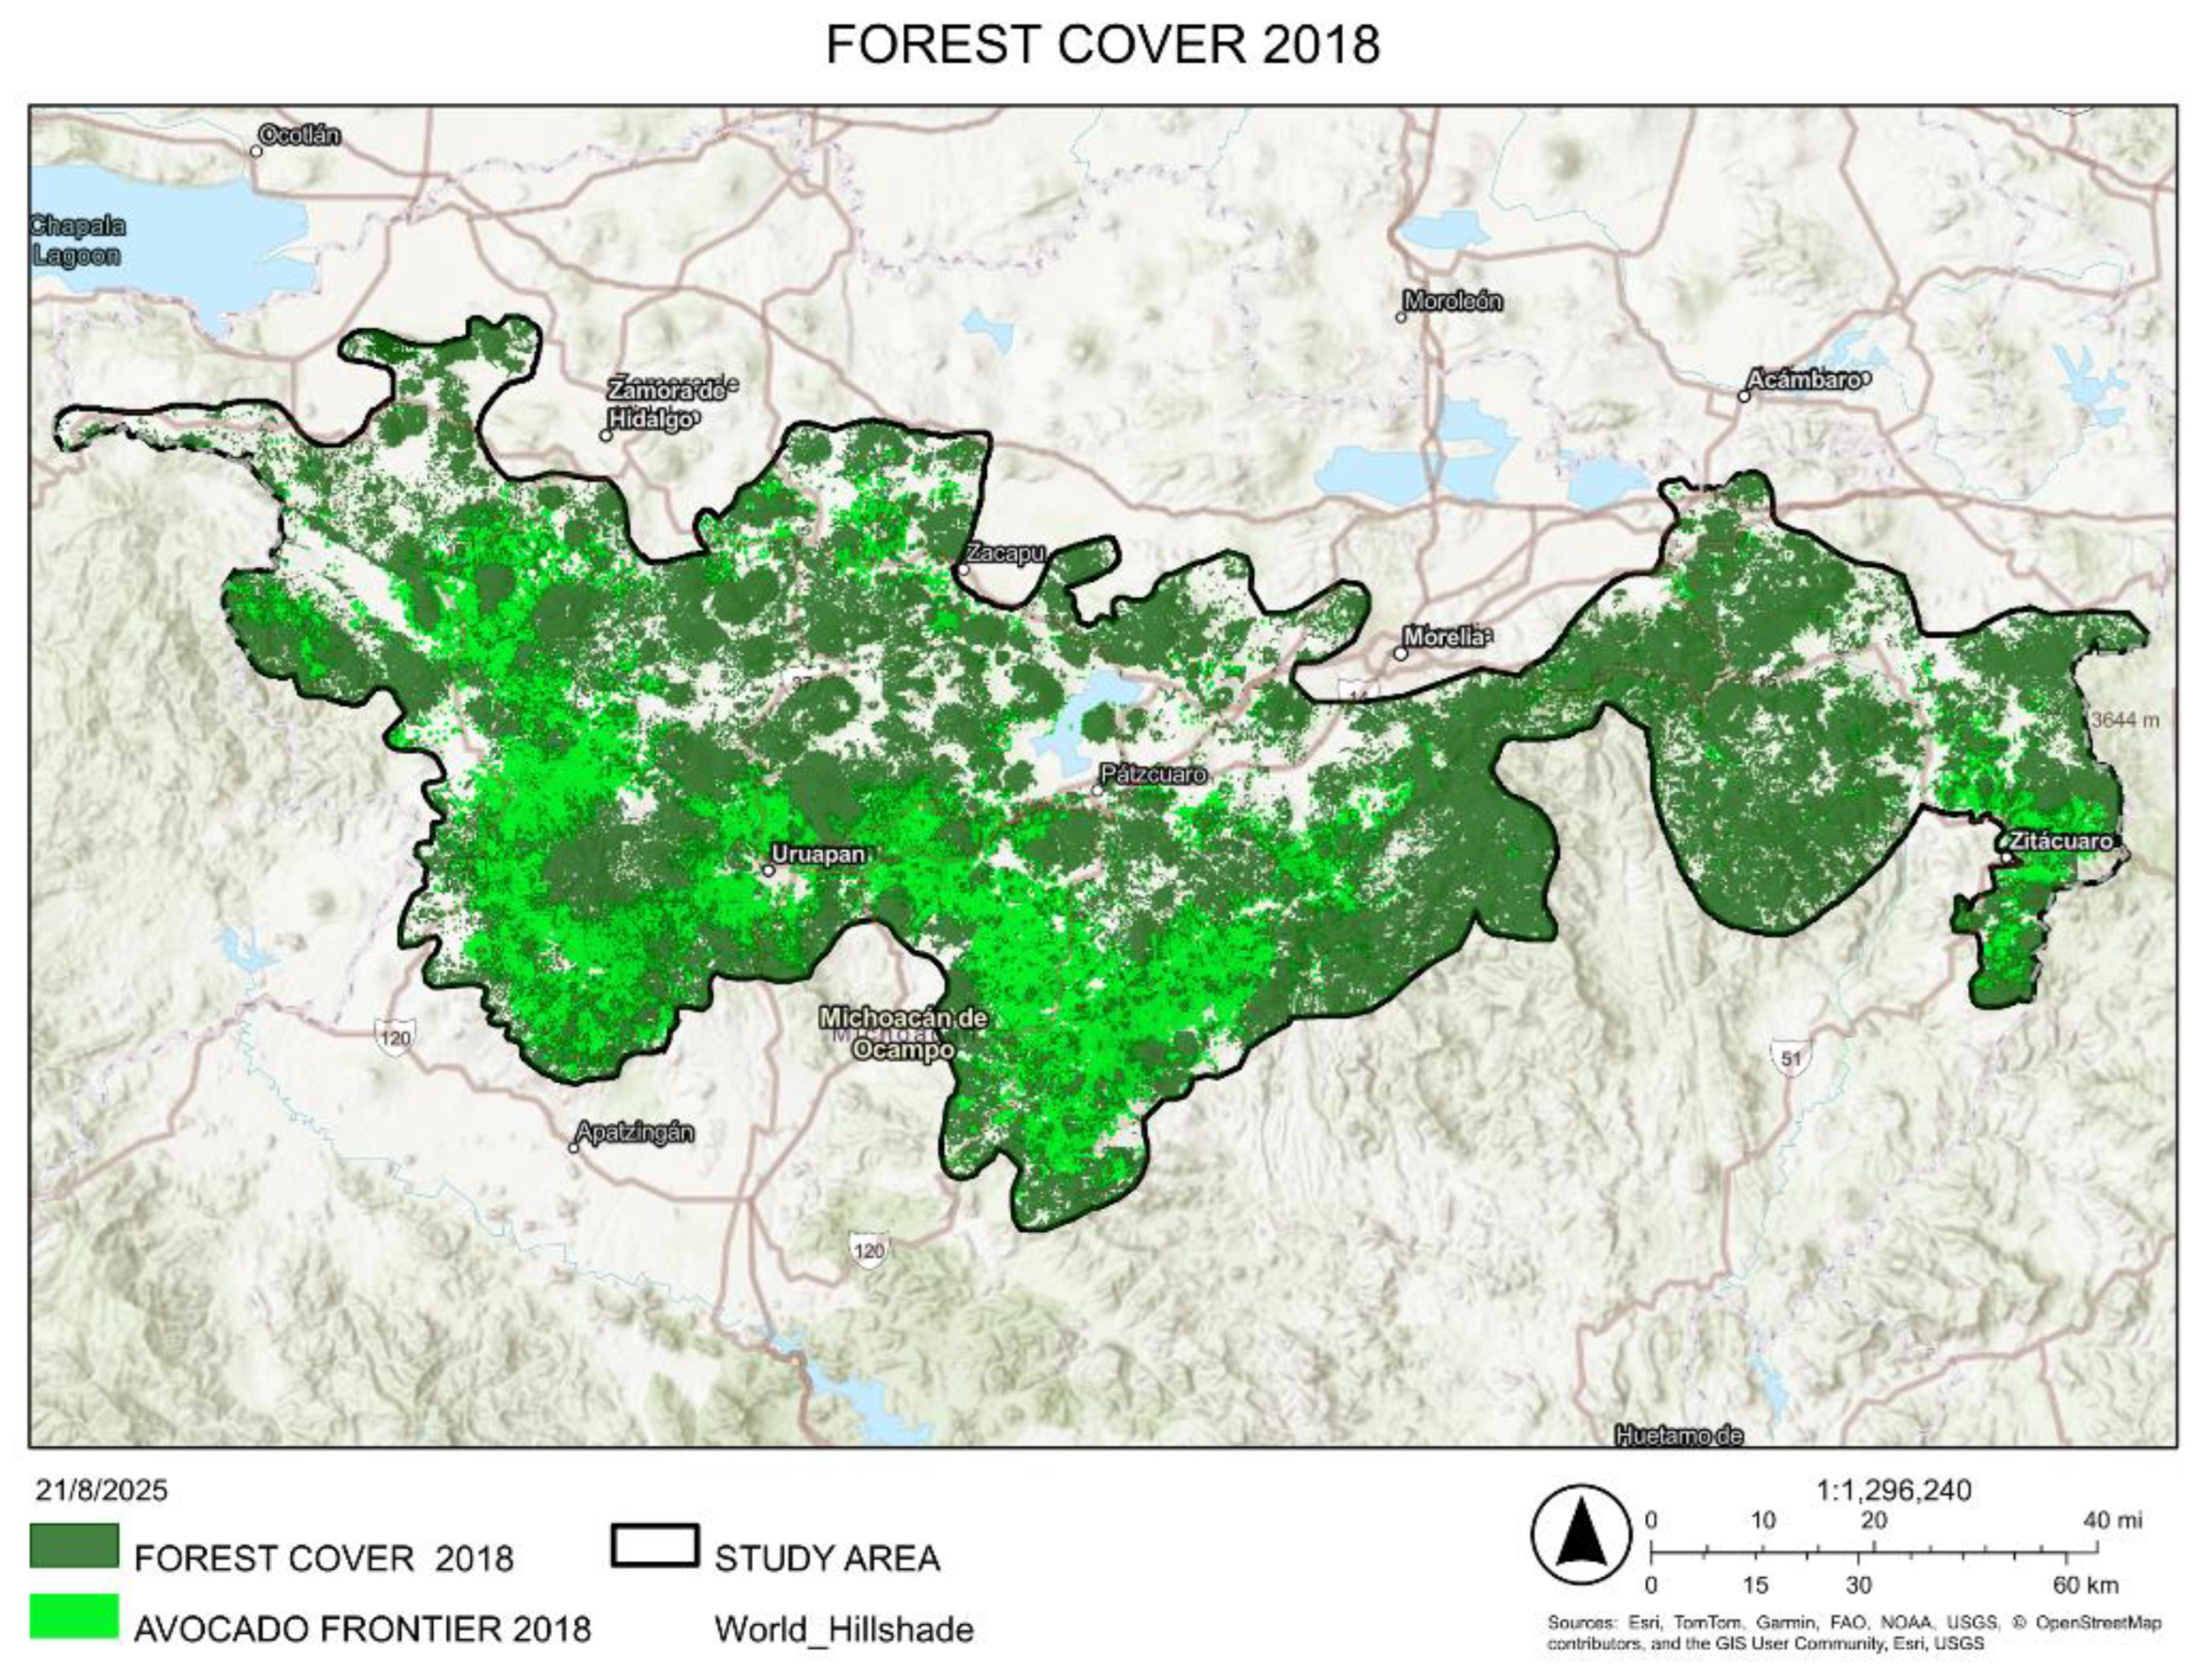
Figure 17.
Forest loss map for the period 2018–2024, showing an estimated 20,673 hectares of forest cover replaced by avocado cultivation in Study Area B. The map can be interactively explored at https://ciga-unam.maps.arcgis.com/apps/instant/basic/index.html?appid=50269fc976ec4075a8b547c4b71b7ef3.
Figure 17.
Forest loss map for the period 2018–2024, showing an estimated 20,673 hectares of forest cover replaced by avocado cultivation in Study Area B. The map can be interactively explored at https://ciga-unam.maps.arcgis.com/apps/instant/basic/index.html?appid=50269fc976ec4075a8b547c4b71b7ef3.
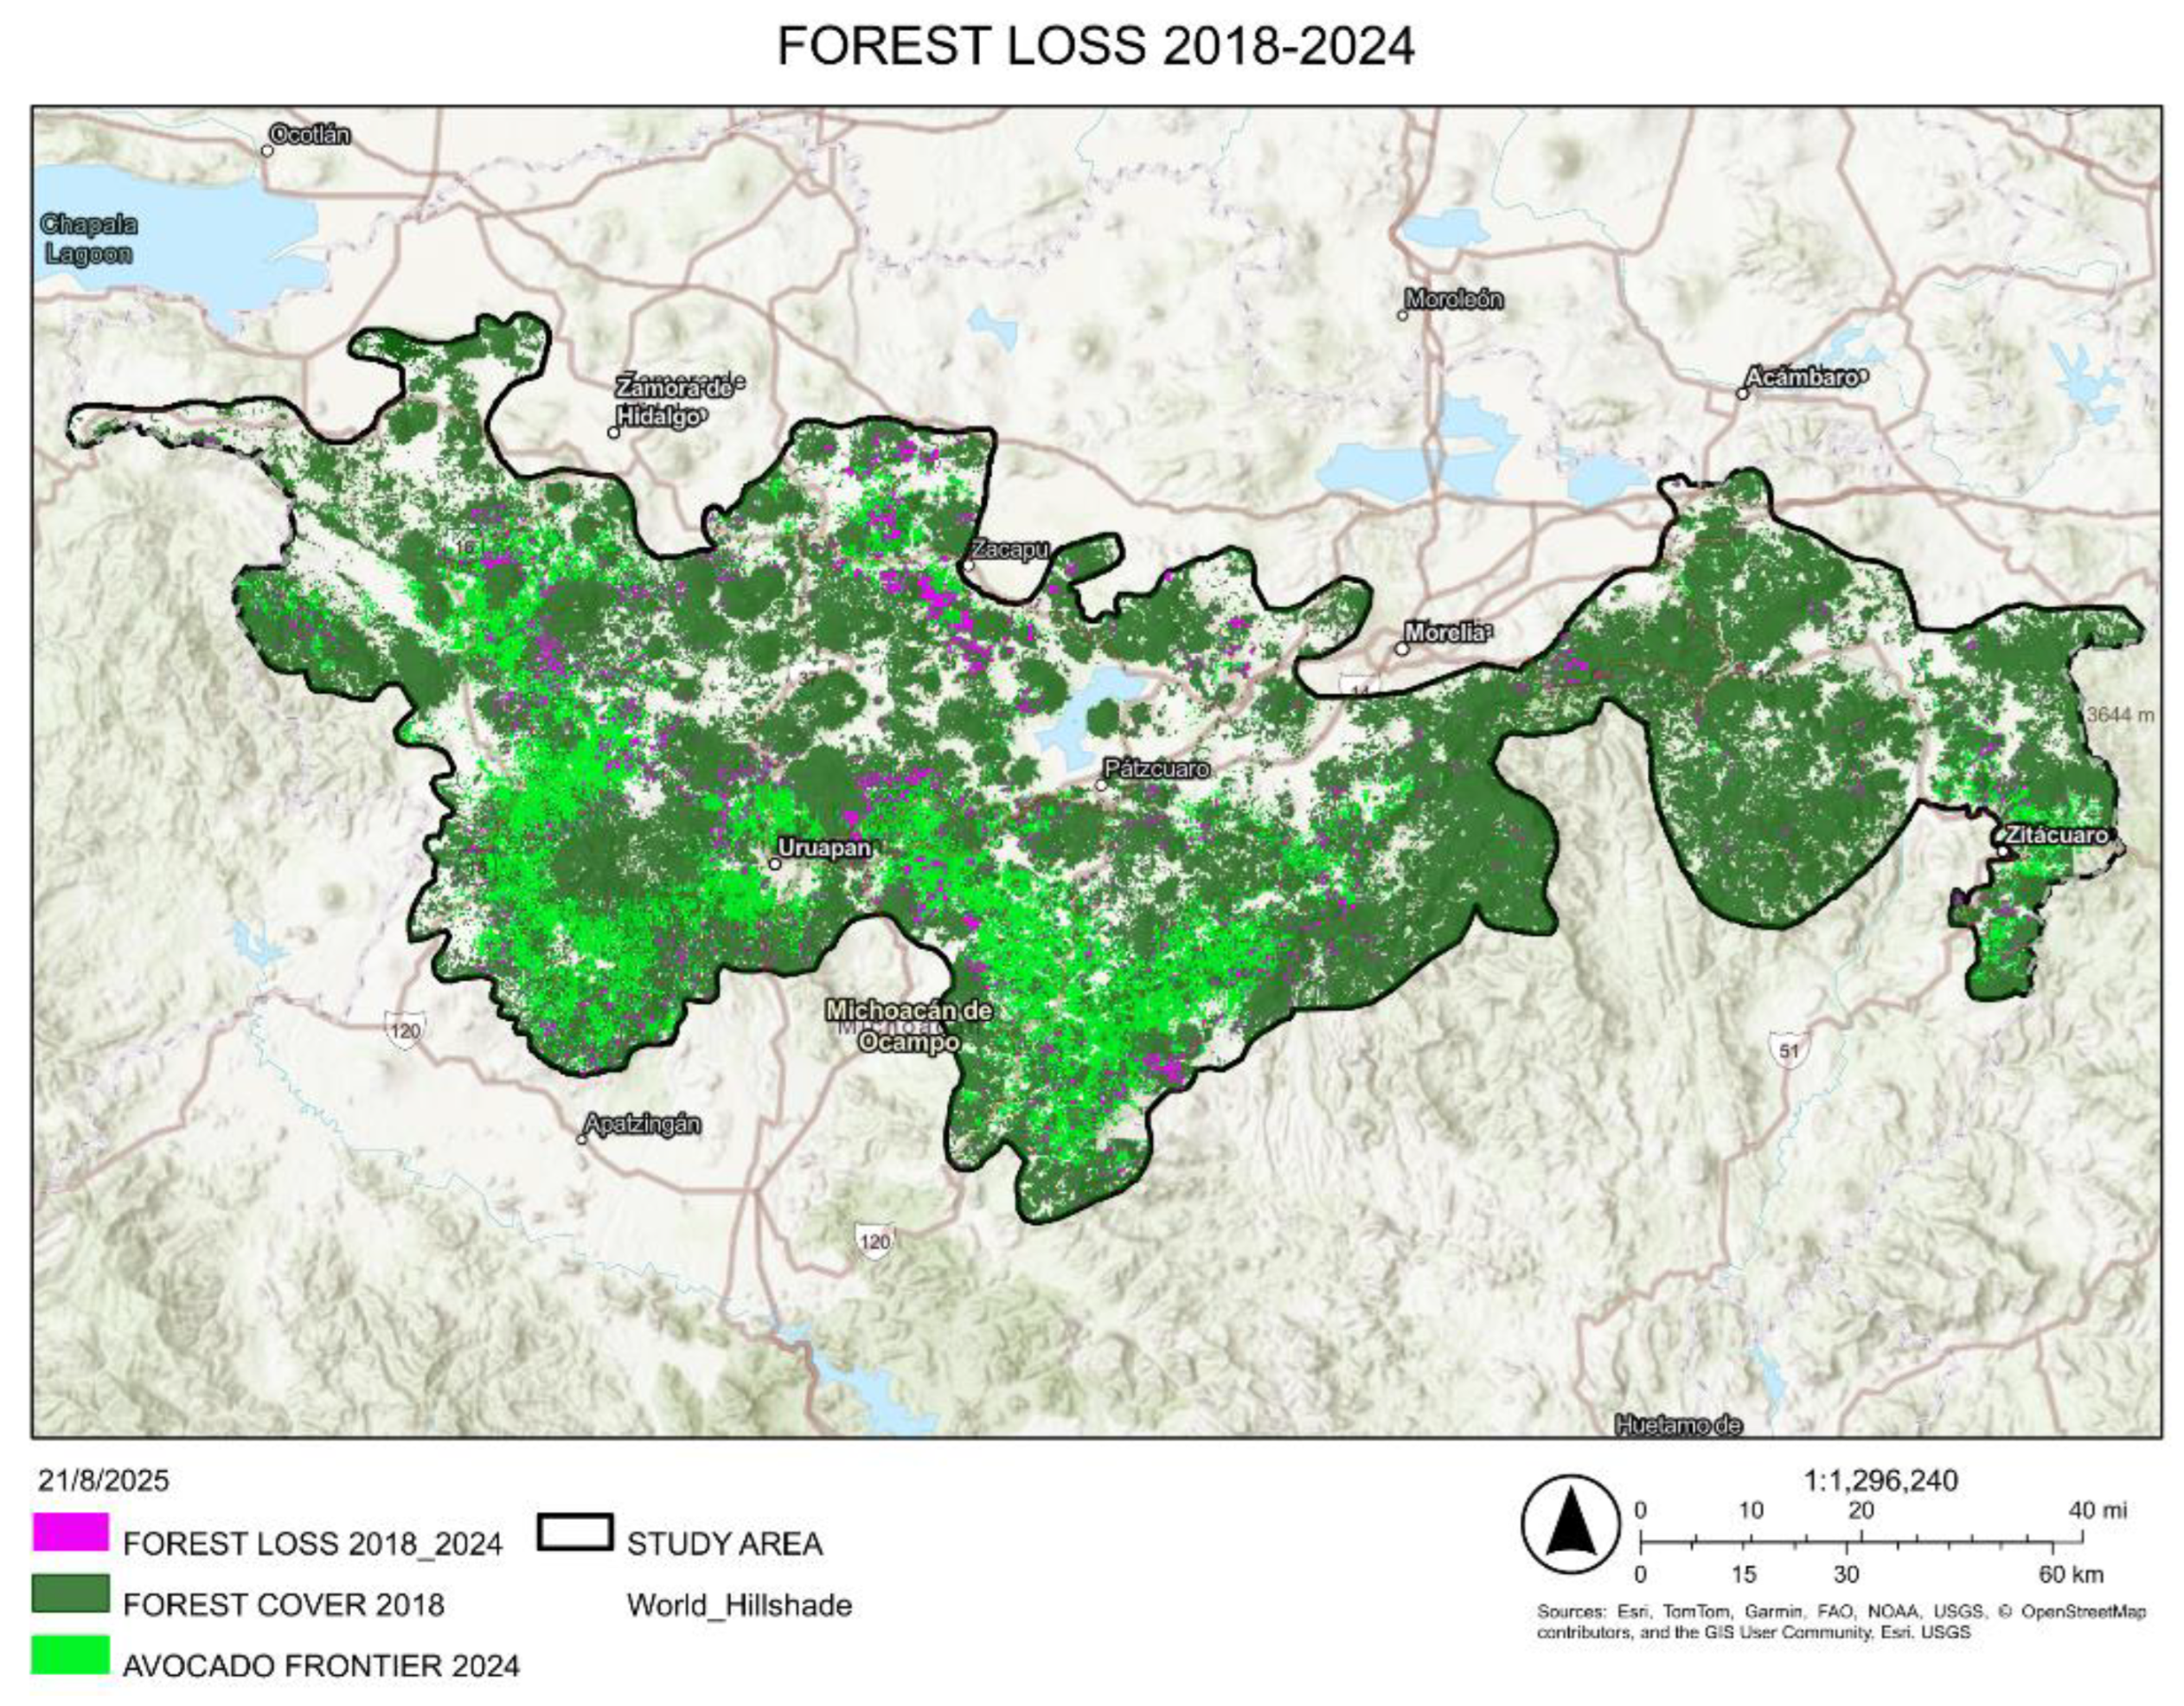
Figure 18.
Forest cover loss due to avocado replacement, 1974–2024.The chart illustrates the temporal trend of deforestation linked to avocado expansion, showing a linear increase during the first three periods, a brief decline around 2011, and a gradual resurgence by 2024.
Figure 18.
Forest cover loss due to avocado replacement, 1974–2024.The chart illustrates the temporal trend of deforestation linked to avocado expansion, showing a linear increase during the first three periods, a brief decline around 2011, and a gradual resurgence by 2024.
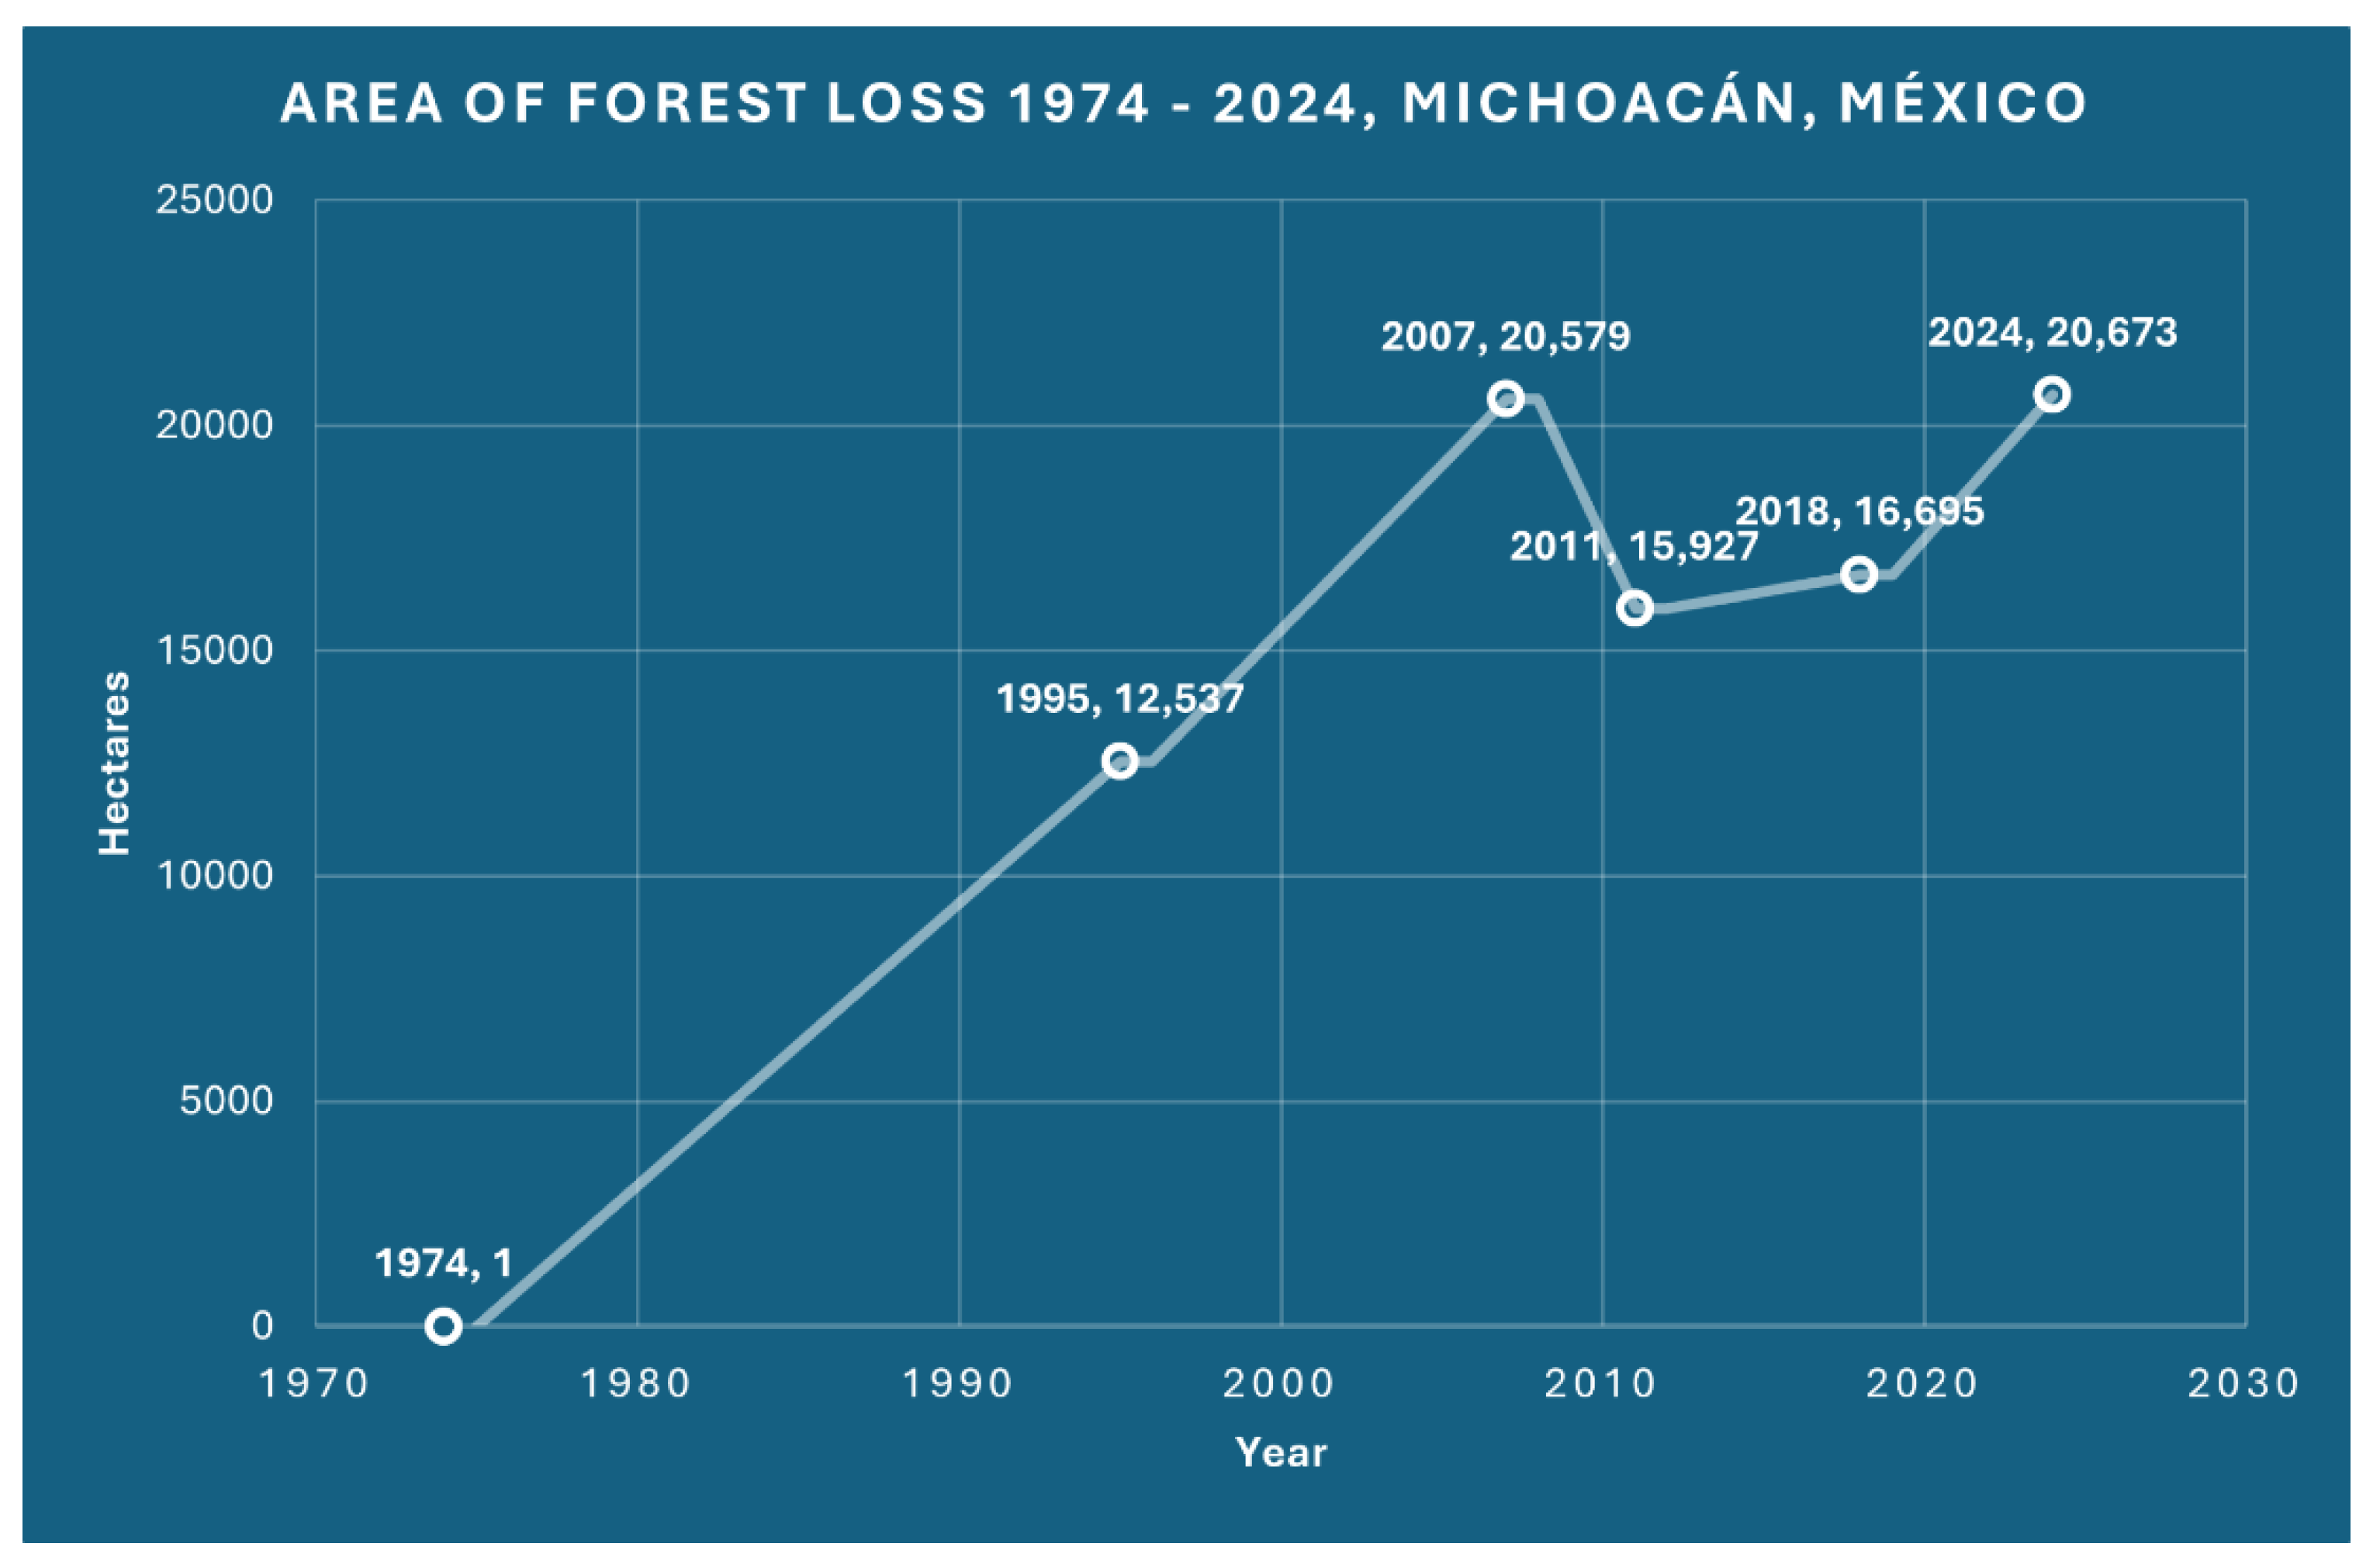
Figure 19.
Rate of forest cover loss due to avocado expansion, 1974–2024, Michoacán, México. The chart illustrates the acceleration of annual forest loss rates over five decades, highlighting a near-exponential trend despite temporary reductions in absolute forest loss around 2011.
Figure 19.
Rate of forest cover loss due to avocado expansion, 1974–2024, Michoacán, México. The chart illustrates the acceleration of annual forest loss rates over five decades, highlighting a near-exponential trend despite temporary reductions in absolute forest loss around 2011.
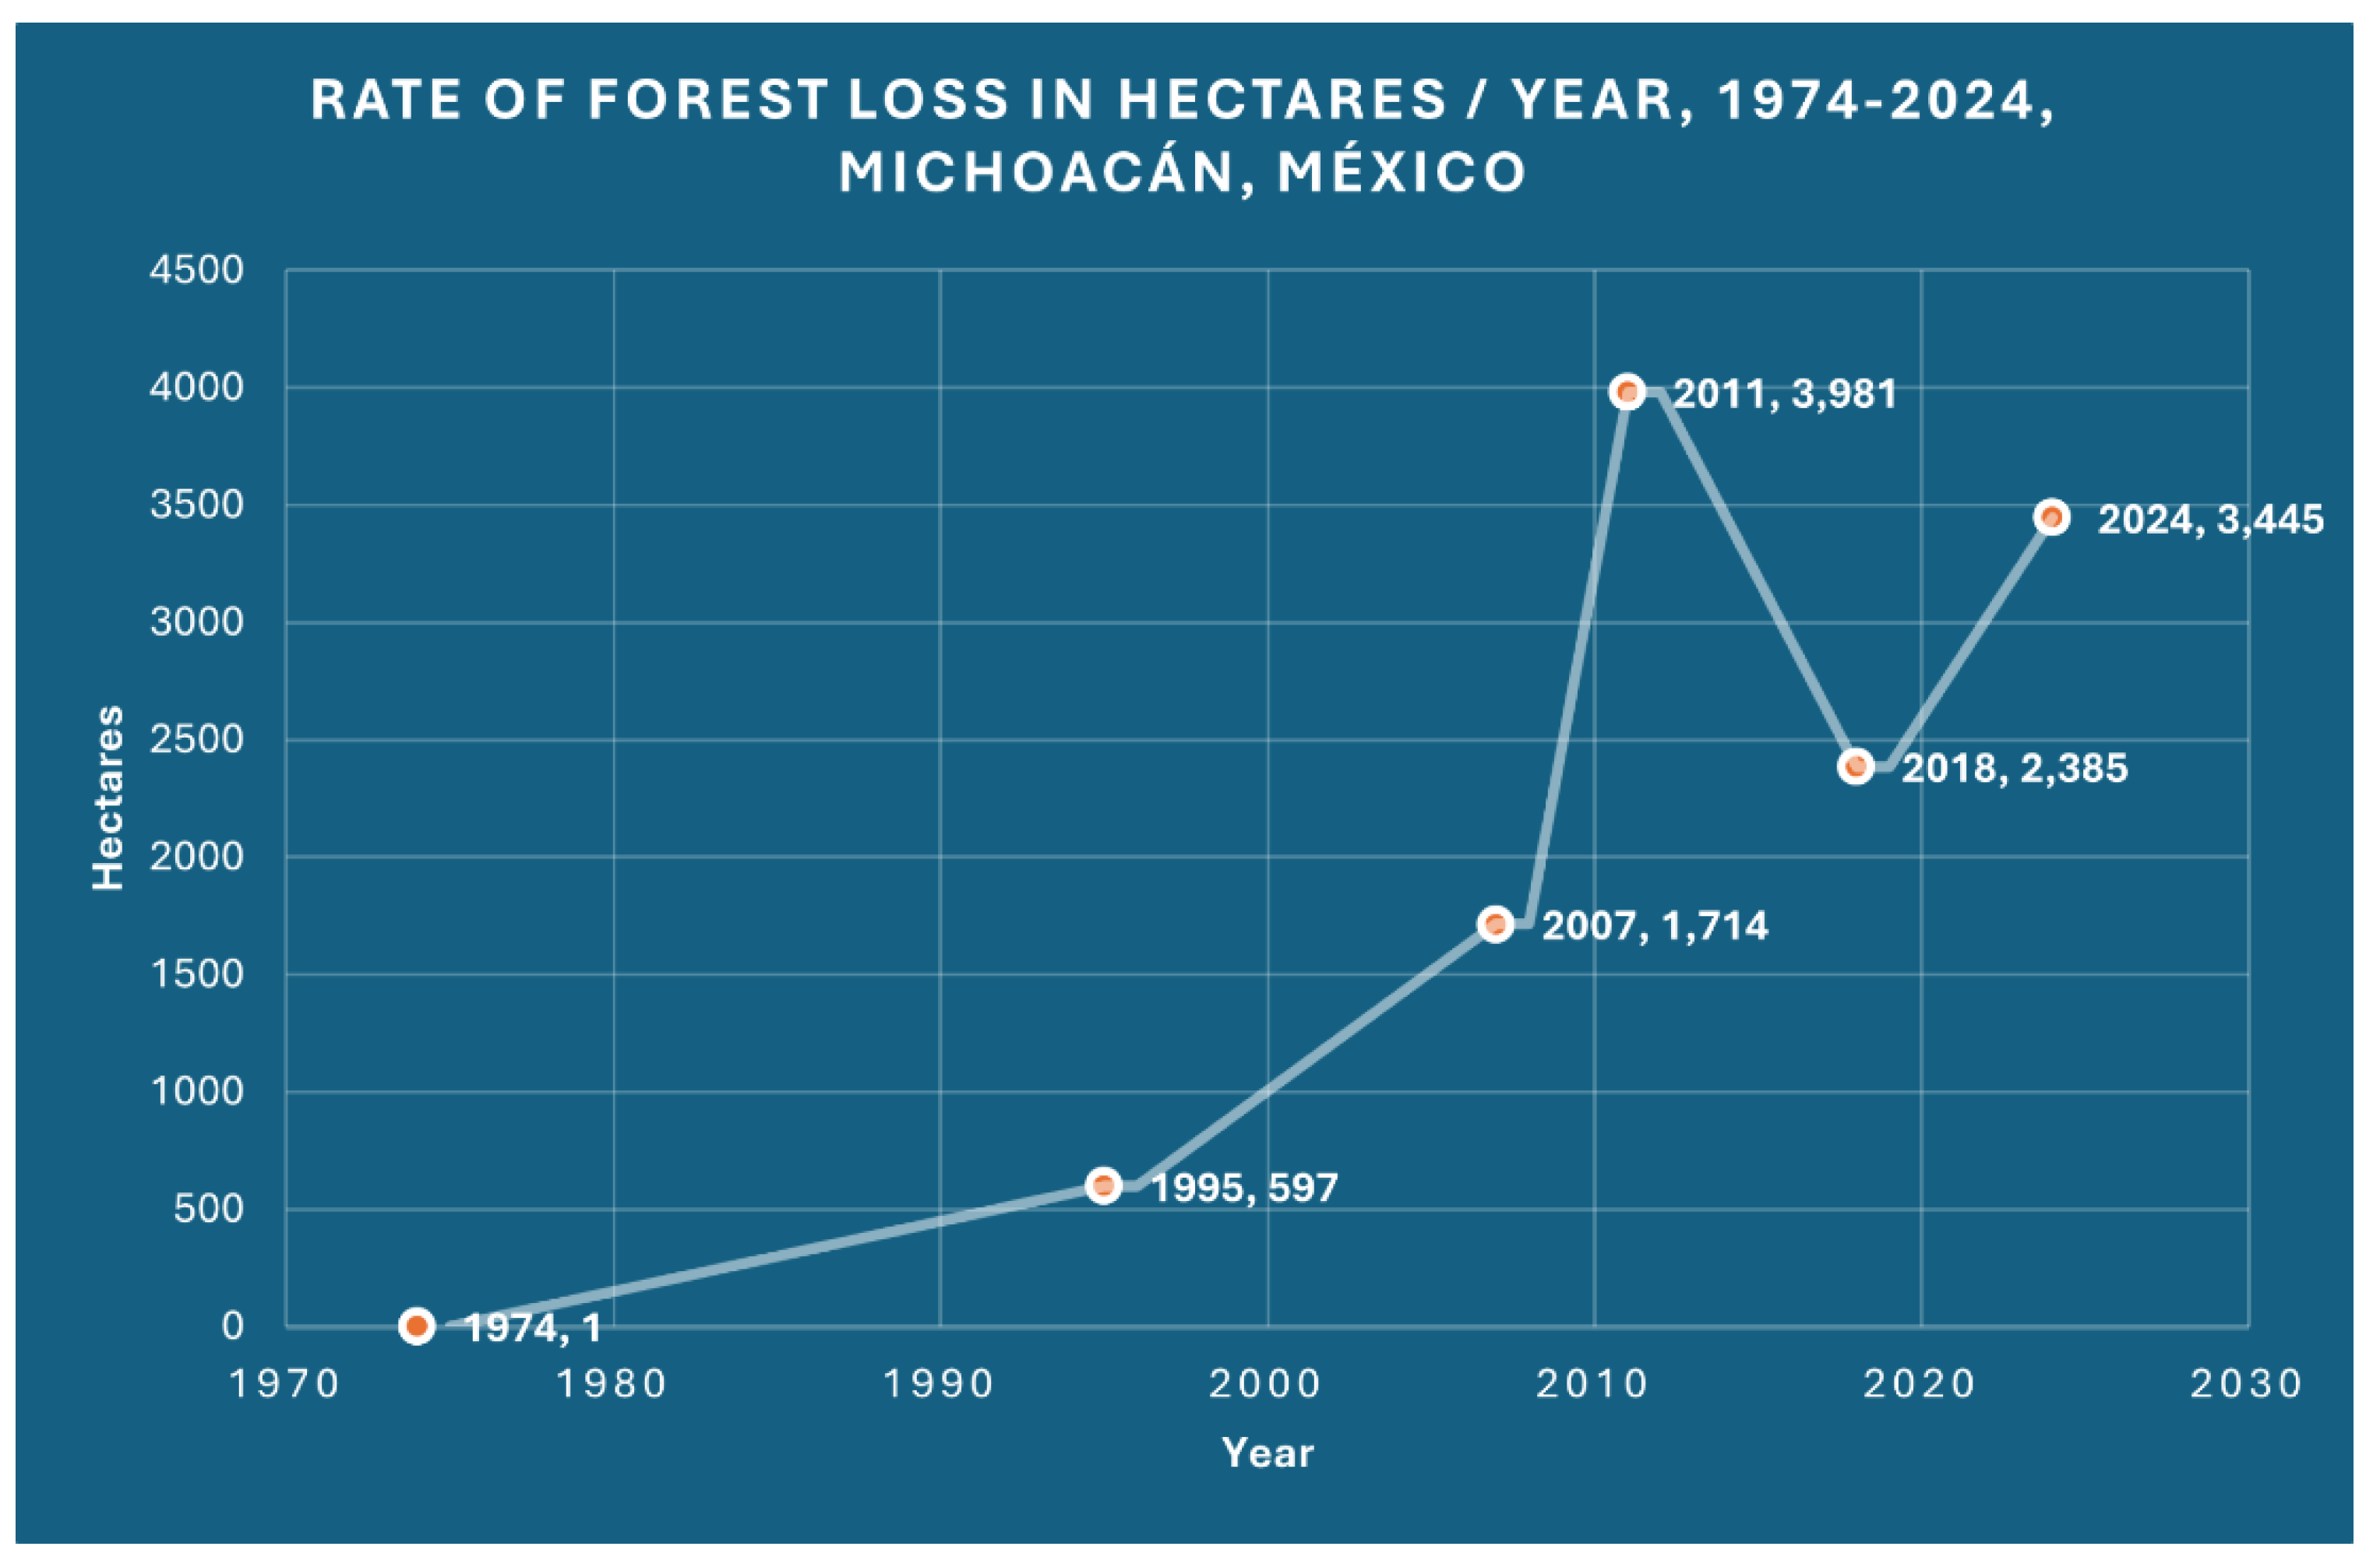
Figure 20.
Volume and value of avocado exports, 2013-2023. Source: [2] with data of UN Comtrade.
Figure 20.
Volume and value of avocado exports, 2013-2023. Source: [2] with data of UN Comtrade.
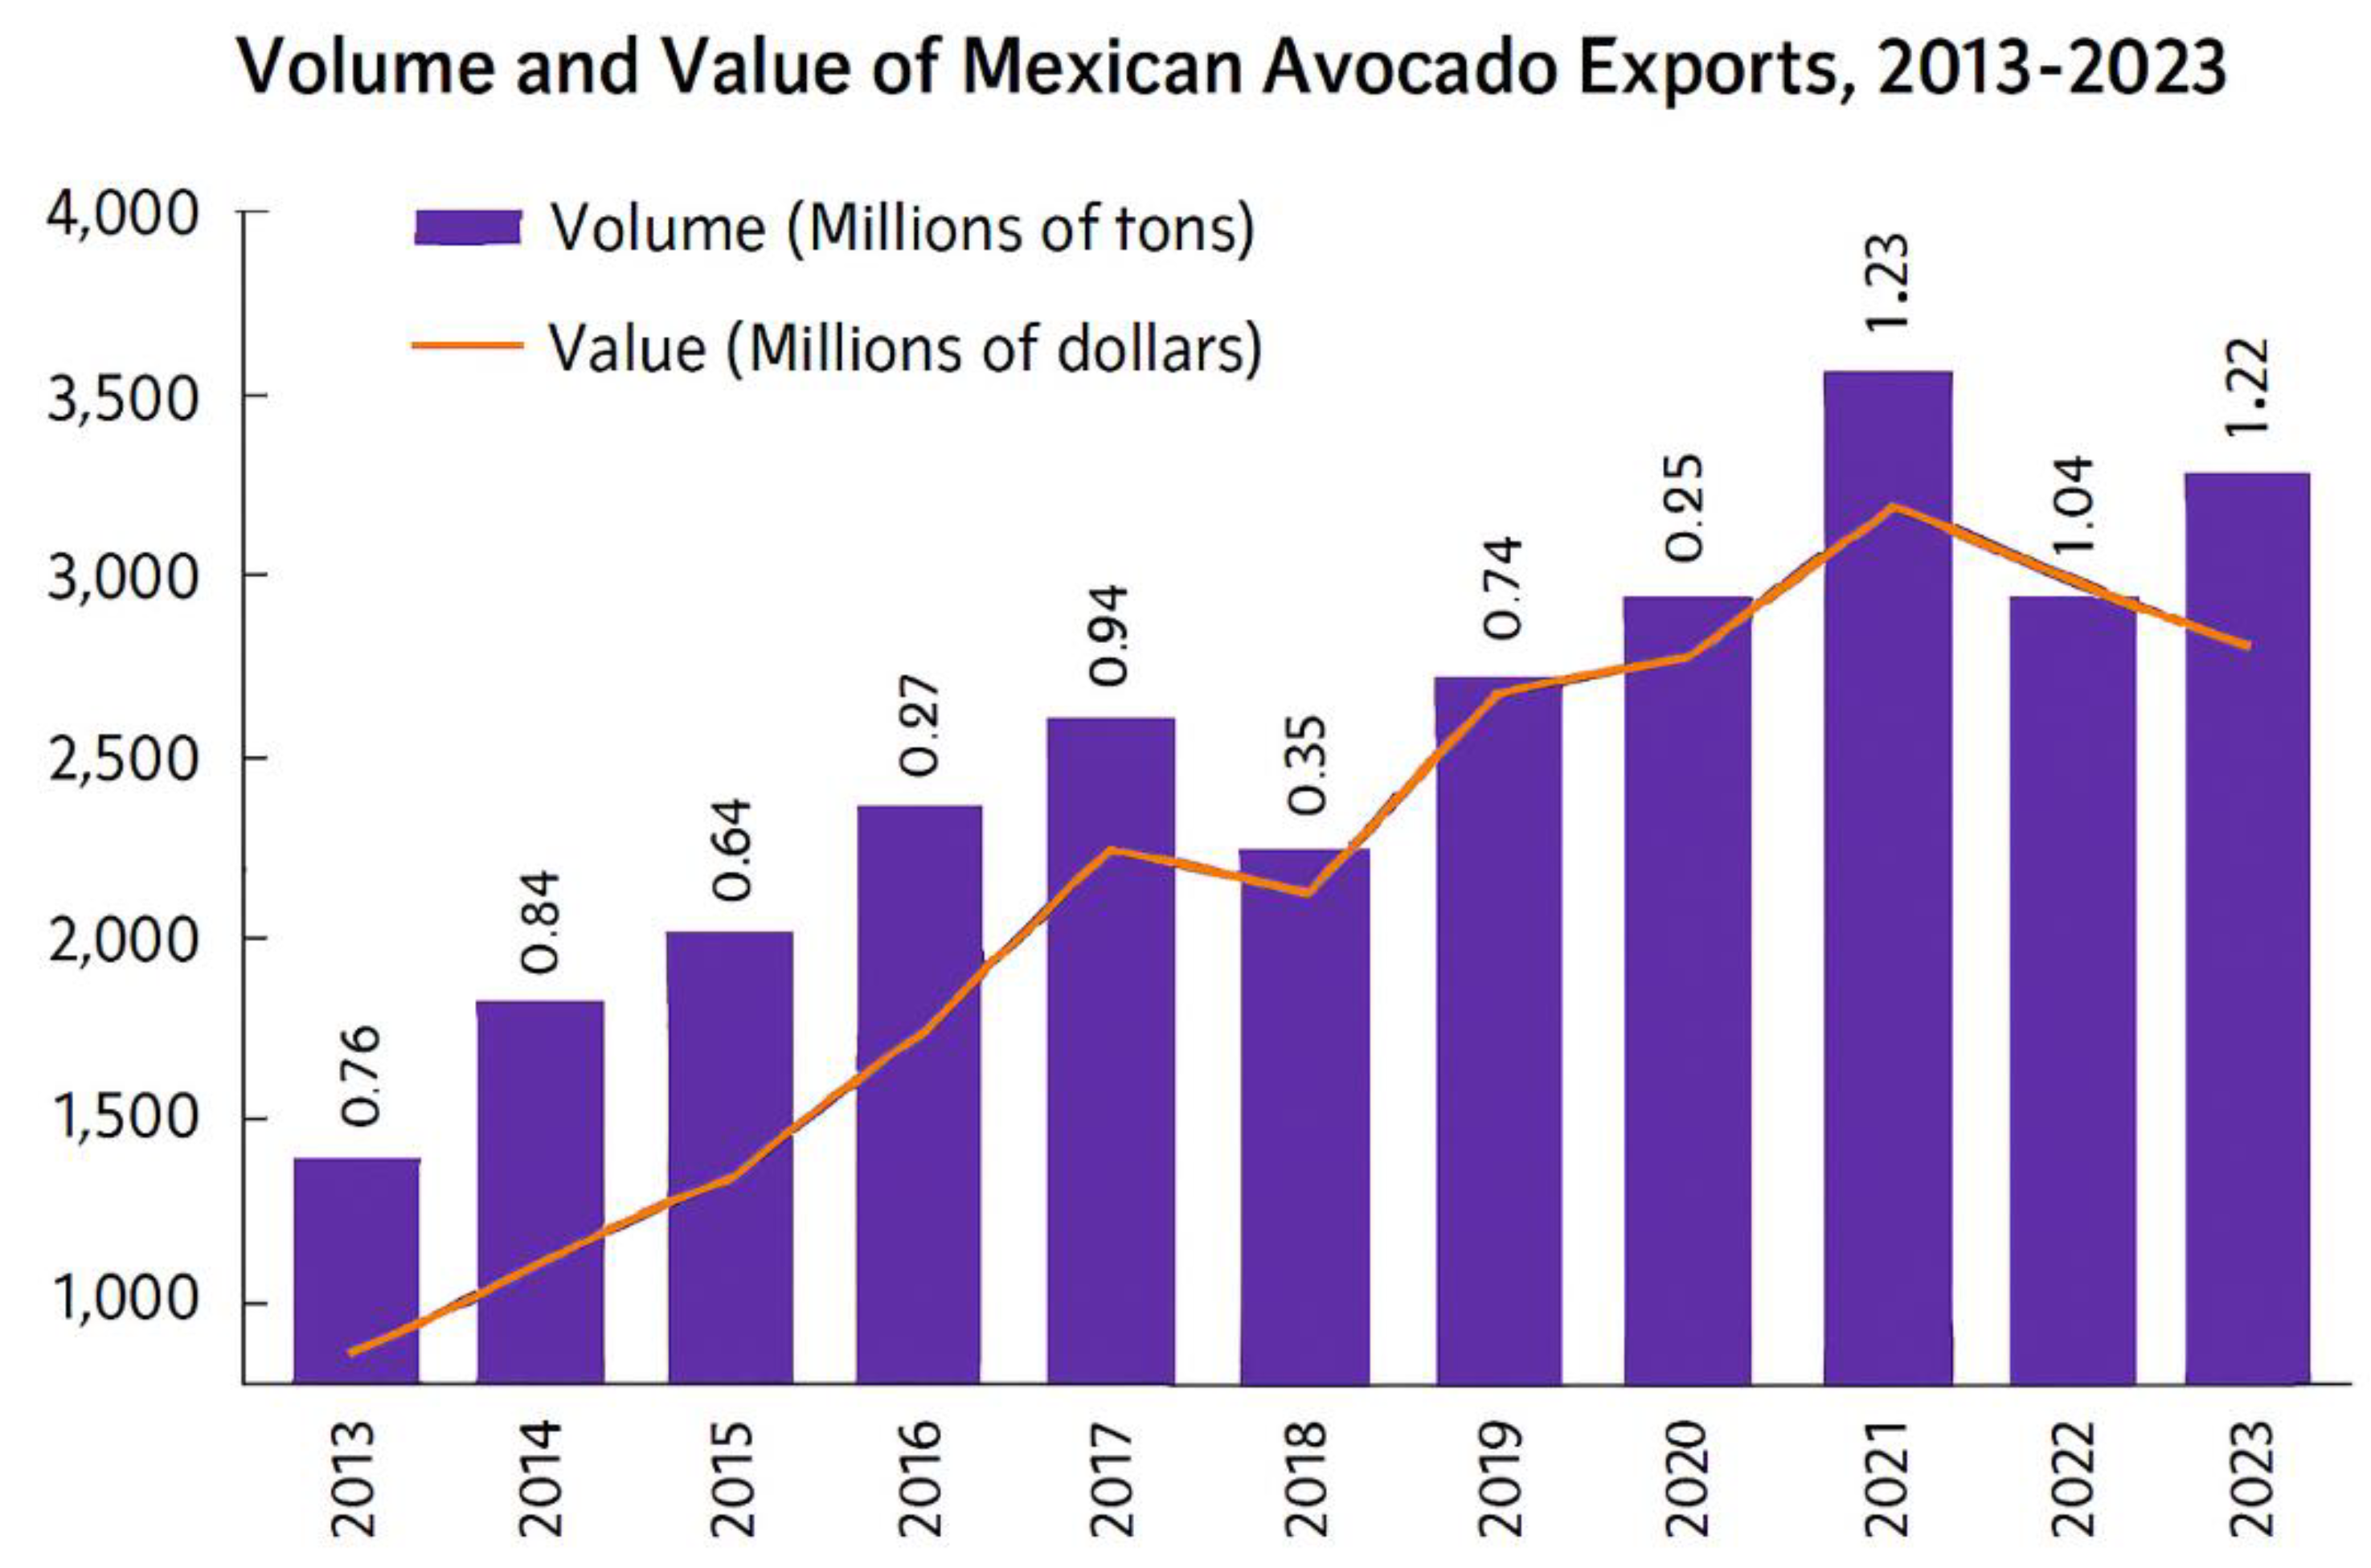
Figure 21.
Fragment size impact on forest cover map, 2024. The map can be interactively explored at https://ciga-unam.maps.arcgis.com/apps/instant/basic/index.html?appid=f245299b4d9045e08292c27e5a9cd6fc.
Figure 21.
Fragment size impact on forest cover map, 2024. The map can be interactively explored at https://ciga-unam.maps.arcgis.com/apps/instant/basic/index.html?appid=f245299b4d9045e08292c27e5a9cd6fc.
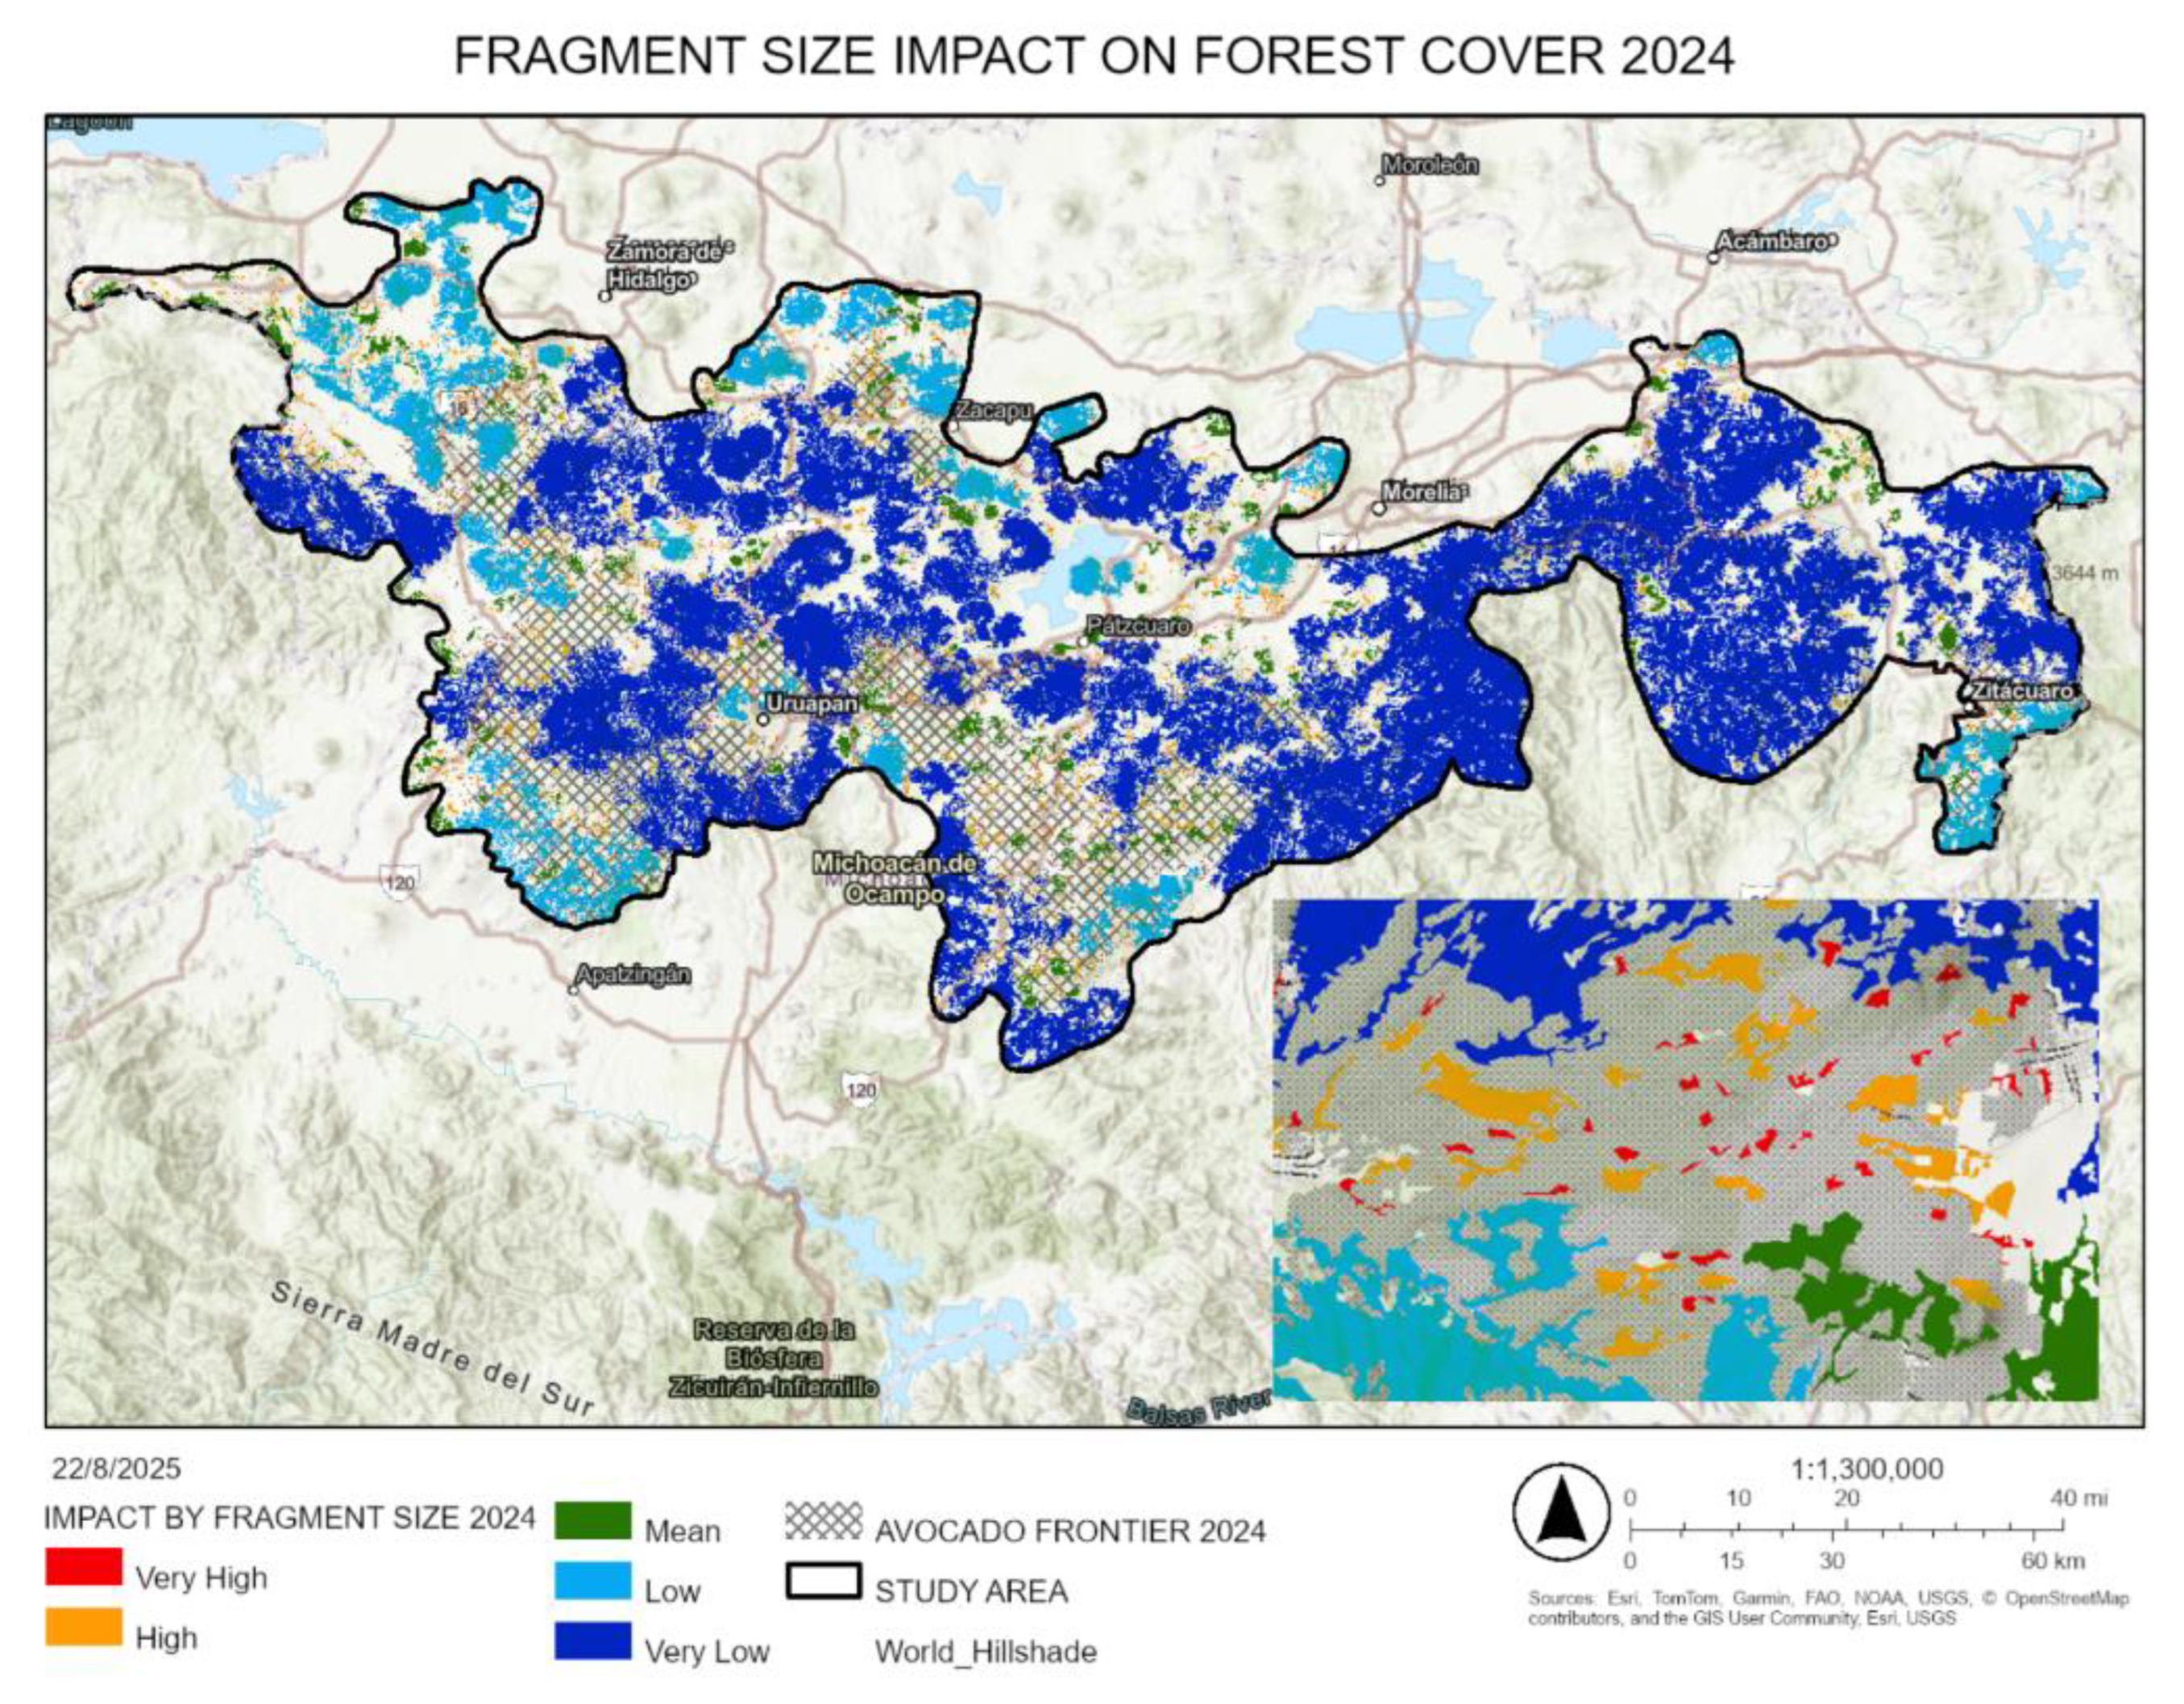
Figure 22.
Fragment distance impact on forest cover map, 2024. The map can be interactively explored at https://ciga-unam.maps.arcgis.com/apps/instant/basic/index.html?appid=35abe3cb18cd4c379b20a1957fae9aa1.
Figure 22.
Fragment distance impact on forest cover map, 2024. The map can be interactively explored at https://ciga-unam.maps.arcgis.com/apps/instant/basic/index.html?appid=35abe3cb18cd4c379b20a1957fae9aa1.
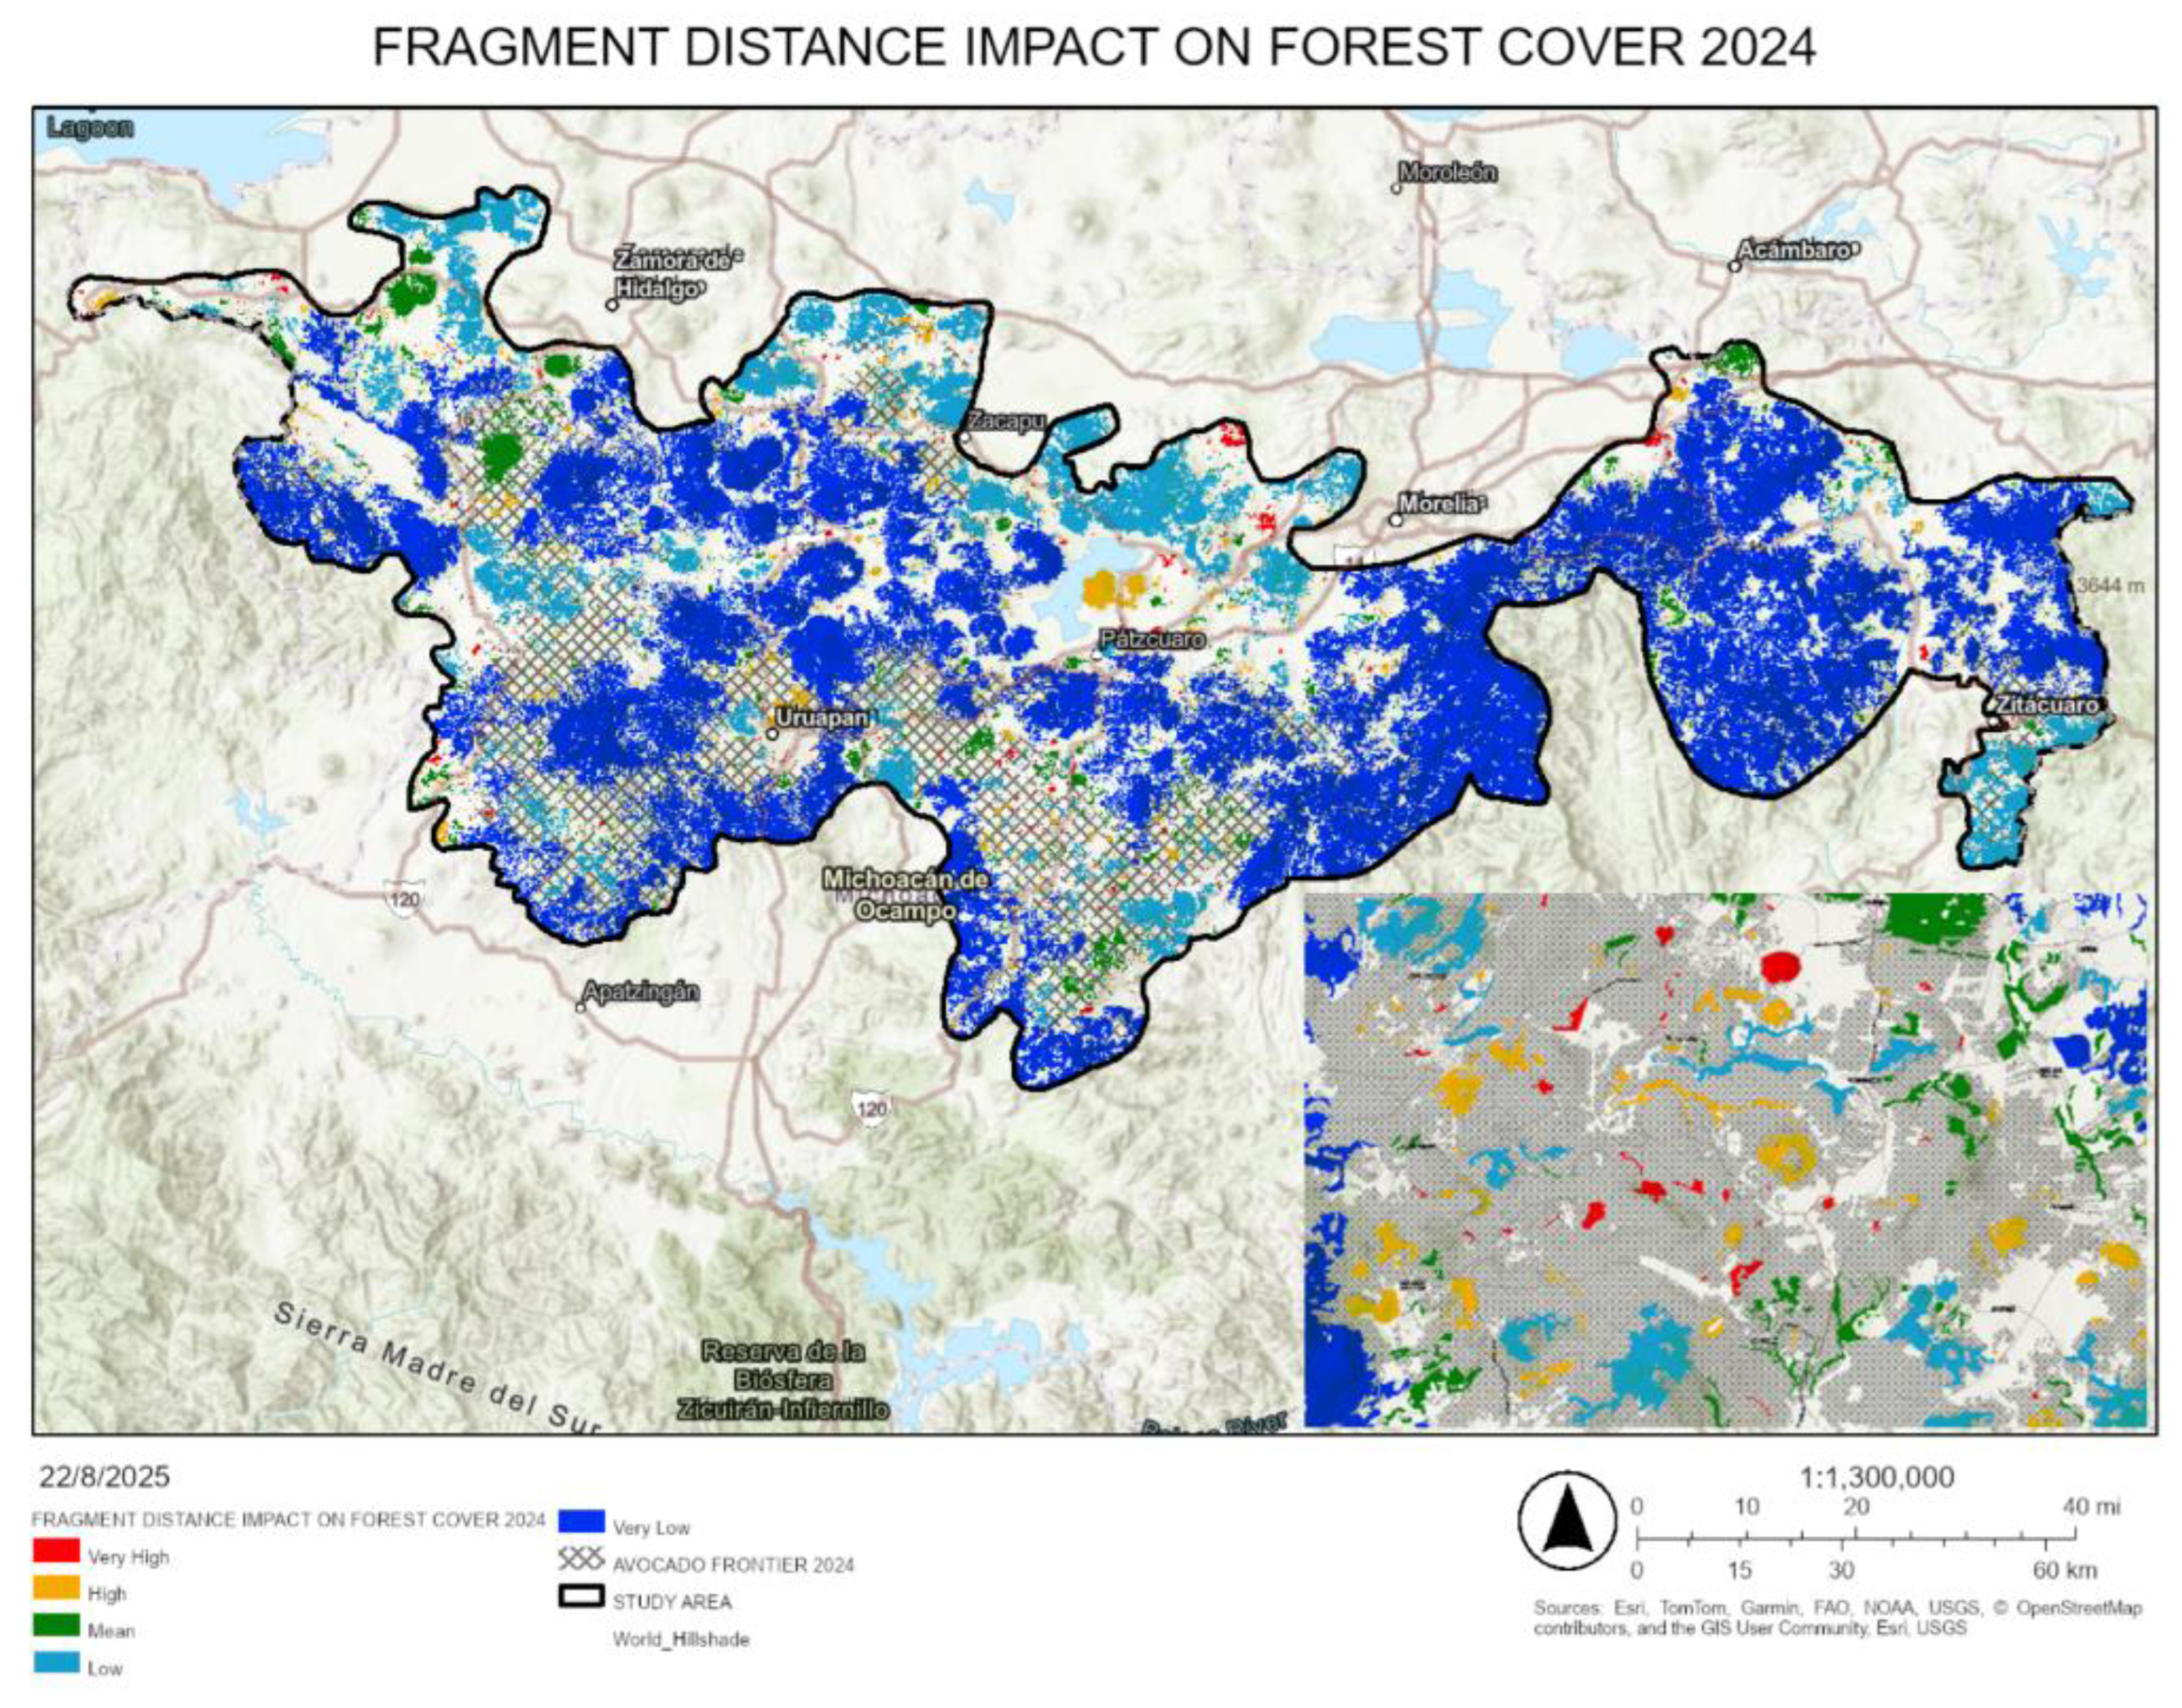
Figure 23.
Fragmentation impact on forest cover map, 2024. The map can be interactively explored at https://ciga-unam.maps.arcgis.com/apps/instant/basic/index.html?appid=2f5a963ed48941e5b8e61d232c647850.
Figure 23.
Fragmentation impact on forest cover map, 2024. The map can be interactively explored at https://ciga-unam.maps.arcgis.com/apps/instant/basic/index.html?appid=2f5a963ed48941e5b8e61d232c647850.
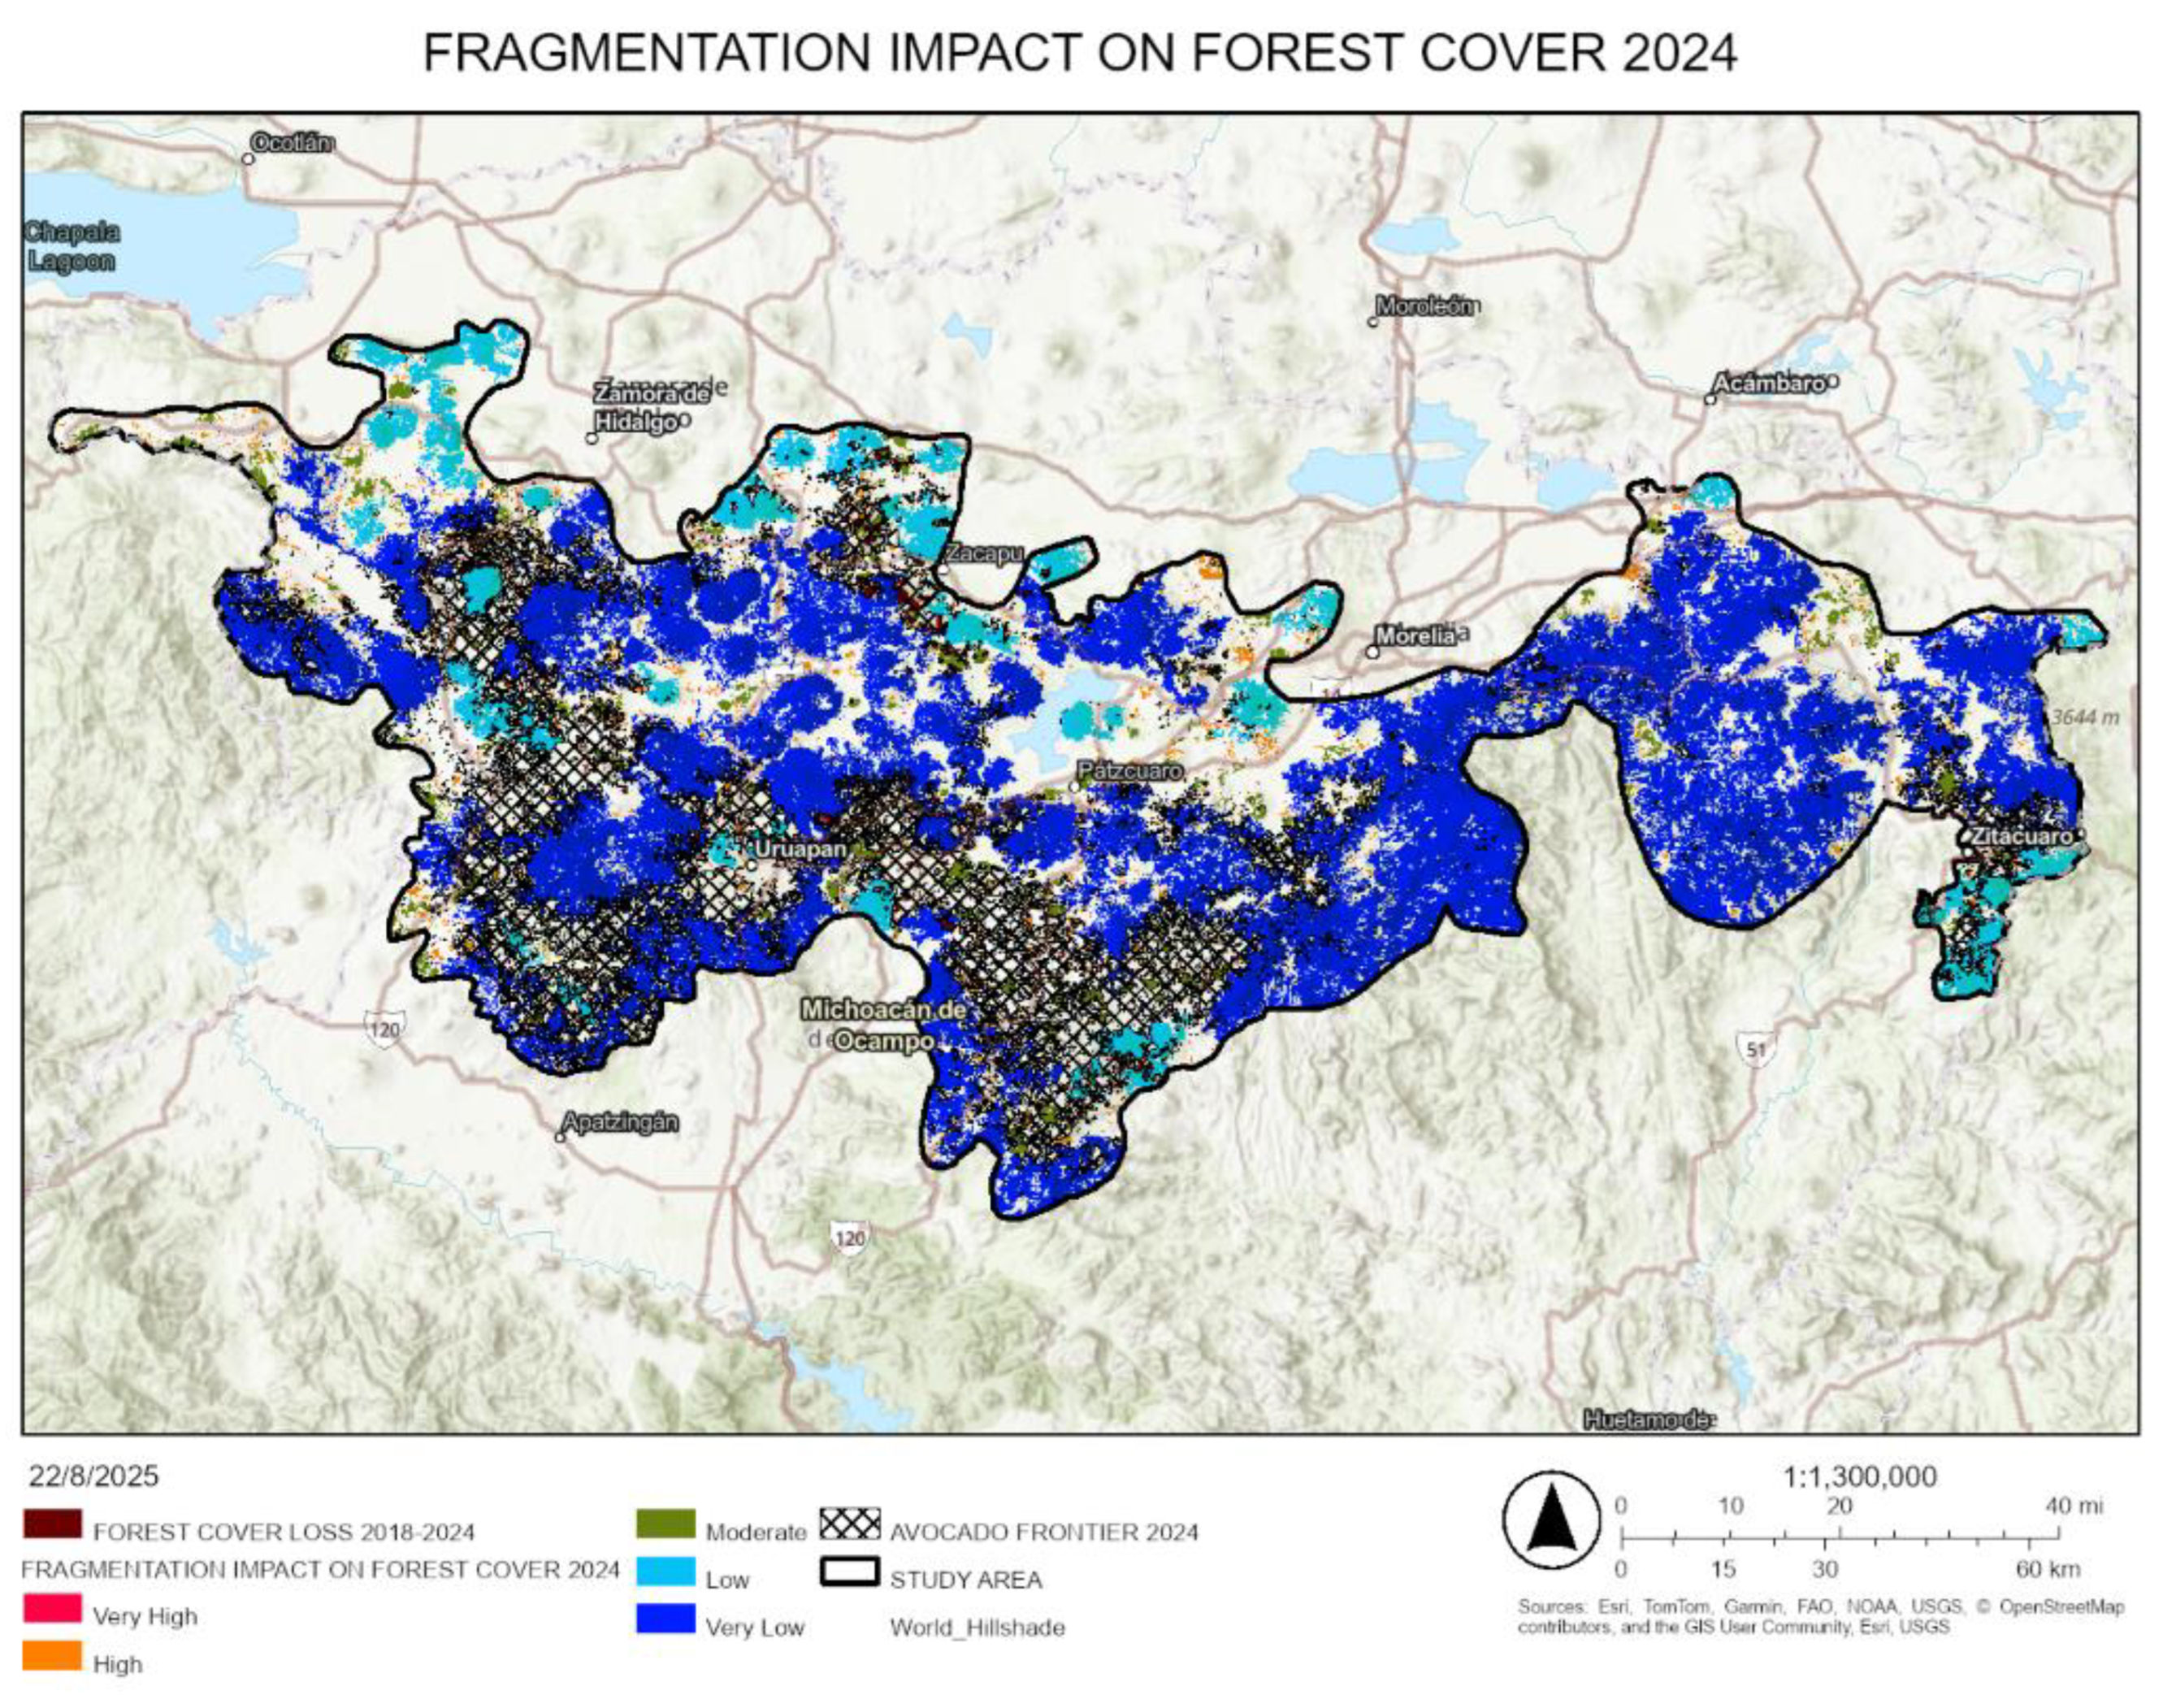
Figure 24.
Fragmentation impact on forest cover map, 2024 (detail).
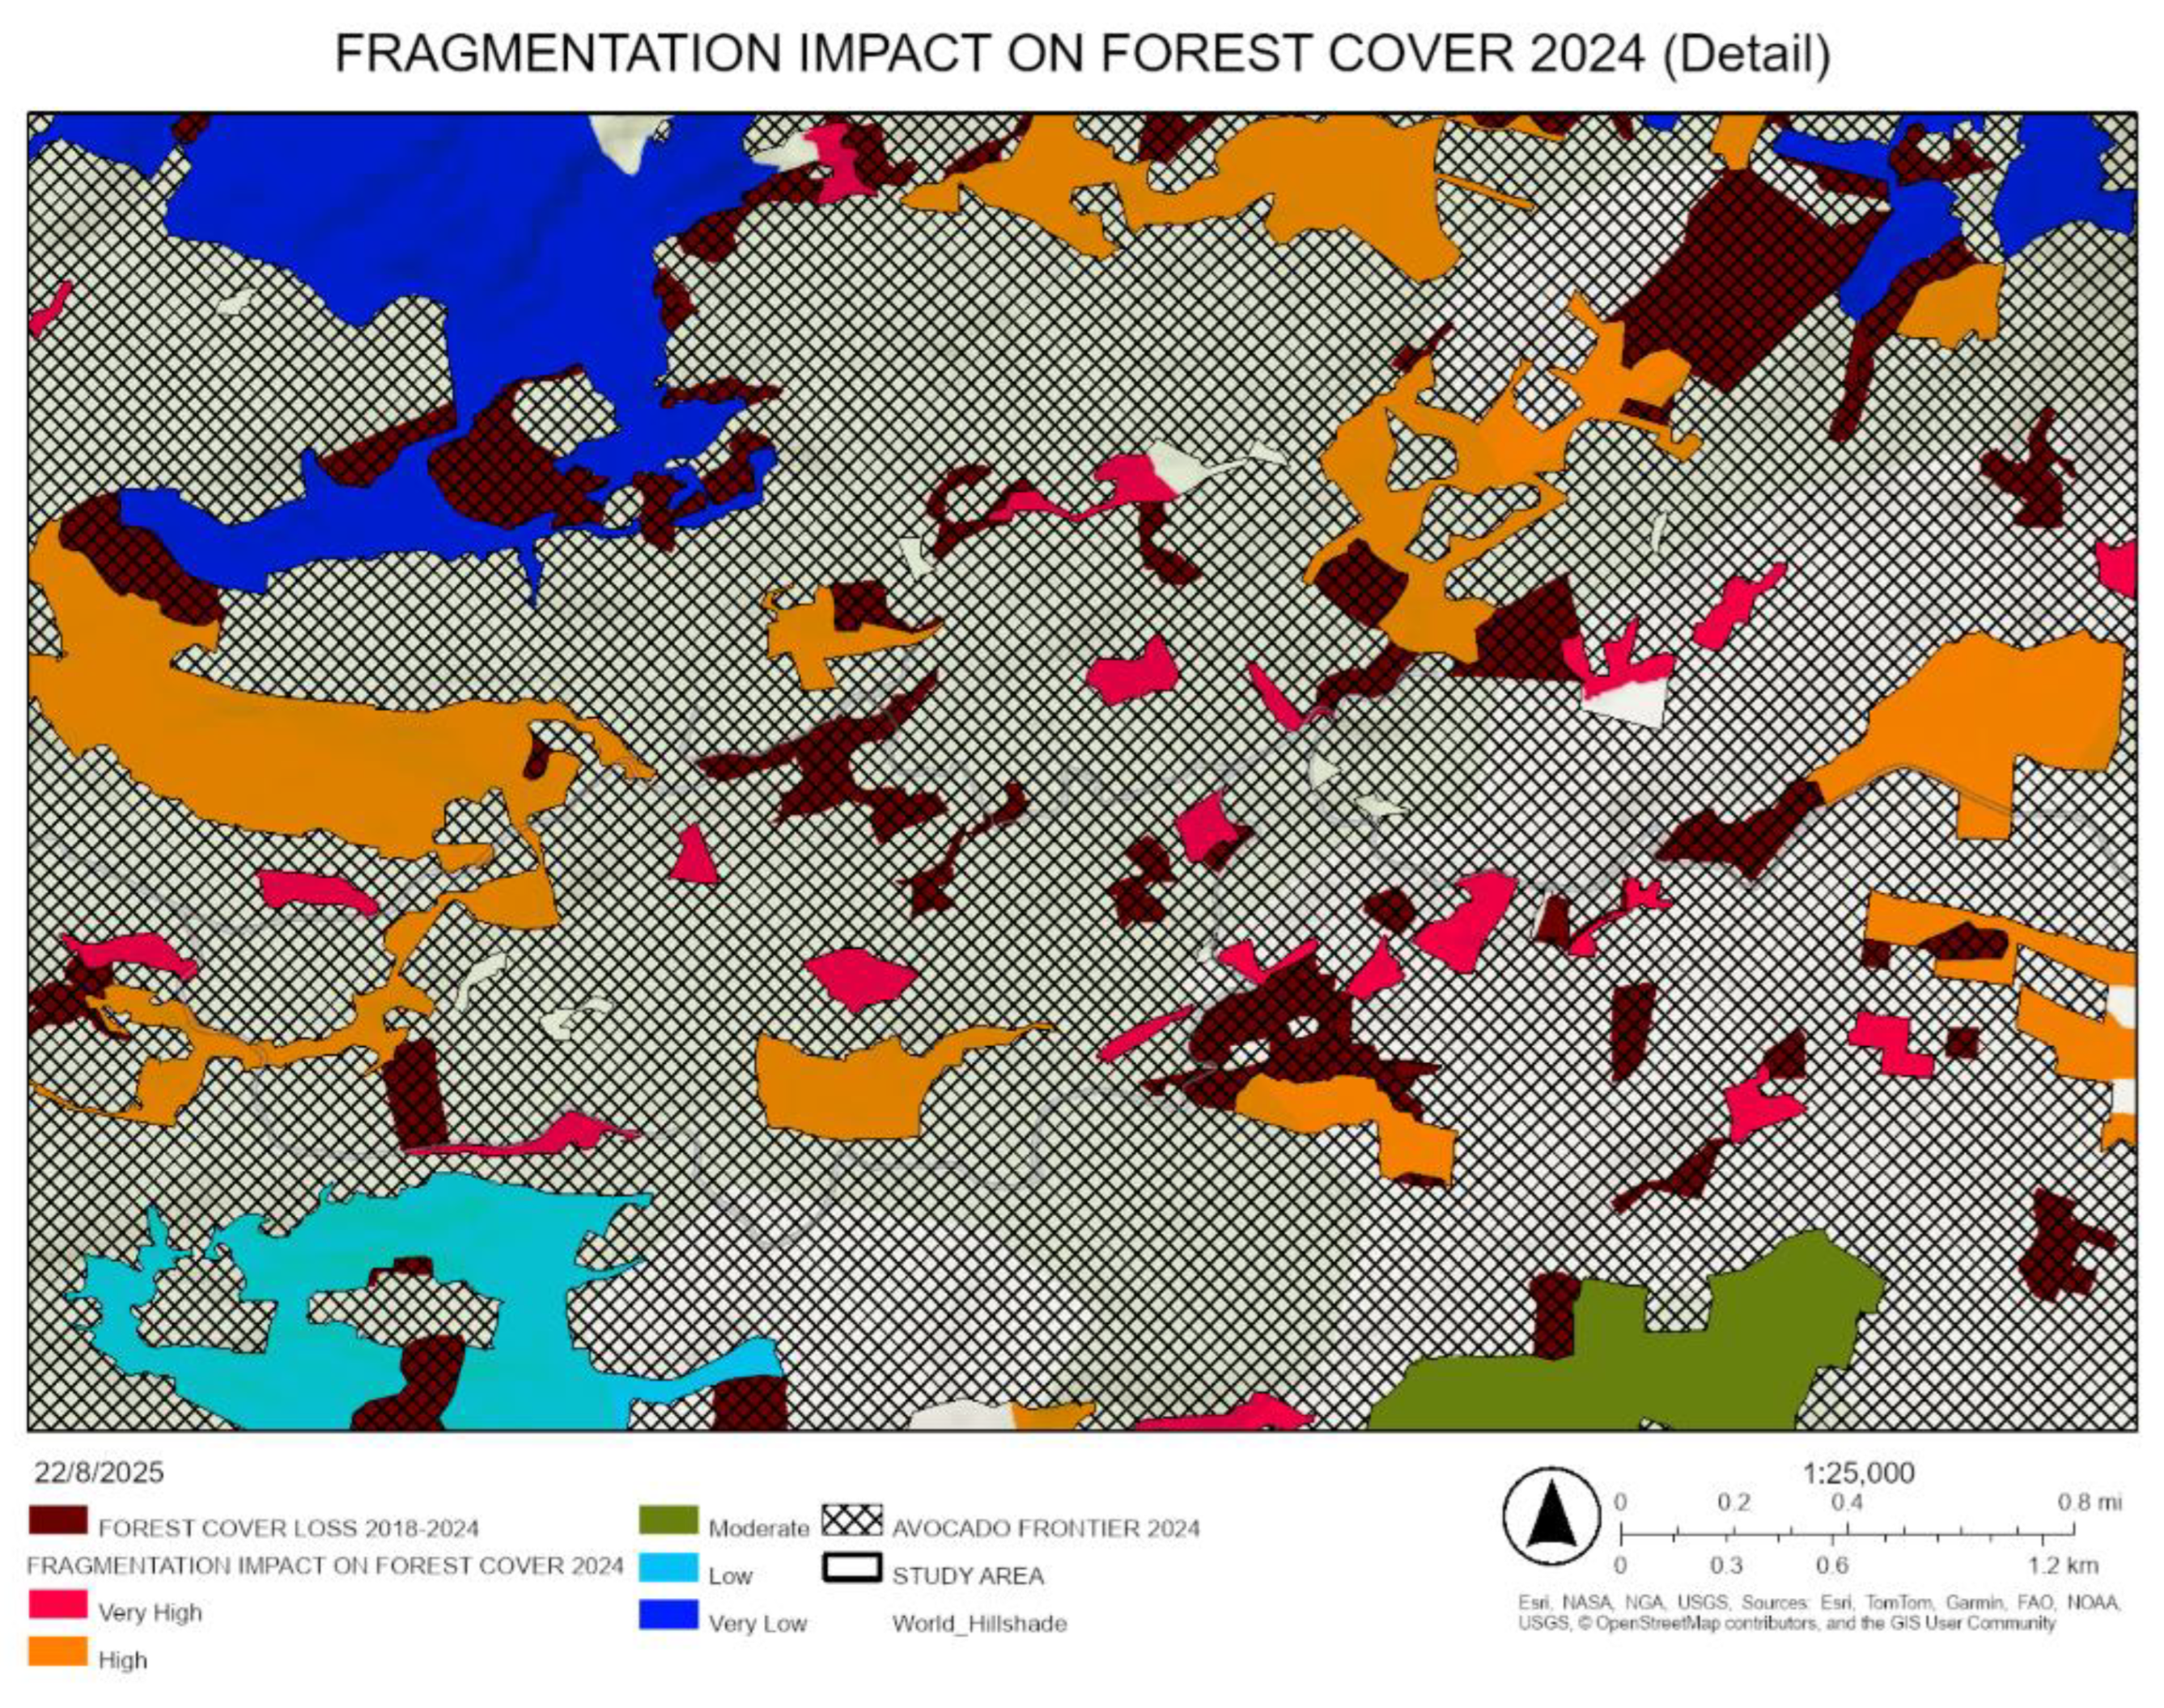

Table 1.
Forest loss-to-avocado rates for the period 1974–2024, Michoacán, México.
| Year | Area of forest cover replaced with avocado (ha) | Annual rate of forest cover loss (ha / year) |
| 1974 | Baseline | Baseline |
| 1995 | 12,537 | 597 |
| 2007 | 20,579 | 1,714 |
| 2011 | 15,927 | 3,981 |
| 2018* | 16,695* | 2,385* |
| 2024 | 20,673 | 3,445 |
*Inferred.
Table 2.
Fragment size and impact levels classification.
| Area of fragment in hectares | Size class | Impact level | |
| >= 20,000 | Very Large | Very Low | 1 |
| 1,000 < 20,000 | Large | Low | 2 |
| 100 < 1,000 | Medium | Moderate | 3 |
| 5 < 100 | Small | High | 4 |
| 1 < 5 | Very Small | Very High | 5 |
Table 3.
Fragment distance and impact levels classification.
| Distance to fragment in meters | Distance class | Impact level | |
| >= 225 | Very Large | Very High | 5 |
| 100 < 225 | Large | High | 4 |
| 25 < 100 | Medium | Moderate | 3 |
| 10 < 25 | Small | Low | 2 |
| 1 < 10 | Very Small | Very Low | 1 |
Table 4.
Forest cover fragmentation impact levels.
| SIZE IMPACT LEVEL | 5 | 4 | 4 | 5 | 5 | 5 |
| 4 | 4 | 4 | 4 | 4 | 4 | |
| 3 | 3 | 3 | 3 | 3 | 4 | |
| 2 | 1 | 2 | 2 | 2 | 3 | |
| 1 | 1 | 1 | 2 | 2 | 2 | |
| 1 | 2 | 3 | 4 | 5 | ||
| DISTANCE IMPACT LEVEL | ||||||
Table 5.
Guiding Principles for Sustainable Avocado Development.
| Guiding Principle | Planning Focus | Triple E Alignment | Sustainability Pillar | Contribution to Sustainability |
| Success | Achieving viable avocado production outcomes | Efficacy | Economic | Ensures that avocado cultivation meets production goals and market demands without compromising long-term viability. |
| Optimization | Using resources wisely and minimizing waste | Efficiency | Environmental | Promotes responsible use of land, water, and inputs, reducing ecological footprint and enhancing resilience. |
| Balance | Fair distribution of benefits and burdens | Equity | Social | Encourages inclusive decision-making, protects community rights, and fosters shared responsibility. |
Disclaimer/Publisher’s Note: The statements, opinions and data contained in all publications are solely those of the individual author(s) and contributor(s) and not of MDPI and/or the editor(s). MDPI and/or the editor(s) disclaim responsibility for any injury to people or property resulting from any ideas, methods, instructions or products referred to in the content. |
© 2026 by the authors. Licensee MDPI, Basel, Switzerland. This article is an open access article distributed under the terms and conditions of the Creative Commons Attribution (CC BY) license (http://creativecommons.org/licenses/by/4.0/).
Copyright: This open access article is published under a Creative Commons CC BY 4.0 license, which permit the free download, distribution, and reuse, provided that the author and preprint are cited in any reuse.