

Submitted:
04 June 2026
Posted:
08 June 2026
You are already at the latest version
Abstract
Hepatic and splenic flexures are important anatomical landmarks in colonoscopy, supporting segmental orientation, lesion localisation, and bowel preparation assessment. This exploratory study investigated whether liver- and spleen-related shadow patterns visible on the colonic wall could serve as indirect cues for flexure localisation. We developed a preliminary workflow combining colour-based annotation and deep learning semantic segmentation. Representative shadow and mucosal regions were used to extract colour characteristics, while lumen/borders and artefacts were identified using luminance-based criteria. Based on these rules, 500 colonoscopy frames with visible shadows were automatically annotated and used to train a segmentation network for four classes: shadows, intestinal mucosa, lumen/borders, and artefacts. The trained model was then applied frame by frame to colonoscopy videos to generate temporal profiles of the segmented regions. In a representative test video, shadow clusters appeared near expert-indicated flexure regions after empirical filtering of frames not matching several criteria. These preliminary findings suggest that liver- and spleen-related shadows may provide complementary cues for flexure localisation in selected cases. However, the method remains exploratory and requires validation on larger, independently annotated datasets.
Keywords:
colonoscopy
; hepatic flexure
; splenic flexure
; semantic segmentation
; deep learning
1. Introduction
In the attempt to address colorectal cancer (CRC)-related healthcare challenges, automatic assessment of colonoscopy videos may assist endoscopists both in polyp detection and in colonoscopy quality evaluation, data retrieval, and follow-up. During colonoscopy, several anatomical landmarks are important for lesion localisation, spatial and temporal orientation of the scope, diagnosis, treatment planning, and standardised reporting [1]. The hepatic and splenic flexures are among the most difficult to identify consistently. Observing shadow-like impressions of the liver and spleen on the intestinal mucosa may help endoscopists recognise the two flexures of the colon, which divide it into three main segments: ascending, transverse, and descending colon.
Among the few recent papers dealing with automatic detection of anatomical landmarks, including the hepatic and splenic flexures, none has specifically used colour characteristics of liver- and spleen-related shadows in the manner proposed in this study.
Ye et al. (2024) [2] proposed a complex deep learning-based system for detecting three anatomical landmarks: the hepatic flexure, the splenic flexure, and the sigmoid-descending colon junction. The authors used 49 colonoscopies and applied image preprocessing, testing, verification, correction, and retesting, while also taking the temporal axis into account and comparing the results with a ground truth database. Interference frames, such as those containing artefacts, reflected light, or water bubbles, were first rejected. Positive frames containing landmarks and negative frames outside landmark regions were then collected. Using this dataset, the authors trained a ResNet-101-based network to identify frames containing one of the three types of landmarks. In a post-processing step applied to the intermediate results, temporal correlation was used to reassign landmark frames to the correct class according to their expected temporal order. The system showed very good performance in differentiating landmark from normal frames, with an average accuracy of 99.75%, and demonstrated a high degree of similarity between predicted landmark periods and the ground truth. This approach may help estimate the relative distance between lesion areas and anatomical landmarks.
Deformable anatomical features of the colon are critical for reliable anatomical section identification and recognition during colonoscopy. Kim et al. (2024) [3] used 100 video-colonoscopies and designed a system with three distinct layers: the Appendix Orifice time-coordinated layer, the Flexure Recognition layer, and the Outside of the Body Recognition layer. The authors combined two approaches: density clustering and deep learning, using a modified AlexNet algorithm. Cascaded CNN models were used to sequentially detect the appendix orifice, hepatic and splenic flexures, and the outside-of-the-body category. Combining deep learning predictions with density-based clustering improved temporal localisation of anatomical events. The Density-Based Potential Map was used as a time-series visualisation method after applying density-based spatial clustering to classifier outputs, allowing the authors to cluster high-confidence frames and estimate when anatomical landmarks appeared in the video. The reported average errors for estimating the appearance time of anatomical boundaries were 6.31 s for the appendix orifice, 9.79 s for the hepatic flexure, 27.69 s for the splenic flexure, and 3.26 s for the outside-of-the-body category. This method offers a useful framework for standardised and time-efficient anatomical recognition.
A more recent paper by Song et al. (2025) [4] presented CAS-Colon, a large and detailed video colonoscopy anatomical segmentation dataset, released in August 2025 [5]. It comprises 78 high-resolution colonoscopy videos recorded during the withdrawal phase. Each video was manually annotated with ten distinct anatomical regions and comprehensive accompanying metadata, including the hepatic and splenic flexures. The dataset can be downloaded under a Creative Commons Attribution-NonCommercial-NoDerivatives 4.0 International Licence [5]. The reported results showed that automatically detected segments did not always match the ground truth precisely, and the two flexures were among the less accurately detected regions when using ResNet-50, DenseNet-121, and Inception V3 models trained on the ten intestinal segments. This important dataset represents a major step towards standardised anatomical segmentation in colonoscopy and provides an open basis for further research.
Zhu et al. (2026) [6] presented EndoClean, a fully automated hybrid deep learning framework designed to compute the full-segment Boston Bowel Preparation Scale (BBPS) score from colonoscopy videos in a standardised and objective manner. In this framework, the hepatic and splenic flexures had to be detected because they divide the colon into the three segments used for BBPS scoring. A dataset of more than 27,000 colonoscopy frames was used, each annotated with one of six landmarks: caecum, ascending colon, transverse colon, descending colon, sigmoid colon, and rectum. A ResNet-50-based classifier was trained on this dataset. Because frame-level classifications may contain noise or abrupt transitions, a Hidden Markov Model was used to refine predictions by enforcing temporal continuity and inferring the most likely anatomical segment for each frame. The authors also designed a post-processing algorithm to detect transition time points between colon segments, which are essential for accurate bowel preparation scoring. Using 314 colonoscopies for development and testing, EndoClean achieved performance comparable to senior experts for BBPS assessment.
Some studies have also addressed colonic flexure detection using Computer Tomography images. For example, Wozniak et al. (2023) [7] investigated acute colonic flexures as a basis for developing artificial intelligence tools to predict the course of colonoscopy. However, CT-based approaches rely on grey-level images and involve a fundamentally different interpretation compared with optical colonoscopy images.
In our previous work, Vulpoi et al. (2025) [8] used semantic segmentation for objective colonoscopy quality assessment. In that study, image regions such as intestinal mucosa, residues, lumen, and artefacts were segmented to support a more objective evaluation of colonoscopy videos. Building on this previous approach, the present study explores whether shadow-like patterns related to the liver and spleen can be detected on the intestinal mucosa and whether these patterns may provide complementary cues for hepatic and splenic flexure localisation.
Because grey-blue hepatic impressions and similar splenic impressions can sometimes be observed on the intestinal wall, we explored the possibility of using this visual clue for flexure localisation. As a novelty, we propose a preliminary method for detecting liver- and spleen-related shadows on the intestinal mucosa using colour characterisation and deep learning semantic segmentation. The aim was to identify colour nuances specific to shadow regions in colonoscopy frames, use these characteristics to automatically annotate representative frames, and then train a semantic segmentation network to recognise similar shadow patterns.
The present study should be interpreted as an exploratory feasibility study rather than as a validated automatic flexure detection system. The paper is structured in five main parts. The introduction is followed by a description of the method used to extract colour information from colonoscopy frames. Section 3 describes how the training dataset was obtained and how the semantic segmentation network was trained for shadow detection. Section 4 presents the preliminary results obtained with the trained network, and the paper ends with the Discussion and Conclusions sections.
2. Shadow Characterisation by Colour
To characterise shadow patterns potentially related to the hepatic and splenic flexures, we reviewed seven video colonoscopies from our collection and selected frames in which shadow-like impressions were clearly visible on the intestinal wall, as illustrated in Figure 1. This process resulted in 1814 representative frames. These frames were not intended to represent the full variability of colonoscopy videos, but rather to provide a focused sample of visually evident shadow patterns that could be used for preliminary colour characterisation.
It should be noted that frames containing such shadows were relatively scarce. In most colonoscopy videos, liver- or spleen-related impressions, when present, are visible only for a short interval as the colonoscope passes near the hepatic or splenic flexure.
From these frames, we manually selected 80 rectangular image fragments corresponding to visible liver- or spleen-related shadow regions, as shown in Figure 2. These fragments were used to extract the colour characteristics of shadow areas. The extracted information was stored in a three-dimensional matrix, with one value for each possible combination of RGB coefficients, corresponding to a 256 × 256 × 256 colour space. Initially, all values in this matrix were set to zero. An automatic script then analysed each shadow fragment pixel by pixel. Whenever a specific RGB combination was found in a shadow fragment, the corresponding value in the matrix was increased by one.
At the end of this process, increased matrix values were obtained only for colour nuances observed within the selected shadow fragments. More frequently occurring nuances received higher scores (up to 297). Because the total number of detected nuances was very large, exceeding 28,000 combinations, and because many of them occurred only rarely, we excluded all nuances with a score lower than 10. After this filtering step, approximately 9500 colour nuances remained and were used as a preliminary colour signature of shadow regions.
A similar procedure was applied to characterise the colour appearance of intestinal mucosa. For this purpose, 112 representative mucosal fragments were selected, as illustrated in Figure 3, and their RGB colour distribution was stored in a separate three-dimensional matrix. This second matrix was used to identify pixels with colour characteristics compatible with intestinal mucosa.
Two additional regions commonly encountered in colonoscopy frames also had to be considered: artefacts and lumen/borders. Artefacts, such as bright reflections, glare, or unnatural high-intensity areas produced by the proximity of the colonoscope to the intestinal wall, may obscure both mucosa and shadow patterns. Similarly, the lumen, when visible as a large dark region, cannot be meaningfully interpreted as a shadow related to the liver or spleen. In addition, the black borders of colonoscopy frames may be misclassified if they are not explicitly handled.
Unlike shadow and mucosal regions, artefacts and lumen/borders were not characterised using colour signatures, because colour-based detection proved less reliable for these areas. Instead, we used a luminance-based approach, following the strategy used in our previous work on semantic segmentation for objective colonoscopy quality assessment by Vulpoi et al. (2025) [8]. Luminance was computed directly from RGB coefficients using the following approximation:
where L represents the estimated luminance of a pixel, and R, G, and B are the red, green, and blue coefficients, expressed as integer values between 0 and 255.
Thus, based on the computed luminance, the pixels belonging to the artefact areas were detected as those with L > 210 (the maximum value being 255 for full white), i.e., those pixels for which the brightness is very high, regardless their colour. It should be noted that in this particular case of shadow detection, we considered it better to eliminate the artefacts more radically, even if in this way it was possible to eliminate some legitimate areas of the intestinal mucosa. Also, we considered that all pixels for which L < 70 (dark pixels, regardless their colour) are part of the lumen or of the borders of the colonoscopy frames. Again, since this time the aim was not the lumen precise detection, we also marked as lumen the black borders of the colonoscopy frames and even some darker areas in the intestinal mucosa. We took into consideration that this does not prevent the detection of the hepatic and splenic shadows on a properly illuminated intestinal mucosa.
3. Semantic Segmentation Deep Learning Network Training
We used a semantic segmentation neural network to identify four types of regions in colonoscopy frames: shadow areas, intestinal mucosa, artefacts, and lumen/borders. The aim was not to develop a definitive pixel-level ground truth model, but to explore whether weakly annotated frames generated through colour- and luminance-based rules could be used to train a network capable of producing spatially coherent segmentation maps.
From the initial set of 1814 representative frames containing visible shadow patterns, we selected the 500 most representative colonoscopy frames for network training. These frames were chosen because they included visually evident shadow-like regions, together with variable amounts of intestinal mucosa, lumen/borders, and artefacts. Since the dataset was relatively small and shadows were not uniformly distributed within the frame, data augmentation was performed by mirroring the images along the horizontal axis, along the vertical axis, and along both axes. This increased the training dataset to 2000 frames and reduced the risk that the network would overlearn shadow location from the predominant position observed in the original images.
The selected colonoscopy frames were automatically annotated using the methods described in the previous section. Pixels were marked as intestinal mucosa when their RGB coefficients were present in the mucosal colour matrix, as shadows when their RGB coefficients were present in the shadow colour matrix, as lumen/borders when their luminance was lower than 70, and as artefacts when their luminance was higher than 210. The resulting annotated images are illustrated in Figure 4.
The automatic annotation procedure generated sparse and imperfect labels. In the augmented training set, artefact pixels represented 3.54% of all pixels, lumen/border pixels 23.6%, intestinal mucosa pixels 6.7%, and shadow pixels 3.98%. A substantial proportion of pixels, 62.18%, remained unassigned after automatic annotation. This reflects the high variability of colonoscopy images and the limitations of simple colour-based rules. Therefore, these annotations should be interpreted as weak labels, designed to guide the network towards representative visual patterns rather than to provide complete expert-validated segmentation masks.
The annotated images were initially created as coloured TIF files to allow visual inspection of the automatic labelling. For network training, they were then converted into PNG greyscale label images, according to the format required for semantic segmentation training in MATLAB. All steps, including colour feature extraction, automatic annotation, conversion of annotation files, network training, and verification of segmentation outputs, were performed using MATLAB routines.
The semantic segmentation network was trained to classify each pixel into one of four classes: shadow, intestinal mucosa, artefact, and lumen/borders. The network included an input layer for 576 × 720 × 3 images with normalisation, followed by six down-sampling layers, four up-sampling layers, and three final layers including softmax and pixel-level cross-entropy classification. Several training runs were performed with different parameter settings. The final version selected for further exploratory analysis was trained for 20 epochs, using a learning factor of 0.0003. Training required approximately 190 minutes and reached a training accuracy of 98.03%, with an output error of 0.0206.
These training values should be interpreted with caution. Since the labels were automatically generated and the primary purpose of the study was feasibility assessment, training accuracy does not represent independent validation of shadow or flexure detection. Instead, it indicates that the network was able to learn the weak labelling patterns generated by the colour- and luminance-based annotation procedure. Independent expert-labelled datasets and external test videos would be required to determine the true segmentation performance and clinical usefulness of this approach.
4. Results
The trained semantic segmentation network was first applied to the set of 500 original colonoscopy frames used for model development. Compared with the initial automatic annotations, the network assigned a larger proportion of pixels to intestinal mucosa and shadow regions. The proportion of pixels classified as intestinal mucosa increased from 6.7% in the automatic annotations to 46.13% after semantic segmentation, while the proportion of pixels classified as shadows increased from 3.98% to 12.68%. Moderate increases were also observed for artefacts, from 3.54% to 8.77%, and for lumen/borders, from 23.6% to 32.42%.
Examples of the resulting segmentation maps are shown in Figure 5, using the same frames illustrated in Figure 1 and Figure 4. Intestinal mucosa pixels are marked in red, shadow pixels in green, artefacts in blue, and lumen/borders in black. These results indicate that the network produced more spatially continuous segmentation maps than the initial sparse automatic annotations. However, since this evaluation was performed on development frames and was based on weak labels, it should not be interpreted as independent validation of segmentation accuracy. Rather, it shows that the network was able to learn and extend the visual patterns provided by the colour- and luminance-based annotation procedure.
To evaluate the results for an entire video colonoscopy, we developed a routine that processes the video frame by frame and counts, for each frame, the number of pixels assigned by the trained semantic segmentation network to each of the four classes: shadows, intestinal mucosa, artefacts, and lumen/borders. The colonoscopies in our database were recorded at 25 frames per second; therefore, pixel counts were summed for every 25 consecutive frames, corresponding to one second of video. As a practical example, Figure 6 shows the results obtained for test video colonoscopy #5, which had a duration of 4 min and 15 s. The horizontal axis represents the time sequence of the colonoscopy video, while the vertical axis shows the relative proportion of the four segmented pixel classes: shadow pixels in green, intestinal mucosa pixels in red, artefact pixels in blue, and lumen/border pixels in black.
As shown in Figure 6, shadow pixels, marked in green, were present throughout many parts of the colonoscopy. This observation indicates that not all detected shadow regions are necessarily related to liver or spleen impressions. In addition to potential hepatic or splenic shadows, numerous shadow-like areas may be generated by the illumination of the intestinal mucosa and its folds, by local angulation, by residual fluid, or by contact between adjacent colonic walls. Therefore, in order to retain only candidate shadow intervals that could plausibly correspond to the colon being close to the liver or spleen, we applied a set of empirical filtering rules based on the relative proportions of the four segmented regions.
For a shadow region to be considered potentially relevant, it should be sufficiently large, while the surrounding intestinal mucosa should remain adequately visible. At the same time, frames dominated by artefacts or lumen/borders are less reliable for interpreting shadow patterns. Therefore, the filtering rules were applied to the percentage of pixels belonging to each segmented class, summed over each one-second interval of the colonoscopy video.
First, all one-second intervals in which lumen/border pixels represented more than 50% of the total pixels were excluded, as shown in Figure 7. Second, intervals in which artefact pixels represented more than 33% of total pixels were excluded, as shown in Figure 8. Third, intervals in which intestinal mucosa represented less than 20% of total pixels were excluded, as shown in Figure 9. Finally, intervals in which shadow pixels represented less than 12% of the pixels were removed, because very small shadow regions were considered more likely to correspond to ordinary mucosal folds or local illumination effects rather than to liver- or spleen-related impressions. These thresholds were empirically selected for exploratory filtering and should not be interpreted as optimised diagnostic cut-offs.
After applying these filtering steps, a limited number of candidate shadow clusters remained, as illustrated in Figure 10. In test colonoscopy #5, the largest cluster was observed between seconds 46 and 52. This interval corresponded to the video sequence shown in Figure 11, left panel, captured at second 49. A second nearby cluster was observed between 1:01 and 1:07, corresponding to the image shown in Figure 11, right panel, captured at 1:03. These intervals were considered candidate shadow regions potentially related to the hepatic flexure. This interpretation was supported by expert review, as one endoscopist acknowledged the hepatic flexure between seconds 45 and 49, possibly extending to 1:00, while the second endoscopist acknowledged the same flexure between seconds 45 and 50.
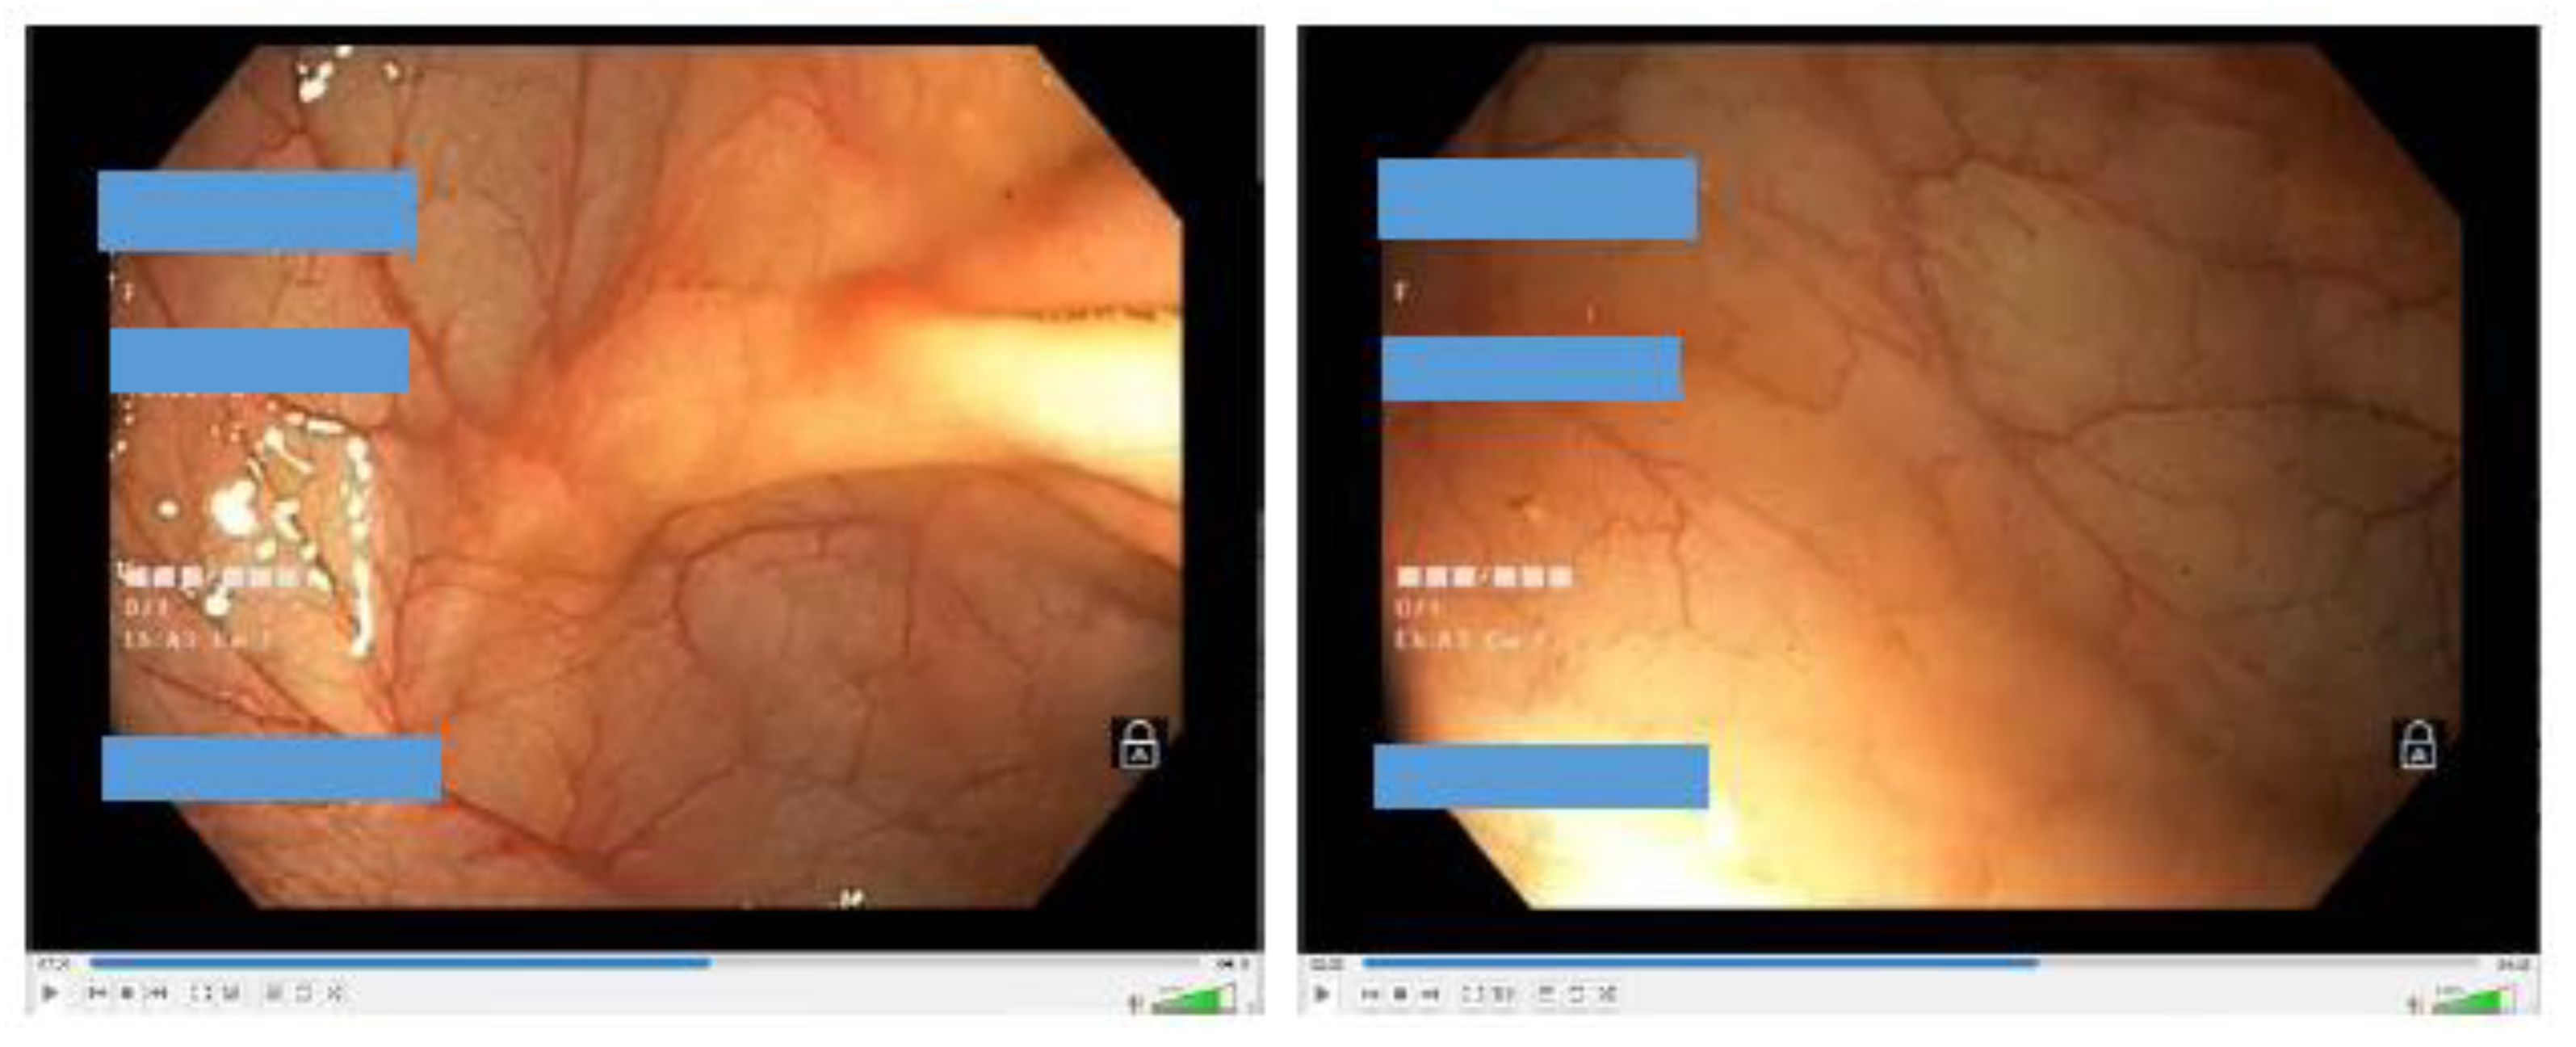
Later in the video, several shadow clusters were observed between seconds 2:22 and 2:37. These intervals corresponded to the video frames shown in Figure 12, captured at 2:23 and 2:35, respectively. Because they occurred in the later part of the withdrawal sequence, these shadow clusters were considered possible candidates for the splenic flexure region. However, this interpretation was less certain than for the hepatic flexure. One endoscopist did not clearly acknowledge the splenic flexure, while the other indicated it around seconds 2:39–2:40 and possibly 2:53. Therefore, the splenic flexure findings should be interpreted as suggestive rather than definitive.
Overall, the full-video analysis suggests that temporally clustered shadow segmentation may help identify candidate flexure regions in selected colonoscopy videos. The hepatic flexure signal appeared more concordant with expert review in the representative case analysed, whereas the splenic flexure signal was more uncertain. These preliminary findings support the feasibility of the approach, but larger validation on independently annotated videos is required to determine its true performance and robustness.
5. Discussion
We explored the possibility of using specific liver- and spleen-related shadows visible on the intestinal wall as indirect cues for the localisation of two important anatomical landmarks encountered during colonoscopy: the hepatic and splenic flexures. These flexures are clinically relevant because they divide the colon into three main segments that are used in colonoscopy practice, including for the assessment of bowel preparation quality with segmental scoring systems such as the Boston Bowel Preparation Scale. However, precise identification of these flexures may sometimes be difficult, even for experienced endoscopists, and in some colonoscopies the specific shadows produced by the liver or spleen may be absent or only briefly visible.
In this study, we developed a preliminary method for automatic segmentation based on the extraction of colour characteristics for shadow regions and intestinal mucosa, together with luminance-based rules for detecting artefacts and lumen/borders within colonoscopy frames. Based on this approach, we constructed a training dataset comprising 500 original frames showing visible shadow patterns and their corresponding automatically colour-annotated masks. Using a semantic segmentation deep learning architecture, we trained a network to segment colonoscopy frames, with reasonable approximation, into four regions: shadows, intestinal mucosa or wall, lumen/borders, and artefacts.
We also developed a procedure to apply the trained neural network to entire video colonoscopies and to analyse the resulting temporal data. For each second of video, the proportions of pixels classified as shadows, intestinal mucosa, artefacts, and lumen/borders were calculated. In this paper, we presented one representative colonoscopy case in which clusters of shadow pixels appeared in temporal proximity to the hepatic and splenic flexure regions indicated by expert review. Therefore, this case supports the feasibility of the proposed approach, but it should not be interpreted as definitive validation of automatic flexure detection.
The usefulness of the method in this representative case depended on applying empirical filtering rules to the pixel percentages of each segmented region for every second of colonoscopy video. These rules were used to exclude intervals dominated by lumen/borders, artefacts, or insufficient visible mucosa, and to retain only intervals with larger shadow regions. This filtering step was necessary because shadow pixels were detected in many parts of the colonoscopy and not all of them were anatomically meaningful.
During testing on additional video colonoscopies, we observed that many small shadows were not related to the liver or spleen, but rather to ordinary mucosal folds, local illumination changes, colonic angulation, or contact between adjacent colonic walls. Some of these non-specific shadows could be reduced by filtering based on pixel count. However, we also encountered situations in which residual liquid in the colon was not detected as an artefact and was misinterpreted as a large shadow region. This type of error could only be recognised by reviewing the original colonoscopy video, which highlights an important limitation of the current approach.
Another limitation is that liver- and spleen-related shadows are not consistently present in all colonoscopies. Their visibility may depend on patient anatomy, degree of insufflation, endoscope position, bowel preparation, and illumination. Therefore, absence of these shadows cannot be interpreted as absence of the corresponding flexure. Similarly, the presence of a large shadow does not necessarily confirm that the colonoscope is passing the hepatic or splenic flexure.
In order to improve the detection of liver- and spleen-related shadows, it will be necessary to collect a larger number of colonoscopy videos in which these specific shadow patterns are present, as well as videos in which they are absent. A larger and more diverse dataset would allow the construction of a more robust semantic segmentation training database and would support a more reliable evaluation of the method. Future work should also include independent expert annotation of flexure intervals and shadow regions, separate evaluation of hepatic and splenic flexure localisation, and quantitative performance metrics such as sensitivity, false-positive rate, and temporal localisation error.
Overall, the present study suggests that liver- and spleen-related shadows may provide useful complementary cues for identifying candidate flexure intervals in selected colonoscopy videos. However, the method remains exploratory and requires further refinement, larger-scale validation, and improved analysis of the resulting temporal data before it can be considered a robust automatic flexure localisation system.
6. Conclusions
The hepatic and splenic flexures are important anatomical landmarks in video colonoscopy, both for lesion, polyp, or previous intervention localisation during surveillance, diagnosis, and treatment, and for procedure quality assessment. Their identification may support a more structured interpretation of colonoscopy videos, particularly when segmental evaluation of bowel preparation or anatomical localisation is required.
In this exploratory study, we tested a preliminary technique for the automatic analysis of colonoscopy videos based on the detection of liver- and spleen-related shadow patterns visible on the intestinal wall. The method relied on extracting colour characteristics associated with these shadows and training a semantic segmentation deep learning network to identify shadow regions frame by frame, together with intestinal mucosa, lumen/borders, and artefacts.
By applying successive empirical filtering rules to the temporal distribution of segmented pixels, the method was able to highlight candidate intervals that appeared in temporal proximity to expert-indicated flexure regions in a representative colonoscopy video. These findings suggest that liver- and spleen-related shadows may provide useful complementary cues for hepatic and splenic flexure localisation in selected cases.
However, the proposed approach should currently be regarded as a feasibility test rather than a validated automatic detection system. Its practical implementation remains challenging because liver- and spleen-related shadows may interfere with other shadow-like regions commonly present in colonoscopy frames, including those produced by mucosal folds, illumination changes, fluid, artefacts, or colonic angulation. Moreover, in some colonoscopies, these specific shadows may be absent or insufficiently visible.
Further work should focus on enlarging the colonoscopy video database, including both cases with visible liver/spleen shadow patterns and cases in which such patterns are absent. Improved colour characterisation, more robust artefact and fluid detection, expert-validated annotations, and quantitative performance assessment will be necessary to determine whether shadow-based segmentation can contribute reliably to automated anatomical localisation in colonoscopy.
Author Contributions
Conceptualisation and methodology, A.C. and M.L.; software, A.C.; validation, R.A.V., O.B.B., V.L.D.; investigation, A.C. and M.L.; data curation, R.A.V.; writing—original draft preparation, A.C.; writing—review and editing, M.L. and R.A.V.; supervision, V.L.D. All authors have read and agreed to the published version of the manuscript.
Institutional Review Board Statement
The study was conducted in accordance with the Declaration of Helsinki and was approved by the Ethics Committee of “Saint Spiridon” Emergency Hospital in Iași (Approval Code: 26/11 March 2022) and the Ethics Committee of “Grigore T. Popa” University of Medicine and Pharmacy in Iași (Approval Code: 150/13 February 2022).
Informed Consent Statement
Informed consent was obtained from all subjects involved in the study.
Data Availability Statement
Any data used in this study may be made available upon reasonable request, except video colonoscopies or colonoscopy frames that need anonymisation prior to release.
Conflicts of Interest
The authors declare no conflicts of interest.
Abbreviations
The following abbreviations are used in this manuscript:
| CRC | Colorectal cancer |
| CNN | Convolutional Neural Network |
| AI | Artificial Intelligence |
| CT | Computer Tomography |
| BBPS | Boston Bowel Preparation Scale |
| RGB | Red Green Blue |
| TIF | Tagged Image File |
References
- Wozniak, S.; Quondamatteo, F.; Paulsen, F. Flexures and bends of the large intestine: Current terminology and a suggestion to simplify it. J. Anat. 2023, 242, 695–700. [Google Scholar] [CrossRef] [PubMed]
- Ye, C.; Che, K.; Yao, Y.; Ma, N.; Zhang, R.; Xu, Y.; Wang, J.; Meng, M. Q. H. A deep learning-based system for accurate detection of anatomical landmarks in colon environment. Intell. Robot. 2024, 4, 164–178. [Google Scholar] [CrossRef]
- Kim, B.S.; Cho, M.; Chung, G.E.; et al. Density clustering-based automatic anatomical section recognition in colonoscopy video using deep learning. Sci. Rep. 2024, 14, 872. [Google Scholar] [CrossRef] [PubMed]
- Song, Y.; Zhang, Z.; Wang, R.; et al. CAS-Colon: A Comprehensive Colonoscopy Anatomical Segmentation Dataset for Artificial Intelligence Development. Sci. Data 2025, 12, 1382. [Google Scholar] [CrossRef] [PubMed]
- CAS-Colon: A Comprehensive Colonoscopy Anatomical Segmentation Dataset for Artificial Intelligence Development. [CrossRef]
- Zhu, Y.; Li, S.-Y.; Fu, P.-Y.; Zhang, Z.; Wang, S.; Li, Q.-L.; Zhou, P.-H. EndoClean: A Hybrid Deep Learning Framework for Automated Full-Video Boston Bowel Preparation Scale Assessment. Bioengineering 2026, 13, 294. [Google Scholar] [CrossRef] [PubMed]
- Wozniak, S.; Pawlus, A.; Grzelak, J.; et al. Acute colonic flexures: the basis for developing an artificial intelligence-based tool for predicting the course of colonoscopy. Anat. Sci. Int. 2023, 98, 136–142. [Google Scholar] [CrossRef] [PubMed]
- Vulpoi, R.A.; Ciobanu, A.; Drug, V.L.; Mihai, C.; Barboi, O.B.; Floria, D.E.; Coseru, A.I.; Olteanu, A.; Rosca, V.; Luca, M. Deep Learning-Based Semantic Segmentation for Objective Colonoscopy Quality Assessment. J. Imaging 2025, 11, 84. [Google Scholar] [CrossRef] [PubMed]
Figure 1.
Colonoscopy frames containing shadows of the liver or spleen observed through the intestinal wall.
Figure 1.
Colonoscopy frames containing shadows of the liver or spleen observed through the intestinal wall.
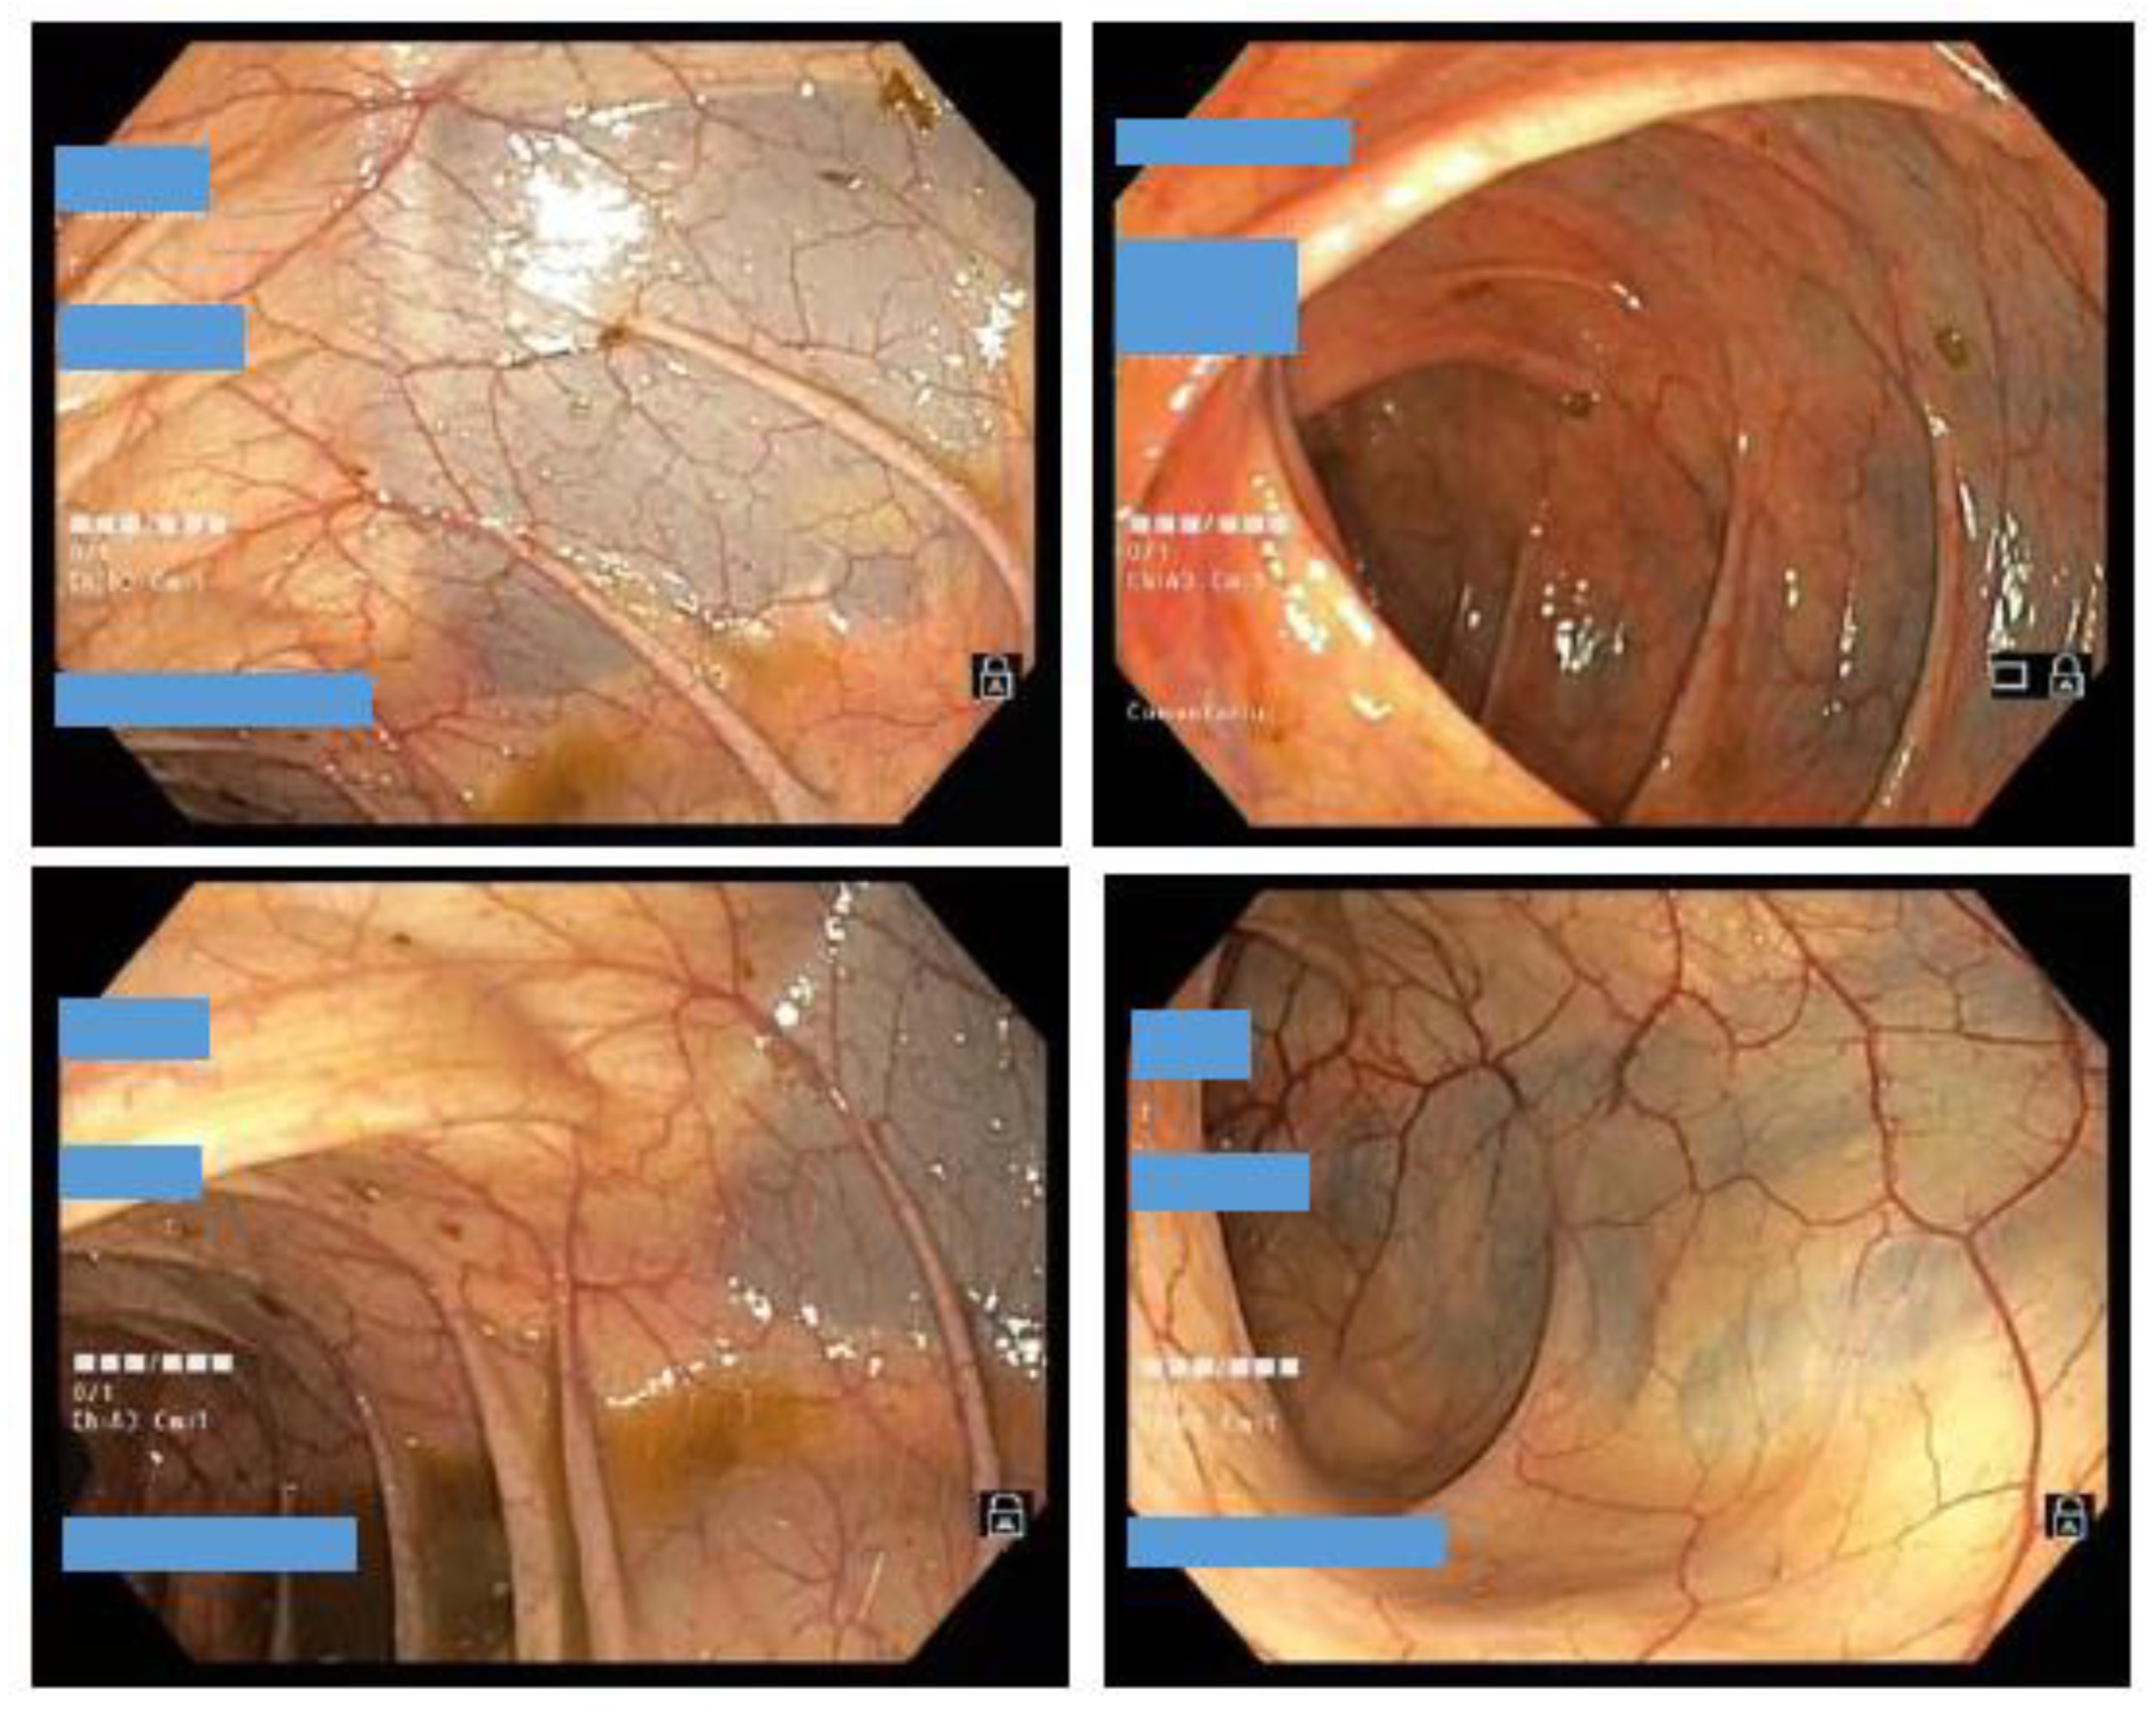
Figure 2.
Colonoscopy fragments used to determine the colour fingerprint of the hepatic and splenic shadows on the intestinal wall.
Figure 2.
Colonoscopy fragments used to determine the colour fingerprint of the hepatic and splenic shadows on the intestinal wall.
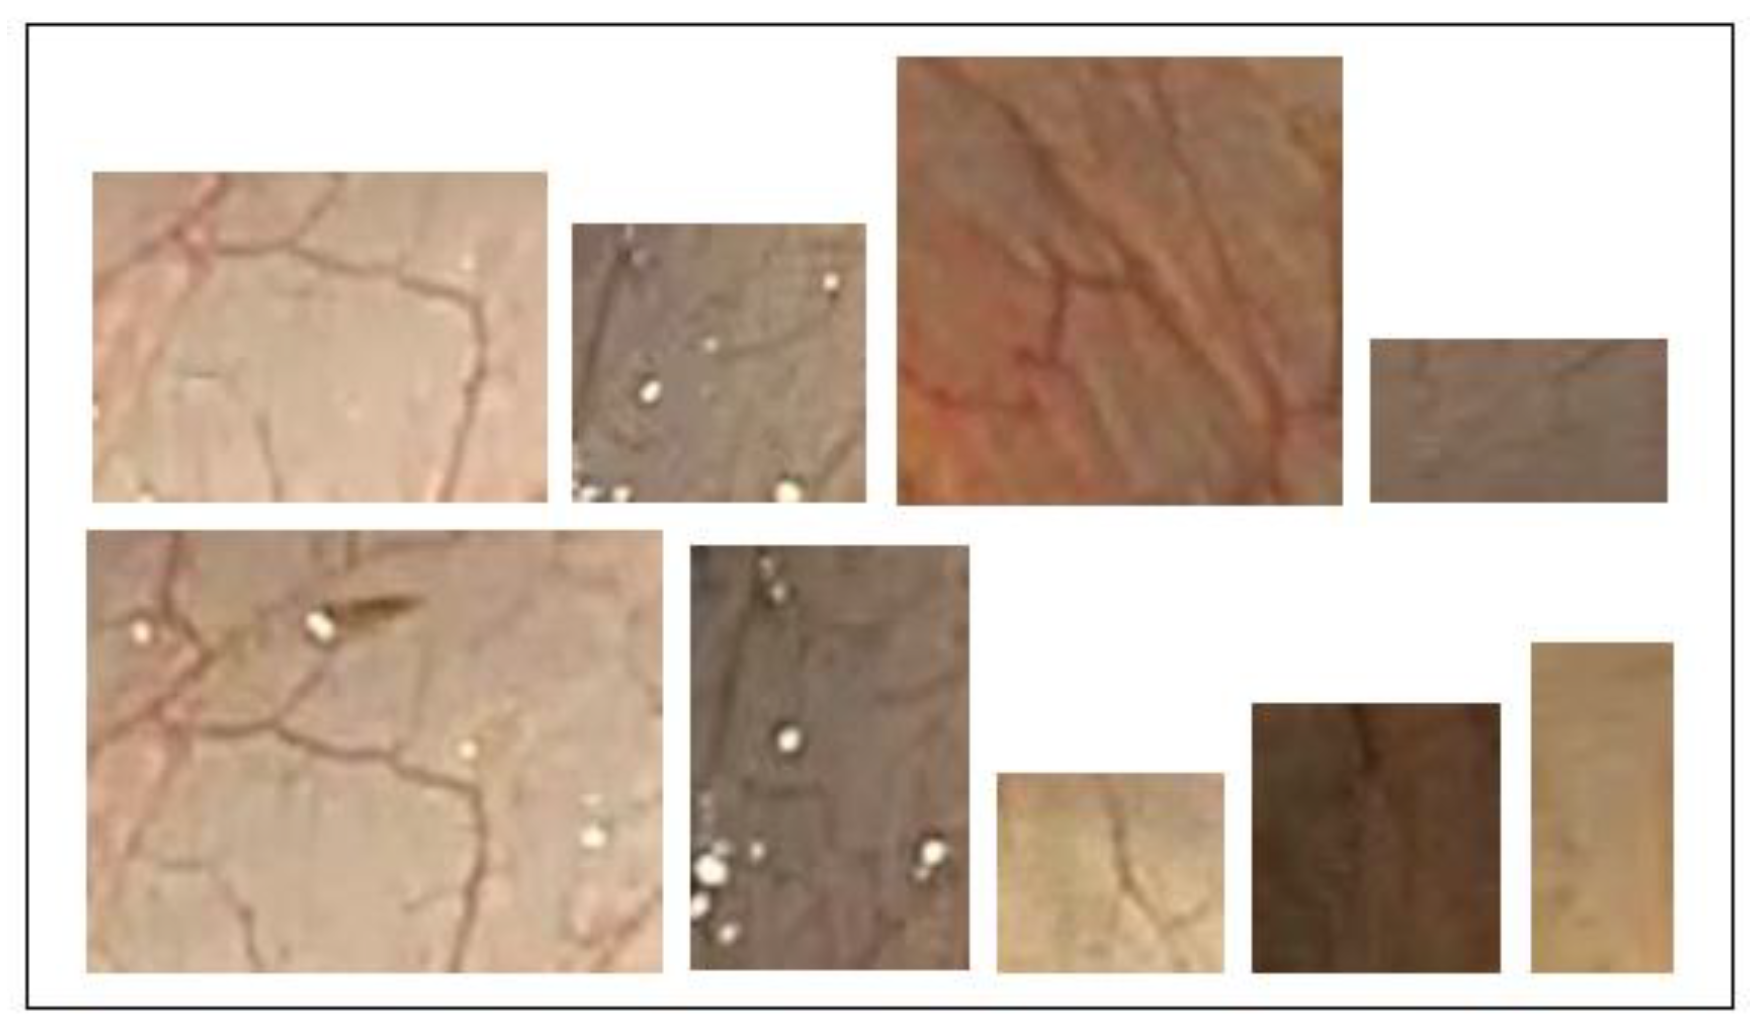
Figure 3.
Colonoscopy fragments used to determine the colour fingerprint of the intestinal mucosa.
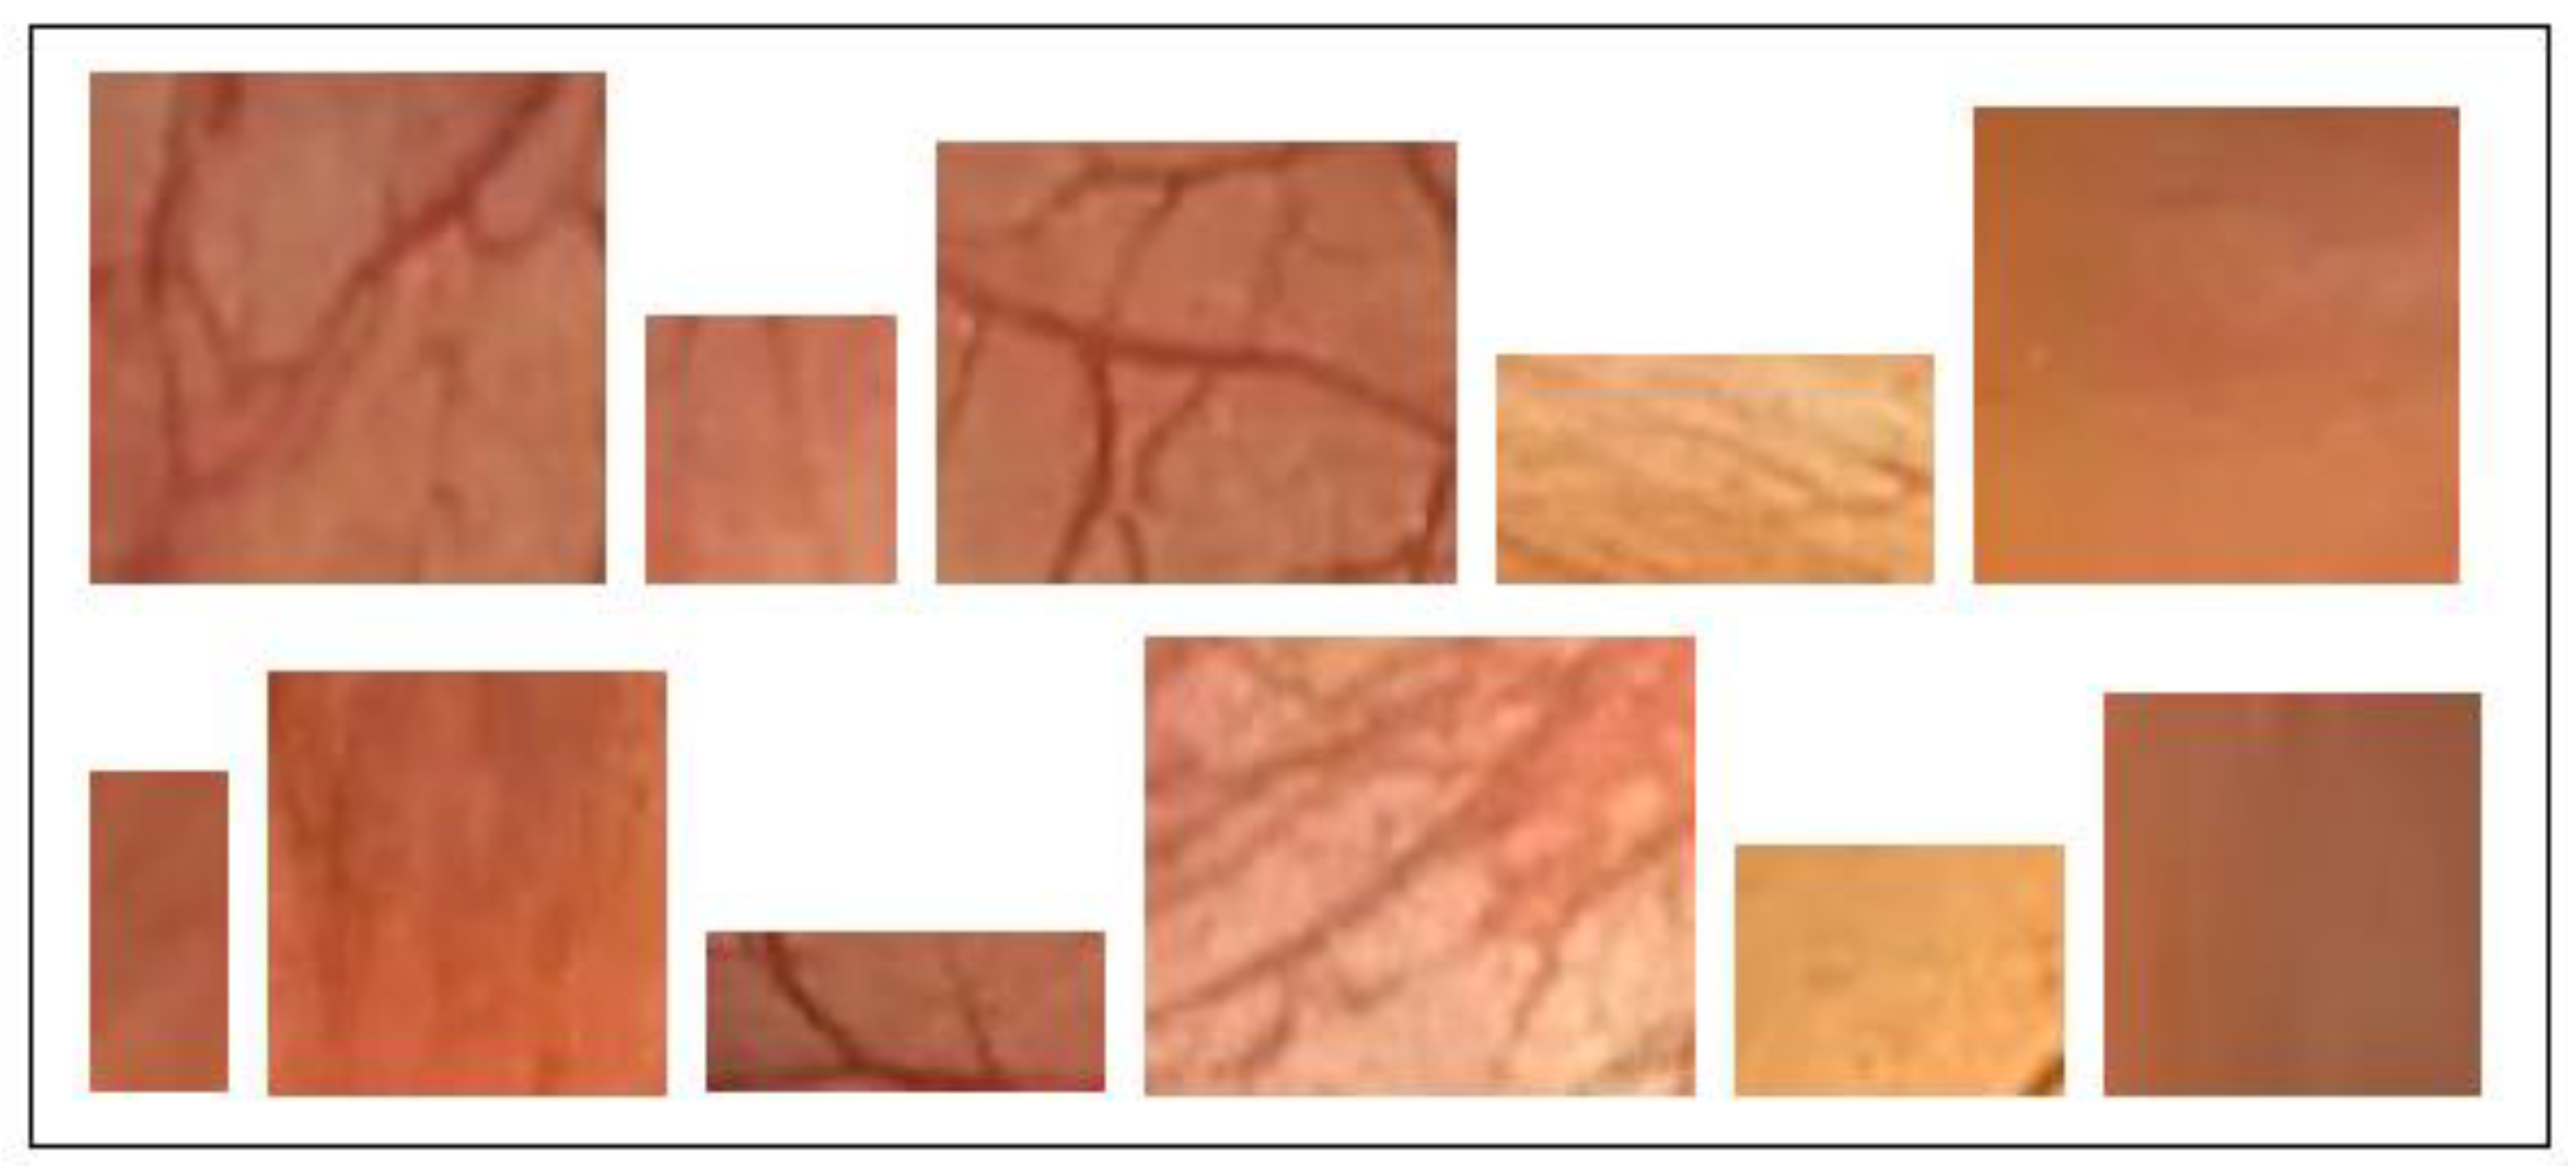
Figure 4.
Colonoscopy frames presented in Figure 1, now with automatic colour detection for intestinal mucosa pixels (marked in red), shadow pixels (marked in green), artefacts (marked in blue) and lumen/edge (marked in black).
Figure 4.
Colonoscopy frames presented in Figure 1, now with automatic colour detection for intestinal mucosa pixels (marked in red), shadow pixels (marked in green), artefacts (marked in blue) and lumen/edge (marked in black).
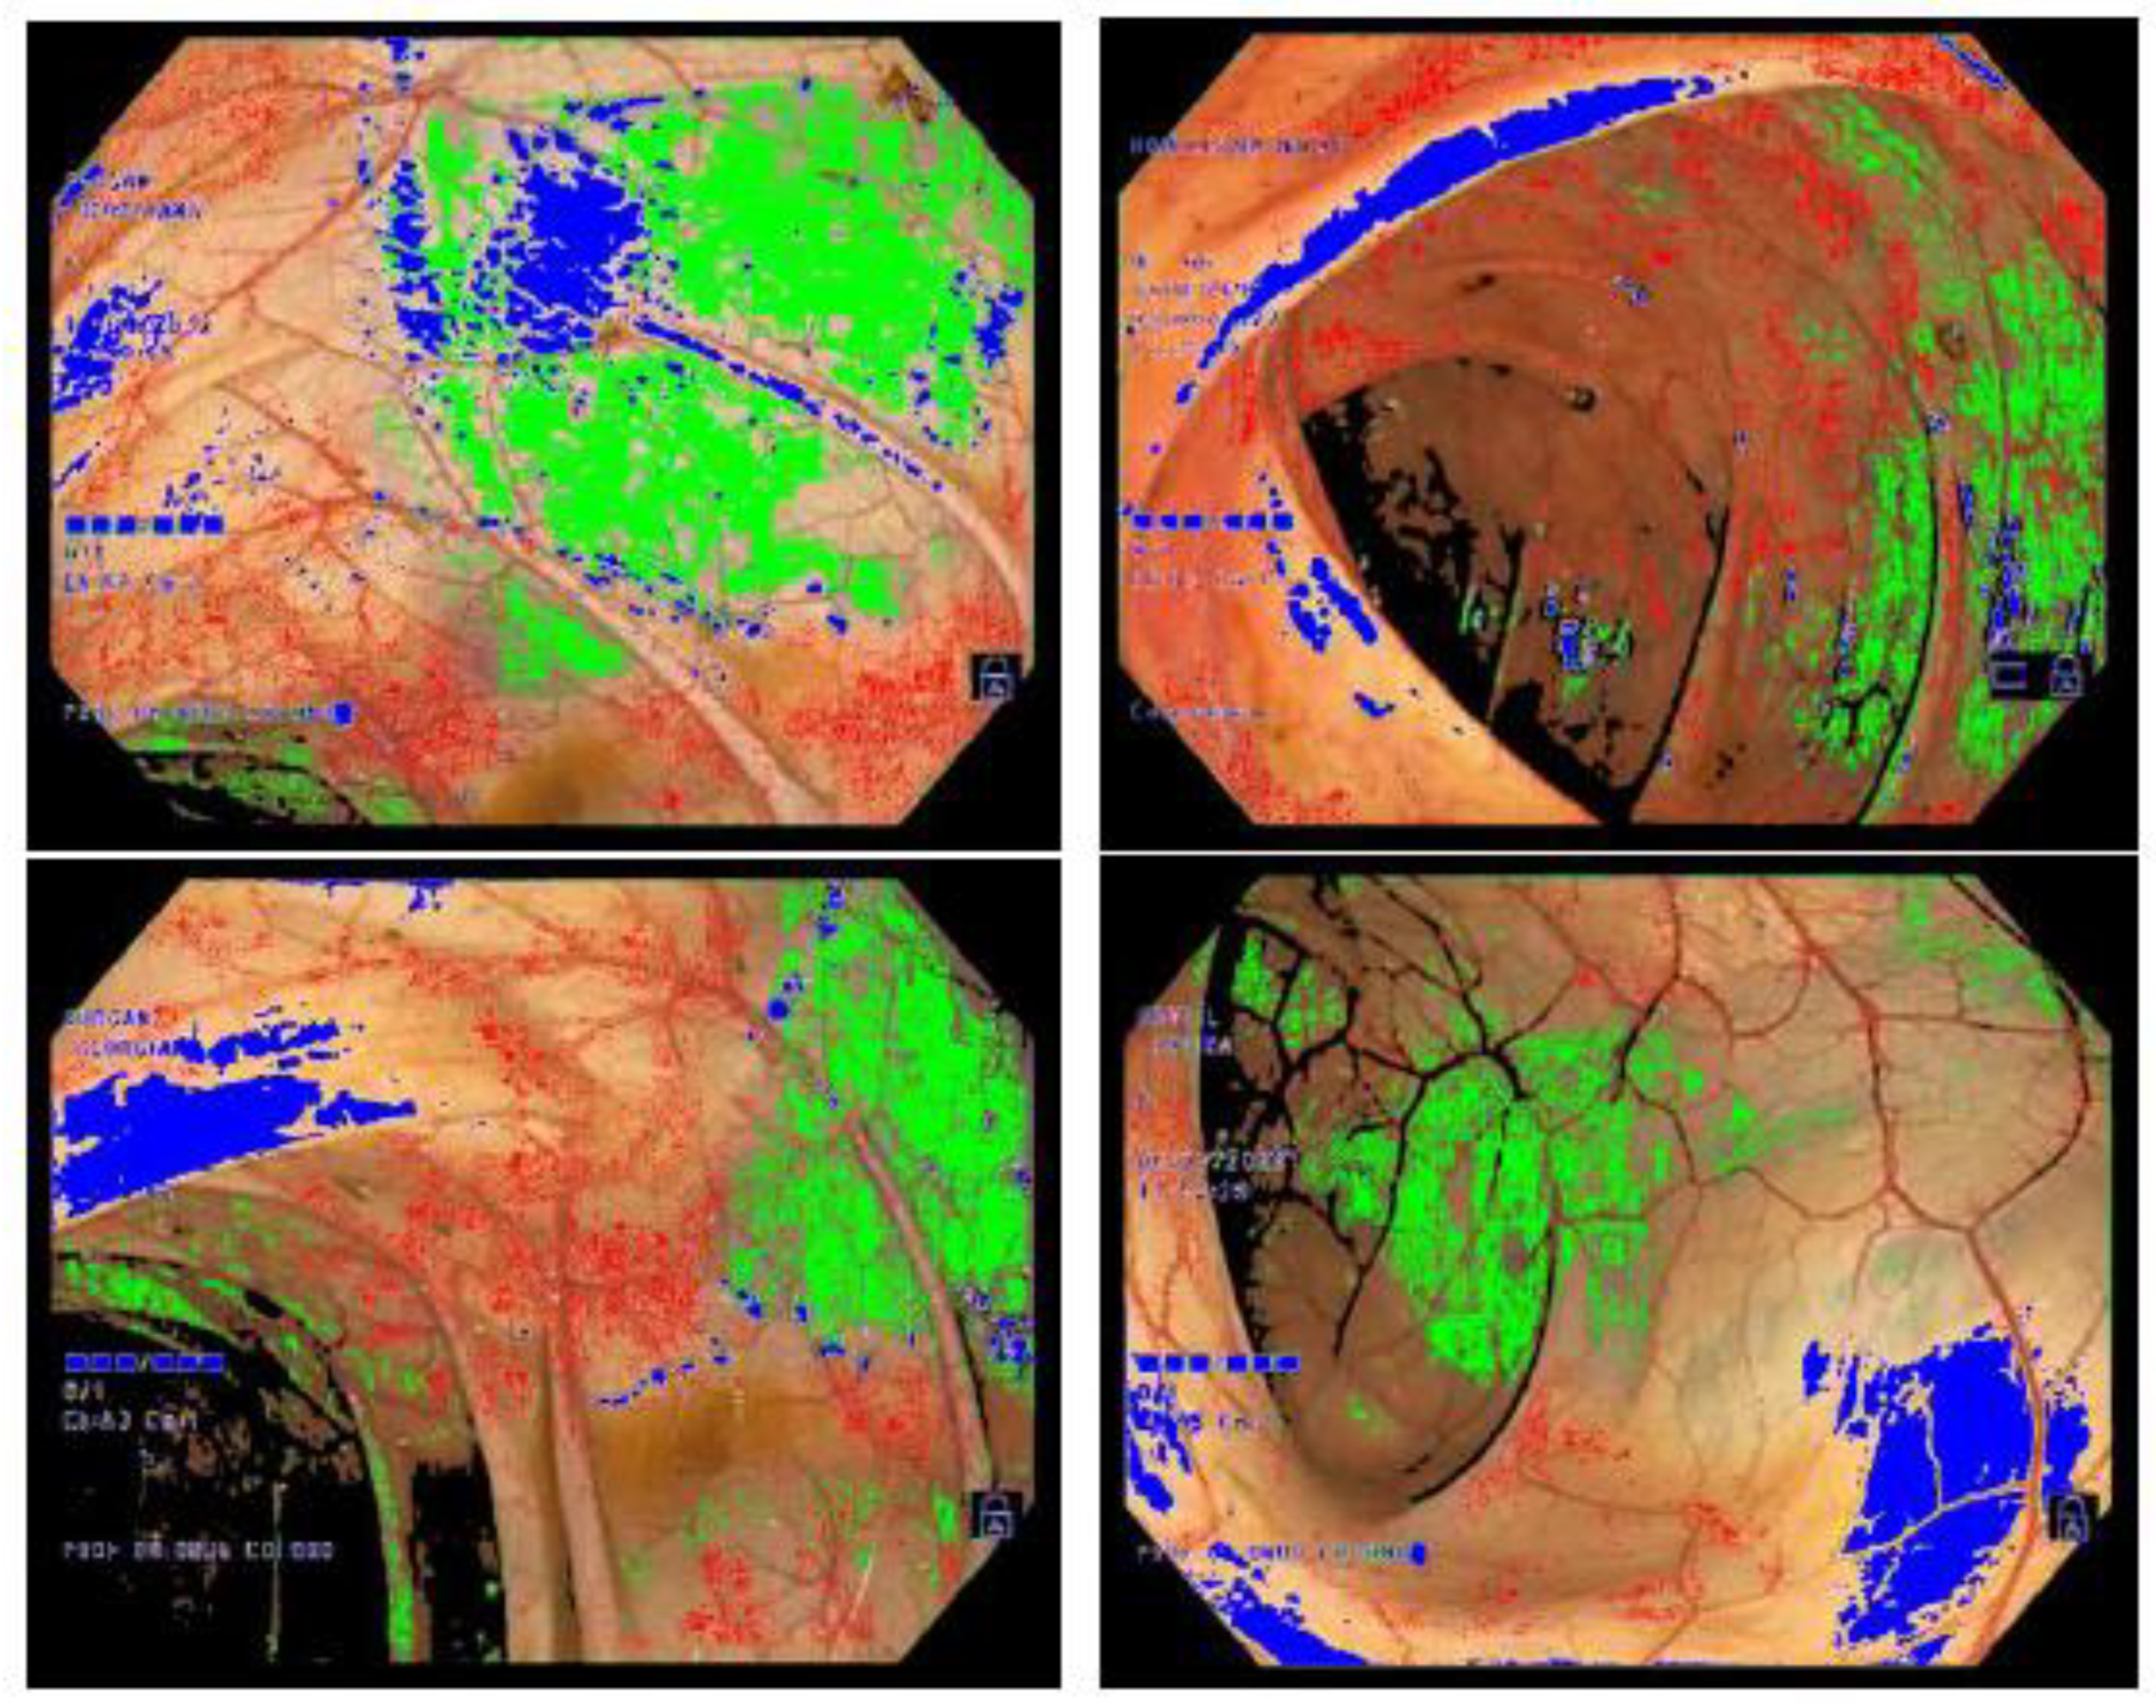
Figure 5.
Colonoscopy frames with regions recognised through semantic segmentation: intestinal mucosa pixels are marked in red, shadows in green, artefacts in blue and lumen/borders in black. (these are corresponding frames to those shown in Figure 1 and Figure 4).
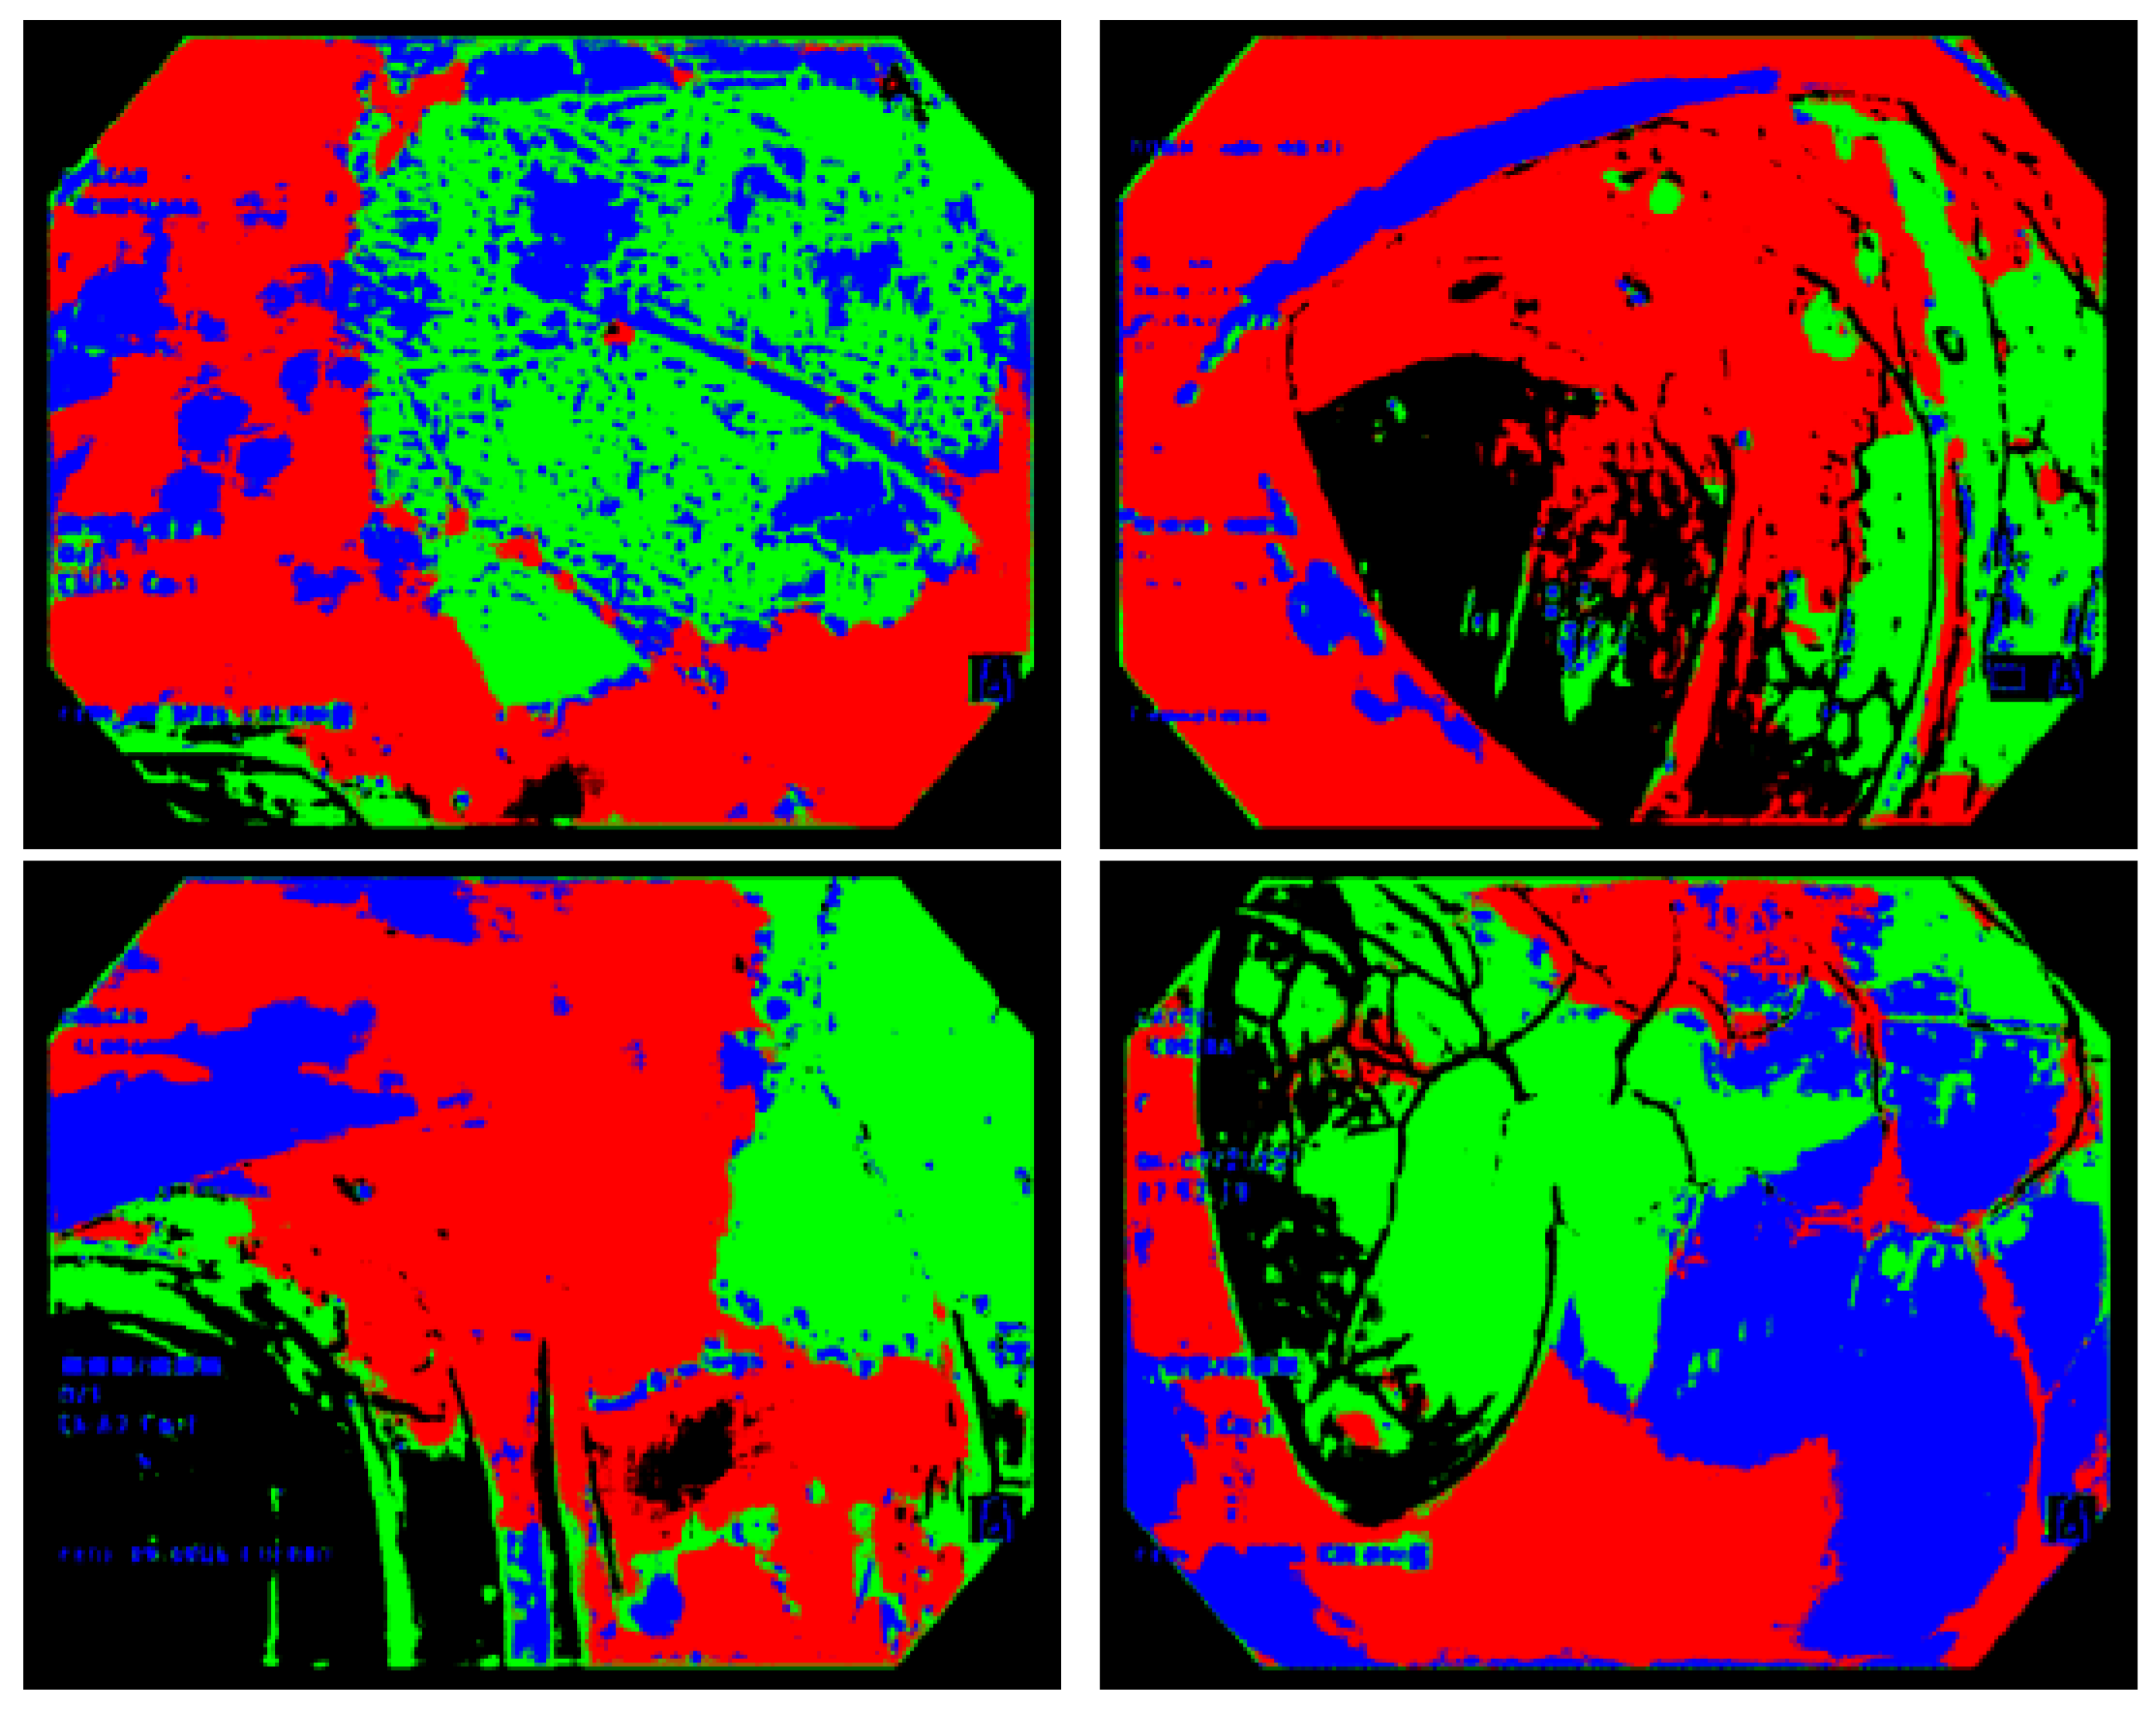
Figure 6.
Pixel composition for each second of test video colonoscopy #5. Horizontally, tick marks indicate each second of the video, while vertically the plot shows the percentage composition of the four pixel classes for each second of the video colonoscopy, corresponding to 25 frames.
Figure 6.
Pixel composition for each second of test video colonoscopy #5. Horizontally, tick marks indicate each second of the video, while vertically the plot shows the percentage composition of the four pixel classes for each second of the video colonoscopy, corresponding to 25 frames.
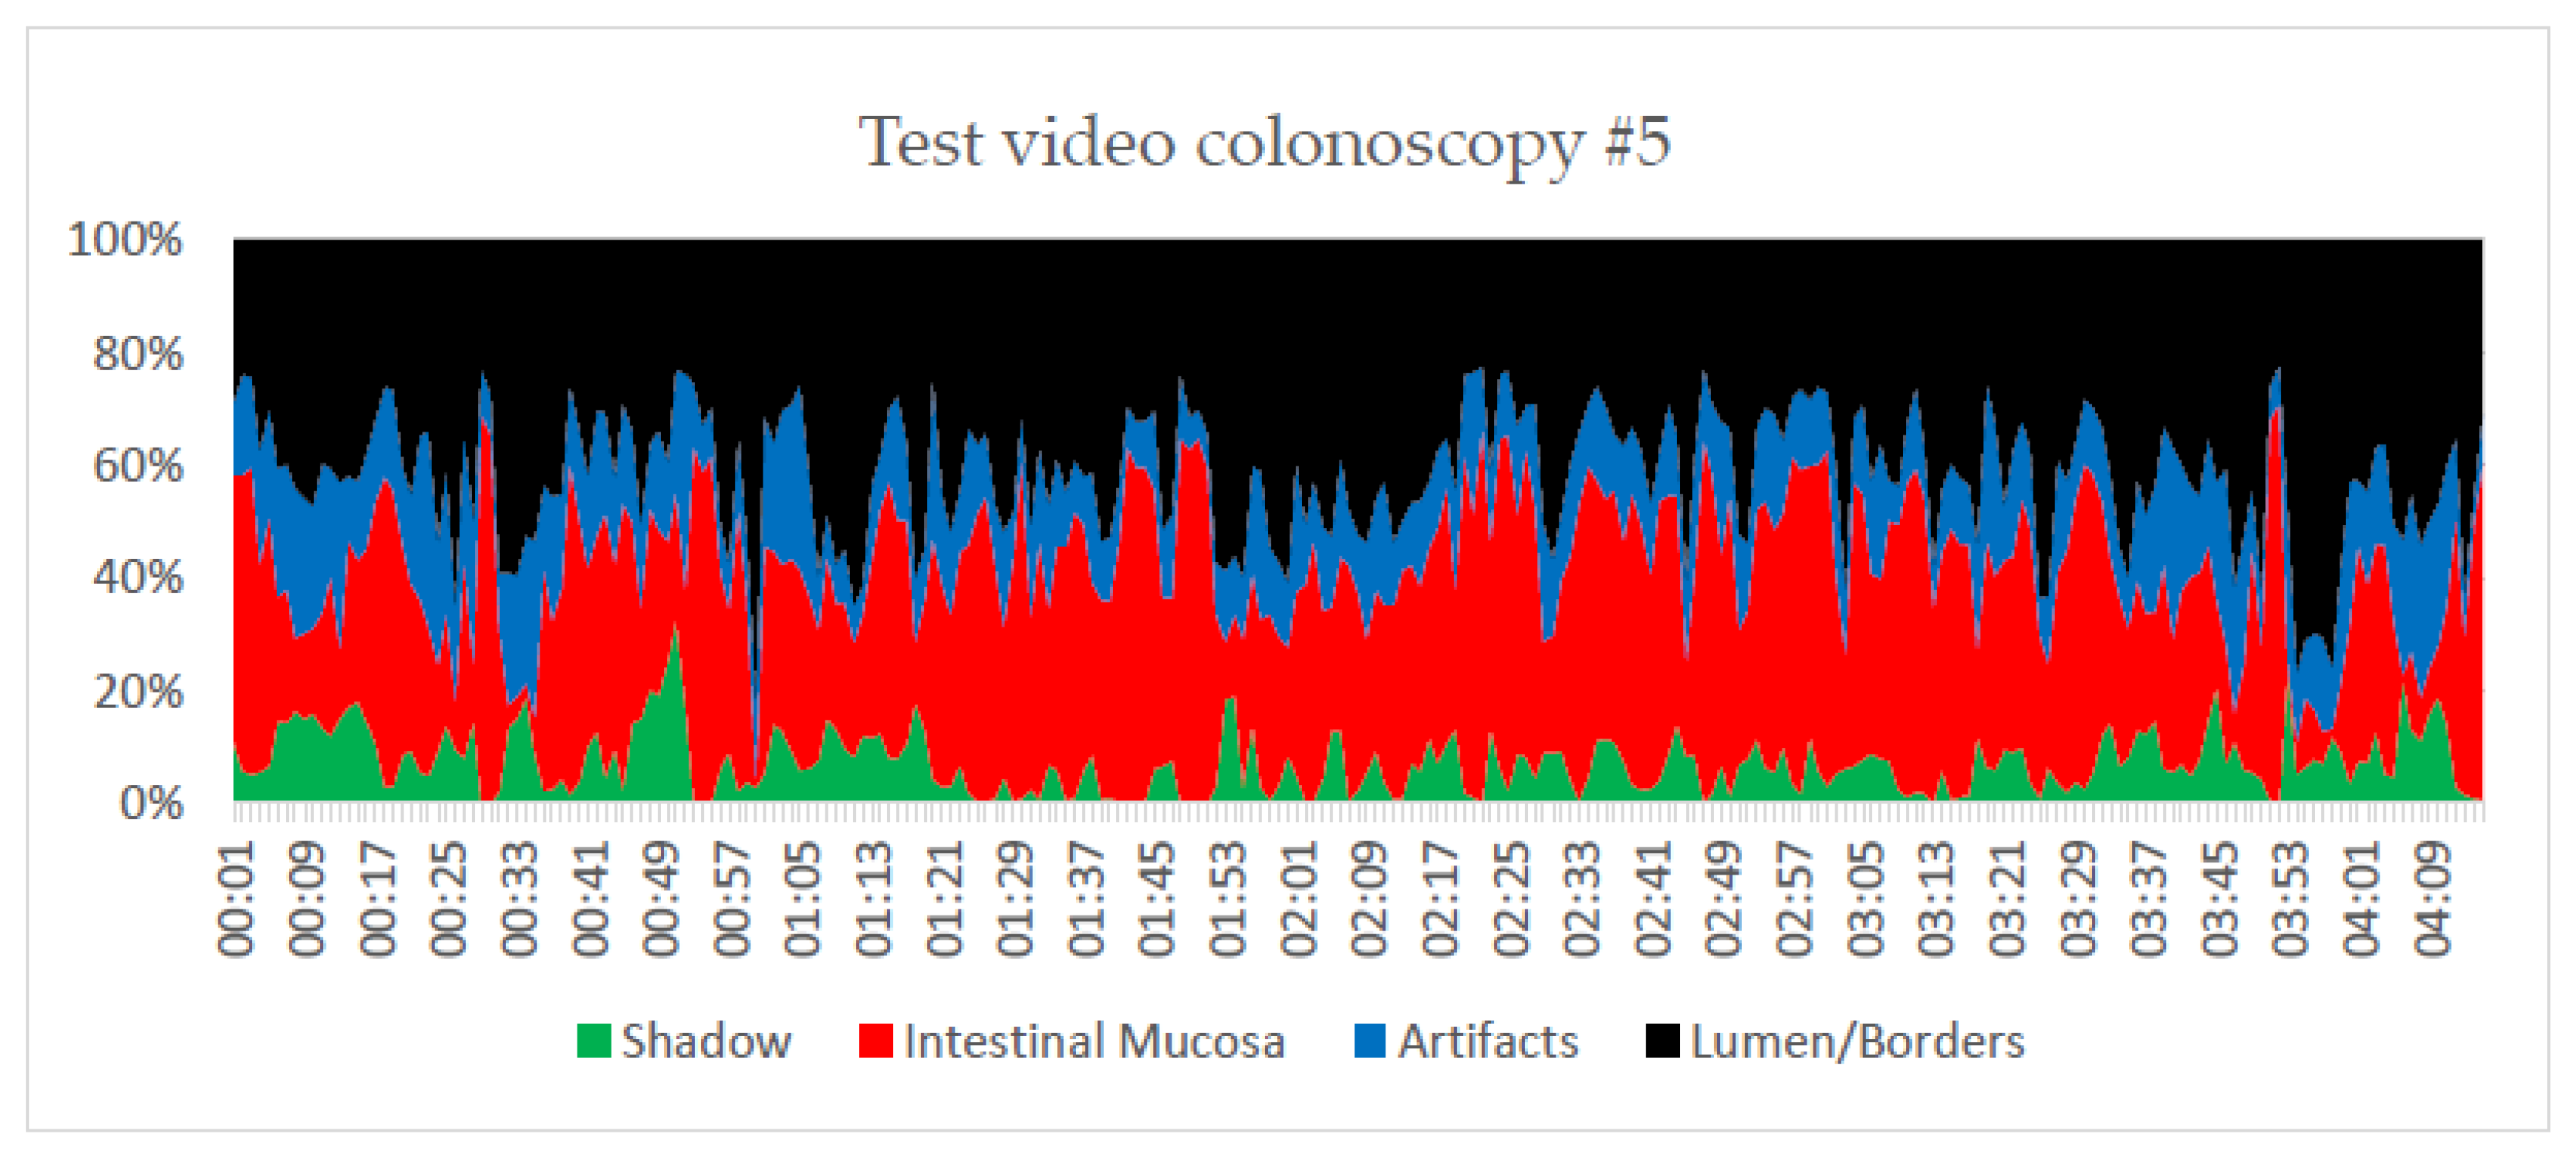
Figure 7.
The same plot as in Figure 6, after excluding video seconds with more than 50% lumen/border pixels.
Figure 7.
The same plot as in Figure 6, after excluding video seconds with more than 50% lumen/border pixels.
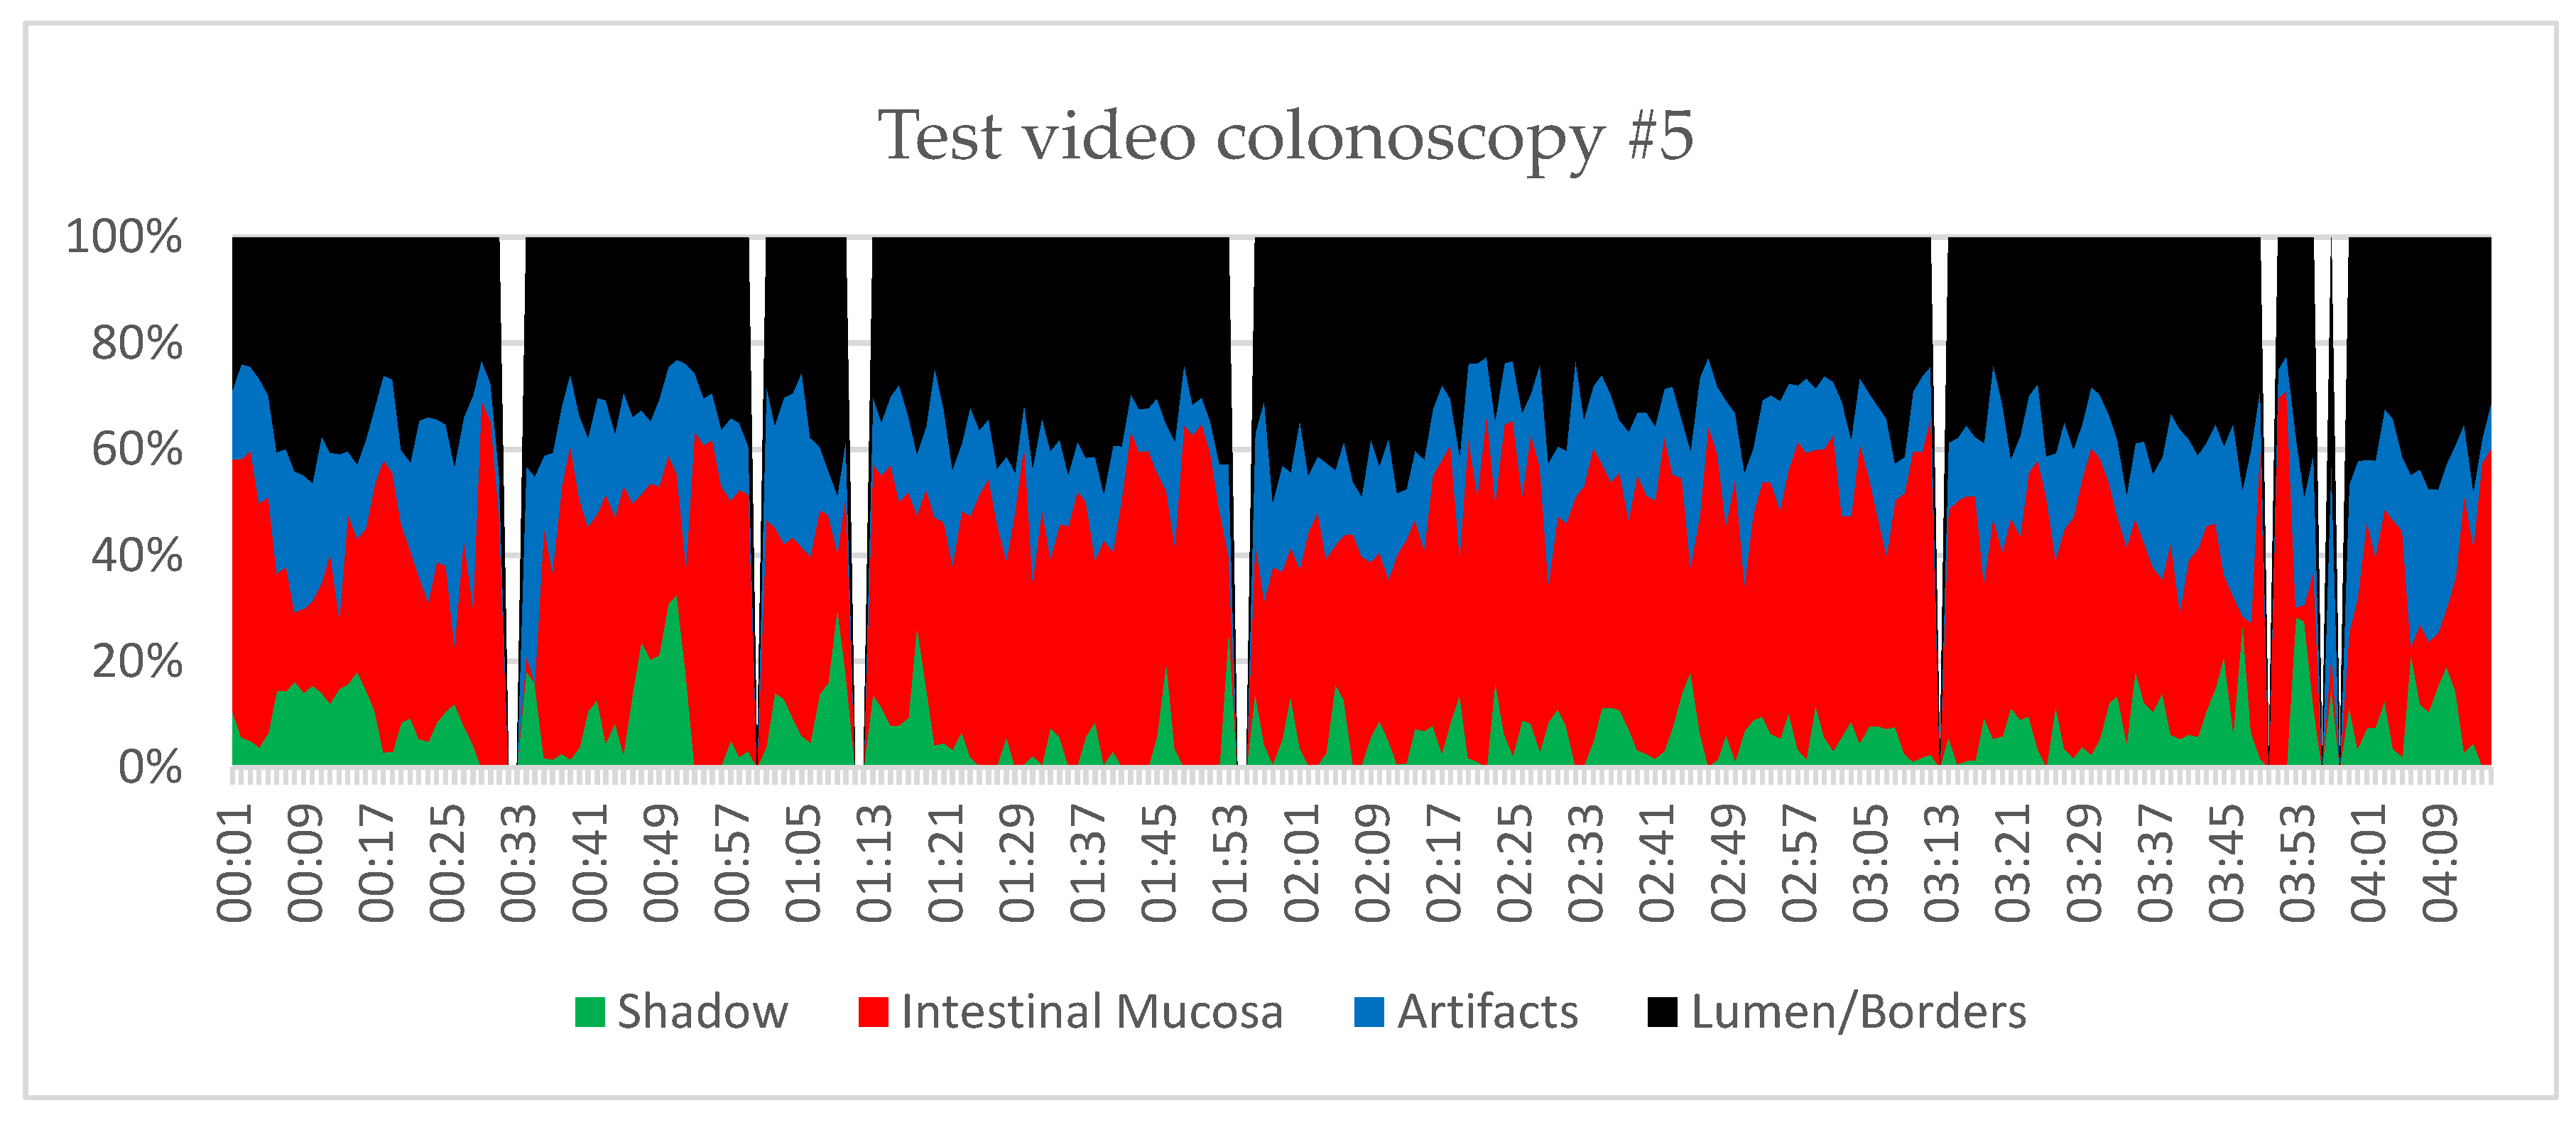
Figure 8.
The same plot as in Figure 7, after additionally excluding video seconds with more than 33% artefact pixels.
Figure 8.
The same plot as in Figure 7, after additionally excluding video seconds with more than 33% artefact pixels.
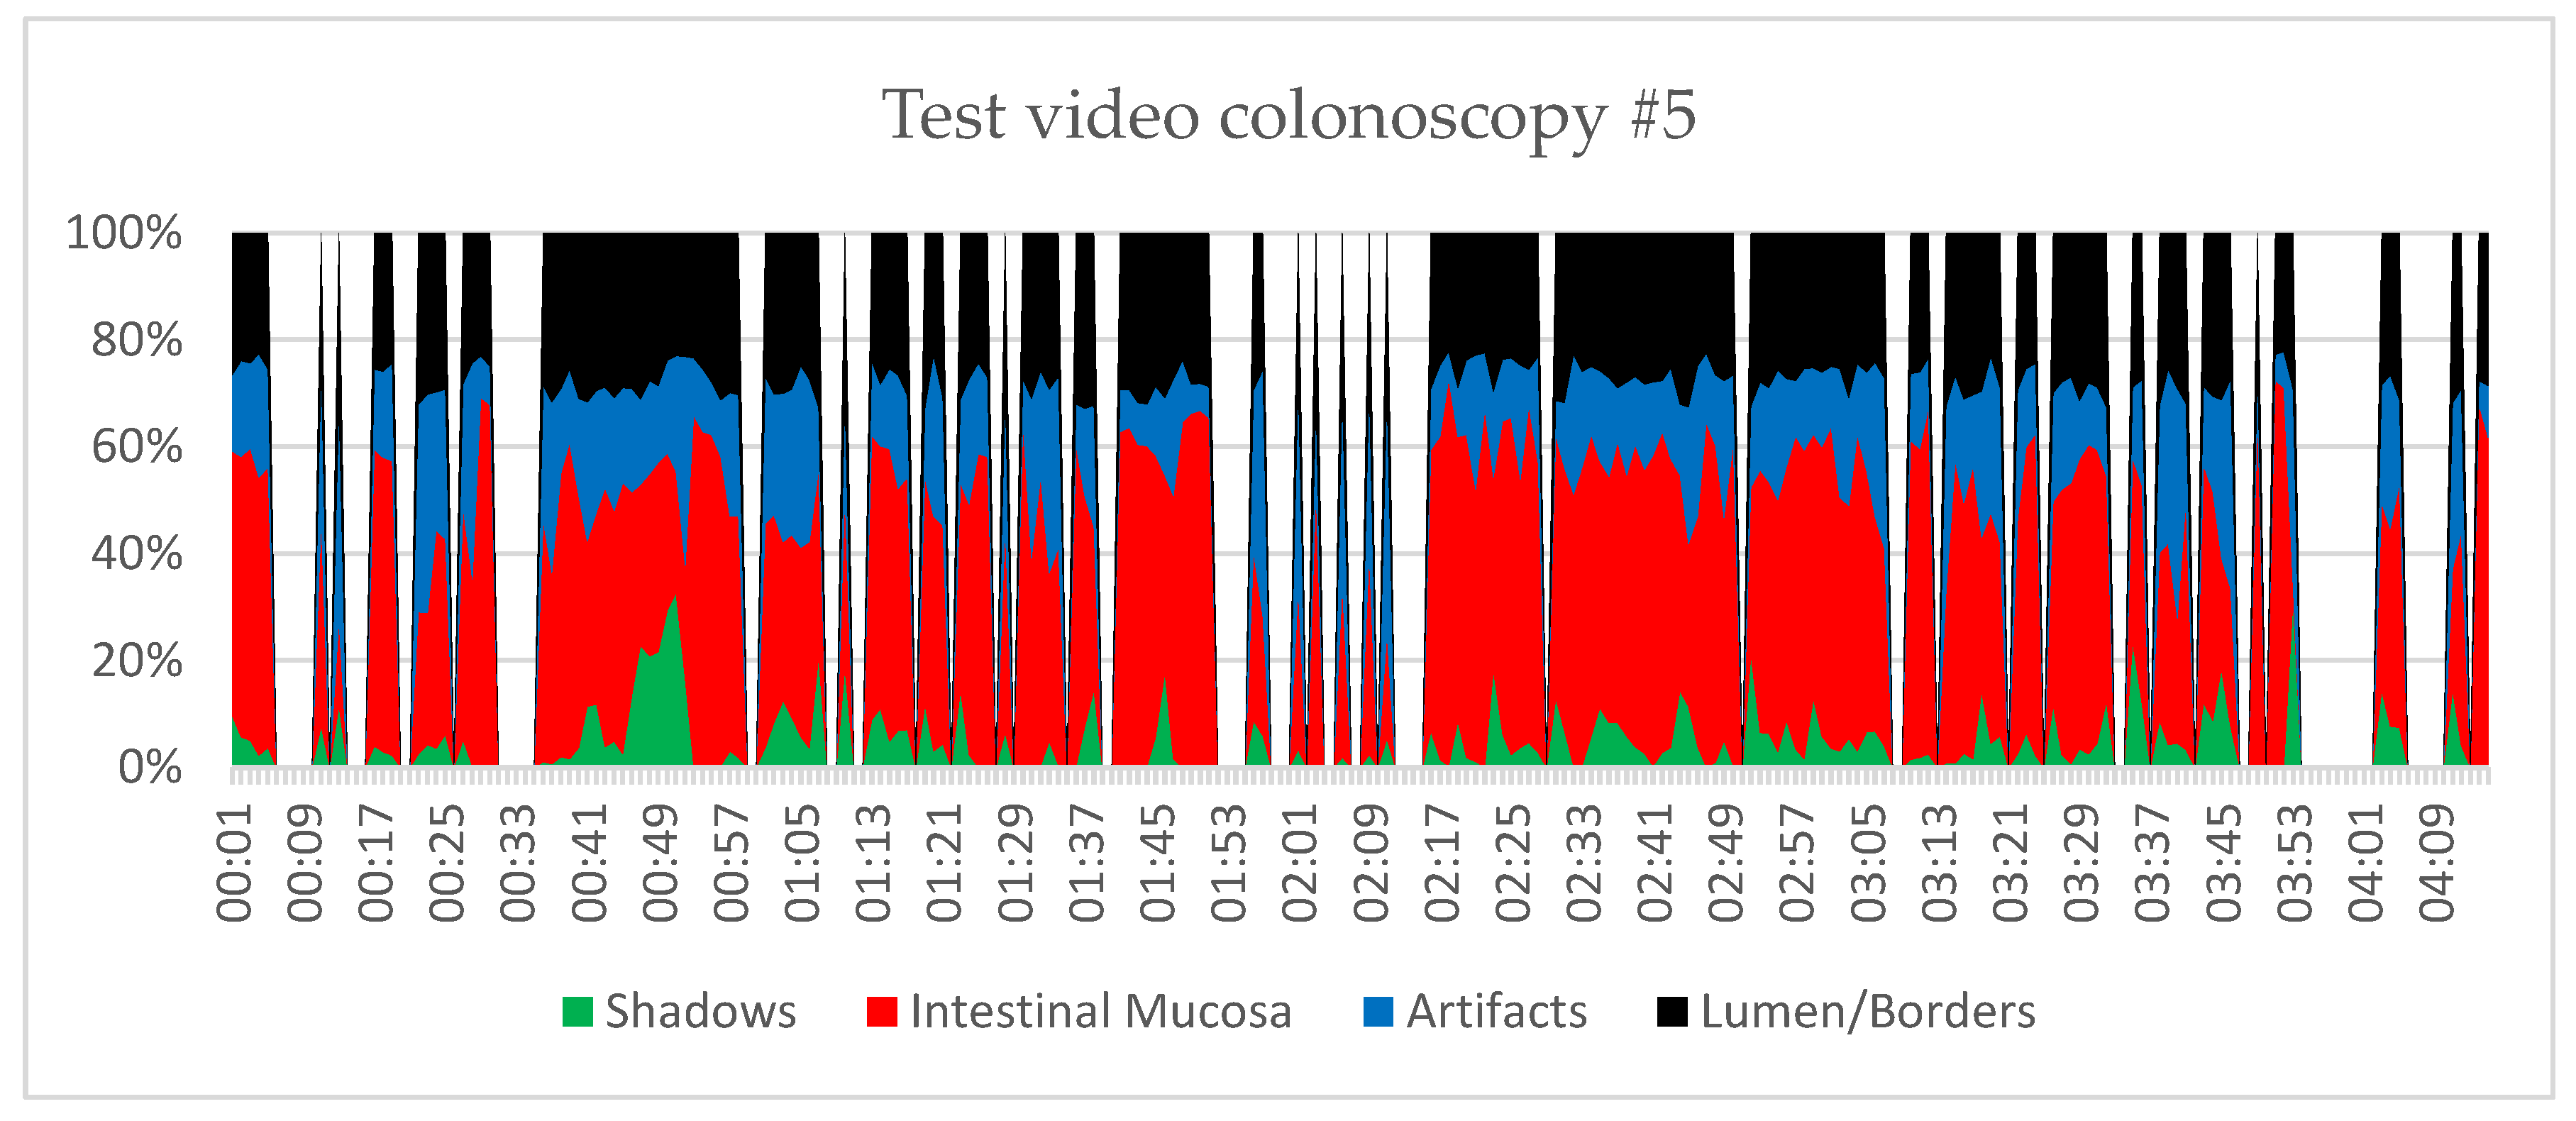
Figure 9.
The same plot as in Figure 8, after additionally excluding video seconds with less than 20% intestinal mucosa pixels.
Figure 9.
The same plot as in Figure 8, after additionally excluding video seconds with less than 20% intestinal mucosa pixels.
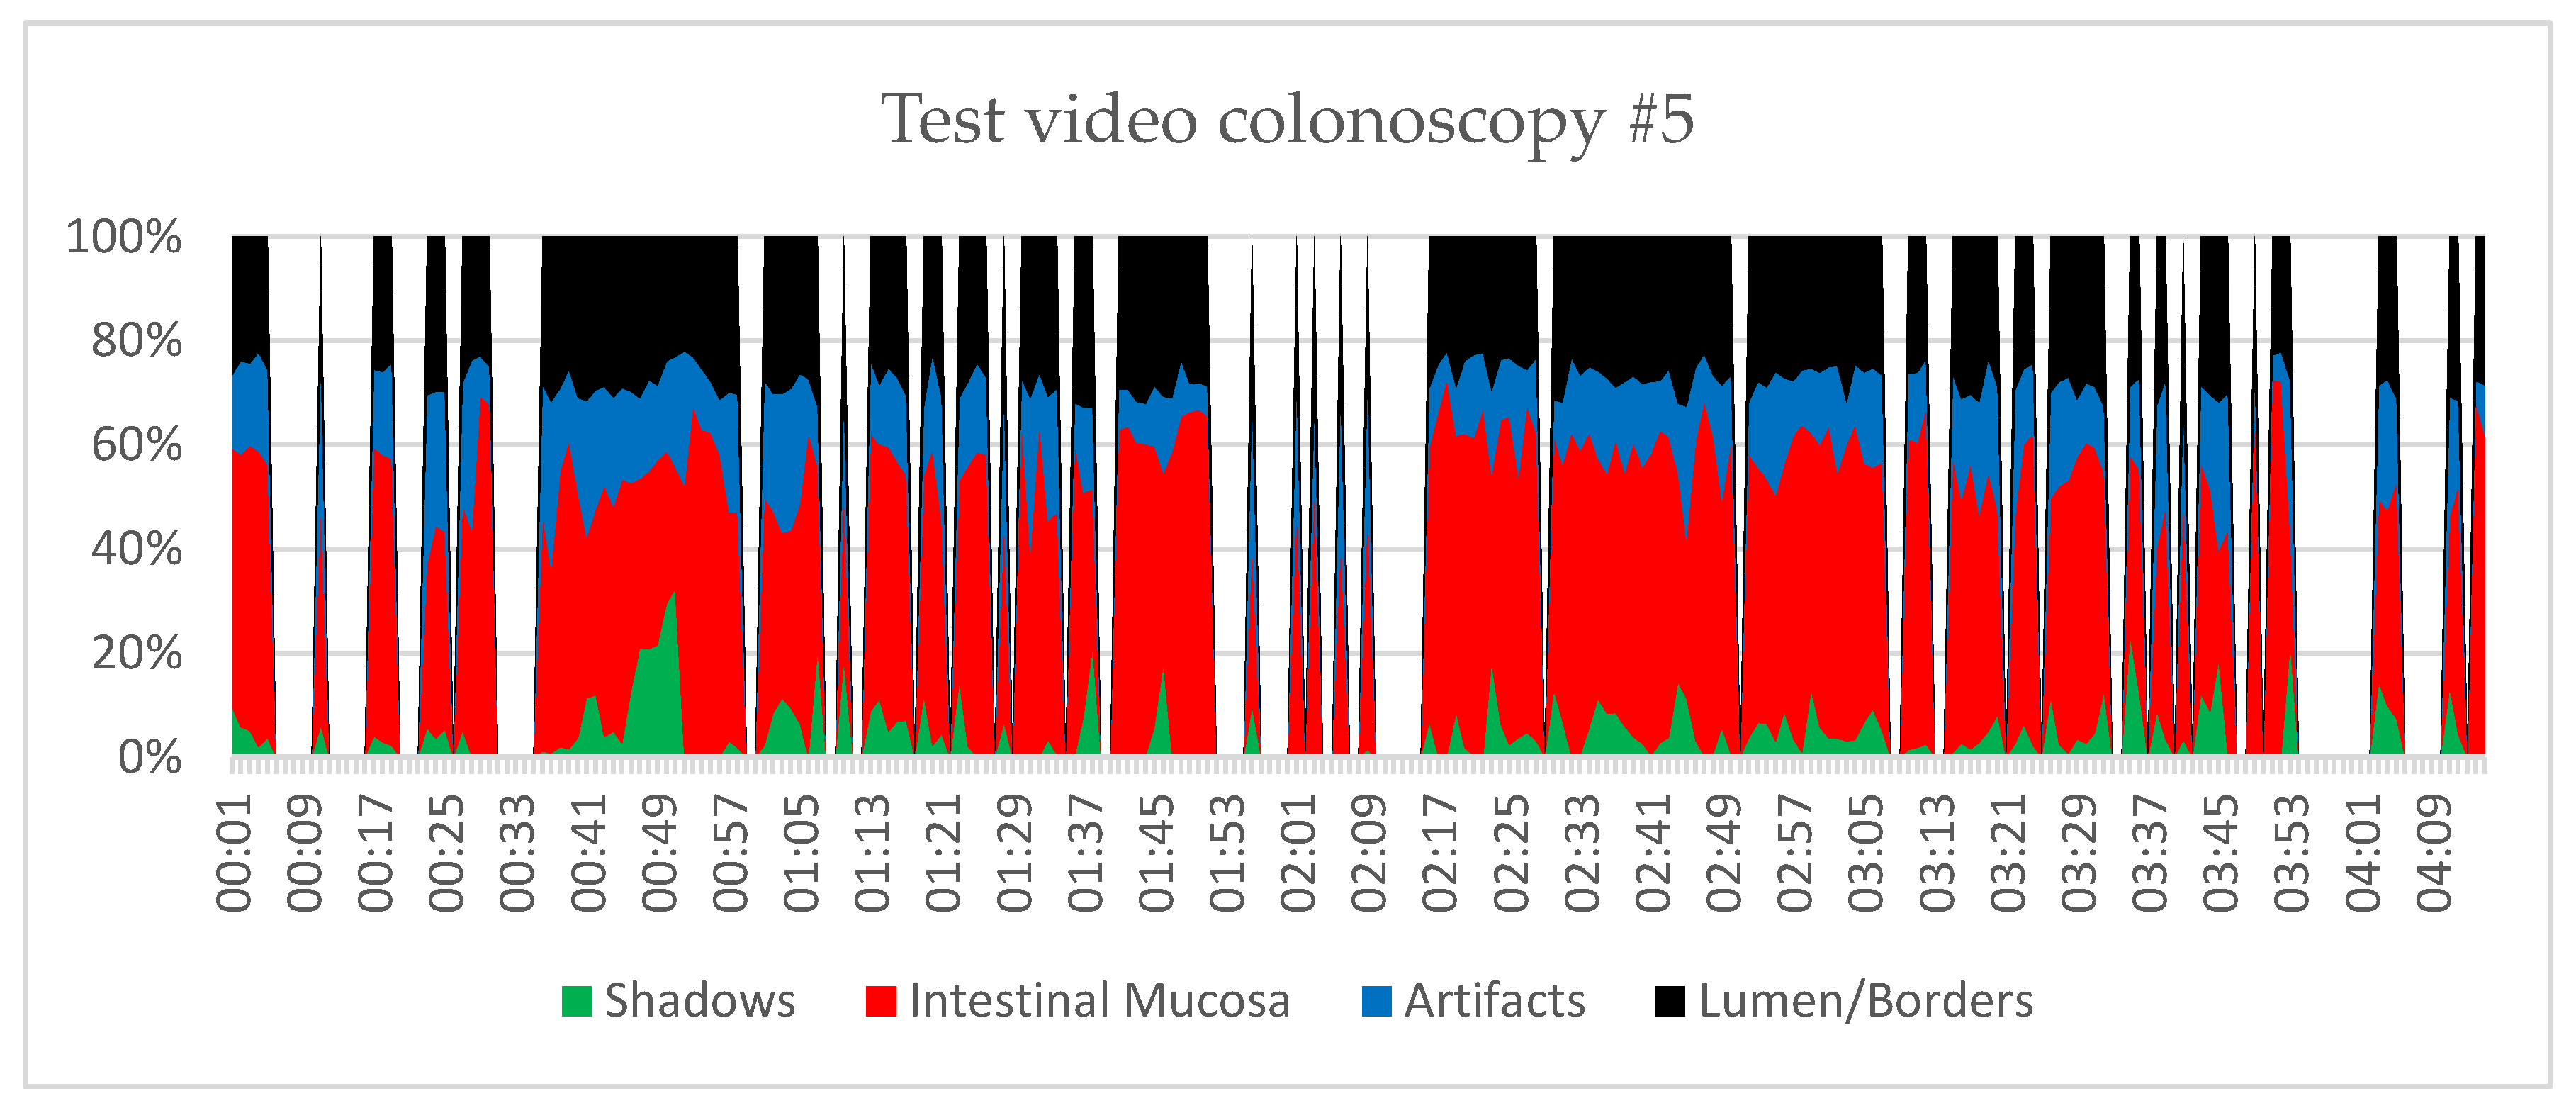
Figure 10.
The same plot as in Figure 9, after additionally excluding video seconds with less than 12% shadow pixels.
Figure 10.
The same plot as in Figure 9, after additionally excluding video seconds with less than 12% shadow pixels.
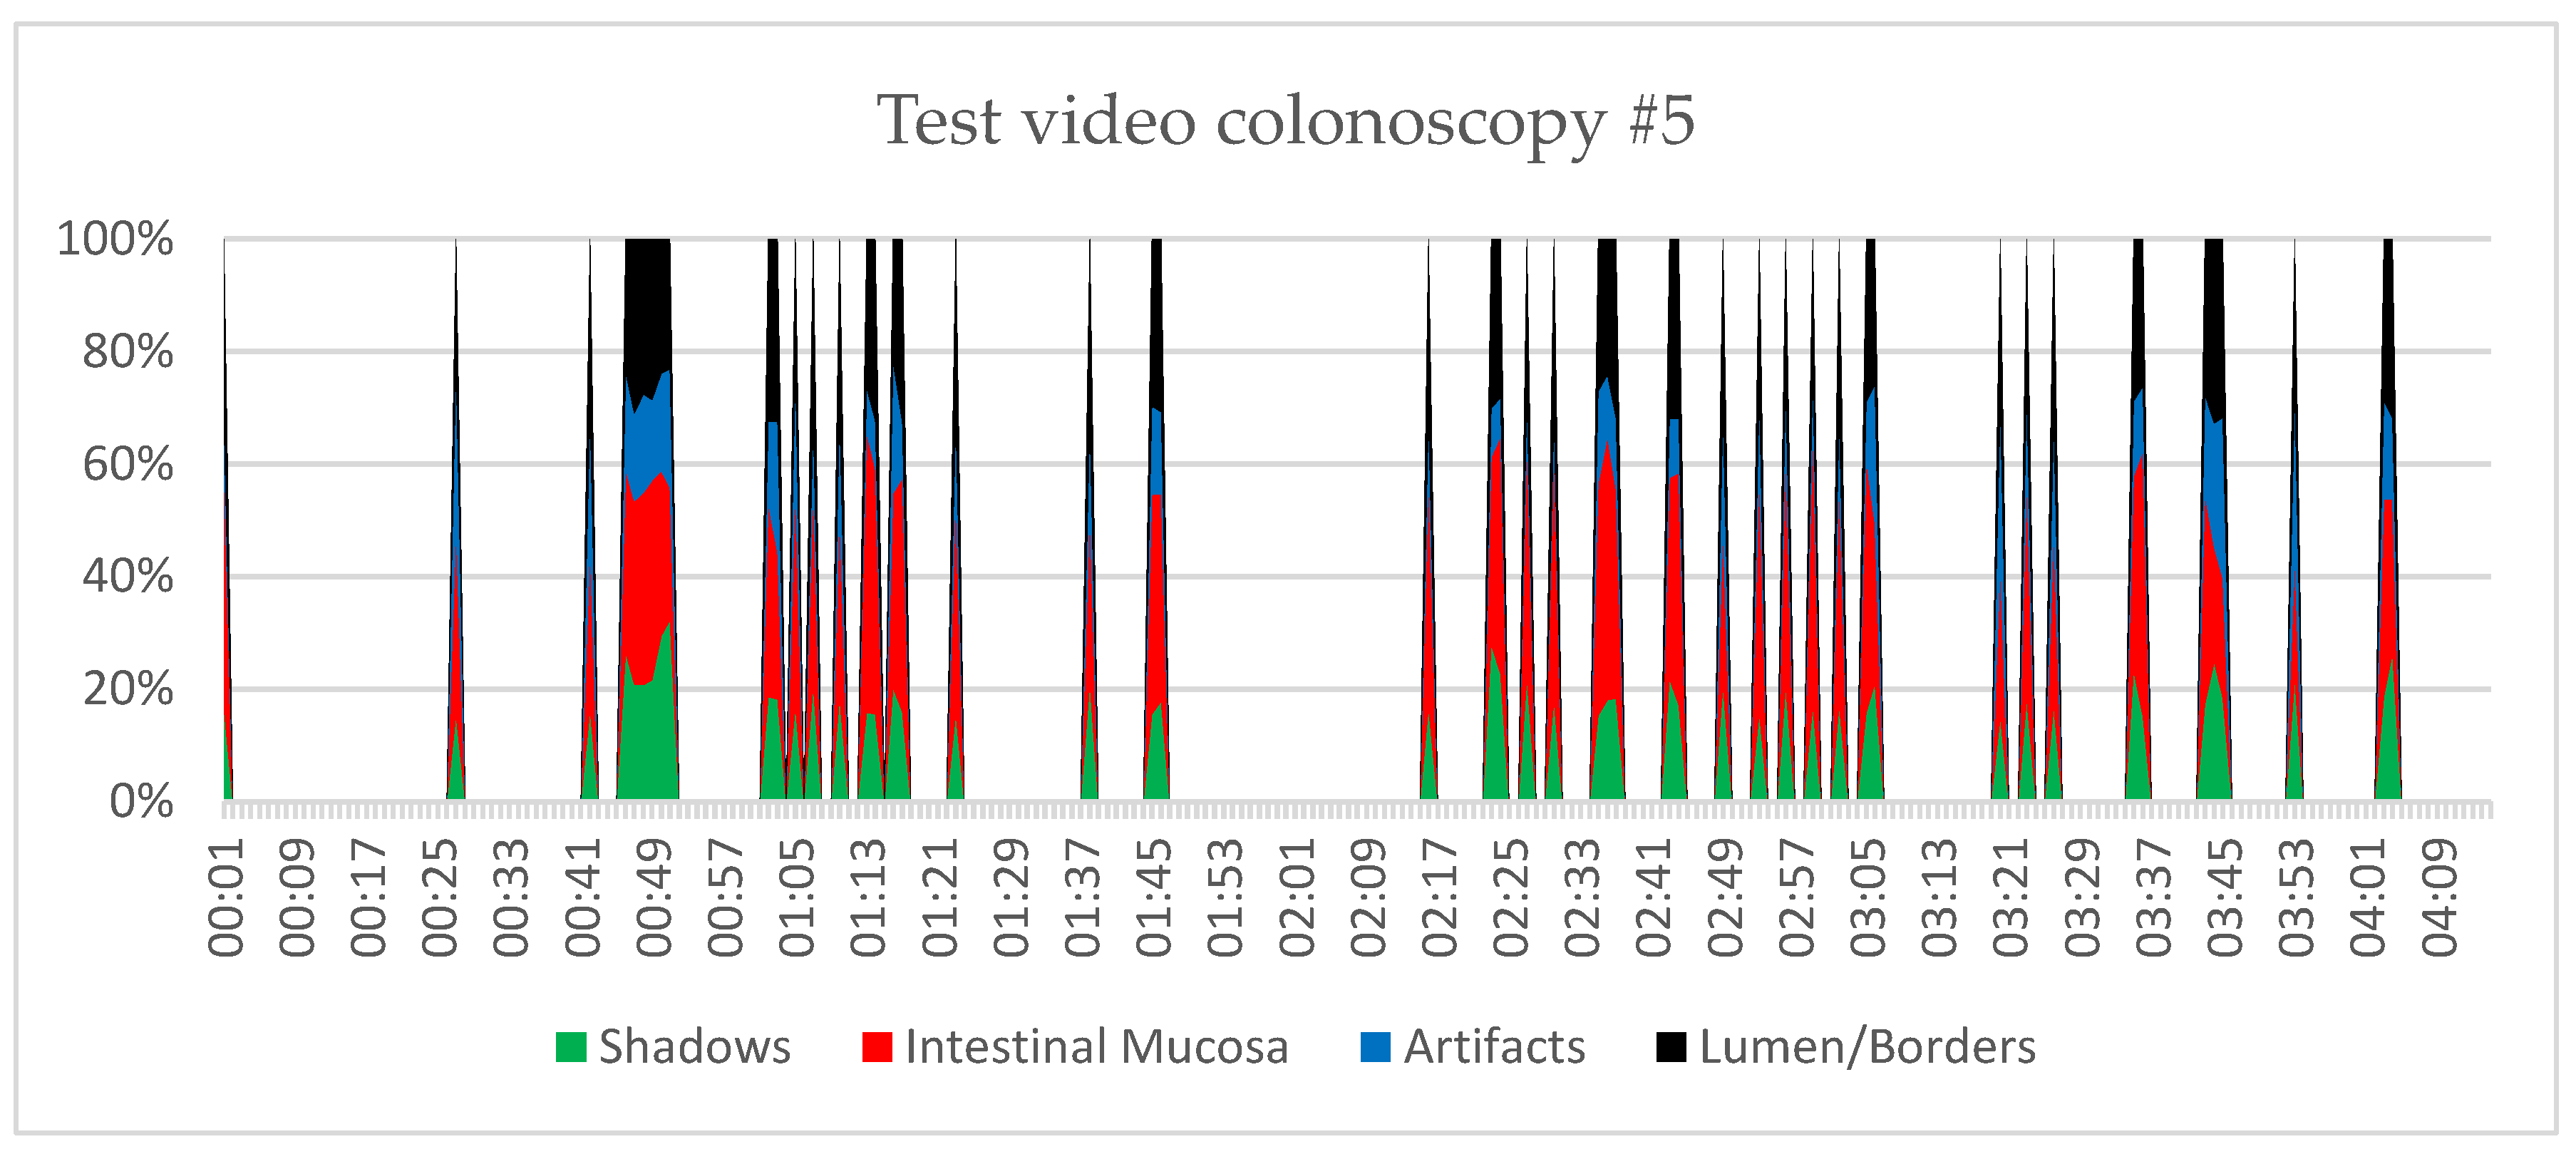
Figure 11.
Screenshots of test video colonoscopy #5 at second 49 (left) and at 1:03 (right), showing candidate shadow regions potentially related to the hepatic flexure.
Figure 11.
Screenshots of test video colonoscopy #5 at second 49 (left) and at 1:03 (right), showing candidate shadow regions potentially related to the hepatic flexure.
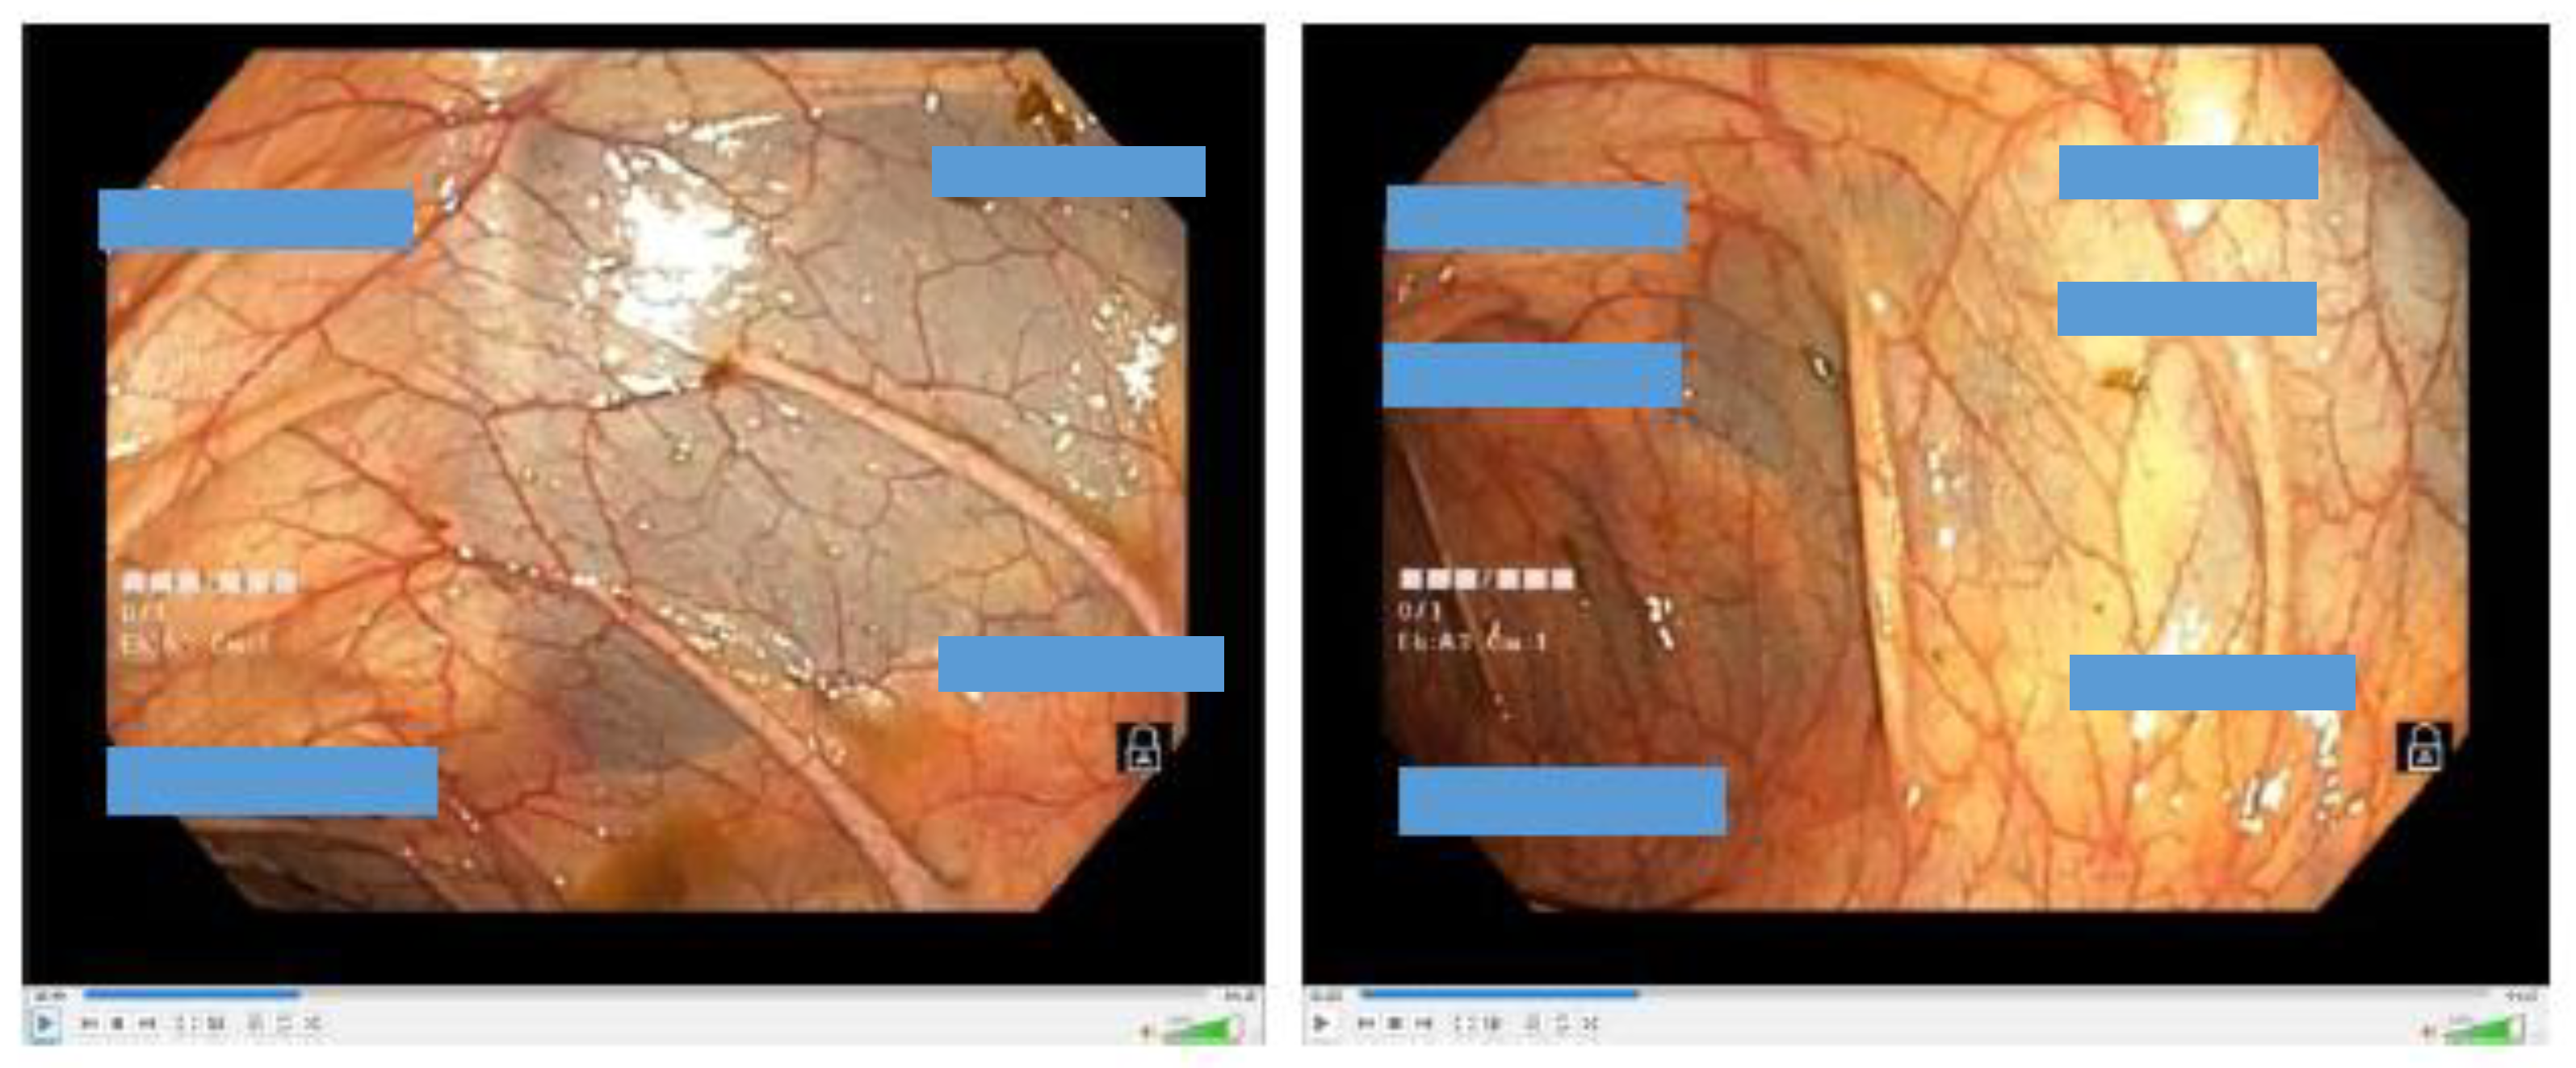
Figure 12.
Screenshots of test video colonoscopy #5 at 2:23 (left) and 2:35 (right), showing candidate shadow regions potentially related to the splenic flexure.
Figure 12.
Screenshots of test video colonoscopy #5 at 2:23 (left) and 2:35 (right), showing candidate shadow regions potentially related to the splenic flexure.
Disclaimer/Publisher’s Note: The statements, opinions and data contained in all publications are solely those of the individual author(s) and contributor(s) and not of MDPI and/or the editor(s). MDPI and/or the editor(s) disclaim responsibility for any injury to people or property resulting from any ideas, methods, instructions or products referred to in the content. |
© 2026 by the authors. Licensee MDPI, Basel, Switzerland. This article is an open access article distributed under the terms and conditions of the Creative Commons Attribution (CC BY) license (http://creativecommons.org/licenses/by/4.0/).
Copyright: This open access article is published under a Creative Commons CC BY 4.0 license, which permit the free download, distribution, and reuse, provided that the author and preprint are cited in any reuse.


