Submitted:
03 June 2026
Posted:
04 June 2026
You are already at the latest version
Abstract
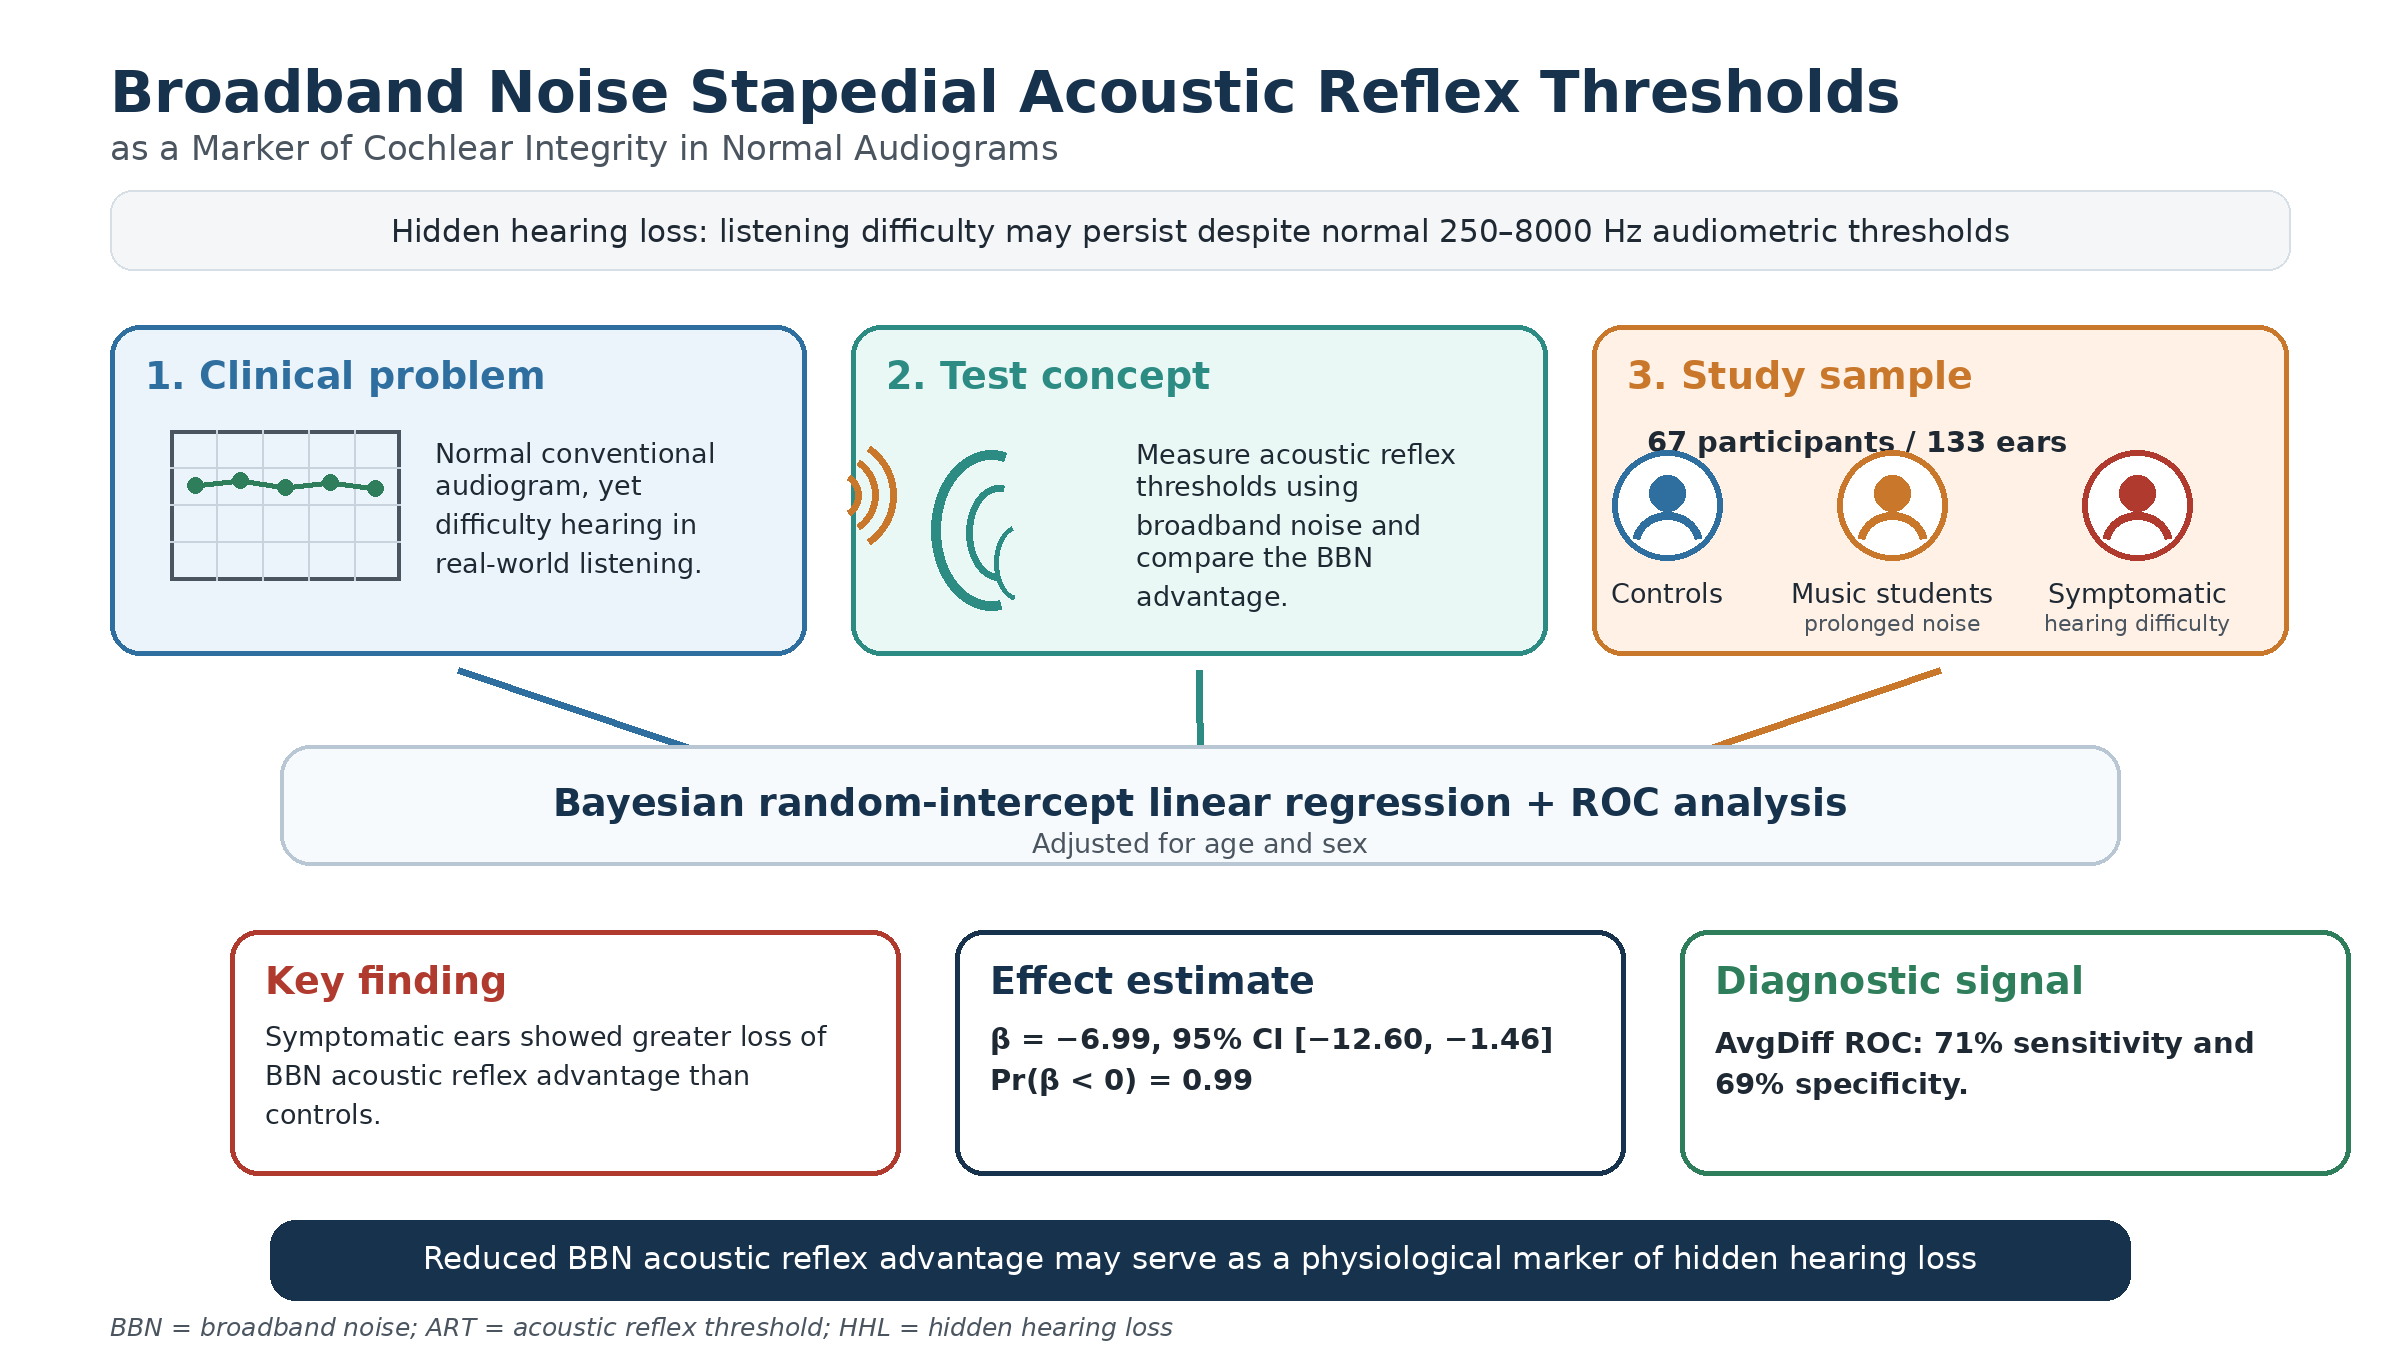
Background/Objectives: Hidden hearing loss (HHL) is defined as occurring when patients report difficulty processing auditory information despite having a normal audiogram at conventional frequencies (250-8000 Hz). Due to the lack of a standard physiological indicator for HHL, this study proposes a potential diagnostic method based on the broadband (BBN) advantage. We hypothesized that the BBN advantage is reduced in ears with underlying cochlear or auditory nerve dysfunction, despite having normal hearing thresholds at conventional frequencies of 250–8000 Hz. Methods: A Bayesian random-intercept linear regression model was employed to investigate this association. The primary outcome was the mean difference in acoustic reflex threshold (ART). The primary exposures were the three groups: normal controls (control), music students (exposed to prolonged noise), and the symptomatic group (participants who complained of difficulty hearing). Results: The sample included 67 participants and 133 ears. Comparisons suggested that symptomatic ears showed a greater loss of BBN acoustic reflex advantage than normal control ears (β = -6.99, 95% CI [-12.60, -1.46], Pr(β < 0) = 0.99) after adjusting for age and sex. ROC analysis reported that the AvgDiff had 71% sensitivity and 69% specificity. Conclusions: The hypothesis is supported, and this sheds light on the potential of using the loss of BBN acoustic reflex advantage as a potential physiological marker for HHL.
Keywords:
hidden hearing loss
; broadband noise acoustic reflex
; stapedial acoustic reflex threshold
; cochlear integrity
; normal hearing thresholds
; speech-in-noise difficulty
; Bayesian regression
1. Introduction
Hearing loss currently affects 18 percent of the population worldwide [1]. Cochlear synaptopathy, a condition commonly referred to as hidden hearing loss (HHL), is less common, impacting approximately 1 to 10 percent of patients in hearing clinics [2]. In audiology, HHL is defined as occurring when patients report difficulty processing auditory information despite having a normal audiogram [2,3]. The literature has proposed that hidden hearing loss may be a clinical indicator for predicting hearing loss later in life; however, this is a debated topic because there is mixed evidence supporting these hypotheses [2]. Despite this, HHL has important implications because hearing difficulties affect daily communication and cognitive function, and managing hidden hearing loss early may reduce the incidence of neurodegenerative disorders such as dementia [2,4,5].
Evidence from animal studies suggests that hidden hearing loss is likely caused by permanent damage to synapses between inner hair cells and afferent nerve fibers in the cochlea. Multiple factors, including noise exposure, drugs, and aging, can cause damage to synapses [2,5,6,7]. Although the synaptic loss mechanism has only been confirmed in rodent studies, prior literature suggests that damage in humans is more likely to occur at synapses connected to nerve fibers with a low spontaneous spike rate (low-SR). Conventional audiometric tests primarily assess high-spontaneous-rate (high-SR) fibers. For this reason, patients with hidden hearing loss typically present with normal audiograms despite underlying neural deficits [2,8]. Taken together, previous literature suggests that HHL is driven by synaptic dysfunction that is undetectable by standard audiograms, highlighting the importance of proposing a new diagnostic marker for HHL [2,5,6,7,8].
Recent studies have proposed that in both noise-exposed and aging populations, the synapses between inner hair cells and afferent nerve fibers are more vulnerable than hair cell damage, supporting the claim that hidden hearing loss may precede overt hearing loss, which is associated with hair cell damage and threshold elevation [7]. In mouse studies, both prolonged and short-term noise exposure have been shown to cause permanent synaptic damage, consistent with the current synaptic loss hypothesis in hidden hearing loss [7,9,10]. However, in human studies, the results remain inconsistent [9,11]. Studies have suggested that there is a non-significant association between noise exposure and HHL in humans and that lifelong exposure to noise was used to measure human noise exposure rather than short-term noise exposure measures in rodents [11,12]. Hence, this may suggest that aging adults with more lifelong exposure to loud noise are more vulnerable to synaptic damage than younger individuals [13].
Noise-induced hidden hearing loss may also cause a reduction in the strength of the acoustic stapedius reflex or middle-ear muscle reflex. The acoustic stapedius reflex is a protective mechanism that involves the involuntary contraction of the stapedius muscles to reduce the magnitude of moderate-to-high-intensity prolonged loud auditory signals transmitted to the inner ear [14,15]. Clinically, acoustic reflex thresholds (ART) are commonly used as part of the immittance test battery to support differential diagnosis of conductive, cochlear, retrocochlear, and facial nerve pathway disorders [16]. The average ART for pure-tone stimuli is approximately 20 dB higher than for broadband stimuli in normal-hearing participants. This difference is known as the acoustic reflex noise-tone difference (NTD) or broadband acoustic reflex advantage (BBN advantage) [17,18].
Past literature has reported that in older populations with hearing loss, both pure-tone stimuli and broadband (BBN) ART are elevated in proportion to the degree of hearing loss, with BBN ART increasing more steeply. Since the BBN advantage is calculated by the difference between pure tone and broadband ART, as broadband ART is elevated, the BBN advantage is reduced in conventional sensorineural hearing loss [19,20]. In summary, past research in the 1980s has examined the relationship between hearing loss and loss of the BBN advantage [19,20,21]. However, HHL is an emerging concept, and it remains unclear whether the reduction in BBN advantage observed in conventional sensorineural hearing loss also occurs in individuals with HHL despite normal hearing thresholds at conventional audiometry. Furthermore, it is unknown whether the loss of the BBN advantage could serve as a potential physiological marker for HHL. Therefore, this study aims to investigate differences in ART use in the HHL population.
To address this gap, this study examines differences in ART across three groups: normal control students, music students with high noise exposure, and a symptomatic group reporting hearing difficulties despite normal audiograms. Furthermore, we hypothesized that ears with presumed cochlear or auditory nerve dysfunction would exhibit a reduced BBN acoustic reflex threshold advantage compared with normal-hearing control ears, despite having normal conventional frequencies of 250 – 8000 Hz, since the vulnerability to synaptic damage increases with aging and prolonged noise exposure [13]. We expected that symptomatic ears (with the greatest cumulative age and prolonged noise exposure) would exhibit the highest BBN acoustic reflex threshold advantage loss, music student ears (exposed to prolonged noise through playing music) would have an intermediate BBN advantage loss, and normal control ears would preserve the BBN advantage. This study provides preliminary evidence supporting the use of loss of BBN acoustic reflex advantage as a potential physiological marker for HHL.
2. Materials and Methods
2.1. Participants
Participants were recruited from UBC and auditory clinics in the Greater Vancouver region in the Hidden Hearing Loss (HHL) study (n = 74 participants, n = 146 ears). The study procedures received ethics approval as part of an HHL project in the UBC Middle Ear Lab. The inclusion criteria of the HHL study were normal hearing thresholds of 25 dB HL or better with no air-bone gap at the conventional audiometric frequencies of 250 to 8000 Hz; normal middle ear function as assessed by wideband acoustic immittance (WAI), presence of robust otoacoustic emission (OAE), and acoustic stapedial reflex; and willingness to provide informed consent. The original dataset included 146 ear-level observations from 74 participants. Thirteen ear-level observations were excluded because of missing values in variables required for analysis, including the primary outcome AvgDiff, stimulus-specific difference measures (500Diff and/or 2000Diff), or sex. The final analytic sample, therefore, included 133 ears from 67 participants.
These participants were categorized into three groups according to their past noise exposure and clinical symptoms: 1) UBC normal-hearing students (Control students) who served as the control group and self-reported without prolonged musical exposure (n = 15 participants, n = 30 ears, mean age 22.6 yrs with an age range of 18-28); 2) UBC music students (Music students), students in the music major with prolonged loud noise exposure (n = 11 participants, n = 22 ears, mean age 22.5 yrs with an age range of 19-27); and 3) symptomatic patients (Symptomatic) who self-reported hearing difficulties understanding speech in noisy environments despite a normal audiogram result (n = 41 participants, n = 81 ears, mean age 44.2 yrs with an age range of 22-70). The operationalized definition of symptomatic patients matches the current definition of HHL [2,3]. All participants had a normal audiogram at conventional frequencies. These participants were referred to the Middle Ear Lab.
2.2. Data Collection
Data were recorded in the Middle Ear Lab from 2017 to 2019, and the data extraction and statistical analyses were conducted between 2025 and 2026. All participants first underwent a hearing screening. Firstly, a Welch Allyn otoscope was used to perform otoscopy and assess for occluding cerumen or other abnormalities in the ear canal. Lifetime noise exposure was estimated using the Noise Exposure Structured Interview (NESI). The automatic and adaptive Bekesy method (with pulsed tones in 1 dB steps) was used to obtain pure-tone thresholds at conventional (250-8000 Hz) and extended high-frequency (9-16 kHz) ranges using HDA-200 circumaural headphones connected to an Otometrics Astera audiometer. The audiometer was calibrated annually by a certified technician.
Middle ear status as well as OAEs (DPOAE and TEOAE) were conducted with an Interacoustics Titan (software suite version 3.4.1) connected to a Windows computer running Interacoustics Otoaccess database software version V.121, before acoustic reflex testing. The system was calibrated before testing participants. Only participants demonstrating a normal wideband absorbance pattern with the presence of the acoustic stapedial reflex, present otoacoustic emissions (at least 3/5 TEOAEs and 4000 Hz DPOAE and TEOAE), and normal 226 Hz tympanometry within established normative ranges were included, thereby minimizing the influence of middle ear pathology on acoustic reflex threshold measurements. Acoustic reflex testing was performed for both left and right ears using automated threshold estimation with a 0.02 mmho criterion change from baseline. Participants’ demographic information, including age, ethnicity, and sex, was collected along with the acoustic reflex threshold.
2.3. Primary Outcome
The dependent variable is the acoustic reflex threshold (ART) difference (in dB HL) between pure tone and broadband stimuli. ART was recorded by identifying an admittance change of> 0.02 mmho in response to pure-tone stimuli at 500 and 2000 Hz or to broadband noise (BBN) [22]. Three types of ART differences were employed: the 500 Hz difference (500Diff), the 2000 Hz difference (2000Diff), and the Avg difference (AvgDiff). The AvgDiff was treated as the primary outcome, while the two stimulus-specific outcomes were also examined. The AvgDiff was then calculated using Equation 1. Both 500Diff and 2000Diff were calculated using Equation 2. According to Equations 1 and 2, a positive AvgDiff indicates that the BBN ART was lower than the pure-tone ART, defining a preserved BBN advantage, while a value near zero or below zero indicates attenuation or loss of the expected BBN advantage.
Equation 1. Calculation of Avg difference between pure tone stimulus and broadband noise
Equation 2. Calculation of 500Diff or 2000Diff between pure tone stimulus and broadband noise
The key independent variable comprised the three study groups: normal control, music students, and symptomatic group. Hence, the group effect would be examined. Additionally, covariates included age ( and sex (female or male).
2.4. Statistical Analysis
The ART results and group information in the HHL dataset were extracted and filtered between October and November 2025. The data were analyzed between January and April 2026 using descriptive and regression analyses. Descriptive statistics were used to create a demographic table summarizing baseline characteristics of participants’ ears. AvgDiff (dB HL) was summarized using the mean and standard deviation (SD) because it is a continuous and approximately normally distributed variable.
A Bayesian random-intercept linear regression model was used because it provides posterior distributions for each model parameter, allowing interpretation of the probability and accounting for participant-level effects. A Bayesian approach was used because it allows direct estimation of the probability, magnitude, and uncertainty of group differences in the BBN acoustic reflex advantage [23,24]. This was particularly appropriate given the modest sample size, the correlated ear-level structure of the data, and the clinical interest in estimating whether symptomatic ears show a reduction in BBN advantage rather than relying solely on dichotomous frequentist p-values. For example, the Bayesian model allowed us to estimate a 99.3% probability that symptomatic ears had a lower BBN advantage than normal controls, while accounting for age, sex, and the fact that some participants contributed data from both ears.
The primary outcome was the AvgDiff. The group effect estimated how much higher or lower AvgDiff was in one group compared to the others. To account for the correlation between ears from the same participant, a participant-level random intercept was included. The study group was entered as a categorical predictor, with normal controls as the reference group. Posterior distributions were estimated for all model parameters. Posterior means, 95% credible intervals, and posterior probabilities were calculated from the model’s posterior. Weakly informative priors were used for regression coefficients as they were intentionally broad and unlikely to force the results in a particular direction, and variance parameters were estimated from the data. The Bayesian model was implemented in Python using custom Markov chain Monte Carlo sampling [25,26].
Receiver operating characteristic (ROC) analysis was also performed to evaluate the discriminative ability of the BBN advantage measures in identifying symptomatic ears. Symptomatic ears were classified as the positive condition, and normal control and music student ears were classified as the comparison condition. ROC curves were generated for AvgDiff, 500Diff, and 2000Diff, with lower values indicating a reduced BBN advantage and therefore a greater likelihood of symptomatic status. Model performance was summarized using the area under the curve. The threshold that maximized Youden’s index was selected as the optimal cutoff, and sensitivity and specificity were calculated at that threshold. Julius AI, version 1.2 Max, was used to assist with statistical coding, exploratory data analysis, Bayesian model implementation, visualization, and drafting of statistical methods/results language. All analyses, outputs, interpretations, and manuscript text were reviewed and verified by the authors, who take full responsibility for the accuracy and integrity of the work. Julius AI was not used as an author and does not meet authorship criteria [25,26].
3. Results
3.1. Participant Characteristics
A total of 133 ears from 67 participants were included in the analysis. The ears were categorized into three groups: normal control, music students, and symptomatic, and the specific descriptive statistics are shown in Table 1. Specifically, Table 1 shows that the normal control ears had the largest positive mean AvgDiff, music student ears were intermediate, and symptomatic ears had the lowest mean AvgDiff, close to zero. On average, normal control ears preserved the expected BBN advantage; music student ears showed a reduced BBN advantage; and symptomatic ears nearly lost it. Figure 1 shows the box-and-whisker plots of the average difference between BBN ART and pure tone ARTs by group. Each point in this figure represents one ear.
3.2. Group Differences in BBN Advantage
Contrasts were estimated from the posterior of the regression model to examine whether AvgDiff differed across groups, adjusting for age, sex, and participant-level clustering. Table 2 reports the posterior mean. , 95% credible interval, and posterior probability for each comparison. Symptomatic ears had a 6.99 dB AvgDiff lower than normal control ears ( = -6.99, 95% CI [-12.60, -1.46], Pr( < 0) = 0.99), indicating there was 99.3% posterior probability that symptomatic ears had a lower BBN advantage than normal control ears. Music student ears also had a 3.78 dB AvgDiff lower than normal control ears, but the credible interval included both positive and negative values ( = -3.78, 95% CI [-9.27, 1.50], Pr( < 0) = 0.92), indicating a possible reduction in the BBN advantage among music students, but with greater uncertainty about the sign of the difference. The symptomatic group had a 3.22 dB AvgDiff lower than the music student group, but the sign of this difference was uncertain ( = -3.22, 95% CI [-9.11, 3.05], Pr( < 0) = 0.86) (Table 2).
Density plots of the marginal posterior distributions for the adjusted group contrasts are shown in Figure 2. The symptomatic-versus-normal control comparison was mostly centered below zero, indicating strong evidence of a reduction in AvgDiff, indicating a loss of BBN advantage in symptomatic ears. The music student vs. normal control and symptomatic versus music student distributions also showed negative posterior means. However, as the distributions overlapped more with zero, the results were less certain (Figure 2).
3.3. Stimulus-Specific Analysis of BBN Advantage
Stimulus-specific analyses were conducted using 500Diff and 2000Diff as outcomes to examine whether 500Diff and 2000Diff differed across groups. Symptomatic ears had a substantially lower 2000Diff than normal control ears ( = -6.32, 95% CI [-9.67, -2.93], Pr( < 0) 1.00). For 500Diff, symptomatic ears also had a lower BBN advantage than normal control ears ( = -3.66, 95% CI [-7.64, 0.40], Pr( < 0) = 0.96); however, the result was less certain as the 95% credible interval slightly crossed zero (Table 3). Overall, similar results were observed across the three outcome metrics, with the strongest evidence of reduced BBN advantage for AvgDiff and 2000Diff (Figure 3).
3.4. Test Performance Analysis
A Receiver Operating Characteristic (ROC) curve was plotted in Figure 4 to identify symptomatic ears and to assess the clinical relevance of the primary analysis result and whether AvgDiff was the best model compared with 500Diff or 2000Diff. AvgDiff, 500Diff, and 2000Diff all demonstrated discrimination above chance level (AUC > 0.5), with AvgDiff showing the strongest discriminative performance (Figure 4). Specifically, the discriminative ability was as follows: AvgDiff (AUC = 0.70, best threshold <= 0), which outperformed both 500Diff (AUC = 0.62, best threshold <= 5) and 2000Diff (AUC = 0.68, best threshold <= 5) (Figure 4). The AvgDiff model showed a sensitivity of 71% and a specificity of 69%. Sensitivity is the proportion of symptomatic ears correctly identified by the model (71%), and specificity is the proportion of non-symptomatic ears correctly identified by the model (69%) (Figure 4).
4. Discussion
In this cross-sectional study, a Bayesian random-intercept linear regression model showed that symptomatic ears had a lower AvgDiff than normal control ears, indicating a reduced BBN acoustic reflex advantage in the symptomatic group. Similar findings were observed in stimulus-specific analyses. ROC analysis revealed a sensitivity of 71% and a specificity of 69% for AvgDiff, suggesting that the acoustic reflex may serve as a meaningful, simple physiological marker of HHL.
4.1. Descriptive Patterns of BBN Advantage Across Groups
The descriptive statistics indicated that the mean AvgDiff was highest for normal control ears, intermediate in music student ears, and lowest in symptomatic ears. This suggests that the mean AvgDiff results are consistent with the hypothesis, as the BBN advantage was preserved in normal control ears, reduced in music student ears, and nearly lost in symptomatic ears. The results also align with past research in hearing loss, indicating that the ART difference is expected to be diminished in groups with prolonged noise exposure but not in the normal hearing population [19,20].
4.2. Evidence of Reduced BBN Advantage in Symptomatic Ears
Group comparisons suggested a 99.3% posterior probability that symptomatic ears had a lower AvgDiff than normal control ears. Music student ears also had a lower AvgDiff than normal control ears, and symptomatic ears had a lower AvgDiff than music student ears, though these comparisons were less certain. The posterior distributions plot further demonstrated this result by showing that the comparison between the symptomatic and normal control groups was almost entirely below zero. In contrast, the other comparisons overlapped more with zero.
These findings strongly suggested a loss of BBN advantage in symptomatic ears, as pure-tone ARTs exceeded BBN thresholds in the normal-hearing population, thereby demonstrating a BBN advantage. Therefore, a loss of BBN advantage may indicate potential cochlear or auditory nerve dysfunction, including damage to the synapses between inner hair cells and afferent nerve fibers, as the pure-tone thresholds become similar to or lower than BBN thresholds [2,7,19,20], consistent with our proposed hypothesis.
The loss of BBN advantage was greater in symptomatic ears than in music student ears and greater in music student ears than in normal control ears. These results aligned with the hypothesis that symptomatic ears had the greatest loss of BBN advantage, followed by music student ears, while control ears preserved the BBN advantage. This ordering is biologically plausible because the BBN advantage depends on broad cochlear and auditory neural input, which may be reduced by diffuse cochlear or auditory neural injury. Previous literature has suggested that the combination of aging and noise exposure makes an individual more vulnerable to synaptic damage. Additionally, compared with normal control students, music students had been exposed to music; hence, it was expected that music students would have a greater loss of BBN advantage than normal controls. Age was included as a covariate in the Bayesian model, and the posterior estimate for age itself was small and uncertain. Nevertheless, because age differed markedly between groups, residual confounding by age or age-related auditory factors cannot be fully excluded. Additionally, the smaller normal control and music student groups contributed to wider posterior uncertainty for these comparisons. sons. [27].
4.3. Stimulus-Specific Analyses Support the Primary Result
Stimulus-specific analyses using 500Diff and 2000Diff further supported the AvgDiff result, as symptomatic ears consistently showed a greater loss of BBN advantage than normal control ears. The 2000Diff and AvgDiff metrics suggested a more certain result than the 500Diff metric. The more certain result for 2000Diff may be explained by the greater vulnerability of higher-frequency cochlear regions, such as 2000 Hz compared with 500 Hz. Hence, the loss of the BBN advantage may be more obvious. The more certain result for AvgDiff may be explained by the advantage of averaging, as it considers all data points. Therefore, it provided the most certain and comprehensive measure by considering both pure tone thresholds and BBN. The stimulus-specific analyses further strengthened the hypothesis. s.
4.4. AvgDiff as a Potential Physiological Marker of HHL
ROC analysis showed that AvgDiff was the best model for identifying symptomatic ears in the clinic compared with 2000Diff or 500Diff, with a sensitivity of 71% and a specificity of 69%. This indicates that the AvgDiff model can correctly identify symptomatic ears 71% of the time and normal control ears 69% of the time. The potential physiologic marker of AvgDiff, in terms of specificity and sensitivity, has not been evaluated in the prior literature for this purpose; hence, this may represent a novel application.
Additionally, the operational definition of the symptomatic group used to define HHL in this study is defined as complaints of hearing difficulties despite a normal audiogram [2]. The findings were consistent with the descriptive statistics, group comparisons, and stimulus-specific analyses, which showed a loss of BBN advantage in symptomatic ears compared to normal control ears. Therefore, these findings suggest that a loss of BBN advantage may serve as a simple physiologic marker of HHL, and this study is among the first to evaluate this marker in relation to HHL. Given the moderate discriminative ability, further studies are suggested to validate this physiologic marker. Although this study shed light on HHL research, the findings are not sufficiently strong to support its use as a stand-alone diagnostic test in clinical practice.
4.5. Limitations and Future Studies
Several limitations affected this study. First, the small sample sizes of music students and normal controls resulted in relatively wide uncertainty intervals, and future studies may benefit from larger samples. Second, this study was cross-sectional; a longitudinal study tracking participants from initial to prolonged exposure over a few years may provide greater statistical power to detect group effects. Lastly, this study assumed that the observed ART differences were driven by synaptic damage; however, this assumption is based on rodent studies, and the neural pathways and mechanisms in humans are more complex. Most importantly, the AUC analysis should be validated with longitudinal and larger-sample data before clinical application. A possible future research question is whether the music student group represents an early-stage or at-risk group for HHL, given the intermediate loss of BBN observed in this study.
5. Conclusions
A lower AvgDiff and a loss of the BBN acoustic reflex advantage were observed in symptomatic ears compared with normal control ears, and stimulus-specific analyses using 500Diff and 2000Diff further supported these findings. ROC analysis revealed a sensitivity of 71% and a specificity of 69% for AvgDiff, suggesting the potential of AvgDiff as a physiological marker for subtle, diffuse cochlear or auditory neural dysfunction not fully captured by conventional pure-tone audiometry in the clinic. Further validation is needed to confirm these findings.
References
- Wilson, B.S.; et al. A Lancet Commission to address the global burden of hearing loss. The Lancet 2019, 393(10186), 2106–2108. [Google Scholar] [CrossRef] [PubMed]
- Liu, J., J. Stohl, and T. Overath, Hidden hearing loss: Fifteen years at a glance. Hear Res, 2024. 443: p. 108967. [CrossRef]
- C. Kohrman, D.; et al. Hidden hearing loss: a disorder with multiple etiologies and mechanisms. Cold Spring Harb. Perspect. Med. 2020, 10(1), a035493. [Google Scholar] [CrossRef]
- Valderrama, J.T.; de la Torre, A.; McAlpine, D. The hunt for hidden hearing loss in humans: From preclinical studies to effective interventions. Front Neurosci. 2022, 16, 1000304. [Google Scholar] [CrossRef]
- D, C.K.; et al. Hidden Hearing Loss: A Disorder with Multiple Etiologies and Mechanisms. Cold Spring Harb. Perspect. Med. 2020, 10(1). [Google Scholar]
- Bramhall, N.; et al. The search for noise-induced cochlear synaptopathy in humans: Mission impossible? Hear. Res. 2019, 377, 88–103. [Google Scholar] [CrossRef]
- Kujawa, S.G.; Liberman, M.C. Synaptopathy in the noise-exposed and aging cochlea: Primary neural degeneration in acquired sensorineural hearing loss. Hear. Res. 2015, 330, 191–199. [Google Scholar] [CrossRef]
- Paul, B.T.; Bruce, I.C.; Roberts, L.E. Evidence that hidden hearing loss underlies amplitude modulation encoding deficits in individuals with and without tinnitus. Hear Res. 2017, 344, 170–182. [Google Scholar] [CrossRef]
- Kujawa, S.G.; Liberman, M.C. Adding insult to injury: cochlear nerve degeneration after “temporary” noise-induced hearing loss. J. Neurosci. 2009, 29(45), 14077–14085. [Google Scholar] [CrossRef] [PubMed]
- Pienkowski, M. Prolonged exposure of CBA/Ca mice to moderately loud noise can cause cochlear synaptopathy but not tinnitus or hyperacusis as assessed with the acoustic startle reflex. Trends Hear. 2018, 22, 2331216518758109. [Google Scholar] [CrossRef]
- Grinn, S.K.; et al. Hidden hearing loss? No effect of common recreational noise exposure on cochlear nerve response amplitude in humans. Front. Neurosci. 2017, 11, 465. [Google Scholar] [CrossRef]
- Shehabi, A.M.; et al. The effect of lifetime noise exposure and aging on speech-perception-in-noise ability and self-reported hearing symptoms: An online study. Front. Aging Neurosci. 2022, 14, 890010. [Google Scholar] [CrossRef]
- Shehabi, A.M.; Prendergast, G.; Plack, C.J. The Relative and Combined Effects of Noise Exposure and Aging on Auditory Peripheral Neural Deafferentation: A Narrative Review. Front Aging Neurosci. 2022, 14, 877588. [Google Scholar] [CrossRef]
- Alagramam, K.N. and C.J.C. Weisz, Auditory System, Central, in Encyclopedia of the Neurological Sciences (Third Edition), J.D. England, Editor. 2025, Academic Press: Oxford. p. 344-353.
- Wojtczak, M.; Beim, J.A.; Oxenham, A.J. Weak Middle-Ear-Muscle Reflex in Humans with Noise-Induced Tinnitus and Normal Hearing May Reflect Cochlear Synaptopathy. eNeuro 2017, 4(6). [Google Scholar] [CrossRef]
- Trevino, M.; Zang, A.; Lobarinas, E. The middle ear muscle reflex: Current and future role in assessing noise-induced cochlear damage. J. Acoust. Soc. Am. 2023, 153(1), 436. [Google Scholar] [CrossRef] [PubMed]
- Hall, J.W. Predicting Hearing Level From the Acoustic Reflex: A Comparison of Three Methods. Arch. Otolaryngol. 1978, 104(10), 601–605. [Google Scholar] [CrossRef] [PubMed]
- Acoustic Reflex Testing: A Complete Guide. Available online: https://www.interacoustics.com/academy/tympanometry-training/acoustic-reflexes/acoustic-reflex-testing (accessed on 29 May 2026).
- Wallin, A.; Mendez-Kurtz, L.; Silman, S. Prediction of hearing loss from acoustic-reflex thresholds in the older adult population. Ear Hear 1986, 7(6), 400–404. [Google Scholar] [CrossRef] [PubMed]
- Silman, S.; et al. Effect of age on prediction of hearing loss with the bivariate-plotting procedure. J. Speech Hear Res. 1984, 27(1), 12–19. [Google Scholar] [CrossRef]
- Shenoy, S.; et al. A Systematic Review: State of the Science on Diagnostics of Hidden Hearing Loss. Diagnostics 2025, 15(6), 742. [Google Scholar] [CrossRef]
- Hunter, L.L. and N. Shahnaz, Acoustic Immittance Measures: Basic and Advanced Practice. 2013: Plural Publishing, Incorporated.
- Dunson, D.B. Commentary: Practical Advantages of Bayesian Analysis of Epidemiologic Data. Am. J. Epidemiol. 2001, 153(12), 1222–1226. [Google Scholar] [CrossRef]
- Goligher, E.C.; Heath, A.; Harhay, M.O. Bayesian statistics for clinical research. Lancet 2024, 404(10457), 1067–1076. [Google Scholar] [CrossRef] [PubMed]
- Python Software Foundation, Python. 2025.
- Robert, C.P., G. Casella, and G. Casella, Monte Carlo statistical methods. Vol. 2. 2004: Springer.
- Faber, J.; Fonseca, L.M. How sample size influences research outcomes. Dent. Press J. Orthod. 2014, 19, 27–29. [Google Scholar] [CrossRef] [PubMed]
- Ryan, A.F.; et al. Temporary and Permanent Noise-induced Threshold Shifts: A Review of Basic and Clinical Observations. Otol. Neurotol. 2016, 37(8), e271-5. [Google Scholar] [CrossRef] [PubMed]
Figure 1.
Average difference between WB and pure-tone reflex thresholds by group. Each point represents one ear. Positive values indicate lower/better WB thresholds relative to pure tones, whereas negative values indicate worse WB thresholds. The dashed horizontal line at 0 marks no difference. Normal controls cluster above zero, music students are intermediate, and symptomatic ears cluster near zero, with many negative values.

Figure 2.
Posterior distributions for adjusted group differences in AvgDiff. Curves show the posterior distributions for the adjusted comparisons between music students and normal controls, symptomatic participants and normal controls, and symptomatic participants and music students. Values below zero indicate reduced BBN advantage in the first-named group relative to the comparison group. The dashed vertical line indicates no difference.

Figure 3.
Bayesian stimulus-specific group contrasts for BBN advantage metrics. Posterior means and 95% credible intervals are shown for AvgDiff, 500Diff, and 2000Diff. Negative values indicate reduced BBN advantage relative to the comparison group. The dashed vertical line indicates no group difference.

Figure 4.
Receiver operating characteristic analysis for identifying symptomatic ears. ROC curves are shown for AvgDiff, 500Diff, and 2000Diff. Lower values of each metric were treated as indicating a greater likelihood of symptomatic status. The diagonal dashed line represents chance-level performance. Dots indicate the Youden-optimal threshold for each metric.


Table 1.
Participant and ear-level descriptive characteristics by group (adjusted with age and sex).
Table 1.
Participant and ear-level descriptive characteristics by group (adjusted with age and sex).
| Normal control | Music Student | Symptomatic | |
| No. of ears, n | 30 | 22 | 85 |
| No. of participants, n | 15 | 11 | 44 |
| AvgDiff, mean (SD), dB HL | 6.58 (9.57) | 2.95 (7.85) | -0.59 (6.72) |
| Median, dB HL | 5.0 | 5.0 | 5.0 |
Table 2.
Bayesian analysis output for AvgDiff Multilevel linear regression analysis of factors associated with Avg ART Differences (adjusted with age and sex).
Table 2.
Bayesian analysis output for AvgDiff Multilevel linear regression analysis of factors associated with Avg ART Differences (adjusted with age and sex).
| Posterior mean | 95% credible interval | Posterior probability | |
| Comparison | |||
| Music student vs Normal control | -3.78 | -9.27 to 1.50 | Pr( < 0) = 0.92 |
| Symptomatic vs Normal control | -6.99 | -12.60 to -1.46 | Pr( < 0) = 0.99 |
| Symptomatic vs Music student | -3.22 | -9.11 to 3.05 | Pr( < 0) = 0.86 |
| Male vs Female | -1.65 | -4.87 to 1.54 | Pr( < 0) = 0.85 |
| Age, per year | -0.01 | -0.18 to 0.17 | Pr( < 0) = 0.54 |
Table 3.
Stimulus-specific Bayesian results for 500 Diff and 2000 Diff (adjusted with age and sex).
| Posterior mean | 95% credible interval | Posterior probability | |
| 500 Diff Comparison | |||
| Music student vs Normal control | -1.46 | -5.36 to 2.37 | Pr( < 0) = 0.77 |
| Symptomatic vs Normal control | -3.66 | -7.64 to 0.40 | Pr( < 0) = 0.96 |
| Symptomatic vs Music student | -2.20 | -6.48 to 2.17 | Pr( < 0) = 0.84 |
| 2000 Diff Comparison | |||
| Music student vs Normal control | -2.67 | -6.10 to 0.70 | Pr( < 0) = 0.95 |
| Symptomatic vs Normal control | -6.32 | -9.67 to -2.93 | Pr( < 0) 1.00 |
| Symptomatic vs Music student | -3.66 | -7.45 to 0.08 | Pr( < 0) = 0.97 |
Disclaimer/Publisher’s Note: The statements, opinions and data contained in all publications are solely those of the individual author(s) and contributor(s) and not of MDPI and/or the editor(s). MDPI and/or the editor(s) disclaim responsibility for any injury to people or property resulting from any ideas, methods, instructions or products referred to in the content. |
© 2026 by the authors. Licensee MDPI, Basel, Switzerland. This article is an open access article distributed under the terms and conditions of the Creative Commons Attribution (CC BY) license (http://creativecommons.org/licenses/by/4.0/).
Copyright: This open access article is published under a Creative Commons CC BY 4.0 license, which permit the free download, distribution, and reuse, provided that the author and preprint are cited in any reuse.


