
Submitted:
03 June 2026
Posted:
04 June 2026
You are already at the latest version
Abstract
Ecological resilience represents a region's fundamental capacity to withstand external disturbances and achieve sustainable development. As a typical ecologically fragile region in China and globally, Southwest China warrants particular attention in terms of understanding the spatiotemporal evolution and driving mechanisms of ecological resilience. Taking 47 cities in Southwest China as the study area,this study constructs an urban ecological resilience evaluation index system based on the "Pressure–State–Response–Innovation" framework. By integrating centroid migration analysis, standard deviation ellipse analysis, kernel density estimation, spatial autocorrelation analysis, the Spatial Durbin Model (SDM), and the XGBoost-SHAP model, the spatiotemporal evolution and driving factors of urban ecological resilience from 2005 to 2024 are systematically examined.The results indicate that: (1) During the study period, disparities in urban ecological resilience across Southwest China gradually widened, accompanied by pronounced regional differentiation. Kernel density estimation further reveals a clear polarization trend in urban ecological resilience. (2) The SDM results demonstrate that urban ecological resilience exhibits strong spatial dependence. For most driving factors, the indirect effects exceed the direct effects, suggesting that their influences are primarily transmitted through spatial spillover mechanisms. (3) The XGBoost-SHAP results reveal significant local threshold effects and interactive relationships among the driving factors of ecological resilience. (4) Significant interprovincial heterogeneity exists in the driving mechanisms of ecological resilience. These findings enrich the analytical framework for urban ecological resilience research and provide important scientific support for differentiated ecological governance and high-quality sustainable development in ecologically fragile regions.
Keywords:
ecological resilience
; spatiotemporal evolution
; SDM model
; XGBoost-SHAP model
; Southwest China
1. Introduction
Against the backdrop of escalating global climate change risks, increasingly frequent extreme weather events, and rapid urbanization, sustainable urban development is facing unprecedented challenges [1]. As critical hubs of human production and daily life, cities play a pivotal role in addressing climate change while promoting sustainable economic, social, and ecological development, making this issue a major global concern [2].Globally, international initiatives such as the United Nations 2030 Sustainable Development Goals (SDGs) and the New Urban Agenda have identified resilience as a core objective of sustainable urban development. In China, urbanization-related challenges, including population concentration, intensive resource consumption, and environmental degradation, have further undermined the resilience of urban ecosystems [3]. In the 2022 Implementation Plan for New Urbanization during the 14th Five-Year Plan Period, the Chinese government explicitly identified the development of resilient cities as a key component of high-quality development. Ecological resilience refers to the capacity of a system or organism to maintain its structure and functions when subjected to external disturbances and to recover its original state through adaptive adjustments. This concept has attracted considerable attention from both academia and policymakers. As a critical foundation of urban resilience [4], ecological resilience provides a new perspective for urban ecological risk governance [5] and offers an effective approach for enhancing ecosystem adaptability to climate change risks [6].Therefore, research on ecological resilience is of great practical significance for addressing global climate change, strengthening regional sustainable development capacity, and informing environmental improvement and governance.
The concept of resilience originated in the field of engineering [7,8]. Holling was the first ecologist to introduce the concept of resilience into ecological research and distinguished between the concepts of engineering resilience and ecological resilience. Subsequently, the socio-ecological systems (SES) theory proposed by Berkes and Folke extended resilience research from natural ecosystems to social systems, thereby broadening its theoretical scope [9]. Research on ecological resilience began relatively early, and existing studies have primarily focused on the following three aspects. (1) Regarding ecological resilience assessment methods, current approaches can generally be classified into single-indicator methods and comprehensive evaluation methods. Single-indicator methods are typically based on the Remote Sensing Ecological Index (RSEI) and employ remote sensing indicators such as greenness and humidity to assess ecological resilience. These methods are suitable for rapid large-scale assessments; however, they have limited capacity to capture the response mechanisms associated with human activities and ecological resilience [10,11,12]. Comprehensive evaluation methods typically construct an ecological resilience assessment index system and employ approaches such as the entropy method, regression analysis, and the analytic hierarchy process (AHP) to determine indicator weights and calculate ecological resilience indices. Widely used ecological resilience assessment frameworks include the Rockefeller Foundation's City Resilience Index (CRI), the Notre Dame Global Adaptation Initiative Index (ND-GAIN), the Resilience Capacity Index (RCI), and the Pressure–State–Response (PSR) framework and its extended models [13,14,15,16]. Among these approaches, the entropy method is widely adopted because of its high degree of objectivity and effective utilization of data.(2) Regarding the driving factors of ecological resilience, existing studies have focused on social, economic, and demographic dimensions and have employed methods such as structural equation modeling, principal component analysis, and geographically weighted regression to examine the effects of socioeconomic development and population activities on ecological resilience. Although empirical studies based on extensive panel data have generated valuable insights, they are often constrained by assumptions of linear relationships. In recent years, machine learning models have gradually demonstrated significant advantages in ecological research, helping to overcome this limitation. [17,18,19,20,21,22,23]. (3) From the perspective of research themes, some scholars have integrated ecological resilience with emerging topics such as the digital economy [24], carbon emissions [25], industrial agglomeration [26]and human activities [27].By employing coupling coordination analysis, these studies have explored the interactions between ecological resilience and related socioeconomic and environmental systems, highlighting its relevance across multiple research domains.
Although existing studies have substantially advanced ecological resilience research and provide an important foundation for the present study, several gaps remain. (1) The geographical coverage of existing research remains limited. Although current studies encompass economic zones, provinces, urban agglomerations, and counties, they are predominantly concentrated in economically developed regions. Comparatively little attention has been paid to Southwest China, making it difficult to fully reveal the regional differentiation of ecological resilience.(2) The construction of ecological resilience indicator systems remains incomplete. Existing studies primarily focus on demographic, social, economic, and environmental dimensions when developing ecological resilience assessment frameworks and selecting driving factors, while paying limited attention to the role of innovation in shaping ecological resilience. (3) Spatial evolution analyses remain insufficiently integrated. Existing studies primarily rely on kernel density estimation or spatial autocorrelation analysis to examine the spatiotemporal evolution of ecological resilience, but often lack a systematic analytical framework that links spatiotemporal distribution, regional differentiation, and spatial correlation. (4) Limitations remain in research on the driving factors of ecological resilience. Traditional panel regression and spatial econometric models generally rely on assumptions of linear relationships, limiting their ability to capture the nonlinear effects of different driving factors on ecological resilience. Furthermore, many studies treat research units as independent entities without adequately accounting for spatial spillover effects or evaluating the marginal contributions of individual factors, thereby constraining a comprehensive and interpretable understanding of the underlying driving mechanisms.
To address the aforementioned research gaps, this study focuses on Southwest China as the study area. As a key region for China's ecological security and an important ecological barrier in the upper reaches of the Yangtze River, Southwest China exhibits substantial interprovincial differences in ecological conditions. Moreover, the increasing frequency of extreme droughts and heavy rainfall events in recent years has further highlighted the heterogeneous characteristics of ecological resilience across the region, providing an appropriate context for comparative and differentiated analyses.
Second, an innovation dimension is incorporated into the traditional PSR framework to construct an enhanced ecological resilience assessment framework.
Third, to examine the spatiotemporal evolution of ecological resilience, this study integrates centroid migration analysis, kernel density estimation, the Theil index, and exploratory spatial data analysis (ESDA) to systematically characterize the spatiotemporal patterns of ecological resilience in Southwest China.
Finally, to investigate the driving mechanisms of ecological resilience, a combined analytical framework incorporating the Spatial Durbin Model (SDM) and the XGBoost-SHAP model is employed. The complementary strengths of these approaches enable the identification of both spatial spillover effects and nonlinear relationships, thereby providing a more comprehensive understanding of the drivers of ecological resilience.
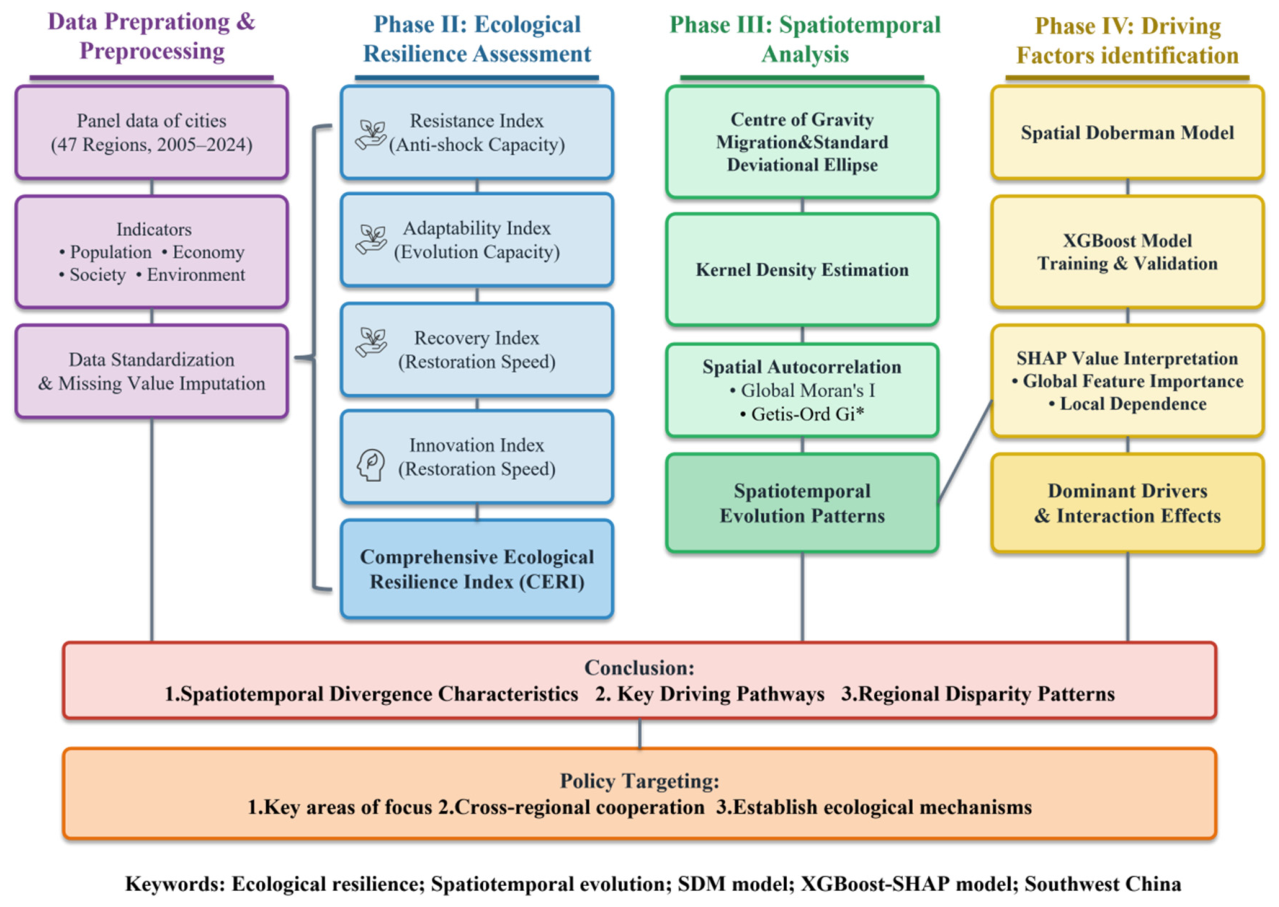
Figure 1.
Technical workflow.
2. Materials and Methods
2.1. Overview of the Study Area
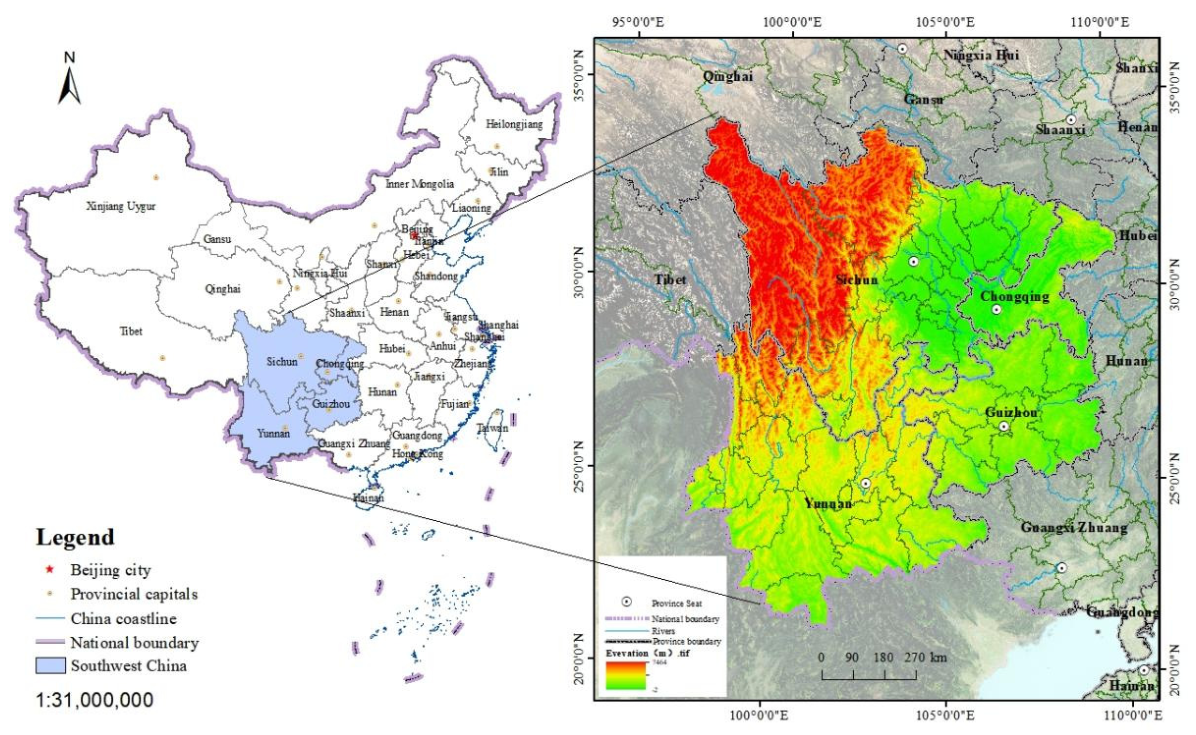
This study focuses on Southwest China, encompassing four provincial-level administrative units: Chongqing Municipality and the provinces of Sichuan, Guizhou, and Yunnan. The study area includes 47 prefecture-level administrative regions, comprising 46 prefecture-level cities and Chongqing Municipality, and covers approximately 1.13 million km², accounting for 11.9% of China's total land area. By the end of 2025, the resident population exceeded 200 million.Located in southwestern China, the region is characterized by complex terrain dominated by mountains and hills and serves as an important transitional zone linking the Qinghai–Tibet Plateau, the Yunnan–Guizhou Plateau, and the Sichuan Basin [28]. As one of the most ecologically fragile regions in China and globally, Southwest China is characterized by distinctive karst landscapes, complex topographic and climatic conditions, and intensive human activities. These characteristics have attracted considerable attention in ecological, geographical, and environmental research.
Figure 2.
Overview of the Study Area. (Note: This map was produced based on the standard map with the approval number GS(2024)0650 obtained from the standard map service website of the NationalGeomatics Center of China).
Figure 2.
Overview of the Study Area. (Note: This map was produced based on the standard map with the approval number GS(2024)0650 obtained from the standard map service website of the NationalGeomatics Center of China).
2.2. Construction of Ecological Resilience Evaluation Indicators
The core of ecological resilience research lies in understanding the capacity of ecosystems to resist disturbances, adapt to changing conditions, and recover from external risks and shocks [29]. Drawing on previous studies and considering the specific characteristics of Southwest China [30,31,32], this study extends the traditional PSR framework by incorporating an innovation dimension and develops an ecological resilience assessment framework for Southwest China.
The framework consists of four dimensions. First, pressure reflects the external pressures and potential threats encountered during regional development. Second, state represents the capacity of urban ecosystems to maintain stability when exposed to external disturbances. Third, response captures the adaptive and restorative measures undertaken by cities following ecological disturbances. Fourth, innovation reflects the role of green innovation in promoting ecological conservation and sustainable development, thereby enhancing ecological resilience.
Based on the conceptual framework of ecological resilience, this study constructs an ecological resilience assessment index system for cities in Southwest China, comprising four dimensions and 15 indicators (Table 1).
2.3. Measurement of Ecological Resilience Index
In comprehensive evaluation approaches, ecological resilience is commonly quantified using an ecological resilience index (ER), which is calculated as follows:
where (ER) denotes the ecological resilience index of a city, ranging from 0 to 1, with higher values indicating greater ecological resilience. x'ij represents the standardized value of indicator (j) for city (i), and wij denotes the corresponding indicator weight.
Given the different attributes of the indicators, min–max normalization was applied to standardize the original data separately for positive and negative indicators. Indicator weights were determined using the entropy method, an objective weighting approach based on information entropy that has been widely applied in ecological resilience assessment studies.
2.4. Data Source
This study covers the period from 2005 to 2024, encompassing both China's rapid urbanization process and the advancement of ecological civilization construction. The study period also includes major events such as the 2008 Wenchuan earthquake and the COVID-19 pandemic, providing a valuable context for examining the dynamics of ecological resilience.
The analysis is based on a sample of 47 prefecture-level administrative regions in Southwest China. The primary data sources include the Chongqing Statistical Yearbook, Sichuan Statistical Yearbook, Guizhou Statistical Yearbook, and Yunnan Statistical Yearbook. Additional data were obtained from the China Urban Construction Statistical Yearbook, national and local statistical bulletins on economic and social development, government work reports, and statistical records from the China National Intellectual Property Administration (CNIPA). Missing values were estimated using linear interpolation.
2.5. Research Methods
2.5.1. Kernel Density Estimation
In addition to centroid migration and standard deviational ellipse analyses, kernel density estimation (KDE) was applied to explore the temporal evolution of ecological resilience. As a nonparametric density estimation method, KDE converts discrete observations into a continuous probability density distribution, thereby revealing changes in the distribution pattern of ecological resilience over time. By comparing kernel density curves across different years, shifts in central tendency, distributional dispersion, polarization, and tail characteristics can be identified, providing insights into the evolutionary dynamics of ecological resilience [33]. The KDE function is expressed as follows:
where (f(x)) denotes the probability density function, (K(x−xi)/h) represents the kernel function, (n) is the sample size, (h) is the bandwidth, (x) denotes the observation value, and (xi) represents the (i)-th sample observation.
2.5.2. Construction and Selection of Spatial Weight Matrix
The specification of the spatial weight matrix is critical in spatial econometric analysis because it determines how spatial dependence is represented among observational units [34]. Commonly used matrices include contiguity, geographic distance, economic distance, inverse squared distance, and economic–geographic nested matrices. Given that ecological governance capacity and green innovation are closely associated with regional economic development in Southwest China, an economic distance matrix is expected to better reflect intercity interactions related to ecological resilience. Comparative analyses using Moran's I statistics and SDM estimation results further confirmed that the economic distance matrix provided the most robust model performance. Accordingly, it was adopted as the spatial weight matrix in this study.
2.5.3. Spatial Autocorrelation
Spatial autocorrelation is generally classified into global and local measures used to quantify spatial dependence in geographic data. Global spatial autocorrelation is commonly assessed using global Moran's I, which measures the overall spatial association and heterogeneity of a variable across the study area. Local spatial autocorrelation is typically examined using Local Indicators of Spatial Association (LISA) and hotspot analysis.
Among these methods, hotspot analysis (Getis–Ord Gi*) is particularly effective in identifying statistically significant clusters of high-value (hotspots) and low-value (coldspots) regions. Accordingly, this study employs global Moran's I and hotspot analysis to investigate the spatial patterns of ecological resilience [35].
2.5.4. Spatial Durbin Model
Commonly used spatial econometric models include the Spatial Error Model (SEM), the Spatial Autoregressive Model (SAR), and the Spatial Durbin Model (SDM). The SEM accounts for spatial dependence through spatially correlated error terms, whereas the SAR model captures spatial interactions via the spatial lag of the dependent variable. The SDM extends both frameworks by incorporating spatial lags of both the dependent variable (Wy) and explanatory variables (WX), thereby providing a flexible specification capable of capturing multiple forms of spatial dependence.
Elhorst (2010), based on Monte Carlo simulation evidence, shows that the SDM yields consistent and unbiased estimates under various data-generating processes. Accordingly, the SDM is employed as the benchmark model to examine spatial dependence in ecological resilience. The model can be specified as follows:
In the above specification, (Y) denotes the dependent variable, (X) represents the vector of explanatory variables, and (W) is the spatial weight matrix. (ρ) is the spatial autoregressive coefficient, while (WY) and (WX) denote the spatial lag terms of the dependent variable and explanatory variables, respectively. (β) and (θ) are coefficient vectors, (α) is the intercept term, (In) is an (n \times n) identity matrix, and (ε) is the error term.
Following Elhorst (2010), the effects of the Spatial Durbin Model are decomposed into direct, indirect, and total effects. The total effect is defined as the sum of direct and indirect effects, where the direct effect captures the impact of explanatory variables on the local region, while the indirect effect reflects spatial spillover effects transmitted to neighboring regions [36,37,38].
2.5.5. XGboost-SHAP Model
Traditional linear models are limited in capturing nonlinear relationships and potential threshold effects among ecological resilience drivers. To address this limitation, this study adopts a hybrid analytical framework integrating XGBoost regression and the SHAP (Shapley Additive exPlanations) approach to uncover complex driving mechanisms.
XGBoost (eXtreme Gradient Boosting) is a high-performance ensemble learning algorithm based on decision trees and gradient boosting. It iteratively improves predictive performance by combining multiple weak learners and is capable of capturing complex nonlinear relationships and interaction effects among explanatory variables. In addition, it incorporates regularization mechanisms to enhance model robustness and mitigate overfitting, while providing effective strategies for handling missing data. The model is expressed as follows:
where (x;γm) denotes the basis function (weak learner), (γm) represents the parameters of the basis function, (βm) is the corresponding coefficient, and (m) denotes the total number of boosting iterations.
The SHAP (Shapley Additive exPlanations) method, grounded in cooperative game theory and Shapley values, provides a theoretically consistent framework for interpreting the contributions of explanatory variables to model predictions. Since its introduction by Lundberg et al. (2017), SHAP has been widely adopted to enhance the interpretability of machine learning models for both classification and regression tasks.
A SHAP summary plot visualizes the distribution of SHAP values and illustrates both the magnitude and direction of each feature’s contribution to the model output. The SHAP value is formally defined as follows:
where(f(xij)) is the SHAP value of sample , (x)represents the i-th sample, (xij) represents the j-th feature of the i-th sample, (mcij) is the marginal contribution of the feature, and (wn) is the weight [39,40].
3. Spatiotemporal Evolution Characteristics of Ecological Resilience
3.1. Temporal Evolution Characteristics
The ecological resilience index of Southwest China was calculated using the entropy method. The ecological resilience values were classified using ArcGIS 10.8 into five levels: [0.0, 0.2) low ecological resilience, [0.2, 0.4) relatively low ecological resilience, [0.4, 0.6) medium ecological resilience, [0.6, 0.8) relatively high ecological resilience, and [0.8, 1.0] high ecological resilience. Figure 3 presents the spatial distribution of the ecological resilience index in Southwest China for the years 2005, 2010, 2015, 2020, and 2024.
As shown in Figure 3, the ecological resilience index in Southwest China generally exhibits a spatial pattern characterized by concentrated low values and dispersed high values. From 2005 to 2024, the number of cities with low ecological resilience showed an overall increasing trend, expanding from northern Southwest China toward the south, with a gradually enlarging spatial extent. In contrast, cities with relatively low and medium ecological resilience gradually decreased, and their spatial extent continuously contracted. Cities with relatively high and high ecological resilience were mainly concentrated in provincial capitals and the northeastern part of the region, and their spatial distribution remained relatively stable over the study period.
During the study period, the highest ecological resilience value was observed in Chongqing in 2021 (0.811), reaching a high resilience level. In 2005, the proportions of cities with low, relatively low, medium, and relatively high ecological resilience were 23.40%, 70.21%, 4.26%, and 2.13%, respectively, with Chengdu (0.714) exhibiting the highest value and Neijiang (0.127) the lowest. In 2024, these proportions changed to 61.70%, 29.79%, 4.26%, and 4.26%, respectively, with Chongqing (0.797) and Diqing Tibetan Autonomous Prefecture (0.106) representing the maximum and minimum values.
The range of ecological resilience increased from 0.587 to 0.691, representing a 17.72% increase compared with 2005, indicating an expanding disparity in ecological resilience across cities in Southwest China and a growing regional imbalance. In terms of quantity, the number of cities with low ecological resilience increased from 11 in 2005 to 29 in 2024, while cities with relatively low ecological resilience decreased from 33 to 14.
Overall, ecological resilience remained at a generally low level across Southwest China, with only a few provincial capitals such as Chongqing, Chengdu, and Kunming maintaining relatively stable and higher resilience levels, indicating a clear polarization pattern. This pattern can be attributed to the region’s inherently fragile ecological conditions combined with intensified urbanization and infrastructure expansion, which have increased ecological pressure and reduced ecological land availability, thereby constraining improvements in ecological resilience.
The spatiotemporal evolution of urban ecological resilience in Southwest China was analyzed using centroid migration trajectories and standard deviational ellipse (SDE) analysis. The centroid trajectories and SDEs from 2005 to 2024 were derived using ArcGIS 10.8. The results are presented in Figure 4 and Table 3.

Table 2.
Standard Deviation Ellipse Parameters for Southwest China.
| Year | Center of Gravity X (E) | Center of Gravity Y (N) | Standard Deviation of X (Km) | Standard Deviation of Y (Km) | Rotation (θ) |
| 2005 | 103.82 | 27.72 | 333.40 | 543.82 | 36.30 |
| 2010 | 103.91 | 27.81 | 335.26 | 546.72 | 38.17 |
| 2015 | 104.10 | 27.92 | 329.07 | 543.25 | 38.61 |
| 2020 | 104.32 | 28.07 | 323.70 | 511.99 | 35.79 |
| 2024 | 104.34 | 28.35 | 323.42 | 506.73 | 35.78 |
The centroid migration trajectory and standard deviational ellipse (SDE) are widely used geostatistical tools to characterize the spatial distribution and evolution of geographic phenomena [41]. As shown in Figure 4, the centroid of ecological resilience in Southwest China exhibited a clear northeastward migration from 2005 to 2024, shifting from Zhaotong City (Yunnan Province) to Yibin City (Sichuan Province).
The migration process can be divided into two stages. During 2005–2020, the centroid shifted relatively rapidly, reflecting the increasing spatial concentration of high ecological resilience in major urban agglomerations such as Chengdu and Chongqing, where stronger ecological governance capacity and policy support contributed to the formation of high-value clusters. In contrast, Yunnan and Guizhou regions, constrained by fragile karst landscapes, generally exhibited lower resilience levels.
From 2020 to 2024, the centroid position became relatively stable, indicating that the spatial structure of ecological resilience had reached a dynamic equilibrium, even under the disturbance of the COVID-19 pandemic.
The SDE results indicate strong spatial stability over time, with substantial overlap across all periods. The persistent northeast–southwest gradient corresponds to the transition between the Sichuan Basin and the Yunnan–Guizhou Plateau, suggesting that topographic constraints play a fundamental role in shaping the spatial pattern of ecological resilience in Southwest China.
To macroscopically characterize the spatiotemporal evolution of urban ecological resilience in Southwest China, kernel density estimation (KDE) was employed. As shown in Figure 5, the ecological resilience index was primarily concentrated within the range of 0.1–0.4 during the study period.
The distribution pattern evolved from an initially unimodal structure toward increasing dispersion and polarization over time. In 2010, the kernel density curve exhibited a sharp and narrow peak, indicating a high degree of concentration and relatively small inter-city disparities in ecological resilience. This pattern may be associated with the coordinated ecological protection policies implemented during the Eleventh Five-Year Plan period, such as afforestation and natural forest conservation programs.
By 2015, the kernel density curve shifted leftward, suggesting an overall decline in ecological resilience, while inter-city differences remained relatively stable. In 2024, the distribution became flatter with reduced peak intensity, indicating increasing heterogeneity among cities. Meanwhile, the emergence of multiple peaks and a more pronounced right tail suggests a transition toward a polarized distribution structure.
In terms of distribution shape, a right-skewed pattern was observed during 2005–2010, indicating the presence of a small number of cities with relatively high ecological resilience. After 2015, the distribution became more symmetric with a general downward shift, whereas by 2024, a bimodal structure emerged, with a secondary concentration in the 0.3–0.5 range. This pattern further confirms the increasing polarization of ecological resilience across cities in Southwest China, consistent with the spatial heterogeneity identified in the standard deviational ellipse results.
3.2. Spatial Evolution Characteristics
To characterize the spatial dependence of ecological resilience in Southwest China, spatial autocorrelation analysis was conducted using ArcGIS 10.8 and GeoDa, with global Moran’s I and hotspot analysis employed to identify clustering patterns. As shown in Figure 6, global Moran’s I remained at a relatively high level from 2005 to 2013, indicating significant spatial clustering of both high- and low-value areas of ecological resilience.
From 2014 to 2017, Moran’s I declined markedly, corresponding to the leftward shift observed in the kernel density distribution, suggesting a weakening of overall spatial dependence associated with a general decline in ecological resilience. After 2018, Moran’s I began to recover, which was accompanied by the emergence of a more polarized distribution pattern in kernel density estimation.
Spatial clustering patterns indicate that high-resilience cities, primarily Chengdu and Chongqing, gradually formed a high-value cluster. This may be associated with relatively strong ecological governance capacity, higher levels of ecological investment, and accelerated industrial upgrading. In contrast, peripheral cities with weaker ecological endowments and limited investment in environmental governance tended to form persistent low-value clusters, leading to a stable spatial polarization pattern.
The global Moran’s I index reflects overall spatial clustering but does not identify localized spatial heterogeneity. In contrast, hotspot and cold-spot analysis enables the identification of statistically significant high- and low-value clusters. The results are shown in Figure 7.
In 2005, pronounced spatial heterogeneity in ecological resilience was observed across Southwest China. Hotspots were primarily concentrated in western Sichuan and northwestern Yunnan, while cold spots were mainly distributed in Chongqing, central Sichuan, southern Guizhou, and southern Yunnan. This spatial pattern reflects the interaction between regional development intensity and ecological endowment conditions. Areas with relatively low population density and better preserved ecological conditions, such as Aba, Ganzi, Liangshan, and Diqing, tended to exhibit higher relative resilience levels, whereas rapidly urbanizing regions with higher population concentration generally showed lower resilience levels.
In 2015, the extent of hotspot areas decreased notably, becoming concentrated in limited regions such as Liangshan, Panzhihua, Lijiang, and Pu’er, while cold spots expanded and exhibited increasing spatial continuity. This suggests an intensification of spatial differentiation in ecological resilience during this period, consistent with the structural shift observed in kernel density estimation.
By 2024, hotspot areas had largely disappeared, and cold spots became dominant across most of the study region. This indicates a transition toward widespread low-value clustering of ecological resilience, which is consistent with the bimodal distribution pattern observed in kernel density analysis.
4. Exploration of Driving Factors of Ecological Resilience
4.1. Selection and Description of Driving Factors
Based on previous studies and considering the complex topographic conditions and population characteristics of Southwest China, this study constructs an evaluation framework for the driving factors of ecological resilience. The framework consists of 12 indicators across four dimensions, which are described as follows.
Table 3.
Driving factors of ecological resilience in Southwest China.
| Criteria Layer | Indicator Layer | Unit, | Description | Code |
| Population | Year-end resident population | 10,000 people | Total Population | X1 |
| Population growth rate | ‰ | Birth Rate - Death Rate | X2 | |
| Urbanization rate | % | Urban Population as a Percentage of Total Population | X3 | |
| Economy | GDP per capita | Yuan | GDP/Total Population | X4 |
| Industrial structure upgrading index | Tertiary Sector GDP/Secondary Sector GDP | X5 | ||
| Actual utilization of foreign capital | US$10,000 | Openness to Foreign Economic Relations | X6 | |
| Society | Urban-rural income ratio | Urban Residents' Per Capita Disposable Income/Rural Residents' Per Capita Disposable Income | X7 | |
| Proportion of science and technology expenditure in fiscal expenditure | % | Science and Technology Fiscal Expenditure/Total Fiscal Expenditure | X8 | |
| Number of internet access users | 10,000 households | Openness to Information | X9 | |
| Environment | Multi-year average temperature | ℃ | Temperature Conditions | X10 |
| Average precipitation | mm | Precipitation Conditions | X11 | |
| Forest coverage rate | % | Ecological Land Use Conditions | X12 |
4.2. Spatial Durbin Model Analysis
4.2.1. Spatial Econometric Analysis Results
Spatial autocorrelation analysis indicates significant spatial dependence in urban ecological resilience across Southwest China. To further identify its driving mechanisms, a spatial Durbin model (SDM) was employed for empirical analysis. Prior to estimation, a series of diagnostic tests were conducted to ensure model robustness, with detailed results provided in Appendix A.1.
The SDM decomposes the total effects into direct and indirect (spillover) effects, providing a more comprehensive framework for examining the spatially interactive nature of ecological resilience drivers. The model estimation was conducted using Stata 17.0, and the results are reported in Table 4.
The spatial lag coefficient (ρ = 0.2739) is positive and statistically significant at the 1% level, indicating the presence of spatial dependence in urban ecological resilience. This suggests that changes in ecological resilience in one city are associated with those in neighboring cities, reflecting spatial interaction effects. Compared with alternative spatial econometric specifications, the SDM provides a more flexible structure for capturing such spatial spillover effects; therefore, it is adopted as the preferred model in this study.
Given that the spatial Durbin model (SDM) includes spatially lagged explanatory variables, the estimated regression coefficients cannot directly reflect marginal effects. Therefore, effect decomposition is conducted to derive direct and indirect impacts.
Based on the decomposition results, among the direct effects, year-end resident population (X1), the urban–rural income ratio (X7), and the number of internet-connected households (X9) all exhibit significant positive effects on local ecological resilience.
The positive effect of population size suggests that population agglomeration in Southwest China is increasingly associated with improvements in ecological resilience rather than merely exerting ecological pressure. This may be attributed to the promotion of scale effects in ecological governance and more efficient infrastructure utilization. The urban–rural income ratio reflects the level of urban–rural integration, which may enhance ecological resilience by facilitating the value realization of ecological products and optimizing land-use allocation. The number of internet-connected households represents the level of digital infrastructure development, which can improve access to green technologies and environmental information, thereby enhancing the digital capacity of ecological governance.
In contrast, actual utilized foreign investment (X6) exhibits a significant negative effect on local ecological resilience. This may be associated with the industrial structure of foreign investment, which is more concentrated in manufacturing-related sectors and may generate environmental pressure during industrial transfer processes, thereby constraining improvements in ecological resilience.
Indirect effects capture the spatial spillover impacts of explanatory variables on neighboring regions through spatial interaction networks. The results indicate two primary types of spatial spillover effects.
The first is a positive spillover effect. The increase in year-end resident population (X1) in neighboring cities exerts a significant positive impact on local ecological resilience. This may be associated with enhanced regional coordination in public services, infrastructure sharing, and cross-regional environmental governance, which facilitates the diffusion of ecological benefits across administrative boundaries.
The second type is a negative spillover effect. Per capita GDP (X4), the share of science and technology expenditure in fiscal spending (X8), and the number of internet users (X9) all exhibit significant negative spatial spillovers.
For per capita GDP, the negative spillover effect may reflect the spatial redistribution of industrial activities and environmental pressures associated with economic growth, which is broadly consistent with the Environmental Kuznets Curve (EKC) hypothesis. As neighboring regions experience economic expansion, industrial relocation and pollution transfer may increase ecological pressure in adjacent areas.
The negative spillover effect of science and technology expenditure may be related to its policy orientation toward industrial technological upgrading rather than ecological governance, which could limit its contribution to regional ecological improvement when fiscal resources are competitively allocated across regions.
Similarly, the number of internet users, as a proxy for digital infrastructure development, may be associated with the agglomeration of data-intensive and energy-demanding industries. This spatial restructuring of industrial activities may shift ecological pressure to neighboring cities, thereby exerting negative spillover effects on their ecological resilience.
The total effects reflect the overall impact of explanatory variables on regional ecological resilience. The results indicate that year-end resident population (X1) and per capita GDP (X4) are the main driving factors shaping the overall pattern of ecological resilience in Southwest China.
Population agglomeration appears to exert a positive influence on ecological resilience, which may be associated with scale effects in ecological governance and improved efficiency in infrastructure utilization. In contrast, economic growth may exert a negative overall effect when it exceeds ecological carrying capacity, suggesting a potential trade-off between economic expansion and ecological sustainability.
The share of science and technology expenditure in fiscal spending (X8) also exhibits a significant negative effect. This may reflect the orientation of fiscal technology investment toward industrial upgrading rather than ecological protection, which could limit its contribution to ecological improvement at the regional level.
Although forest coverage (X12) is not statistically significant in the total effect, its relatively large indirect effect suggests potential spatial spillover effects. As a key component of ecological land, forests contribute to carbon sequestration, biodiversity conservation, and water regulation, which may generate ecological benefits that extend beyond local boundaries.
Table 5.
SDM regression results.
| Variable | Direct effect | Indirect effect | total effect |
| X1 | 0.3513*** | 1.4327*** | 1.7840*** |
| X2 | 0.0189 | -0.1028 | -0.0840 |
| X3 | 0.0663 | 0.3426 | 0.4089 |
| X4 | -0.0020 | -0.5120*** | -0.5139*** |
| X5 | 0.0199 | -0.0098 | 0.0100 |
| X6 | -0.0271** | -0.0484 | -0.0755 |
| X7 | 0.1281*** | 0.0620 | 0.1901 |
| X8 | -0.0161 | -0.1497** | -0.1658** |
| X9 | 0.1805*** | -0.2502* | -0.0697 |
| X10 | 0.0202 | -0.0730 | -0.0529 |
| X11 | 0.0226 | -0.0691 | -0.0465 |
| X12 | 0.0679 | 3.7176 | 3.7855 |
These findings are consistent with the results of global Moran’s I, hotspot analysis, and kernel density estimation. The observed rebound in global Moran’s I in the later period may reflect a strengthening of spatial dependence driven by the increasing polarization of ecological resilience rather than an overall improvement in ecological conditions.
In the early stage, hotspot regions identified in the cold–hot spot analysis were primarily associated with relatively favorable ecological endowments and population agglomeration, which may have facilitated improvements in ecological governance efficiency and resource coordination across regions, thereby generating positive spatial interaction effects.In the later period, the significant negative effects of per capita GDP (X4) and the share of science and technology expenditure in fiscal spending (X8) appear to be more pronounced in low-resilience regions. This may indicate that spatial spillover effects associated with industrial transfer and policy imitation contribute to the persistence of low ecological resilience clusters.
Correspondingly, the bimodal distribution observed in 2024 kernel density estimation suggests increasing polarization, with low-resilience cities concentrated in the lower distribution peak, while relatively high-resilience cities remain in the upper peak, reflecting persistent spatial heterogeneity in ecological resilience across Southwest China.
4.2.2. Robustness Test
The spatial Durbin model is primarily estimated using an economic distance matrix. To examine the robustness of the results and mitigate potential bias arising from a single specification of spatial weights, the model is re-estimated using an economic–geographic nested matrix, an inverse distance squared matrix (IDW), and a contiguity matrix. The full results are reported in Appendix A.2.
As shown in Table 6, the spatial lag coefficients remain positive and statistically significant across different spatial weight matrices, with no substantial changes in sign or statistical significance. The log-likelihood values range from -397.83 (hybrid-additive matrix) to -394.09 (IDW matrix), while the baseline economic distance matrix yields a value of -395.05. Although the IDW matrix shows a slightly higher log-likelihood, the improvement is marginal and does not alter the sign or significance of the key coefficients. The hybrid-additive matrix exhibits relatively poorer model fit.The economic distance matrix is selected as the preferred specification for three main reasons.
First, from a theoretical perspective, ecological governance in Southwest China is more strongly associated with economic similarity than pure geographic proximity, as cities with comparable development levels are more likely to adopt similar environmental governance strategies.
Second, from a statistical perspective, differences in log-likelihood across spatial weight matrices are relatively small and do not indicate a clear dominance of any alternative specification.
Third, from a variable robustness perspective, the significance of year-end resident population (X1) is more stable under the economic distance specification, suggesting that spatial interaction in ecological governance is more closely related to economic linkages than to geographic adjacency.
4.3. XG Boost+SHAP Model Analysis
The SEM model reveals the marginal effect and spatial spillover effect of the driving factors, but there is a linear relationship between its implicit explanatory variables, making it difficult to explore the threshold effect and nonlinear relationship of the driving factors. The XG boost algorithm can automatically identify the nonlinear characteristics of the driving factors through the gradient boosting algorithm, which is particularly suitable for studying the driving factors of ecological resilience [42]. Unlike the SDM which uses standardized variables, the XGBoost model directly uses the original variable input to ensure the interpretability of the threshold in the SHAP dependency graph, making it easier for policymakers to directly understand the critical value. The panel data of 47 prefecture-level cities/municipalities in Southwest China from 2005 to 2024 were used as stratified sampling samples, and the dependent variable was the ecological resilience index. The optimal hyperparameters were determined by grid search combined with 5-fold cross-validation. The XGBoost model demonstrated robustness in cross-validation: after 10 runs of 5-fold cross-validation with different random seeds, the average R² was 0.91 (SD = 0.02) and the average RMSE was 0.09 (SD = 0.01), confirming that the fit was not driven by a specific training-test split, thus laying a solid foundation for subsequent use of the SHAP method.
The spatial error model (SEM) captures spatial dependence in the error term and allows for the estimation of spatial spillover effects; however, its underlying linear structure limits its ability to identify potential nonlinear relationships and threshold effects among driving factors of ecological resilience.
In contrast, the XGBoost algorithm can effectively capture nonlinear relationships and interaction effects through a gradient boosting framework, making it particularly suitable for analyzing complex driving mechanisms of ecological resilience. Unlike the spatial Durbin model (SDM), which relies on standardized variables for econometric interpretation, the XGBoost model is implemented using original variables to preserve the inherent scale information, thereby facilitating the interpretation of marginal thresholds in SHAP dependence plots and supporting more intuitive policy interpretation.
This study uses panel data from 47 prefecture-level cities/municipalities in Southwest China covering the period 2005–2024, with the ecological resilience index as the dependent variable. Model hyperparameters are optimized using grid search combined with five-fold cross-validation.
The XGBoost model demonstrates strong predictive stability. After 10 repeated runs of five-fold cross-validation with different random seeds, the average R² is 0.91 (SD = 0.02), and the average RMSE is 0.09 (SD = 0.01), indicating that model performance is not sensitive to a specific data split. This provides a reliable basis for subsequent SHAP-based interpretability analysis.
However, the feature importance generated by traditional XGBoost only reflects the relative contribution of each variable to model performance, without providing information on the direction of effects or capturing potential heterogeneous impacts at the individual observation level.
To address this limitation, this study introduces the SHAP method, which computes Shapley values for each feature based on cooperative game theory and enables a consistent decomposition of model predictions. SHAP dependence plots are further employed to examine the directionality and heterogeneity of feature effects.
Figure 8 presents the ranking of the mean absolute SHAP values after incorporating the lagged dependent variable. The results show that the mean absolute SHAP value of year-end resident population (X1) is 0.0167, which is consistent with the direct and indirect effects identified in the SDM model, highlighting the central role of population size in shaping ecological resilience.
The lagged population variable (X1_lag1, 0.0130) and the spatial lag of the dependent variable (y_wlag, 0.0099) rank second and third, respectively, indicating the presence of dynamic path dependence and spatial feedback mechanisms in the evolution of ecological resilience.
Urbanization rate (X3), internet access (X9), and the urban–rural income ratio (X7) also exhibit relatively high SHAP importance values (all approximately 0.0054), suggesting that these factors contribute to nonlinear variations in ecological resilience that are not fully captured by the linear SDM specification.
In contrast, per capita GDP (X4) and forest coverage (X12) show relatively lower SHAP importance. This may be explained by the fact that the spatial spillover effects of economic development are largely absorbed by spatial lag structures in the SDM framework, leaving limited residual explanatory power in the nonlinear model. Similarly, the relatively low importance of forest coverage may be associated with its low temporal variability during the study period, which limits its contribution to machine-learning-based feature discrimination.
Figure 9 presents the SHAP dependence plots of the main driving factors. Figure 9(a) shows the relationship between year-end resident population and SHAP values. When the population size is below approximately 10 million, SHAP values remain close to zero, indicating limited marginal contribution. Once this threshold is exceeded, SHAP values increase to the range of 0.15–0.17, suggesting a potential scale-related nonlinearity, where larger cities may exhibit stronger contributions to ecological resilience.
Figure 9(b) illustrates the SHAP dependence pattern of forest coverage. When forest coverage is below approximately 45%, the marginal effect remains weak. Beyond this level, SHAP values tend to become negative. This pattern may reflect trade-offs in land use allocation and ecological management costs, where excessive concentration of forest land could be associated with reduced diversification of ecological land types and increased maintenance pressure.
Figure 9(c) shows the SHAP dependence pattern of GDP per capita. The distribution does not exhibit a clear threshold effect, but rather a dispersed vertical pattern, suggesting that its influence on ecological resilience is not characterized by a single nonlinear breakpoint. Instead, its effect may be more closely associated with spatial interaction processes captured by the econometric specification in the SDM framework.
Figure 9(d) illustrates the interaction effect between year-end resident population and its lagged term. Cities with larger historical population bases tend to show stronger marginal effects as population increases, while cities with smaller population bases exhibit relatively gradual responses. This suggests that the impact of population dynamics on ecological resilience may be associated with cumulative and path-dependent characteristics over time.
Figure 10 illustrates inter-provincial heterogeneity in urban ecological resilience across Chongqing, Sichuan, Guizhou, and Yunnan. In Chongqing, year-end resident population (X1) and its lagged term (X1_lag1) are the primary influencing factors, while internet access (X9) and urbanization rate (X3) also rank relatively high, reflecting the combined effects of population agglomeration and temporal persistence.
In Sichuan, X1 and X1_lag1 remain the leading factors. In addition, lagged science and technology expenditure (X8_lag1) and spatial spillover effects (Y_wlag, X1_wlag) are also prominent, suggesting that ecological resilience is jointly associated with population dynamics, interregional interaction, and fiscal technology investment over time.
In Guizhou, spatial spillover variables (X1_wlag and Y_wlag) rank first and second, followed by local population (X1), indicating that ecological resilience is more strongly associated with interregional spillover effects than with local demographic scale.
In Yunnan, spatial lag variables (Y_wlag, X1_wlag) and lagged science and technology expenditure (X8_lag1) are among the most influential factors, while local population ranks relatively lower, suggesting a stronger dependence on regional interaction networks and temporal policy effects.
These provincial differences imply that ecological resilience governance in Southwest China exhibits marked spatial heterogeneity, highlighting the need for regionally differentiated policy strategies that account for differences in population structure and spatial dependence.
Overall, both the SDM and XGBoost–SHAP results consistently identify year-end resident population (X1), urbanization rate (X3), urban–rural income ratio (X7), and internet access (X9) as important influencing factors. However, differences are observed for per capita GDP (X4) and forest coverage (X12). The SDM results emphasize their spatial spillover effects, while the XGBoost–SHAP results capture potential nonlinear patterns at the local level.
Rather than indicating a methodological contradiction, these differences reflect the complementary nature of the two approaches. The SDM framework captures linear spatial dependence across regions, whereas the XGBoost–SHAP framework captures nonlinear and heterogeneous local effects. Together, they provide a multi-layer analytical perspective on spatial dependence and nonlinear heterogeneity in ecological resilience.
5. Conclusions and Discussion
5.1. Conclusions
This study takes 47 cities in Southwest China from 2005 to 2024 as the research sample. An urban ecological resilience evaluation system was first constructed, and the entropy method was applied to measure resilience levels. The spatiotemporal evolution patterns were then analyzed using centroid migration, standard deviation ellipse, kernel density estimation, global Moran’s I, and hot–cold spot analysis.Finally, a hybrid analytical framework integrating the spatial Durbin model (SDM) and XGBoost–SHAP was employed to examine spatial spillover effects and the driving mechanisms of ecological resilience. The main conclusions are as follows:
(1) Spatiotemporal evolution characteristics of ecological resilience: During the study period, the disparity in urban ecological resilience across Southwest China gradually widened, with increasingly pronounced regional differentiation. From 2005 to 2010, most cities remained at relatively low levels of ecological resilience, with a unimodal kernel density distribution and a relatively stable spatial pattern indicated by the standard deviation ellipse. From 2010 to 2020, rapid urbanization and industrialization were associated with a general decline in ecological resilience, an increase in low-resilience cities, and a synchronous turning point in the global Moran’s I. By 2024, the kernel density distribution evolved into a bimodal pattern. High-resilience cities were mainly concentrated in provincial capitals and exhibited a clustered “core–periphery” structure, while low-resilience cities formed contiguous clusters along the Sichuan Basin margin, Guizhou, and northeastern Yunnan, indicating increasing spatial polarization.
(2) Dominant driving factors of ecological resilience differentiation: The SDM results indicate significant spatial dependence in urban ecological resilience. Effect decomposition shows that indirect effects are generally stronger than direct effects, suggesting that spatial transmission plays a key role in shaping resilience patterns. Specifically, year-end resident population (X1) exhibits significant positive spatial spillover, while per capita GDP (X4) and the share of science and technology expenditure in fiscal expenditure (X8) show significant negative spillover effects. The interaction of positive and negative spillovers contributes to a pattern characterized by mutual reinforcement among low-resilience cities and limited diffusion of high-resilience cities. Although forest coverage (X12) is not statistically significant, its relatively large indirect effect suggests that its ecological contribution may be more strongly expressed through cross-regional ecosystem services such as carbon sequestration and hydrological regulation.
(3) Threshold effects and interaction mechanisms: The XGBoost–SHAP results indicate a nonlinear threshold for year-end resident population (X1), with a critical value of approximately 10 million. Below this level, its marginal contribution to ecological resilience is limited, whereas above this threshold, SHAP values increase to 0.15–0.17, indicating a scale-dependent nonlinear effect. Forest coverage (X12) exhibits a nonlinear “high-coverage effect,” where marginal contributions become negative beyond approximately 45%. In contrast, per capita GDP (X4) does not exhibit a clear local threshold, suggesting that its effects are more closely associated with spatial interaction mechanisms rather than local nonlinearities. The interaction between population size and its lagged term indicates that cities with stronger historical population bases tend to exhibit amplified marginal effects over time, reflecting cumulative and path-dependent dynamics.
(4) Inter-provincial heterogeneity in driving mechanisms: Significant differences exist across provinces. In Chongqing, population size (X1) and its lagged term (X1_lag1) are the dominant factors, reflecting strong population agglomeration and temporal inertia. In Sichuan, population-related variables remain dominant, while spatial spillover effects (Y_wlag, X1_wlag) and lagged fiscal science and technology expenditure (X8_lag1) also play important roles, indicating a combined influence of demographic, spatial, and policy factors. In Guizhou, spatial spillover variables (X1_wlag, Y_wlag) are the primary drivers, suggesting a stronger reliance on interregional effects than on local population size. In Yunnan, spatial dependence and lagged fiscal technology expenditure remain dominant, while the contribution of local population is relatively weaker, indicating greater dependence on regional networks and historical policy inputs.
5.2. Contributions of This Paper
This study makes three main contributions.
(1) It develops a two-layer analytical framework that integrates linear spatial econometric modeling with nonlinear machine learning approaches. By combining effect decomposition from the spatial Durbin model (SDM) with SHAP-based attribution analysis from XGBoost, this framework enables simultaneous examination of spatial spillover effects and nonlinear thresholds and interaction patterns that are not fully captured by traditional linear models, thereby providing a complementary perspective for analyzing urban ecological resilience.
(2) It provides a long-term perspective on the spatial polarization of urban ecological resilience in Southwest China. Unlike previous studies that often treat ecological resilience as an isolated attribute, this study demonstrates that it is shaped by both spatial dependence and nonlinear local dynamics. The SDM results identify spatial spillover patterns of key variables such as population size and per capita GDP, while the XGBoost–SHAP results further reveal potential nonlinear boundaries and threshold effects, such as population scale effects and forest coverage inflection patterns, offering a micro-level perspective on resilience heterogeneity.
(3) It identifies potential nonlinear and spatially mediated effects of forest coverage and per capita GDP. The results suggest that forest coverage may exhibit a nonlinear association with ecological resilience at higher levels, potentially reflecting trade-offs in land use structure and ecological management intensity. In addition, the influence of per capita GDP appears to be primarily associated with spatial spillover effects rather than localized impacts, suggesting that economic growth may be linked to interregional transmission processes such as industrial relocation and environmental pressure redistribution.
5.3. Policy Recommendations
Southwest China has complex topography and contains a large number of ecologically fragile areas, making it particularly sensitive to the impacts of urbanization and industrialization, which may contribute to variations in ecological resilience. At present, the region has formed several major economic growth poles, including the Chengdu–Chongqing Economic Circle, the Central Yunnan Economic Circle, and the Central Guizhou Economic Circle, while surrounding cities continue to face challenges such as population outflow, infrastructure limitations, and environmental pressure. Against the background of new-type urbanization and the Western Development Strategy, addressing regional imbalance and promoting coordinated ecological development has become an important policy concern.
(1) Population scale management. For small and medium-sized cities that have not yet reached the identified population scale threshold, policies aimed at improving infrastructure and public services may help enhance population attraction and partially activate demographic dividends. For large cities such as Chengdu and Chongqing, attention should be paid to the potential pressure on ecological carrying capacity associated with continued population agglomeration.
(2) Adaptive forest ecosystem management. The results suggest that forest coverage may exhibit nonlinear characteristics at higher levels. Accordingly, forest management strategies may benefit from shifting toward more diversified ecological land-use configurations, including wetland conservation and farmland ecosystem restoration, to enhance overall ecological resilience.
(3) Spatially coordinated ecological compensation mechanisms for economic development. Given that per capita GDP appears to be more closely associated with spatial spillover effects, the establishment of cross-regional coordination mechanisms for pollution control and ecological compensation may help mitigate interregional externalities. In particular, core economic zones such as the Chengdu–Chongqing Economic Circle, the Central Yunnan Urban Agglomeration, and the Central Guizhou Urban Agglomeration may play a leading role in promoting industrial coordination and regional cooperation.
(4) Regionally differentiated governance strategies. Due to the observed inter-provincial heterogeneity in driving mechanisms, differentiated policy approaches may be more appropriate. Chongqing may prioritize coordination between population concentration and ecological infrastructure. Sichuan may focus on strengthening environmental protection investment and facilitating green transformation of industries. Guizhou and Yunnan may place greater emphasis on improving local ecological governance capacity and reducing vulnerability to adverse spatial spillover effects, while exploring regional ecological compensation mechanisms to enhance resilience.
5.4. Limitations and Future Research
This paper also has certain limitations: (1) Regarding the construction of the ecological resilience indicator system, due to data availability constraints, the selected indicators may not fully capture all dimensions of urban ecological resilience. Future research could further refine the indicator framework by incorporating additional environmental, social, and innovation-related variables to improve comprehensiveness and robustness.
(2) Regarding the temporal scope of the panel data, the study covers the period 2005–2024 and includes major events such as the 2008 Wenchuan earthquake and the 2020 COVID-19 pandemic. While these events may have introduced structural changes in the driving mechanisms of ecological resilience, the current analysis only partially addresses temporal heterogeneity (see Appendix A.3) and does not explicitly integrate policy shock effects such as the “dual carbon” strategy. Future studies may consider employing quasi-experimental approaches, such as difference-in-differences or regression discontinuity designs, to better identify causal impacts of major policy interventions.
(3) Regarding the specification of the spatial weight matrix, this study compares multiple matrices, including economic-distance, inverse distance, and adjacency-based specifications, and finds that the economic-distance matrix provides the most consistent results in the robustness analysis. However, the choice of spatial weight matrix remains a structural assumption in spatial econometric modeling. Future research may further explore spatial heterogeneity and dependence structures using alternative frameworks such as geographically weighted regression or Bayesian spatial models.
Author Contributions
Conceptualization,methodology,Writing-original draft preparation,writing-review and editing, Y.L.;project administration,funding acquisition, and supervision,X.L.;data curation, X.G.; supervisionand visualization, C.L. All authors have read and agreed to the published version of the manuscript.
Funding
This research was supported by the US Clean Energy Fund(G-1601-24189) and the National Natural Science Foundation of China (41261039).
Institutional Review Board Statement
Not applicable.
Informed Consent Statement
Not applicable.
Data Availability Statement
The data underlying the results ofthis study can be obtained from the corresponding author upon a reasonable request.
Conflicts of Interest
The authors declare no conflict of interest.
References
- Zhao, R. D.; Fang, C. L.; Liu, H. M. Progress and Prospect of Urban Resilience Research. Prog. Geogr. 2020, 39, 1717–1731.
- Lü, Y. L.; Cao, X. H.; Wang, C. C. Systematic Transformation towards Urban Sustainable Development. Acta Ecol. Sin. 2019, 39, 1125–1134.
- Yin, K.; Wang, R. S.; An, Q. X.; Yao, L.; Liang, J. Using Eco-Efficiency as an Indicator for Sustainable Urban Development: A Case Study of Chinese Provincial Capital Cities. Ecol. Indic. 2014, 36, 665–671.
- Gao, Y.; Zhang, Y.; Xu, D. A Systematic Review of Urban Ecological Resilience: Emerging Frontiers in Process-Oriented Metabolic Research. Ecol. Modell. 2025, 510, 111319.
- Dakos, V.; Kéfi, S. Ecological Resilience: What to Measure and How. Environ. Res. Lett. 2022, 17, 043003.
- Spaans, M.; Waterhout, B. Building up Resilience in Cities Worldwide—Rotterdam as Participant in the 100 Resilient Cities Programme. Cities 2017, 61, 109–116.
- Holling, C. S. Resilience and Stability of Ecological Systems. Annu. Rev. Ecol. Syst. 1973, 4, 1–23.
- Holling, C. S. Engineering Within Ecological Constraints; National Academies Press: Washington, DC, 1996.
- Berkes, F.; Folke, C. Linking Social and Ecological Systems for Resilience and Sustainability. In Linking Social and Ecological Systems: Management Practices and Social Mechanisms for Building Resilience; Berkes, F., Folke, C., Eds.; Cambridge University Press: Cambridge, U.K., 1998; pp 1–25 .
- Slocum, M. G.; Mendelssohn, I. A. Use of Experimental Disturbances to Assess Resilience along a Known Stress Gradient. Ecol. Indic. 2008, 8, 181–190.
- Zhang, Y. Q.; Liu, J. F.; Zhu, Y. Spatiotemporal Evolution and Multi-Scenario Evolution Simulation of Ecological Resilience in Shenyang City. Environ. Sci. 2026, 47, 1858–1869.
- Folke, C. Resilience: The Emergence of a Perspective for Social-Ecological Systems Analyses. Glob. Environ. Change 2006, 16, 253–267.
- Chen, C.; Hellmann, J.; Berrang-Ford, L.; et al. A Global Assessment of Adaptation Investment from the Perspectives of Equity and Efficiency. Mitig. Adapt. Strateg. Glob. Change 2018, 23, 101–122.
- Hofmann, S. Z. 100 Resilient Cities Program and the Role of the Sendai Framework and Disaster Risk Reduction for Resilient Cities. Prog. Disaster Sci. 2021, 11, 100189.
- Wu, M. F.; Tian, Y.; Huang, J. Spatiotemporal Differentiation and Spatial Convergence of Social-Ecological Resilience in County Towns of Hubei Province. Resour. Sci. 2026, 48, 924–939.
- Su, F.; Xu, Y. X. Evolution Characteristics of Spatial Correlation Network and Driving Factors of County Ecological Resilience in Qinba Ecological Function Area. Resour. Environ. Yangtze Basin 2026, 35, 994–1007.
- Yang, J. F.; Qiao, P. R.; Li, Y. M.; et al. Review on Machine Learning Classification Problems and Algorithms. Stat. Decis. 2019, 35, 36–40.
- Li, H. Q.; Xu, X.; Yan, R. Q.; et al. Study on Ecological Resilience Assessment of Tibet Autonomous Region Based on Structural Equation Model. J. Ecol. Rural Environ. 2026, 1–20. doi:10.19741/j.issn.1673-4831.2025.0712.
- Wang, T. Z.; Liu, X. D.; Li, X. B.; et al. Study on Landscape Ecological Resilience Assessment and Driving Force Analysis in Beijing Section of Yongding River Basin. Geol. Bull. China 2026, 1–16. https://link.cnki.net/urlid/11.4648.P.20260413.1411.002.
- Zhou, A. H.; Yan, J. J.; Yang, G. Dynamic Evolution and Driving Mechanism of Ecological Resilience in Urban Agglomeration Based on "Potential-Capacity-Efficiency" Framework: A Case Study of Changsha-Zhuzhou-Xiangtan Urban Agglomeration. Acta Ecol. Sin. 2026, No. 16, 1–16. doi:10.20103/j.stxb.202507031719.
- Huang, J. Y.; Wang, M. Y.; Yuan, Y. T.; et al. Analysis of Spatiotemporal Changes and Influencing Factors of Ecological Resilience in Beijing-Tianjin-Hebei Region. J. Shenyang Agric. Univ. 2025, 56, 174–184.
- Han, Y.; Cui, X. F. Spatiotemporal Pattern and Influencing Factors of Ecological Resilience in the Yellow River Basin Based on XGBoost-SHAP Model. Environ. Sci. 2026, 1–22. doi:10.13227/j.hjkx.202509214.
- Yao, Y.; Liu, Y. X.; Fu, F. Y.; et al. Declined Terrestrial Ecosystem Resilience. Glob. Change Biol. 2024, 30, e17291.
- Li, M. L.; Li, Y. L. Impact Mechanism and Spatial Effect of Digital Economy on Ecological Resilience in the Yangtze River Economic Belt. Resour. Environ. Yangtze Basin 2026, 1–20. https://link.cnki.net/urlid/42.1320.x.20251210.1312.002.
- Duan, X. Y.; Ma, J.; Liu, X.; et al. Interactive Coupling and Influencing Factors of Ecological Resilience and Carbon Emission in Urban Agglomeration on the Northern Slope of Tianshan Mountains. Environ. Sci. 2026, 1–16. doi:10.13227/j.hjkx.202510250.
- Bai, L.; Zeng, F. M.; Jiang, L.; et al. Impact of Manufacturing Agglomeration on Ecological Resilience from the Perspective of Spatiotemporal Differentiation: A Case Study of the Yangtze River Economic Belt. Environ. Sci. 2026, 1–21. doi:10.13227/j.hjkx.202508224.
- She, H.; Li, P.; Wang, X. K.; et al. Study on Spatial Relationship between Ecological Resilience and Human Activity Intensity in Sanjiangyuan Region from 2000 to 2020. Res. Soil Water Conserv. 2025, 32, 403–412.
- Wang, R.; Cai, Y. L. Management Modes of Degraded Ecosystem in Southwest Karst Area of China. Chin. J. Appl. Ecol. 2010, 21, 1070–1080.
- Gunderson, L. H. Ecological Resilience—in Theory and Application. Annu. Rev. Ecol. Syst. 2000, 31, 425–439.
- Su, F.; Wu, J. W.; Lin, W. J. Spatiotemporal Evolution and Influencing Factors of Response Intensity of Ecological Resilience to Urban Renewal in Yangtze River Delta Urban Agglomeration. China Environ. Sci. 2026, 1–17. doi:10.19674/j.cnki.issn1000-6923.20260422.003.
- Wang, S. J.; Cui, Z. T.; Lin, J. J.; et al. Coupling Coordination between Urbanization and Ecological Resilience in the Pearl River Delta. Acta Geogr. Sin. 2021, 76, 973–991.
- Peng, W. B.; Xie, X. Q. Response of Ecological Resilience to Urban Renewal in Changsha-Zhuzhou-Xiangtan Urban Agglomeration. Resour. Environ. Yangtze Basin 2024, 33, 2369–2378.
- Chen, Y.; Jiang, C. L. Coupling Coordination and Influencing Factors of Digital-Real Integration and Ecological Resilience in Chinese Cities Based on CatBoost-SHAP Model. Environ. Sci. 2026, 1–15. doi:10.13227/j.hjkx.202511174.
- Han, J.; Han, L. Y. Construction of Spatial Weight Matrix Based on Economic Internal Circulation. Stat. Decis. 2026, 42, 64–68.
- Liu, H.; Ma, L.; Li, G. P. Evolution of Cold and Hot Spot Patterns of Economic Development and Its Influencing Factors in Beijing-Tianjin-Hebei Region. Geogr. Res. 2017, 36, 97–108.
- Hou, X. S.; Zhang, Z. Y.; Zhou, J. X. Study on Growth Effect and Action Path of China's Economic Structure. J. World Econ. 2013, 36, 88–111.
- Feng, Y. C.; Wang, X. H.; Hu, S. L. FDI, OFDI and China's Green Total Factor Productivity—Analysis Based on Spatial Econometric Model. Chin. J. Manag. Sci. 2021, 29, 81–91.
- Elhorst, J. P. Applied Spatial Econometrics; Raising the Bar. Spat. Econ. Anal. 2010, 5, 9–28.
- Chen, T.; Guestrin, C. XGBoost: A Scalable Tree Boosting System. In Proceedings of the 22nd ACM SIGKDD International Conference on Knowledge Discovery and Data Mining; ACM: New York, 2016; pp 785–794.
- Lin, Y. C.; Zhou, P.; Pan, Y.; et al. Exploration of Flood Disaster Impact Factors and Risk Assessment in Jingzhou City Based on Random Forest and XGBoost Algorithms. China Rural Water Hydropower 2022,6, 125–132.
- Wei, L.; Zhang, Y.; Li, Q.; et al. Study on Spatial Differentiation of National Land Ecological Space in China Based on Standard Deviation Ellipse. Ecol. Econ. 2020, 36, 176–181.
- Gao, S.; He, Z. J.; Liu, Z. Y.; et al. Application of Difference Fusion Analysis Based on Machine Learning in Air Quality Prediction. Electron. Meas. Technol. 2021, 44, 85–92.
Figure 3.
Spatiotemporal evolution map of ecological resilience in Southwest China. (Note: (a) 2005, (b)2010, (c) 2015, (d) 2020, (e) 2024).
Figure 3.
Spatiotemporal evolution map of ecological resilience in Southwest China. (Note: (a) 2005, (b)2010, (c) 2015, (d) 2020, (e) 2024).
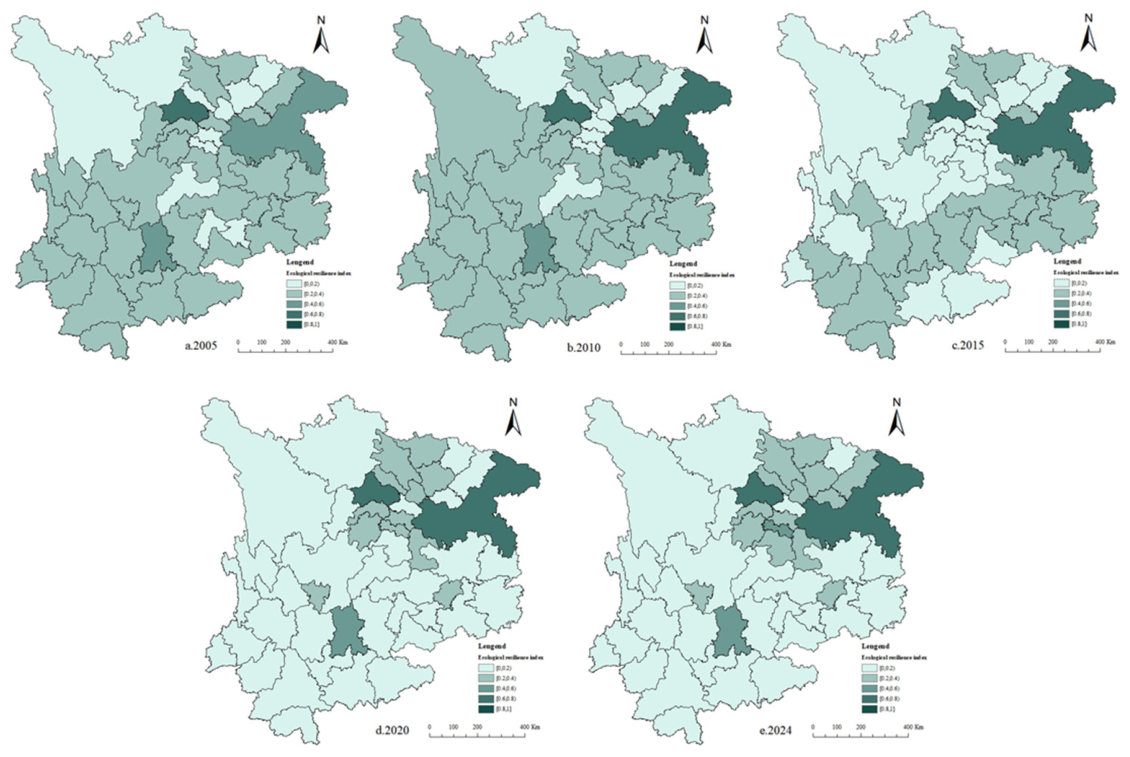
Figure 4.
Ecological resilience index centroid migration trajectory and standard deviation ellipse in Southwest China.
Figure 4.
Ecological resilience index centroid migration trajectory and standard deviation ellipse in Southwest China.
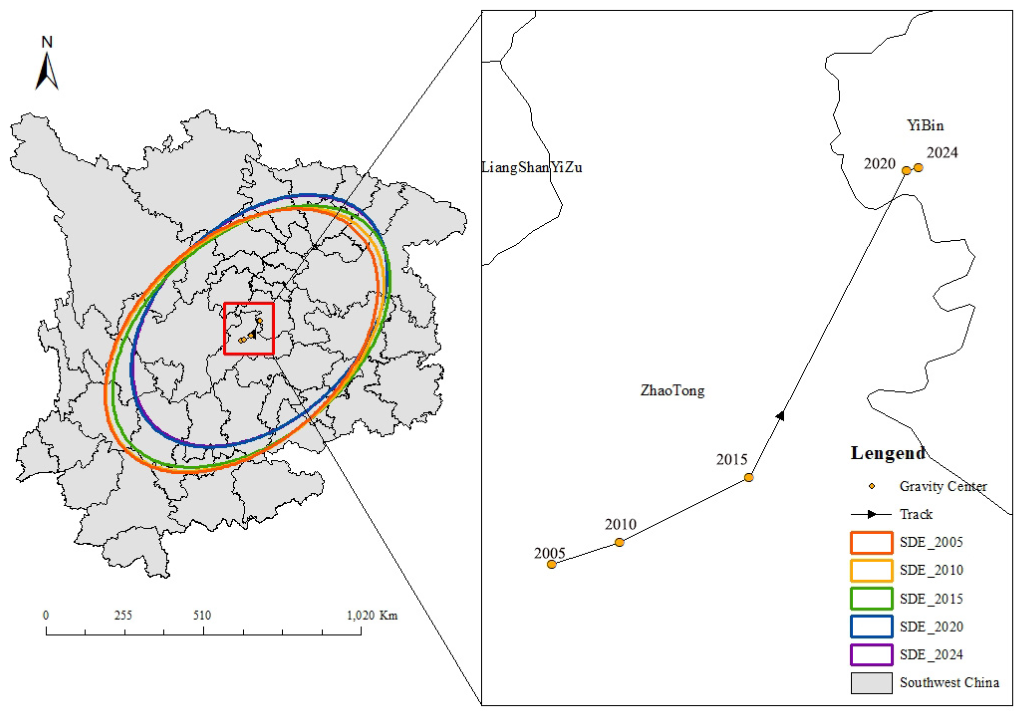
Figure 5.
Kernel density estimation of ecological resilience index in Southwest China.
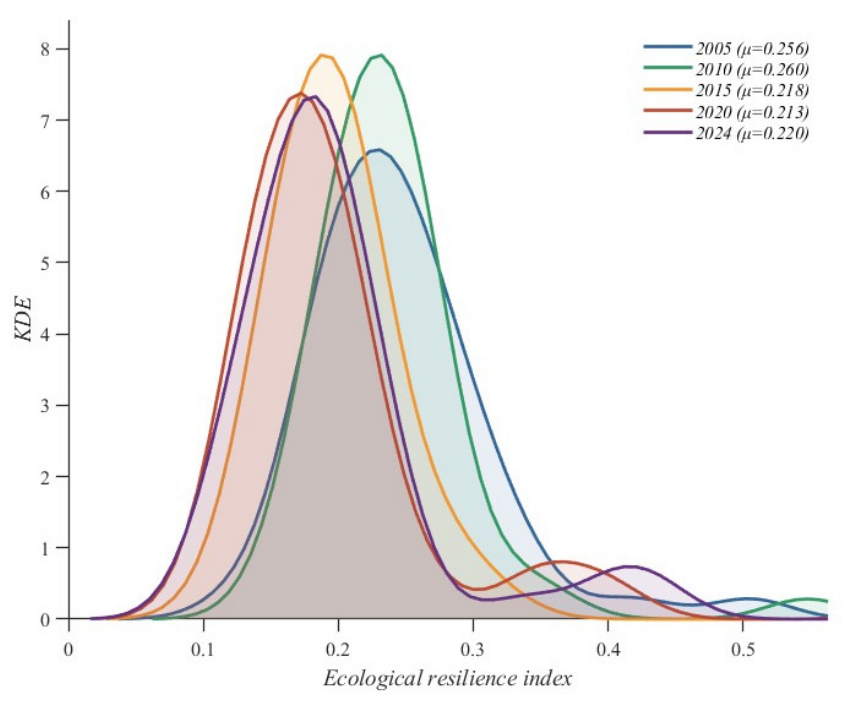
Figure 6.
Global Moran Index of Ecological Resilience.
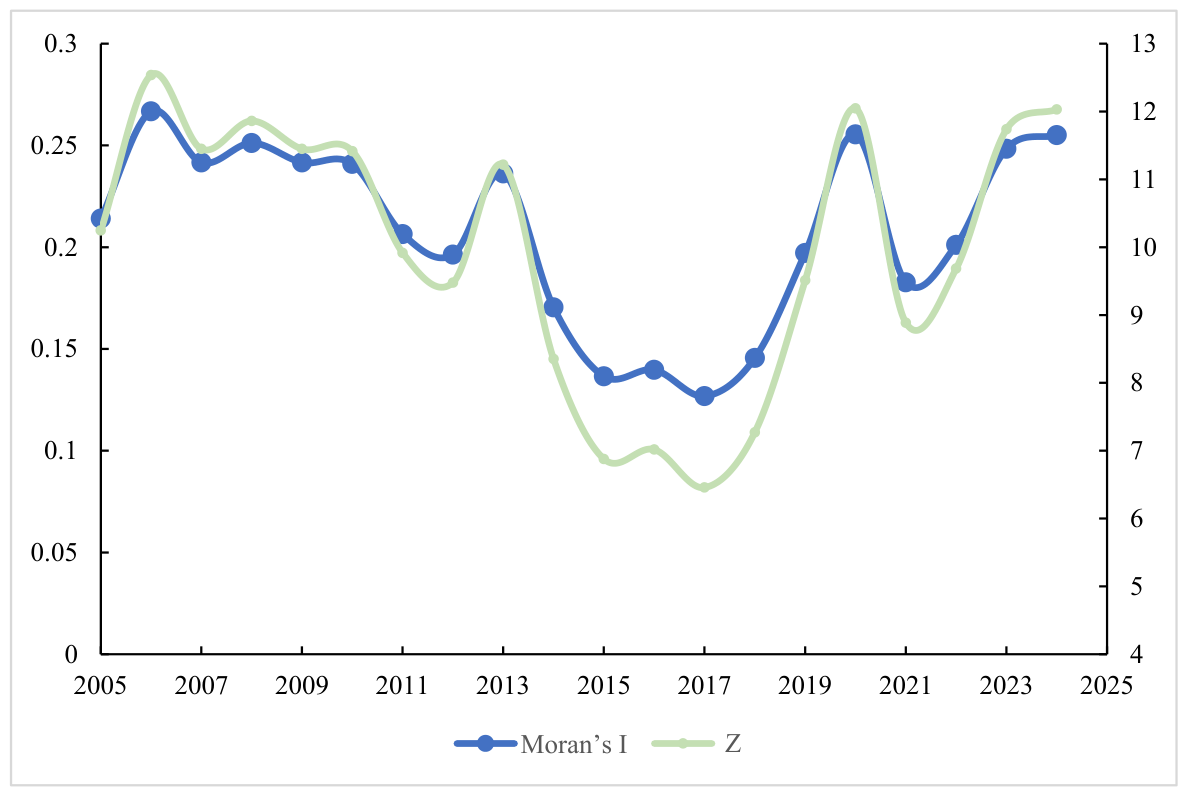
Figure 7.
Distribution map of hot and cold spots of ecological resilience index ((a) Description (Note: (a) 2005, (b) 2015, (c) 2024).
Figure 7.
Distribution map of hot and cold spots of ecological resilience index ((a) Description (Note: (a) 2005, (b) 2015, (c) 2024).
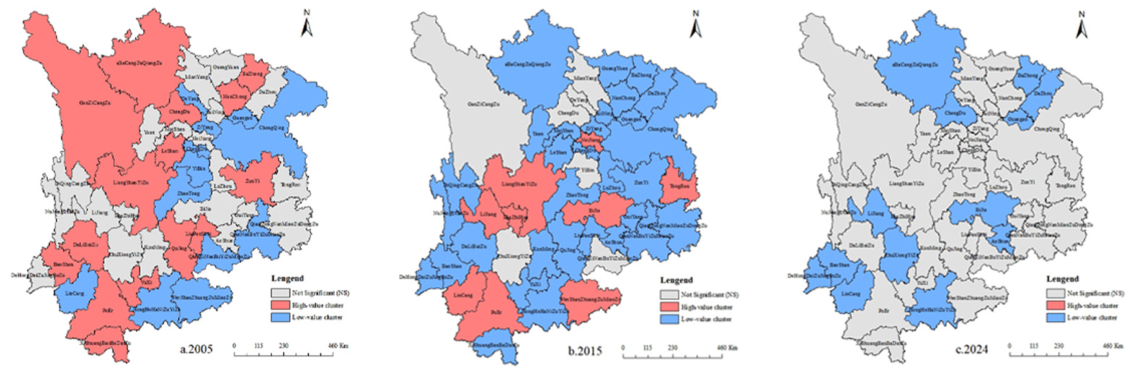
Figure 8.
SHAP Average Absolute Impact Ranking.
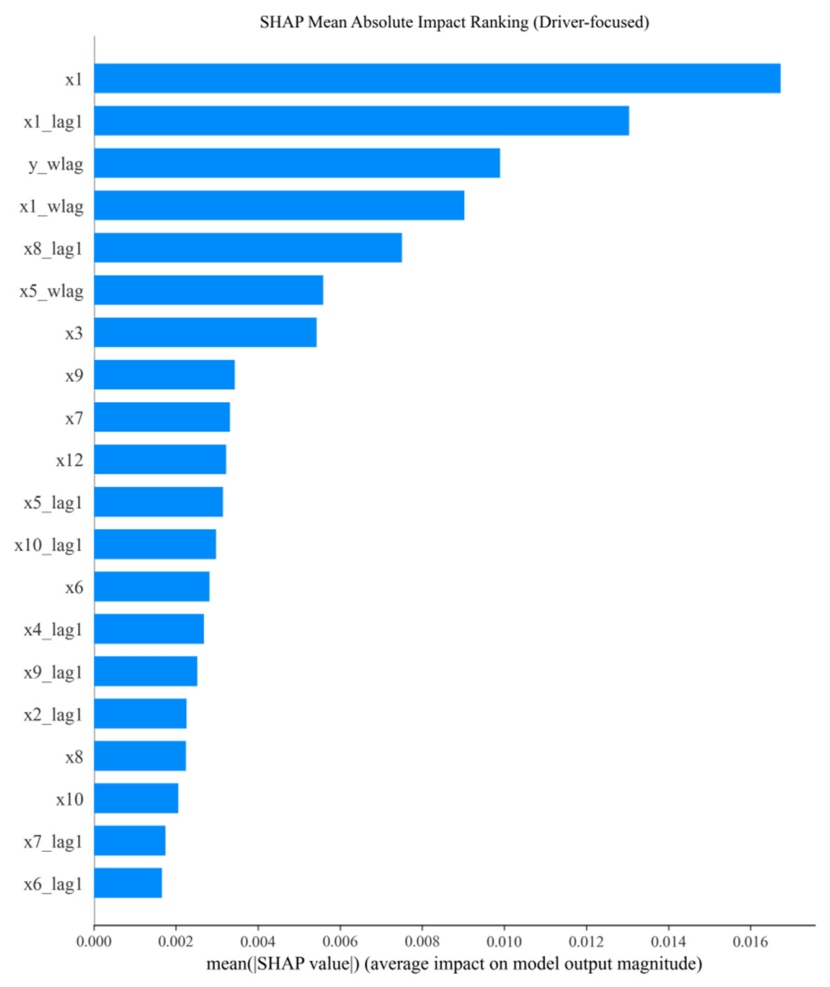
Figure 9.
SHAP Dependency Graphy.
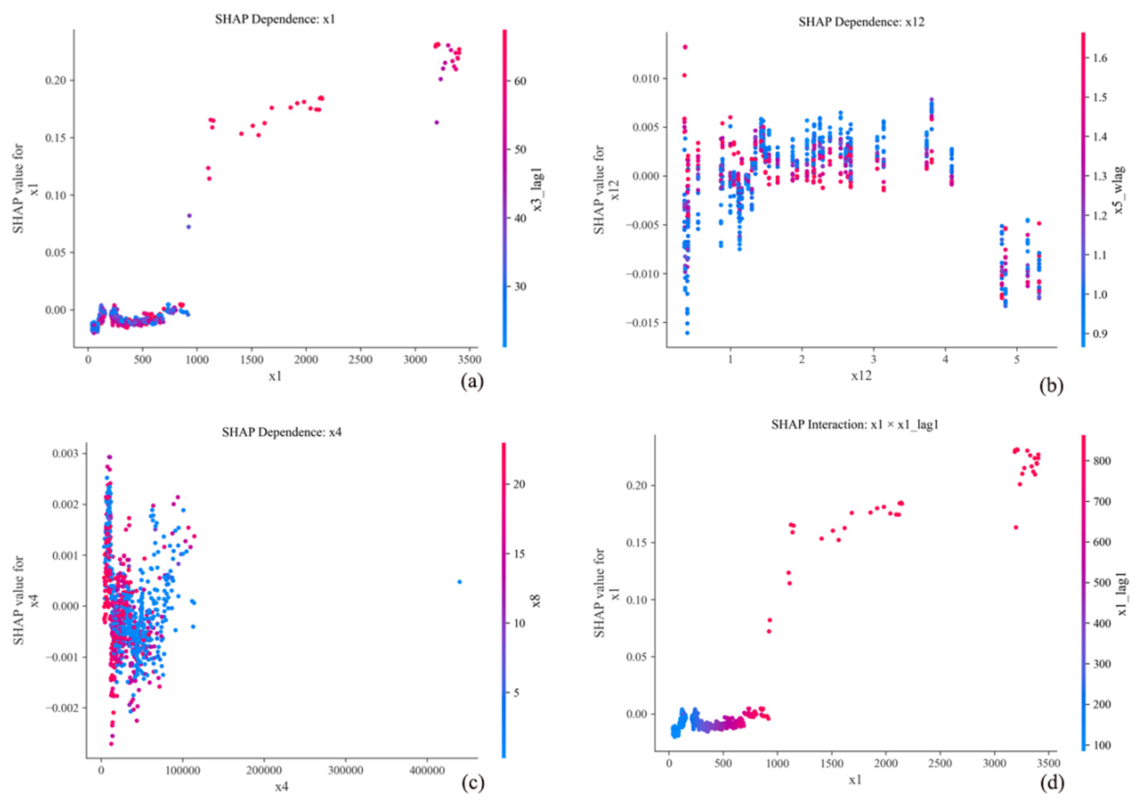
Figure 10.
Inter-provincial heterogeneity.
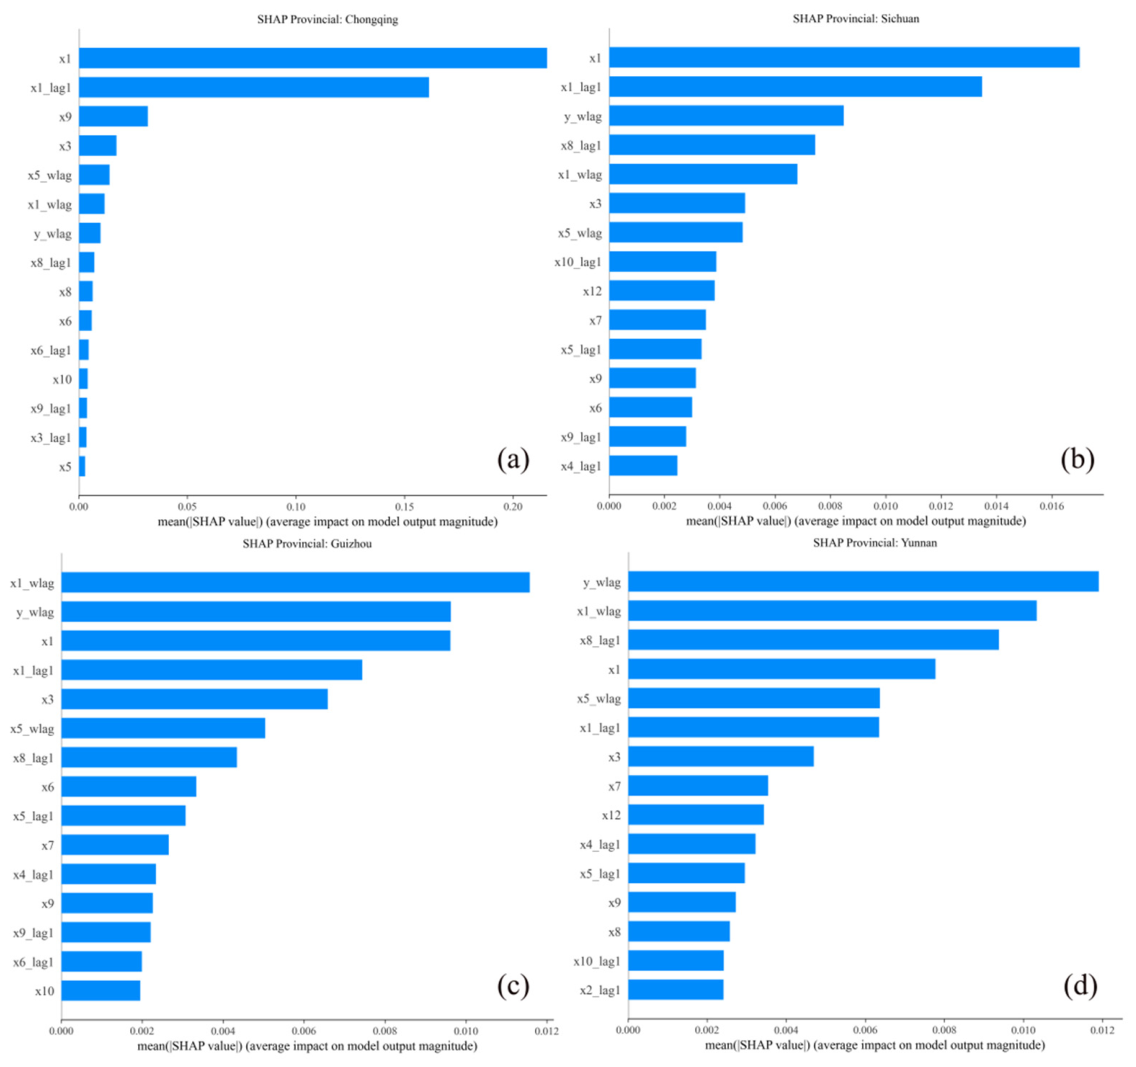
Table 1.
Ecological Resilience Evaluation Index System for Southwest China.
| Criteria Layer | Indicator Layer | Unit | Data Source | Indicator Attributes |
| Pressure | CO2 emissions | 10,000 tons | Peng [32] | - |
| N2O emissions | 10,000 tons | Peng [32] | - | |
| PM2.5 concentration | micrograms per cubic meter | Wang [31] | - | |
| population density | people per square kilometer | Wu [15] | - | |
| State | rate of harmless treatment of domestic waste | % | Peng [32] | + |
| rate of comprehensive utilization of industrial solid waste | % | Wang [31] | + | |
| rate of centralized treatment of urban sewage | % | Wu [15] | + | |
| percentage of days with good air quality | % | Wu [15] | + | |
| Response | energy consumption per unit of GDP | Tons of standard coal/10,000 yuan | Wu [15] | - |
| green coverage rate of built-up areas | % | Wu [15] | + | |
| per capita park green space area | square meters | Peng [32] | + | |
| energy conservation and environmental protection expenditure | ten thousand yuan | Wang [31] | + | |
| Innovation | distance from coastal ports | kilometers | - | |
| frequency of environmental regulation terms in government work reports | times | + | ||
| number of green patents | items | Wang [31] | + |
Table 4.
SDM regression results.
| Variable | Main | Wx |
| X1 | 0.3288*** | 0.9576*** |
| (0.0874) | (0.3546) | |
| X2 | 0.0202 | -0.0785 |
| (0.0170) | (0.0564) | |
| X3 | 0.0646 | 0.2350 |
| (0.0466) | (0.1922) | |
| X4 | 0.0012 | -0.3702*** |
| (0.0221) | (0.1171) | |
| X5 | 0.0168 | -0.0161 |
| (0.0265) | (0.1023) | |
| X6 | -0.0262** | -0.0305 |
| (0.0132) | (0.0445) | |
| X7 | 0.1277*** | 0.0133 |
| (0.0241) | (0.1335) | |
| X8 | -0.0153 | -0.1084** |
| (0.0221) | (0.0484) | |
| X9 | 0.1829*** | -0.2311** |
| (0.0216) | (0.1029) | |
| X10 | 0.0198 | -0.0589 |
| (0.0447) | (0.0516) | |
| X11 | 0.0241 | -0.0565 |
| (0.0202) | (0.0461) | |
| X12 | 0.0399 | 2.7318 |
| (0.1140) | (2.3562) | |
| rho | 0.2739*** | |
| (0.0930) | ||
| lgt_theta | -1.5558*** | |
| (0.2275) | ||
| sigma2_e | 0.1136*** | |
| (0.0057) | ||
| N | 940 |
*All variables standardized.*** p<0.01, ** p<0.05, * p<0.1.
Table 6.
Robustness Check.
| Indicators | Econ-Gauss | Hybrid-Add | IDW | Queen |
| Spatial lag coefficient (rho) | 0.2739*** | 0.2840*** | 0.2976*** | 0.0983*** |
| Random effect variance proportion | -1.5558*** | -2.1151*** | -2.0596*** | -2.1890*** |
| θ | 0.174 | 0.108 | 0.113 | 0.101 |
| Log-Likelihood | -395.05 | -397.83 | -394.09 | -394.94 |
| Sample size | 940 |
*All matrices are row-standardized before estimation. *** p<<0.01, ** p<<0.05, * p<<0.1.
Disclaimer/Publisher’s Note: The statements, opinions and data contained in all publications are solely those of the individual author(s) and contributor(s) and not of MDPI and/or the editor(s). MDPI and/or the editor(s) disclaim responsibility for any injury to people or property resulting from any ideas, methods, instructions or products referred to in the content. |
© 2026 by the authors. Licensee MDPI, Basel, Switzerland. This article is an open access article distributed under the terms and conditions of the Creative Commons Attribution (CC BY) license (http://creativecommons.org/licenses/by/4.0/).
Copyright: This open access article is published under a Creative Commons CC BY 4.0 license, which permit the free download, distribution, and reuse, provided that the author and preprint are cited in any reuse.


