Submitted:
30 May 2026
Posted:
01 June 2026
You are already at the latest version
Abstract
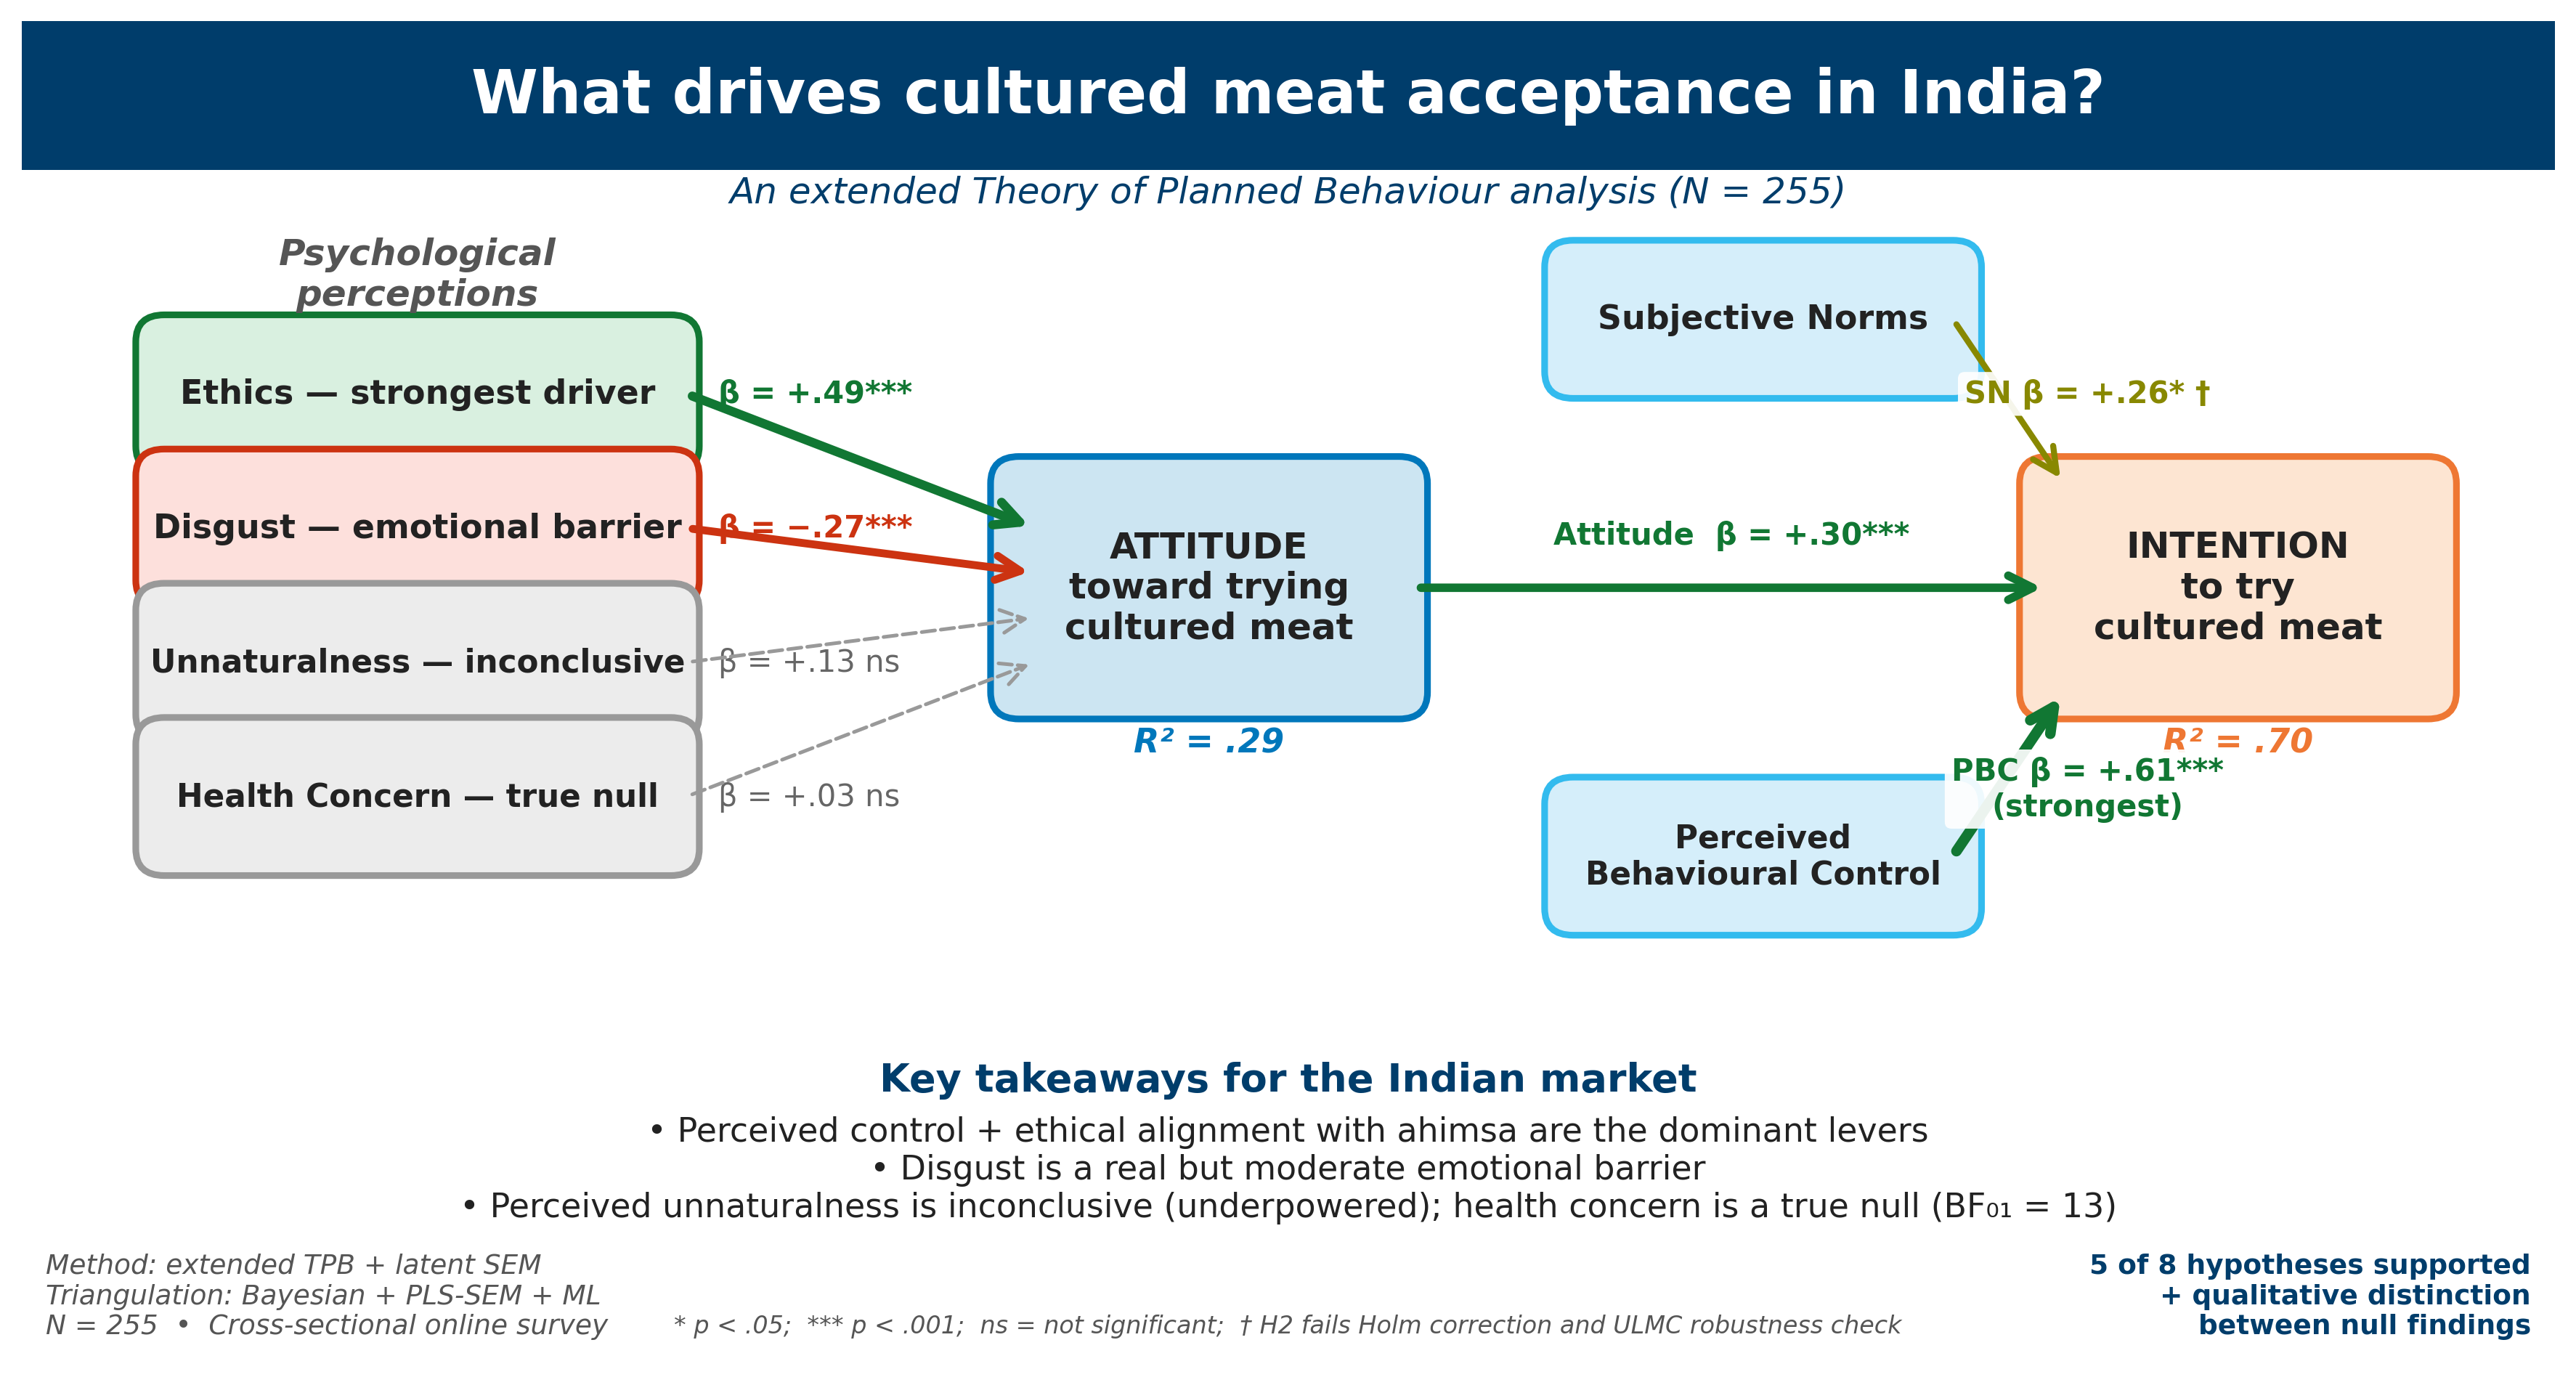
Cultured meat is proposed as a sustainable protein alternative, yet consumer acceptance remains the principal barrier to its commercialisation, and the evidence base is overwhelmingly Western. India — the world’s most populous nation, characterised by dietary pluralism and the principle of ahimsa — remains understudied. This study applied an extended Theory of Planned Behaviour to identify the psychological predictors of intention to try cultured meat among English-speaking Indian consumers (N = 255), using latent-variable structural equation modelling with a common-method-variance check. Perceived behavioural control was the strongest predictor of intention (β = 0.609, p < 0.001), followed by attitude (β = 0.295) and subjective norms (β = 0.263, sensitive to method variance); a dominance decomposition nonetheless attributed the largest share of explained variance to subjective norms. Ethical concern for animal welfare was the strongest predictor of attitude (β = 0.487) and disgust a significant negative predictor (β = −0.272); perceived unnaturalness, health concern, and dietary-group differences were non-significant. The model explained 69.9% of the variance in intention. Acceptance reflected perceived feasibility and ahimsa-aligned ethics rather than unnaturalness, diverging from Western evidence with implications for marketing and certification strategies.
Keywords:
cultured meat
; consumer acceptance
; Theory of Planned Behaviour
; India
; structural equation modelling
; alternative proteins
1. Introduction
The provision of adequate protein for a global population projected to reach approximately 10 billion people by 2050 represents one of the central challenges of contemporary food systems [1]. Conventional meat production, while constituting a significant source of high-quality dietary protein, is associated with considerable environmental costs — including high land and water use, greenhouse-gas emissions, and zoonotic risks — and these pressures are intensifying as demand for animal protein continues to rise [2]. Cultured meat, produced from animal cells cultivated in bioreactors without the slaughter of live animals, has been advanced as one possible response. This product is biologically similar to conventional meat but generated through a controlled biomanufacturing process. Notwithstanding the substantial advances in technology, the primary impediment to the commercialisation of cultured meat has transitioned from biological to behavioural, namely, consumer acceptance [2,3].
The field of research concerning the psychological factors influencing the acceptance of cultured meat has undergone significant expansion over the past decade, culminating in the identification of a limited number of recurrent predictors. Recent reviews have synthesised this rapidly expanding literature, underscoring the roles of awareness, information provision, and familiarity in shaping acceptance [4,5], while early analyses of Western media coverage noted a disproportionate focus on vegetarian reactions, with implications for cultured-meat marketing [6]. The Theory of Planned Behaviour (TPB) [7] has been the dominant framework, positing that behavioural intention is jointly shaped by attitude toward the behaviour, subjective norms, and perceived behavioural control. Extended TPB models tailored to cultured meat further include perceived unnaturalness and disgust as cognitive and affective barriers [8,9], ethical concern for animal welfare as a motivational antecedent [2,10], and health-related concerns as a potential ambivalent predictor. Recent studies applying the extended TPB to cultured meat in Western settings have generally reported attitude as the strongest predictor of intention, with perceived behavioural control playing a secondary role [11,12]. However, the extant evidence base is overwhelmingly drawn from Europe and North America, with comparatively little empirical work on Asian — and particularly Indian — consumers. Recent studies have extended this evidence base to further contexts — including China [13], Japan and China [14], Japan [15], Greece [16], Arab countries [17], and a cross-cultural comparison of Belgium, Chile, and China [18] — yet India remains conspicuously underrepresented.
India occupies a distinctive position in the global protein-transition debate. As the world’s most populous nation, with a rapidly expanding middle class and an increasing demand for animal-derived protein, the trajectory of meat consumption in India will have considerable global consequences. Concurrently, the Indian food system is characterised by deeply entrenched cultural and religious frameworks that lack direct parallels in the majority of Western contexts. The principle of ahimsa, central to Hindu and Jain ethical traditions, places non-violence towards all sentient beings at the core of dietary practice and supports one of the largest populations of vegetarians worldwide. The dietary practices of Muslim consumers, which include halal food options, and vegetarian diets, which are mandated by national food-labelling regulations, further structure what may be classified as acceptable food. These cultural particularities suggest that the psychological predictors identified in Western research may operate differently in the Indian context, both in their relative importance and in their meaning. However, the paucity of empirical evidence remains a salient issue. Cross-country studies have incorporated relatively small Indian subsamples [19], and dedicated Indian research has tended to focus on specific regions or informed consumer segments [20]. A recent comparative study of consumer trust in emerging food technologies across Croatia and India [21] likewise demonstrated that trust in technologies such as lab-grown meat is strongly culturally contingent, yet it did not model the psychological pathway from such perceptions to behavioural intention within a theory-driven framework. Consequently, a theory-driven empirical analysis of the psychological predictors of cultured meat acceptance among English-speaking Indian consumers is timely and necessary.
The present study addresses this gap by applying an extended TPB framework to a sample of English-speaking Indian adult consumers (N = 255). The model integrates the three core TPB predictors of behavioural intention – namely, attitude, subjective norms, and perceived behavioural control – with four extended psychological antecedents of attitude. These are: perceived unnaturalness, disgust, ethical concern for animal welfare, and health-related concern. The study will test eight hypotheses: H1–H3 will examine the core TPB predictors of intention; H4–H6 will test perceived unnaturalness (negative), disgust (negative), and ethical concern (positive) as predictors of attitude; H7 will examine whether attitudes and intentions differ across dietary patterns; and H8 (exploratory) will examine whether health-related concern negatively influences attitude. The hypothesised paths, depicted in the conceptual research model in Figure 1, are tested using latent-variable structural equation modelling, complemented by bootstrap mediation analysis and a robustness check for common method variance. The objective of this study is to identify which psychological predictors most strongly shape acceptance of cultured meat in India and to position these findings against the Western evidence base, with implications for marketing, certification, and consumer-education strategies in the Indian market.
2. Materials and Methods
2.1. Study Design
The present study employed a quantitative, cross-sectional research design. Data were collected through a self-administered online questionnaire hosted on Google Forms. The instrument was constructed on the basis of an extended Theory of Planned Behaviour framework adapted to the study of cultured meat acceptance and was developed iteratively through a pilot phase prior to deployment in the main study.
2.2. Pilot Study
A pilot study (N = 64) was conducted prior to the main data collection in order to evaluate the clarity, comprehensibility, internal flow, and completion time of the instrument. The pilot participants were drawn primarily from the researcher’s extended personal and professional networks, and the pilot instrument was administered bilingually in English and Hindi. The pilot phase indicated that the original questionnaire was excessively lengthy, which was associated with respondent fatigue. In response to this feedback, the instrument was substantially shortened. The focus was concentrated on the core TPB constructs of attitude, subjective norms, perceived behavioural control, and behavioural intention, while retaining the four psychological antecedents most consistently identified in the cultured meat literature. Minor refinements to item wording were additionally introduced in order to enhance clarity.
2.3. Participants and Procedure
The target population comprised adult residents of India with sufficient English proficiency to complete an online questionnaire. A non-probability convenience sampling strategy, supplemented by elements of snowball sampling, was adopted. The questionnaire was distributed electronically in December 2025 through social media platforms — including Instagram, WhatsApp, LinkedIn, and Facebook — in addition to personalised email invitations. Recipients were invited to forward the questionnaire to other potential respondents. No restrictions were imposed on age, gender, dietary pattern, or geographic location within India.
Prior to the commencement of the questionnaire, respondents were informed of the purpose of the study, the voluntary and anonymous nature of participation, and their right to withdraw at any time without consequence. Proceeding to the first question constituted informed consent.
A total of 259 responses were obtained. Following the application of listwise deletion to address missing values on the key analytic variables, the final analytic sample comprised N = 255 complete cases. The level of missingness was minimal and non-systematic (< 1% per variable); the missing values occurred exclusively on the four single-item perceptual measures (perceived unnaturalness, disgust, ethical concern, and health-related concern), and each of the four excluded cases omitted at least one of these items. The achieved sample size satisfied both the absolute minimum of 200 observations and the 10:1 ratio criterion conventionally recommended for structural equation modelling with maximum likelihood estimation [22].
2.4. Measures
The final instrument comprised eight sections. Section A consisted of a single screening item on prior awareness of cultured meat (binary: Yes / No). Section B presented a neutrally worded informational note describing the production process and characteristics of cultured meat, in line with the informed-choice paradigm widely adopted in this literature [3]; the framing of such information has itself been shown to affect cultured-meat acceptance [23]. Sections C through F contained the core TPB constructs. Attitude toward trying cultured meat was measured by four semantic differential items rated on 7-point scales (negative–positive, unpleasant–pleasant, unattractive–attractive, not worthwhile–worthwhile), following Ajzen [24]; all four items were oriented so that higher scores denote a more positive attitude, and no reverse-coding was required. Subjective norms were measured by two 7-point Likert items (1 = strongly disagree, 7 = strongly agree) capturing the injunctive component of perceived social approval. Perceived behavioural control was measured by two 7-point Likert items assessing perceived ease of access and personal autonomy, in line with Ajzen’s [25] treatment of perceived behavioural control and self-efficacy. Behavioural intention was measured by two 7-point Likert items addressing general intention and intention to purchase contingent on availability and reasonable price.
Section G assessed four psychological antecedents of attitude through single-item 7-point Likert measures: perceived unnaturalness, disgust, ethical concern for animal welfare, and health-related concern. The use of single-item measures for these constructs is consistent with established practice in cultured meat acceptance research, where each construct is theoretically concrete, unambiguous, and narrow in scope [8,9]. Section H collected demographic and background information, including age, gender, dietary pattern (omnivore, flexitarian, vegetarian, vegan), country of residence, education level, place of residence, and self-rated financial situation. The dietary-pattern item presented the general label “vegetarian” without distinguishing lacto- from lacto-ovo-vegetarian diets; this lack of granularity, which carries particular cultural significance in the Indian context, is acknowledged as a limitation.
The items were adapted from established TPB instruments for cultured meat and novel food acceptance research [3,7,8,9]. The adapted items are reproduced in line with standard scholarly use; the full instrument is available as Supplementary Materials.
2.5. Statistical Analysis
All statistical analyses were conducted in Python (version 3.13), using the scipy (1.14), statsmodels (0.14), semopy (2.4), numpy (2.2), and pandas (2.2) libraries. The significance threshold was set at α = 0.05 for all inferential tests.
Composite scores for the four multi-item TPB constructs were computed as the arithmetic mean of the constituent items. Internal consistency was assessed by Cronbach’s α and, given the documented limitations of α under unequal factor loadings, by McDonald’s ω estimated from confirmatory factor analysis loadings [26]. Descriptive statistics were computed for all study variables, and distributional properties were evaluated using the Shapiro-Wilk test. Pearson and Spearman correlations were computed in parallel in order to assess the robustness of bivariate associations under potential non-normality and the ordinal scaling of Likert-type items. Variance inflation factors were inspected to evaluate multicollinearity, with the conventional threshold of VIF < 5 adopted [27].
The hypothesised model was tested using latent-variable structural equation modelling with maximum likelihood estimation. The measurement model specified four latent constructs (Attitude, Subjective Norms, Perceived Behavioural Control, Intention), each indicated by its respective items, while the four psychological antecedents of attitude were retained as observed exogenous predictors. Global model fit was assessed using the χ² statistic, the Comparative Fit Index (CFI), the Tucker-Lewis Index (TLI), the Root Mean Square Error of Approximation (RMSEA), and the Standardised Root Mean Square Residual (SRMR), with the conventional thresholds recommended by Bentler and Bonett [28], Hu and Bentler [29], and Kline [22] adopted.
In view of the single-source self-report design, common method variance was assessed as a potential threat to construct validity [30]. The Unmeasured Latent Method Construct (ULMC) approach was employed as a post hoc robustness check [31]. A latent method factor was added to the baseline model and constrained to load on all multi-item indicators while remaining orthogonal to the substantive constructs. Indirect effects of the four perceptual predictors on intention through attitude were estimated using the percentile bootstrap method with 5,000 resamples; an indirect effect was deemed significant when its 95% confidence interval excluded zero [32,33].
Group differences in attitude and intention across dietary patterns (H7) were tested using a multi-method approach. A multivariate analysis of variance (MANOVA) with Pillai’s Trace was used to test the joint vector of attitude and intention, selected for its robustness to violations of multivariate normality and unequal group sizes [34]. One-way analysis of variance with Tukey HSD post hoc comparisons was conducted separately for attitude and intention, with effect sizes reported as η², ω², and Cohen’s f [35]. Non-parametric Kruskal-Wallis tests, including all four dietary groups, served as sensitivity checks. The Vegan subgroup (n = 4) was excluded from the parametric tests owing to insufficient size but was retained in the non-parametric analyses.
2.6. Robustness and Triangulation Analyses
The primary confirmatory analysis was the latent structural equation model with Holm-Bonferroni multiplicity correction and the ULMC robustness check (Section 2.5). In order to evaluate the robustness of those primary results and to triangulate the findings across statistical paradigms, a pre-specified set of secondary analyses was undertaken. These secondary analyses were planned in advance of estimation of the main structural model but were not formally preregistered. All analyses were conducted on the same analytic sample (N = 255) and were implemented in Python (version 3.13). The complete reproducibility package, including data, scripts, and a pinned requirements file, is available as Supplementary Materials.
Confirmatory versus exploratory tests were pre-classified. Hypotheses H1 to H6 and H7 were treated as confirmatory; the exploratory hypothesis H8 (health-related concern) was analysed separately and is reported with this label throughout.
Item-level psychometric diagnostics. For each multi-item scale, Cronbach’s α-if-item-deleted and the corrected item-total correlations were computed in addition to the scale-level α and McDonald’s ω reported above.
Multiplicity correction. Within the confirmatory family H1–H6, raw p-values from the latent structural paths were adjusted using the Holm–Bonferroni procedure at a familywise α of 0.05. The Benjamini–Hochberg false discovery rate procedure (q = 0.05) was applied to the exploratory hypothesis H8.
Bootstrap robust standard errors. The latent structural model was re-estimated in 1,000 non-parametric bootstrap resamples (resampled with replacement; case-level resampling). For each structural path the bootstrap mean, bootstrap standard error, percentile and bias-corrected 95% confidence intervals, and a two-sided bootstrap p-value were computed. Replicates yielding standardised coefficients with absolute value above 1.5 were treated as numerical failures (arising from near-singular factor loadings in the resampled covariance structure) and were excluded from the summary. The number of stable replicates is reported for every path.
Sensitivity power analysis. For every structural path, a post-hoc Wald-type sensitivity power analysis was conducted using the bootstrap-derived standard error as a realistic estimate of the path uncertainty. Achieved power was computed at the uncorrected α of 0.05 and at the most conservative Holm-corrected α of 0.05 / 6. The minimum detectable standardised effect at power = 0.80 was reported for each path under both α thresholds. This analysis was used to distinguish substantive null findings from findings whose non-significance may reflect inadequate power.
Binary-outcome sensitivity. The continuous intention measure was dichotomised at the scale midpoint (intention > 4 indicating willingness to try cultured meat). A logistic regression with heteroskedasticity-consistent (HC3) robust standard errors was estimated to test the core TPB predictors against the dichotomised outcome. The same procedure was applied to a dichotomised attitude outcome for the H4–H6 / H8 sensitivity model. Odds ratios with 95% confidence intervals, McFadden’s pseudo-R², and the area under the receiver operating characteristic curve (AUC) are reported.
Dominance analysis. The relative importance of the predictors in two ordinary least-squares models — intention regressed on the three core TPB constructs, and attitude regressed on the four perceptual predictors — was quantified by Budescu’s general-dominance decomposition [36]. For every predictor the average incremental R² across all 2ᵖ⁻¹ subsets of co-predictors was computed and normalised to the full-model R². This procedure provides an order-independent decomposition of explained variance and is reported alongside the structural-model coefficients to confirm the relative-importance ranking.
Triangulation across estimation paradigms. Three independent paradigms were used to confirm the patterns identified by covariance-based SEM. First, a Bayesian path model with weakly informative priors (b ~ Normal(0, 1) on standardised coefficients) was estimated in PyMC with four chains of 2,000 tuning and 2,000 sampling iterations. Posterior 95% credible intervals, posterior probability of direction, and Savage–Dickey approximations of the Bayes factor BF₁₀ against a point-null at zero are reported. Second, an elastic net regression (l1-ratio and penalty tuned by 10-fold cross-validation) and a random-forest regressor with permutation importance were estimated for both outcomes (intention and attitude). Predictors retained by the elastic net and ranked highly by random-forest permutation importance were compared with the set of predictors identified by the structural model. Third, the same path model was re-estimated under the variance-based partial least squares structural equation modelling (PLS-SEM) paradigm using a transparent in-house implementation of the canonical Wold–Tenenhaus algorithm with Mode A outer estimation and the path-weighting inner scheme. Five hundred non-parametric bootstrap resamples were used for inference on the PLS path coefficients. Convergence of the path estimates across the covariance-based SEM, the Bayesian path model, the regularised and non-parametric machine-learning analyses, and the PLS-SEM analysis was treated as triangulation evidence for the structural conclusions.
Two further sensitivity analyses were conducted as additional robustness checks on the Perceived Behavioural Control findings. To probe the borderline reliability of the two-item Perceived Behavioural Control scale, the latent structural model was re-estimated twice, with Perceived Behavioural Control represented by each of its two indicators alone (single-indicator specifications, with the item treated as a perfect measure of the construct). To address the high collinearity between Subjective Norms and Perceived Behavioural Control, an alternative hierarchical model specifying Subjective Norms as an antecedent of Perceived Behavioural Control (Subjective Norms → Perceived Behavioural Control → Intention) was estimated and compared against the parallel baseline model using the Akaike and Bayesian information criteria.
Generative AI statement. The authors used a generative AI assistant (Claude, Anthropic) to assist with the restructuring and formatting of the Python analysis code and with the code used to generate the manuscript figures. The study design, data collection, statistical analyses, results, and their interpretation were carried out by the authors; all AI-assisted code was independently executed and verified against the reported outputs, and the authors take full responsibility for the content.
3. Results
3.1. Sample Characteristics
Of 259 questionnaires submitted, 4 cases with missing values on the key analytic variables were excluded by listwise deletion, yielding a final analytic sample of N = 255 complete cases (< 1% missingness per variable). The demographic profile of the sample is presented in Table 1. Respondents were predominantly male (n = 177; 69.4%), with the remainder identifying as female (n = 73; 28.6%) or preferring not to disclose their gender (n = 5; 2.0%). The educational profile of the sample was substantially skewed toward tertiary attainment: 96.1% of respondents held a bachelor’s degree or higher, with 56.1% holding a bachelor’s (n = 143) and 40.0% a master’s degree or above (n = 102). Urban residence dominated the place-of-residence distribution, with 80.4% residing in cities of at least 100,000 inhabitants and 42.4% (n = 108) in cities of more than 500,000. All respondents reported India as their country of residence.
The dietary distribution comprised 63.1% omnivores (n = 161), 28.6% flexitarians (n = 73), 6.7% vegetarians (n = 17), and 1.6% vegans (n = 4). The very small size of the vegan subgroup precluded its inclusion in the parametric tests for Hypothesis 7 but was retained in the non-parametric sensitivity analyses. Prior awareness of cultured meat was reported by 45.1% of respondents (n = 115), with 54.9% (n = 140) indicating that they had not previously encountered the concept before participating in the survey.
The demographic profile of the present sample diverges substantially from that of the broader Indian adult population. Indian adults are approximately half male and the great majority do not hold a tertiary qualification, whereas the present sample is 69.4% male and 96.1% tertiary-educated. Approximately one-third of the Indian population resides in urban areas, whereas 80.4% of the present respondents reside in cities of at least 100,000 inhabitants. Additionally, the sample was restricted to respondents with sufficient English proficiency to complete the questionnaire, which over-represents English-literate urban adults. The achieved sample is therefore best characterised as an urban, tertiary-educated, English-literate, predominantly male early-adopter segment of the Indian consumer market rather than as a representative cross-section of Indian adult consumers; all subsequent results are interpreted accordingly.
3.2. Measurement Reliability and Descriptive Statistics
The internal consistency of the multi-item scales is reported in Table 2. The Attitude scale demonstrated excellent reliability (Cronbach’s α = 0.949; McDonald’s ω = 0.844), with item-total correlations exceeding 0.85 for all four indicators and with α-if-item-deleted values that did not rise above the full-scale α for any indicator (range: 0.929–0.941), confirming that no item warrants exclusion. The Subjective Norms scale (α = 0.934; ω = 0.807; inter-item r = 0.876) and the Intention scale (α = 0.908; ω = 0.734; inter-item r = 0.831) both exhibited strong internal consistency. The Perceived Behavioural Control scale demonstrated borderline acceptable reliability (α = 0.698; ω = 0.490; inter-item r = 0.536), consistent with the known sensitivity of ω to unequal factor loadings in two-item scales. The results involving PBC are therefore interpreted with appropriate caution, although the inter-item correlation remained above the conventional threshold of 0.50. The four perceptual constructs (G1–G4) were measured by single items and are not eligible for internal-consistency estimation.
Descriptive statistics for all study variables are reported in Table 2. Attitude (M = 3.36, SD = 1.84) and Subjective Norms (M = 3.47, SD = 2.01) were positioned below the scale midpoint, indicating that initial evaluations of cultured meat were, on average, modestly unfavourable. Intention to try cultured meat was similarly below the midpoint (M = 3.57, SD = 2.10). In contrast, Perceived Behavioural Control was positioned slightly above the midpoint (M = 4.20, SD = 1.93), suggesting moderate perceived feasibility of trying cultured meat. Among the perceptual predictors, Health Concern recorded the highest mean (M = 5.39, SD = 1.91), with Unnaturalness (M = 4.59, SD = 2.16) and Ethics (M = 4.57, SD = 2.08) positioned above the midpoint and Disgust (M = 3.89, SD = 2.09) positioned slightly below. All variables exhibited mild-to-moderate skewness (range: −0.92 to 0.41) and were platykurtic (kurtosis range: −1.29 to −0.36). Shapiro-Wilk tests were significant for most variables, as is typical with N > 200; maximum likelihood estimation in structural equation modelling is robust to such departures from normality.
3.3. Bivariate Correlations and Multicollinearity
The bivariate correlation matrix is presented in Table 3. Within the core TPB constructs, Attitude was strongly correlated with Intention (r = 0.694; ρ = 0.696; p < 0.001), as were Subjective Norms (r = 0.761; ρ = 0.772; p < 0.001) and Perceived Behavioural Control (r = 0.709; ρ = 0.714; p < 0.001). Subjective Norms and Perceived Behavioural Control were themselves substantially correlated (r = 0.697; ρ = 0.691; p < 0.001), a pattern that proved to be consequential for the bootstrap stability of the SN and PBC paths in the latent SEM (see Section 3.5). Among the perceptual predictors, Ethics demonstrated a strong positive association with Attitude (r = 0.502; ρ = 0.494; p < 0.001), Disgust a weak negative association (r = −0.139; ρ = −0.138; p < 0.05), and Unnaturalness no significant association with Attitude (r = 0.055; ρ = 0.035; p > 0.05). Unnaturalness and Disgust were themselves strongly correlated (r = 0.690; ρ = 0.699; p < 0.001), foreshadowing the multicollinearity diagnostics reported below. The directional pattern of these correlations is consistent with the hypothesised positive associations for H1, H2, H3, and H6 and with the hypothesised negative association for H5; the near-zero correlation between Unnaturalness and Attitude foreshadows the inconclusive H4 result.
The Pearson and Spearman coefficients were closely convergent across all variable pairs, supporting the assumption of approximately linear association and indicating that the observed patterns were not artefacts of distributional assumptions or of the ordinal scaling of Likert-type items. Variance Inflation Factors were inspected to evaluate multicollinearity in both regression models. For the predictors of Attitude, VIFs ranged from 1.18 (Ethics) to 2.26 (Unnaturalness), with Unnaturalness and Disgust exhibiting the highest values. For the predictors of Intention, VIFs ranged from 1.97 (PBC) to 2.64 (Subjective Norms). All values were below the conventional threshold of 5, indicating that multicollinearity does not invalidate the regression estimates. However, the shared variance between Subjective Norms and Perceived Behavioural Control, and between Unnaturalness and Disgust, is taken into account when the structural results are interpreted.
3.4. Structural Model — Hypothesis Testing
The latent structural equation model exhibited mixed global fit. The incremental fit indices satisfied the conventional thresholds (CFI = 0.920; TLI = 0.901; both ≥ 0.90), but the Root Mean Square Error of Approximation exceeded the recommended cutoff (RMSEA = 0.110), indicating suboptimal absolute fit, and the χ² test was significant (χ²(77) = 313.50, p < 0.001), as is typical with samples of N > 200. The Unmeasured Latent Method Construct (ULMC) model, incorporating a latent method factor to control for common method variance, demonstrated improved fit on all indices (CFI = 0.961; TLI = 0.945; RMSEA = 0.082; SRMR = 0.045), indicating that some shared method variance is present in the data.
Standardised path coefficients and the results of the Holm-corrected hypothesis testing are reported in Table 4 and visualised in the path diagram in Figure 2. Among the core TPB predictors of Intention (H1–H3), all three exhibited the expected positive direction. Perceived Behavioural Control was the strongest predictor of Intention (H3: β = 0.609, p < 0.001; Holm-corrected p < 0.001), followed by Attitude (H1: β = 0.295, p < 0.001; Holm-corrected p < 0.001). Subjective Norms also predicted Intention in the baseline model (H2: β = 0.263, p = 0.032), but the path failed to retain significance under the Holm correction (Holm-corrected p = 0.064) and lost significance entirely in the ULMC robustness model (β = 0.417, p = 0.111), indicating that the effect of subjective norms is sensitive to both multiple-testing correction and common method variance. The bootstrap analysis confirmed this pattern: 25.9% of the bootstrap replicates exhibited extreme estimates for the Subjective Norms and Perceived Behavioural Control paths that exceeded the |β| = 1.5 stability threshold, reflecting the high collinearity between the two predictors (r = 0.697). The interpretation of H2 is therefore qualified accordingly. Furthermore, the two-item Perceived Behavioural Control scale exhibited borderline internal consistency (Cronbach’s α = 0.698; McDonald’s ω = 0.490, reported in Table 2), and the magnitude of the PBC path coefficient should be interpreted in light of this measurement limitation.

Table 4.
Latent structural model — path coefficients, multiplicity correction, common-method-variance robustness check, and multi-paradigm triangulation.
Panel A. Frequentist SEM with Holm-Bonferroni correction and ULMC robustness check.
Table 4.
Latent structural model — path coefficients, multiplicity correction, common-method-variance robustness check, and multi-paradigm triangulation.
Panel A. Frequentist SEM with Holm-Bonferroni correction and ULMC robustness check.
| Hyp. | Path | β | p | Holm p | β (ULMC) | p (ULMC) |
| H1 | Attitude → Intention | 0.295 | < 0.001 | < 0.001 | 0.370 | < 0.001 |
| H2 | Subjective Norms → Intention | 0.263 | 0.032 | 0.064 | 0.417 | 0.111 |
| H3 | PBC → Intention | 0.609 | < 0.001 | < 0.001 | 0.558 | < 0.001 |
| H4 | Unnaturalness → Attitude | 0.133 | 0.103 | 0.103 | 0.078 | 0.433 |
| H5 | Disgust → Attitude | −0.272 | < 0.001 | 0.002 | −0.174 | 0.072 |
| H6 | Ethics → Attitude | 0.487 | < 0.001 | < 0.001 | 0.361 | < 0.001 |
| H8 (expl.) | Health Concern → Attitude | 0.025 | 0.729 | 0.729 | 0.002 | 0.985 |
Note. β = standardised structural path coefficient. p = raw two-sided Wald p-value. Holm p = Holm–Bonferroni adjusted p-value, family of H1–H6 at α = 0.05; Benjamini–Hochberg q-value reported for the exploratory H8. β (ULMC) and p (ULMC) = coefficient and p-value in the model that includes an unmeasured latent method construct. † H2 lost significance under Holm and under ULMC, indicating sensitivity to both multiple-testing correction and common method variance.
Table 4.
Panel B. Multi-paradigm triangulation: Bayesian path model, PLS-SEM, and bootstrap inference.
Table 4.
Panel B. Multi-paradigm triangulation: Bayesian path model, PLS-SEM, and bootstrap inference.
| Hyp. | Path | Bayes mean | 95% CrI | BF₁₀ | PLS β | Bootstrap 95% CI |
| H1 | Attitude → Intention | +0.253 | [+0.154, +0.350] | very large | +0.244 | [+0.142, +0.463] |
| H2 | Subjective Norms → Intention | +0.378 | [+0.264, +0.488] | very large | +0.345 | [+0.056, +0.541] |
| H3 | PBC → Intention | +0.320 | [+0.226, +0.413] | very large | +0.364 | [+0.344, +0.778] |
| H4 | Unnaturalness → Attitude | +0.130 | [−0.032, +0.291] | 0.30 (BF₀₁ = 3.3) | +0.131 | [−0.029, +0.292] |
| H5 | Disgust → Attitude | −0.263 | [−0.414, −0.112] | 55.8 | −0.264 | [−0.430, −0.110] |
| H6 | Ethics → Attitude | +0.474 | [+0.359, +0.592] | very large | +0.476 | [+0.374, +0.593] |
| H8 (expl.) | Health Concern → Attitude | +0.023 | [−0.118, +0.168] | 0.07 (BF₀₁ = 14.3) | +0.023 | [−0.131, +0.170] |
Note. Bayes mean = posterior mean from PyMC (4 chains × 2,000 tune + 2,000 draws; prior b ~ Normal(0, 1) on standardised coefficients). 95% CrI = equal-tailed 95% credible interval. BF₁₀ = Savage–Dickey Bayes factor against a point-null at β = 0; BF₀₁ = 1 / BF₁₀ reported in parentheses where evidence favours the null. PLS β = standardised structural path coefficient from PLS-SEM (Wold–Tenenhaus, Mode A, path-weighting inner scheme). Bootstrap 95% CI = percentile interval from 1,000 non-parametric bootstrap resamples of the latent SEM, after removal of replicates with |β| > 1.5.
Table 4.
Panel C. Integrated decision across all analytic layers.
| Hypothesis | Path | Final decision |
| H1 | Attitude → Intention | Supported |
| H2 | Subjective Norms → Intention | Supported in baseline; not retained under Holm or ULMC† |
| H3 | PBC → Intention | Supported |
| H4 | Unnaturalness → Attitude | Inconclusive (underpowered)‡ |
| H5 | Disgust → Attitude | Supported (marginal under ULMC) |
| H6 | Ethics → Attitude | Supported |
| H8 (expl.) | Health Concern → Attitude | Not supported — true null§ |
Note. † H2 fails Holm correction (p = 0.064) and loses significance under ULMC (p = 0.111); the path is sensitive to both. ‡ H4 was not statistically supported but the observed effect (β = 0.133) lay below the minimum detectable effect at conventional power (MDE = 0.227 at α = 0.05, power = 0.80) and the Bayes factor evidence for the null was moderate (BF₀₁ = 3.3); seeTable 5for the corresponding power analysis. § H8 was robustly non-significant and the Bayesian evidence in favour of the null was strong (BF₀₁ = 13).
Among the extended antecedents of Attitude (H4–H6) and the exploratory predictor (H8), Ethics emerged as the strongest predictor of Attitude (H6: β = 0.487, p < 0.001; Holm-corrected p < 0.001), with the effect remaining robust in the ULMC model (β = 0.361, p < 0.001) and across all triangulation analyses. Disgust was a significant negative predictor (H5: β = −0.272, p < 0.001; Holm-corrected p = 0.002), though the effect was attenuated to marginal significance in the ULMC model (β = −0.174, p = 0.072). Perceived Unnaturalness did not significantly predict Attitude (H4: β = 0.133, p = 0.103; Holm-corrected p = 0.103) and, unexpectedly, exhibited a positive rather than the hypothesised negative direction. The exploratory predictor Health Concern was likewise non-significant (H8: β = 0.025, p = 0.729; BH-FDR-corrected p = 0.729). Hypotheses H1, H3, H5, and H6 were therefore supported under both raw and corrected p-values; H2 was supported in the baseline model only; H4 and H8 were not supported. The two endogenous constructs were well-explained by their predictors: R² = 0.699 for Intention and R² = 0.286 for Attitude (see also the path diagram in Figure 2 for the full set of estimated paths).
3.5. Robustness and Triangulation Analyses
The convergence of results across the four estimation paradigms is summarised in Table 4 (final two columns) and visualised as a forest plot in Figure 3, providing strong triangulation evidence for the structural conclusions. The Bayesian path model yielded posterior means closely aligned with the frequentist estimates (e.g., H1 posterior mean = 0.253, 95% credible interval [0.154, 0.350]; H6 posterior mean = 0.474, 95% CrI [0.359, 0.592]). The posterior probability of direction exceeded 0.99 for H1, H2, H3, H5, and H6, supporting the corresponding decisions. The Savage–Dickey approximations of the Bayes factor against a point null were extremely large for the supported paths (BF₁₀ > 10⁵ for H1, H2, H3, H6) and provided two qualitatively different characterisations of the non-significant predictors: for H4 (Unnaturalness), the Bayes factor provided moderate evidence in favour of the null (BF₀₁ = 3.3), whereas for H8 (Health Concern) the evidence in favour of the null was strong (BF₀₁ = 13). This distinction is particularly informative for the interpretation of the two null findings; the full set of posterior densities, with the corresponding Bayes factors, is shown in Figure 4.
The post-hoc sensitivity power analysis, summarised in Table 5 and visualised in Figure 5, reinforces this distinction. Power to detect the observed Unnaturalness–Attitude path at the uncorrected α = 0.05 was estimated at 0.38, with a minimum detectable standardised effect of 0.227 at power = 0.80, a value substantially larger than the observed β = 0.133. The non-significance of H4 may therefore reflect insufficient power rather than a true null effect. By contrast, power to detect the H8 effect was estimated at 0.06 with an observed β of 0.025; this combination — convergent Bayesian support for the null, a minute observed effect, and very low power for detection — indicates that H8 represents a substantively negligible effect rather than an underpowered miss. Power was adequate (≥ 0.80) for the supported paths H1, H3, H5, and H6 at both the uncorrected and the Holm-corrected α thresholds.
Table 5.
Sensitivity power analysis and general-dominance decomposition of explained variance.
Panel A. Post-hoc sensitivity power for each structural path (N = 255).
Table 5.
Sensitivity power analysis and general-dominance decomposition of explained variance.
Panel A. Post-hoc sensitivity power for each structural path (N = 255).
| Hypothesis | Path | β | SE | Power α = 0.05 | Power α = 0.05/6 | MDE α = 0.05 | MDE α = 0.05/6 |
| H1 | Attitude → Intention | 0.295 | 0.084 | 0.94 | 0.81 | 0.236 | 0.293 |
| H2 | Subjective Norms → Intention | 0.263 | 0.119 | 0.60 | 0.34 | 0.332 | 0.413 |
| H3 | PBC → Intention | 0.609 | 0.115 | 1.00 | 1.00 | 0.322 | 0.400 |
| H4 | Unnaturalness → Attitude | 0.133 | 0.081 | 0.38 | 0.16 | 0.227 | 0.282 |
| H5 | Disgust → Attitude | −0.272 | 0.081 | 0.92 | 0.77 | 0.226 | 0.281 |
| H6 | Ethics → Attitude | 0.487 | 0.056 | 1.00 | 1.00 | 0.157 | 0.195 |
| H8 (expl.) | Health Concern → Attitude | 0.025 | 0.076 | 0.06 | 0.01 | 0.213 | 0.265 |
Note. β = standardised path coefficient. SE = realistic standard error from the bootstrap distribution (Table 4, Panel B). Power = post-hoc Wald-type two-sided power at the listed α; α = 0.05/6 corresponds to the most conservative step of the Holm–Bonferroni correction within the confirmatory family H1–H6. MDE = minimum detectable standardised coefficient at power = 0.80 and the listed α. Paths with power < 0.80 are interpreted as potentially underpowered; the most consequential case is H4 (Unnaturalness → Attitude), for which the observed β (0.133) lies below the MDE at α = 0.05 (0.227), indicating that the non-significant finding may reflect inadequate power rather than a true null.
Table 5.
Panel B. Budescu general-dominance decomposition.
| Outcome (full R²) | Predictor | General dominance | % of full R² |
| Intention (full R² = 0.699) | Subjective Norms | 0.2711 | 38.8% |
| Intention (full R² = 0.699) | PBC | 0.2293 | 32.8% |
| Intention (full R² = 0.699) | Attitude | 0.1988 | 28.4% |
| Attitude (full R² = 0.286) | Ethics | 0.2266 | 79.3% |
| Attitude (full R² = 0.286) | Disgust | 0.0377 | 13.2% |
| Attitude (full R² = 0.286) | Health Concern | 0.0124 | 4.3% |
| Attitude (full R² = 0.286) | Unnaturalness | 0.0089 | 3.1% |
Note. General dominance values are computed as the average incremental R² across all 2ᵖ⁻¹ subsets of co-predictors [37]. The values sum (subject to rounding) to the full-model R² for each outcome. The ranking that emerges from the dominance decomposition for Intention (Subjective Norms > PBC > Attitude) differs from the ranking implied by the standardised SEM path coefficients (PBC > Attitude > Subjective Norms), reflecting the high shared variance among the three TPB predictors. For the Attitude model the dominance and SEM rankings are concordant (Ethics dominates, followed by Disgust).
The relative-importance ranking of the predictors, as quantified by Budescu’s general-dominance decomposition, is reported in Table 5. For the prediction of Intention, Subjective Norms contributed 38.8% of the explained variance, Perceived Behavioural Control 32.8%, and Attitude 28.4%. This ordering differs from the ranking implied by the standardised SEM path coefficients, in which Perceived Behavioural Control exhibits the largest unique partial contribution, and reflects the high shared variance among the three TPB predictors. For the prediction of Attitude, Ethics dominated the explained variance (79.3%), with Disgust accounting for 13.2% and Unnaturalness and Health Concern accounting for negligible proportions (3.1% and 4.3%, respectively). The dominance ranking complements the partial-regression evidence for the H1–H3 predictors of Intention and for the H4–H6 plus H8 predictors of Attitude.
The binary-outcome sensitivity analysis provided additional support for the core TPB structure. When Intention was dichotomised at the scale midpoint, a logistic regression of the dichotomised outcome on the three core TPB predictors (with HC3 robust standard errors) yielded an area under the receiver operating characteristic curve of AUC = 0.927 and McFadden’s pseudo-R² = 0.493, indicating very strong discrimination between respondents willing and unwilling to try cultured meat. The corresponding model for dichotomised Attitude — regressed on the four perceptual predictors — yielded McFadden’s pseudo-R² = 0.187, consistent with the more modest explanatory power of the perceptual predictors in the SEM (R² = 0.286).
The PLS-SEM analysis, the elastic-net regression, and the random-forest analysis all converged on the same predictor set. The PLS-SEM path estimates were closely aligned with the covariance-based SEM estimates for the antecedents of Attitude (H4: β = 0.131 vs 0.133; H5: β = −0.264 vs −0.272; H6: β = 0.476 vs 0.487; H8: β = 0.023 vs 0.025; all within 0.02 of the CB-SEM estimate), and the elastic-net regression excluded both Unnaturalness and Health Concern as predictors of Attitude, consistent with the null findings for H4 and H8 in the SEM. The random-forest permutation importance reproduced the dominance-analysis ordering (for Intention: Subjective Norms > Perceived Behavioural Control > Attitude; for Attitude: Ethics ≫ Disgust > Unnaturalness > Health Concern). The cross-validated R² values from the elastic net (Intention: 0.697; Attitude: 0.272) corresponded closely with the SEM-derived R² values, indicating that the structural conclusions are not contingent on the choice of estimation paradigm.
Two further sensitivity analyses addressed the measurement and collinearity concerns surrounding Perceived Behavioural Control. First, because the two-item PBC scale exhibited borderline reliability, the latent model was re-estimated with PBC represented by each indicator alone (Table S9). The PBC → Intention path remained positive and significant in all three specifications (two-indicator β = 0.609; E1-only β = 0.552; E2-only β = 0.138; all p < 0.01), and the Attitude and Subjective-Norms paths retained their direction and significance throughout, indicating that the core structural conclusions do not depend on the two-item operationalisation. The magnitude of the PBC effect was, however, substantially larger when PBC was indexed by the accessibility item E1 (“I could easily try cultured meat once it becomes available”) than by the autonomy item E2 (“whether I try cultured meat is entirely up to me”), suggesting that the predictive weight of PBC in this sample is carried primarily by perceived market accessibility rather than by personal autonomy. Second, an alternative hierarchical model in which Subjective Norms was specified as an antecedent of PBC (SN → PBC → Intention) rather than as a parallel predictor fitted the data equally well (CFI = 0.920; TLI = 0.902; RMSEA = 0.110) and was marginally preferred by the information criteria (AIC = 51.5 versus 53.5; BIC = 147.1 versus 152.7; Table S10). In this model the SN → PBC path was very strong (β = 0.865, p < 0.001) and the PBC → Intention path strengthened further (β = 0.859, p < 0.001), consistent with Ajzen’s argument that social pressures shape perceived behavioural control and offering a theoretically coherent resolution of the high SN–PBC collinearity (r = 0.697) observed in the parallel model.
3.6. Mediation Analysis
Bootstrap mediation analysis (5,000 resamples; percentile confidence intervals) examined whether the four perceptual predictors exert indirect effects on Intention via Attitude. Two indirect pathways reached significance. The indirect effect of Ethics on Intention via Attitude was positive and was the largest of the four (ab = 0.114; 95% CI [0.056, 0.183]), indicating that ethical concern for animal welfare enhances favourable attitudes, which in turn strengthen behavioural intention. The indirect effect of Disgust on Intention via Attitude was negative and significant (ab = −0.063; 95% CI [−0.122, −0.019]), indicating that affective aversion reduces favourable attitudes and consequently reduces intention. The indirect effects of Unnaturalness (ab = 0.030; 95% CI [−0.007, 0.076]) and Health Concern (ab = 0.006; 95% CI [−0.033, 0.048]) on Intention via Attitude were non-significant. As none of the four perceptual predictors exhibited significant direct effects on Intention (all p > 0.28 in the partial mediation model), the influence of Ethics and Disgust on Intention is fully mediated through Attitude. Given the cross-sectional design, these results are interpreted as indirect associations rather than as evidence of causal mediation.
3.7. Group Differences by Dietary Pattern
Hypothesis H7, which posited that Attitude and Intention differ across dietary patterns, was not supported. A multivariate analysis of variance on the joint vector of Attitude and Intention across the three larger dietary groups (Omnivore, Flexitarian, Vegetarian; vegans excluded owing to insufficient sample size) was non-significant on Pillai’s Trace (V = 0.012; F(4, 496) = 0.74; p = 0.567) and on the corroborative Wilks’ Lambda (Λ = 0.988; F(4, 494) = 0.73; p = 0.569). The univariate ANOVAs were similarly non-significant for both outcomes (Attitude: F(2, 248) = 0.43, p = 0.654, η² = 0.003, ω² = 0.000, Cohen’s f = 0.059; Intention: F(2, 248) = 0.78, p = 0.461, η² = 0.006, ω² = 0.000, Cohen’s f = 0.079). The non-parametric Kruskal-Wallis tests, including all four dietary groups, also yielded non-significant results, although the test for Attitude approached conventional significance (H(3) = 7.33, p = 0.062, ε² = 0.017). All effect sizes were negligible (η² < 0.01). H7 was therefore not supported under any analytic approach.
3.8. Summary of Hypothesis Testing
The integrated decision pattern across all analytic layers is reported in Table 4 and is summarised as follows. Four of the eight hypotheses were robustly supported across the latent SEM with Holm-corrected p-values, the bootstrap robust inference, the ULMC robustness check, the Bayesian path model, and the PLS-SEM and machine-learning triangulation: H1 (Attitude → Intention), H3 (Perceived Behavioural Control → Intention), H5 (Disgust → Attitude), and H6 (Ethics → Attitude). The decision for H2 (Subjective Norms → Intention) is qualified: the baseline path was significant (p = 0.032) but failed to retain significance under Holm correction (p = 0.064) and under common-method-variance control (p = 0.111). H4 (Unnaturalness → Attitude) was not supported in the latent SEM but was found to be underpowered (estimated power = 0.38) and the Bayes factor evidence for the null was moderate (BF₀₁ = 3.3); H4 is therefore best characterised as inconclusive rather than as evidence of absence. The exploratory hypothesis H8 (Health Concern → Attitude) was robustly non-significant in the SEM, and the Bayesian analysis provided strong evidence in favour of the null (BF₀₁ = 13); H8 is therefore characterised as a substantive null finding. H7 (group differences across dietary patterns) was not supported under any analytic approach, with negligible effect sizes throughout.
4. Discussion
4.1. Overview of Findings
The present study applied an extended Theory of Planned Behaviour (TPB) framework, complemented by a pre-specified package of robustness and triangulation analyses, to examine the psychological predictors of cultured meat acceptance among English-speaking Indian consumers (N = 255). Across covariance-based structural equation modelling, Bayesian path modelling, PLS-SEM, and regularised machine-learning estimation, a coherent pattern emerged: Perceived Behavioural Control and ethical concern for animal welfare were the strongest predictors of acceptance, disgust constituted a significant emotional barrier, and the conventional Western emphasis on perceived unnaturalness was not supported in the present sample (with the H4 result further characterised as inconclusive rather than as a substantive null, on the basis of the sensitivity power analysis and the Bayes-factor evidence; see Section 4.3). Of the eight hypothesised relationships, four were robustly supported across all analytic layers (H1, H3, H5, H6), one was supported in the baseline model but failed to retain significance under Holm-Bonferroni correction and common-method-variance control (H2), one was inconclusive owing to insufficient power (H4), and two received no support (H7, H8); H8 was further characterised as a substantive null on the basis of strong Bayesian evidence in favour of the null (BF₀₁ = 13). The findings extend the TPB literature into a previously underrepresented context and complicate the dominant Western narrative about which psychological mechanisms govern cultured meat acceptance. They also complement recent cross-cultural evidence on consumer trust in emerging food technologies in India [21] by specifying the structural pathway — dominated by perceived feasibility and animal-welfare ethics — through which such perceptions translate into the intention to try cultured meat.
4.2. Core TPB Findings: The Prominence of Perceived Behavioural Control
The three core TPB predictors of intention behaved in directionally consistent ways with the established literature but exhibited a relative-importance pattern that departs from typical Western findings. Perceived Behavioural Control emerged as the strongest standardised predictor of Intention (β = 0.609, p < 0.001), accounting for the largest unique contribution within the structural equation model. This primacy refers, however, to unique partial variance; the dominance analysis (Section 4.5) shows that Subjective Norms commands the largest share of the total explained variance once shared variance is preserved, so the claim of PBC primacy is deliberately confined to the partial-regression perspective. This is in marked contrast to recent extended-TPB studies of cultured meat acceptance in Germany, in which Attitude has been reported as the strongest predictor and Perceived Behavioural Control as a secondary predictor [11,12]. A consistent pattern was reported by Malavalli et al. [38] for New Zealand respondents, where PBC was a robust predictor of intention under conditions of low product familiarity. The present results therefore align with the broader observation that, in early-stage acceptance research for novel food technologies, perceived feasibility tends to dominate over evaluative attitude when the product is not yet available in the market.
Several mechanisms may account for the prominence of Perceived Behavioural Control in the Indian context. First, cultured meat has no commercial presence in India at the time of writing, and only 45.1% of the present sample reported any prior awareness of the technology. Under such conditions of high novelty and low market availability, behavioural intention may be primarily contingent on whether the act of trying the product is perceived as feasible — that is, on perceived accessibility, affordability, and personal autonomy — rather than on the strength of attitudinal evaluation, which is itself only weakly formed in the absence of direct sensory experience [3]. Second, the structural-model decomposition reflects the partial regression coefficient, which captures the unique contribution of a predictor after the variance shared with the other predictors has been removed. As the dominance analysis revealed (see Section 4.5), the relative-importance ranking of the three TPB predictors is substantially altered when shared variance is preserved.
Attitude exhibited a smaller but robust positive effect on Intention (H1: β = 0.295, p < 0.001; Holm-corrected p < 0.001; Bayesian posterior mean = 0.253, BF₁₀ > 10³). The role of Subjective Norms was more equivocal. The baseline model reported a significant positive effect of Subjective Norms on Intention (H2: β = 0.263, p = 0.032), but the path failed to retain significance under the Holm-Bonferroni correction (p = 0.064) and was further attenuated to non-significance in the ULMC robustness check (β = 0.417, p = 0.111). The non-parametric bootstrap, in which approximately one quarter of replicates produced extreme estimates for the Subjective Norms and Perceived Behavioural Control paths, provided independent evidence that the two predictors are partially confounded in the present sample (r = 0.697). The role of social norms in Indian cultured meat acceptance therefore remains an open question. Indian dietary identity and religious dietary codes might be expected a priori to amplify the role of social norms, yet the present evidence is sensitive to multiple analytic decisions and does not warrant a firm conclusion. Recent work shows that even within Western samples, vegetarians and omnivores diverge in how they categorise and evaluate cultured meat [39], suggesting that dietary identity may shape acceptance in ways not captured by aggregate group comparisons.
4.3. Two Qualitatively Different Null Findings
A central contribution of the present study is the identification of two non-significant paths that are typically conflated under a single “not supported” decision but that are qualitatively different in their evidentiary status: H4 (Perceived Unnaturalness → Attitude) and H8 (Health-related Concern → Attitude).
For H4, the observed effect was small and positive (β = 0.133) rather than the hypothesised negative direction, and was not significant under either raw or Holm-corrected p-values. However, the sensitivity power analysis revealed that the post-hoc power for detecting this effect was only 0.38 at the uncorrected α = 0.05 and 0.16 at the Holm-corrected α = 0.05/6; the minimum detectable standardised effect at conventional power was 0.227, substantially larger than the observed β. The Bayesian Savage-Dickey analysis returned moderate evidence in favour of the null (BF₀₁ = 3.3). The combination of low statistical power, an observed effect below the minimum detectable threshold, and modest Bayesian evidence for the null indicates that the non-significant H4 result is best characterised as inconclusive rather than as evidence of a true null. Replication with substantially larger samples — approximately N = 500–600 by the present power estimates — would be required to determine whether perceived unnaturalness exerts a small but real influence on attitudes in the Indian context. The H4 result therefore warrants caution: it should not be interpreted as evidence that perceived unnaturalness is irrelevant to cultured meat acceptance in India, only as evidence that the present study was not adequately powered to detect an effect of the size that may exist. Recent cross-food evidence likewise indicates that perceived unnaturalness and disgust function as coupled yet culturally variable barriers across cultured foods [40].
The interpretation of H8 is fundamentally different. The observed effect of Health-related Concern on Attitude was virtually zero (β = 0.025), the post-hoc power was negligible (0.06), and the Bayesian analysis returned strong evidence in favour of the null (BF₀₁ = 13). This combination — a near-zero point estimate, near-zero detection probability, and strong Bayesian support for the null — provides much firmer grounds for the substantive conclusion that, in the present sample, health-related concern does not act as a meaningful independent predictor of attitudes toward cultured meat after the variance shared with disgust and ethical concern is accounted for. The implication is not that Indian consumers do not have health-related concerns about cultured meat; on the contrary, the mean health-concern score was the highest of all measured variables (M = 5.39 on a 7-point scale). Rather, the implication is that such concerns operate through, or are subsumed by, the affective dimension of disgust and the moral dimension of ethical evaluation, rather than acting as an independent cognitive antecedent of attitude formation. This pattern is consistent with the conceptual argument advanced by Wilks, Hornsey, and Bloom [41], who note that lay perceptions of “unnaturalness” and “health risk” in novel foods tend to converge with affective and moral evaluations rather than constituting separable cognitive antecedents.
The distinction between an inconclusive non-significance (H4) and a substantively supported null (H8) is rarely articulated in the cultured-meat acceptance literature, in which the conventional reporting framework subsumes both outcomes under the single decision “hypothesis not supported.” The Bayesian Savage-Dickey approach [42,43] provides a formal mechanism for separating these two outcomes and is recommended for future research in this domain.
4.4. Ethics, Ahimsa, and the Moral Foundation of Purity
Before interpreting the Ethics effect (H6) in cultural terms, it must be stated explicitly that neither ahimsa endorsement nor purity-based moral reasoning was directly operationalised in the questionnaire; the cultural mechanisms proposed in this section are therefore theoretical propositions advanced for future empirical testing rather than constructs measured in the present study, and they are framed accordingly. The strongest predictor of Attitude in the present study was ethical concern for animal welfare (H6: β = 0.487, p < 0.001; Bayesian posterior mean = 0.474, BF₁₀ > 10³), and this effect remained robust under every robustness and triangulation check. The dominance analysis indicated that ethical concern accounted for 79.3% of the variance in Attitude that is explained jointly by the four perceptual predictors. The magnitude and robustness of this effect deserve contextual interpretation that goes beyond the standard observation that animal-welfare framing predicts cultured meat acceptance [2,9].
The principle of ahimsa — non-violence toward all sentient beings — is foundational to Hindu and Jain ethical traditions and is institutionalised in Indian dietary practice through the very large vegetarian population, through the legally mandated green/brown dot food-labelling system that classifies all packaged products as vegetarian or non-vegetarian, and through religious dietary codes such as halal [44,45]. Cultured meat is conceptually unusual in that it represents a product that is biologically meat yet does not require the slaughter of a live animal, a feature that places it in an ambiguous position relative to the ahimsa framework but that, importantly, allows it to be framed as a means of reducing rather than perpetuating animal suffering. The strong association observed in the present sample between ethical concern for animal welfare and Attitude is consistent with the hypothesis that respondents who hold ahimsa-aligned values may evaluate cultured meat through that ethical lens. Ahimsa itself was not directly measured in the present study, however, and the ahimsa interpretation therefore remains theoretically motivated rather than empirically tested. Comparable evidence of the centrality of ethical reasoning in South Asian acceptance has been reported by Ahsan, Uzair, and Ali [46] in their study of Pakistani consumers.
A particularly relevant theoretical lens has recently been advanced by Wilks, Crimston, and Hornsey [10], who demonstrated that the moral foundation of purity — rather than harm — is the strongest moral predictor of attitudes toward cultured meat in cross-cultural samples. The purity-pollution distinction is deeply embedded in Hindu and Jain food traditions through the concept of shuddhi (ritual purity) and through caste-related dietary practices. The Indian context therefore constitutes a natural setting in which to test the purity-moral-foundation hypothesis. Future research that directly measures purity-based moral reasoning in Indian samples is necessary to determine whether the observed ethics effect is mediated by, or is conceptually distinct from, purity-based moral evaluation.
Disgust exhibited the expected significant negative effect on Attitude (H5: β = −0.272, p < 0.001), although the effect was attenuated to marginal significance under ULMC control (β = −0.174, p = 0.072), suggesting partial sensitivity to shared-method variance. The mediation analysis revealed that both the ethical effect (H6) and the disgust effect (H5) operate on Intention entirely through Attitude; neither perceptual predictor exhibited a significant direct effect on Intention. The asymmetry between the strong positive effect of Ethics (β = 0.487) and the smaller negative effect of Disgust (β = −0.272) is consistent with the argument by Rosenfeld and Tomiyama [47] and by Arango, Septianto, and Pontes [48] that positive ethical framing may be a more potent lever for shifting attitudes than reducing affective aversion.
4.5. Practical Implications: Dominance Versus Partial Regression
The dominance analysis revealed a relative-importance ranking that differs from the ranking implied by the standardised SEM path coefficients and that has different practical implications. Within the SEM, the standardised partial regression coefficients yielded the ranking PBC > Attitude > Subjective Norms (β = 0.609, 0.295, 0.263) for the prediction of Intention. The general-dominance decomposition [36,37], which is order-independent and preserves rather than partials out shared variance, yielded a different ranking: Subjective Norms (38.8% of the explained variance) > PBC (32.8%) > Attitude (28.4%). The two rankings reflect different but complementary perspectives on the relative importance of the TPB predictors.
For marketing and communication interventions, the dominance result suggests that targeting Subjective Norms — through influencer endorsements, peer-to-peer testimonials, or culturally credible spokespersons — may exert the largest leverage on intention to try cultured meat in the Indian market, because Subjective Norms carries the largest share of the explained variance when the overlap with PBC and Attitude is preserved. For policy and regulation, the dominance of Perceived Behavioural Control within the SEM (β = 0.609) signals that improving the perceived accessibility, affordability, and autonomy of cultured meat — through product availability, transparent pricing, and clear labelling — remains essential, because PBC carries the largest unique contribution after social and attitudinal influences are accounted for. The two analytic perspectives are therefore complementary rather than contradictory: dominance analysis identifies the largest overall lever, while standardised regression identifies the largest unique lever. A coordinated Indian market strategy will benefit from interventions on both dimensions, with social-norm campaigns and accessibility-focused policy operating in parallel.
For the substantial Indian Muslim consumer population, the question of halal certification adds an additional regulatory dimension. Hamdan et al. [49] provided empirical evidence that the willingness of Muslim consumers to substitute cultured meat for conventionally slaughtered meat is conditional on credible halal certification from recognised religious authorities. The halal-certification framework for cultured meat is therefore a material consumer-acceptance issue rather than a theoretical concern, and warrants explicit policy attention as the Indian regulatory landscape for cultivated proteins matures.
4.6. Methodological Contributions and Limitations
The present study adopted a methodologically conservative analytic strategy that included multiple-testing correction, ULMC robustness checking, non-parametric bootstrap inference, post-hoc sensitivity power analysis, and triangulation across four estimation paradigms: covariance-based SEM, Bayesian path modelling, PLS-SEM [50,51], and regularised machine-learning estimation. The convergence of structural conclusions across these paradigms is interpreted as triangulation evidence against the possibility that the findings are artefacts of any single methodological choice. Two methodological features warrant particular attention.
First, the demonstration that H4 and H8 are qualitatively different null findings — distinguishable by the joint pattern of observed effect size, statistical power, and Bayesian evidence ratio — is, to our knowledge, novel in the cultured-meat acceptance literature, which has tended to conflate non-significance with substantive null support. The Bayesian Savage-Dickey approach provides a formal mechanism for distinguishing inconclusive non-significance from substantive null evidence and is recommended for future studies in this domain.
Second, the bootstrap analysis revealed that approximately 26% of replicates produced extreme estimates for the Subjective Norms and Perceived Behavioural Control paths, reflecting the high collinearity between these predictors in the present sample. This finding constitutes empirical evidence that the partial regression coefficients for SN and PBC are weakly identified in convenience samples of the present size and structure, and tempers any strong claims about the relative importance of these two TPB constructs. An alternative hierarchical specification in which Subjective Norms is modelled as an antecedent of Perceived Behavioural Control (Section 3.5) fitted the data equally well and offers a theoretically grounded way to represent this entanglement in future confirmatory work.
Several limitations should be acknowledged. The convenience-sample design and the requirement of English-language proficiency restrict generalisability to urban, educated, English-literate Indian adults; the present sample is best characterised as an early-adopter segment rather than as a representative cross-section of Indian consumers. The cross-sectional design precludes causal inference; the indirect effects reported in the mediation analysis are best interpreted as indirect associations rather than as evidence of causal mediation. The four perceptual predictors (Unnaturalness, Disgust, Ethics, Health Concern) were measured by single items, which precludes formal reliability estimation, may attenuate the corresponding path estimates through unmodelled measurement error, and constitutes construct underrepresentation for theoretically complex constructs such as ethical concern for animal welfare. Multi-item validated scales would strengthen construct validity in future replications [9]. The two-item Perceived Behavioural Control scale exhibited borderline reliability (Cronbach’s α = 0.698; McDonald’s ω = 0.490), and conclusions about the primacy of PBC as the principal predictor of behavioural intention must be interpreted in light of this measurement limitation. The Subjective Norms and Intention scales similarly comprise only two indicators each, restricting the precision with which their effects can be estimated. Common method variance, although controlled by the ULMC robustness check [30,31], remains a residual concern for any single-source self-report study. Finally, the present design did not directly measure several culturally specific variables — ahimsa endorsement, purity-based moral reasoning [10], halal-certification importance, and caste-based food practices — that may be operative in the Indian context; the integration of such measures in future work would substantially deepen the cultural interpretation of the results.
4.7. Directions for Future Research
Three principal directions for future research follow from the present findings and their limitations. First, replication with probability-based samples that include rural residents, non-English speakers, and lower-educational-attainment groups is needed to extend the generalisability of the present results. The sensitivity power analysis indicates that approximately N = 500–600 would be required to definitively resolve the inconclusive H4 result, and substantially larger oversampled subgroups would be required to enable robust within-group comparisons across dietary identities (cf. H7). Second, the integration of culturally specific measures — direct ahimsa endorsement, purity-based moral reasoning [10], halal-certification importance [49], and caste-based dietary practices — would permit a far richer empirical test of the cultural-mechanism hypotheses entertained in the present discussion. Third, longitudinal and experimental designs that track attitude and intention as awareness increases and as actual product availability emerges in the Indian market are needed to assess the stability of the early-adopter patterns reported here. Field studies measuring actual purchase and consumption behaviour, rather than self-reported intention, would address the well-documented intention-behaviour gap [52] and would convert the current associational evidence into direct evidence of consumer adoption.
5. Conclusions
The present study delivered an extended Theory of Planned Behaviour analysis of cultured meat acceptance in India, complemented by a triangulated package of robustness analyses spanning multiplicity correction, bootstrap robust inference, post-hoc sensitivity power analysis, Bayesian path modelling, PLS-SEM, and regularised machine-learning estimation. Three substantive conclusions follow.
First, the psychological architecture of cultured meat acceptance among Indian consumers is dominated by perceived feasibility and by ethical concern for animal welfare. Perceived Behavioural Control was the strongest predictor of behavioural intention (β = 0.609), and ethical concern for animal welfare was the strongest predictor of attitude (β = 0.487). Disgust functioned as a significant emotional barrier (β = −0.272). These three effects were robust across all four estimation paradigms and across the full set of robustness checks. The Indian pattern therefore differs from the attitude-dominant pattern reported in recent Western extended-TPB studies and suggests that, in the early-adoption phase of a novel food technology with no current market presence, perceived feasibility and moral evaluation are the principal levers.
Second, two non-significant findings — perceived unnaturalness (H4) and health-related concern (H8) — are qualitatively distinct in their evidentiary status. The H4 result was inconclusive: the observed effect lay below the minimum detectable effect at conventional power, and the Bayesian evidence in favour of the null was only moderate. The H8 result, by contrast, was supported by strong Bayesian evidence in favour of the null (BF₀₁ = 13). The conventional reporting framework that subsumes both outcomes under a single “hypothesis not supported” decision is therefore insufficient; the joint use of frequentist significance testing, power analysis, and Bayesian evidence ratios provides a more nuanced evidentiary scheme that should be standard in future cultured-meat acceptance research.
Third, the practical implications for cultured meat introduction to the Indian market follow from the joint interpretation of partial-regression and dominance evidence. Standardised SEM coefficients identify Perceived Behavioural Control as the largest unique predictor of intention, suggesting that accessibility, affordability, and clear labelling are essential policy levers. The dominance decomposition identifies Subjective Norms as the largest overall contributor to explained variance, suggesting that peer endorsement, influencer communication, and culturally credible spokespersons are essential marketing levers. The two perspectives are complementary, and a coherent Indian cultured-meat strategy will integrate both. Ethical framing aligned with the principle of ahimsa, halal certification for the substantial Muslim consumer population, and the gradual reduction of affective aversion through repeated exposure constitute the core tactical components of such a strategy. The findings position India as a distinctive but tractable market for the global protein transition.:
Supplementary Materials
The following supporting information can be downloaded at the website of this paper posted on Preprints.org.
Author Contributions
Nematullah Farooqui: Conceptualization, Methodology, Investigation, Data curation, Formal analysis (primary), Writing – original draft, Visualization. Anna Kaczmarek: Conceptualization, Methodology, Supervision, Formal analysis (robustness and triangulation), Writing – review and editing, Project administration. Both authors approved the final version of the manuscript.
Funding
This work was financially supported by the Polish Ministry of Education and Science under grant number DWD/3/35/2019. The open-access publication fee was financed by the Polish Minister of Science and Higher Education as part of the Strategy of Poznań University of Life Sciences for 2024–2026 in the field of improving scientific research and development work in priority research areas.
Institutional Review Board Statement
Ethical review and approval were not required for this study. The study was conducted as an anonymous, non-interventional online questionnaire survey among adult consumers in India. No identifiable personal data, sensitive personal data, biological samples, food tasting, supplementation, medical intervention, clinical procedure, or experimental manipulation were collected or performed. The research was conducted under the auspices of the Poznań University of Life Sciences, Poland. Under Polish national legislation, ethics-committee approval is required for medical experiments involving humans, as regulated by the Act of 5 December 1996 on the Professions of Physician and Dentist, in particular Articles 21 and 29. The present study did not constitute a medical experiment under this Act and involved only anonymous questionnaire data with no more than minimal risk to participants. Moreover, according to the institutional guidelines of the Poznań University of Life Sciences, approval by the University Ethics Committee was not required for this type of anonymous, non-interventional questionnaire study. The study was conducted in accordance with the ethical principles of the Declaration of Helsinki [53].
Informed Consent Statement
Implied informed consent was obtained electronically from all study participants. Prior to completing the questionnaire, respondents were informed about the purpose of the study, the voluntary and anonymous nature of participation, and their right to withdraw at any time without consequence; proceeding to the first question of the questionnaire constituted the participant’s affirmative consent.
Data Availability Statement
The anonymised dataset, the complete set of Python analysis scripts, a pinned requirements file, and the supplementary materials that support the findings of this study are openly available in Zenodo at https://doi.org/10.5281/zenodo.20444749 [54]. All derived outputs reported in the article and its supplementary materials can be regenerated from the anonymised dataset and scripts by following the README included in the deposit.
Acknowledgments
The authors are grateful to the NAWA (Polish National Agency for Academic Exchange) and the Stefan Banach Scholarship Programme for the financial support that enabled N. F. to undertake the master’s programme at Poznań University of Life Sciences during which the present research was conducted. We thank the 255 anonymous respondents who contributed their time to the survey. No funder had any role in the design, conduct, analysis, or reporting of the study. During the preparation of this manuscript, the authors used Claude (Anthropic) for the purposes of restructuring and formatting the analysis code, generating the figures, formatting the manuscript, and checking grammar and spelling. The authors have reviewed and edited the output and take full responsibility for the content of this publication.
Conflicts of Interest
The authors declare no conflict of interest.
References
- Guan, X.; Lei, Q.; Yan, Q.; Li, X.; Zhou, J.; Du, G.; Chen, J. Trends and ideas in technology, regulation and public acceptance of cultured meat. Future Foods 2021, 3, 100032. [Google Scholar] [CrossRef]
- Bryant, C. J.; Barnett, J. Consumer acceptance of cultured meat: An updated review (2018–2020). Appl. Sci. 2020, 10(15), 5201. [Google Scholar] [CrossRef]
- Verbeke, W.; Sans, P.; Van Loo, E. J. Challenges and prospects for consumer acceptance of cultured meat. J. Integr. Agric. 2015, 14(2), 285–294. [Google Scholar] [CrossRef]
- Szendrő, K. Consumer perceptions of lab-grown cells: Awareness, barriers, and the power of information. A review. Czech. J. Anim. Sci. 2025, 70(6), 203–222. [Google Scholar] [CrossRef]
- Raverta, P.; Sandi, I.; Martin, B.; Loera, B. Unfamiliar familiarity: A scoping review on the role of familiarity in consumer acceptance of cultivated meat. Appetite 2025, 211, 108000. [Google Scholar] [CrossRef]
- Hopkins, P. D. Cultured meat in Western media: The disproportionate coverage of vegetarian reactions, demographic realities, and implications for cultured meat marketing. J. Integr. Agric. 2015, 14(2), 264–272. [Google Scholar] [CrossRef]
- Ajzen, I. The Theory of Planned Behavior. Organ. Behav. Hum. Decis. Process. 1991, 50(2), 179–211. [Google Scholar] [CrossRef]
- Siegrist, M.; Hartmann, C. Perceived naturalness, disgust, trust and food neophobia as predictors of cultured meat acceptance in ten countries. Appetite 2020, 155, 104814. [Google Scholar] [CrossRef] [PubMed]
- Wilks, M.; Phillips, C. J. C.; Fielding, K.; Hornsey, M. J. Testing potential psychological predictors of attitudes towards cultured meat. Appetite 2019, 136, 137–145. [Google Scholar] [CrossRef]
- Wilks, M.; Crimston, C. R.; Hornsey, M. J. Meat and morality: The moral foundation of purity, but not harm, predicts attitudes toward cultured meat. Appetite 2024, 197, 107297. [Google Scholar] [CrossRef] [PubMed]
- Dupont, J.; Harms, T.; Fiebelkorn, F. Acceptance of cultured meat in Germany — Application of an extended Theory of Planned Behaviour. Foods 2022, 11(3), 424. [Google Scholar] [CrossRef]
- Weinrich, R.; Strack, M.; Neugebauer, F. Consumer acceptance of cultured meat in Germany. Meat Sci. 2020, 162, 107924. [Google Scholar] [CrossRef]
- Li, H.; Van Loo, E. J.; Van Trijp, H. C. M.; Chen, J.; Bai, J. Will cultured meat be served on Chinese tables? A study of consumer attitudes and intentions about cultured meat in China. Meat Sci. 2023, 197, 109081. [Google Scholar] [CrossRef] [PubMed]
- Huang, S.; Uehara, T. Young consumers’ perceptions of and preferences for alternative meats: an empirical study in Japan and China. Front. Sustain. Food Syst. 2023, 7, 1290131. [Google Scholar] [CrossRef]
- Hibino, A.; Nakamura, F.; Furuhashi, M.; Takeuchi, S. How can the unnaturalness of cellular agricultural products be familiarized?: Modeling public attitudes toward cultured meats in Japan. Front. Sustain. Food Syst. 2023, 7, 1129868. [Google Scholar] [CrossRef]
- Lazou, A. E.; Revelou, P. K.; Kougioumtzoglou, S.; Strati, I. F.; Kanellou, A.; Batrinou, A. Cultured meat: A survey of awareness among Greek consumers. AIMS Agric. Food 2024, 9(1), 356–373. [Google Scholar] [CrossRef]
- Chriki, S.; Alhujaili, A.; Hallman, W. K.; Payet, V.; Ellies-Oury, M.; Hocquette, J. Attitudes toward artificial meat in Arab countries. J. Food Sci. 2024, 89(12), 9711–9731. [Google Scholar] [CrossRef]
- Rodríguez Escobar, M. I.; Han, S.; Cadena, E.; De Smet, S.; Hung, Y. Cross-cultural consumer acceptance of cultured meat: A comparative study in Belgium, Chile, and China. Food Qual. Prefer. 2025, 127, 105454. [Google Scholar] [CrossRef]
- Bryant, C.; Szejda, K.; Parekh, N.; Deshpande, V.; Tse, B. A survey of consumer perceptions of plant-based and clean meat in the USA, India, and China. Front. Sustain. Food Syst. 2019, 3, 11. [Google Scholar] [CrossRef]
- Choudhary, F.; Khandi, S. A.; Hassoun, A.; Aadil, R. M.; Bekhit, A. E. D. A.; Abdi, G.; Bhat, Z. F. Awareness and acceptance of informed and professional consumers of Jammu and Kashmir about cultured meat. Appl. Food Res. 2024, 4(1), 100397. [Google Scholar] [CrossRef]
- Šostar, M.; Joy, J.; Ramanathan, H. N. Consumer trust in emerging food technologies: A comparative analysis of Croatia and India. Sustainability 2025, 17(17), 7993. [Google Scholar] [CrossRef]
- Kline, R. B. Principles and practice of structural equation modeling, 4th ed.; Guilford Press: New York, NY, 2016. [Google Scholar]
- Bryant, C.; Dillard, C. The impact of framing on acceptance of cultured meat. Front. Nutr. 2019, 6, 103. [Google Scholar] [CrossRef]
- Ajzen, I. Constructing a theory of planned behavior questionnaire. 2006. Available online: https://people.umass.edu/~aizen/pdf/tpb.measurement.pdf.
- Ajzen, I. Perceived behavioral control, self-efficacy, locus of control, and the Theory of Planned Behavior. J. Appl. Soc. Psychol. 2002, 32, 665–683. [Google Scholar] [CrossRef]
- McDonald, R. P. Test theory: A unified treatment; Lawrence Erlbaum Associates: Mahwah, NJ, 1999. [Google Scholar]
- Hair, J. F.; Black, W. C.; Babin, B. J.; Anderson, R. E. Multivariate data analysis, 8th ed.; Cengage: Boston, MA, 2019. [Google Scholar]
- Bentler, P. M.; Bonett, D. G. Significance tests and goodness of fit in the analysis of covariance structures. Psychol. Bull. 1980, 88(3), 588–606. [Google Scholar] [CrossRef]
- Hu, L.; Bentler, P. M. Cutoff criteria for fit indexes in covariance structure analysis: Conventional criteria versus new alternatives. Struct. Equ. Model. 1999, 6(1), 1–55. [Google Scholar] [CrossRef]
- Podsakoff, P. M.; MacKenzie, S. B.; Lee, J.-Y.; Podsakoff, N. P. Common method biases in behavioral research: A critical review of the literature and recommended remedies. J. Appl. Psychol. 2003, 88(5), 879–903. [Google Scholar] [CrossRef]
- Williams, L. J.; Hartman, N.; Cavazotte, F. Method variance and marker variables: A review and comprehensive CFA marker technique. Organ. Res. Methods 2010, 13(3), 477–514. [Google Scholar] [CrossRef]
- Hayes, A. F. Introduction to mediation, moderation, and conditional process analysis: A regression-based approach, 2nd ed.; Guilford Press: New York, NY, 2018. [Google Scholar]
- Preacher, K. J.; Hayes, A. F. Asymptotic and resampling strategies for assessing and comparing indirect effects in multiple mediator models. Behav. Res. Methods 2008, 40(3), 879–891. [Google Scholar] [CrossRef] [PubMed]
- Tabachnick, B. G.; Fidell, L. S. Using multivariate statistics, 6th ed.; Pearson: Boston, MA, 2013. [Google Scholar]
- Cohen, J. Statistical power analysis for the behavioral sciences, 2nd ed.; Lawrence Erlbaum Associates: Hillsdale, NJ, 1988. [Google Scholar]
- Azen, R.; Budescu, D. V. The dominance analysis approach for comparing predictors in multiple regression. Psychol. Methods 2003, 8(2), 129–148. [Google Scholar] [CrossRef] [PubMed]
- Budescu, D. V. Dominance analysis: A new approach to the problem of relative importance of predictors in multiple regression. Psychol. Bull. 1993, 114(3), 542–551. [Google Scholar] [CrossRef]
- Malavalli, M. M.; Hamid, N.; Kantono, K.; Liu, Y.; Seyfoddin, A. Consumers’ Perception of In-Vitro Meat in New Zealand Using the Theory of Planned Behaviour Model. Sustainability 2021, 13(13), 7430. [Google Scholar] [CrossRef]
- Lanz, M.; Wassmann, B.; Siegrist, M. Cultured meat: Vegetarian or not? Exploring young vegetarians’ and omnivores’ perceptions of this new technology. Appetite 2025, 213, 108059. [Google Scholar] [CrossRef]
- Herziger, A. Moving beyond meat: Perceived unnaturalness and disgust across cultured foods. J. Environ. Psychol. 2024, 98, 102384. [Google Scholar] [CrossRef]
- Wilks, M.; Hornsey, M.; Bloom, P. What does it mean to say that cultured meat is unnatural? Appetite 2021, 156, 104960. [Google Scholar] [CrossRef]
- Kass, R. E.; Raftery, A. E. Bayes factors. J. Am. Stat. Assoc. 1995, 90(430), 773–795. [Google Scholar] [CrossRef]
- Lee, M. D.; Wagenmakers, E.-J. Bayesian cognitive modeling: A practical course; Cambridge University Press: Cambridge, UK, 2013. [Google Scholar]
- Sathyamala, C. Meat-eating in India: Whose food, whose politics, and whose rights? Policy Futur. Educ. 2019, 17(7), 878–891. [Google Scholar] [CrossRef]
- Prakash, J. The dietary practices and food-related rituals in Indian tradition and their role in health and nutrition. In Nutritional and health aspects of food in South Asian countries; Krishnamurti, R. Y., Ed.; Academic Press: London, UK, 2020; pp. 75–85. [Google Scholar] [CrossRef]
- Ahsan, M.; Uzair, M.; Ali, M. Attitudes and perceptions towards cultured meat among general population in Pakistan. ASEAN J. Sci. Eng. Educ. 2021, 2(1), 111–122. [Google Scholar] [CrossRef]
- Rosenfeld, D. L.; Tomiyama, A. J. Would you eat a burger made in a petri dish? Why people feel disgusted by cultured meat. J. Environ. Psychol. 2022, 80, 101758. [Google Scholar] [CrossRef]
- Arango, L.; Septianto, F.; Pontes, N. The role of conventional meat unnaturalness in cultured meat acceptance: A test of holistic mindset. Appetite 2024, 203, 107656. [Google Scholar] [CrossRef]
- Hamdan, M. N.; Ramli, M. A.; Zaman Huri, N. M. F.; Abd Rahman, N. N. H.; Abdullah, A. Will Muslim consumers replace livestock slaughter with cultured meat in the market? Trends Food Sci. Technol. 2021, 109, 729–732. [Google Scholar] [CrossRef]
- Tenenhaus, M.; Vinzi, V. E.; Chatelin, Y.-M.; Lauro, C. PLS path modeling. Comput. Stat. Data Anal. 2005, 48(1), 159–205. [Google Scholar] [CrossRef]
- Wold, H. Soft modeling: The basic design and some extensions. In Systems under indirect observation: Causality, structure, prediction, part II; Jöreskog, K. G., Wold, H., Eds.; North-Holland: Amsterdam, the Netherlands, 1982; pp. 1–54. [Google Scholar]
- Sheeran, P. Intention–behavior relations: A conceptual and empirical review. Eur. Rev. Soc. Psychol. 2002, 12(1), 1–36. [Google Scholar] [CrossRef]
- World Medical Association. World Medical Association Declaration of Helsinki: Ethical principles for medical research involving human subjects. JAMA 2013, 310(20), 2191–2194. [Google Scholar] [CrossRef] [PubMed]
- Farooqui, N. Perceived behavioural control and animal-welfare ethics predict cultured meat acceptance in India: An extended Theory of Planned Behaviour analysis [Data set and analysis code]; Zenodo, 2026. [Google Scholar] [CrossRef]
Figure 1.
Conceptual research model (extended Theory of Planned Behaviour).

Figure 2.
Latent structural equation model — standardised path coefficients.

Figure 3.
Multi-paradigm triangulation of structural-path estimates.

Figure 4.
Bayesian path model — posterior densities and Savage–Dickey Bayes factors.

Figure 5.
Sensitivity power analysis — observed effect vs. minimum detectable effect.

Table 1.
Sample characteristics (N = 255).
| Characteristic | Category | n | % |
| Gender | Male | 177 | 69.4 |
| Female | 73 | 28.6 | |
| Prefer not to disclose | 5 | 2.0 | |
| Education | Bachelor’s degree | 143 | 56.1 |
| Master’s degree or higher | 102 | 40.0 | |
| High school | 7 | 2.7 | |
| Vocational / technical | 2 | 0.8 | |
| Primary or lower secondary | 1 | 0.4 | |
| Place of residence | City > 500,000 | 108 | 42.4 |
| City 100,000–500,000 | 62 | 24.3 | |
| City 20,000–100,000 | 35 | 13.7 | |
| Rural area | 30 | 11.8 | |
| Town < 20,000 | 20 | 7.8 | |
| Dietary pattern | Omnivore | 161 | 63.1 |
| Flexitarian (limits meat consumption) | 73 | 28.6 | |
| Vegetarian | 17 | 6.7 | |
| Vegan | 4 | 1.6 | |
| Prior awareness of cultured meat | Yes | 115 | 45.1 |
| No | 140 | 54.9 |
Note. All respondents reported India as their country of residence.
Table 2.
Descriptive statistics and scale reliability for all study variables (N = 255).
| Variable | k items | M | SD | Skew | Kurt | α | ω | Inter-item r |
| Attitude (ATT) | 4 | 3.36 | 1.84 | 0.41 | −0.97 | 0.949 | 0.844 | — |
| Subjective Norms (SN) | 2 | 3.47 | 2.01 | 0.38 | −1.06 | 0.934 | 0.807 | 0.876 |
| Perceived Behavioural Control (PBC) | 2 | 4.20 | 1.93 | −0.17 | −1.04 | 0.698 | 0.490 | 0.536 |
| Intention (INT) | 2 | 3.57 | 2.10 | 0.24 | −1.29 | 0.908 | 0.734 | 0.831 |
| Unnaturalness | 1 | 4.59 | 2.16 | −0.34 | −1.26 | — | — | — |
| Disgust | 1 | 3.89 | 2.09 | 0.11 | −1.24 | — | — | — |
| Ethics | 1 | 4.57 | 2.08 | −0.37 | −1.12 | — | — | — |
| Health Concern | 1 | 5.39 | 1.91 | −0.92 | −0.36 | — | — | — |
Note. M = mean; SD = standard deviation; Skew = skewness; Kurt = excess kurtosis; α = Cronbach’s alpha; ω = McDonald’s omega total estimated via confirmatory factor analysis loadings; Inter-item r = Pearson correlation between the two items (reported for two-item scales only). Single-item measures (k = 1) do not permit reliability estimation. All scales scored on 7-point Likert (or semantic-differential, for Attitude) responses.
Table 3.
Bivariate correlations: Pearson r below the diagonal, Spearman ρ above the diagonal (N = 255).
Table 3.
Bivariate correlations: Pearson r below the diagonal, Spearman ρ above the diagonal (N = 255).
| ATT | SN | PBC | INT | Unnat | Disg | Ethics | HC | |
| ATT | — | 0.687 | 0.553 | 0.696 | 0.035 | -0.138 | 0.494 | 0.055 |
| SN | 0.689*** | — | 0.691 | 0.772 | 0.028 | -0.137 | 0.438 | 0.061 |
| PBC | 0.552*** | 0.697*** | — | 0.714 | 0.248 | 0.034 | 0.467 | 0.298 |
| INT | 0.694*** | 0.761*** | 0.709*** | — | 0.076 | -0.117 | 0.443 | 0.108 |
| Unnat | 0.055 | 0.071 | 0.285*** | 0.118 | — | 0.699 | 0.193 | 0.590 |
| Disg | -0.139* | -0.120 | 0.042 | -0.105 | 0.690*** | — | 0.034 | 0.509 |
| Ethics | 0.502*** | 0.439*** | 0.449*** | 0.461*** | 0.184** | 0.042 | — | 0.327 |
| HC | 0.123* | 0.129* | 0.374*** | 0.191** | 0.604*** | 0.533*** | 0.333*** | — |
Note. ATT = Attitude; SN = Subjective Norms; PBC = Perceived Behavioural Control; INT = Intention; Unnat = Unnaturalness; Disg = Disgust; HC = Health Concern. Below the diagonal: Pearson product-moment correlations. Above the diagonal: Spearman rank-order correlations. Significance stars apply to the Pearson coefficients. *p < 0.05, **p < 0.01, ***p < 0.001.
Disclaimer/Publisher’s Note: The statements, opinions and data contained in all publications are solely those of the individual author(s) and contributor(s) and not of MDPI and/or the editor(s). MDPI and/or the editor(s) disclaim responsibility for any injury to people or property resulting from any ideas, methods, instructions or products referred to in the content. |
© 2026 by the authors. Licensee MDPI, Basel, Switzerland. This article is an open access article distributed under the terms and conditions of the Creative Commons Attribution (CC BY) license (http://creativecommons.org/licenses/by/4.0/).
Copyright: This open access article is published under a Creative Commons CC BY 4.0 license, which permit the free download, distribution, and reuse, provided that the author and preprint are cited in any reuse.


