

Submitted:
29 May 2026
Posted:
01 June 2026
You are already at the latest version
Abstract
In a closed-inventory Large Language Model (LLM) system such as Online-CADCOM, which recommends engineering tools from a verified inventory, mention-level hallucination occurs when the model recommends tools not present in the inventory. We evaluate a three-mechanism mitigation stack consisting of database-grounded context injection, fixed vocabulary constraints, and enforced JavaScript Object Notation (JSON) output across three commercial LLM providers (OpenAI, Anthropic, Google), two model generations, and two output modes (standard and reasoning), totaling 6,912 Application Programming Interface (API) calls over 12 configurations. The hallucination rate (HR) decreases from 59–74% to 3.3–14.9% under the full architecture, with cross-provider averages stable across generations (6.8% Generation 1 (Gen1), 7.5% Generation 2 (Gen2)). A key finding is the C3 anomaly, observed under the configuration where only JSON output enforcement is active without any grounding mechanisms: JSON enforcement alone increases hallucination above the unconstrained baseline for all providers (+10.1 percentage points (pp) Gen1, +15.1 pp Gen2). We hypothesize that mandatory entity fields in the JSON schema exert slot-filling pressure, forcing models to populate tool-name slots from training-data priors when no grounding vocabulary is provided. This hypothesis requires further experimental validation. Reasoning-mode models provide no statistically significant improvement under architectural constraints. A frequency-weighted audit shows that the majority of remaining out-of-inventory mentions correspond to real engineering tools absent from the platform's inventory. Under the full architecture, 35–63% of responses still contain at least one such mention, indicating that handling unseen tools remains an open challenge for closed-inventory recommendation systems.
Keywords:
large language models
; hallucination mitigation
; cross-provider evaluation
; retrieval-augmented generation
; electronic design automation tools
; printed circuit board design tools
1. Introduction
Over the last few years, it has become increasingly common to deploy Large Language Models (LLMs) in production systems. Enterprise spending on generative Artificial Intelligence (AI) reached $13.8 billion in 2024 [1]. Recommendation and decision-support systems are among the areas where LLMs can have significant impact, for example by providing relevant product recommendations within a given domain based on their broad knowledge. This capability can complement engineering decision-support workflows that rely on validated and verified tool inventories. One of the key issues affecting the reliability of current LLM deployments is hallucination, formally defined as the generation of highly plausible but factually incorrect information [2,3].
In the context of domain-specific recommendations, we encounter a specific form of hallucination. Here, a tool is recommended by the system but is not present in the verified inventory of the target platform. We study this phenomenon in the context of the Online-CADCOM system introduced in our previous work [4]. Online-CADCOM is a web-based system designed to assist engineers in selecting appropriate tools for their needs. In [4], we provided a detailed description of the prototype implementation, the PostgreSQL database design, and the initial validation trial conducted with university students. The system maintains a curated database of 82 verified engineering tools across multiple domains. An out-of-inventory recommendation may therefore correspond either to a fabricated tool name or to a real commercial tool that is not included in the platform’s curated inventory. Inventory-relative hallucination in domain-specific recommendations differs from general-purpose hallucination. In the latter case, hallucination may involve subtle factual inaccuracies that require human judgment to detect. In contrast, inventory-relative hallucination can be evaluated automatically via database lookup, achieving high precision and high (though not perfect) recall. Determining whether a recommended tool exists in the verified database is therefore an objective and largely automatable process.
Various techniques have been proposed to mitigate hallucination in LLMs. Retrieval-Augmented Generation (RAG) grounds outputs in retrieved factual content [5]. Chain-of-thought prompting decomposes reasoning into intermediate steps, which may reduce errors [6]. Grammar-constrained decoding restricts outputs to valid syntactic structures [7]. However, most empirical evaluations of these techniques focus on a single model family, leaving open the question of whether mitigation strategies generalize across providers.
This question is increasingly important as enterprises adopt multi-provider LLM strategies. A mitigation architecture that performs well on one provider may not exhibit the same behavior on another. In addition, LLM capabilities continue to evolve, including the introduction of “reasoning” or “thinking” modes that involve extended internal deliberation before producing output. Preliminary evidence (preprint; not yet peer-reviewed) suggests that reasoning models may exhibit higher hallucination rates in certain contexts [8], challenging the assumption that additional computation necessarily improves accuracy.
In this work, we empirically investigate the interaction of three constraint-based mechanisms in commercial LLMs: database-grounded context injection, closed-vocabulary constraints, and structured JavaScript Object Notation (JSON) enforcement. While each mechanism has been studied individually in prior work, to the best of our knowledge this is among the first systematic empirical characterizations of their combined behavior across multiple commercial providers and model generations. An alternative approach is post-processing via a “generate freely then filter” strategy, where tool names are validated against the database after generation. Although valid, this approach requires full response generation prior to filtering and may necessitate regeneration, whereas prompt-level constraints prevent out-of-inventory content from being produced in the first place.
The present paper extends our prior conference work [9], which evaluated the three-mechanism architecture on a single LLM provider (OpenAI GPT-4o-mini, 576 queries). Here, we examine whether the architecture generalizes across providers and model generations. Specifically, we evaluate models from three major commercial providers (OpenAI, Anthropic, and Google) across two generations, totaling 6,912 controlled Application Programming Interface (API) calls.
Multiple works investigate the concept of hallucination in natural language generation [2,3,10]. [2] classify hallucinations as intrinsic vs. extrinsic; intrinsic hallucinations are those that contradict the original source material while extrinsic hallucinations add information that is unverifiable. Out-of-inventory recommendations in a domain-specific setting would be classified as extrinsic hallucination since a structured database query can confirm its accuracy.
Reasons for hallucination in LLMs have been listed by [3] such as memorization of the training data, exposure bias and the decoding algorithms. The fact that hallucination rates vary significantly across model architectures and scales suggests that cross-provider evaluation is needed, and that, as [10] show, hallucination is a general characteristic of autoregressive language models not specific to any one architecture, occurring across a wide range of tasks.
Hallucination in conversational systems can be reduced substantially as [11] show, by grounding the generation process in external knowledge. This principle can be extended beyond document retrieval to structured tool databases that encode hierarchical entities, attributes, and relationships.
Retrieval-Augmented Generation (RAG) [5] alleviates hallucination by incorporating retrieved documents into the generation process. By grounding outputs in verifiable information, RAG reduces unsupported claims. [12] survey RAG architectures and compare their effectiveness across hallucination types, revealing that tightly coupled retrieval-generation pipelines are particularly effective in domain-specific applications.
[13] extend retrieval-based methods through automated fact-checking feedback loops. Instead of fetching text snippets from databases, this retrieval method inserts structured entity data covering attributes, features, and associations of engineering tools, realizing a form of retrieval grounding tailored to relational engineering databases.
[7] show that grammar-constrained decoding can enforce valid output structures without requiring additional fine-tuning. By restricting the output space, this approach also helps reduce hallucination. In our architecture, we apply closed-vocabulary constraints (M2) at the prompt level by providing the model with a list of valid tool names. Structured JSON enforcement (M3) is implemented at the application layer.
[14] examine how structured output specifications interact with hallucination in retrieval-augmented systems. Their results show that structured output formats can either improve or reduce factual accuracy depending on whether grounding context is available. Their study focuses on a single-model question-answering setting, suggesting that the phenomenon reflects a broader interaction between structured output and grounding rather than being limited to a model-specific artifact.
As a result of the advancement in the design of LLMs that are capable of reasoning, this represents a major step forward in model design. This is illustrated by the way scaling model capabilities, as demonstrated by GPT-4 and subsequent models, improves performance across diverse tasks [15]. Additionally, instruction-following training with human feedback (i.e., RLHF), as shown by [16], improves alignment and serves as a basis for modern reasoning models.
It has been conjectured that greater reasoning ability should result in improved accuracy. However, recent evidence suggests that reasoning-mode models may achieve similar or even higher hallucination rates in certain settings, possibly due to over-elaboration during extended deliberation that generates plausible but unfounded reasoning chains.
The use of Large Language Models (LLMs) in engineering fields such as Electronic Design Automation (EDA) has been a prominent topic within EDA research as of late. [17] introduce ChatEDA, an LLM-based autonomous agent developed for EDA tasks, and showed how domain-adapted language models can support circuit design workflows. [18] created ChipNeMo, a domain-adapted LLM for chip design; this system uses retrieval-augmented generation and proprietary design data to achieve significant advances compared to general-purpose models. The studies in these references demonstrate how LLMs are increasingly being integrated into engineering disciplines, and emphasize the importance of mitigating hallucination when generated outputs refer to actual tools, specifications or technical entities. However, these domain-adaptation approaches require significant training investment and are tied to specific model families, leaving open the question of whether provider-portable architectural constraints can achieve comparable hallucination reduction without fine-tuning.
Online-CADCOM is a research web platform for engineering tool selection that has evolved through several research phases starting with OPTIMEK (online-assisted technology management) [19], followed by cloud-based CADCOM [20], expert system integration [21], Multi-Criteria Decision Analysis (MCDA)-based automatic tool selection [22,23], and later knowledge-based [24] and LLM-powered [25,26,27] tool recommendation. The current Dynamic Expert Module (DEM) architecture is implemented using React JS on the frontend, ASP.NET Core 8.0 on the backend, and PostgreSQL as the database [4].
In this study, Online-CADCOM functions as a closed-world recommendation system. It maintains a curated inventory of 82 verified engineering tools with objectively verifiable membership; thus, hallucination can be measured as a binary classification problem: a recommended tool either exists in the inventory or it does not.
[28] and [29] advanced systematic LLM assessment through holistic benchmarking and combined automated-human evaluation. However, these assessments focus on general performance and do not investigate whether mitigation architectures transfer across provider ecosystems. A systematic cross-provider evaluation of hallucination-mitigation architectures spanning multiple providers and model generations remains an open gap in the literature. In this work, we aim to address this gap by evaluating a three-mechanism constraint-based architecture across three commercial providers and two model generations.
2. Methodology
2.1. System Architecture
Online-CADCOM is a research application that has been fully implemented and deployed as an online system for managing and selecting engineering tools. It is implemented using ASP.NET Core 8.0 and React 18 [4]. The application uses a PostgreSQL database containing 82 verified engineering tools. The tools are structured into a hierarchy of categories and subcategories, and each tool record includes characteristics, parameters, and inter-tool relationships. The names of the 82 verified tools used as the verification inventory are provided in the supplementary materials.
Figure 1 shows the anti-hallucination architecture with three sub-modules that can be switched on and off.
Mechanism M1: Database-Grounded Context Injection. We retrieve PostgreSQL records for tools and use a hierarchical context builder with six stages that generates the following contexts in sequence: (1) attributes of the target tool including feature attributes, input and output connections, and verification tools; (2) sibling tools in the same subcategory; (3) tools in the parent category; (4) tools in adjacent subcategories under the same parent category; (5) cross-category tools that share feature overlap with the target tool; and (6) a global list of all tool names. The number of tokens in the grounding context depends on domain density and is typically between 2,000 and 7,000. Because M1 includes tool records that contain tool names alongside their attributes, tool names are implicitly disclosed in the context. The M2 constraint can be seen as a refinement on top of this, which we discuss further under Section 2.2.
Mechanism M2: Closed-Vocabulary Constraint. We enforce a constraint using the following instruction placed before a list of tool names: “You MUST ONLY recommend tools from the following verified database. Do NOT invent, assume, or hallucinate any tool names.” This constraint is reinforced by an enumerated list of tool names (names only, without additional attributes) repeated at multiple points in the prompt. In contrast to M1, the names are shown without contextual details. With 82 tool names, the complete vocabulary fits within the prompt context. For substantially larger inventories, a retrieval step would be required to select a top-K candidate subset from the full vocabulary.
Mechanism M3: Structured JSON Enforcement (C3 anomaly). The model is prompted to output its response in a fixed JSON format, populating fields such as toolName, toolId, features, strengths, limitations, and workflowSteps. The presence of the mandatory fields toolName and toolId results in a high amount of slot-filling for this workflow step. When neither semantic grounding nor a closed vocabulary constrains the output space, the model may rely on training-data priors to fill these slots with plausible but out-of-inventory names. This behaviour is examined in detail under Section 4.2: JSON enforcement in itself increases hallucination, while improvements appear only when M3 is combined with grounding mechanisms (M1 and M2). Whether allowing null, empty, or “unknown” tool entries within the schema would reduce the C3 anomaly remains an open question.
2.2. Ablation Design
We define six configurations representing all meaningful combinations of the three mechanisms (Table 1):
The three binary mechanisms yield possible combinations. We evaluate six configurations and exclude M1+M3 (context + JSON, no vocabulary) and M2+M3 (vocabulary + JSON, no context). These two configurations are excluded for three main reasons. First, our main question for M3 is whether it adds benefit on top of the minimum effective configuration M1+M2, which is tested directly by comparing C4 and C5. Second, the weak performance of C3 shows that JSON enforcement without grounding is counterproductive, and the partially grounded intermediate cases are of lower mechanistic interest for this paper. Third, adding the two excluded configurations would require 1,152 additional API calls per generation (two configurations × three providers × four domains × 12 prompts × three repetitions × two generations), which increases experimental cost by 33% for limited additional insight. We therefore postpone M1+M3 and M2+M3 to future work, where they can more directly test whether partial grounding mitigates the C3 anomaly as predicted by the slot-filling hypothesis. The six evaluated configurations allow us to isolate each mechanism (C1, C2, C3), test the minimum effective combination (C4 = M1+M2), and evaluate the full architecture (C5 = M1+M2+M3).
Ablation overlap considerations. A methodological note about mechanism isolation is necessary because M1’s tool records include tool names. As a result, C1 (M1 only) provides implicit tool-name exposure through the injected context, while C2 (M2 only) provides explicit tool-name exposure combined with an explicit behavioral constraint, but without contextual details. The ablation therefore reflects practical deployment configurations rather than perfectly isolated mechanisms. All mechanism-attribution language should be interpreted at the configuration level. For example, “C1 is associated with X% reduction” refers to the effect of the C1 configuration (M1 enabled, M2/M3 disabled), not to M1 in isolation. Empirically, C2 outperforms C1 in both generations (Gen1: 12.2% vs. 22.1%; Gen2: 7.9% vs. 21.0%), suggesting that explicit behavioral constraints in M2 are associated with lower hallucination than implicit name exposure in M1, despite M1 providing richer context. A cleaner ablation (M1 with and without the tool-name list) could isolate this effect further in future work. Full prompt templates for all six configurations are provided in the supplementary material.
2.3. Model Selection
We evaluate twelve LLM configurations from three providers in two operational modes and across two model generations (Table 2 and Table 3).
In our prior conference paper, we demonstrated the effect of this architecture on a single provider model (OpenAI GPT-4o-mini, 576 queries). Here we examine robustness across providers. Specifically, we evaluate the three major commercial LLM API providers, OpenAI, Anthropic, and Google, which represent the dominant practical options for deploying LLM-based recommendation systems. Switching providers may affect results due to differences in model families, alignment through Reinforcement Learning from Human Feedback (RLHF), and tokenization.
Two-generation evaluation. A single cross-provider evaluation provides only a snapshot in time. Because LLMs evolve rapidly, we repeat the full experimental protocol on each provider’s next-generation models as of February 2026 (Generation 2), in addition to the models available as of January 2026 (Generation 1). With three providers, two modes (standard and thinking), and two generations, this yields a factorial design. This design allows us to assess whether the mitigation architecture remains effective as models evolve and provides practitioners with evidence that deployment investments are not invalidated by a model upgrade.
Reproducibility parameters. Table 4 shows the specific API parameters applied in each configuration. All experiments were carried out in Sofia, Bulgaria, between January 25 and February 15, 2026.

Table 4.
API parameters for reproducibility. All parameters were held constant across configurations C0–C5 within each model.
Table 4.
API parameters for reproducibility. All parameters were held constant across configurations C0–C5 within each model.
| Model | API Model ID | Temp. | Max Tokens | Thinking Param. |
|---|---|---|---|---|
| Generation 1 | ||||
| GPT-4.1 | gpt-4.1 | 1.0 | unlimited | — |
| o4-mini | o4-mini | 1.0 | unlimited | — |
| Claude Sonnet 4.5 | claude-sonnet-4-5-20250929 | 1.0 | 16,000 | — / type:enabled |
| Gemini 2.5 F.-Lite | gemini-2.5-flash-lite | 0.7 | 4,096 | — |
| Gemini 2.5 Flash | gemini-2.5-flash | 0.7 | 8,192 | — |
| Generation 2 | ||||
| GPT-5.2 | gpt-5.2 | 1.0 | 4,096 / 16,000 | reasoning_effort |
| Claude Sonnet 4.6 | claude-sonnet-4-6 | 1.0 | 4,096 / 16,000 | thinking.type:adaptive |
| Gemini 3.1 Flash-Lite | gemini-3.1-flash-lite-preview | 0.7 | 4,096 / 8,192 | thinkingLevel |
a GPT-5.2 uses max_completion_tokens (not max_tokens); values shown as standard/thinking where they differ. b Anthropic thinking uses budget_tokens: 4096. c Google thinking uses thinkingLevel within generationConfig. d OpenAI and Anthropic temperature values (1.0) are each provider’s API default; Google temperature (0.7) was set explicitly. OpenAI Gen1 max tokens were not set (SDK default: model maximum). All requests used HTTP timeout of 300s. Where wall-clock times (latencies) are shown in Table 5 and Table 6, these times have been measured from Sofia, Bulgaria, using sequential (i.e., non-concurrent) requests; thus, absolute latencies will depend on the particular environment in which they were measured and should be compared only within the context of the two tables; however, latency multipliers represent the more broadly applicable measure of latency. Where noted, provider defaults were used to reflect typical production deployment conditions.
Table 5.
Generation 1 response characteristics per query under C5 ( per model).
| Model | Tools/Q | Out Tok. | Latency (s) | Think Tok. | JSON% | Lat. Mult. |
|---|---|---|---|---|---|---|
| GPT-4.1 | 8.8 | 1,162 | 19.5 | — | 99.3 | 1.53× |
| o4-mini | 9.9 | 1,026 | 29.8 | 1,673 | 98.6 | |
| Claude Sonnet 4.5 | 15.6 | 2,843 | 65.6 | — | 97.9 | 0.95× |
| Claude S. 4.5 (thn) | 12.7 | 2,424 | 62.0 | 529 | 99.3 | |
| Gemini 2.5 Flash-Lite | 12.7 | 1,467 | 6.0 | — | 100.0 | 2.70× |
| Gemini 2.5 Flash | 14.0 | 374 | 16.2 | 1,717 | 78.5 |
Table 6.
Generation 2 response characteristics per query under C5 ( per model).
| Model | Tools/Q | Out Tok. | Latency (s) | Think Tok. | JSON% | Lat. Mult. |
|---|---|---|---|---|---|---|
| GPT-5.2 | 14.2 | 2,057 | 34.5 | — | 100.0 | 1.33× |
| GPT-5.2 (thn) | 14.3 | 2,103 | 45.9 | 596 | 100.0 | |
| Claude Sonnet 4.6 | 19.0 | 3,109 | 60.8 | — | 96.5 | 1.29× |
| Sonnet 4.6 (thn) | 19.0 | 3,768 | 78.4 | 514 | 100.0 | |
| Gemini 3.1 Flash-Lite | 8.0 | 830 | 4.2 | — | 100.0 | 2.26× |
| Gemini 3.1 Flash-Lite (thn) | 7.2 | 1 | 9.5 | 1,708 | 100.0 |
* Reported by API; actual thinking content is substantially longer due to a token-counting artifact in the Gemini API.
Supplementary Materials. All experimental data and source code are publicly available. The repository includes: (1) the 82 tool names that are part of the verification inventory; (2) the 197-name H1/H2 classification CSV with evidence URLs; (3) the evaluation framework source code (prompt builder, hallucination detector, metrics calculator); (4) the prompt templates for all configurations (C0–C5); (5) analysis scripts for all reported statistics and figures; and (6) the database schema of the tool framework plus a sample subset of tool records for reproduction using synthetic data. The repository README includes reproduction instructions.
In Generation 1 there is considerable variability in the implementation of the reasoners across the different providers (i.e., different model families, different API parameters, different models). This makes it very non-trivial to make any meaningful comparison of reasoners across the different providers. Generation 2 resolves this: all three providers converge on a single-model paradigm with configurable thinking toggles (see Table 4 for parameters).
2.4. Experimental Design
A factorial design experiment utilizing the Provider dimension (OpenAI, Anthropic, and Google), Mode dimension (standard and thinking), and Generation dimension (Generation 1 (Gen1), Generation 2 (Gen2)) conducted on combinations of providers, modes, and generations. By “generation” we refer to each provider’s cohort of models evaluated at a given time under the same protocol (Gen1: January 2026; Gen2: February 2026). Models were identified through APIs provided by the three providers during the measurement period and are listed in Table 4.
Ablation configuration (C0–C5) and domain (D1–D4) are additional within-subject factors. We use a partial factorial design for cost–information trade-off: standard models are evaluated on all six configurations, while thinking models are evaluated only on boundary configurations C0 and C5. A full ablation for thinking models would require 5,184 additional API calls (). The boundary-only design suffices, as the key question is if thinking increases performance at both (C0) the ungrounded baseline and (C5) the full architecture; in this case, all of the observable C5 scores were less than 2%.
Phase 1: Gen1 Full Ablation (Standard Models). API calls.
Phase 2: Gen1 Thinking Comparison. API calls.
Phase 3a: Gen2 Full Ablation (Standard Models). API calls.
Phase 3b: Gen2 Thinking Comparison. API calls.
In total, the experiment consists of 6,912 API calls across twelve model configurations spanning two generations.
Accounting of N. Here, N denotes the total number of API calls (queries) in each reported analysis. A single query is one API call to one model with one prompt under one configuration (Table 7). All 6,912 calls returned valid responses; no calls were excluded due to timeouts, malformed responses, or API errors.
Each cell has 12 prompts × 3 repetitions, yielding 36 queries. Within-prompt standard deviation was below 2% for C5 configurations. In the Results tables, N (the number of API calls included in each specific analysis) is reported alongside each result.
2.5. Evaluation Domains
These four domains represent variations in tool density and level of specialization (Table 8). Here, “tools” refers to engineering software products such as EDA applications, calculators, and simulators, not UI functions. In Domain D1 (Printed Circuit Board (PCB) design tools), some names are proper product names (e.g., “KiCad”, “Eagle”), while others are more generic. More generic names are handled through structured extraction and multi-word matching within the hallucination detection pipeline.
The four evaluation domains include 41 primary tools; the remaining 41 tools in the 82-tool inventory belong to non-evaluated categories. The “Related” column indicates tools from sibling and parent categories included via the M1 hierarchical context builder. M2 always includes all 82 tool names regardless of domain, and hallucination detection operates against the full 82-tool inventory.
2.6. Prompt Generation
For each domain, 12 test prompts are generated to cover diverse query types, including workflow recommendations, tool comparisons, simulation requests, verification needs, manufacturing workflows, calculator recommendations, alternatives, student-oriented guidance, advanced analysis tools, and multi-domain integration scenarios.
2.7. Metrics
We compute four metrics for each configuration-model-domain combination.
Hallucination Rate (HR). HR is the proportion of tool-name mentions that are absent from the verified database:
The counting unit is the distinct tool-name mention. Tool names are deduplicated within each response (case-insensitive). All per-configuration rates are computed at the provider-configuration cell level by aggregating mention counts over the 144 queries in that cell.
Grounding Rate. The complement of hallucination rate ().
(Query-Level Hallucination Probability). The proportion of queries containing at least one out-of-inventory tool mention:
This metric captures what users experience directly: whether a response contains any out-of-inventory recommendation. Under C5, in Gen1 standard models ranges from 35.4% (GPT-4.1) to 59.0% (Claude Sonnet 4.5), and in Gen2 standard models from 32.6% (Gemini 3.1 Flash-Lite) to 91.7% (Claude Sonnet 4.6). These values can be higher than HR because a single hallucinated tool among many grounded ones yields a low mention-level rate but still produces a “contaminated” response from a user perspective. We also define , the probability of encountering at least one H2 (external-real) tool recommendation:
An operationally significant failure mode can be isolated: how frequently does a user of the platform encounter real, competing tools (that have not been vetted by the platform)? is reported under Section 4.2 in addition to .
H1/H2 Taxonomy. Two types of out-of-inventory mentions are identified: H1 (fabricated) refers to names of tools that do not have an external referent (e.g., PCB Pro Designer 3000) and H2 (external-real) refers to tools that do exist commercially or as open-source software but are not listed in the curated inventory (e.g., Altium Designer, LTspice). These represent failures relative to the closed inventory, but they have different epistemic status. Frequency-weighted decomposition of the most frequent out-of-inventory names by manual verification is presented under Section 4.2.
Tools Per Query (). The average number of distinct tool names mentioned per response. This is essential for interpreting HR.
Expected Hallucinated Tools Per Query ():
Unlike HR, is not affected by “denominator dilution” (listing more grounded tools). It captures the absolute user impact per response.
2.8. Hallucination Detection
Hallucination detection can be decomposed into two sub-tasks: (1) the tool mention detection task which aims at locating the candidate tool mentions in the response, and (2) the tool mention grounding task which determines whether each mentioned tool is grounded or hallucinated.
2.8.1. Candidate Tool Name Extraction
Candidate tool names are extracted using three complementary strategies applied to every response:
Strategy 1: JSON field extraction. There are a considerable number of results that can be parsed as valid JSON (mainly C3 and C5). Tool names are extracted from specific schema fields (toolName, tool) via recursive JSON traversal and ignoring the meta-description fields (phase, step, action, verdict). We filter the string values by length, which has to be between 3 and 100 characters.
Strategy 2: Known-name matching. The 82 known tool names are loaded when the application is started. For each full name, the tool searches the raw response for the full tool-name string using case-insensitive contain search (response.Contains(fullToolName, OrdinalIgnoreCase)). The names are matched as full phrases which are composed of multiple words. Known-name matching only matches grounded mentions and cannot catch the hallucinated names.
Strategy 3: Software product pattern detection. Regex patterns derived from engineering software naming conventions are applied to detect hallucinated tool names not present in the database. Patterns include common software suffixes (“Designer”, “Pro”, “Suite”, “Studio”, “Toolkit”, “Calculator”, “Simulator”, “Viewer”, “Editor”), version number patterns (e.g., “OrCAD 17.4”), and a curated list of known commercial EDA tools outside our inventory (e.g., Altium Designer, OrCAD, Cadence, Mentor Graphics, Proteus, Multisim, LTspice). These patterns aim to match the common naming conventions of tool names while excluding common English words.
When we combine the three strategies, we get the set of candidate tool mentions for each response. For free-form text responses (C0, C1, C2, C4), Strategies 2 and 3 are the dominant strategies. For JSON responses (C3, C5), all three strategies are used, but we prefer Strategy 1 due to its higher precision. The precision of Strategy 1 is due to the fact that it makes use of the structural information of the JSON fields.
2.8.2. Grounding Classification
Each extracted candidate is classified as grounded or hallucinated via a three-level matching cascade:
- 1.
- Exact match (case-insensitive): candidate exactly matches a database tool name.
- 2.
- Fuzzy containment: if either string contains the other and the length ratio (shorter/longer) exceeds 0.55, classify as grounded (e.g., “KiCad EDA” matching “KiCad”).
- 3.
- Edit distance: for names longer than 4 characters, if Levenshtein distance , classify as grounded (handles minor typos such as “KiCaad”).
Candidates failing all three levels are classified as hallucinated.
2.8.3. Scope and Limitations of Detection
Ambiguous names. We found three ambiguous names in D1–D4: “EAGLE” (a common English word), “jcalc” (a short, generic-sounding name), and “Maddox” (a common surname). For Strategy 2, we match the full tool-name strings against the input strings in a case-insensitive containing fashion rather than in a case-insensitive substring fashion. Sensitivity analysis confirms that excluding these changes hallucination rates by <1 percentage point and that our findings are unchanged.
False negatives. Hallucinated tool names that do not fit the patterns described in Strategy 3 may be missed, making our hallucination estimates conservative for free-form configurations (C0, C1, C2, C4). In JSON configurations (C3, C5), Strategy 1 substantially reduces this risk by extracting tool names directly from schema fields.
False positives. A non-tool word matching a regex pattern could be incorrectly identified as a hallucinated tool. There were zero false positives from validating 50 stratified responses (25 C0, 25 C5, evenly balanced by provider) across 485 extracted tool mentions, with 28 undetected tool names (27 from C0 free-form responses and 1 from C5 JSON responses). Overall recall is estimated at approximately 94.5%, and above 99% for C5 due to JSON field extraction. Because recall is lower for free-form baselines, C0 hallucination rates are conservative lower bounds, and the C0-to-C5 reduction is likely equal to or greater than reported.
Detection pipeline asymmetry. Recall is higher for JSON-enforced configurations (C3, C5) than for free-text configurations due to Strategy 1. This asymmetry biases against our improvement claims, since it makes uncontrolled baseline rates (C0) conservative lower bounds while capturing nearly all hallucinated mentions under JSON enforcement. Any bias therefore works against our reported reduction, making the measured improvement conservative.
Finally, our precision measure is about whether an extracted string behaves like a tool mention (i.e., looks like a tool name entity). A post-hoc analysis under Section 4.2 identifies a subset of out-of-inventory mentions that are generic or non-specific entities (e.g., “Practical Tips”, “Score”) that pass syntactic extraction but lack a specific product referent. These are still correctly classified as out-of-inventory, but they inflate headline HR relative to the operationally relevant H2 (external-real) category.
2.9. Statistical Methods
All comparisons use non-parametric tests. We treat hallucination rate (HR) as non-parametric because (i) HR is bounded on , and (ii) under effective configurations the empirical HR distributions are non-normal and typically right-skewed.
- Within-model comparisons (C0 vs. C5, C0 vs. C3): Wilcoxon signed-rank test with query-level paired observations ( per provider per configuration). The C0 vs. C5 tests are two-sided. The C0 vs. C3 tests are also two-sided since we had no a priori belief about the direction of the anomaly; one-sided p-values are reported as supplementary confirmation (see Section 4.2).
- Cross-mode comparisons (standard vs. thinking) are evaluated using the Wilcoxon signed-rank test with query-level pairing by (domain, prompt, repetition), since both variants are evaluated on the same 144 queries for each provider (). This paired design, also used in the within-model ablation and in the multi-group ordering discussed below, ensures that identical queries are compared across conditions, with pairing by query identity controlling for prompt-difficulty effects. As a robustness check, we also report Mann–Whitney U tests on independent samples. When the two tests differ, the higher statistical power of the paired test reveals significant differences favoring the standard models (Gen1 Google, ; Gen1 cross-provider aggregate, ). Differences between standard and thinking modes are computed as ; therefore positive C5 and positive indicate higher hallucination under thinking mode.
- Cross-generational comparisons (Gen1 vs. Gen2): Mann–Whitney U test on independent samples ( per group), because Gen1 and Gen2 models are architecturally distinct (e.g., GPT-4.1 vs. GPT-5.2), and we expect the assumption of comparable within-query error structure to be weaker than for within-generation mode comparisons.
- Multi-group ordering (C0–C5): Friedman test followed by three planned pairwise Wilcoxon signed-rank tests (paired, consistent with the repeated-measures design) to assess contrasts aligned with the study hypotheses: (i) C2 vs. C4 to test whether adding M1 to M2 improves performance; (ii) C2 vs. C5 to test whether the full architecture outperforms vocabulary alone; and (iii) C4 vs. C5 to test whether adding M3 to M1+M2 improves performance.
For planned contrasts, we performed a Bonferroni correction for tests. Other tests that show up in the results (e.g., the C3 anomaly effects, standard-vs.-thinking, and cross-generational comparisons) are not multiplicity corrected and should be treated as exploratory and merely indicative. The significance threshold for all tests is . Tables report mention-aggregated HR, while all statistical tests operate on per-query HR values (one observation per query; per cell). Zero-difference pairs (queries with identical HR under both conditions) are excluded from the Wilcoxon signed-rank test and from the computation of . For the primary C0 vs. C5 contrast, the proportion of zero-difference pairs is per cell. For ablation pairwise contrasts among low-HR configurations (e.g., C2 vs. C4), this proportion can reach 50–64% because both conditions frequently yield zero hallucinations for the same query.
Effect sizes. We report matched-pairs rank-biserial correlation () as the primary paired effect size, Cliff’s delta () as a descriptive non-parametric measure [30], and Cohen’s d for comparability. Cliff’s delta thresholds follow [30]: (negligible), (small), (medium), and (large). Formulas and relationships between measures are provided in the supplementary materials.
Confidence intervals. We report 95% bootstrap confidence intervals derived using the percentile method with 10,000 resamples, with the individual query as the resampling unit ( query resamples per provider-configuration cell). Each resample draws 144 query-level HR values with replacement, recomputes the mention-aggregated rate, and records the 2.5th and 97.5th percentiles. When bootstrap and parametric intervals diverge, we report the bootstrap interval. Additional bootstrap details are provided in the supplementary materials.
3. Results
We report results in two parts. The first part presents the Generation 1 cross-provider baseline (Phases 1–2: GPT-4.1, Claude Sonnet 4.5, Gemini 2.5 Flash-Lite/Flash; 3,456 API calls). The second part presents Generation 2 results (Phases 3a–3b: GPT-5.2, Claude Sonnet 4.6, Gemini 3.1 Flash-Lite; 3,456 additional calls). Table 9 provides a navigational overview.
Table 9.
Result map: key findings and supporting evidence.
| Finding | Section | Evidence |
|---|---|---|
| C0 baseline HR: 59–74% | 3.1 | Table 10 |
| C5 reduces HR to 3.3–14.9% | 3.2 | Table 11, Table 12 |
| Ablation rank ordering consistent | 3.3, 3.6 | Table 13, Table 14 |
| C3 anomaly (+10–15pp) | 3.3, 4.2 | Table 13, Table 14 |
| Reasoning = no significant benefit (C5) | 3.4, 3.6 | Table 15, Table 16 |
| Cross-generational stability | 3.6 | Table 17 |
| M1+M2 captures 93–99% of benefit | 4.2 | Table 13, Table 14 |
| H2 decomposition (59.3% external-real) | 4.2 | Supplement CSV |
| Verbosity–HR correlation weak | 4.1 | Table 5, Table 6 |
Table 10.
Generation 1 baseline hallucination rates (HR, %) under C0 across all models and domains (36 queries per cell; ).
Table 10.
Generation 1 baseline hallucination rates (HR, %) under C0 across all models and domains (36 queries per cell; ).
| Model | D1 | D2 | D3 | D4 | Avg |
|---|---|---|---|---|---|
| Standard Models | |||||
| GPT-4.1 | 64.2 | 62.5 | 60.4 | 63.5 | 62.7 |
| Claude Sonnet 4.5 | 69.4 | 70.2 | 81.1 | 75.3 | 74.0 |
| Gemini 2.5 Flash-Lite | 69.6 | 49.1 | 69.5 | 48.6 | 59.2 |
| Reasoning Models | |||||
| o4-mini | 70.6 | 67.3 | 84.3 | 66.9 | 72.3 |
| Claude Sonnet 4.5 (thn) | 71.4 | 70.5 | 81.5 | 70.8 | 73.6 |
| Gemini 2.5 Flash | 65.3 | 59.7 | 67.0 | 66.0 | 64.5 |
| Cross-provider avg | 68.4 | 63.2 | 74.0 | 65.2 | 67.7 |
Table 11.
Generation 1 hallucination rates (%) under C5 with C0-to-C5 reduction (36 queries per cell; ). Cross-provider rate comparisons should be interpreted cautiously due to temperature differences (see Table 4).
Table 11.
Generation 1 hallucination rates (%) under C5 with C0-to-C5 reduction (36 queries per cell; ). Cross-provider rate comparisons should be interpreted cautiously due to temperature differences (see Table 4).
| Model | D1 | D2 | D3 | D4 | Avg | Reduction |
|---|---|---|---|---|---|---|
| Standard Models | ||||||
| GPT-4.1 | 8.7 | 9.1 | 3.6 | 0.0 | 5.3 | 91.5% |
| Claude Sonnet 4.5 | 26.3 | 14.9 | 2.1 | 1.9 | 11.3 | 84.7% |
| Gemini 2.5 Flash-Lite | 9.3 | 4.5 | 1.4 | 0.0 | 3.8 | 93.6% |
| Reasoning Models | ||||||
| o4-mini | 14.8 | 6.2 | 4.6 | 0.9 | 6.6 | 90.8% |
| Claude S. 4.5 (thn) | 25.8 | 15.7 | 1.9 | 1.8 | 11.3 | 84.7% |
| Gemini 2.5 Flash | 9.6 | 9.1 | 1.4 | 1.9 | 5.5 | 91.5% |
| Cross-prov. avg (std) | 14.8 | 9.5 | 2.4 | 0.6 | 6.8 | 89.6% |
| Cross-prov. avg (thn) | 16.7 | 10.3 | 2.6 | 1.5 | 7.8 | 88.9% |
Table 12.
Generation 2 hallucination rates (%) under C5 with C0-to-C5 reduction (36 queries per cell; ).
Table 12.
Generation 2 hallucination rates (%) under C5 with C0-to-C5 reduction (36 queries per cell; ).
| Model | D1 | D2 | D3 | D4 | C5 Avg | Reduction |
|---|---|---|---|---|---|---|
| Standard Models (C5) | ||||||
| GPT-5.2 | 5.9 | 6.8 | 0.2 | 0.2 | 3.3 | 94.6% |
| Claude Sonnet 4.6 | 21.9 | 15.6 | 10.5 | 5.2 | 13.3 | 81.6% |
| Gemini 3.1 Flash-Lite | 10.4 | 11.1 | 2.0 | 0.3 | 5.9 | 91.2% |
| Reasoning Models (C5) | ||||||
| GPT-5.2 (thn) | 4.3 | 8.1 | 0.2 | 0.6 | 3.3 | 94.6% |
| Sonnet 4.6 (thn) | 24.6 | 16.6 | 11.6 | 6.9 | 14.9 | 79.3% |
| Gemini 3.1 Flash-Lite (thn) | 8.3 | 11.2 | 1.5 | 0.0 | 5.2 | 92.4% |
| Cross-prov. avg (std) | 12.7 | 11.1 | 4.3 | 1.9 | 7.5 | 88.8% |
| Cross-prov. avg (thn) | 12.4 | 12.0 | 4.4 | 2.5 | 7.8 | 88.7% |
Table 13.
Generation 1 ablation results: mention-aggregated HR (%) per configuration, averaged across four domains (144 queries per cell; ). C3 anomaly* highlighted.
Table 13.
Generation 1 ablation results: mention-aggregated HR (%) per configuration, averaged across four domains (144 queries per cell; ). C3 anomaly* highlighted.
| Config | Mechanisms | GPT-4.1 | Claude 4.5 | Gemini Lite | Avg |
|---|---|---|---|---|---|
| C0 | None | 62.7 | 74.0 | 59.2 | 65.3 |
| C1 | M1 (Context) | 17.6 | 35.5 | 13.2 | 22.1 |
| C2 | M2 (Vocab.) | 9.7 | 22.2 | 4.8 | 12.2 |
| C3* | M3 (JSON) | 74.0* | 80.0* | 72.1* | 75.4* |
| C4 | M1+M2 | 7.5 | 22.6 | 2.9 | 11.0 |
| C5 | M1+M2+M3 | 5.3 | 11.3 | 3.8 | 6.8 |
| C0→C5 reduction | 91.5% | 84.7% | 93.6% | 89.6% | |
Table 14.
Generation 2 ablation results: mention-aggregated HR (%) per configuration, averaged across four domains (144 queries per cell; ). C3 anomaly* persists.
Table 14.
Generation 2 ablation results: mention-aggregated HR (%) per configuration, averaged across four domains (144 queries per cell; ). C3 anomaly* persists.
| Config | Mechanisms | GPT-5.2 | Sonnet 4.6 | Flash-Lite 3.1 | Avg |
|---|---|---|---|---|---|
| C0 | None | 60.3 | 72.4 | 67.3 | 66.7 |
| C1 | M1 (Context) | 13.7 | 26.2 | 17.4 | 19.1 |
| C2 | M2 (Vocab.) | 2.9 | 15.2 | 6.5 | 8.2 |
| C3* | M3 (JSON) | 85.4* | 82.6* | 77.3* | 81.8* |
| C4 | M1+M2 | 3.6 | 16.3 | 4.5 | 8.1 |
| C5 | M1+M2+M3 | 3.3 | 13.3 | 5.9 | 7.5 |
| C0→C5 reduction | 94.6% | 81.6% | 91.2% | 88.8% | |
Table 15.
Generation 1 standard vs. reasoning model comparison under C0 and C5. C5 = (percentage points (pp)); positive = higher hallucination under thinking. per row.
Table 15.
Generation 1 standard vs. reasoning model comparison under C0 and C5. C5 = (percentage points (pp)); positive = higher hallucination under thinking. per row.
| Provider | Mode | C0 HR (%) | C5 HR (%) | Reduction | Δ C5 |
|---|---|---|---|---|---|
| OpenAI | Standard | 62.7 | 5.3 | 91.5% | pp |
| Reasoning | 72.3 | 6.6 | 90.8% | ||
| Anthropic | Standard | 74.0 | 11.3 | 84.7% | pp |
| Reasoning | 73.6 | 11.3 | 84.7% | ||
| Standard | 59.2 | 3.8 | 93.6% | pp | |
| Reasoning | 64.5 | 5.5 | 91.5% | ||
| Average | Standard | 65.3 | 6.8 | 89.6% | pp |
| Reasoning | 70.1 | 7.8 | 88.9% |
Table 16.
Generation 2 standard vs. reasoning comparison under C0 and C5. C5 = (pp). All Gen2 providers use single-model thinking toggles. per row.
Table 16.
Generation 2 standard vs. reasoning comparison under C0 and C5. C5 = (pp). All Gen2 providers use single-model thinking toggles. per row.
| Provider | Mode | C0 HR (%) | C5 HR (%) | Reduction | Δ C5 |
|---|---|---|---|---|---|
| OpenAI | Standard | 60.3 | 3.3 | 94.6% | pp |
| Reasoning | 61.5 | 3.3 | 94.6% | ||
| Anthropic | Standard | 72.4 | 13.3 | 81.6% | pp |
| Reasoning | 72.3 | 14.9 | 79.3% | ||
| Standard | 67.3 | 5.9 | 91.2% | pp | |
| Reasoning | 69.1 | 5.2 | 92.4% | ||
| Average | Standard | 66.7 | 7.5 | 88.8% | pp |
| Reasoning | 67.6 | 7.8 | 88.4% |
Table 17.
Cross-generational C5 hallucination rates (%). Bold = improvement ( per cell).
| Provider | Mode | Gen1 | Gen2 | Δ | Direction |
|---|---|---|---|---|---|
| OpenAI | Standard | 5.3 | 3.3 | ↓ Improved | |
| Reasoning | 6.6 | 3.3 | ↓ Improved | ||
| Anthropic | Standard | 11.3 | 13.3 | ↑ Regressed | |
| Reasoning | 11.3 | 14.9 | ↑ Regressed | ||
| Standard | 3.8 | 5.9 | ↑ Regressed | ||
| Reasoning | 5.5 | 5.2 | ≈ Stable | ||
| Average | Standard | 6.8 | 7.5 | ≈ Stable | |
| Reasoning | 7.8 | 7.8 | ≈ Stable |
Note: Cross-provider absolute rate comparisons should be interpreted carefully, since default temperatures differ (OpenAI/Anthropic: 1.0; Google: 0.7). Within-provider and cross-generational comparisons are unaffected.
3.1. Cross-Provider Baseline Hallucination (C0)
Under C0 (no anti-hallucination mechanisms), all models exhibit high hallucination rates across all domains (Table 10).
From the rates in Figure 2 we see that hallucination rates are in the range of 59.2% to 74.0%. This means that around two-thirds of suggested tools do not appear in the confirmed tool box. Reasoning models show consistently equal or higher rates than their standard counterparts (cross-provider averages: 65.3% standard vs. 70.1% thinking). Thus, extended internal deliberation alone does not serve to decrease ungrounded output.
3.2. Full Architecture Effectiveness (C5)
When all three mechanisms are in place (C5), there is a substantial reduction in hallucination (Table 11).
The C0-to-C5 reduction is statistically significant for all twelve model configurations (Wilcoxon signed-rank, all ; to ; Cliff’s to , all large; Figure 2).
For standard Gen1 models, residual C5 rates are as low as 3.8% (Gemini Flash-Lite, 95% CI [2.7, 4.4]) and as high as 11.3% (Claude Sonnet 4.5, 95% CI [8.6, 12.5]). The lower absolute rates may be due to Google’s lower temperature setting (0.7 vs. 1.0, see Section 4.3). All models come close to zero hallucination in domains D3 and D4 (≤1.9% for five of six models), which suggests that smaller, well-defined domains enable stronger grounding. The C0-to-C5 reduction holds across all 48 domain–model cells individually ().
Under C5, reasoning models perform comparably but slightly worse (cross-provider: 6.8% standard vs. 7.8% thinking; C5 = +1.0pp, , , small). None of the providers show a statistically significant gain for the reasoning mode. The only per-provider statistically significant result (Google, ) favors the standard configuration. The same conclusion is also confirmed when applying the Mann–Whitney U test as a robustness check.
3.3. Ablation Analysis
Table 13 presents the mention-aggregated hallucination rates for each ablation configuration in Generation 1.
C3* anomaly: JSON enforcement in isolation (C3) is strictly larger than C0 for all providers, indicating that structural constraints without semantic grounding are counterproductive. We also found that the configuration ordering is statistically significant (Friedman test, all ; Figure 3). The largest reduction occurs at C1, going from 65.3% to 22.1%, while C2 further reduces the rate to 12.2%. The C3 anomaly is consistent across providers (Wilcoxon one-sided, all ; to ). C4 approaches C5 (11.0% vs. 6.8%); the C2–C5 contrast is significant for OpenAI and Anthropic () but not Google ().
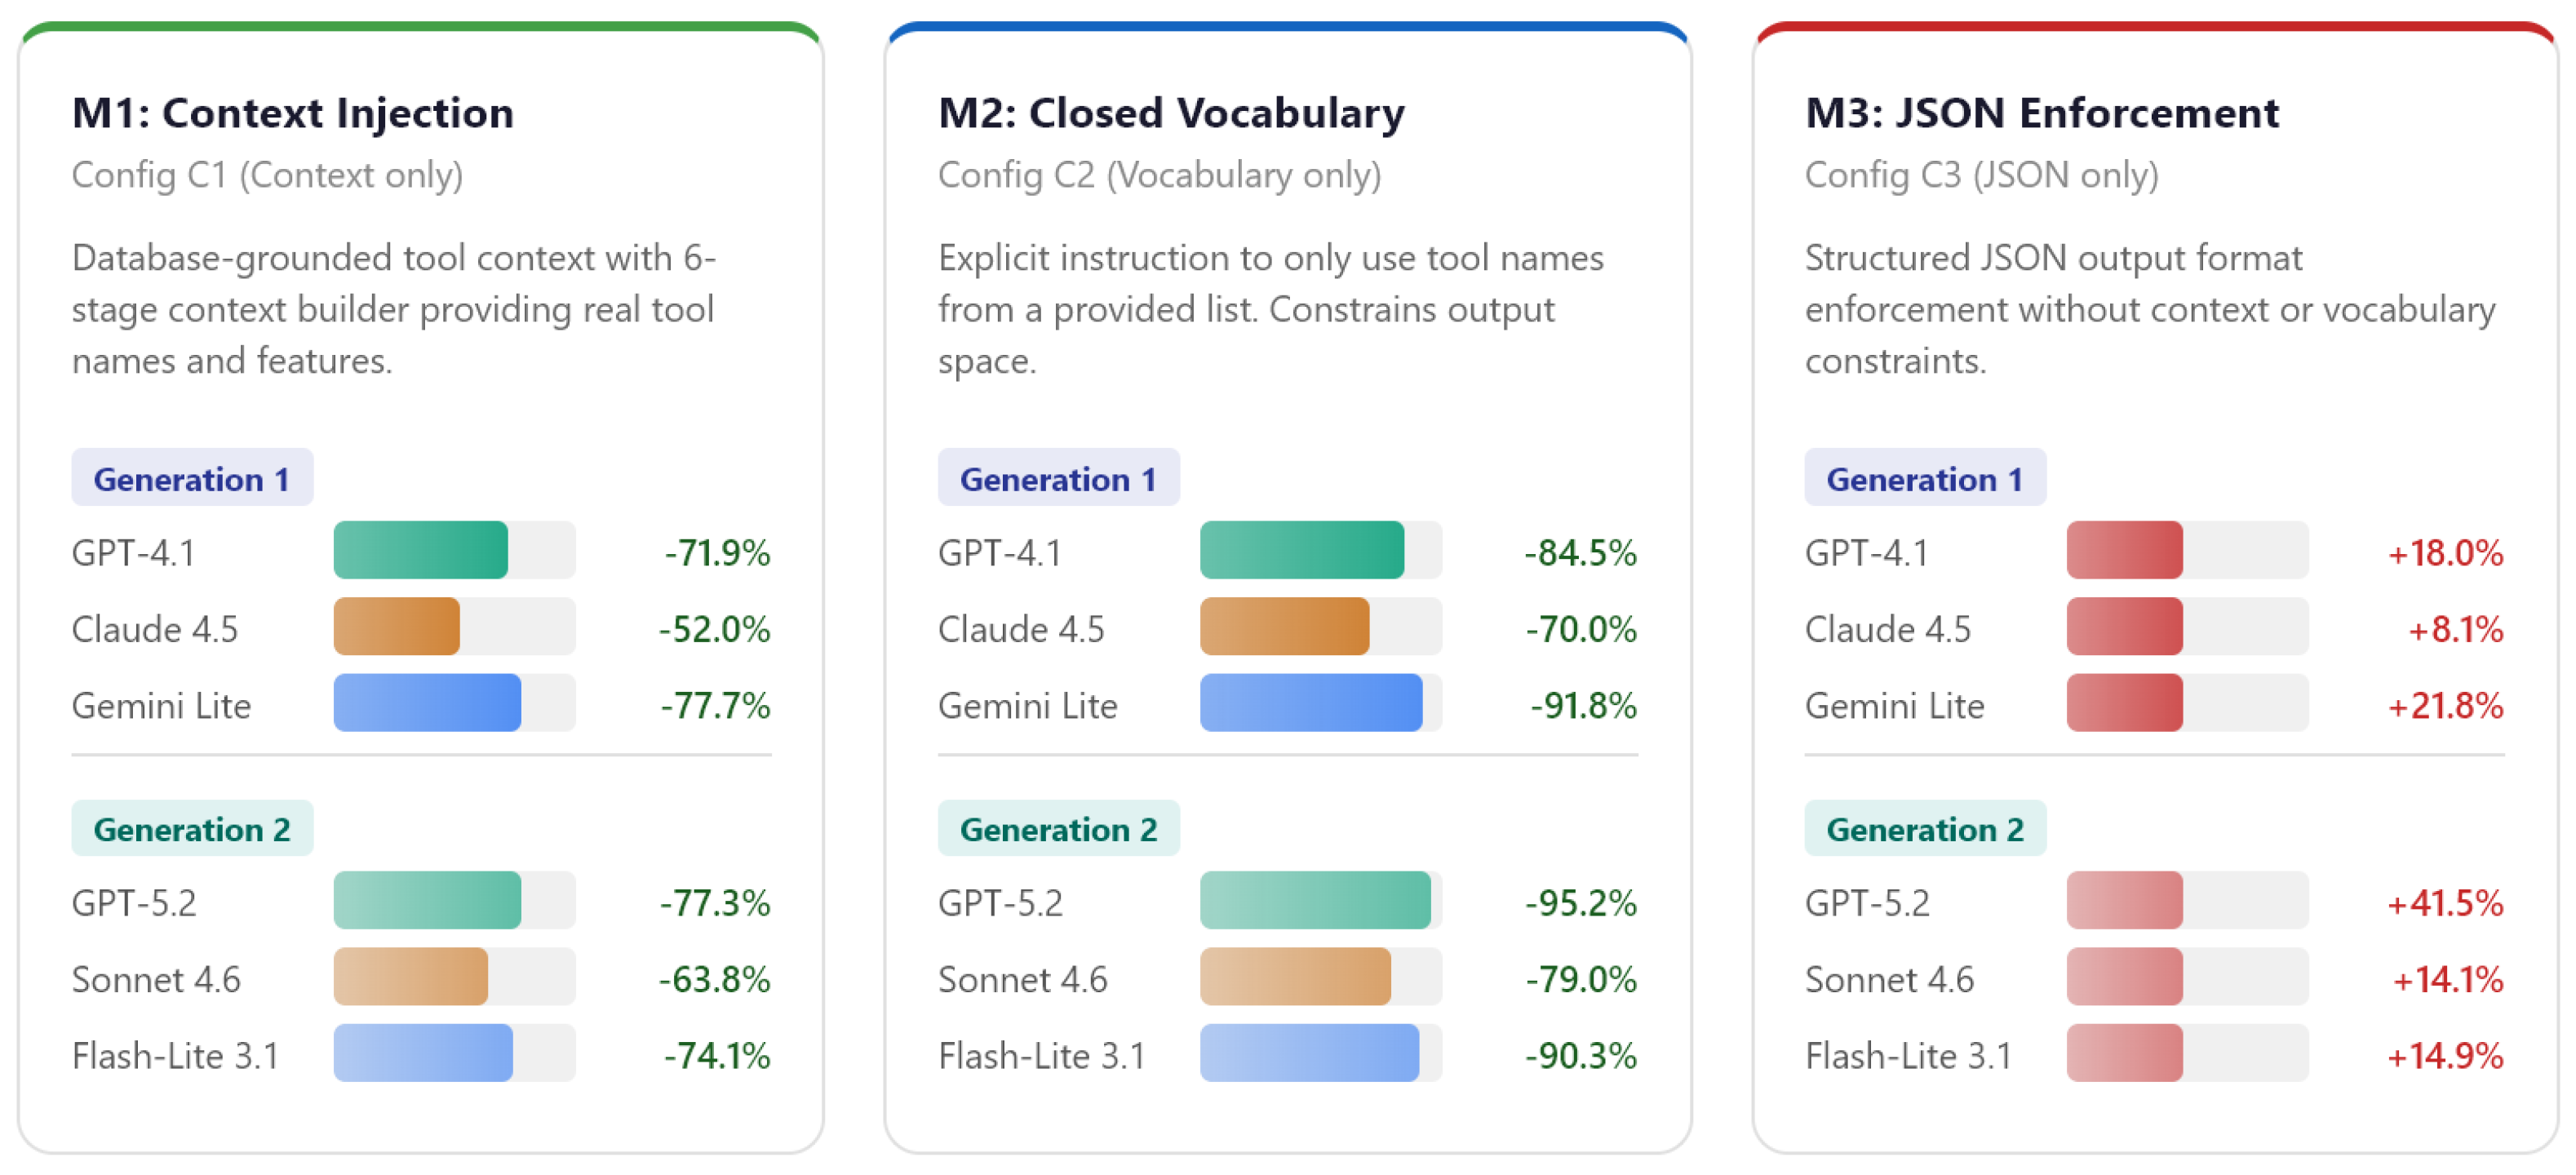
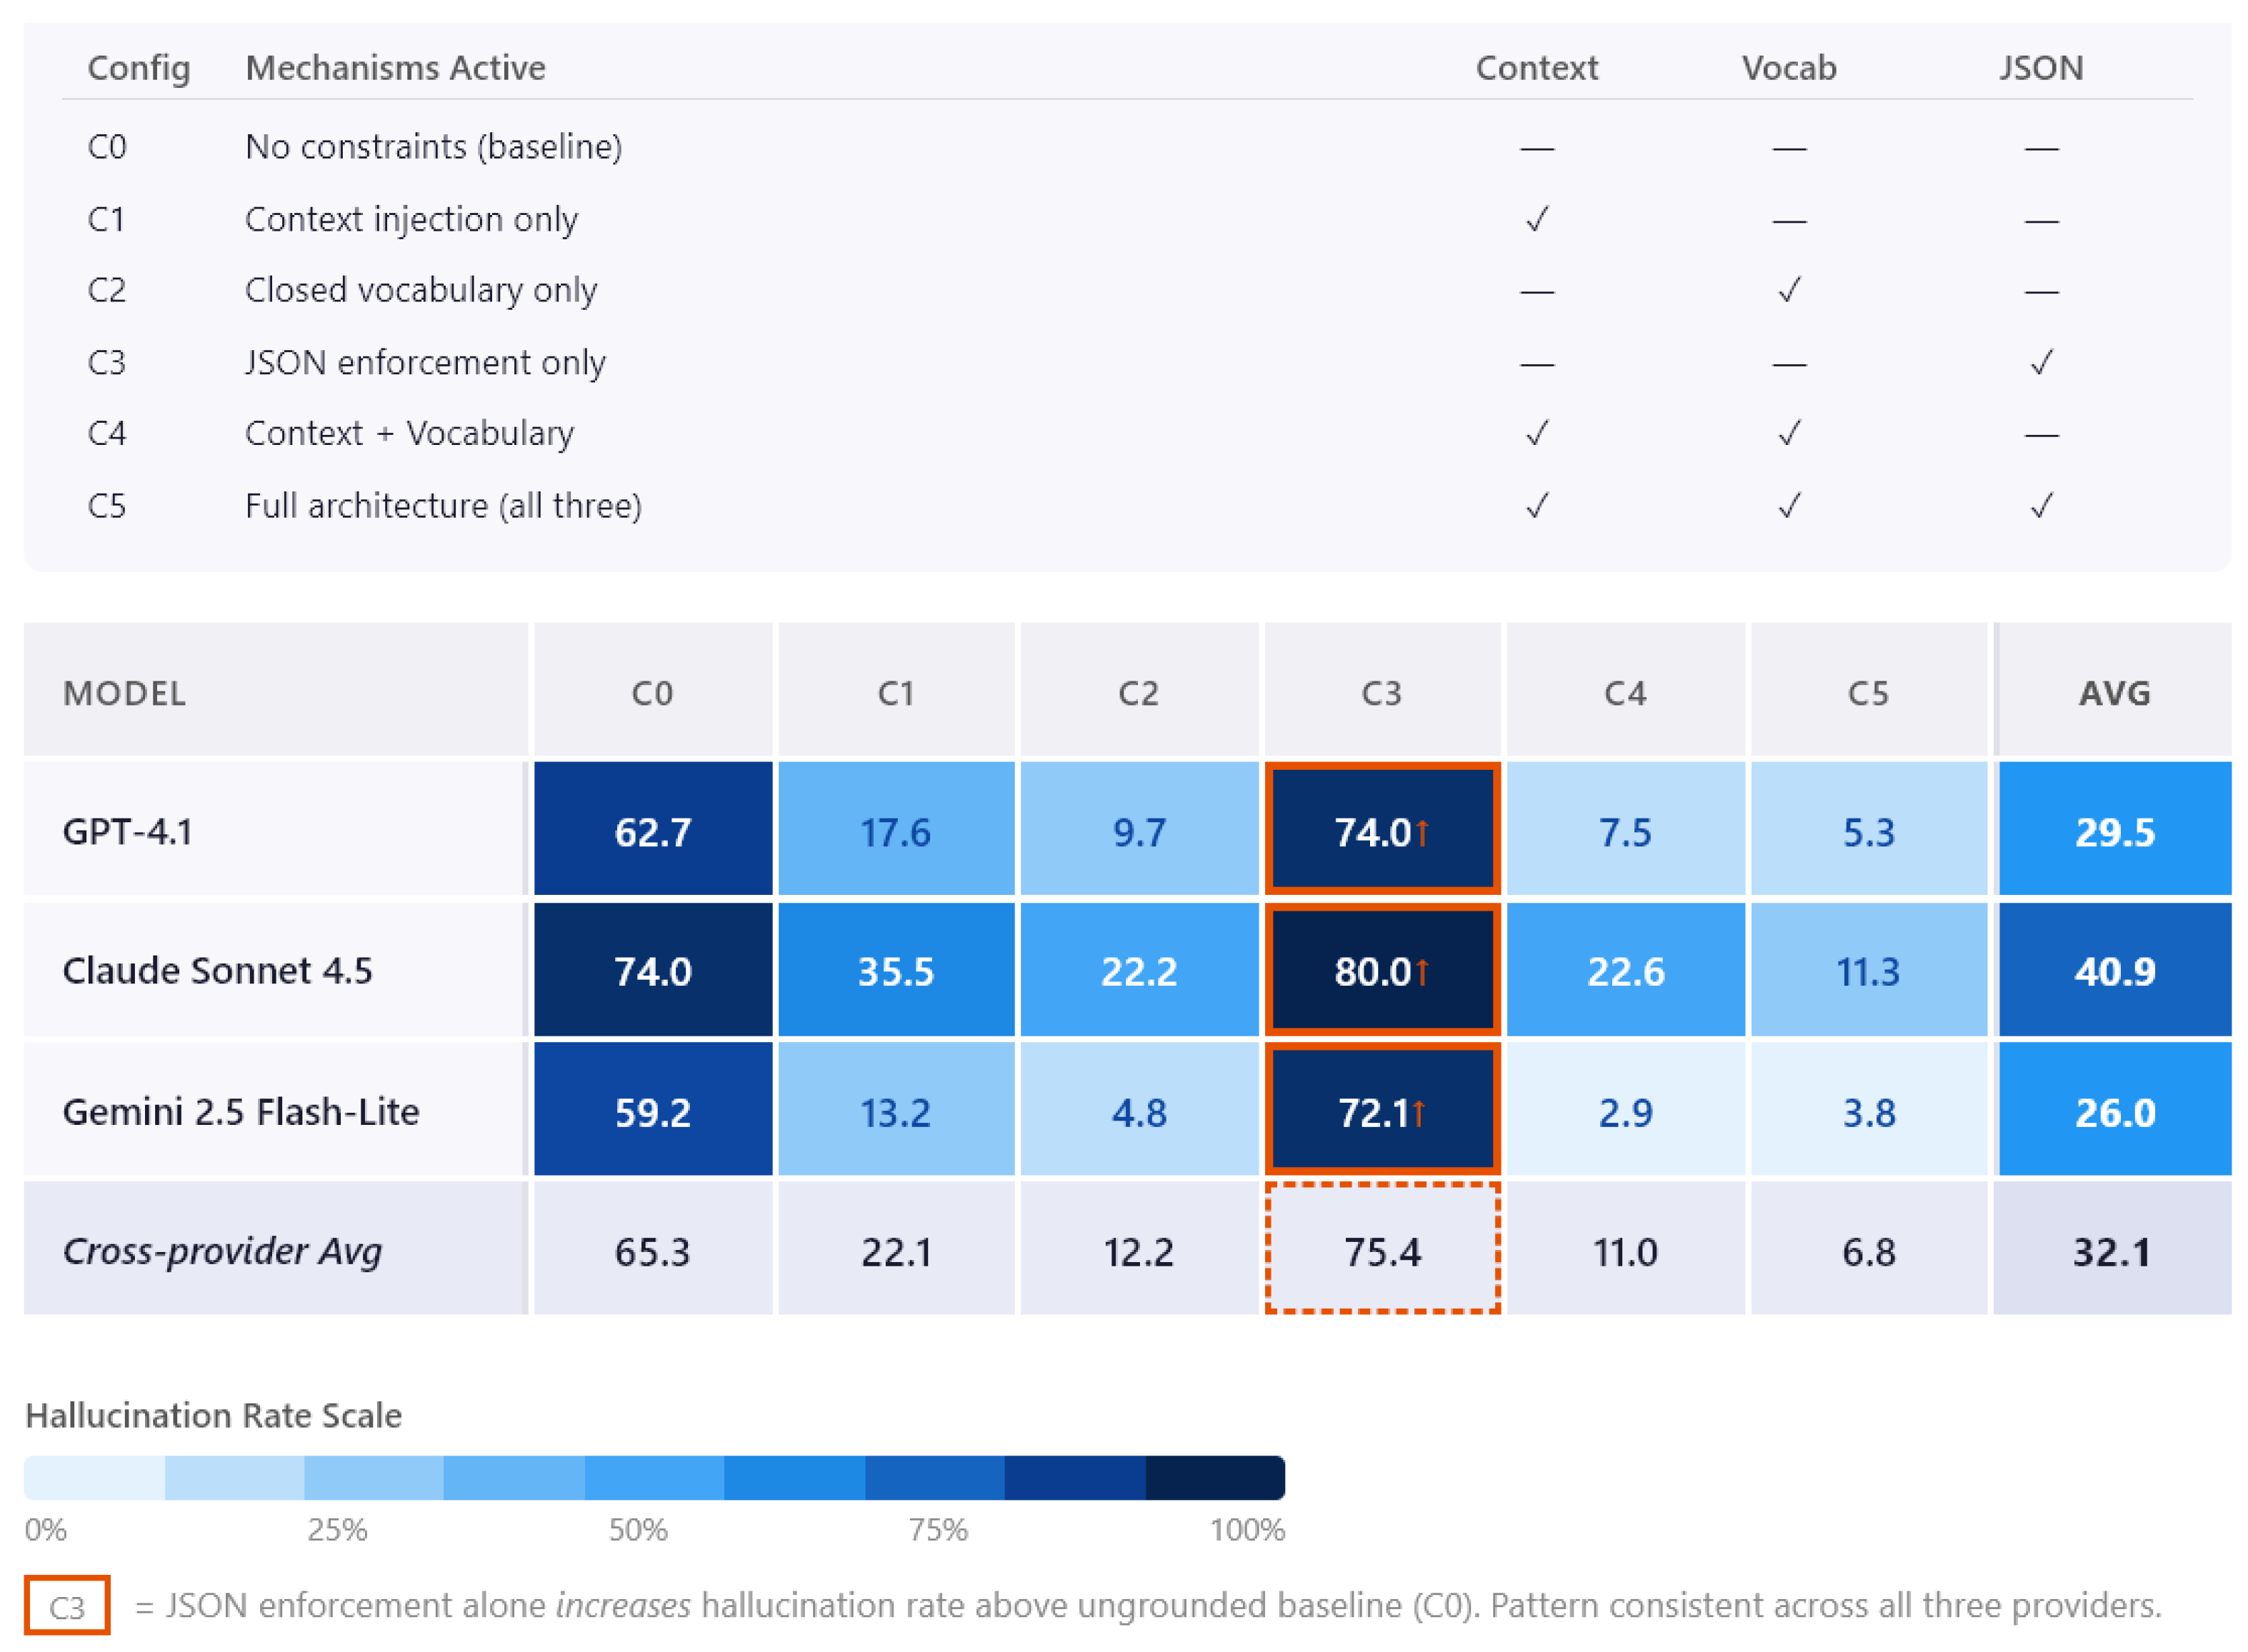
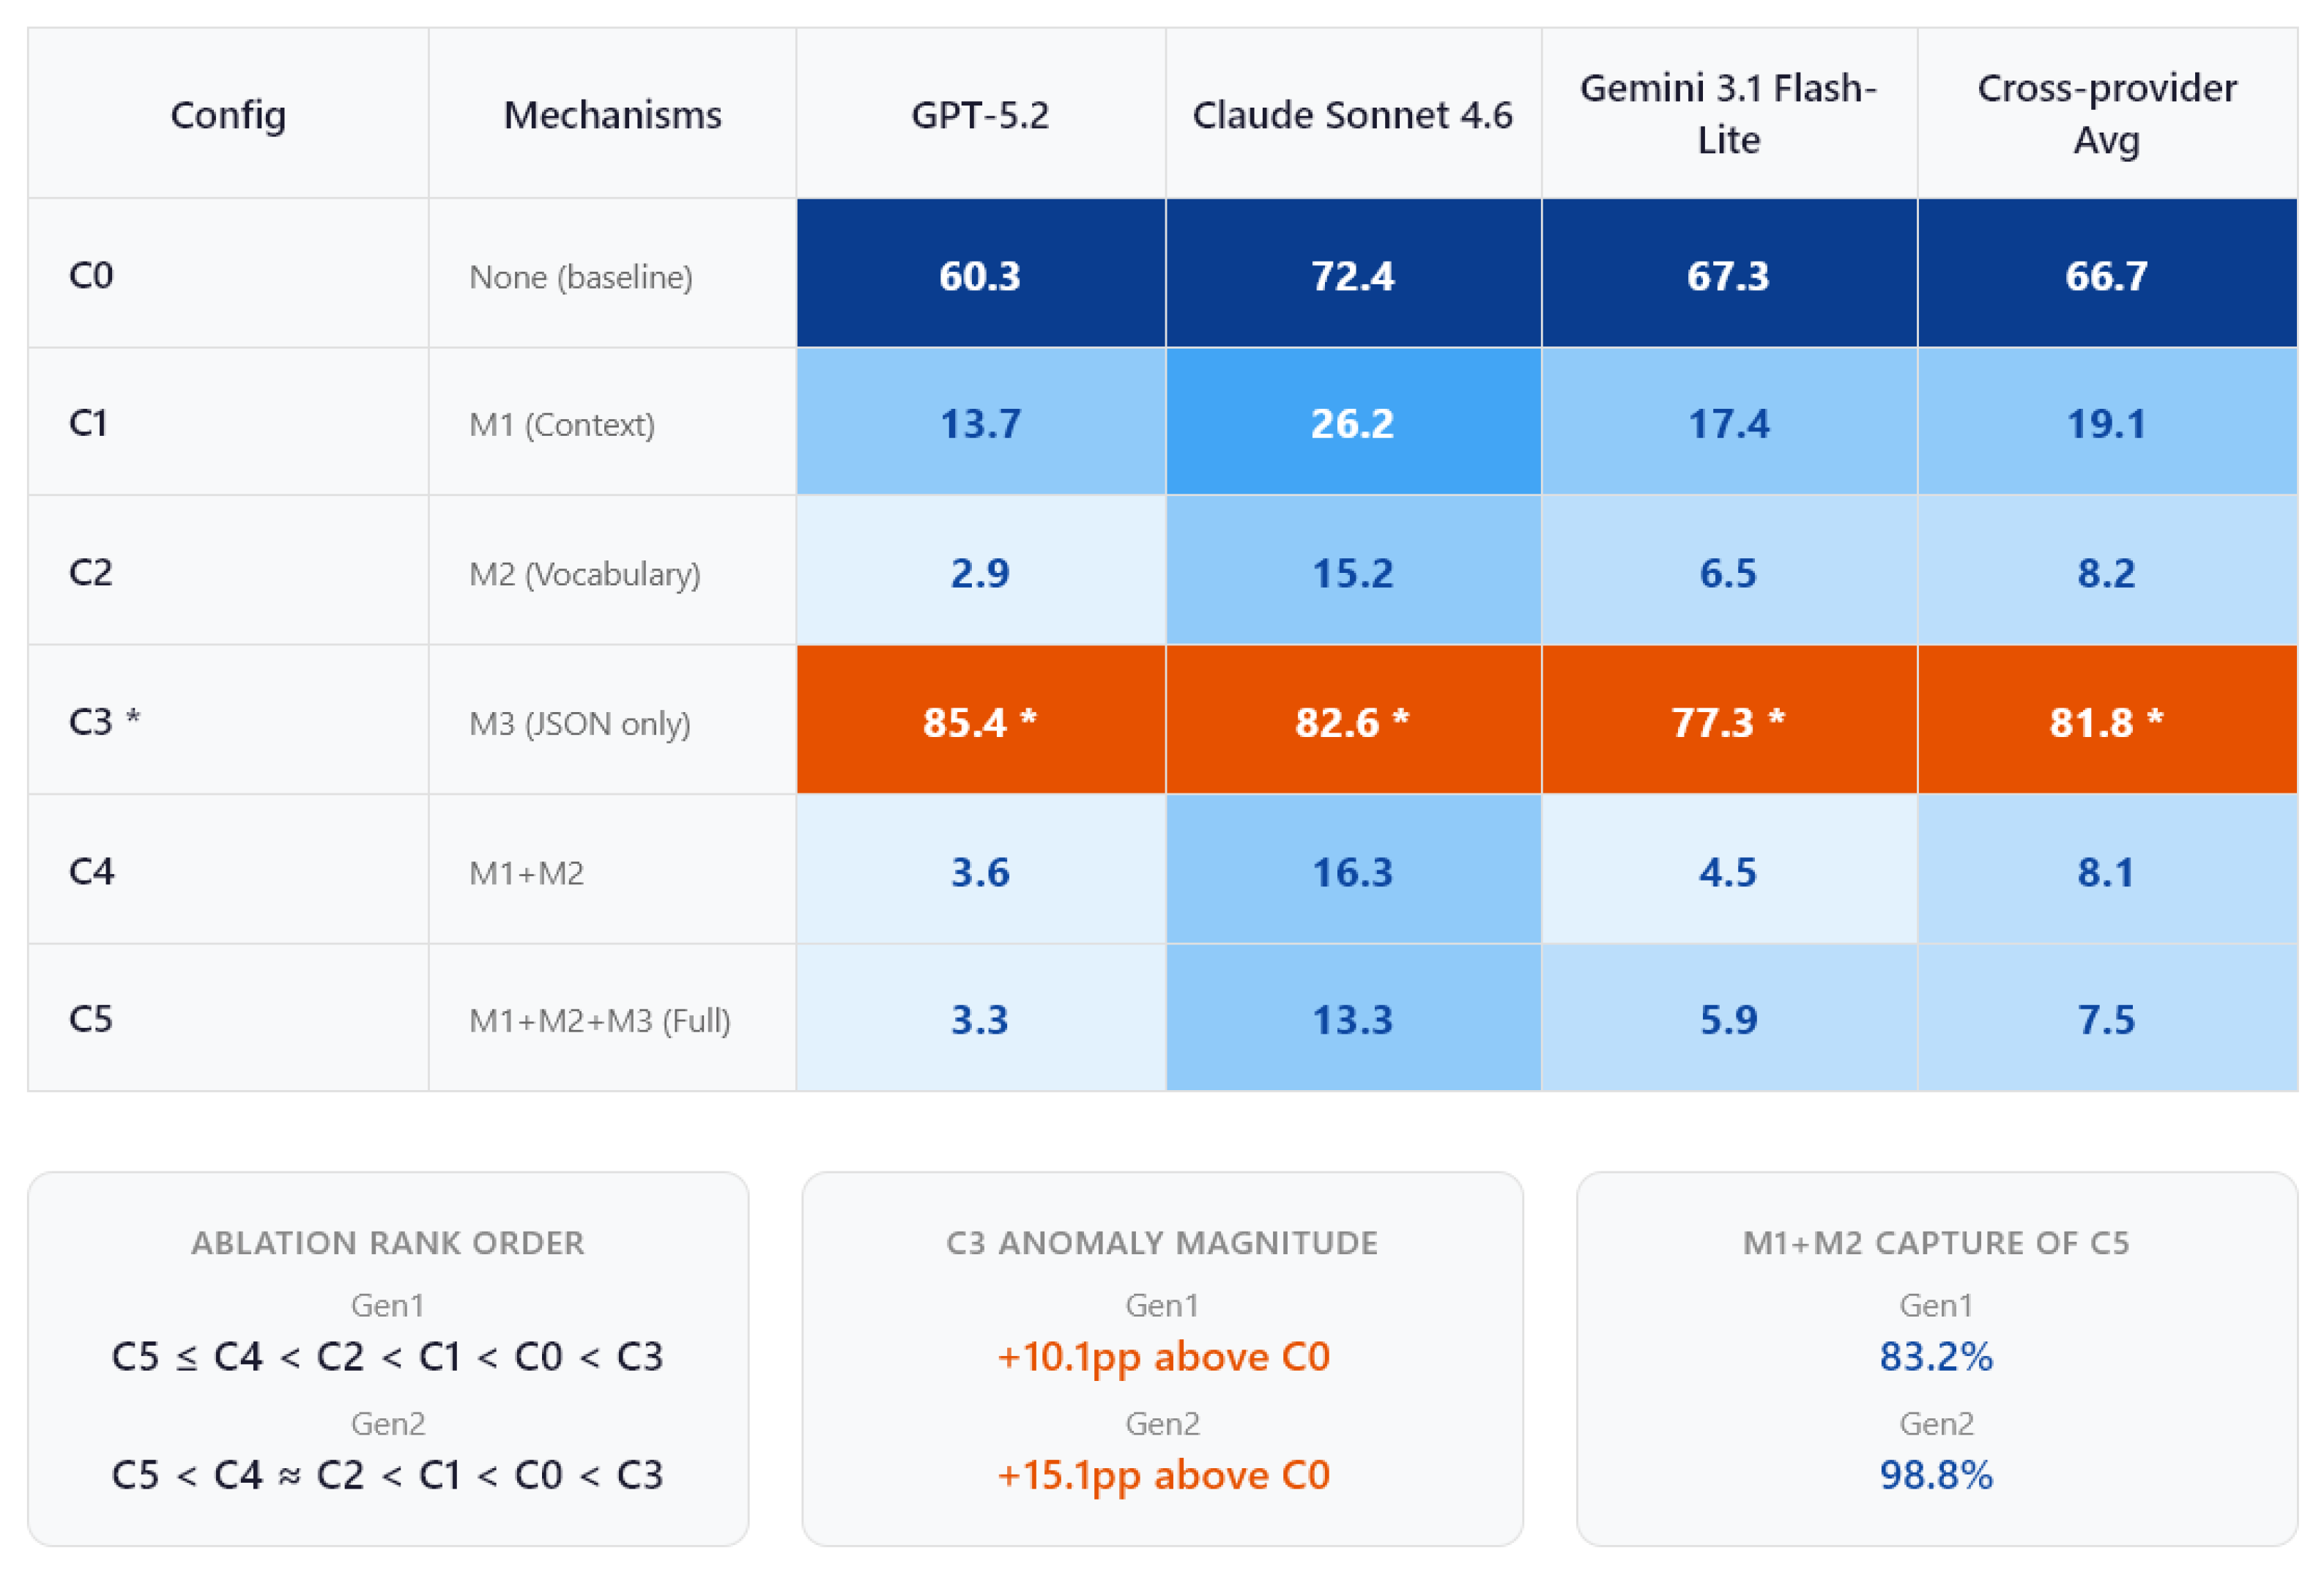
Figure 3.
Per-configuration hallucination reduction across both generations ( per cell). C2 (vocabulary only) shows the largest single-configuration reduction (Gen1: 81.3%; Gen2: 88.2%). The C3 anomaly* intensifies from Gen1 to Gen2 (GPT-5.2: +41.5%).
Figure 3.
Per-configuration hallucination reduction across both generations ( per cell). C2 (vocabulary only) shows the largest single-configuration reduction (Gen1: 81.3%; Gen2: 88.2%). The C3 anomaly* intensifies from Gen1 to Gen2 (GPT-5.2: +41.5%).
Figure 4.
Generation 1 ablation heatmap: HR (%) across C0–C5 for three standard models ( per cell). Darker = lower HR. C3* exceeds C0 for all providers. See Figure 5 for Generation 2.
Figure 4.
Generation 1 ablation heatmap: HR (%) across C0–C5 for three standard models ( per cell). Darker = lower HR. C3* exceeds C0 for all providers. See Figure 5 for Generation 2.
Figure 5.
Generation 2 ablation heatmap: HR (%) across C0–C5 ( per cell). Rank ordering preserved (C5 = C4 = C2 < C1 < C0 < C3). C3* exceeds C0 for all providers (+15.1pp avg vs. +10.1pp in Gen1).
Figure 5.
Generation 2 ablation heatmap: HR (%) across C0–C5 ( per cell). Rank ordering preserved (C5 = C4 = C2 < C1 < C0 < C3). C3* exceeds C0 for all providers (+15.1pp avg vs. +10.1pp in Gen1).
3.4. Standard Models vs. Reasoning Models
3.5. Response Characteristics
Table 5 summarizes the response characteristics of Generation 1 models under the full architecture (C5).
Claude Sonnet 4.5 produced 77% more tools per query than GPT-4.1 (15.6 vs. 8.8), though the verbosity–HR correlation is weak (see Section 4.1). Under C5, ranges from 0.47 (GPT-4.1) to 1.76 (Claude Sonnet 4.5), a 4–8× reduction from C0. Gemini 2.5 Flash shows degraded JSON validity (78.5% vs. 100% for Flash-Lite), and the thinking tokens (529–1,717) add overhead without reducing hallucination.
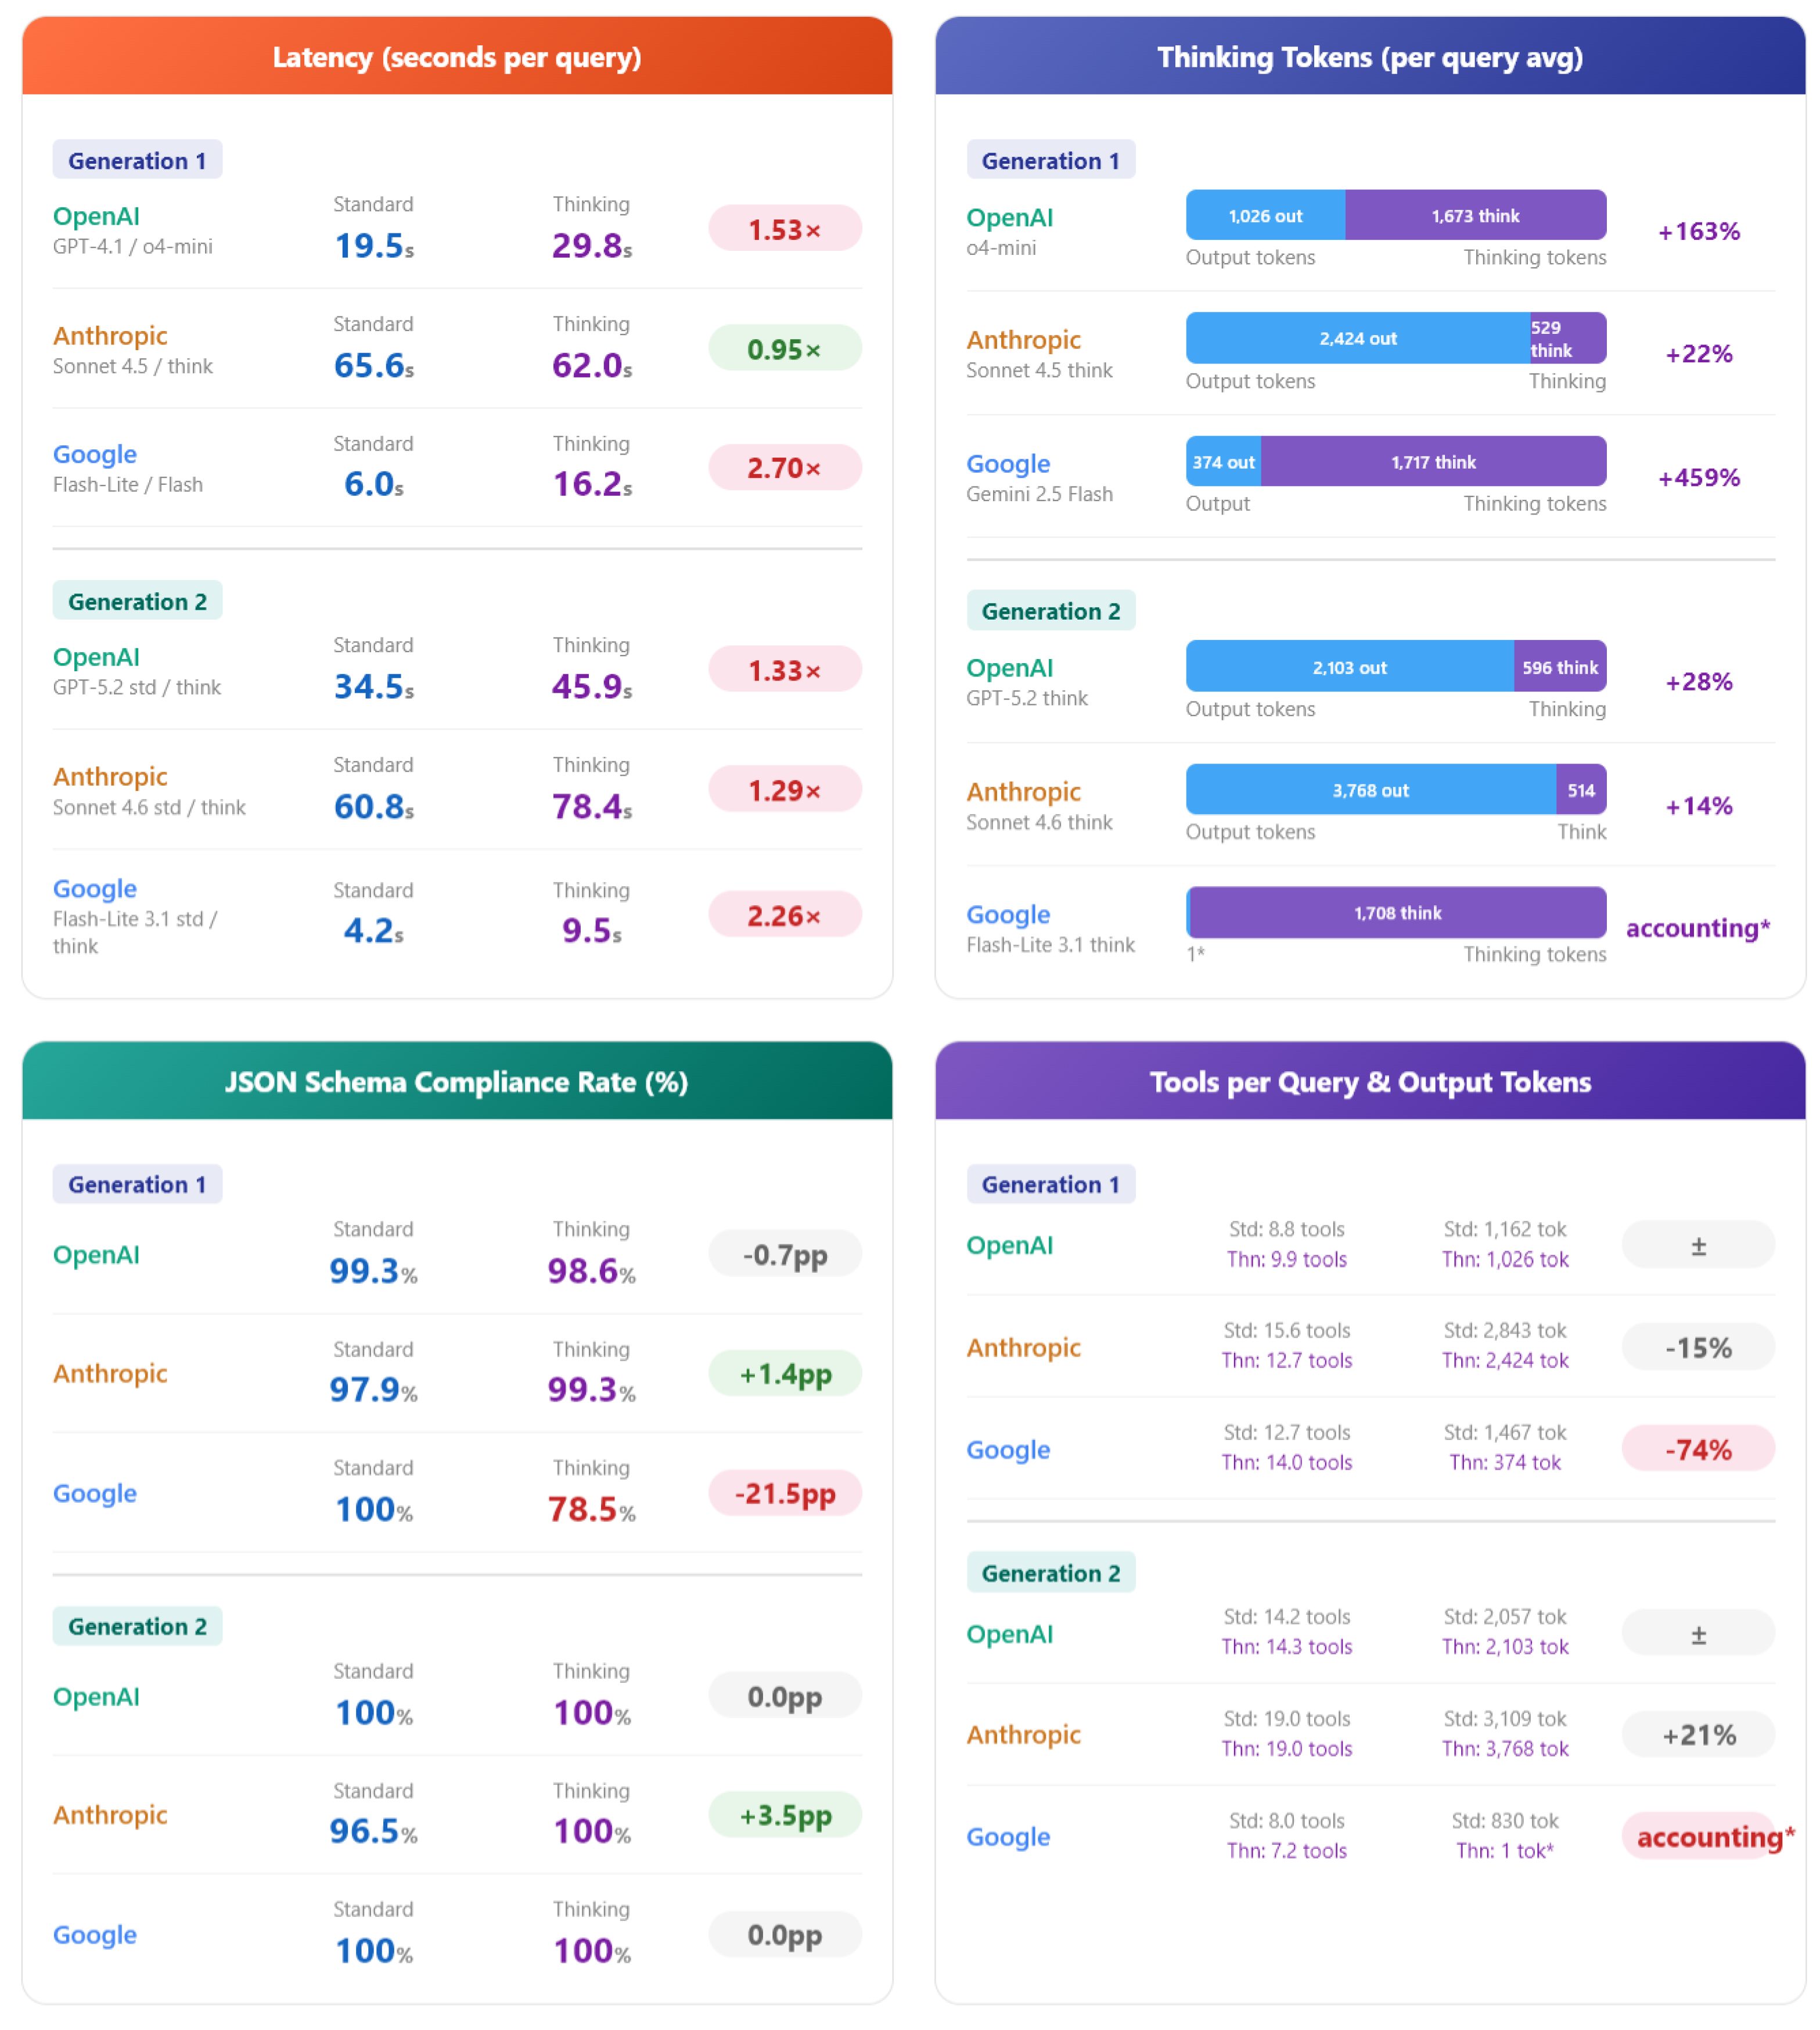
Figure 7.
Thinking model overhead across both generations ( per model): latency multipliers, thinking tokens, JSON compliance, and verbosity. Gen2 thinking models achieve 100% JSON validity, yet no provider shows significantly lower hallucination under reasoning mode.
Figure 7.
Thinking model overhead across both generations ( per model): latency multipliers, thinking tokens, JSON compliance, and verbosity. Gen2 thinking models achieve 100% JSON validity, yet no provider shows significantly lower hallucination under reasoning mode.
3.6. Generation 2 Results
Generation 2 evaluates GPT-5.2, Claude Sonnet 4.6, and Gemini 3.1 Flash-Lite using the same protocol, involving 3,456 additional API calls. All three providers now use a single model with a configurable thinking toggle.
Gen2 full architecture effectiveness (C5). Table 12 presents the Generation 2 hallucination rates under C5 with the corresponding C0-to-C5 reduction.
Gen2 C5 results confirm that the architecture generalizes across providers. GPT-5.2 achieves the lowest residual rate at 3.3%, followed by Gemini 3.1 Flash-Lite at 5.9% and Claude Sonnet 4.6 at 13.3%. Interestingly, Anthropic shows a regression, with Sonnet 4.5 at 11.3% versus Sonnet 4.6 at 13.3%, indicating that newer models do not necessarily improve vocabulary adherence. The near-zero D3/D4 pattern holds (0.0%–11.6%).
Gen2 ablation analysis.
Table 14 presents the Generation 2 ablation results across all configurations and providers.
The C3 anomaly persists and intensifies: the cross-provider average increase rises from +10.1pp (Gen1) to +15.1pp (Gen2). The Gen2 ordering remains {C5, C4, C2} < C1 < C0 < C3 (Friedman, all ). C2 alone (8.2%) closely approaches C5 (7.5%) and C4 (8.1%). The incremental contribution of M3 (C4 to C5) is provider-dependent: Anthropic benefits significantly (, ), OpenAI shows no meaningful change (), and Google shows no significant M3 effect (). Similarly, across configurations C2–C5, the same pattern is observed: the Anthropic model benefits from the full architecture, whereas for OpenAI and Google the vocabulary constraint alone is at least as good as C5 [31].
Cross-generational comparison.
Table 17 compares hallucination rates under C5 between the two model generations.
OpenAI improves significantly (pp, ), while Anthropic and Google show small regressions (pp and pp, both significant under paired Wilcoxon at ). Cross-provider averages remain stable (standard: 6.8% vs. 7.5%; thinking: 7.8% vs. 7.8%). At the query level (), 25%–96% of responses contain at least one out-of-inventory mention; the H2-only rate remains approximately 2–4%.
Gen2 standard vs. reasoning models.
Table 16 compares standard and reasoning-mode performance for Generation 2 models.
Under Gen2’s single-model-with-toggle design, only Anthropic shows a statistically significant standard-vs-reasoning difference (Sonnet 4.6 reasoning pp worse, ); OpenAI and Google show no meaningful difference (both ). The cross-provider aggregate effect remains negligible.
Gen2 response characteristics.
Table 6 summarizes the response characteristics of Generation 2 models under C5.
Gen2 patterns mirror Gen1: Claude Sonnet 4.6 is the most verbose (19.0 tools/query), GPT-5.2 increases verbosity (8.8 to 14.2) yet reduces hallucination, and Gen2 under C5 ranges from 0.34 (Flash-Lite 3.1 thinking) to 2.89 (Sonnet 4.6 thinking). Gen2 thinking overhead is comparable to Gen1 (1.29–2.26× vs. 0.95–2.70× in Gen1) and all Gen2 thinking models achieve 100% JSON validity, yet only Anthropic shows a significant thinking penalty (no provider shows a thinking advantage).
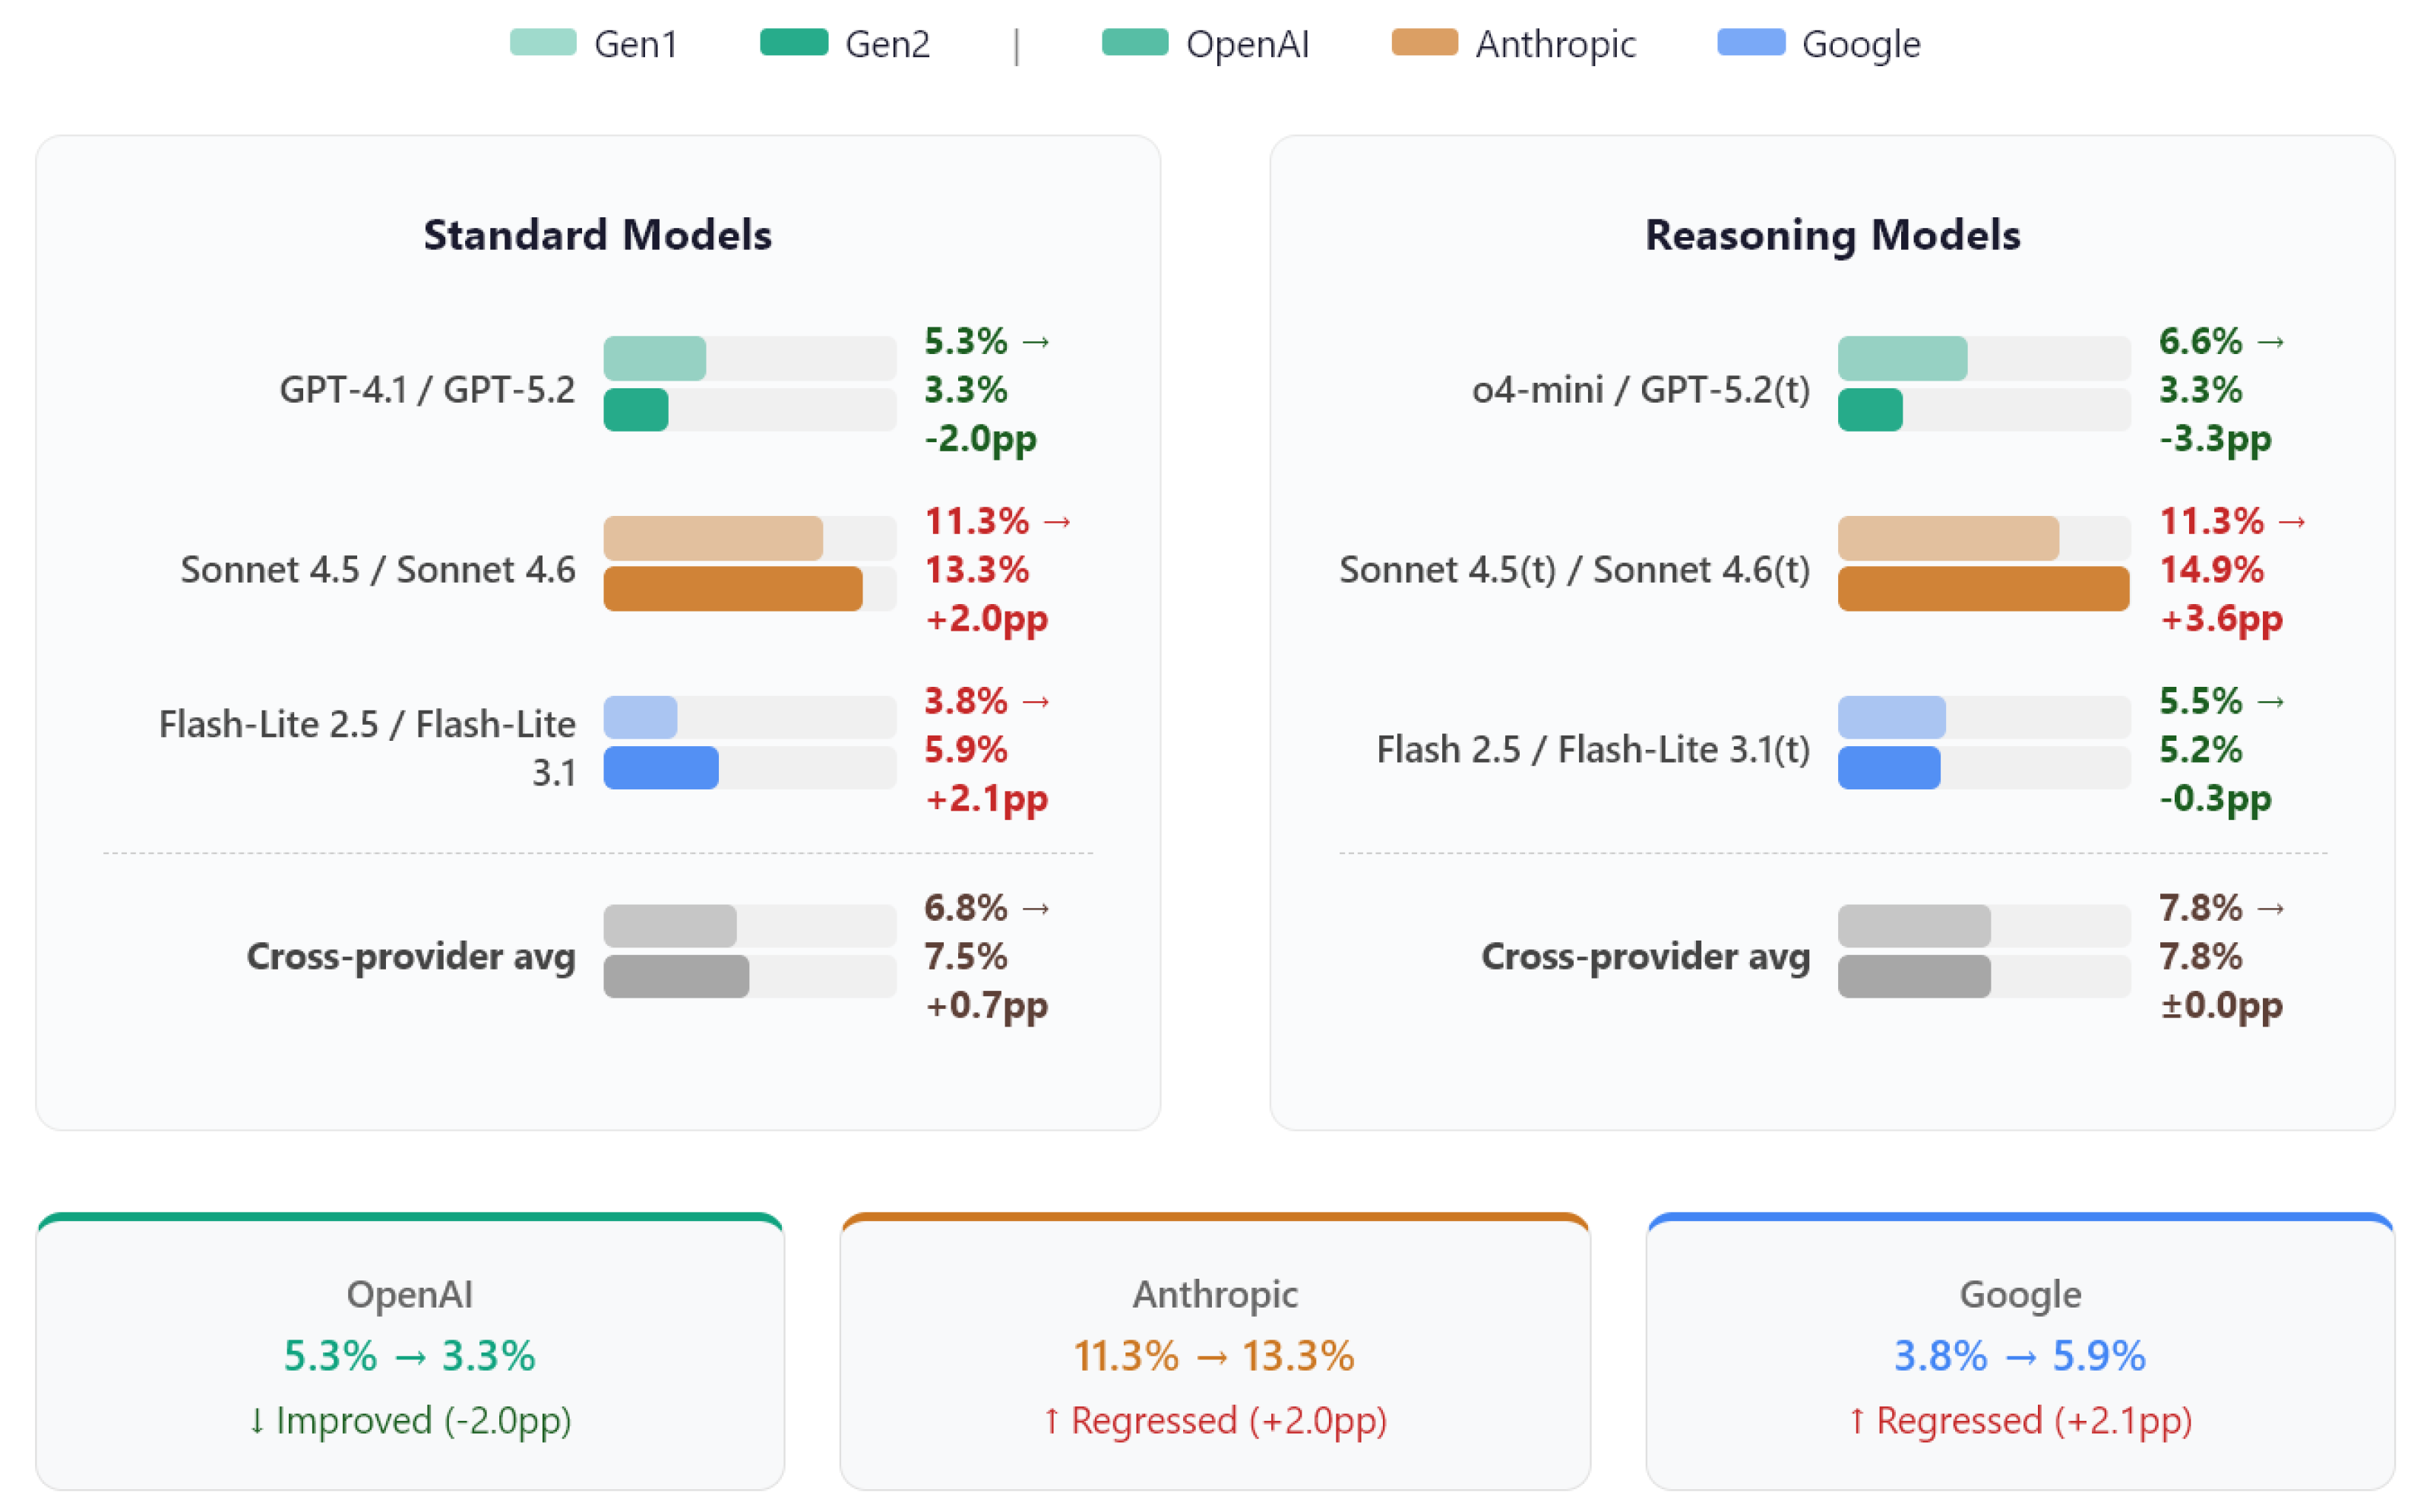
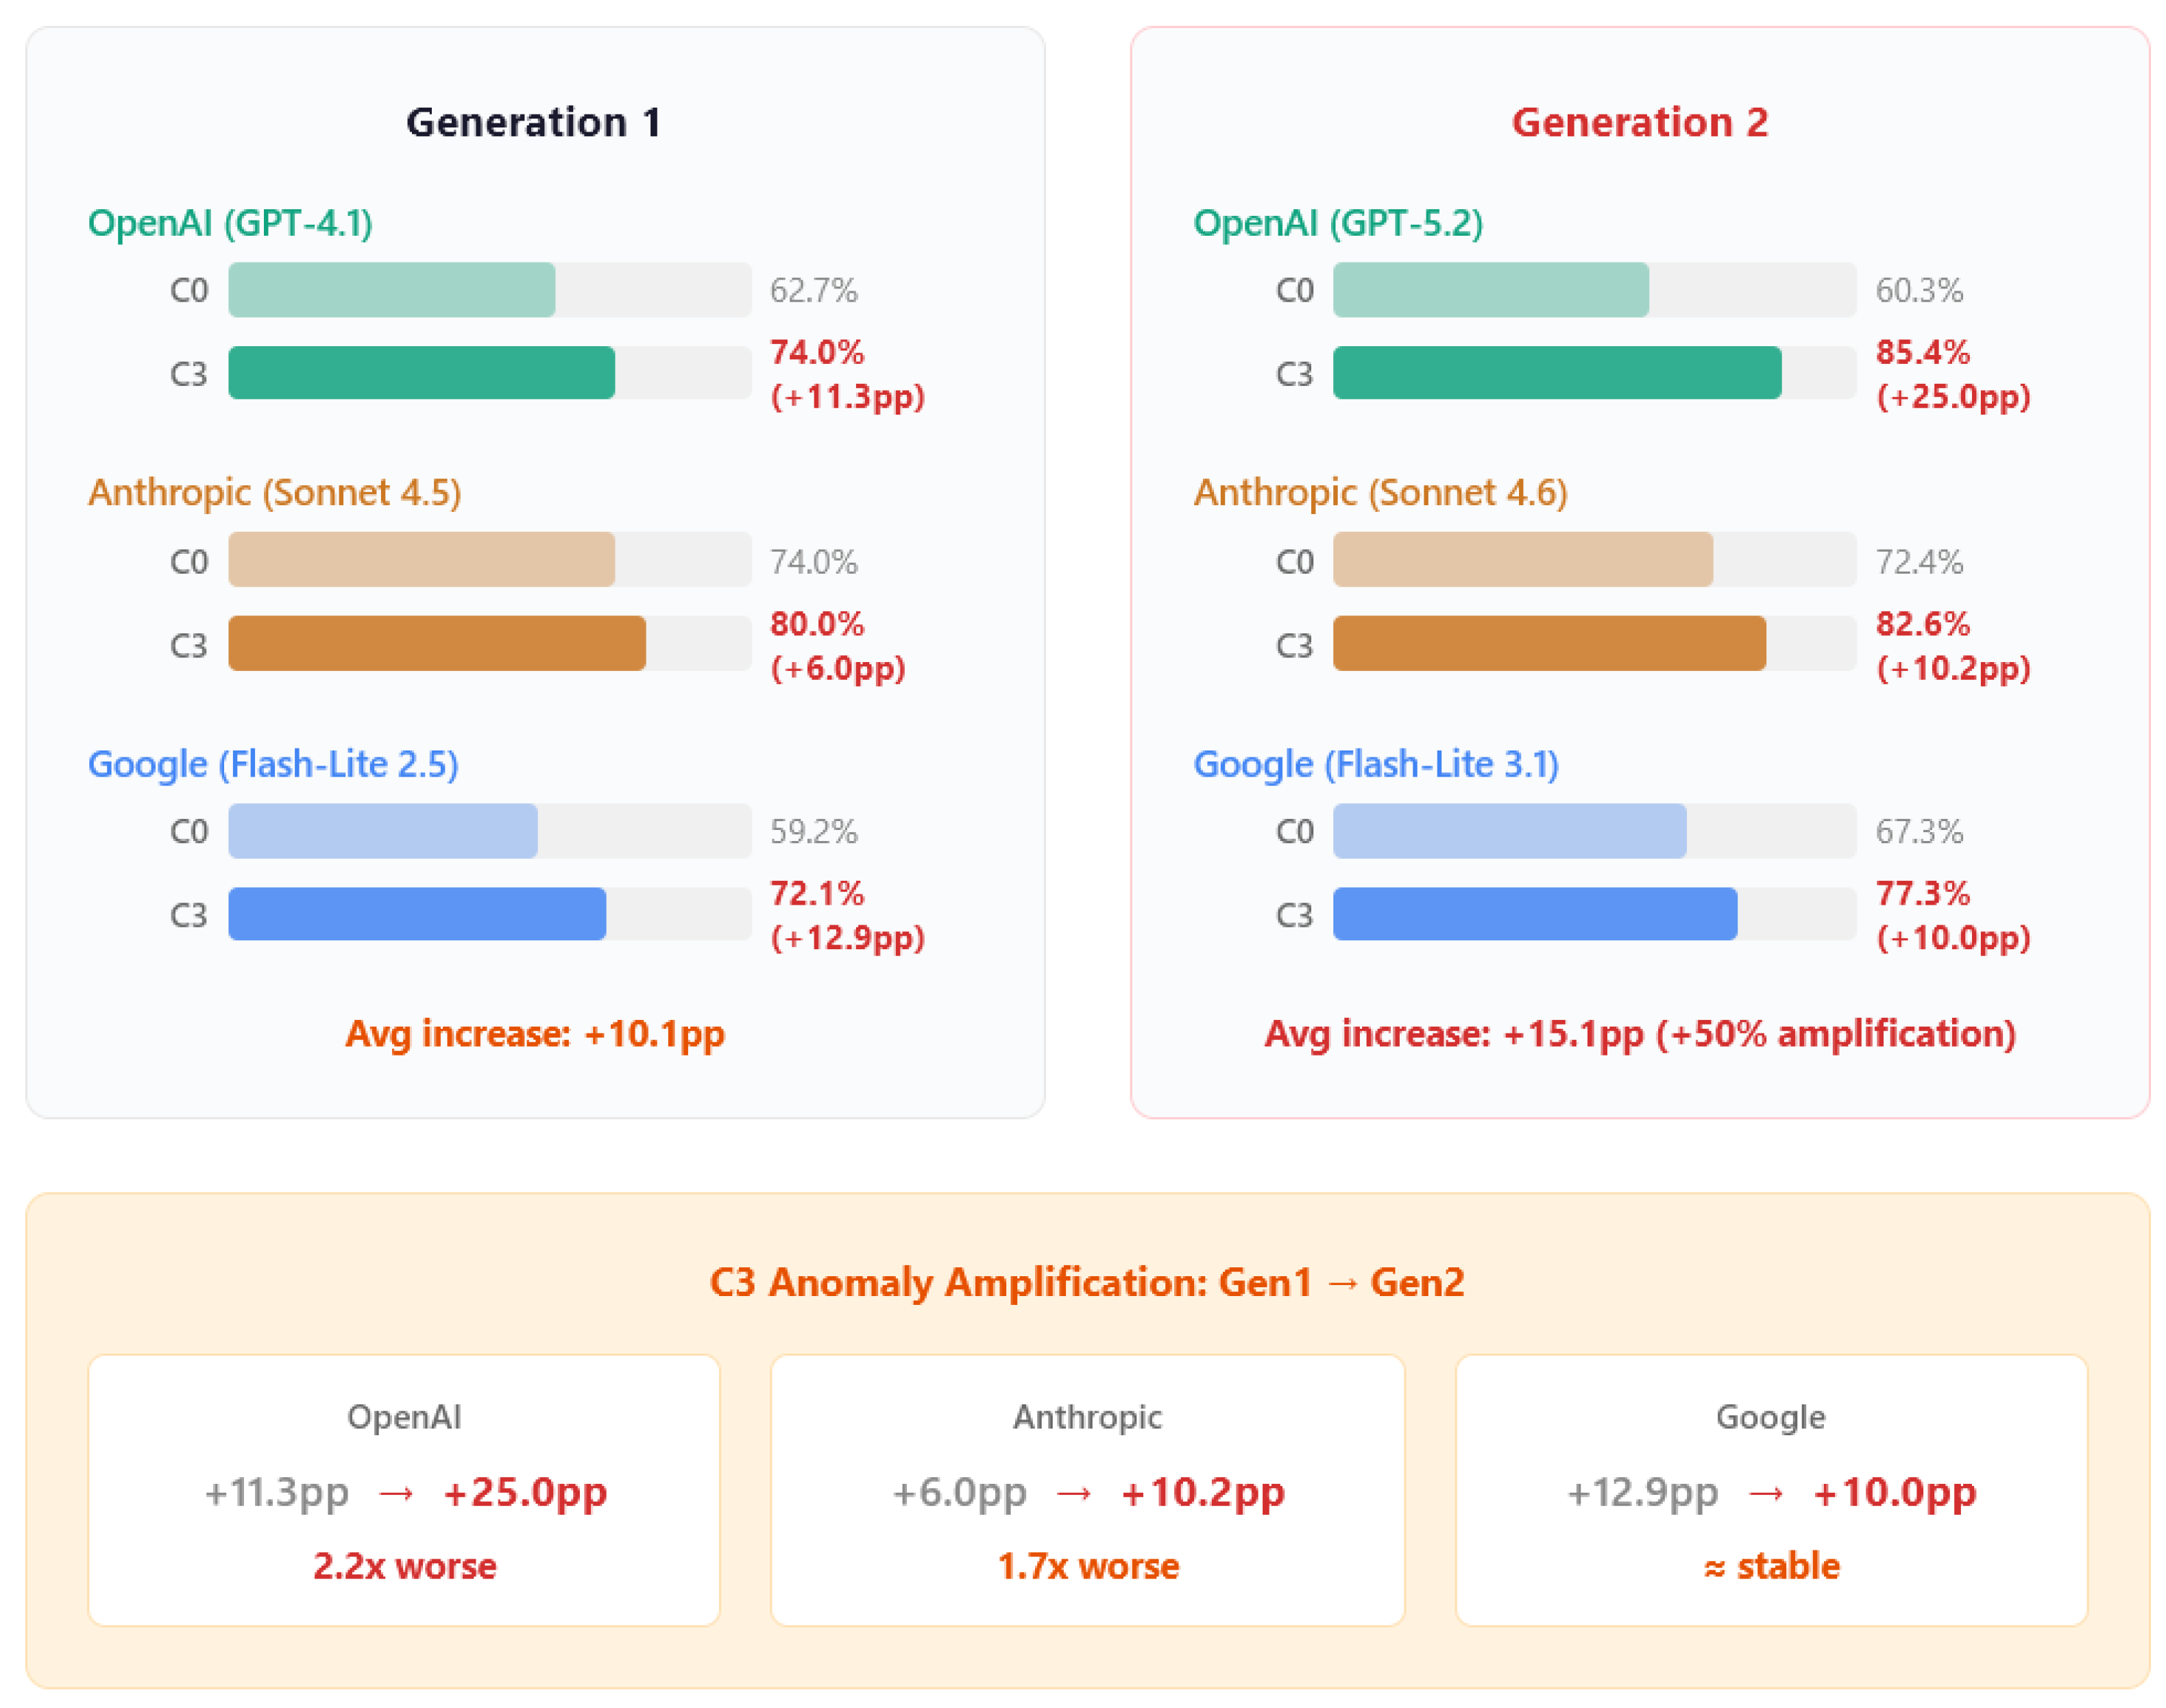
Figure 8.
Cross-generational C5 hallucination rates: Gen1 (faded) vs. Gen2 (solid). OpenAI improves ( to pp), Anthropic regresses ( to pp), Google shows within-band variation ( to pp). Cross-provider averages remain stable.
Figure 8.
Cross-generational C5 hallucination rates: Gen1 (faded) vs. Gen2 (solid). OpenAI improves ( to pp), Anthropic regresses ( to pp), Google shows within-band variation ( to pp). Cross-provider averages remain stable.
Figure 9.
C3 anomaly amplification across generations. JSON-only enforcement increases hallucination above baseline in all six models (+10.1pp Gen1, +15.1pp Gen2; GPT-5.2: +25.0pp).
Figure 9.
C3 anomaly amplification across generations. JSON-only enforcement increases hallucination above baseline in all six models (+10.1pp Gen1, +15.1pp Gen2; GPT-5.2: +25.0pp).
4. Discussion
4.1. Key Findings and Mechanism Analysis
The hallucination mitigation transfers across providers and generations: HR is reduced by 84.7%–94.6% across all twelve configurations, and the ablation ordering {C5, C4, C2} < C1 < C0 < C3 is preserved across all six standard models. The C3 anomaly is equally stable: C3 > C0 for every provider in both generations. At the same time, residual hallucination under the full architecture differs considerably by model, by up to a factor of 3.5 (e.g., 3.3% for GPT-5.2 vs. 11.3% for Claude Sonnet 4.5). This variation suggests that identical architectural constraints may still interact differently with each model’s vocabulary adherence behavior.
A practical takeaway is the cross-generational stability of the architecture’s effectiveness. The cross-provider C5 average is stable within ±1pp across generations (6.8% in Gen1 vs. 7.5% in Gen2 for standard models), which supports the idea that the three-mechanism design yields a small residual hallucination level that is fairly stable under the tested settings. We do not yet have enough evidence to say whether this residual is a hard limit, or whether it can be pushed down further by better models and/or additional techniques such as constrained decoding or retrieval reranking. In multi-provider enterprise settings, this suggests that the architecture generally does not need to be redesigned for a new model generation, although provider-specific residual rates can still shift (as shown by Anthropic’s regression from 11.3% to 13.3%). The 95% confidence intervals for all twelve C5 configurations are shown in Figure 10.
Verbosity, per-mention quality, and hallucination.
While Anthropic models are consistently more verbose and also show higher residual hallucination, the relationship between tools-per-query and hallucination rate across all 12 model configurations is weak and not statistically significant (Pearson , , ). The main reason is that provider identity confounds the relationship: Anthropic models cluster at high verbosity and high HR, while the other providers do not show a consistent trend.
Two cross-generational observations illustrate why verbosity alone is not a good explanation. GPT-5.2 increases tools/query substantially from Gen1 to Gen2 (8.8 → 14.2 tools/query) while reducing hallucination under C5 (5.3% → 3.3%). Conversely, Gemini 3.1 Flash-Lite produces fewer tools/query than Flash-Lite 2.5 (8.0 vs. 12.7), yet hallucinates at a slightly higher rate (5.9% vs. 3.8%, ).
A more informative view is the per-tool-mention hallucination rate (Figure 11). Under C5, the per-mention hallucination rates closely track the overall HR regardless of output length (e.g., 3.5% for GPT-5.2 versus 10.8% for Claude Sonnet 4.5). This indicates that the remaining hallucination is mainly driven by the model’s vocabulary adherence quality at the per-mention level, rather than by the total number of mentions generated. This pattern also clarifies the small Google regression result: Flash-Lite 2.5 shows slightly better per-mention quality than Flash-Lite 3.1.
Existence hallucination vs. recommendation quality.
Our primary metric (HR) evaluates whether the recommended tools exist in the Online-CADCOM database, rather than whether they are the most suitable tools for the user’s query. Existence hallucination and recommendation quality are separate concerns. Our contribution is therefore existence hallucination reduction: it is necessary for appropriateness, but not sufficient. Existence verification is objective and automatable, while appropriateness evaluation is inherently more subjective.
That said, we observe that under C5, models tend to organize recommendations around tools that actually belong to the queried domain rather than suggesting generic alternatives. This suggests that M1 context injection has a positive effect on domain relevance beyond mere inventory compliance. A systematic comparison against the platform’s MCDA-based rankings [23] is left to future work.
4.2. Practical Implications and Deployment
As a post-hoc analysis, we applied a stoplist of 62 ultra-generic tokens to remove extraction artifacts (this filtering is used only for this decomposition analysis and does not change the HR values reported in Results). We then manually classified the 197 most frequent out-of-inventory tool names (covering 76.5% of 20,430 tool-like mentions across 6,912 queries) into four categories using web verification. Evidence was based on a vendor product page, a GitHub/SourceForge repository, or a Wikipedia entry, and the evidence URLs are provided in the supplementary material. This classification was performed by the first author and inter-annotator reliability was not assessed, which is a limitation. We also ran a sensitivity analysis on the 14 ambiguous names that were resolved conservatively, which showed the decomposition remains stable within ±4.5pp (maximum shift). Of the 15,634 classified mentions:
- 59.3% (9,277) are H2 (external-real) tools (e.g., LTspice, Altium Designer, PSpice).
- 22.6% (3,542) are near-miss references to inventory tools.
- 18.0% (2,815) are non-specific mentions, often generic labels consistent with the C3 anomaly.
- 0.0% are H1 (fabricated) within the top-197 names.
Operationally, the H2-only C5 rate is 2.9% (vs. headline HR ∼7.4%), corresponding to a 91.3% reduction from C0. Per-provider C5 H2-only rates are 1.3% (OpenAI), 2.8% (Google), and 4.1% (Anthropic). Even under the worst-case reclassification scenario, where all ambiguous names are counted as H2, the upper bound reaches 5.3%, which still represents an 84% reduction from C0. At the query level, compared to , indicating that roughly two-thirds of contaminated C5 responses involve only near-miss or non-specific mentions.
Reasoning models and hallucination.
Across both generations, no statistically significant improvements are observed from reasoning models under C5 (Gen1: 6.8% standard vs. 7.8% thinking; Gen2: 7.5% vs. 7.8%; all per-provider ). This extends the pattern reported by [8] to the constrained setting, now replicated across two model generations.
In Gen1, the direction consistently favors standard models over thinking (Gen1 Google, ; Gen1 cross-provider aggregate, ). Gen2’s cleaner single-model-with-toggle design yields small per-provider differences (C5 range: to pp), with a negligible cross-provider aggregate effect.
From a practical standpoint, thinking models add 514–1,708 additional thinking tokens and 1.29×–2.26× latency overhead without producing any measurable reduction in hallucinations. Gen2 thinking overhead is comparable to Gen1 (1.29–2.26× vs. 0.95–2.70×), and Gen2 models resolved the JSON compliance degradation observed in Gen1, with all Gen2 thinking models achieving JSON validity of 100%.
Mechanism contribution analysis.
Interpretation caveat: this ablation isolates configuration-level effects rather than strictly causal mechanisms, since M1 context includes tool names. C4 (Context + Vocabulary) achieves 11.0% (Gen1) and 8.1% (Gen2), capturing 92.8%–98.8% of the full C5 reduction. In Gen2, C4 performs nearly identically to C5 (8.1% vs. 7.5%).
The C3 anomaly: structural constraints without semantic grounding.
In Generation 1, the C3 cross-provider average increases from 65.3% (C0) to 75.4% (C3), a +10.1pp increase:
- GPT-4.1: +11.3pp (62.7% → 74.0%)
- Claude Sonnet 4.5: +6.0pp (74.0% → 80.0%)
- Gemini 2.5 Flash-Lite: +12.9pp (59.2% → 72.1%)
The anomaly intensifies in Generation 2. The cross-provider average reaches 81.8% under C3 (+15.1pp relative to C0). The largest amplification is observed for GPT-5.2 (+11.3pp to +25.0pp), followed by a moderate increase for Anthropic (+6.0pp to +10.2pp), while Google remains largely stable (+12.9pp to +10.0pp). All six C3 > C0 comparisons are significant (Wilcoxon, all ), with the cross-provider effect size increasing from (medium) to (large).
We attribute this effect to structural slot-filling pressure. Because the JSON schema requires populated toolName and toolId fields, the model is forced to specify a tool even when no grounded vocabulary is available. This mechanism leads to several testable predictions: (1) allowing null slots should weaken the anomaly; (2) stronger instruction-following behavior may amplify it; and (3) increasing the number of mandatory fields creates more opportunities for hallucination. This interpretation is supported by the observation that 18.0% of hallucinated mentions are non-specific labels (e.g., “Practical Tips”), which are characteristic of slot-filling artifacts. These findings extend the observations of [14] and suggest that structured output constraints should not be deployed without semantic grounding, a precaution that becomes increasingly important as model capabilities improve.
Practical implications.
- Minimum effective configuration: M1 + M2 (C4) captures 92.8%–98.8% of C5’s reduction. In Gen2, C4 performs nearly identically to C5 (8.1% vs. 7.5%).
- Standard models suffice: Reasoning modes provide no consistent advantage under C5 while adding token and latency overhead.
- JSON enforcement requires caution: Ungrounded C3 is harmful (+15.1pp Gen2, +10.1pp Gen1). When grounded, M3’s effect is provider-dependent (beneficial for Anthropic, neutral for OpenAI and Google).
- Per-provider validation: Residual hallucination varies up to 3.5× across models; post-generation name verification can further reduce out-of-inventory outputs.
- Vocabulary scaling: For inventories exceeding 82 items, M2 would require top-K retrieval.
Suggested deployment heuristic (M3: JSON enforcement).
- If C4 ≈ C5 (no significant difference), M3 can be omitted unless JSON output is required for parsing.
- If C4 > C5 significantly: M3 is not recommended.
- If C5 > C4 significantly: the full C5 architecture is recommended.
In all cases, M1 + M2 represents the minimum effective configuration. Total cost: $180.98 across 6,912 calls ($0.0008–$0.1078 per query); details in supplementary materials.
Qualitative example.
For example, under C0 GPT-5.2 recommends Altium Designer, OrCAD, and Cadence Allegro, which are real tools but absent from the inventory (100% out-of-inventory). Under C5, the same query instead yields KiCad, PCB Calculator, and Impedance Calculator, all verified and resulting in 0% HR. Additional examples are provided in the supplementary materials.
Contributions. This work makes four main contributions. First, we report the discovery of the C3 anomaly and its generational amplification: JSON enforcement alone increases hallucination above baseline across all tested providers and both model generations (+10.1pp Gen1, +15.1pp Gen2), consistent with a structural slot-filling pressure hypothesis in which mandatory entity fields in JSON schemas force models to populate tool name slots with plausible but out-of-inventory entries when no grounding vocabulary is provided. This finding extends observations by [14] on structured output–hallucination interactions and represents a key finding of this study. Second, we provide empirical evidence that anti-hallucination mechanisms transfer across providers: evaluation across twelve LLM configurations from three major commercial providers (OpenAI, Anthropic, Google) spanning two model generations (6,912 controlled API calls) demonstrates that the architecture’s effectiveness is consistent across provider ecosystems despite their different training methodologies. Third, a cross-generational stability analysis shows that the architecture’s effectiveness persists as models evolve (cross-provider C5 average: 6.8% Gen1, 7.5% Gen2), suggesting deployment investments are not invalidated by model upgrades. Fourth, we present evidence that reasoning-mode models provide no significant benefit over standard counterparts under architectural constraints, replicated across all providers and both generations ( factorial design).
4.3. Threats to Validity
Internal validity. All test prompts are generated programmatically and are identical across all models, which reduces prompt-design bias but does not fully reflect real user query distributions. The C0 baseline represents a condition with no mitigation effort, rather than the best achievable performance without the three mechanisms. The C0-to-C5 reduction should therefore be interpreted as an upper bound. Three repetitions per cell (144 queries) provide sufficient power for large effects but may miss smaller differences.
Temperature confound. Provider temperatures differ. OpenAI and Anthropic use the default setting (1.0), while Google uses 0.7. This difference of 0.3 was a deliberate design choice intended to reflect typical production deployment conditions, namely the parameter values a practitioner would normally use when calling each provider’s API without additional tuning. Lower temperature generally reduces output randomness, which may contribute to Google’s lower Gen1 hallucination rates. Importantly, this difference does not affect the main conclusions of the study. Within-provider comparisons (standard vs. thinking, C0 vs. C5, and the ablation ordering) are unaffected because temperature remains constant within each provider. The C3 anomaly (C3 > C0) is observed for all providers, including Google, which indicates that the anomaly is not a temperature artifact. Cross-generational comparisons also use the same temperature within each provider across generations, which preserves the validity of the stability finding. The temperature difference may partially explain some cross-provider rate differences, such as Google’s lower Gen1 rates, but it does not invalidate any reported conclusion. Therefore, cross-provider rankings such as “GPT-5.2 achieves the lowest residual hallucination” should be interpreted with awareness of this confound, while the primary within-provider and cross-generational conclusions remain unaffected.
Partial factorial limitation. The reasoning model evaluation uses a partial factorial design (C0 and C5 only) rather than evaluating all six ablation configurations. This limits our ability to characterize reasoning effects on intermediate configurations (C1–C4). However, the negligible C5 differences observed between standard and thinking modes (0.0–1.7pp across all providers) suggest that intermediate configurations would show similarly negligible reasoning effects, as the grounding mechanisms appear to dominate over reasoning depth at all constraint levels.
Construct validity. Hallucination detection uses a three-strategy extraction pipeline with multi-level grounding classification (see Section 2.8). Automated validation on 50 stratified samples estimates detection precision at 100% (zero false positives across 485 extracted mentions) and recall at approximately 94.5% overall (>99% for JSON-enforced responses, lower for free-form C0 due to 27 undetected mentions). Because false negatives are concentrated in unstructured C0 responses (where regex-based Strategy 3 is the primary detector), the measured C0 baseline hallucination rate is a conservative lower bound; any detection bias therefore works against our reported C0-to-C5 reduction, making the improvement a conservative estimate. The per-mention HR metric does not capture query-level user experience; we additionally report (query-level hallucination probability) to address this gap. Here the metric measures hallucination for existence only and ignores the relevancy of the suggested grounded tools for the input search query, which is further discussed in Section 4.2. The residual hallucination rate reported for C5 may also reflect limitations of our detection rather than the true behavior of the model. The M3 JSON schema includes a field called toolId and a field called toolName. For this analysis we have only tested if the tool name is present in the tool inventory, but not whether the model outputs the correct or consistent toolId. Verifying whether the model returns a correct toolId would require a separate matching step against the database primary keys, and is left to future work.
Detection sensitivity. To assess whether detector parameter choices affect the robustness of hallucination measurement, we conducted two sensitivity analyses across all 6,912 responses. First, we identified three potentially ambiguous tool names in the D1–D4 evaluation domains (“EAGLE,” “jcalc,” “Maddox”) and nine additional ambiguous names in non-evaluation categories. Across all responses, every occurrence of these names was classified as grounded (zero hallucinated occurrences), and excluding them from analysis changes C5 hallucination rates by <1 percentage point per provider. Second, we swept the fuzzy containment ratio threshold (0.45–0.70, production value 0.55) and Levenshtein edit distance threshold (0–3, production value 2) across all 24 combinations. Both key conclusions—that the full architecture reduces hallucination (C5 < C0) and that ungrounded JSON enforcement is counterproductive (C3 > C0)—hold for all 24 threshold combinations in both model generations. The maximum reclassification rate across threshold combinations is 2.0% of the 5,580 unique tool names. These results indicate that the reported findings are robust to reasonable variations in detection parameters.
Inventory-relative measurement. Our HR metric captures all tool mentions absent from the 82-tool verified inventory, including commercially available tools not represented in our database (H2). A frequency-weighted audit of the 197 most frequent out-of-inventory names (76.5% of all mentions) found that 59.3% are H2 (external-real tools such as LTspice, Altium Designer, and PSpice), 22.6% are near-miss references to inventory tools, 18.0% are non-specific mentions, and 0% are H1 (fabricated). This means HR slightly overstates the “confabulation” rate while accurately measuring inventory non-compliance, which is the operationally relevant metric for a curated recommendation platform. A full ground-truth classification of all 2,870 unique consolidated names would require exhaustive cross-referencing against comprehensive commercial software databases, infeasible at scale but addressed for the high-frequency names that dominate the distribution. Importantly, the architecture reduces both H2 and near-miss mentions (83.1% and 49.5% C0-to-C5 reduction, respectively), indicating that the grounding mechanisms constrain recommendations to the verified inventory regardless of whether alternatives are real or fabricated.
External validity. Results are derived from one engineering tool recommendation research platform (Online-CADCOM) with 82 tools across 4 domains. Generalization to other recommendation domains (e.g., medical, legal, or consumer products) and other database sizes requires further validation. Three providers are tested (representing major commercial LLM API providers), but open-source models (Meta Llama, Mistral) are excluded. In Generation 1, the three providers implement reasoning capabilities differently (separate model, toggle, variant), making cross-provider reasoning comparisons approximate; Generation 2 partially resolves this as all three converge on a single-model paradigm with configurable thinking toggles. The cross-generational design provides evidence of architectural stability across two model generations, but two timepoints are not sufficient for claims of “temporal stability” or trend extrapolation; providers may silently update model weights between our measurement points, and longer cross-generational tracking with repeated sampling is needed to establish true temporal patterns. Additionally, M2’s closed-vocabulary constraint currently enumerates all 82 tool names directly in the prompt (around 200 tokens). Scaling to substantially larger inventories presents a clear practical challenge: listing 1,000 tool names would require roughly 2,500 prompt tokens, while 10,000 names would exceed the context limits of most models. A practical solution is a retrieval step (e.g., embedding-similarity or category-based filtering) to select a top-K candidate subset per query before constructing the M2 vocabulary list. However, this introduces a retrieval recall ceiling (if the optimal tool is not in the top-K set, it cannot be recommended), converting M2 from a complete constraint to an approximate one. The 82-tool setting isolates M2’s mechanism effectiveness independent of retrieval quality; whether the measured hallucination reduction degrades gracefully as inventory size grows (and M2 becomes retrieval-dependent) is an open empirical question. While the mechanisms are architectural and prompt-level, structured-output support differs across providers (e.g., OpenAI’s response_format, Anthropic’s tool-use blocks, Google’s responseMimeType) and requires minor per-provider parameterization; “provider-portable” refers to the architectural design, not a zero-adaptation deployment.
5. Conclusion
In this paper, we present a cross-provider, cross-generational empirical study of hallucination mitigation in LLM-based tool recommendation. We evaluate the transferability of these three mechanisms across twelve model configurations from three major commercial providers, spanning two model generations and totaling 6,912 API calls. Across providers and generations, mention-level hallucination rates are reduced from 59–74% baselines to 3.3–14.9% under the full architecture (cross-provider average: 6.8% in Gen1 and 7.5% in Gen2). At the same time, the query-level metric () remains between 35% and 63%, meaning that more than one-third of responses still contain at least one out-of-inventory mention even under the strongest constraints.
The central empirical result is the C3 anomaly: JSON enforcement without semantic grounding increases hallucination above the unconstrained baseline for all providers and both generations (+10.1pp Gen1, +15.1pp Gen2, up to +25.0pp for GPT-5.2), consistent with structural slot-filling pressure. These findings indicate that structured output enforcement should not be deployed without semantic grounding, and that this requirement becomes more critical as model capabilities improve.
Two additional results emerge from the cross-provider design. First, reasoning-mode (thinking) variants do not provide statistically significant improvements over their standard counterparts under architectural constraints. This holds across both generations and all three providers, including under Generation 2’s single-model-with-toggle design. Second, the minimum effective architecture (context plus vocabulary, C4) captures 92.8% (Gen1) to 98.8% (Gen2) of the full system’s hallucination reduction on the cross-provider average. The empirical residual sits at approximately 7% cross-provider, with provider-specific rates varying by up to 3.5× (as low as 3.3% for GPT-5.2). At the query level, however, remains 35–63% under C5, meaning that the user-facing impact is substantially larger than the mention-level HR alone would suggest. Whether this residual can be further reduced through additional mechanisms remains an open question.
These results are derived from one engineering tool recommendation platform (Online-CADCOM) containing 82 tools across four domains, where the full vocabulary fits within prompt context. Generalization to other domains, substantially larger inventories (where retrieval-based vocabulary selection would replace full enumeration), open-source models, or fine-tuned domain-specific systems requires further validation. Future work should investigate the C3 anomaly amplification mechanism more directly, test the slot-filling pressure hypothesis using alternative JSON schemas, and extend cross-generational tracking to subsequent model releases as they become available.
From a practical engineering perspective, these findings have direct implications for EDA tool selection workflows. The demonstrated architecture enables reliable LLM-powered tool recommendation within curated engineering databases, reducing the risk that designers receive suggestions for tools outside their organization’s verified inventory. For telecommunication system designers who rely on simulation and modeling software to analyze communication channels, signal integrity, and network performance, the architecture ensures that AI-assisted tool selection remains grounded in validated alternatives. Similarly, PCB designers working with layout, impedance calculation, and design rule checking tools benefit from recommendations constrained to verified software products rather than hallucinated or unavailable alternatives. For EDA engineers in telecommunications more broadly, the provider-portable and generation-stable nature of the architecture means that organizations can deploy LLM-based recommendation systems with confidence that the mitigation remains effective across model upgrades and provider changes, without requiring repeated architectural redesign.
Author Contributions
Conceptualization, L.M. and G.M.; methodology, L.M. and G.M.; software, L.M.; validation, L.M.; formal analysis, L.M.; investigation, L.M.; resources, L.M. and G.M.; data curation, L.M.; writing of the original draft, L.M.; review and editing, L.M. and G.M.; visualization, L.M.; supervision, G.M.; project administration, G.M.; funding acquisition, G.M. All authors have read and agreed to the published version of the manuscript.
Funding
This research work was funded by the European Regional Development Fund within the Operational Program “Bulgarian national recovery and resilience plan,” under the Project BG-RRP-2.004-0005 “Improving the research capacity and quality to achieve international recognition and resilience of TU-Sofia.” The APC was funded by the same project.
Institutional Review Board Statement
Not applicable.
Informed Consent Statement
Not applicable.
Data Availability Statement
All experimental data, source code, and analysis scripts supporting the findings of this study are publicly available at https://github.com/nauka-lm/llm-tool-recommendation-replication. The repository includes the 82-tool verification inventory, the H1/H2 classification dataset with evidence URLs, prompt templates for all six configurations (C0–C5), the evaluation framework source code (prompt builder, hallucination detector, metrics calculator), analysis scripts for all reported statistics and figures, and reproduction instructions.
Acknowledgments
The authors used Claude (Anthropic) to assist with LaTeX formatting and language editing. All the scientific content, interpretations, and conclusions are the original work of the authors.
Conflicts of Interest
The authors declare no conflicts of interest.
References
- Menlo Ventures. 2025: The State of Generative AI in the Enterprise. 2025. Available online: https://menlovc.com/perspective/2025-the-state-of-generative-ai-in-the-enterprise/ (accessed on 27 February 2026).
- Ji, Z.; Lee, N.; Frieske, R.; Yu, T.; Su, D.; Xu, Y.; Ishii, E.; Bang, Y.; Madotto, A.; Fung, P. Survey of hallucination in natural language generation. ACM Comput. Surv. 2023, 55, 248. [Google Scholar] [CrossRef]
- Huang, L.; Yu, W.; Ma, W.; Zhong, W.; Feng, Z.; Wang, H.; Chen, Q.; Peng, W.; Feng, X.; Qin, B.; et al. A survey on hallucination in large language models: Principles, taxonomy, challenges, and open questions. ACM Trans. Inf. Syst. 2025, 57, 1–61. [Google Scholar] [CrossRef]
- Menxhiqi, L.; Marinova, G. Dynamic expert module for tool selection in the Online CADCOM platform. In Proceedings of the IEEE International Conference on Communications (BalkanCom), 2025. Poster presentation.
- Lewis, P.; Perez, E.; Piktus, A.; Petroni, F.; Karpukhin, V.; Goyal, N.; Küttler, H.; Lewis, M.; Yih, W.t.; Rocktäschel, T.; et al. Retrieval-augmented generation for knowledge-intensive NLP tasks. In Proceedings of the Advances in Neural Information Processing Systems (NeurIPS), 2020, Vol. 33. pp. 9459–9474.
- Wei, J.; Wang, X.; Schuurmans, D.; Bosma, M.; Ichter, B.; Xia, F.; Chi, E.; Le, Q.V.; Zhou, D. Chain-of-thought prompting elicits reasoning in large language models. In Proceedings of the Advances in Neural Information Processing Systems (NeurIPS), 2022, Vol. 35.
- Geng, S.; Josifoski, M.; Peyrard, M.; West, R. Grammar-constrained decoding for structured NLP tasks without finetuning. In Proceedings of the Conference on Empirical Methods in Natural Language Processing (EMNLP), 2023, pp. 10932–10952.
- Yao, Z.; Liu, Y.; Chen, Y.; Chen, J.; Fang, J.; Hou, L.; Li, J.; Chua, T.S. Are reasoning models more prone to hallucination? arXiv preprint arXiv:2505.23646 2025. Preprint.
- Menxhiqi, L.; Marinova, G. Database-Grounded LLM Recommendations for Engineering Tool Selection: An Anti-Hallucination Architecture. In Proceedings of the 1st International Conference on Industrial & Systems Engineering (ICISE), Tirana, Albania, 2026. Accepted.
- Zhang, Y.; Li, Y.; Cui, L.; et al. Siren’s song in the AI ocean: A survey on hallucination in large language models. arXiv preprint arXiv:2309.01219 2023. Preprint.
- Shuster, K.; Poff, S.; Chen, M.; Kiela, D.; Weston, J. Retrieval augmentation reduces hallucination in conversation. In Proceedings of the Findings of the Association for Computational Linguistics (EMNLP), 2021, pp. 3784–3803.
- Gao, Y.; Xiong, Y.; Gao, X.; et al. Retrieval-augmented generation for large language models: A survey. arXiv preprint arXiv:2312.10997 2024. Preprint.
- Peng, B.; Galley, M.; He, P.; et al. Check your facts and try again: Improving large language models with external knowledge and automated feedback. arXiv preprint arXiv:2302.12813 2023. Preprint.
- Béchard, P.; Marquez Ayala, O. Reducing hallucination in structured outputs via retrieval-augmented generation. In Proceedings of the Conference of the North American Chapter of the Association for Computational Linguistics (NAACL), Industry Track, 2024.
- OpenAI. GPT-4 technical report. arXiv preprint arXiv:2303.08774 2023. Preprint.
- Ouyang, L.; Wu, J.; Jiang, X.; et al. Training language models to follow instructions with human feedback. In Proceedings of the Advances in Neural Information Processing Systems (NeurIPS), 2022, Vol. 35, pp. 27730–27744.
- Wu, H.; He, Z.; Zhang, X.; et al. ChatEDA: A large language model powered autonomous agent for EDA. IEEE Trans. Comput.-Aided Des. Integr. Circuits Syst. 2024, 43, 3530–3542. [Google Scholar] [CrossRef]
- Liu, M.; Ene, T.D.; Kirby, R.; Cheng, C.; Pinckney, N.; Liang, R.; Alben, J.; Anand, H.; Banerjee, S.; Bayraktaroglu, I.; et al. ChipNeMo: Domain-adapted LLMs for chip design. arXiv preprint arXiv:2311.00176 2023. Preprint.
- Marinova, G.; Guliashki, V.; Chikov, O. Concept of online assisted platform for technologies and management in communications – OPTIMEK. In Proceedings of the Conference on Communications, Control and Signal Processing (CSIS), 2014, pp. 1–4.
- Marinova, G.; Chikov, O.; Rodič, B. E-content and tool selection in the cloud-based Online CADCOM platform for computer-aided design in communications. In Proceedings of the International Conference on Telecommunications (ConTEL), 2019, pp. 1–6.
- Chikov, O.; Marinova, G. Expert tool for filter design program selection in Online CADCOM platform. In Proceedings of the International Conference on Electronics and Telecommunications (ICEST), 2020, pp. 1–4.
- Marinova, G.; Guliashki, V.; Chikov, O. MCDA approaches for automatic tool selection in a cloud based Online CADCOM platform. In Proceedings of the 12th UBT Annual International Conference (IC-UBT), Prishtina, Kosovo, 2023; pp. 1–6.
- Menxhiqi, L. Comparative evaluation of Multi-Criteria Decision-Making methods in the Online CADCOM platform. In Proceedings of the International Conference on Intelligent Systems and New Applications (ICISNA), 2025, pp. 1–8. 2025.
- Menxhiqi, L.; Marinova, G. Knowledge base assisting PCB design tool selection and combination in Online CADCOM platform. In Proceedings of the International Conference on Information Technologies and Information Security (ITIS), 2023, pp. 1–6. 2023.
- Kostova, K.M.; Menxhiqi, L.; Zylfiu, B.; Marinova, G.I. Review of artificial intelligence implementation in electronic design automation methods and tools. In Proceedings of the IEEE International Conference on Software, Telecommunications and Computer Networks (SoftCOM), 2024, pp. 1–6.
- Menxhiqi, L.; Marinova, G. AI integration for PCB design tool recommendation: Insights from a focused case study. In Proceedings of the IEEE International Conference on Broadband Communications for Next Generation Networks and Multimedia Applications (CoBCom), 2024, pp. 1–6.
- Menxhiqi, L.; Marinova, G. AI-powered workflow completion in decision support platform for engineering tool selection. In Proceedings of the IEEE International Conference on Software, Telecommunications and Computer Networks (SoftCOM), 2025, pp. 1–6.
- Liang, P.; Bommasani, R.; Lee, T.; Tsipras, D.; et al. Holistic evaluation of language models. Ann. N. Y. Acad. Sci. 2023, 1525, 140–146. [Google Scholar] [CrossRef]
- Zheng, L.; Chiang, W.L.; Sheng, Y.; Zhuang, S.; et al. Judging LLM-as-a-Judge with MT-Bench and Chatbot Arena. In Proceedings of the Advances in Neural Information Processing Systems (NeurIPS), Datasets and Benchmarks Track, 2023.
- Cliff, N. Dominance statistics: Ordinal analyses to answer ordinal questions. Psychol. Bull. 1993, 114, 494–509. [Google Scholar] [CrossRef]
- Schenker, N.; Gentleman, J.F. On judging the significance of differences by examining the overlap between confidence intervals. Am. Stat. 2001, 55, 182–186. [Google Scholar] [CrossRef]
Figure 1.
Three-mechanism anti-hallucination architecture. User queries pass through configurable combinations of M1, M2, and M3 before reaching any of twelve LLM configurations (three providers, two generations). Responses are validated against the tool database. The architecture is evaluated unchanged across 6,912 API calls.
Figure 1.
Three-mechanism anti-hallucination architecture. User queries pass through configurable combinations of M1, M2, and M3 before reaching any of twelve LLM configurations (three providers, two generations). Responses are validated against the tool database. The architecture is evaluated unchanged across 6,912 API calls.
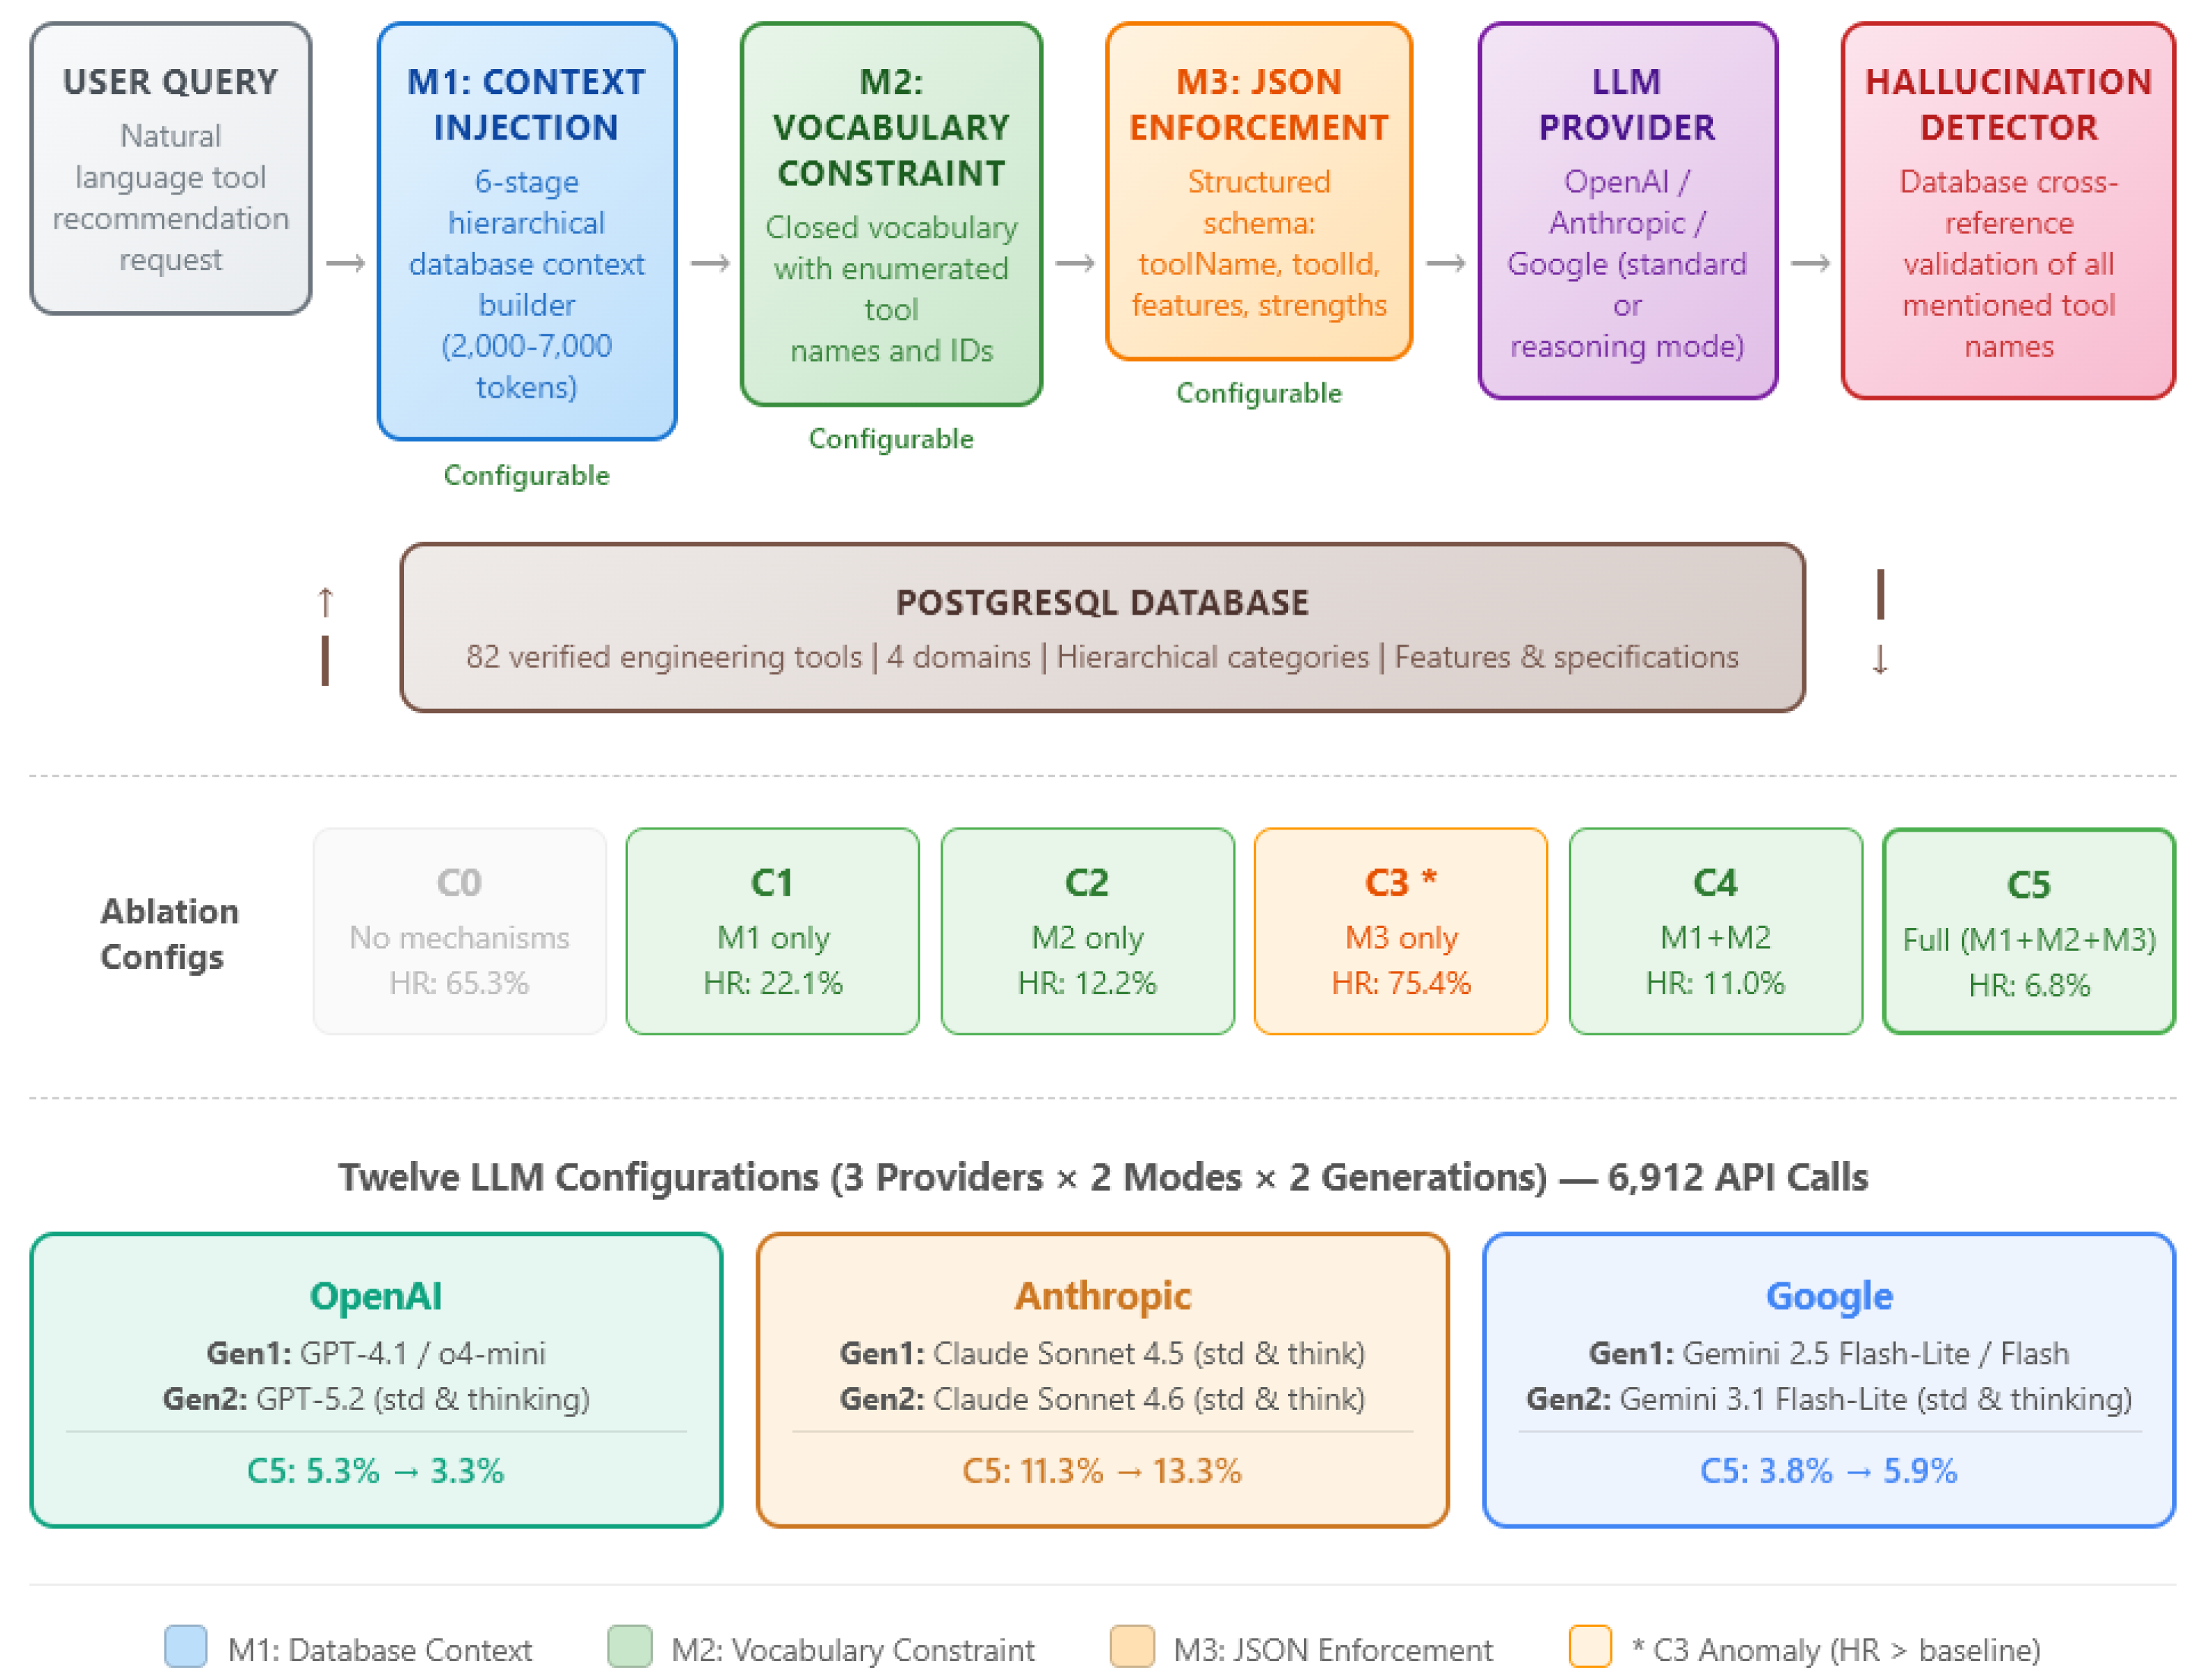
Figure 2.
C0 vs. C5 hallucination rates (%) across both generations ( per cell). C5 reduces HR by 79.3%–94.6%. GPT-5.2 achieves the lowest residual (3.3%); Anthropic’s regression (11.3% to 13.3%) is visible.
Figure 2.
C0 vs. C5 hallucination rates (%) across both generations ( per cell). C5 reduces HR by 79.3%–94.6%. GPT-5.2 achieves the lowest residual (3.3%); Anthropic’s regression (11.3% to 13.3%) is visible.
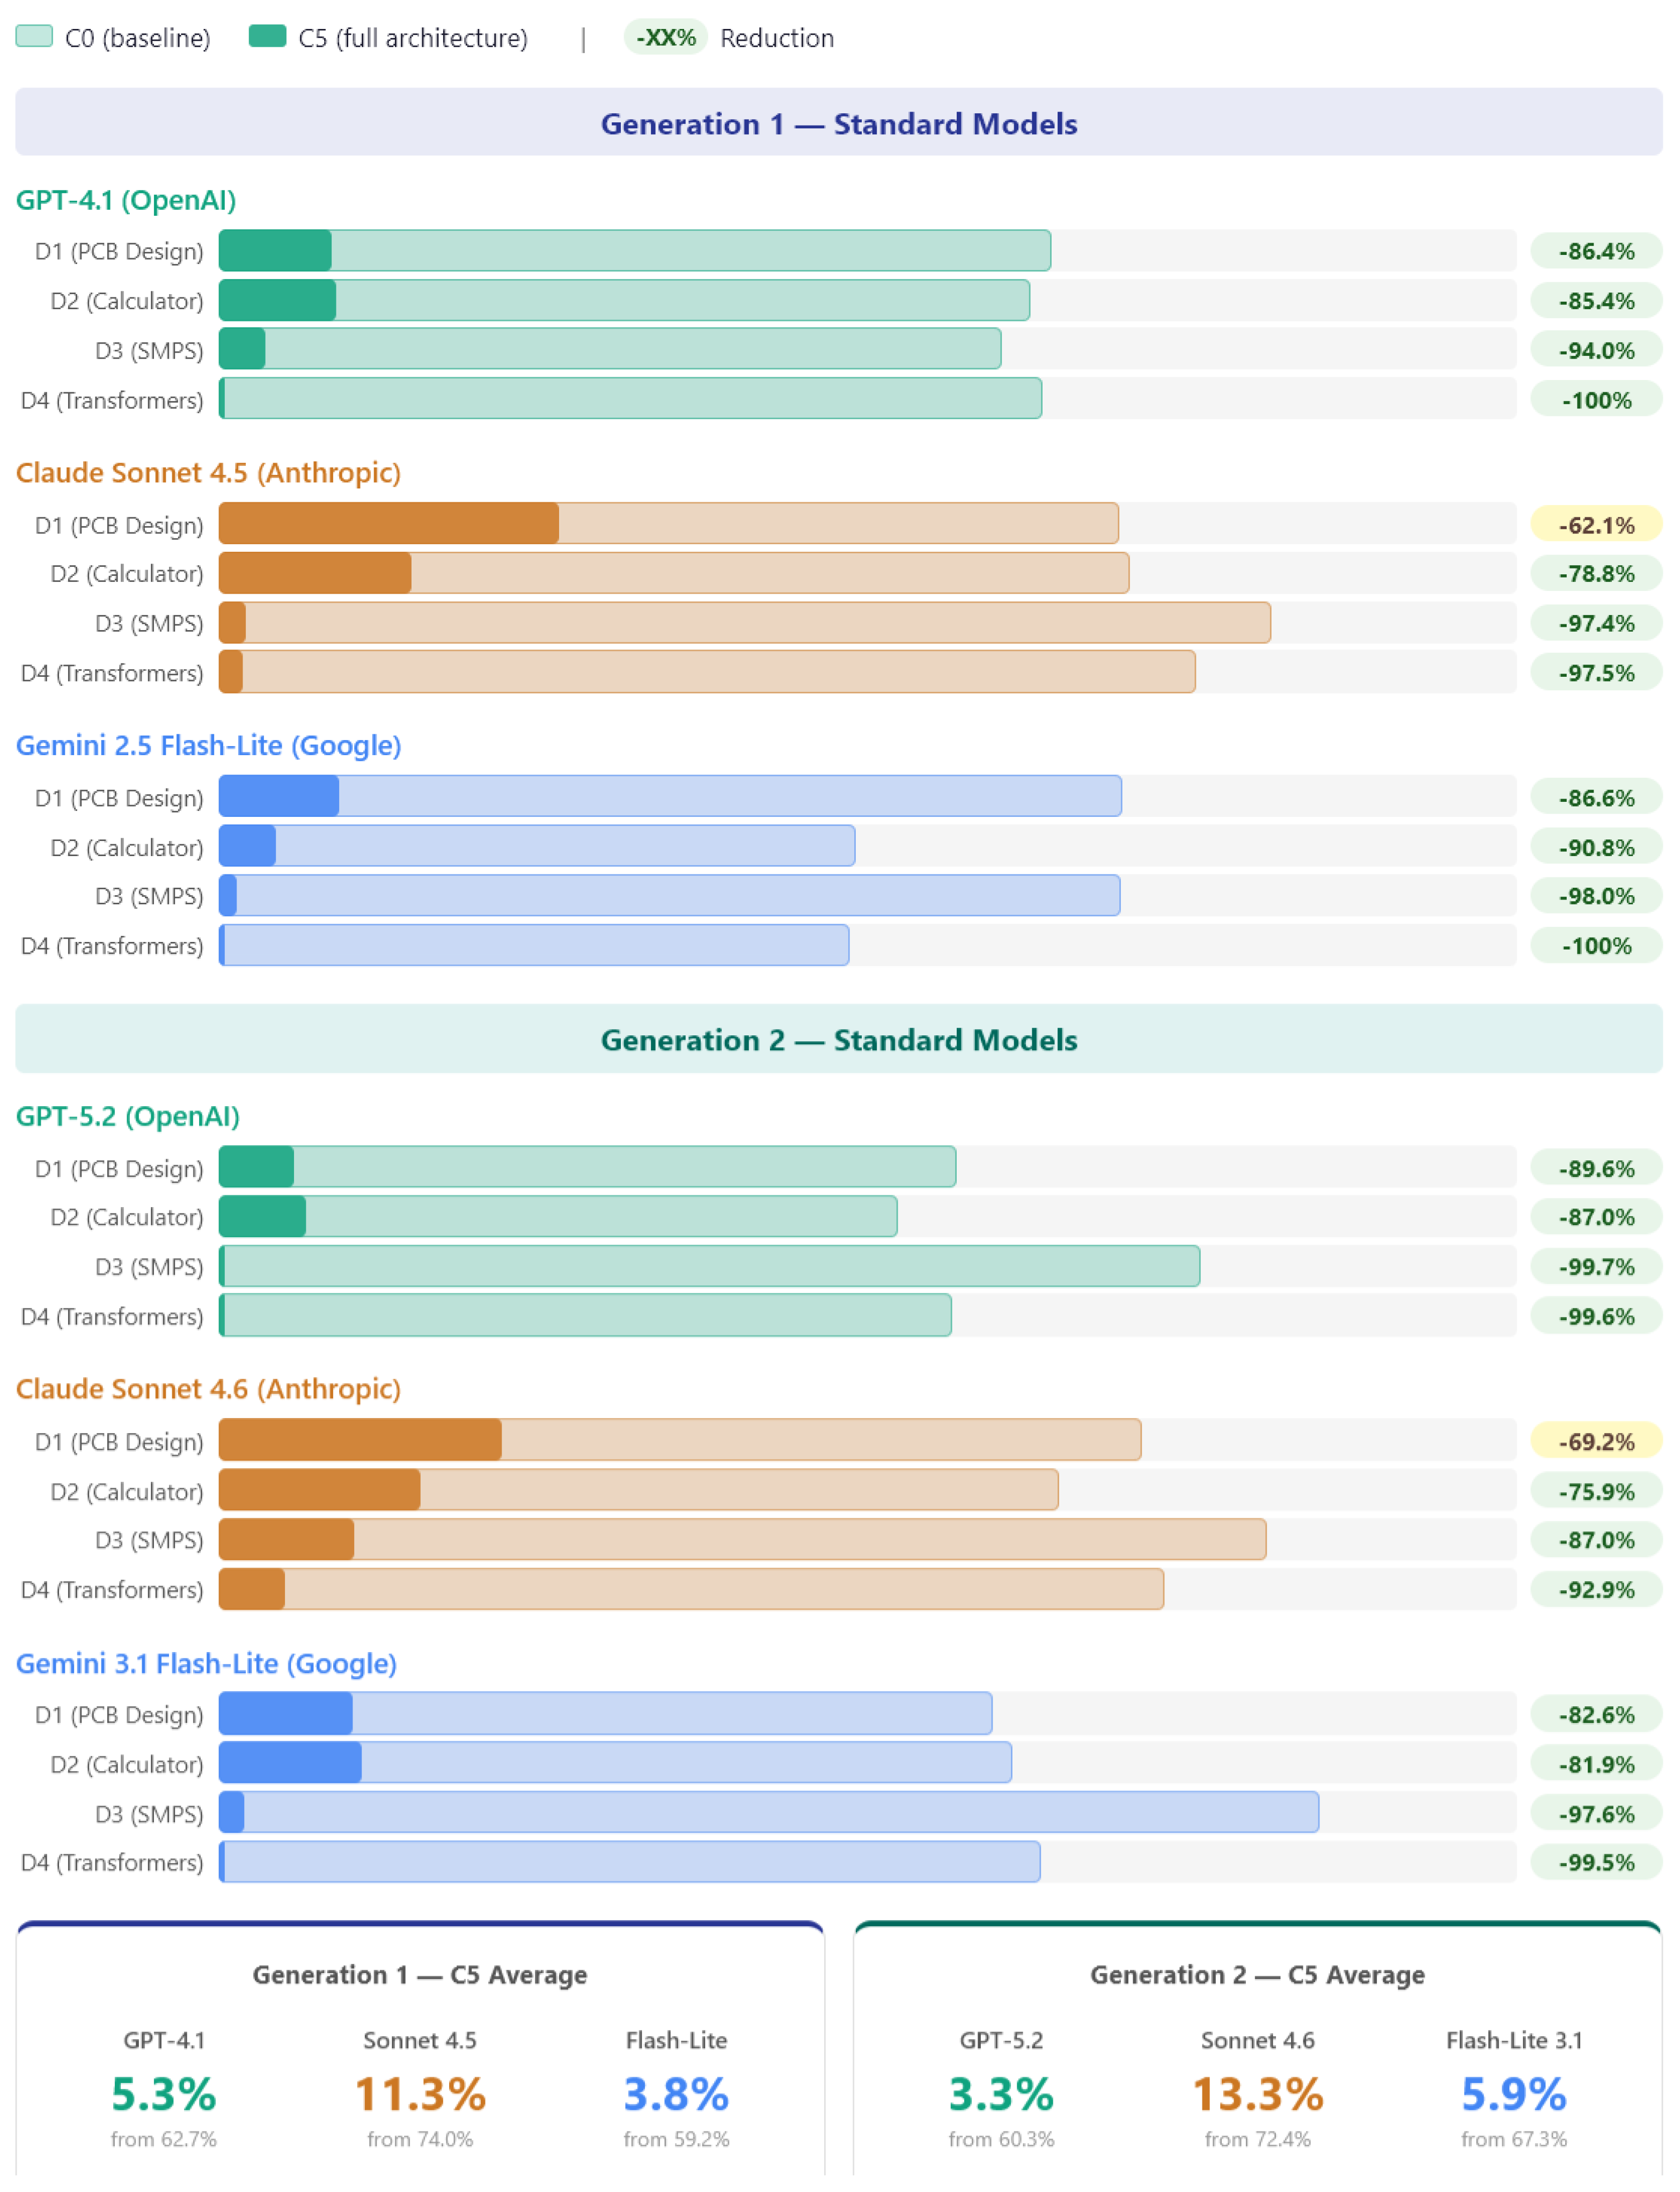
Figure 6.
Standard vs. reasoning model comparison under C0 and C5 across both generations ( per cell). No provider shows a significant thinking-mode advantage.
Figure 6.
Standard vs. reasoning model comparison under C0 and C5 across both generations ( per cell). No provider shows a significant thinking-mode advantage.
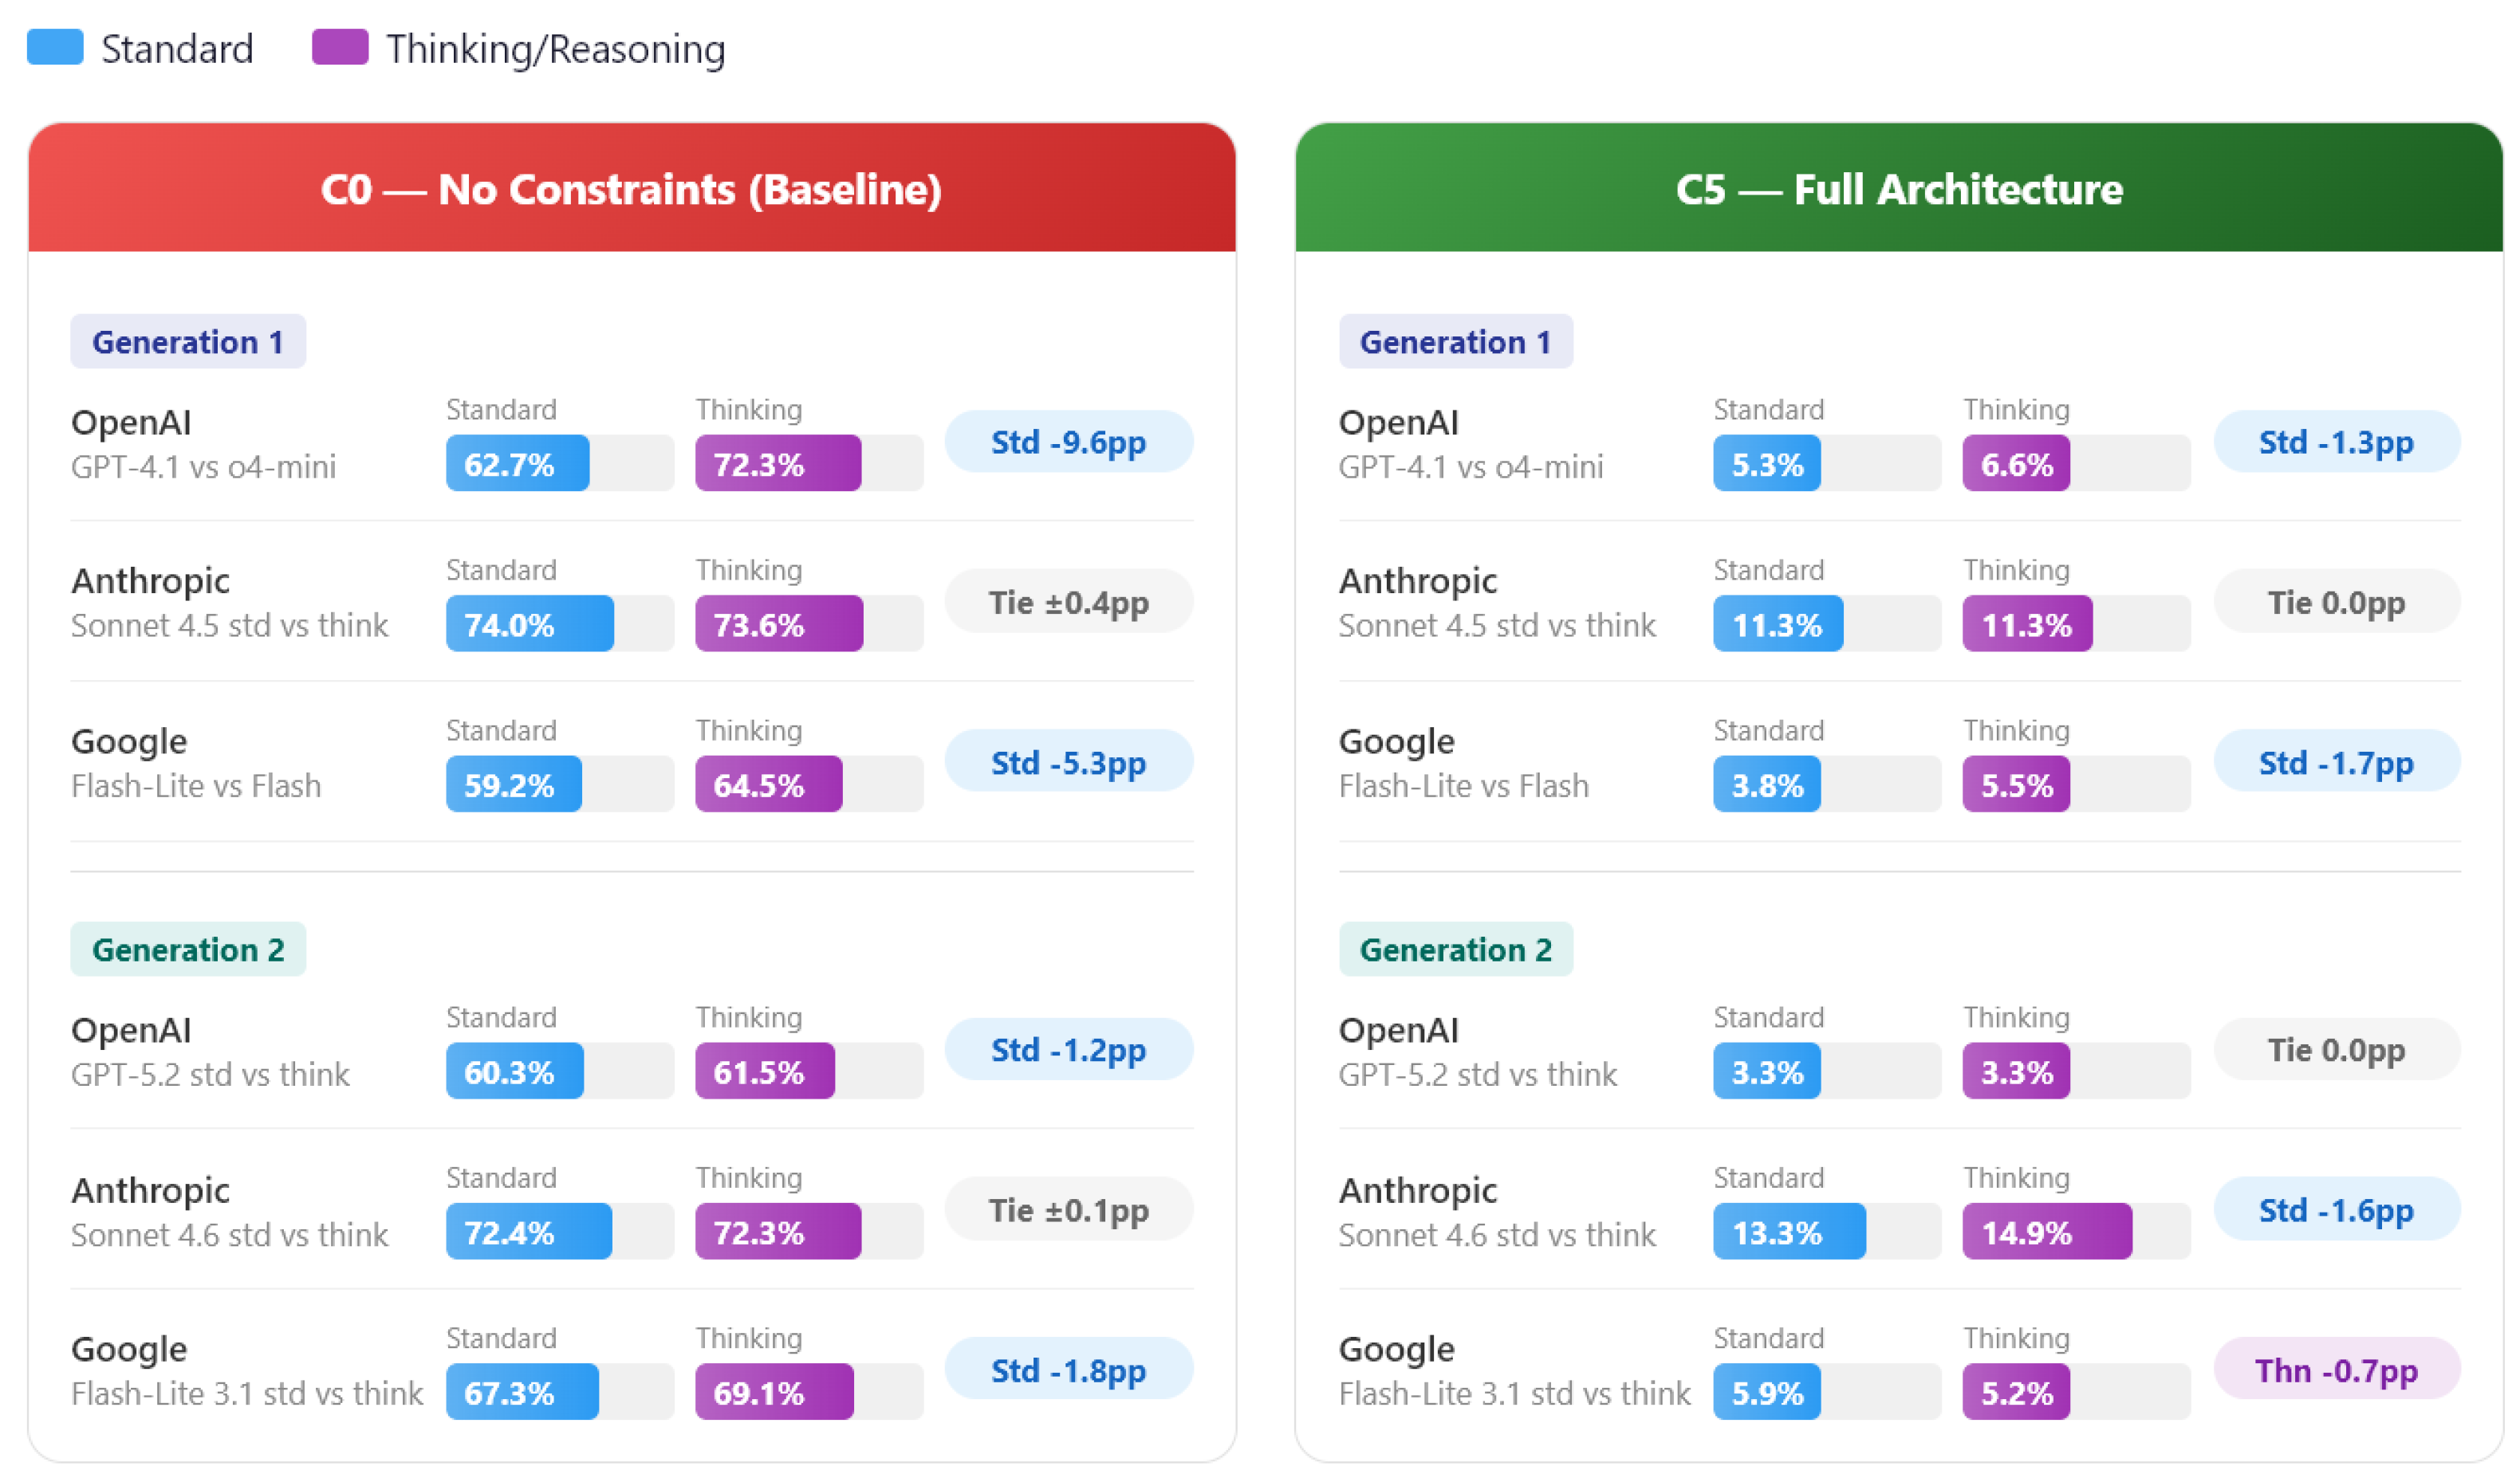
Figure 10.
C5 hallucination rates (%) with 95% bootstrap CIs for all twelve models ( per cell). Cross-provider average stable (6.8% Gen1 vs. 7.5% Gen2). Anthropic regresses (11.3% to 13.3%, ); OpenAI improves (5.3% to 3.3%, ).
Figure 10.
C5 hallucination rates (%) with 95% bootstrap CIs for all twelve models ( per cell). Cross-provider average stable (6.8% Gen1 vs. 7.5% Gen2). Anthropic regresses (11.3% to 13.3%, ); OpenAI improves (5.3% to 3.3%, ).
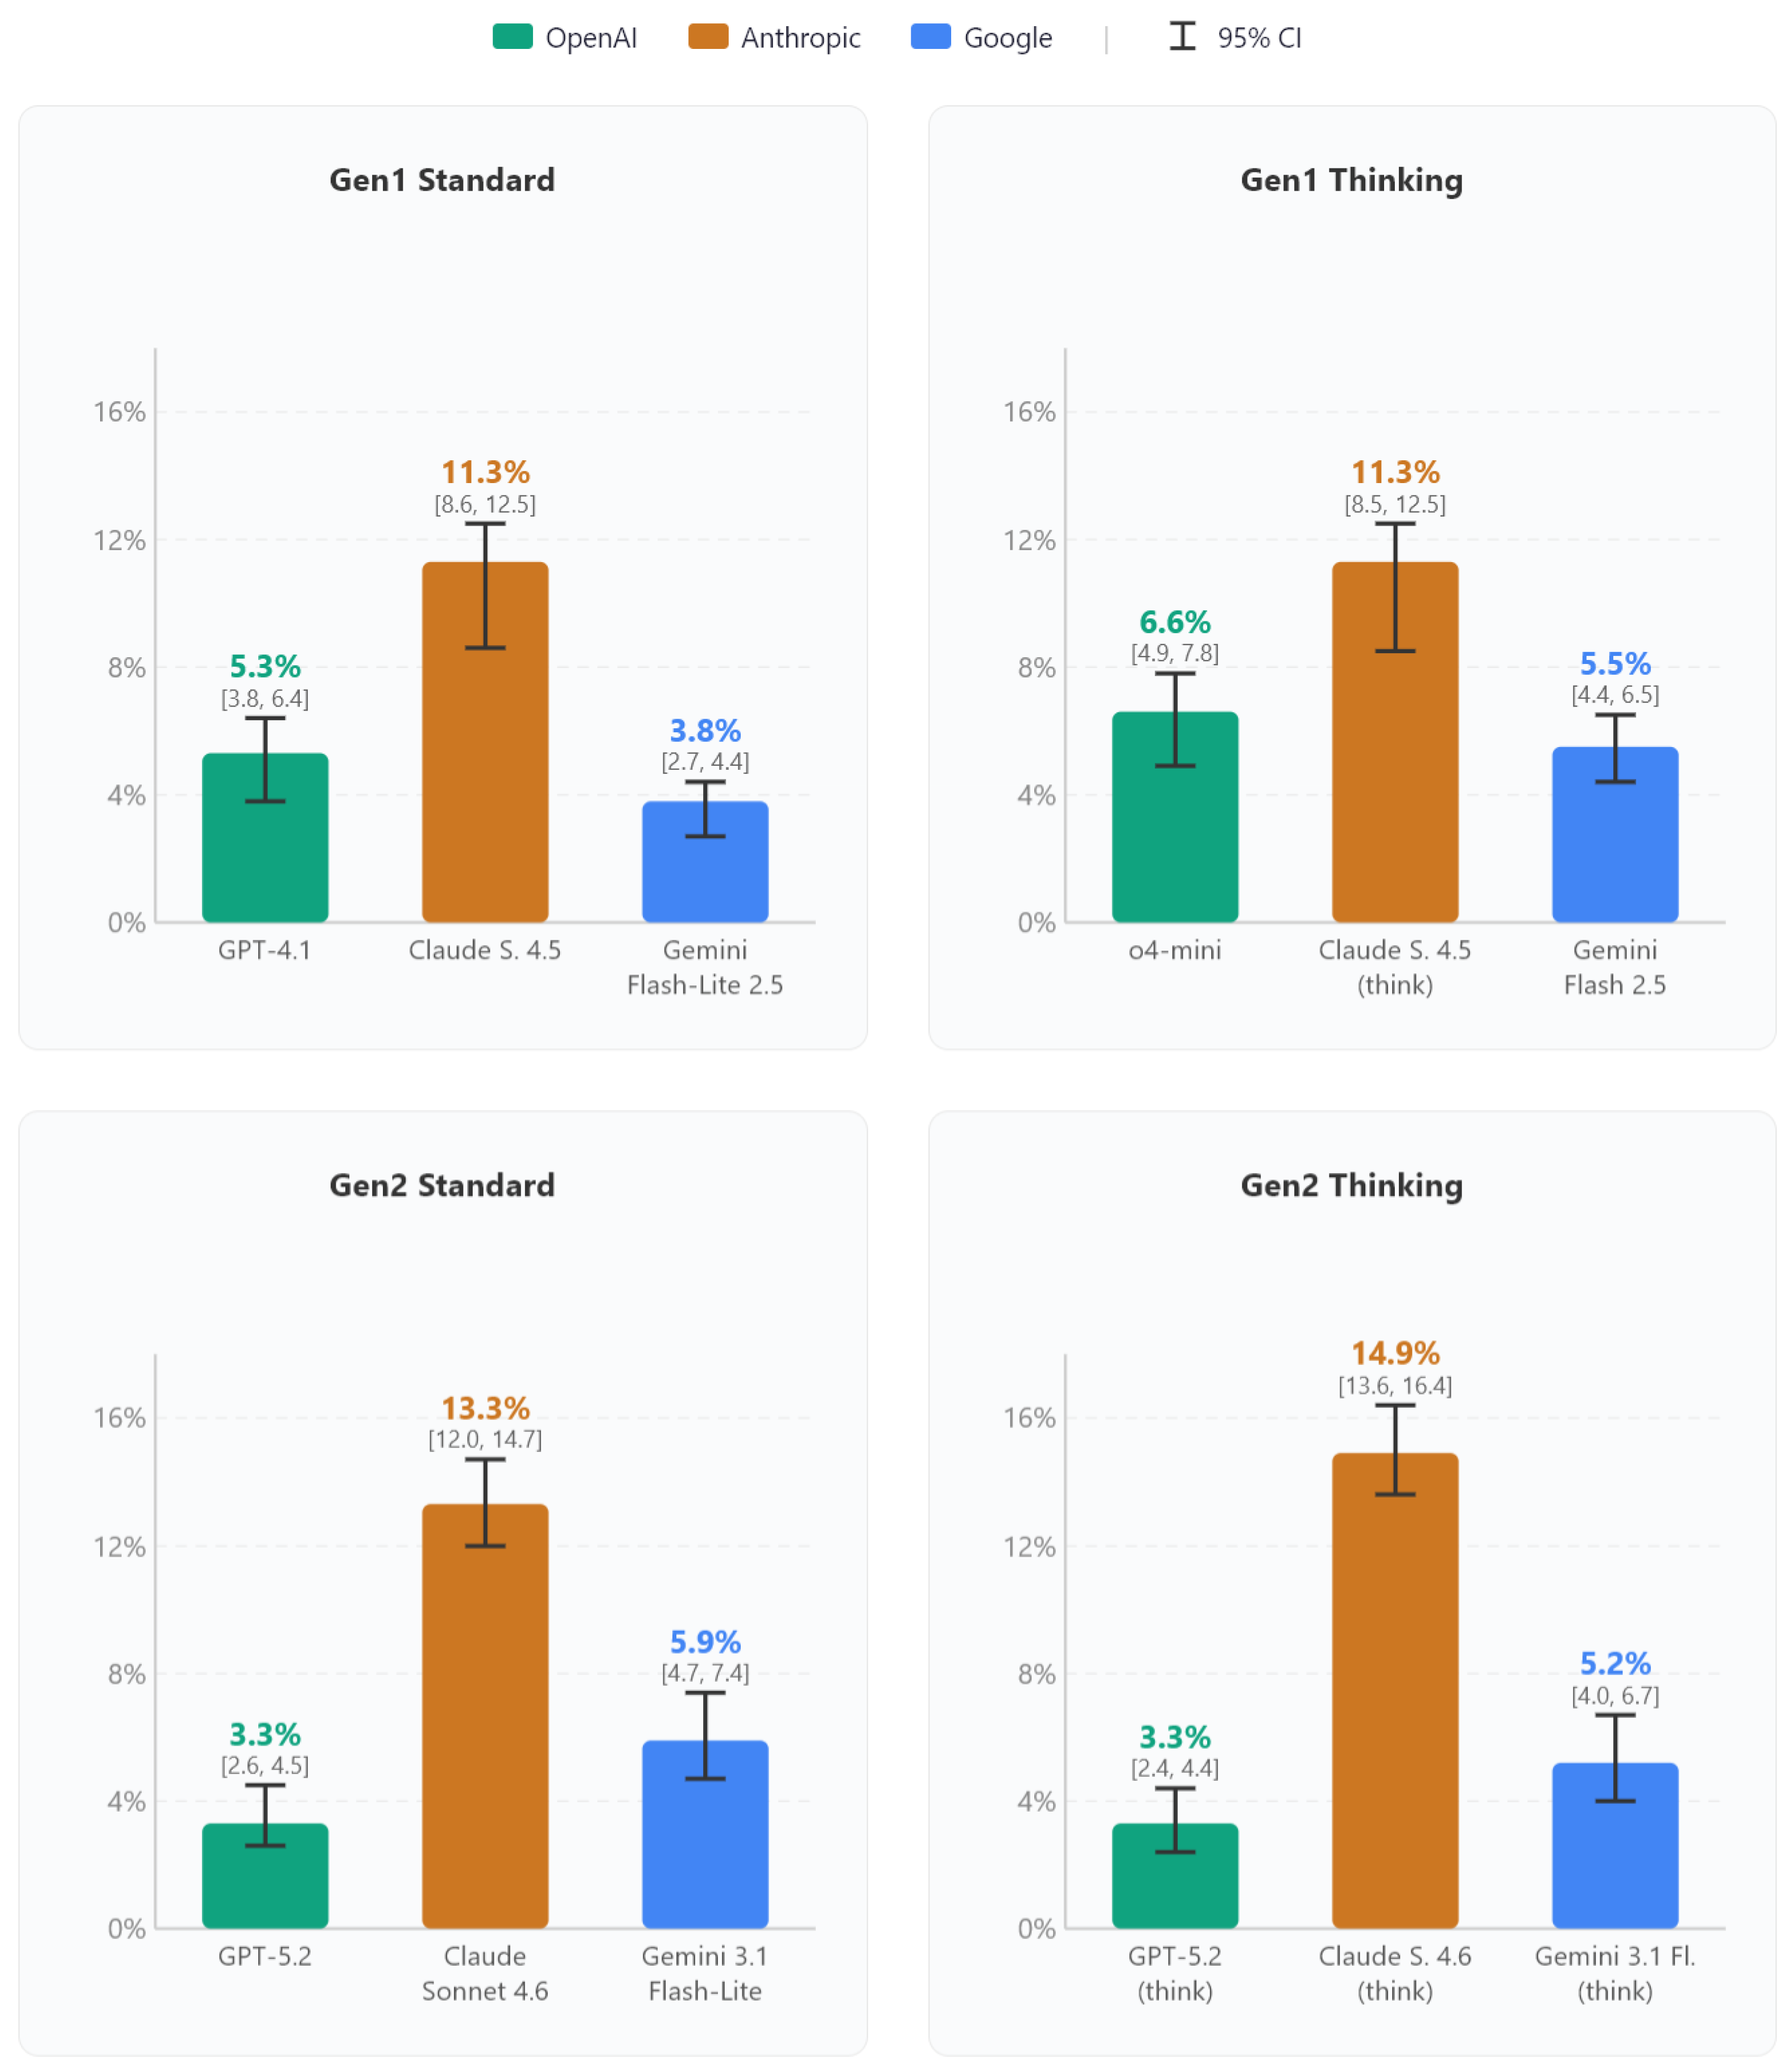
Figure 11.
Per-tool-mention hallucination rates under C5 ( per model), isolating vocabulary adherence from verbosity. Anthropic regression visible (Sonnet 4.5: 10.83% to Sonnet 4.6: 13.60%). GPT-5.2 achieves the lowest per-mention rate (3.48%) despite increased verbosity.
Figure 11.
Per-tool-mention hallucination rates under C5 ( per model), isolating vocabulary adherence from verbosity. Anthropic regression visible (Sonnet 4.5: 10.83% to Sonnet 4.6: 13.60%). GPT-5.2 achieves the lowest per-mention rate (3.48%) despite increased verbosity.
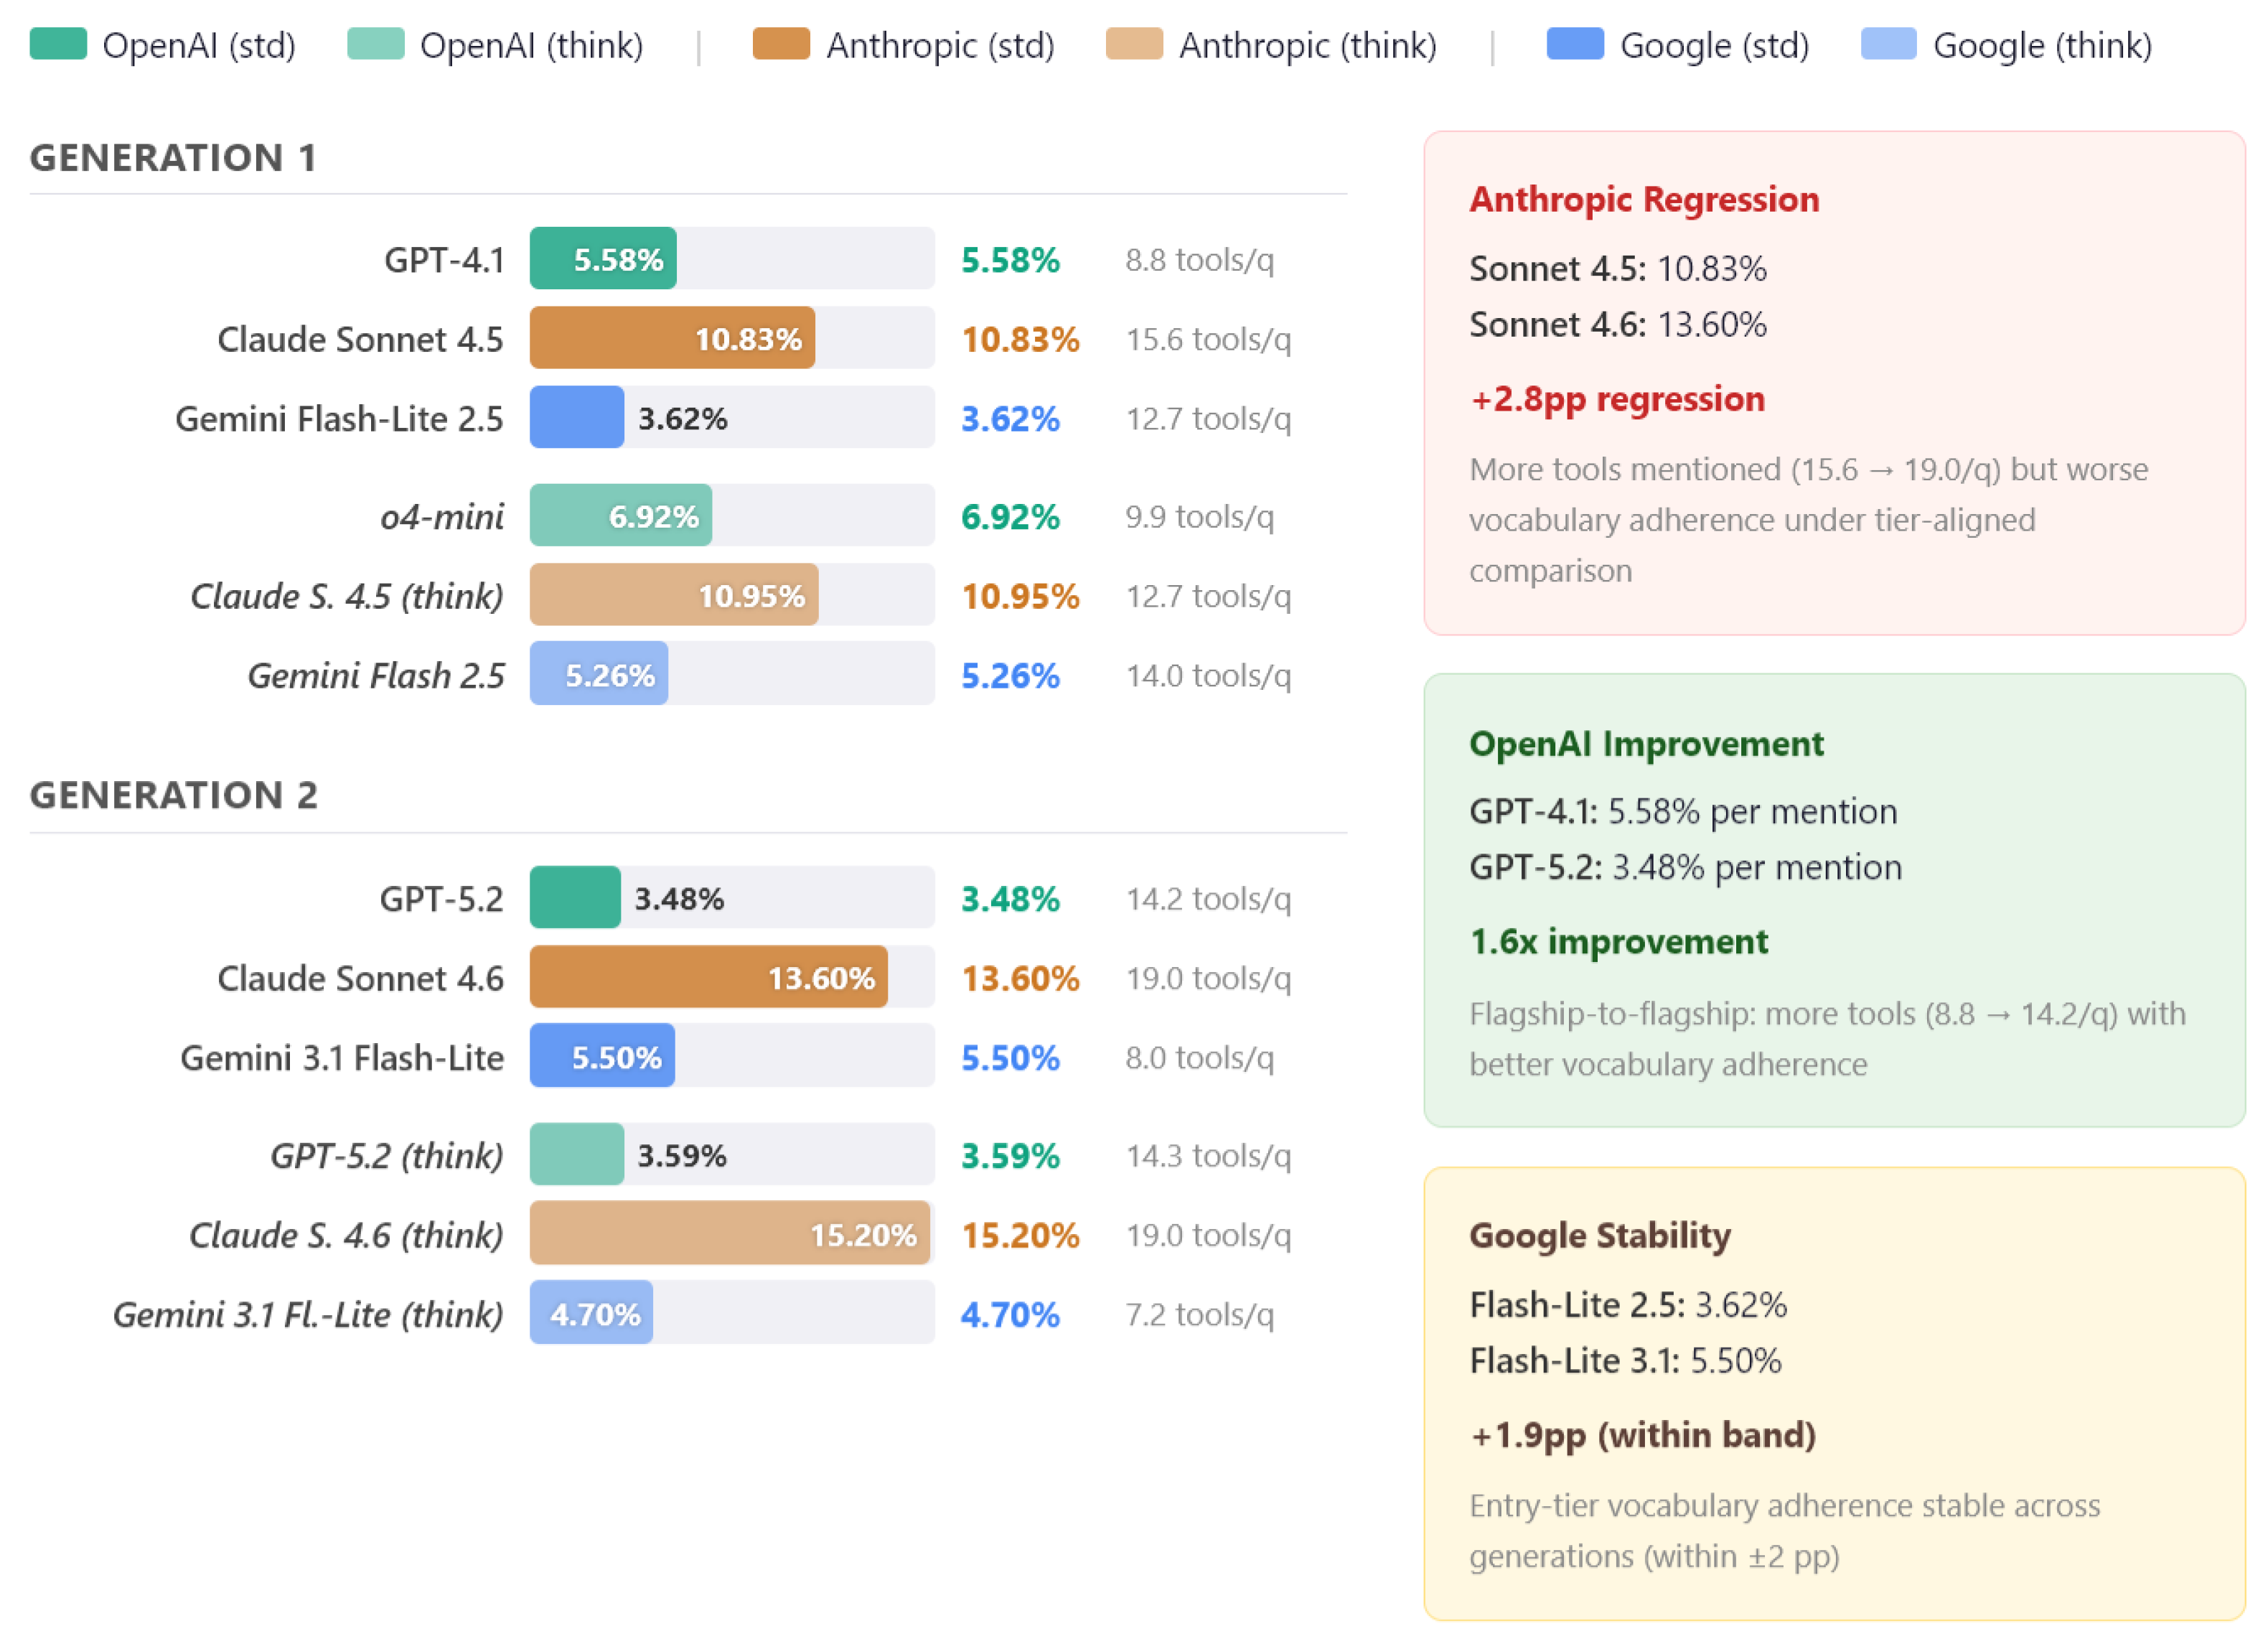
Table 1.
Ablation configuration matrix. Each configuration represents a unique combination of mechanisms M1 (Context), M2 (Vocabulary), and M3 (JSON).
Table 1.
Ablation configuration matrix. Each configuration represents a unique combination of mechanisms M1 (Context), M2 (Vocabulary), and M3 (JSON).
| Config | Description | M1 | M2 | M3 |
|---|---|---|---|---|
| C0 | Ungrounded baseline | – | – | – |
| C1 | Context only | – | – | |
| C2 | Vocabulary only | – | – | |
| C3 | JSON only | – | – | |
| C4 | Context + Vocabulary | – | ||
| C5 | Full architecture |
Table 2.
Generation 1 LLM configurations. These models represent the initial cross-provider evaluation baseline.
Table 2.
Generation 1 LLM configurations. These models represent the initial cross-provider evaluation baseline.
| Provider | Standard Model | Reasoning Model | Reasoning Mechanism |
|---|---|---|---|
| OpenAI | GPT-4.1 | o4-mini | Separate model family |
| Anthropic | Claude Sonnet 4.5 | Claude Sonnet 4.5 | Extended thinking toggle |
| Gemini 2.5 Flash-Lite | Gemini 2.5 Flash | Model variant |
Table 3.
Generation 2 LLM configurations. These are each provider’s next-generation models (February 2026). All three providers now use a single model with a configurable thinking toggle, eliminating the cross-provider reasoning heterogeneity present in Generation 1.
Table 3.
Generation 2 LLM configurations. These are each provider’s next-generation models (February 2026). All three providers now use a single model with a configurable thinking toggle, eliminating the cross-provider reasoning heterogeneity present in Generation 1.
| Provider | Standard | Reasoning (thinking) | Mechanism | Parameter |
|---|---|---|---|---|
| OpenAI | GPT-5.2 | GPT-5.2 | Reasoning effort | reasoning.effort |
| Anthropic | Claude Sonnet 4.6 | Claude Sonnet 4.6 | Adaptive thinking | thinking.type:adaptive |
| Gemini 3.1 Flash-Lite | Gemini 3.1 Flash-Lite | Thinking level | thinkingLevel |
Table 7.
Query accounting across all experimental phases.
| Phase | Models | Configs | Domains | Per cell | Total |
|---|---|---|---|---|---|
| Phase 1 (Gen1 std.) | 3 | 6 (C0–C5) | 4 | 36 | 2,592 |
| Phase 2 (Gen1 thn.) | 3 | 2 (C0, C5) | 4 | 36 | 864 |
| Phase 3a (Gen2 std.) | 3 | 6 (C0–C5) | 4 | 36 | 2,592 |
| Phase 3b (Gen2 thn.) | 3 | 2 (C0, C5) | 4 | 36 | 864 |
| Grand total | 6,912 | ||||
Table 8.
Evaluation domains with tool counts and category hierarchy.
| ID | Domain | Tools | Related | Examples |
|---|---|---|---|---|
| D1 | PCB Design Tool | 8 | 21 | KiCad, EasyEDA, EAGLE |
| D2 | PCB Design Calculator | 15 | 20 | Saturn PCB Toolkit, Technick Impedance Calc. |
| D3 | Switched-Mode Power Supply (SMPS)/Converters | 8 | 8 | PowerEsim, WEBENCH (TI), ADIsimPower |
| D4 | Transformers | 10 | 19 | goodcalculators, jcalc, alfatransformer |
Disclaimer/Publisher’s Note: The statements, opinions and data contained in all publications are solely those of the individual author(s) and contributor(s) and not of MDPI and/or the editor(s). MDPI and/or the editor(s) disclaim responsibility for any injury to people or property resulting from any ideas, methods, instructions or products referred to in the content. |
© 2026 by the authors. Licensee MDPI, Basel, Switzerland. This article is an open access article distributed under the terms and conditions of the Creative Commons Attribution (CC BY) license (http://creativecommons.org/licenses/by/4.0/).
Copyright: This open access article is published under a Creative Commons CC BY 4.0 license, which permit the free download, distribution, and reuse, provided that the author and preprint are cited in any reuse.