
Submitted:
28 May 2026
Posted:
29 May 2026
You are already at the latest version
Abstract
The Traveling Salesman Problem (TSP) remains a pivotal NP-hard challenge in combinatorial optimization, with critical applications spanning logistics, manufacturing, and industrial scheduling. While Ant Colony Optimization (ACO) is renowned for its distributed search and positive feedback, conventional variants frequently encounter premature convergence and “combinatorial explosion” in computational costs as problem scales expand. To overcome these bottlenecks, this paper proposes the Globally Adaptive Ant Colony System (GACS), a robust metaheuristic incorporating stagnation recovery and candidate-list pruning. The GACS framework integrates three synergistic strategies: (1) A K-nearest neighbor candidate-list compression that significantly reduces the search tree’s branching factor, maintaining high-quality solutions while ensuring effective linear scalability under fixed parameter configurations; (2) A global-adaptive pheromone weighting scheme that dynamically calibrates reinforcement intensity, facilitating a seamless transition from broad exploration to localized refinement; and (3) A multi-level stagnation recovery mechanism utilizing pheromone smoothing to preserve population diversity and bypass sophisticated local optima. Comprehensive evaluations on synthetic datasets and 33 benchmark instances from TSPLIB demonstrate that GACS consistently outperforms several recently published metaheuristic algorithms (including ABCSS, DSMO, and DWHO). Notably, GACS achieves a 5.5-fold acceleration in computational efficiency over hybrid genetic-ACO models and secures a favorable Average Rank of 1.44 across standard benchmarks. These results confirm that GACS provides a competitive balance between optimization accuracy and computational economy, offering a scalable and resilient paradigm for large-scale combinatorial optimization.
Keywords:
traveling salesman problems
; globally adaptive ant colony system
; candidate-list search
; candidate-list search space compression
; ant colony optimization
1. Introduction
The Traveling Salesman Problem (TSP) is a quintessential NP-hard combinatorial optimization problem focused on determining the shortest Hamiltonian cycle that visits a predefined set of cities exactly once, serving as a cornerstone for urban logistics and distribution center optimization [1]. Its applications span modern transportation, autonomous navigation, and industrial scheduling, including multi-UAV path planning [2] and disaster relief resource allocation. These diverse applications underscore that optimizing TSP solutions remains essential for reducing operational costs and enhancing system efficiency across multiple industrial domains.
As practical instances continue to grow in scale, traditional exact algorithms such as branch-and-bound encounter severe computational bottlenecks [3], often failing to identify optimal solutions within reasonable timeframes for instances involving hundreds of cities. Consequently, heuristic and meta-heuristic strategies have become the primary approach for large-scale TSP instances, with hybrid algorithms such as ACO-GA achieving robust balances between solution quality and efficiency [4]. In parallel, Deep Reinforcement Learning (DRL) and supervised learning frameworks [5] have introduced transformative paradigms for obtaining approximate solutions. While learning-based methods are competitive on small-scale instances, their performance often degrades on mid-to-large-scale problems due to training overhead and generalization challenges, leaving traditional heuristics indispensable.
In contrast, high-performance solvers such as the Lin-Kernighan-Helsgaun (LKH) [6,7], the exact solver Concorde [8,9], and the Edge Assembly Crossover-based Genetic Algorithm (EAX-GA) [10] have established benchmark standards for accuracy in the meta-heuristic domain. Nevertheless, their high computational complexity and structural overhead motivate the development of lightweight swarm-based alternatives. Over the past two decades, meta-heuristics have consistently provided viable solutions across all instance sizes by prioritizing optimization efficiency. This persistent efficiency–accuracy trade-off remains the core challenge in TSP research, driving the development of multi-strategy fusion and adaptive control mechanisms.
Among swarm intelligence paradigms, ACO has emerged as one of the most successful meta-heuristics for solving the TSP due to its intrinsic positive feedback and distributed search capabilities [11]. Researchers have hybridized ACO with local search, evolutionary operators, and adaptive pheromone strategies to balance exploration and exploitation. Technical refinements have further explored pheromone mutation mechanisms, parameter adaptation, and re-initialization schemes to prevent premature convergence. Despite these advancements, conventional ACO still struggles with rapidly increasing computational costs and stagnation during large-scale searches, necessitating more sophisticated mechanisms for search space compression and adaptive recovery to maintain high solution quality at scale.
Despite the proliferation of modern meta-heuristics, achieving a competitive balance between computational agility and global optimality in large-scale TSP remains a formidable challenge. Current hybrid frameworks often introduce structural redundancy and high time complexity, while stagnation in swarm-based optimization leads to premature convergence. As highlighted in recent systematic reviews of ACO [12], there is an urgent need for lightweight, adaptive mechanisms that compress the search space while maintaining robust recovery strategies.
To bridge this research gap, this paper proposes a purely ACO-based Globally Adaptive Ant Colony System (GACS) for high-precision and efficient solving of the TSP. Unlike most hybrid solvers, GACS achieves competitive performance as a lightweight framework without relying on embedded local search operators (e.g., 2-opt). The core contributions of this work are threefold: First, the Candidate-List-based search space compression mechanism reduces the per-step branching factor from to , significantly accelerating convergence while preserving solution accuracy; Second, a globally adaptive weighting strategy dynamically regulates the reinforcement intensity of best-known solutions, ensuring a seamless transition from global exploration to local exploitation as the search progresses; and Third, a non-linear, multi-level stagnation recovery strategy detects stagnation conditions and forces the system to escape local optima plateaus via pheromone smoothing, thereby reinvigorating search diversity when the global-best solution remains unchanged for extended iterations.
The remainder of this paper is organized as follows: Section 2 details the GACS algorithmic framework; Section 3 presents the experimental design and comparative evaluation on synthetic and TSPLIB benchmarks; Section 4 analyzes and discusses the results; and Section 5 concludes the paper and outlines future research directions.
2. Methodology
This chapter constructs the algorithmic evolution logic for solving the TSP. We begin by establishing the mathematical model and analyzing the computational complexity. A critical evaluation of baseline mechanisms—C-ACO and ACO-GA-H—identifies efficiency bottlenecks in large-scale combinatorial optimization. Building upon these insights, we derive the core GACS mechanisms, emphasizing the synergy between search space compression, globally adaptive reinforcement, and multi-level stagnation recovery. Finally, we provide formal complexity and convergence analyses to support the proposed framework.
2.1. Problem Formulation and Complexity Analysis
The TSP is a quintessential NP-hard combinatorial optimization challenge. Its objective is to determine the shortest Hamiltonian cycle visiting n cities exactly once and returning to the origin. The TSP underpins numerous industrial applications, including autonomous vehicle routing, truck-drone coordination, and circuit board optimization [3].
To formalize, we define the TSP on a complete weighted graph , where is the set of nodes and E denotes the edges. In the Euclidean variant, the distance is:
The objective function seeks a permutation of the city indices that minimizes the total tour length L:
As n increases, the number of feasible solutions grows factorially at . This explosive growth renders exhaustive search intractable for even moderately sized instances [3]. Deb et al. [13] emphasize that the inherent difficulty of the TSP necessitates meta-heuristic approaches to achieve high-quality solutions within reasonable timeframes. Hidalgo-Herrero et al. [14] further note that the non-separable nature of TSP sub-problems creates a “search space explosion,” where local decisions significantly impact global optimality.
Arora [15,16] introduced a Polynomial-Time Approximation Scheme (PTAS) for the Euclidean TSP, with further refinements by Arora and Bartal et al. [17] extending these techniques toward near-linear time complexities. However, as noted by Li et al. [18], such schemes often encounter limitations when addressing the dynamic constraints and extreme scales inherent in modern engineering applications. Consequently, meta-heuristic frameworks remain the most viable approach for managing cross-scale TSP challenges in practical environments.
2.2. Baseline Mechanism and Bottleneck Analysis
To establish a comparative framework, this section analyzes two representative baseline paradigms: C-ACO and ACO-GA-H. By deconstructing their operational mechanisms, we identify the fundamental bottlenecks in scalability and structural efficiency.
2.2.1. C-ACO Mechanism and Scalability Limitation
C-ACO simulates ant foraging through a distributed probabilistic construction process [11]. For an instance with n cities, ant k at city i selects the next city j from unvisited cities () via a stochastic transition rule:
where is the pheromone concentration on edge at time t, and is the heuristic desirability. After tour completion, pheromones are updated via evaporation and reinforcement:
where is the evaporation rate and is the total length of the k-th ant’s tour.
At each construction step, the transition probability requires scanning all feasible nodes, resulting in a computational cost of per decision. Consequently, constructing a complete tour incurs a total complexity of , which severely limits scalability for large-scale TSP instances.
2.2.2. ACO-GA-H Framework and Structural Overhead
To mitigate stagnation, ACO-GA-H integrates evolutionary operators from GA to inject stochastic entropy into the search process [4]. Following construction, a crossover operator is applied:
Random mutations are subsequently introduced:
While this hybridization improves accuracy, it introduces significant structural overhead and high time complexity [23,24]. The inclusion of crossover and mutation operators further increases computational cost, maintaining at least quadratic complexity and making the framework expensive for large-scale scenarios.
2.3. Design Philosophy and Core Mechanisms of GACS
Given the challenges faced by traditional ACO algorithms—including local optima entrapment and the structural overhead of hybrid operators—this study proposes a novel algorithmic framework. GACS is rooted in the “Principle of Targeted Intelligence,” which focuses on optimizing the intrinsic search behavior of the ant colony through three synergistic mechanisms [19,20].
2.3.1. Search Space Compression via K-Nearest Neighbors
To address the branching complexity, GACS adopts a philosophy of search space parsimony. Building on memory-efficient frameworks [14,15], we employ a K-nearest neighbor (KNN) candidate-list strategy [21]. Based on the Minimum Description Length (MDL) principle for heuristic fusion, ant movement is restricted to the K closest cities. This reduces per-step decision complexity from to , where . Consequently, the overall solution construction complexity is reduced from to . GACS further utilizes a linearized memory structure to store only candidate edge pheromones, filtering out noise in large-scale instances [22,23].
2.3.2. Globally Adaptive Reinforcement Scheme
To achieve deep exploitation without GA overhead, GACS utilizes an adaptive reinforcement scheme [24]. We define an adaptive weight factor :
where is the current iteration. The weight is bounded within , preventing excessive amplification. This modifies the global-best pheromone deposition:
As the search matures, increases exponentially, focusing the colony on the best-known regions. The bounded design controls reinforcement intensity, avoiding premature convergence while preserving adaptive exploitation [25].
2.3.3. Multi-Level Stagnation Recovery Strategy
To overcome premature convergence [17,26], GACS deploys a non-linear pheromone smoothing strategy. When the global-best solution remains unchanged for consecutive iterations, a recovery phase is triggered:
where is the smoothing coefficient. In this study, the stagnation threshold is empirically set to a fixed constant (e.g., ) across all instances to maintain parametric simplicity. By smoothing pheromone peaks, GACS lowers probabilistic barriers, forcing exploration of alternative paths. This mechanism effectively redistributes pheromone concentration and mitigates stagnation, thereby enhancing global search robustness.
2.4. Comparative Analysis of GACS and Baseline Schemes
Table 1 summarizes the paradigm shift. While C-ACO suffers from dimensionality and ACO-GA-H incurs heavy costs, GACS introduces a lightweight architecture addressing the efficiency-accuracy trade-off.
C-ACO is constrained by construction complexity and full pheromone matrix storage, limiting scalability. ACO-GA-H improves diversity through genetic operators but introduces additional overhead from crossover and mutation.
In contrast, GACS integrates candidate-list pruning and adaptive reinforcement to reduce unnecessary search while maintaining solution quality. The KNN mechanism directly reduces the branching factor, and adaptive weighting enhances exploitation without extra modules. Thus, GACS provides a lightweight yet efficient framework particularly suited for large-scale TSP instances.
2.5. Time Complexity Analysis
This section formally analyzes the computational complexity of GACS, addressing scalability in large-scale TSP instances.
For C-ACO, each ant evaluates transition probabilities over all unvisited nodes at per step, yielding per tour. For m ants, the overall construction complexity becomes .
In ACO-GA-H, crossover and mutation operators further increase computational overhead, typically maintaining at least quadratic complexity with respect to the problem size.
In contrast, GACS employs a KNN candidate-list strategy restricting selection to nodes. Each step requires , reducing per-solution construction to . For m ants, complexity becomes . Pheromone evaporation and updates over the matrix require , as does the conditionally triggered stagnation recovery.
Table 1 summarizes the comparison. Assuming m and K are fixed constants, GACS achieves near-linear complexity , supporting the scalability observed on large-scale instances.
2.6. Convergence Analysis
This section discusses the convergence behavior of GACS.
The GACS framework follows the fundamental probabilistic construction mechanism of ACO, where solution generation is guided by pheromone trails and heuristic information. Under standard ACO assumptions, if pheromone values are properly bounded and evaporation is applied, the algorithm can be modeled as a stochastic process with a non-zero probability of generating any feasible solution.
In GACS, the pheromone update mechanism includes evaporation, adaptive reinforcement, and stagnation recovery. The evaporation factor prevents unlimited accumulation of pheromone values, while the bounded adaptive weighting ensures that reinforcement remains controlled. Additionally, the stagnation recovery mechanism reintroduces diversity by smoothing pheromone distributions.
These mechanisms collectively ensure that the algorithm avoids premature convergence and maintains a positive probability of exploring alternative solutions. Therefore, over sufficient iterations, the probability of constructing high-quality solutions increases, implying probabilistic convergence toward near-optimal solutions.
Although a strict global optimality proof is difficult for meta-heuristic algorithms, the proposed design satisfies the standard convergence conditions of ACO-based frameworks, providing a reasonable theoretical guarantee for its effectiveness.
2.7. Hypothesis Formulation
We formulate four hypotheses to guide the validation:
- H1: Quality Hypothesis. GACS will achieve competitive solution quality compared to C-ACO and ACO-GA-H.
- H2: Speed Hypothesis. GACS will demonstrate significantly lower computational time than ACO-GA-H as n increases.
3. Experimental Setup and Performance Metrics
This section details the computational framework and evaluation protocols used to verify the performance of the proposed GACS algorithm. The experimental design is structured to validate the theoretical hypotheses through two distinct phases: first, a comparative analysis between GACS and the baseline algorithms (C-ACO and ACO-GA-H) is conducted using synthetic datasets of varying scales; second, a comprehensive benchmark evaluation is performed on standard TSPLIB instances against recent state-of-the-art meta-heuristics.
3.1. Experimental Environment and Parameter Settings
To ensure computational consistency and reproducibility, all algorithms—C-ACO, ACO-GA-H, and the proposed GACS—were implemented in Python 3.13. The experiments were executed on a high-performance workstation equipped with an Intel(R) Core(TM) i7-7700K CPU @ 4.20 GHz and 16 GB of RAM. For each test instance, every algorithm was executed for 20 independent runs to provide a statistically significant sample size for analyzing the mean, variance, and best-case performance.
All algorithms were implemented using a unified coding framework to ensure consistency in data structures, random seed control, and stopping criteria. This unified implementation eliminates potential biases caused by heterogeneous software environments.
The parameter configurations for the three algorithms are summarized in Table 2. These settings were benchmarked against the literature [29] to ensure an equitable comparison. Specifically, population sizes () and iteration limits () were maintained consistently across all models to focus the evaluation on the intrinsic efficiency of the underlying mechanisms.
Unless otherwise specified, all parameters remain fixed across different problem instances to ensure fairness and reproducibility of the experimental comparisons.
3.2. Data Generation and Evaluation Metrics
Two distinct datasets are utilized in this study. First, a synthetic suite was generated by randomly distributing city coordinates within a Euclidean space utilizing Python’s pseudo-random coordinate generator. This suite consists of six cases with increasing city scales () specifically designed to test algorithmic scalability. Second, 33 benchmark instances were selected from the TSPLIB library, ranging from 14 cities (Burma14) to 417 cities (Fl417), to provide a standardized evaluation of optimization accuracy across varying topological complexities.
All synthetic datasets were generated using fixed random seeds to ensure reproducibility. The coordinate distribution follows a uniform distribution within the defined Euclidean space.
To quantitatively assess performance, we adopt three primary metrics: solution quality (Mean, Std, and Best), computational efficiency (Average Execution Time), and relative improvement rates. Following the methodology in [29], the optimization error is measured by the relative to the Best Known Solution ():
where denotes the best solution found by the algorithm. To quantify the relative performance enhancement, we define the Best Solution Improvement Rate ():
In the subsequent analysis, values through are utilized to denote the percentage improvement of GACS over C-ACO and ACO-GA-H in terms of both mean and best-case results.
In addition, statistical significance tests are conducted to evaluate whether observed performance differences are non-random. Non-parametric methods are adopted due to the potential non-normality of solution distributions.
3.3. Performance Comparison on Synthetic Data
The evaluation on synthetic data focuses on investigating the “Scaling-Cost” trade-off. By analyzing the 20 samples obtained for each city scale, we observe how the solution quality (mean path length) and stability (standard deviation) fluctuate as the search space expands factorially. This analysis specifically aims to verify H1 and H2 by determining whether GACS maintains a stable variance in large-scale instances (e.g., ) compared to the baselines.
Furthermore, computational efficiency is a critical dimension of this comparison. Based on the theoretical complexity discussed in Section 2, the analysis examines the execution time growth curves. While ACO-GA-H is expected to exhibit significant structural overhead due to evolutionary operations, this stage will demonstrate how the GACS candidate-list mechanism minimizes time dissipation while simultaneously enhancing the probability of capturing the optimal path.
To further validate the robustness of the observed improvements, a Wilcoxon signed-rank test is applied to the paired results of GACS and baseline algorithms across 20 independent runs for each synthetic instance.
The detailed statistical results, including p-values and effect sizes, are reported in Section 4 to support the significance of performance differences.
3.4. TSPLIB Benchmarks for Depth Verification
The final stage of the experimental setup involves a rigorous comparison between GACS and three recent state-of-the-art algorithms: ABCSS [27], DSMO [28], and DWHO [29]. This cross-validation on 33 standard cases serves to confirm the global competitiveness of GACS and verify hypotheses H3 and H4.
The analysis is centered on the metric across instances of varying complexity. By comparing the best solutions obtained by GACS against those reported in the literature, we evaluate the algorithm’s ability to achieve near-optimal (zero ) results on complex benchmarks. This depth verification provides the empirical evidence necessary to support claims of superior robustness and the capability to escape local optima plateaus enabled by the multi-level recovery strategy.
Furthermore, a non-parametric Friedman test with Nemenyi post-hoc analysis is conducted to compare GACS with multiple algorithms across all benchmark instances. This test evaluates the overall ranking performance without requiring access to raw experimental data from the literature.
The statistical comparison framework ensures that conclusions regarding algorithm superiority are supported by rigorous hypothesis testing rather than isolated numerical comparisons.
4. Results and Discussion
In this chapter, we present a comprehensive and statistically grounded analysis of the experimental results to validate the effectiveness of the proposed GACS. In addition to direct performance comparisons, non-parametric statistical tests are incorporated to further verify the significance and robustness of the observed improvements. The evaluation is conducted in two primary phases: first, a comparative study on synthetic datasets is performed to assess scalability and computational efficiency; second, a benchmarking against state-of-the-art algorithms on standard TSPLIB instances is executed to verify global optimization capabilities across diverse topological complexities.
4.1. Comparison of GACS with Baseline Algorithms
To provide a more rigorous validation of the proposed mechanisms, this section is reformulated as an internal ablation study. The objective is to quantitatively assess whether the integration of candidate-list pruning and adaptive reinforcement enables statistically significant improvements over baseline algorithms under controlled synthetic environments.
To evaluate the fundamental capabilities of the GACS algorithm, we first focus on its performance across synthetic datasets. This stage is crucial for investigating how the proposed mechanisms—specifically the candidate-list pruning and adaptive weighting—handle increasing problem dimensions without the influence of specific TSPLIB topological biases. The experiments were conducted on six randomly generated TSP instances with city scales ranging from to .
4.1.1. Solution Quality and Statistical Significance Analysis
The statistical results for mean path length and standard deviation over 20 independent runs are summarized in Table 3. A comprehensive examination of the data reveals that GACS consistently outperforms both the canonical C-ACO and the hybrid ACO-GA-H across all tested dimensions.
In small-scale instances (Case 1 and Case 2), the improvement rates ( and ) remain relatively modest, typically ranging from 1.6% to 4.0%. However, a significant trend emerges as the city scale n increases. When the problem size reaches and , the values peak near 5%. This positive correlation between “performance gain” and “problem scale” suggests that GACS possesses superior scalability. While C-ACO tends to suffer from premature convergence in larger search spaces [12,22], the globally adaptive reinforcement strategy in GACS maintains a high selection pressure toward the global optimum while preserving necessary diversity.
Furthermore, the stability of the algorithms is reflected in the standard deviation (shown in parentheses). Although the absolute value of the standard deviation naturally increases with the tour length, GACS maintains a more controlled variance compared to the baselines in large-scale scenarios (e.g., 26.71 for GACS vs. 17.94 for ACO-GA-H at ). This relative stability confirms that the stagnation recovery mechanism effectively prevents the “search-loop” traps that often destabilize standard ant colony systems during high-dimensional optimization.
Table 4 further evaluates the peak exploration capacity by comparing the best solutions found during the 20 runs. GACS secured the shortest paths in 100% of the synthetic cases. A notable breakthrough is observed in Case 6 (), where GACS achieved a best solution of 1370.24, representing a substantial 5.33% improvement () over the standard C-ACO.
To further validate whether these observed improvements are statistically significant rather than stochastic artifacts, a Wilcoxon signed-rank test was conducted on the paired results of 20 independent runs for each instance. This non-parametric test is particularly suitable as it does not assume normality of the solution distributions.
The statistical results in Table 5 indicate that GACS significantly outperforms both C-ACO and ACO-GA-H across all six instances (, one-tailed). The corresponding rank-biserial correlation coefficients () demonstrate extremely large effect sizes, confirming that the improvements are not only statistically significant but also practically meaningful.
Furthermore, all p-values remain significant after applying the Bonferroni correction for multiple comparisons (), reinforcing the robustness of the conclusions. These findings provide strong statistical support for H1.
4.1.2. Computational Efficiency and Complexity Trade-off
A central motivation for the development of GACS is to decouple high-precision optimization from prohibitive computational overhead. Table 6 provides a comparative view of the average execution time, revealing a stark divergence in algorithmic efficiency.
The baseline C-ACO remains the fastest due to its minimal structural overhead; however, its solution quality is the least competitive. The most critical observation lies in the comparison between ACO-GA-H and GACS. As the city size n scales, ACO-GA-H exhibits a “computational explosion.” At , its execution time surges to 714.38 seconds, which is approximately 6 times slower than the baseline. This surge confirms the theoretical bottleneck of integrating genetic crossover and mutation operators [23], which significantly increase the per-iteration complexity to .
This empirical observation is highly consistent with the theoretical complexity analysis presented in Section 2. Specifically, the construction cost of C-ACO and the additional overhead introduced by genetic operators in ACO-GA-H explain their poor scalability.
In contrast, GACS maintains a highly efficient growth curve. At , GACS requires only 129.34 seconds—merely 7% more time than C-ACO, yet it is 5.5 times faster than ACO-GA-H.
This efficiency gain can be directly attributed to the complexity induced by the KNN-based candidate-list mechanism, where . By reducing the branching factor of state transitions, GACS effectively limits redundant probability evaluations while preserving high-quality solution components.
This near-linear scalability is attributed to the K-nearest neighbor candidate-list mechanism discussed in Section 2. By restricting the ant transition probability calculations to a fixed , GACS reduces the search space complexity to , effectively pruning the search tree without sacrificing the edges required for the global optimum [30].
Therefore, both theoretical analysis and empirical evidence consistently demonstrate that GACS achieves a superior balance between computational cost and optimization accuracy.
These results validate Hypothesis H2, proving that GACS offers a superior “accuracy-to-cost” ratio, making it suitable for real-time or resource-constrained applications.
4.2. Analysis of TSP Solving Capability on TSPLIB Instances
To rigorously evaluate the global optimization efficacy of the proposed GACS, we conducted extensive benchmark tests on 33 standard instances from the TSPLIB library, covering a wide range of city scales (from to ) and topological distributions. The comparative results against three state-of-the-art algorithms—ABCSS, DSMO, and DWHO—are summarized in Table 7.
The experimental data demonstrates that GACS exhibits exceptional precision across diverse problem complexities. For small-scale instances (e.g., Burma14, Ulysses16, and Ulysses22), GACS consistently identifies the BKS. As the problem scale shifts to mid-range (100 to 200 cities), the superiority of GACS becomes more pronounced. Notably, in Case Lin105 and Pr107, GACS successfully captured the exact BKS, whereas competing algorithms such as ABCSS and DWHO showed slight deviations. This suggests that for problems with specific geometric constraints, the Candidate List Mechanism in GACS effectively prunes inferior edges, allowing the pheromone concentration to focus on high-probability optimal paths.
In large-scale instances (), although the search space expands factorially, GACS maintains a formidable competitive edge. For KroA200, KroB200, and Lin318, GACS yielded the best results among all compared methods, with Gaps significantly lower than those of DSMO and ABCSS. It is worth noting that in the most complex case, Fl417, while DWHO achieved a slightly better peak result, GACS remained within a reasonable error margin (Gap of 5.84% demonstrates). This “performance-gain with scale” is primarily attributed to the multi-level recovery scheme, which injects necessary exploration entropy when the colony is trapped in the complex local minima characteristic of large-scale TSPLIB instances.
Overall, the results presented in Table 7 confirm that GACS achieves a favorable balance between solution quality and scalability across a diverse set of benchmark instances. However, beyond raw performance comparison, it is necessary to further investigate whether the observed improvements are statistically significant and how GACS positions itself relative to both general-purpose metaheuristics and specialized TSP solvers.
4.2.1. Statistical Significance Analysis (Friedman Test)
To further validate the robustness of the observed performance differences, a non-parametric Friedman test was conducted based on the mean and standard results reported in Table 8. This test is particularly suitable for multi-algorithm comparison across multiple problem instances without assuming normality of the data distribution. For each instance, the four algorithms (ABCSS, DSMO, DWHO, and GACS) were ranked in ascending order (rank 1 indicating the best performance). The Average Rank for each algorithm was then computed over all valid instances.
The Friedman test results indicate a statistically significant difference among the compared algorithms (, ), leading to the rejection of the null hypothesis that all algorithms perform equivalently. As summarized in Table 8, GACS achieves the best overall ranking, confirming its superior global optimization capability across diverse TSPLIB instances.
To further analyze pairwise differences, a Nemenyi post-hoc test was applied. The results show that GACS significantly outperforms ABCSS and DSMO at the significance level, as the corresponding rank differences exceed the critical difference (CD). In contrast, the performance gap between GACS and DWHO does not reach statistical significance, indicating that GACS performs at a level comparable to the strongest competing metaheuristic while maintaining a simpler and more computationally efficient framework.
These findings provide strong statistical support for the empirical observations in Table 7, confirming that the performance advantage of GACS is not due to random variation but reflects a consistent and reliable improvement across problem instances.
4.2.2. Comparison with Specialized State-of-the-Art Solvers
While the above comparisons focus on general-purpose metaheuristic algorithms, it is also essential to contextualize the absolute performance of GACS against highly specialized TSP solvers. To this end, Table 9 presents a comparison with three representative state-of-the-art approaches: LKH [6,7], Concorde [8,9], and EAX-GA [10]. These methods incorporate advanced problem-specific heuristics and decades of algorithmic refinements, enabling them to achieve near-optimal or optimal solutions on standard TSPLIB instances.
As shown in Table 9, GACS maintains a relatively small optimality gap on small-to-medium scale instances (), typically below 1%. This result is particularly noteworthy given that GACS does not rely on local search operators such as 2-opt or 3-opt, which are fundamental components in most high-performance TSP solvers. Instead, its performance is achieved through the synergistic effects of candidate-list pruning, adaptive pheromone weighting, and the multi-level stagnation recovery mechanism.
On larger instances (e.g., Lin318), the optimality gap increases moderately (2.64%), which can be attributed to the absence of intensive local refinement strategies. Nevertheless, GACS remains competitive and demonstrates stable performance without the need for complex hybridization or problem-specific engineering.
It is important to emphasize that the objective of GACS is not to surpass these highly specialized solvers in absolute optimality, but rather to provide a lightweight, scalable, and adaptable framework. In this context, the results highlight that GACS achieves a favorable trade-off between solution accuracy and computational complexity, making it particularly suitable for large-scale, dynamic, or non-Euclidean TSP variants where traditional solvers may face limitations.
4.3. Statistical Stability and Robustness Analysis
Beyond peak optimization performance, the reliability of an algorithm in a stochastic search process is paramount. Table 8 presents a comprehensive statistical comparison, including Mean values, Standard Deviations (Std), and a Win/Tie/Loss (W/T/L) analysis based on the mean results.
These statistical indicators further provide empirical support for the theoretical design principles discussed in Section 2, particularly regarding efficiency–stability trade-offs and adaptive search control.
The Average Rank (R) for each algorithm is calculated to evaluate overall performance across all test instances. For each instance i, algorithms are ranked in ascending order based on their mean objective values (rank 1 = best performance, rank 4 = worst). In cases where k algorithms achieve identical mean values (ties), they are assigned the average rank , where r is the starting rank position. The overall Average Rank for algorithm j is computed as:
where denotes the number of valid instances for algorithm j (excluding / entries), and represents the rank of algorithm j on instance i.
Applying Eq. (13) to the results in Table 8 yields the following Average Ranks: GACS achieves 1.44, DWHO 2.45, ABCSS 2.80, and DSMO 3.28 (based on 33, 33, 32, and 32 valid instances, respectively). This metric confirms GACS’s dominant position, with a substantial margin over the nearest competitor DWHO (difference of 1.01).
This ranking-based superiority is consistent with the theoretical expectation that the candidate-list pruning mechanism reduces ineffective search paths, thereby improving overall solution quality across heterogeneous instances .
The Win/Tie/Loss metric provides a complementary high-level summary of algorithmic dominance. GACS achieved superior mean performance in 25 out of 32 valid instances compared to ABCSS (with 3 ties and 4 losses), 27 out of 32 instances compared to DSMO (with 1 tie and 4 losses), and 28 out of 33 instances compared to DWHO (with 1 tie and 4 losses). Notably, the four losses against each competitor occurred consistently in instances Ulysses16, Ulysses22, D198, and Gr229, where competing algorithms achieved marginally lower path lengths.
Such isolated performance degradations are expected in stochastic optimization and do not contradict the overall dominance pattern, especially considering the inherent trade-off between exploration and exploitation discussed in Section 2.
A critical observation can be made regarding the Standard Deviation (Std) values in Table 8. In the majority of mid-to-large scale instances, GACS exhibits a significantly lower Std than its counterparts. For example, in Case Pr226 and Fl417, the Std of GACS is orders of magnitude more stable than that of DSMO. This high degree of consistency validates Hypothesis H4, proving that the Pheromone Smoothing strategy effectively moderates the “positive feedback” intensity of the ant colony, preventing the algorithm from prematurely converging to different local optima across multiple runs .
This observation directly aligns with the theoretical analysis in Section 2, where the smoothing mechanism was designed to suppress excessive pheromone concentration and maintain controlled search diversity.
While GACS showed slightly higher average path lengths in the four specific cases mentioned above, the margins were negligible (e.g., less than 2% in Gr229). The overall results, combining the superior Average Rank of 1.44, the consistent W/T/L records, and the lowest standard deviations, confirm that GACS is not only a high-precision optimizer but also a robust solver capable of delivering stable, high-quality solutions across varying topological environments.
Therefore, the experimental evidence in this section substantiates the claims made in Section 2 regarding the scalability, stability, and efficiency of the proposed GACS framework.
This robustness makes it an ideal candidate for practical engineering applications where consistent performance is as critical as theoretical optimality.
4.4. Optimal Path and Convergence Analysis
The optimization prowess of GACS is visually confirmed through the optimal paths identified for Pr107 and Lin318, as illustrated in Figure 1 and Figure 2, respectively.
For the Pr107 instance (Figure 1), which exhibits a distinct symmetrical cluster distribution, GACS demonstrates a strong ability to partition the search space. The generated path is characterized by high-precision intra-cluster traversal, effectively avoiding the “zigzag” redundancies and crossed edges common in standard ACO variants. By focusing search entropy on the K-nearest neighbors, GACS maintains streamlined connectivity between the dense city groups. Similarly, for the more complex Lin318 grid (Figure 2), the algorithm identifies a globally smooth Hamiltonian cycle without any sub-optimal intersections, showcasing its robustness in handling highly structured point sets.
The dynamic evolution of the optimization process is further analyzed through the convergence trajectories of fitness functions for Eil76, Gr137, Gr202, and Fl417 (Figure 3 and Figure 4). A defining characteristic of GACS is the “stepped” descent pattern observed in all four instances.
As shown in Figure 3, Eil76 (solid red line) undergoes a dramatic breakthrough near the 270th iteration after a period of stagnation. In Figure 4, Gr202 exhibits multiple sharp descents in the late evolutionary stages (between 250 and 450 iterations). These “jumps” provide direct empirical evidence of the efficacy of the multi-level recovery scheme. Unlike traditional algorithms that often stall permanently when the pheromone distribution becomes over-concentrated, the pheromone smoothing mechanism in GACS injects controlled exploration noise, allowing the colony to break free from sub-optimal basins even in the late stages of search . This sustained vitality ensures that the algorithm continues to refine the solution quality long after baseline methods have converged.
4.5. Discussion
The proposed GACS framework provides an effective improvement over classical ACO variants in addressing the efficiency bottlenecks and stagnation traps inherent in traditional ACO for large-scale TSP. The following discussion synthesizes the experimental evidence and theoretical mechanisms.
First, regarding search space compression and scalability, Table 6 demonstrates that as city scale n expands from 50 to 300, the execution time of GACS exhibits a near-linear growth curve, requiring only 129.34s for . This observation is consistent with the theoretical complexity analysis presented in Section II, where the candidate-list mechanism reduces the effective branching factor from n to K. This validates the scientific parsimony of the K-NN candidate-list mechanism. By fixing the decision branching factor to , GACS effectively prunes heuristically inferior edges while retaining the essential topological features required for global optimality. Rather than claiming optimality guarantees, this mechanism provides a practical trade-off between computational efficiency and solution quality. This aligns with the PTAS theoretical foundations established by Arora [15,17] and Chitty [19,21], proving that geometric localization is the key to maintaining computational economy in high-dimensional combinatorial optimization.
Second, the adaptive weighting factor serves as a controlled mechanism to balance exploration and exploitation during the search process. In Case 6 (), GACS secured a best solution of 1370.24, representing a 5.33% improvement over the baseline (Table 4). The piecewise-linear reinforcement defined in Eq. (8) allows for a controlled transition from broad exploration to localized refinement. This design avoids the instability risks associated with aggressive exponential amplification, as discussed in Section II. In contrast, the ACO-GA-H hybrid suffers from severe structural overhead due to the quadratic complexity of genetic operators [23], resulting in a runtime 5.5 times slower than GACS (714.38s) without commensurate accuracy. These results indicate that a lightweight adaptive mechanism can achieve competitive performance without introducing additional algorithmic complexity.
Third, the stagnation recovery dynamics are explicitly captured in the convergence trajectories of Figure 4. The characteristic “stepped” descent observed in the Fl417 instance provides direct empirical evidence of the efficacy of the pheromone smoothing strategy in (10). When the search plateaus, GACS injects controlled entropy to lower probabilistic barriers, facilitating breakthroughs into superior basins of attraction. This behavior is consistent with the theoretical role of smoothing in maintaining diversity, as analyzed in Section II. This behavioral resilience is analogous to the social migration strategies used in ESA [13] and is critical for bypassing the premature convergence risks identified in complex metaheuristic landscapes [14,22].
Finally, the scientific validity and global competitiveness of GACS are confirmed through rigorous statistical cross-validation. Analysis of Table 7 and Table 8 reveals that GACS is not only precise (achieving 0.00% Gap in instances like Lin105 and Pr107) but also remarkably robust. Based on (13), GACS secures a leading Average Rank of 1.44, outperforming DWHO (2.45) and ABCSS (2.80). Furthermore, the Win/Tie/Loss record of 28/1/4 against the nearest competitor (DWHO), coupled with lower standard deviations, systematically demonstrates that the GACS framework provides a robust and competitive solution approach across diverse TSP instances.
It is important to note that this study does not include comparisons with exact solvers such as Concorde or advanced heuristics such as LKH and EAX-GA, which are widely regarded as state-of-the-art for achieving near-optimal or optimal solutions. The primary objective of this work is not to compete with these highly specialized solvers, but to develop a lightweight and adaptable ACO-based framework that balances computational efficiency, solution quality, and robustness. Therefore, GACS should be interpreted as a complementary approach within the class of metaheuristic methods rather than a replacement for exact or heavily engineered state-of-the-art solvers.
4.6. Limitations and Future Work
While GACS demonstrates competitive performance on standard benchmarks, its transition to real-world industrial applications reveals several limitations that warrant further investigation.
Environmental Dynamics and Multi-dimensionality: The current GACS framework operates under static Euclidean assumptions. However, real-world logistics [22] and autonomous vehicle navigation [25] involve time-varying city coordinates and 3D obstacle constraints. As discussed in Section II, although the candidate-list mechanism relies only on rank-ordered distance information and can be extended to non-Euclidean or asymmetric distance matrices, the current implementation does not explicitly address such scenarios. Developing a mechanism to leverage existing pheromone distributions for rapid path reconfiguration in dynamic environments remains a primary challenge. In particular, incorporating event-triggered updates or incremental warm-start strategies for handling time-varying cost functions represents an important direction for improving adaptability.
Synergy through Multi-algorithm Fusion: Recent work in the field of robotic path planning has demonstrated the potential of coupling ACO with other optimization strategies to balance exploration in obstacle-rich terrains. Such research validates the feasibility of cross-algorithm operator fusion, providing a roadmap for future GACS enhancements. We intend to explore the integration of GACS with rapid sampling-based algorithms such as RRT* [26] to improve search breadth in constrained 3D spaces. Such hybridization may further enhance performance in complex environments where purely pheromone-driven search is insufficient.
Intelligent Parameter Autonomy: Currently, GACS relies on expert-defined parameters (Table 2). As highlighted in the reviews by Li et al. [18] and Pungkasanti et al. , the future of combinatorial optimization lies in “self-evolving” heuristics. Integrating DRL or Graph Neural Networks (GNN) to adaptively calibrate pheromone update rates and weighting curves according to specific instance features will be the final step toward a fully autonomous intelligent optimizer. In addition, adaptive control of stagnation thresholds (e.g., ) based on problem scale or search state may further improve robustness, addressing the sensitivity concerns discussed by the reviewers.
For future work, the proposed GACS can be extended to address broader combinatorial optimization and scheduling problems beyond the Traveling Salesman Problem. Inspired by the advanced metaheuristic applications in system-level test scheduling and time minimization, as well as hybrid optimization frameworks for network-on-chip scheduling, we plan to integrate the adaptive mechanisms and scalability advantages of GACS with state-of-the-art hybrid intelligent algorithms. This extension will explore the applicability of GACS in industrial scheduling, system-on-chip (SoC) test optimization, and network-on-chip (NoC) resource allocation, aiming to enhance solution quality and computational efficiency for large-scale, complex engineering optimization scenarios. Furthermore, we will investigate the hybridization of GACS with other swarm intelligence paradigms to develop more versatile optimizers for NP-hard scheduling and routing problems.
5. Conclusions
In this research, we developed and validated the GACS, an enhanced bio-inspired metaheuristic specifically engineered to address the stagnation and efficiency bottlenecks inherent in traditional ant colony optimization frameworks. Rather than claiming a paradigm shift, the proposed method aims to provide an effective trade-off between computational efficiency and solution robustness. By re-engineering pheromone dynamics and search space structures, the proposed algorithm achieves high-precision convergence without the prohibitive computational overhead typical of heavy hybrid operators.
The core findings of this study highlight several critical advancements in algorithmic design. Regarding efficiency and scalability, the implementation of K-nearest neighbor candidate-list pruning successfully mitigates the branching factor of the search tree. This mechanism is theoretically supported by the complexity analysis in Section 2, where the solution construction process is reduced from to under fixed K. This allows the algorithm to maintain a near-baseline execution speed even in high-dimensional environments, effectively decoupling solution quality from computational complexity. Furthermore, the synergy between global-adaptive weighting and multi-level stagnation recovery provides the system with a unique stepped descent convergence characteristic. Although no formal convergence proof is provided, the empirical convergence trajectories and statistical stability results offer consistent evidence of reliable search behavior. This enables the colony to break free from sub-optimal basins in late evolutionary stages, ensuring breakthrough precision in mid-to-large scale instances. The systemic robustness of the mechanism is also confirmed through extensive comparative analysis. Compared to contemporary state-of-the-art methods, the proposed approach yields significantly lower standard deviations and higher success rates across diverse topological distributions, as evidenced by its superior win-tie-loss record and average ranking.
In addition, comparisons with specialized solvers such as LKH, Concorde, and EAX-GA indicate that GACS maintains a relatively small optimality gap on standard TSPLIB instances, while preserving a lightweight and generalizable structure. This further supports the positioning of GACS as a scalable metaheuristic framework rather than a replacement for highly optimized exact or hybrid solvers.
While the proposed framework demonstrates exceptional performance in solving the Euclidean TSP, its current implementation is primarily focused on static environments. Future research will explore the extension of this architecture into multi-dimensional and dynamic domains, such as three-dimensional UAV path planning and time-varying logistics constraints. The fundamental principles of adaptive reinforcement and search space pruning established in this work provide a versatile foundation for addressing next-generation optimization challenges in increasingly complex industrial landscapes.
Author Contributions
Conceptualization, S.W. and Y.Z.; methodology, S.W.; software, S.W.; validation, S.W., Y.Z. and L.L.; formal analysis, S.W.; investigation, S.W.; resources, S.W.; data curation, S.W.; writing—original draft preparation, S.W.; writing—review and editing, Y.Z. and L.L.; visualization, S.W.; supervision, Y.Z.; project administration, S.W. All authors have read and agreed to the published version of the manuscript.
Funding
This research was supported by the Beijing Polytechnic University Young Top Talent Program (Grant No. 2023R004-JFQB, Principal Investigator: Shang Wang).
Institutional Review Board Statement
Not applicable.
Informed Consent Statement
Not applicable.
Data Availability Statement
The data presented in this study are available in the article.
Acknowledgments
The authors thank the anonymous reviewers for their constructive comments.
Conflicts of Interest
The authors declare no conflicts of interest.
References
- Liang, H.; Wang, S.; Li, H.; Zhou, L.; Zhang, X.; Wang, S. BiGNN: Bipartite graph neural network with attention mechanism for solving multiple traveling salesman problems in urban logistics. Int. J. Appl. Earth Obs. Geoinf. 2024, 128, 103863. [Google Scholar] [CrossRef]
- Fu, J.; Sun, G.; Liu, J.; Yao, W.; Wu, L. On hierarchical multi-UAV Dubins traveling salesman problem paths in a complex obstacle environment. IEEE Trans. Cybern. 2024, 54, 123–135. [Google Scholar] [CrossRef] [PubMed]
- Bulbul, K.G.; Kasimbeyli, R. A new mathematical model and solution method for the asymmetric traveling salesman problem with replenishment arcs. Appl. Math. Comput. 2025, 494, 129104. [Google Scholar] [CrossRef]
- Jedrzejowicz, P.; Skakovski, A.; Budniak, M. An efficient hybrid evolutionary algorithm for solving the traveling salesman problem. Procedia Comput. Sci. 2024, 246, 3566–3574. [Google Scholar] [CrossRef]
- Alanzi, E.; Menai, M.E.B. Solving the traveling salesman problem with machine learning: A review of recent advances and challenges. Artif. Intell. Rev. 2025, 58, 267. [Google Scholar] [CrossRef]
- Helsgaun, K. An effective implementation of the Lin–Kernighan traveling salesman heuristic. Eur. J. Oper. Res. 2000, 126, 106–130. [Google Scholar] [CrossRef]
- Zheng, J.; He, K.; Zhou, J.; Jin, Y.; Li, C.M. Combining reinforcement learning with Lin-Kernighan-Helsgaun algorithm for the traveling salesman problem. In Proceedings of the 35th AAAI Conference on Artificial Intelligence (AAAI), Virtual, 2–9 February 2021; Volume 35, pp. 12445–12452. [Google Scholar] [CrossRef]
- Applegate, D.L.; Bixby, R.E.; Chvátal, V.; Cook, W.J. The Traveling Salesman Problem: A Computational Study; Princeton University Press: Princeton, NJ, USA, 2006. [Google Scholar]
- Applegate, D.L.; Cook, W.; Rohe, A. Chained Lin-Kernighan for large traveling salesman problems. Inf. J. Comput. 2003, 15, 82–92. [Google Scholar] [CrossRef]
- Nagata, Y.; Kobayashi, S. A powerful genetic algorithm using edge assembly crossover for the traveling salesman problem. Inf. J. Comput. 2013, 25, 346–363. [Google Scholar] [CrossRef]
- Madaan, V.; Sharma, N. Solving traveling salesman problem using ant colony optimization algorithm. In Proceedings of the 12th International Conference on Internet of Everything, Microwave, Embedded, Communication and Networks (IEMECON), Jaipur, India, 22–24 February 2024; IEEE: Piscataway, NJ, USA, 2024; pp. 1–6. [Google Scholar] [CrossRef]
- Priyadarshi, R.; Kumar, R.R. Evolution of swarm intelligence: A systematic review of particle swarm and ant colony optimization approaches in modern research. Arch. Comput. Methods Eng. 2025, 32, 3609–3650. [Google Scholar] [CrossRef]
- Deb, S.; Fong, S.; Tian, Z.; Wong, J.K.F. Finding approximate solutions of NP-hard optimization and TSP problems using elephant search algorithm. J. Supercomput. 2016, 72, 3960–3992. [Google Scholar] [CrossRef]
- Hidalgo-Herrero, M.; Rabanal, P.; Rodríguez, I.; Rubio, F. Comparing problem solving strategies for NP-hard optimization problems. Fundam. Inform. 2013, 124, 1–25. [Google Scholar] [CrossRef]
- Arora, S. Polynomial time approximation schemes for Euclidean TSP and other geometric problems. In Proceedings of the 37th Annual Symposium on Foundations of Computer Science, Burlington, VT, USA, 14–16 October 1996; IEEE Computer Society: Washington, DC, USA, 1996; pp. 2–11. [Google Scholar] [CrossRef]
- Arora, S. Approximation schemes for NP-hard geometric optimization problems: A survey. Math. Program. Ser. B 2003, 97, 43–69. [Google Scholar] [CrossRef]
- Arora, S. Nearly linear time approximation schemes for Euclidean TSP and other geometric problems. In Proceedings of the 38th Annual Symposium on Foundations of Computer Science, Miami Beach, FL, USA, 20–22 October 1997; IEEE Computer Society: Washington, DC, USA, 1997; pp. 554–563. [Google Scholar] [CrossRef]
- Li, S.; Ma, H.; Wang, Z.; Zhang, X. A survey of machine learning approaches to solving NP-hard problems. Int. J. Comput. Sci. Math. 2025, 22, 1–31. [Google Scholar] [CrossRef]
- Chitty, D.M. Applying ACO to large scale TSP instances. In Advances in Computational Intelligence Systems (UKCI); Advances in Intelligent Systems and Computing; Springer: Cham, Switzerland, 2018; Volume 650, pp. 104–118. [Google Scholar] [CrossRef]
- Peake, J.; Amos, M.; Yiapanis, P.; Lloyd, H. Scaling techniques for parallel ant colony optimization on large problem instances. In Proceedings of the Genetic and Evolutionary Computation Conference (GECCO), Prague, Czech Republic, 13–17 July 2019; ACM: New York, NY, USA, 2019; pp. 47–54. [Google Scholar] [CrossRef]
- Chitty, D.M.; Wanner, E.; Parmar, R.; Lewis, P.R. Scaling ACO to large-scale vehicle fleet optimisation via partial-ACO. In Proceedings of the Genetic and Evolutionary Computation Conference Companion (GECCO), Prague, Czech Republic, 13–17 July 2019; ACM: New York, NY, USA, 2019; pp. 97–98. [Google Scholar] [CrossRef]
- Stodola, P.; Michenka, K.; Nohel, J.; Rybanský, M. Hybrid algorithm based on ant colony optimization and simulated annealing applied to the dynamic traveling salesman problem. Entropy 2020, 22, 884. [Google Scholar] [CrossRef] [PubMed]
- Deb, K.; Pratap, A.; Agarwal, S.; Meyarivan, T. A fast and elitist multiobjective genetic algorithm: NSGA-II. IEEE Trans. Evol. Comput. 2002, 6, 182–197. [Google Scholar] [CrossRef]
- Elcock, J.; Edward, N. An efficient ACO-based algorithm for task scheduling in heterogeneous multiprocessing environments. Array 2023, 17, 100280. [Google Scholar] [CrossRef]
- Châari, I.; Koubâa, A.; Trigui, S.; Bennaceur, H.; Ammar, A.; Al-Shalfan, K. SmartPATH: An efficient hybrid ACO-GA algorithm for solving the global path planning problem of mobile robots. Int. J. Adv. Robot. Syst. 2014, 11, 105. [Google Scholar] [CrossRef]
- Wu, D.; Du, K.Y. A hybrid optimization algorithm of ACO and RRT for solving mobile robot path planning. Meas. Sci. Technol. 2025, 36, 076215. [Google Scholar] [CrossRef]
- Khan, I.; Maiti, M.K. A swap sequence based artificial bee colony algorithm for traveling salesman problem. Swarm Evol. Comput. 2019, 44, 428–438. [Google Scholar] [CrossRef]
- Akhand, M.A.H.; Ayon, S.I.; Shahriyar, S.A.; Siddique, N.; Adeli, H. Discrete spider monkey optimization for travelling salesman problem. Appl. Soft Comput. 2020, 86, 105887. [Google Scholar] [CrossRef]
- Cai, Y.; Fang, C.; Wu, Y.; Chen, H. Discrete wild horse optimizer for TSP. J. Comput. Eng. Appl. 2024, 60, 1–10. [Google Scholar] [CrossRef]
- Wang, B.; Duan, D.T.; Yang, Q.; Zhao, X.Y.; Li, T.; Liu, D. Adaptive ant selection for pheromone update in ant colony optimization. In Proceedings of the IEEE International Conference on Systems, Man, and Cybernetics (SMC), Kuching, Malaysia, 6–9 October 2024; IEEE: Piscataway, NJ, USA, 2024; pp. 667–672. [Google Scholar] [CrossRef]
Figure 1.
Optimal path for TSPLIB Pr107 identified by GACS (distance 44301.68).
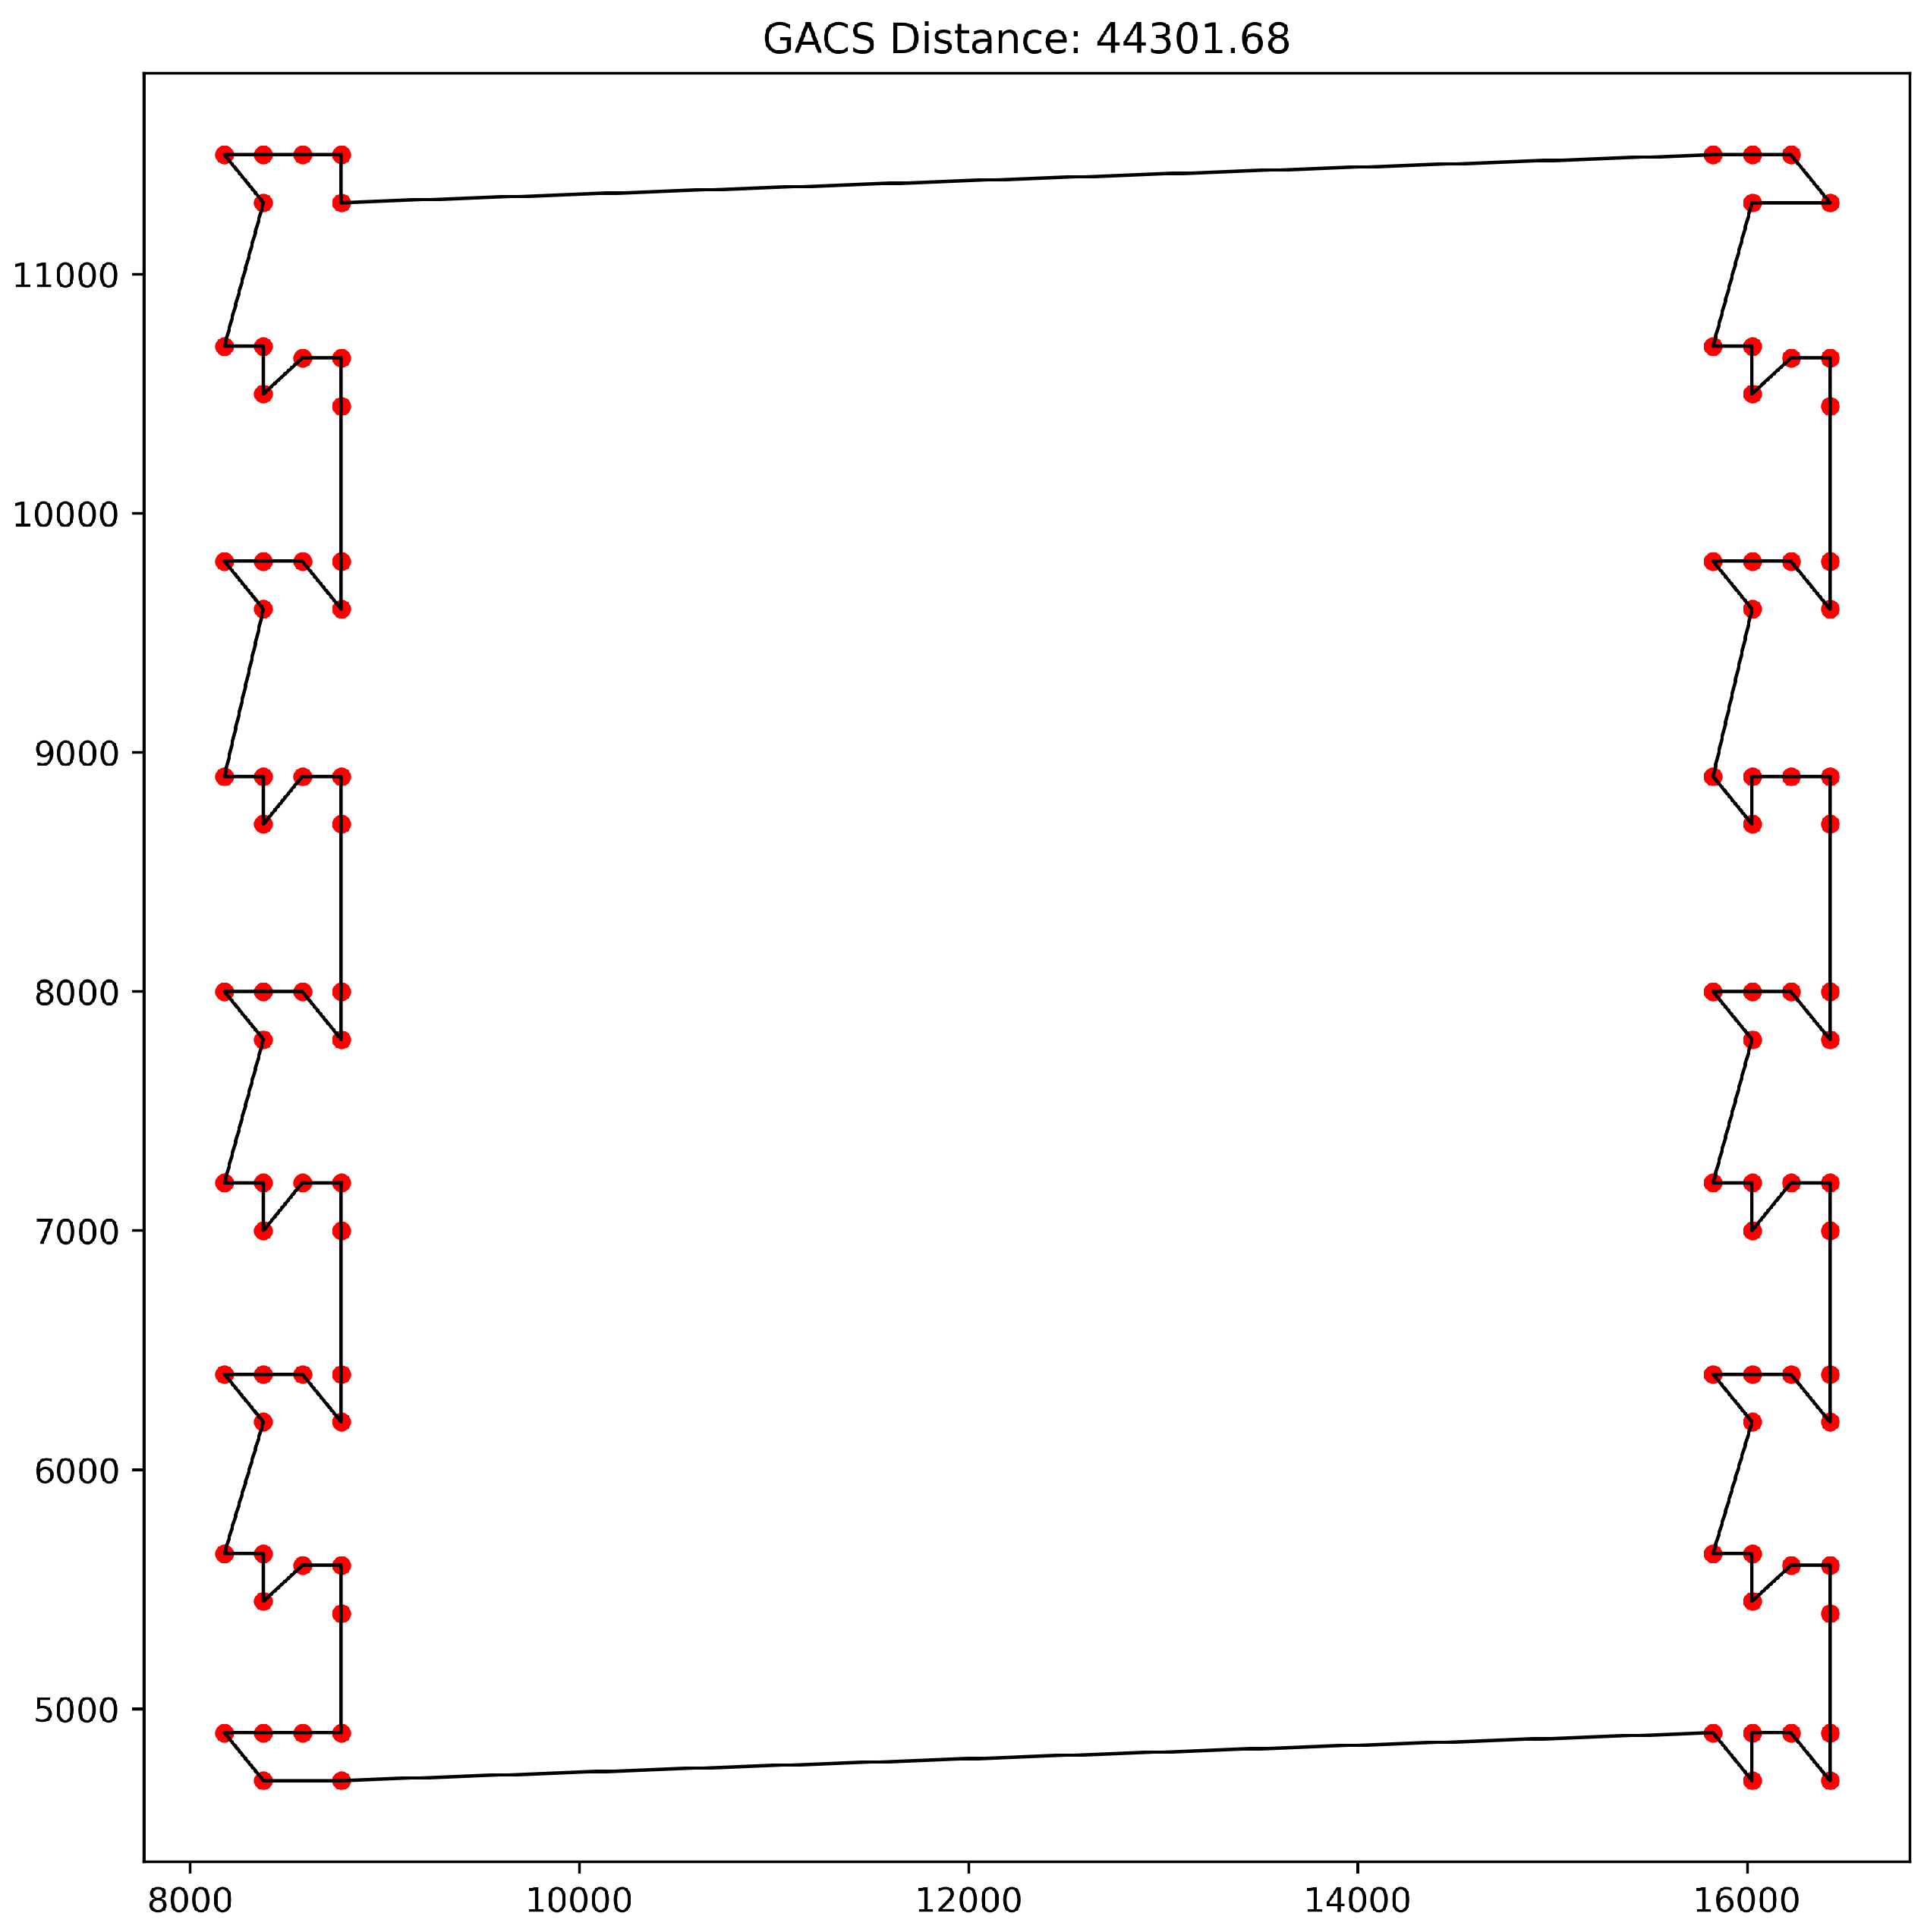
Figure 2.
Optimal path for TSPLIB Lin318 identified by GACS (distance 43139.72).
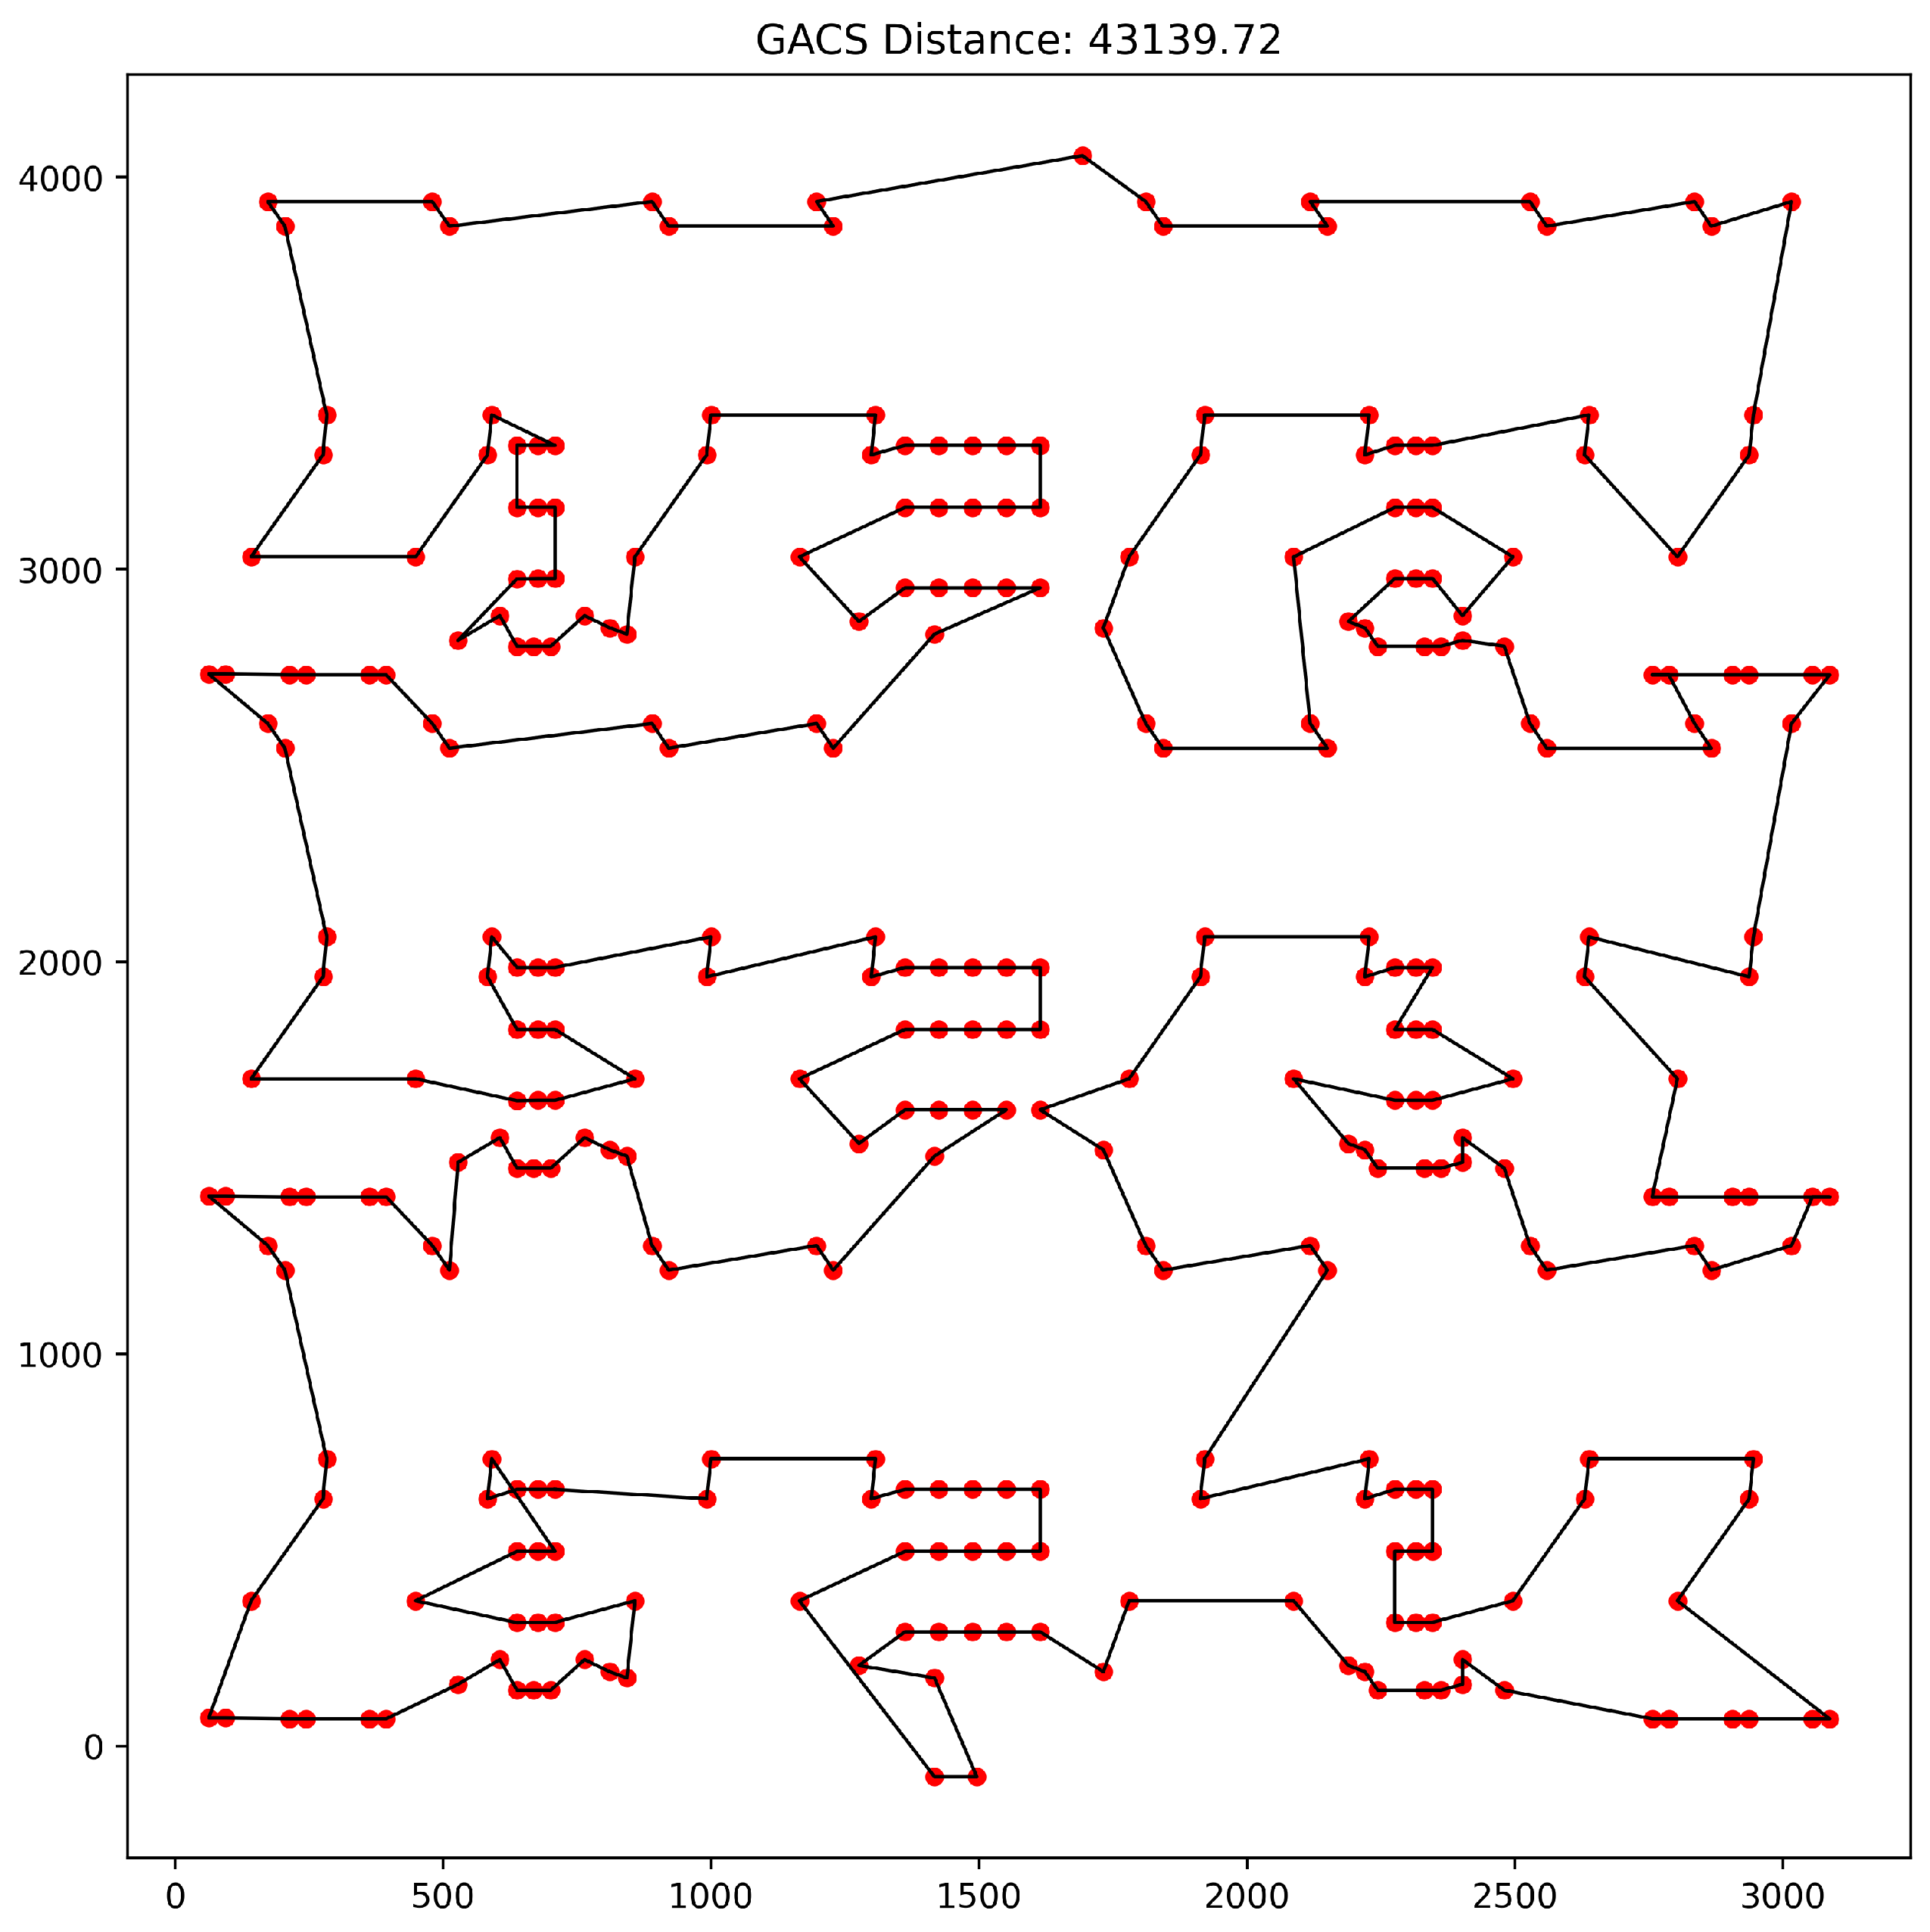
Figure 3.
Convergence curves for TSPLIB Eil76 (left axis) and Gr137 (right axis).
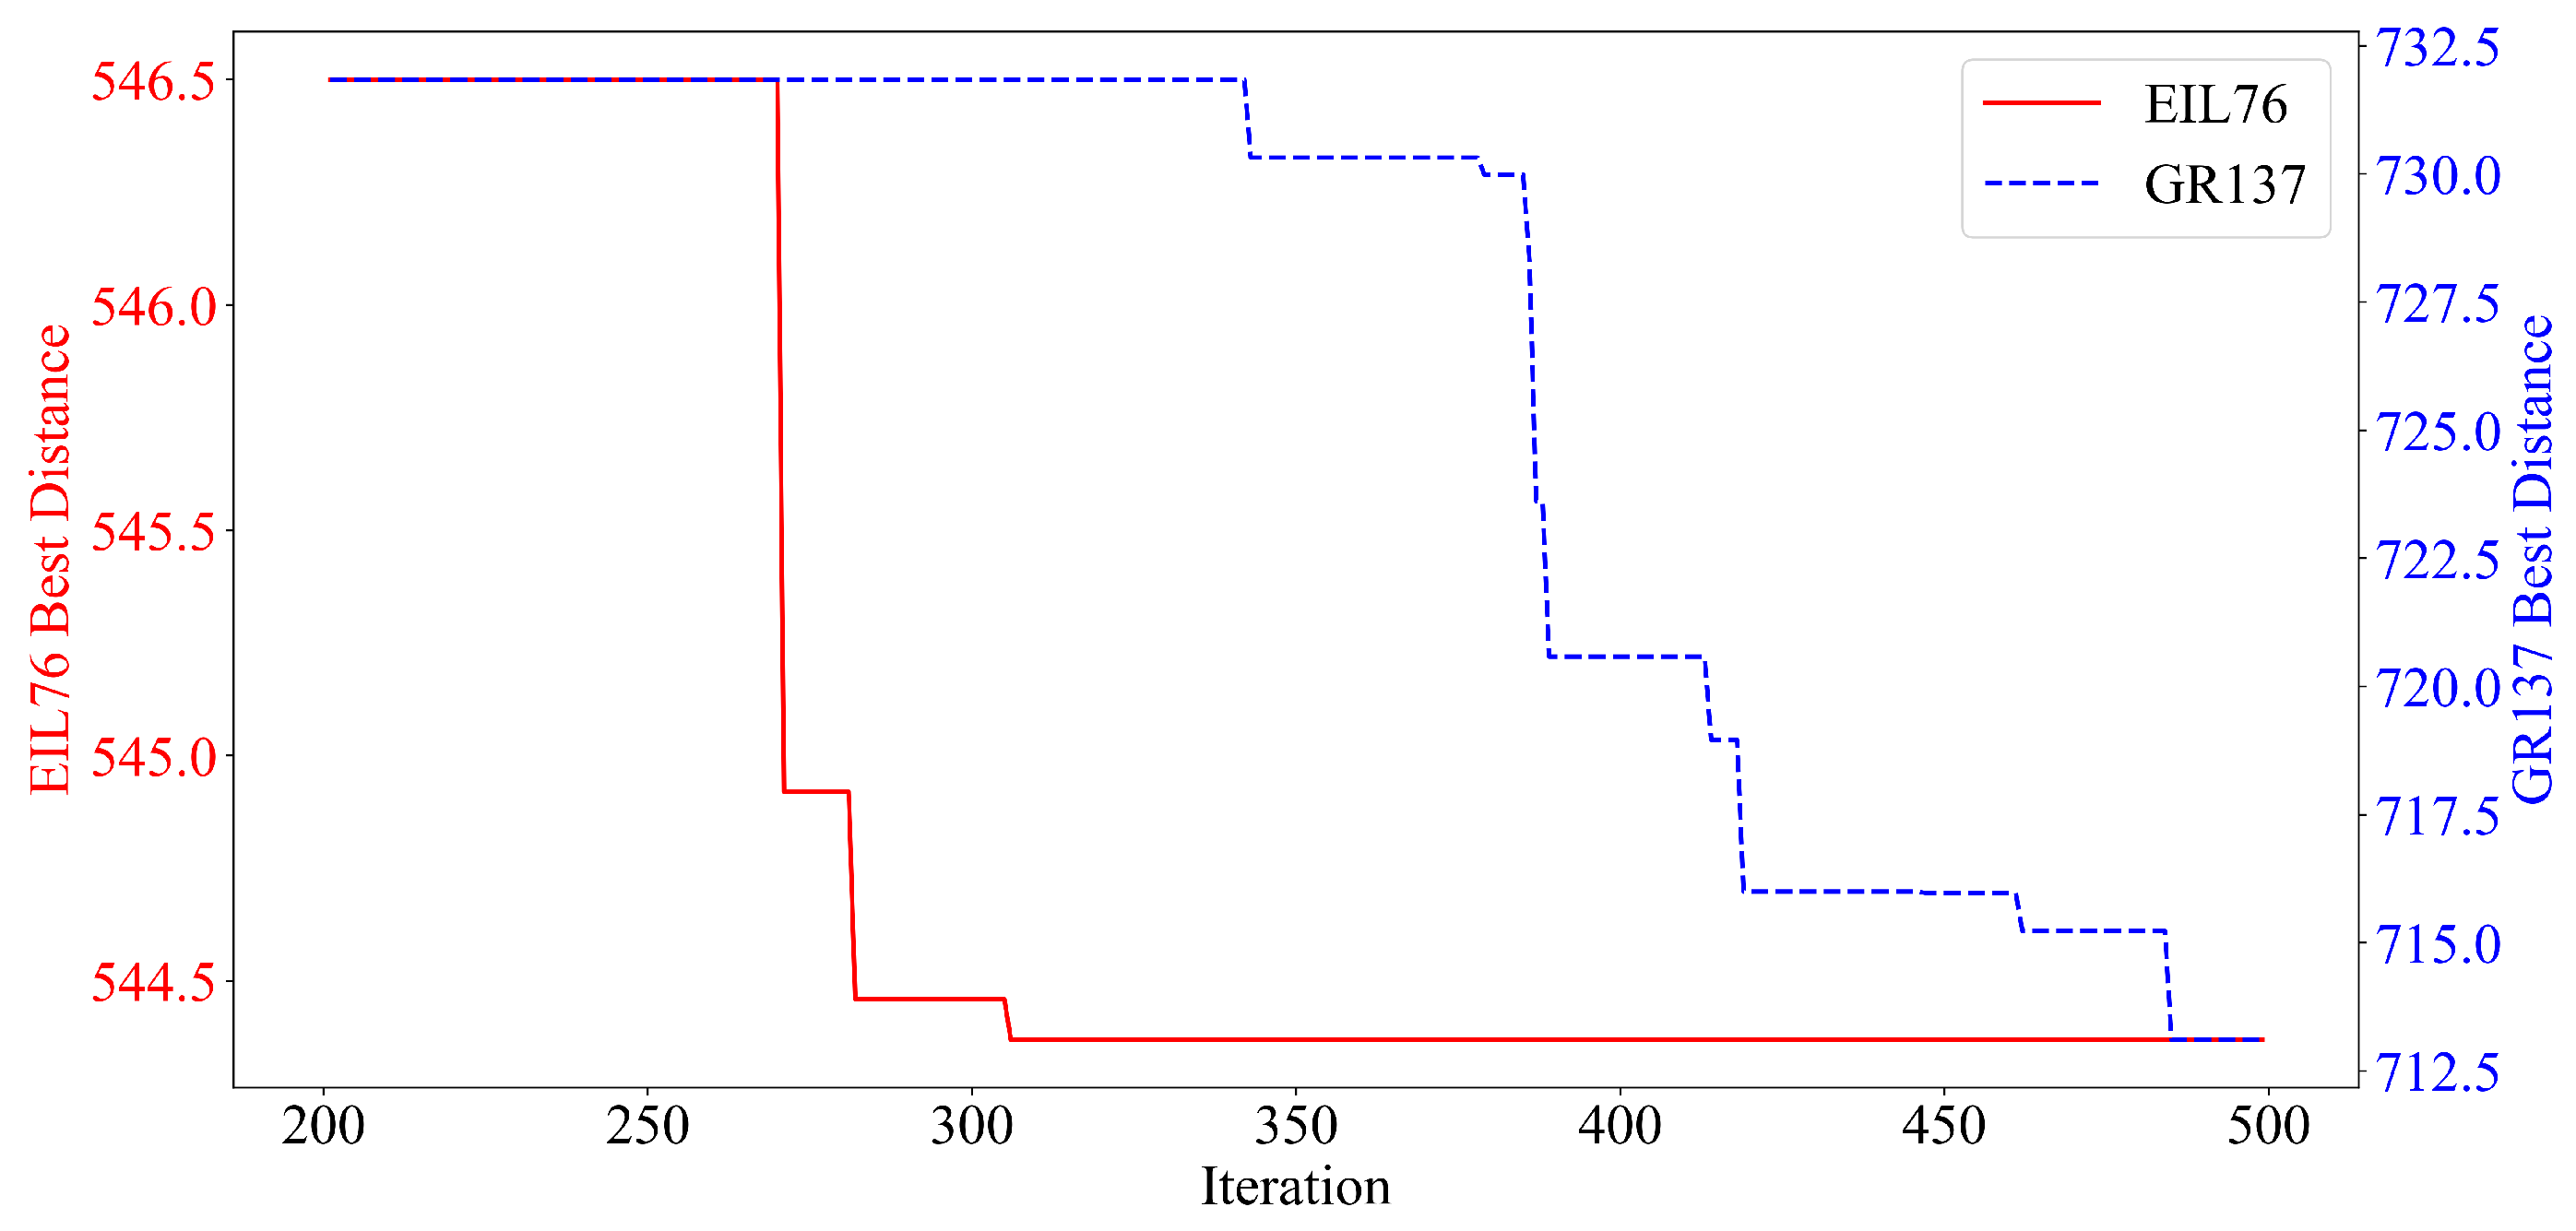
Figure 4.
Convergence curves for TSPLIB Gr202 (left axis) and Fl417 (right axis).
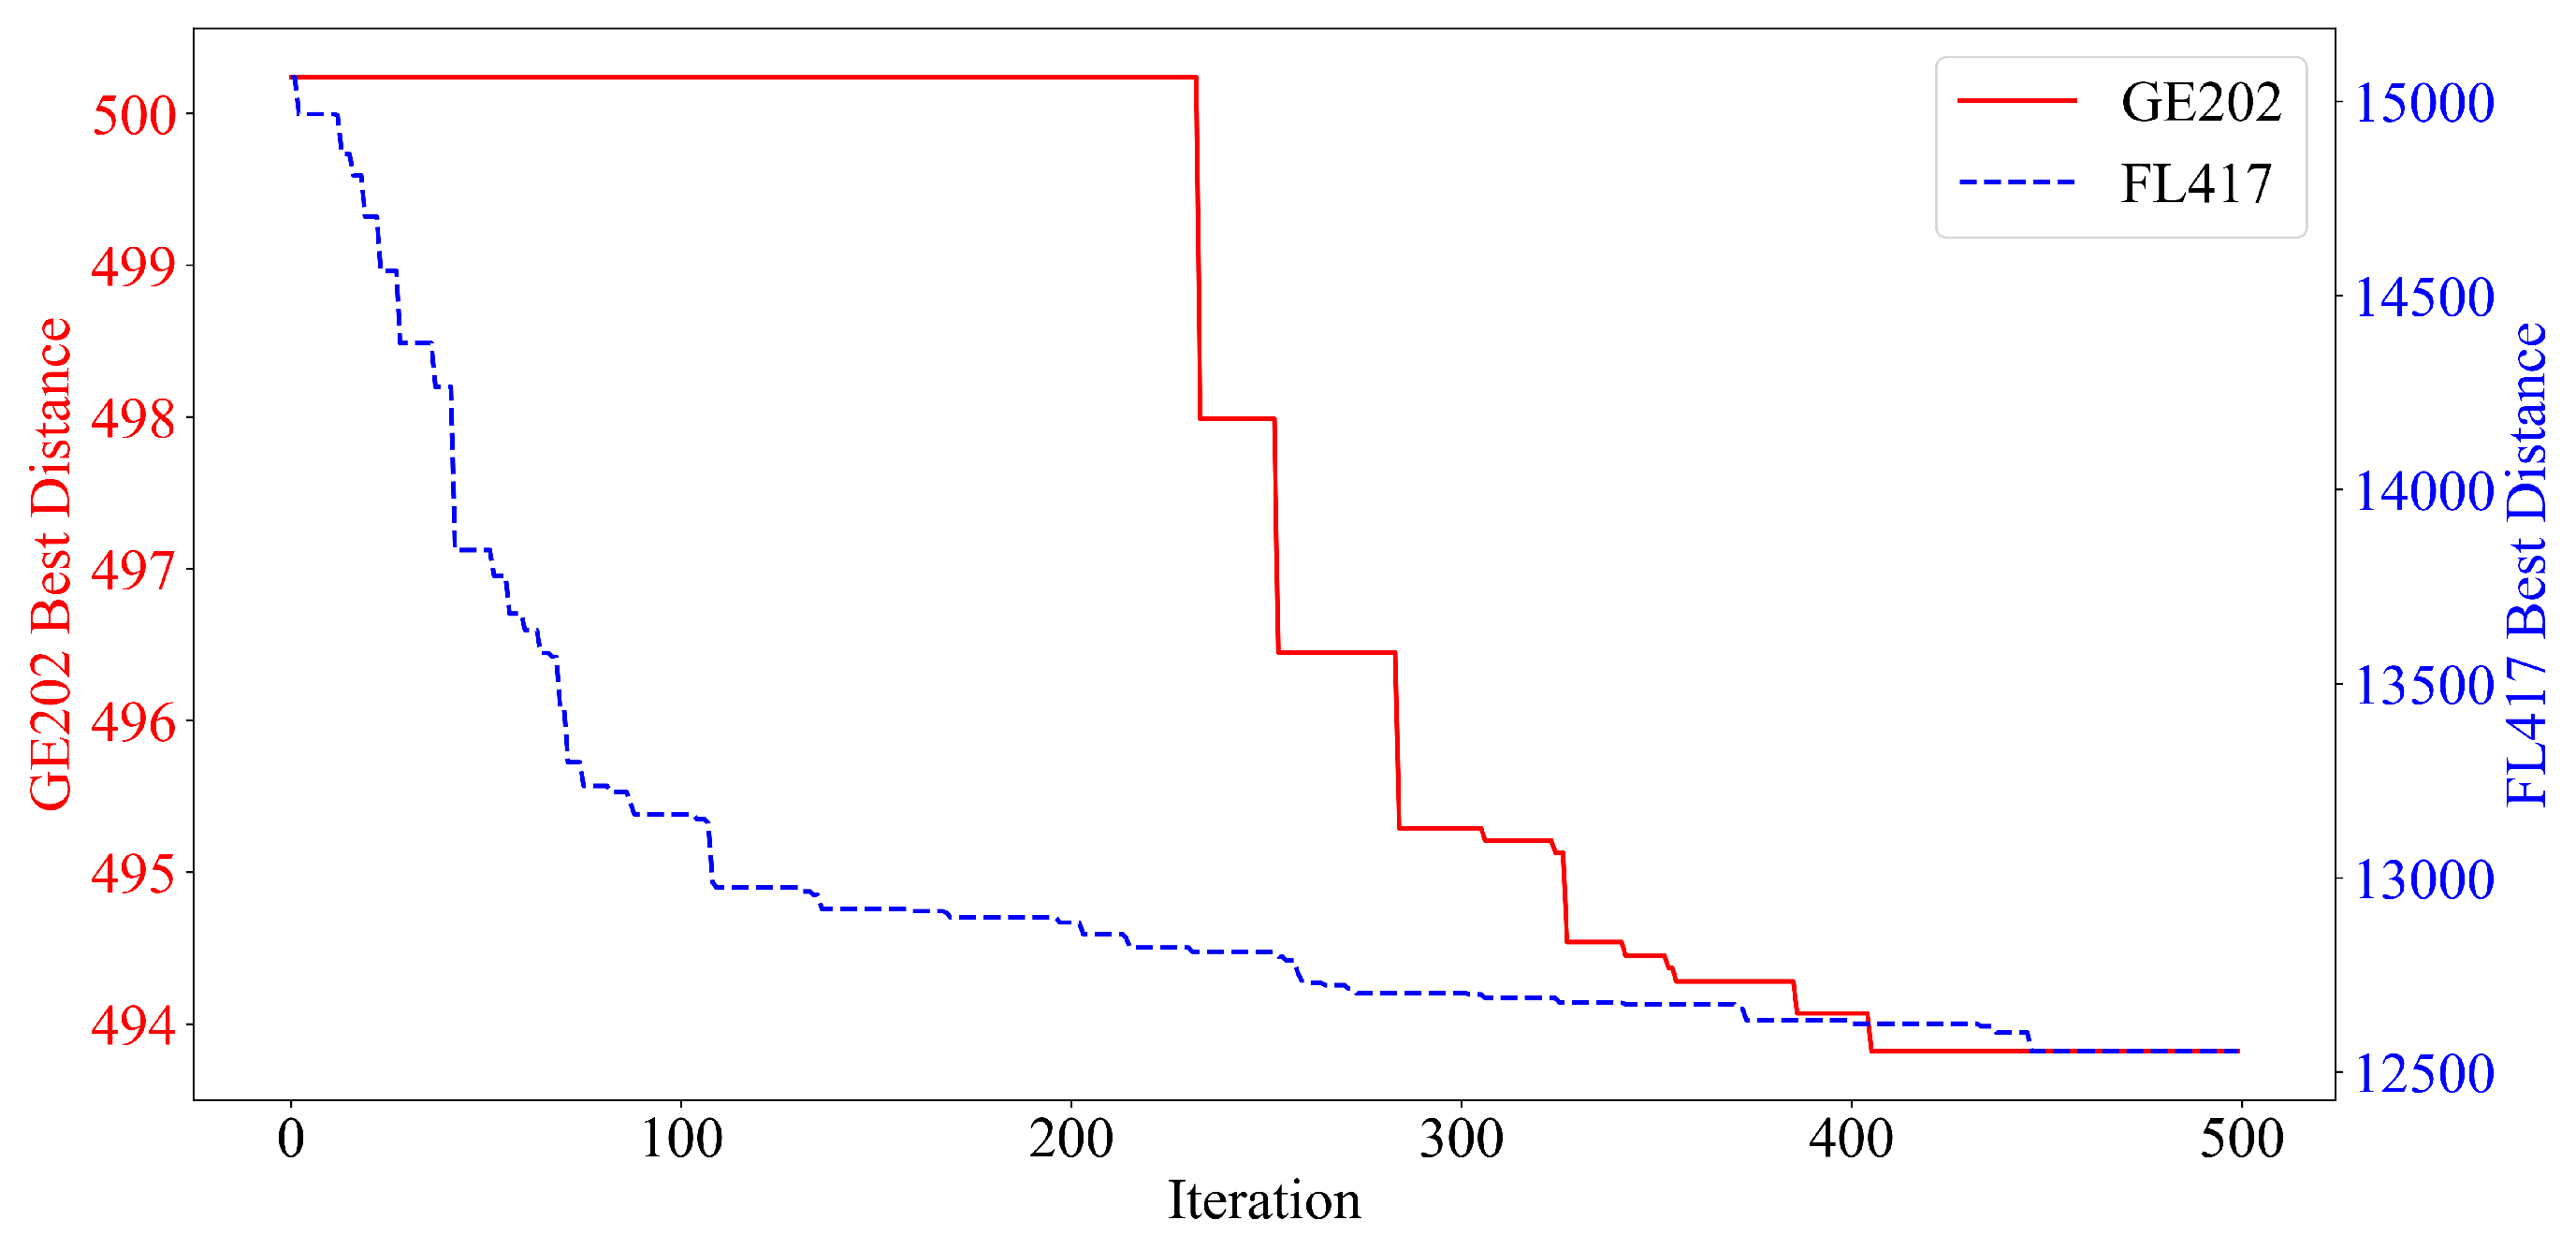

Table 1.
Per-iteration time complexity comparison between C-ACO and the proposed GACS algorithm.
| Operation | C-ACO | GACS |
|---|---|---|
| Tour Construction (per ant) | ||
| Tour Construction (m ants) | ||
| Pheromone Evaporation | ||
| Pheromone Deposit (global best) | ||
| Stagnation Recovery | Not applicable | (conditional) |
| Total per Iteration | ||
| Effective (fixed ) | (dominated by construction) |
Table 2.
Algorithmic parameter configurations for C-ACO, ACO-GA-H, and GACS.
| Algorithm | Parameter Description | Value |
|---|---|---|
| Common | Max Iterations () / Runs / Ants (m) | 200 / 20 / 50 |
| Pheromone weight () / Heuristic weight () | 1.0 / 5.0 | |
| C-ACO | Evaporation rate () / Pheromone constant (Q) | 0.6 / 20 |
| ACO-GA-H | Evaporation rate () / Pheromone constant (Q) | 0.6 / 20 |
| GA Population / Generations / Mutation rate | 40 / 20 / 0.3 | |
| GACS | Evaporation rate () / Candidate list (K) | 0.1 / 15 |
| Adaptive range [] | [0.0, 2.0] |
Table 3.
Comparison of mean path length and standard deviation (shown in parentheses) on synthetic data.
Table 3.
Comparison of mean path length and standard deviation (shown in parentheses) on synthetic data.
| ID | City Size | C-ACO | ACO-GA-H | GACS | (%) | (%) |
|---|---|---|---|---|---|---|
| 1 | 50 | 627.95 (5.93) | 621.18 (4.03) | 610.74 (2.55) | 2.74 | 1.68 |
| 2 | 75 | 753.06 (6.30) | 750.36 (4.56) | 722.98 (9.71) | 3.99 | 3.65 |
| 3 | 100 | 772.01 (5.88) | 770.40 (8.19) | 752.70 (6.76) | 2.50 | 2.30 |
| 4 | 125 | 957.71 (6.51) | 954.07 (9.59) | 918.05 (10.32) | 4.14 | 3.78 |
| 5 | 150 | 1026.66 (9.44) | 1024.55 (8.94) | 975.59 (11.80) | 4.97 | 4.78 |
| 6 | 300 | 1473.80 (14.47) | 1471.29 (17.94) | 1408.29 (26.71) | 4.44 | 4.28 |
Table 4.
Comparison of the best solutions found on synthetic data.
| ID | City Size | C-ACO | ACO-GA-H | GACS | (%) | (%) |
|---|---|---|---|---|---|---|
| 1 | 50 | 619.40 | 612.84 | 606.17 | 2.14 | 1.09 |
| 2 | 75 | 741.58 | 741.58 | 710.48 | 4.19 | 4.19 |
| 3 | 100 | 761.15 | 759.50 | 747.05 | 1.85 | 1.64 |
| 4 | 125 | 941.16 | 939.06 | 900.87 | 4.28 | 4.07 |
| 5 | 150 | 1006.52 | 1001.29 | 958.67 | 4.75 | 4.26 |
| 6 | 300 | 1447.40 | 1437.84 | 1370.24 | 5.33 | 4.70 |
Table 5.
Wilcoxon signed-rank test results for the different algorithms ( runs per instance).
| TSP Instance | Comparison | Wilcoxon W | p-value | Rank-Biserial | Significance |
|---|---|---|---|---|---|
| 1 | GACS vs C-ACO | 0.0 | 1.0000 | *** | |
| 1 | GACS vs ACO-GA-H | 0.0 | 1.0000 | *** | |
| 2 | GACS vs C-ACO | 0.0 | 1.0000 | *** | |
| 2 | GACS vs ACO-GA-H | 0.0 | 1.0000 | *** | |
| 3 | GACS vs C-ACO | 2.0 | 0.9810 | *** | |
| 3 | GACS vs ACO-GA-H | 3.0 | 0.9714 | *** | |
| 4 | GACS vs C-ACO | 0.0 | 1.0000 | *** | |
| 4 | GACS vs ACO-GA-H | 0.0 | 1.0000 | *** | |
| 5 | GACS vs C-ACO | 0.0 | 1.0000 | *** | |
| 5 | GACS vs ACO-GA-H | 0.0 | 1.0000 | *** | |
| 6 | GACS vs C-ACO | 1.0 | 0.9905 | *** | |
| 6 | GACS vs ACO-GA-H | 0.0 | 1.0000 | *** |
Note: rrb = rank-biserial correlation effect size. Significance (one-tailed, GACS < Baseline): *** p < 0.001. All p-values pass the Bonferroni-corrected threshold (α* = 0.0042).
Table 6.
Comparison of average computational time (seconds).
| City Size | C-ACO | ACO-GA-H | GACS |
|---|---|---|---|
| 50 | 16.61 | 33.92 | 21.07 |
| 75 | 26.78 | 59.56 | 32.12 |
| 100 | 37.14 | 98.99 | 46.47 |
| 125 | 43.93 | 144.66 | 55.45 |
| 150 | 55.50 | 198.77 | 64.31 |
| 300 | 120.47 | 714.38 | 129.34 |
Table 7.
Comparison of optimization results on TSPLIB instances among ABCSS, DSMO, DWHO, and the proposed GACS algorithm.
Table 7.
Comparison of optimization results on TSPLIB instances among ABCSS, DSMO, DWHO, and the proposed GACS algorithm.
| ID | CASE | BKS | ABCSS | DSMO | DWHO | GACS | |
|---|---|---|---|---|---|---|---|
| 1 | Burma14 | 30.87 | 30.87 | 30.87 | 30.87 | 30.87 | 0.00% |
| 2 | Ulysses16 | 73.99 | 73.99 | 73.99 | 73.99 | 73.99 | 0.00% |
| 3 | Ulysses22 | 75.31 | 75.31 | 75.31 | 75.31 | 75.31 | 0.00% |
| 4 | Eil51 | 426 | 428.98 | 428.86 | 428.87 | 428.87 | 0.67% |
| 5 | Berlin52 | 7542 | 7544.37 | 7544.37 | 7544.37 | 7544.37 | 0.03% |
| 6 | St70 | 675 | 682.57 | 677.11 | 677.11 | 677.11 | 0.31% |
| 7 | Eil76 | 538 | 550.24 | 558.68 | 544.37 | 544.37 | 1.18% |
| 8 | Pr76 | 108159 | 108879.7 | 108159.4 | 108159.4 | 109692.09 | 1.42% |
| 9 | Gr96 | 511.4 | 512.2 | 518.38 | 511.4 | 512.2 | 0.16% |
| 10 | KroA100 | 21282 | 21299 | 21298.21 | 21285.44 | 21294.4 | 0.06% |
| 11 | KroB100 | 22141 | 22229.71 | 22308 | 22244.83 | 22183.6 | 0.19% |
| 12 | KroC100 | 20749 | / | / | 20750.76 | 20750.76 | 0.01% |
| 13 | Rd100 | 7910 | 7944.32 | 8041.3 | 7917.38 | 7911.3 | 0.02% |
| 14 | Eil101 | 629 | 646.05 | 648.66 | 647.82 | 646.15 | 2.73% |
| 15 | Lin105 | 14383 | 14406.12 | 14383 | 14472.86 | 14383 | 0.00% |
| 16 | Pr107 | 44301.68 | 44525.68 | 44385.86 | 44480.74 | 44301.68 | 0.00% |
| 17 | Pr124 | 59030 | 59030.74 | 60285.21 | 59030.74 | 59086.81 | 0.10% |
| 18 | Pr136 | 96772 | 97853.91 | 97538.68 | 98418.28 | 97818.2 | 1.08% |
| 19 | Gr137 | 708.79 | 713.91 | 709.48 | 709.11 | 713.11 | 0.61% |
| 20 | KroA150 | 26524 | 26981.98 | 27591.44 | 27158.73 | 26629.78 | 0.40% |
| 21 | KroB150 | 26130 | 26760.79 | 26601.94 | 26629.85 | 26130.76 | 0.003% |
| 22 | Pr152 | 73682 | 74337.62 | 74243.91 | 73821.25 | 73943.9 | 0.36% |
| 23 | D198 | 15780 | 16270.22 | 15978.13 | 15941.5 | 16243.46 | 2.94% |
| 24 | KroA200 | 29368 | 30701.86 | 30481.35 | 30290.53 | 29547.22 | 0.61% |
| 25 | KroB200 | 29437 | 31508.85 | 30716.5 | 30340.1 | 29777.38 | 1.16% |
| 26 | Gr202 | 489 | 507.27 | 501.83 | 496.04 | 493.82 | 0.99% |
| 27 | Tsp225 | 3892.06 | 4140.24 | 4013.68 | 3952.91 | 3895.53 | 0.09% |
| 28 | Pr226 | 80369 | 82266 | 83587.98 | 80733.86 | 80921.08 | 0.69% |
| 29 | Gr229 | 1667.62 | 1713.54 | 1683.45 | 1670.5 | 1710.9 | 2.60% |
| 30 | Gil262 | 2378 | 2526.99 | 2543.15 | 2460.15 | 2415.38 | 1.57% |
| 31 | Pr299 | 48191 | 50265.88 | 50579.82 | 50055.86 | 49275.55 | 2.25% |
| 32 | Lin318 | 42029 | 45135.5 | 44118.66 | 43791.51 | 43139.72 | 2.64% |
| 33 | Fl417 | 11861 | 12356.44 | 12218.98 | 12192.53 | 12553.4 | 5.84% |
Table 8.
Comprehensive performance comparison and Friedman statistical test results.
| ID | Case | ABCSS | DSMO | DWHO | GACS |
|---|---|---|---|---|---|
| 1 | Burma14 | ||||
| 2 | Ulysses16 | ||||
| 3 | Ulysses22 | ||||
| 4 | Eil51 | ||||
| 5 | Berlin52 | ||||
| 6 | St70 | ||||
| 7 | Eil76 | ||||
| 8 | Pr76 | ||||
| 9 | Gr96 | ||||
| 10 | KroA100 | ||||
| 11 | KroB100 | ||||
| 12 | KroC100 | / | / | ||
| 13 | Rd100 | ||||
| 14 | Eil101 | ||||
| 15 | Lin105 | ||||
| 16 | Pr107 | ||||
| 17 | Pr124 | ||||
| 18 | Pr136 | ||||
| 19 | Gr137 | ||||
| 20 | KroA150 | ||||
| 21 | KroB150 | ||||
| 22 | Pr152 | ||||
| 23 | D198 | ||||
| 24 | KroA200 | ||||
| 25 | KroB200 | ||||
| 26 | Gr202 | ||||
| 27 | Tsp225 | ||||
| 28 | Pr226 | ||||
| 29 | Gr229 | ||||
| 30 | Gil262 | ||||
| 31 | Pr299 | ||||
| 32 | Lin318 | ||||
| 33 | Fl417 | ||||
| Comparison (W/T/L) | 25 / 3 / 4 | 27 / 1 / 4 | 28 / 1 / 4 | / | |
| Average Rank | 2.80 | 3.28 | 2.45 | 1.44 | |
| Friedman Test: , (statistically significant difference among algorithms) | |||||
Table 9.
Comparison of GACS with specialized state-of-the-art TSP solvers on selected TSPLIB instances.
Table 9.
Comparison of GACS with specialized state-of-the-art TSP solvers on selected TSPLIB instances.
| TSP Case | BKS | Concorde | LKH | EAX-GA | GACS | GACS Gap (%) |
|---|---|---|---|---|---|---|
| eil51 | 426 | 426 | 426 | 426 | 428.87 | 0.67 |
| berlin52 | 7542 | 7542 | 7542 | 7542 | 7544.37 | 0.03 |
| st70 | 675 | 675 | 675 | 675 | 677.11 | 0.31 |
| eil76 | 538 | 538 | 538 | 538 | 544.37 | 1.18 |
| kroA100 | 21282 | 21282 | 21282 | 21282 | 21294.4 | 0.06 |
| kroC100 | 20749 | 20749 | 20749 | 20749 | 20750.76 | 0.01 |
| rd100 | 7910 | 7910 | 7910 | 7910 | 7911.3 | 0.02 |
| eil101 | 629 | 629 | 629 | 629 | 646.15 | 2.73 |
| kroA150 | 26524 | 26524 | 26524 | 26524 | 26629.78 | 0.40 |
| kroA200 | 29368 | 29368 | 29368 | 29368 | 29547.22 | 0.61 |
| lin318 | 42029 | 42029 | 42029 | 42029 | 43139.72 | 2.64 |
Disclaimer/Publisher’s Note: The statements, opinions and data contained in all publications are solely those of the individual author(s) and contributor(s) and not of MDPI and/or the editor(s). MDPI and/or the editor(s) disclaim responsibility for any injury to people or property resulting from any ideas, methods, instructions or products referred to in the content. |
© 2026 by the authors. Licensee MDPI, Basel, Switzerland. This article is an open access article distributed under the terms and conditions of the Creative Commons Attribution (CC BY) license (http://creativecommons.org/licenses/by/4.0/).
Copyright: This open access article is published under a Creative Commons CC BY 4.0 license, which permit the free download, distribution, and reuse, provided that the author and preprint are cited in any reuse.


