

Submitted:
27 May 2026
Posted:
28 May 2026
You are already at the latest version
Abstract
Antibody glycosylation is a critical quality attribute (CQA) in disease research and quality control of therapeutic antibodies. This study presents a streamlined approach for the direct analysis of N-glycans released from IgG by PNGase F using matrix-assisted laser desorption/ionization time-of-flight mass spectrometry (MALDI-TOF MS) without any prior purification. By utilizing a 1,5-diaminonaphthalene (DAN)/2,5-dihydroxybenzoic acid (DHB) matrix, multiple glycan-derived peaks were selectively detected directly from the protein-rich digestion mixture, demonstrating the superior glycan selectivity of the DAN/DHB system. Furthermore, systematic dilution of the digest was found to significantly enhance the signal-to-noise ratio, enabling the detection of sialylated glycans while simultaneously suppressing the formation of undesirable DAN adducts. Comparative evaluation of three matrices—DAN/DHB, DHB/0.1% TFA, and DHB—across varying IgG concentrations revealed that the DAN/DHB matrix offers the highest sensitivity and robustness for unpurified samples. This novel, purification-free methodology provides a rapid and accessible platform for IgG glycan profiling, significantly reducing the complexity of conventional glycomic workflows.
Keywords:
IgG
; glycosylation
; MALDI
; glycotyping
; N-glycan
; ADCC
; CDC
; galactosylation
; sialylation
; core fucose
1. Introduction
Antibodies are key mediators of the immune response, and in recent years, their functions have been increasingly exploited for the development of antibody-based therapeutics and treatment strategies focusing on immunoglobulin G (IgG) monoclonal antibodies (mAbs) [1,2,3]. The efficacy of such antibodies is based on their antigen specificity and effector functions. Antigen specificity is primarily determined by the amino acid sequence of the variable regions, whereas effector functions are modulated not only by the constant region structure but also by glycosylation as a key post-translational modification (PTM) [4,5].
IgG antibodies possess a pair of conserved N-glycosylation sites at asparagine 297 (Asn297) within the Fc domain [6]. Although these glycans account for only 2–3% of the total antibody mass, their structures have a profound impact on IgG functions [4,5,6]. The Fc region mediates interactions with immune cells and complement proteins, thereby contributing to effector functions such as antibody-dependent cellular cytotoxicity (ADCC) and complement-dependent cytotoxicity (CDC) [4,5]. For example, defucosylated Fc glycans enhance binding affinity to FcγRIIIa, leading to increased ADCC activity [7]. Accordingly, defucosylation is often engineered in therapeutic mAbs to improve ADCC [8]. In addition, galactosylation of Fc glycans promotes binding to complement protein C1q, resulting in enhanced CDC activity [9]. These observations highlight that glycan structures are directly linked to antibody effector functions, making glycan analysis a critical checkpoint for evaluating antibody functionality.
Glycans introduced as PTMs can influence both the immunogenicity and biological activity of antibodies and are therefore regarded as critical quality attributes (CQAs) in the development and quality control of antibody therapeutics [10]. Comprehensive analysis of released glycans using liquid chromatography (LC) is widely employed for glycan profiling and characterization of therapeutic mAbs [11]. While HILIC-UPLC provides high reproducibility and quantitative performance, it requires complex pretreatment involving fluorescent labeling [12]. In addition to LC, structural analysis by mass spectrometry (MS) is also an important approach for CQA assessment [13]. Matrix-assisted laser desorption/ionization time-of-flight mass spectrometry (MALDI-TOF MS) facilitates the simultaneous analysis of heterogeneous IgG glycan structures by predominantly producing singly charged molecular ions, thereby minimizing spectral complexity [14]. However, conventional protocols still necessitate labor-intensive processes to isolate the released glycans from the IgG molecules, digestive enzymes, and buffer components. Recently, we developed a glycan-selective matrix composed of 1,5-diaminonaphthalene (DAN) and 2,5-dihydroxybenzoic acid (DHB) that enables the direct MALDI-TOF MS analysis of N-glycans from intact glycoproteins via in-source decay (ISD) [15]. However, due to the low glycan content of IgG, direct ISD analysis required ultra-high-resolution instrumentation, such as FT-ICR MS, to effectively resolve glycan signals from interfering matrix-derived noise [16]. Notably, this matrix facilitated the selective ionization and rapid characterization of O-antigen repeating structures directly from crude mixtures, such as acid-treated supernatants from a single Gram-negative bacterial colony [17,18]. The ability to identify these complex polysaccharides without prior cleanup suggested the feasibility of simplifying IgG glycan analysis through the direct measurement of enzymatic digests.
In this study, we propose a streamlined and accessible glycan analysis platform that complements existing approaches by enabling the direct analysis of enzymatic digests without prior purification using conventional MALDI-TOF MS. N-glycans were released from IgG antibodies via PNGase F treatment, and the resulting digestion mixture was directly spotted with a matrix for MALDI-TOF MS analysis, allowing for the simultaneous detection of multiple glycan signals. Furthermore, we systematically evaluated various matrices—including DAN/DHB, DHB/0.1% TFA, and DHB—using digestion mixtures at multiple dilution levels. Our results demonstrated that the DAN/DHB matrix significantly enhanced glycan-selective ionization, while optimized dilution of the mixture improved sensitivity and expanded the range of detectable glycan structures. Based on these findings, we established a novel, purification-free MS-based methodology and determined the optimal conditions for comprehensive IgG N-glycan profiling.
2. Materials and Methods
2.1. Reagents
Lyophilized IgG antibody derived from human serum and 1,5-diaminonaphthalene (DAN) were purchased from Sigma-Aldrich (St. Louis, MO, USA). Trifluoroacetic acid (TFA) was purchased from Tokyo Chemical Industry Co., Ltd. (Tokyo, Japan). 2,5-Dihydroxybenzoic acid (DHB), ammonium acetate, and acetonitrile were purchased from Wako Pure Chemical Industries, Ltd. (Osaka, Japan). PNGase F (Glycerol-free) was purchased from New England Biolabs (Ipswich, MA, USA). The water used in this study was prepared using Milli-Q water (Direct-Q 3 UV; Merck Millipore, Tokyo, Japan).
2.2. PNGase F Digestion
Lyophilized IgG antibody (0.5 mg) derived from human serum was dissolved in 98 μL of 5 mM ammonium acetate, and 2 μL of PNGase F (glycerol-free) was added and mixed. The PNGase F reaction mixture was incubated at 37 °C for 24 h. For comparison, the IgG antibody PNGase F digests after incubation were diluted with Milli-Q water at dilution factors of 2×, 5×, 10×, 50×, 100×, 500×, 1000×, and 5000×. All digested solutions were analyzed within 2 h of preparation.
2.3. Matrices
The matrix compositions were adapted from a previously reported method [15]. Stock solutions of 2,5-dihydroxybenzoic acid (500 mM) in acetonitrile/water (9:1, v/v) and 1,5-diaminonaphthalene (50 mM) in acetonitrile/water (5:5, v/v) were prepared, and three types of matrices were prepared using these solutions.
DAN/DHB matrix: 2 μL of DHB (500 mM) in acetonitrile/water (9:1, v/v) and 4 μL of DAN (50 mM) in acetonitrile/water (5:5, v/v) were mixed and diluted to 100 μL with acetonitrile/water (5:5, v/v).
DHB/0.1% TFA matrix: 2 μL of DHB (500 mM) in acetonitrile/water (9:1, v/v) was diluted to 100 μL with acetonitrile/water/trifluoroacetic acid (5:5:0.01, v/v/v).
DHB matrix: 2 μL of DHB (500 mM) in acetonitrile/water (9:1, v/v) was diluted to 100 μL with acetonitrile/water (5:5, v/v).
2.4. MALDI-TOF MS Analysis
A 0.5 μL aliquot of matrix solution was spotted onto a STA μFocus plate (24x16, 700 μm) (Hudson Surface Technology, Inc., Closter, NJ, USA), followed by 0.5 μL of IgG antibody PNGase F digests. The spots were air-dried at room temperature. Mass spectrometry was performed using an ultrafleXtream-DHS 2 TOF/TOF instrument (Bruker, Bremen, Germany) equipped with a 2000 Hz Smartbeam II Nd:YAG UV laser (355 nm), operated by FlexControl 3.4 software (Bruker). All spectra were acquired in positive reflectron mode using the random walk method with 10,000 laser shots. The acquired mass spectra were analyzed using FlexAnalysis 3.4 software (Bruker). Glycan structure diagrams were generated using GlycoWorkbench 2.1 stable build 146 (European Carbohydrates DataBase project http://www.eurocarbdb.org/).
3. Results
3.1. Direct Analysis of IgG Antibody Digests
The initial experiments focused on the direct analysis of IgG enzymatic digests without prior purification. Three different matrices—DAN/DHB, DHB/0.1% TFA, and DHB (0.5 μL each)—were spotted onto the MALDI plate, followed by the addition of 0.5 μL of the unpurified IgG digest. This digest contained N-glycans liberated by PNGase F treatment. A 0.5 μL aliquot of the IgG solution (5 mg/mL) corresponds to approximately 17 pmol of IgG (MW: ca. 150,000). Consequently, the resulting co-crystals on the MALDI plate consisted of the target N-glycans alongside IgG-derived protein backbones and PNGase F-derived proteins.
MALDI-TOF MS analysis demonstrated that no glycan-derived peaks were detectable when using DHB/0.1% TFA or DHB matrices (Figure 1a,b). In stark contrast, four distinct glycan signals were clearly observed with the DAN/DHB matrix (Figure 1c). The majority of the observed m/z values were consistent with those of liberated human IgG N-glycans [19], enabling tentative structural assignment. Based on their m/z values, these peaks were identified as G0F, G0BF, G1F, G1BF, and G2F.
Notably, all detected glycans were observed as sodium cationized molecules [M+Na]+. These sodium ions originated from the 50 mM NaCl present in the commercial PNGase F reagent, resulting in a concentration of approximately 1 mM in the final digestion mixture (0.5 nmol per spot). These results underscore the superior glycan selectivity of the DAN/DHB matrix, which effectively suppresses interference from abundant proteinaceous components and facilitates glycan ionization directly from crude reaction mixtures.
3.2. Direct Analysis of Diluted IgG Antibody Digests
The IgG digests were subsequently diluted with ultrapure water and analyzed using the DAN/DHB matrix across a range of concentrations (Figure 2). Dilution factors ranged from 2× to 5000×, corresponding to IgG amounts per spot of 8.3 pmol, 3.3 pmol, 1.7 pmol, 330 fmol, 170 fmol, 33 fmol, 17 fmol, and 3.3 fmol. Dilution significantly improved the signal-to-noise (S/N) ratio, enabling the detection of 10 N-glycans, which was greater than the number detected under the undiluted condition. The detection limit for glycan analysis with the DAN/DHB matrix was 17 fmol of IgG, at which the three most abundant species (G0F, G1F, and G2F) remained detectable.
Sialylated glycans were also successfully detected under diluted conditions. Ten major glycoforms—G0, G0F, G1, G1F, G2, G0BF, G2F, G1BF, G2BF, and G2BFS—were selected for comparative analysis (Figure 3a). The highest overall S/N ratios were obtained at 1.7 pmol of IgG, where all major peaks exhibited maximum S/N ratios (Figure 3b).
A detailed spectral comparison between 1.7 pmol and 330 fmol of IgG is presented in Figure 3b and Figure 3c. At 1.7 pmol and above, DAN adduct peaks (Δm/z 140) were observed, likely formed via Schiff base dehydration condensation between the DAN amino group and the reducing-end hydroxyl group of the glycans. Notably, upon further dilution to 330 fmol, these undesirable DAN adducts were completely suppressed while favorable S/N ratios were maintained (Figure 3c). At this optimal concentration, ten glycan structures, including sialylated species, were clearly identified.
Furthermore, as dilution increased, a mass shift of Δm/z 16 (ex. m/z 1825.673) became apparent in the spectra (Figure 3c). This shift is attributed to the reduced sodium content in the diluted mixture, which leads to a relative increase in the abundance of potassium cationated molecules [M + K]+. Because the mass difference between sodium and potassium (+16 Da) coincides with the mass of a hexose-fucose unit difference (e.g., distinguishing G1 from G1F), accurate assessment of defucosylation becomes challenging in highly diluted samples.
3.3. Direct Analysis of Diluted Digestion Solutions Using DHB/0.1% TFA and DHB Matrices
Dilution experiments were also conducted using DHB/0.1% TFA and DHB matrices (Figure 4). Glycan detection was achieved in both matrices only after sufficient dilution of the digest. The detection limits were 33 fmol for DHB/0.1% TFA and 17 fmol for DHB (Figure S2 and S3). In both cases, glycan signals were suppressed at higher IgG amounts (above 3.3 pmol) due to interference from abundant proteins.
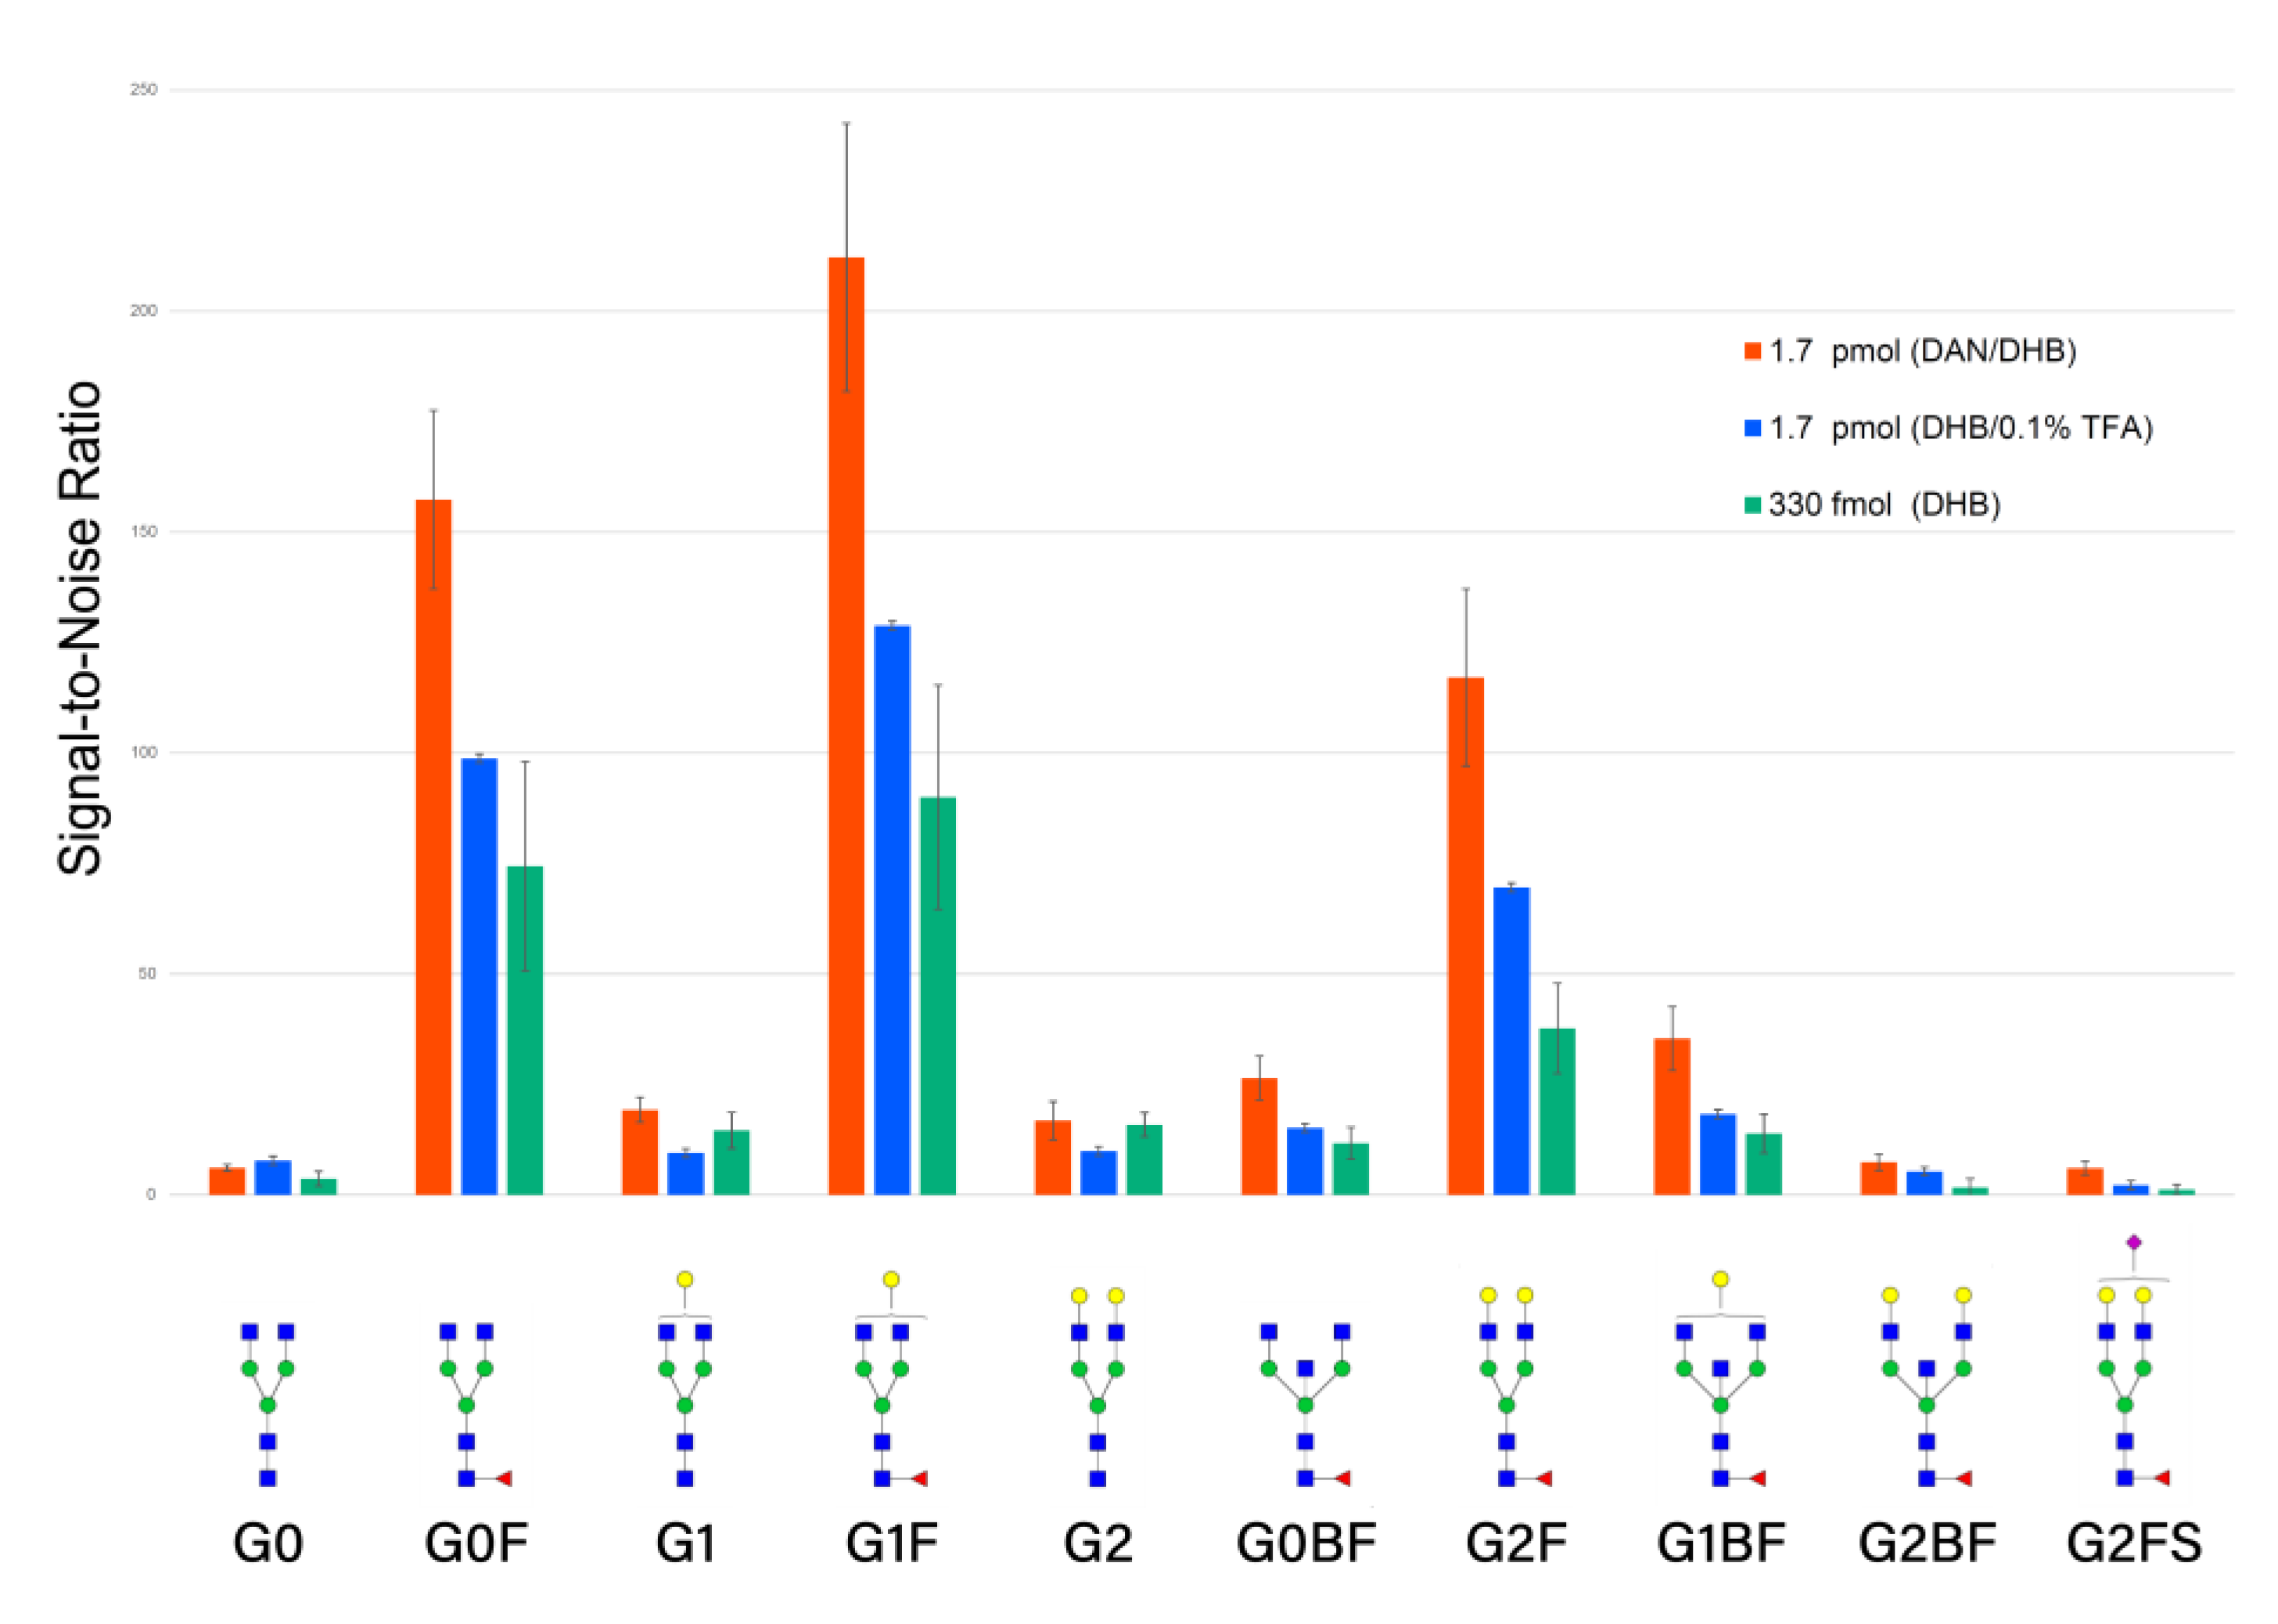
The optimal IgG amounts, providing the highest S/N ratios, were 1.7 pmol for DHB/0.1% TFA and 330 fmol for DHB (Figure S4). Overall, dilution improved the S/N ratios and expanded the range of detectable glycan structures for all three matrices. However, the DAN/DHB matrix consistently provided higher S/N ratios than the other matrices for all ten major glycoforms, demonstrating superior sensitivity in the presence of unpurified protein backbones (Figure 5). The DAN/DHB matrix not only enabled direct analysis of unpurified PNGase F digests, but also achieved more sensitive detection of multiple glycan structures from diluted digestion digests compared with the other matrices. These findings indicate that the DAN/DHB matrix possesses a broader workable sample concentration range for glycan detection, highlighting its superior practicality and robustness for glycan analysis under varying sample conditions.
4. Discussion
In this study, we demonstrate that N-glycans released from IgG antibodies by PNGase F can be directly analyzed by MALDI-TOF MS without any purification step, simply by mixing the digestion mixture with an appropriate matrix. This represents a substantial simplification compared to conventional glycan analysis workflows, which typically require labor-intensive cleanup and enrichment procedures.
The proposed method enables rapid and sensitive detection of key glycan features, including sialylation, galactosylation, and fucosylation, even from exceptionally low amounts of IgG (down to the femtomole level). This capability is particularly advantageous for antibody characterization, where subtle variations in glycosylation critically influence biological function and therapeutic efficacy.
A notable finding is that glycan detection was achieved across all tested matrices upon sufficient dilution, which can be attributed to the presence of sodium ions derived from the NaCl in the PNGase F reagent. The coexistence of matrix components and sodium ions likely enhances glycan ionization and selectivity [20]. Among the tested conditions, the DAN/DHB matrix exhibited the highest performance. It enabled the detection of multiple glycan structures even in undiluted digestion solutions and consistently provided superior sensitivity upon dilution, while effectively suppressing undesirable DAN adduct formation at optimal concentrations.
Importantly, glycan signals were clearly detectable even in highly concentrated digestion mixtures containing abundant proteinaceous components derived from both IgG and PNGase F. This suggests that the DAN/DHB matrix system effectively suppresses ionization interference from coexisting proteins, thereby enhancing glycan selectivity far beyond that of conventional matrices [15].
Taken together, this purification-free strategy provides a rapid, sensitive, and experimentally simple platform for glycan profiling. This methodology has strong potential for streamlining antibody quality control in biopharmaceutical manufacturing and facilitating high-throughput glycomics studies in clinical research.
5. Conclusions
Post-translational modifications (PTMs), particularly glycosylation, are critical quality attributes (CQAs) that strictly dictate the immunogenicity and effector functions—such as ADCC and CDC—of therapeutic antibodies. Consequently, the rigorous monitoring and quality control of these diverse glycan structures remain indispensable throughout biopharmaceutical development and manufacturing.
In this study, we successfully established a streamlined, purification-free methodology for IgG N-glycan profiling using conventional MALDI-TOF MS. By exploiting the superior glycan selectivity of the DAN/DHB matrix, we enabled the direct detection of N-glycans from crude PNGase F digestion mixtures, effectively overcoming severe ionization interference from abundant coexisting proteins. Furthermore, systematic dilution of the digest proved to be a critical optimization step; it not only suppressed the formation of undesirable DAN adducts but also significantly enhanced the signal-to-noise ratio, allowing for the comprehensive detection of sialylated glycoforms with femtomole-level sensitivity.
This simple and highly accessible platform successfully bypasses the labor-intensive cleanup and enrichment procedures typically required in conventional LC and MS workflows. Importantly, because the entire analytical process relies solely on basic liquid handling—such as dilution, matrix mixing, and spotting—it is highly amenable to automation using simple liquid-handling robots [21]. Ultimately, this purification-free strategy holds strong potential to accelerate high-throughput glycomics in clinical research and paves the way for the realization of fully automated quality control systems for next-generation antibody therapeutics.
6. Patents
The authors declare that a patent application related to this research has been filed (JP 2021-000822).
Supplementary Materials
The following supporting information can be downloaded at the website of this paper posted on Preprints.org, Figure S1: All spectra of digests of IgG antibody with DAN/DHB matrix, Figure S2: All spectra of digests of IgG antibody with DHB/0.1% TFA matrix, Figure S3: All spectra of digests of IgG antibody with DHB matrix, Figure S4: Comparison of signal-to-noise ratios of 10 major glycan structures for each matrix (DHB/0.1%TFA, DHB matrix); Table S1: Peak assignment and S/N ratio data for detected glycan structures.
Author Contributions
Conceptualization, H.H.; methodology, M.Y. and S.U.; validation, M.Y. and H.H.; formal analysis, M.Y.; investigation, M.Y.; resources, H.H.; data curation, M.Y.; writing—original draft preparation, M.Y.; writing—review and editing, M.Y., S.U., and H.H.; visualization, M.Y.; supervision, H.H.; project administration, H.H.; funding acquisition, H.H. All authors have read and agreed to the published version of the manuscript.
Funding
This research was funded by Grant-in-Aid for Scientific Research (B: 22H02191, 23K23458 to H.H.), Core-to-Core type B (JPJSCCB20240004 to H.H.) from the Japan Society for the Promotion of Science (JSPS).
Institutional Review Board Statement
Not applicable.
Informed Consent Statement
Not applicable.
Data Availability Statement
The original contributions presented in the study are included in the article/supplementary material. Further inquiries can be directed to the corresponding author(s).
Acknowledgments
The authors appreciate the support in laboratory management provided by Ms. Maki Morita. We thank the Open Facility, Global Research Facility Alliance Center, Office for Integrated Technical Core Hub, Hokkaido University for allowing us to conduct the analysis of all samples using an ultrafleXtream-DHS 2 TOF/TOF and providing insight and expertise that greatly assisted the research.
Conflicts of Interest
The authors declare no conflicts of interest.
Abbreviations
| CQA | critical quality attribute |
| MALDI | matrix-assisted laser desorption/ionization |
| TOF MS | time-of-flight mass spectrometry |
| DAN | 1,5-diaminonaphthalene |
| DHB | 2,5-dihydroxybenzoic acid |
| IgG | immunoglobulin G |
| mAb | monoclonal antibody |
| PTM | post-translational modification |
| ADCC | antibody-dependent cellular cytotoxicity |
| CDC | complement-dependent cytotoxicity |
| LC | liquid chromatography |
| HILIC | hydrophilic interaction liquid chromatography |
| UPLC | ultra performance liquid chromatography |
| ISD | in-source decay |
| FT-ICR | fourier transform ion cyclotron resonance |
| PNGase F | peptide N-glycosidase from Flavobacterium meningosepticum |
| TFA | trifluoroacetic acid |
| Nd:YAG | neodymium-doped yttrium aluminum garnet |
References
- Lu, L.L.; Suscovich, T.J.; Fortune, S.M.; Alter, G. Beyond binding: antibody effector functions in infectious diseases. Nat. Rev. Immunol. 2018, 18, 46–61. [Google Scholar] [CrossRef]
- Lu, R.M.; Chiang, H.L.; Yuan, J.P.; Wang, H.H.; Chen, C.Y.; Panda, S.S.; Liang, K.H.; Peng, H.P.; Ko, S.H.; Hsu, H.J.; et al. Technological advancements in antibody-based therapeutics for treatment of diseases. J. Biomed. Sci. 2025, 32, 98. [Google Scholar] [CrossRef] [PubMed]
- Verdin, P. Top product forecasts for 2026. Nat. Rev. Drug Discov. 2026, 25, 10. [Google Scholar] [CrossRef]
- Nimmerjahn, F.; Vidarsson, G.; Cragg, M.S. Effect of posttranslational modifications and subclass on IgG activity: from immunity to immunotherapy. Nat. Immunol. 2023, 24, 1244–1255. [Google Scholar] [CrossRef]
- Kristic, J.; Lauc, G. The importance of IgG glycosylation-What did we learn after analyzing over 100,000 individuals. Immunol. Rev. 2024, 328, 143–170. [Google Scholar] [CrossRef]
- Cobb, B.A. The history of IgG glycosylation and where we are now. Glycobiology 2020, 30, 202–213. [Google Scholar] [CrossRef]
- Shields, R.L.; Lai, J.; Keck, R.; O’Connell, L.Y.; Hong, K.; Meng, Y.G.; Weikert, S.H.; Presta, L.G. Lack of fucose on human IgG1 N-linked oligosaccharide improves binding to human FcγRIII and antibody-dependent cellular toxicity. J. Biol. Chem. 2002, 277, 26733–26740. [Google Scholar] [CrossRef] [PubMed]
- Mimura, Y.; Katoh, T.; Saldova, R.; O’Flaherty, R.; Izumi, T.; Mimura-Kimura, Y.; Utsunomiya, T.; Mizukami, Y.; Yamamoto, K.; Matsumoto, T.; et al. Glycosylation engineering of therapeutic IgG antibodies: challenges for the safety, functionality and efficacy. Protein Cell 2018, 9, 47–62. [Google Scholar] [CrossRef] [PubMed]
- Peschke, B.; Keller, C.W.; Weber, P.; Quast, I.; Lunemann, J.D. Fc-galactosylation of human immunoglobulin gamma isotypes improves C1q binding and enhances complement-dependent cytotoxicity. Front. Immunol. 2017, 8, 646. [Google Scholar] [CrossRef]
- Reusch, D.; Tejada, M.L. Fc glycans of therapeutic antibodies as critical quality attributes. Glycobiology 2015, 25, 1325–1334. [Google Scholar] [CrossRef]
- Hiranyakorn, M.; Iwamoto, S.; Hoshinoo, A.; Tsumura, R.; Takashima, H.; Yasunaga, M.; Manabe, S. Chromatographic analysis of the N-glycan profile on therapeutic antibodies using FcγRIIIa affinity column chromatography. ACS Omega 2023, 8, 16513–16518. [Google Scholar] [CrossRef]
- Ahn, J.; Bones, J.; Yu, Y.Q.; Rudd, P.M.; Gilar, M. Separation of 2-aminobenzamide labeled glycans using hydrophilic interaction chromatography columns packed with 1.7 μm sorbent. J. Chromatogr. B Anal. Technol. Biomed. Life Sci. 2010, 878, 403–408. [Google Scholar] [CrossRef] [PubMed]
- Simunovic, J.; Gaspersic, J.; Cernigoj, U.; Vidic, J.; Strancar, A.; Novokmet, M.; Razdorov, G.; Pezer, M.; Lauc, G.; Trbojevic-Akmacic, I. High-throughput immunoaffinity enrichment and N-glycan analysis of human plasma haptoglobin. Biotechnol. Bioeng. 2023, 120, 491–502. [Google Scholar] [CrossRef] [PubMed]
- Zhang, W.; Xie, L.; Zhao, H.; Ma, X.; Ren, S. High-throughput glycosylation screening method for biologics development using MALDI-TOF-MS. Commun. Chem. 2025, 8, 291. [Google Scholar] [CrossRef] [PubMed]
- Urakami, S.; Hinou, H. Direct MALDI glycotyping of glycoproteins toward practical subtyping of biological samples. ACS Omega 2022, 7, 39280–39286. [Google Scholar] [CrossRef]
- Senini, I.; Tengattini, S.; Rinaldi, F.; Massolini, G.; Gstottner, C.; Reusch, D.; Donini, M.; Marusic, C.; van Veelen, P.A.; Dominguez-Vega, E.; et al. Direct glycosylation analysis of intact monoclonal antibodies combining ESI MS of glycoforms and MALDI-in source decay MS of glycan fragments. Commun. Chem. 2024, 7, 203. [Google Scholar] [CrossRef]
- Urakami, S.; Hinou, H. MALDI glycotyping of O-antigens from a single colony of gram-negative bacteria. Sci. Rep. 2024, 14, 12719. [Google Scholar] [CrossRef]
- Urakami, S.; Hinou, H. MALDI O-antigen glycotyping of Y. pseudotuberculosis using DAN/DHB/K matrix. BBA Adv. 2025, 7, 100131. [Google Scholar] [CrossRef]
- Jansen, B.C.; Bondt, A.; Reiding, K.R.; Scherjon, S.A.; Vidarsson, G.; Wuhrer, M. MALDI-TOF-MS reveals differential N-linked plasma- and IgG-glycosylation profiles between mothers and their newborns. Sci. Rep. 2016, 6, 34001. [Google Scholar] [CrossRef]
- Hinou, H. Aniline derivative/DHB/alkali metal matrices for reflectron mode MALDI-TOF and TOF/TOF MS analysis of unmodified sialylated oligosaccharides and glycopeptides. Int. J. Mass. Spectrom. 2019, 443, 109–115. [Google Scholar] [CrossRef]
- Rathore, A.S.; Guttman, A.; Shrivastava, A.; Joshi, S. Recent progress in high-throughput and automated characterization of N-glycans in monoclonal antibodies. Trac.-Trends Anal. Chem. 2023, 169, 117397. [Google Scholar] [CrossRef]
Figure 1.
Direct MALDI analysis of IgG antibody (17 pmol) digests. (a) DHB/0.1% TFA matrix (b) DHB matrix (c) DAN/DHB matrix.
Figure 1.
Direct MALDI analysis of IgG antibody (17 pmol) digests. (a) DHB/0.1% TFA matrix (b) DHB matrix (c) DAN/DHB matrix.
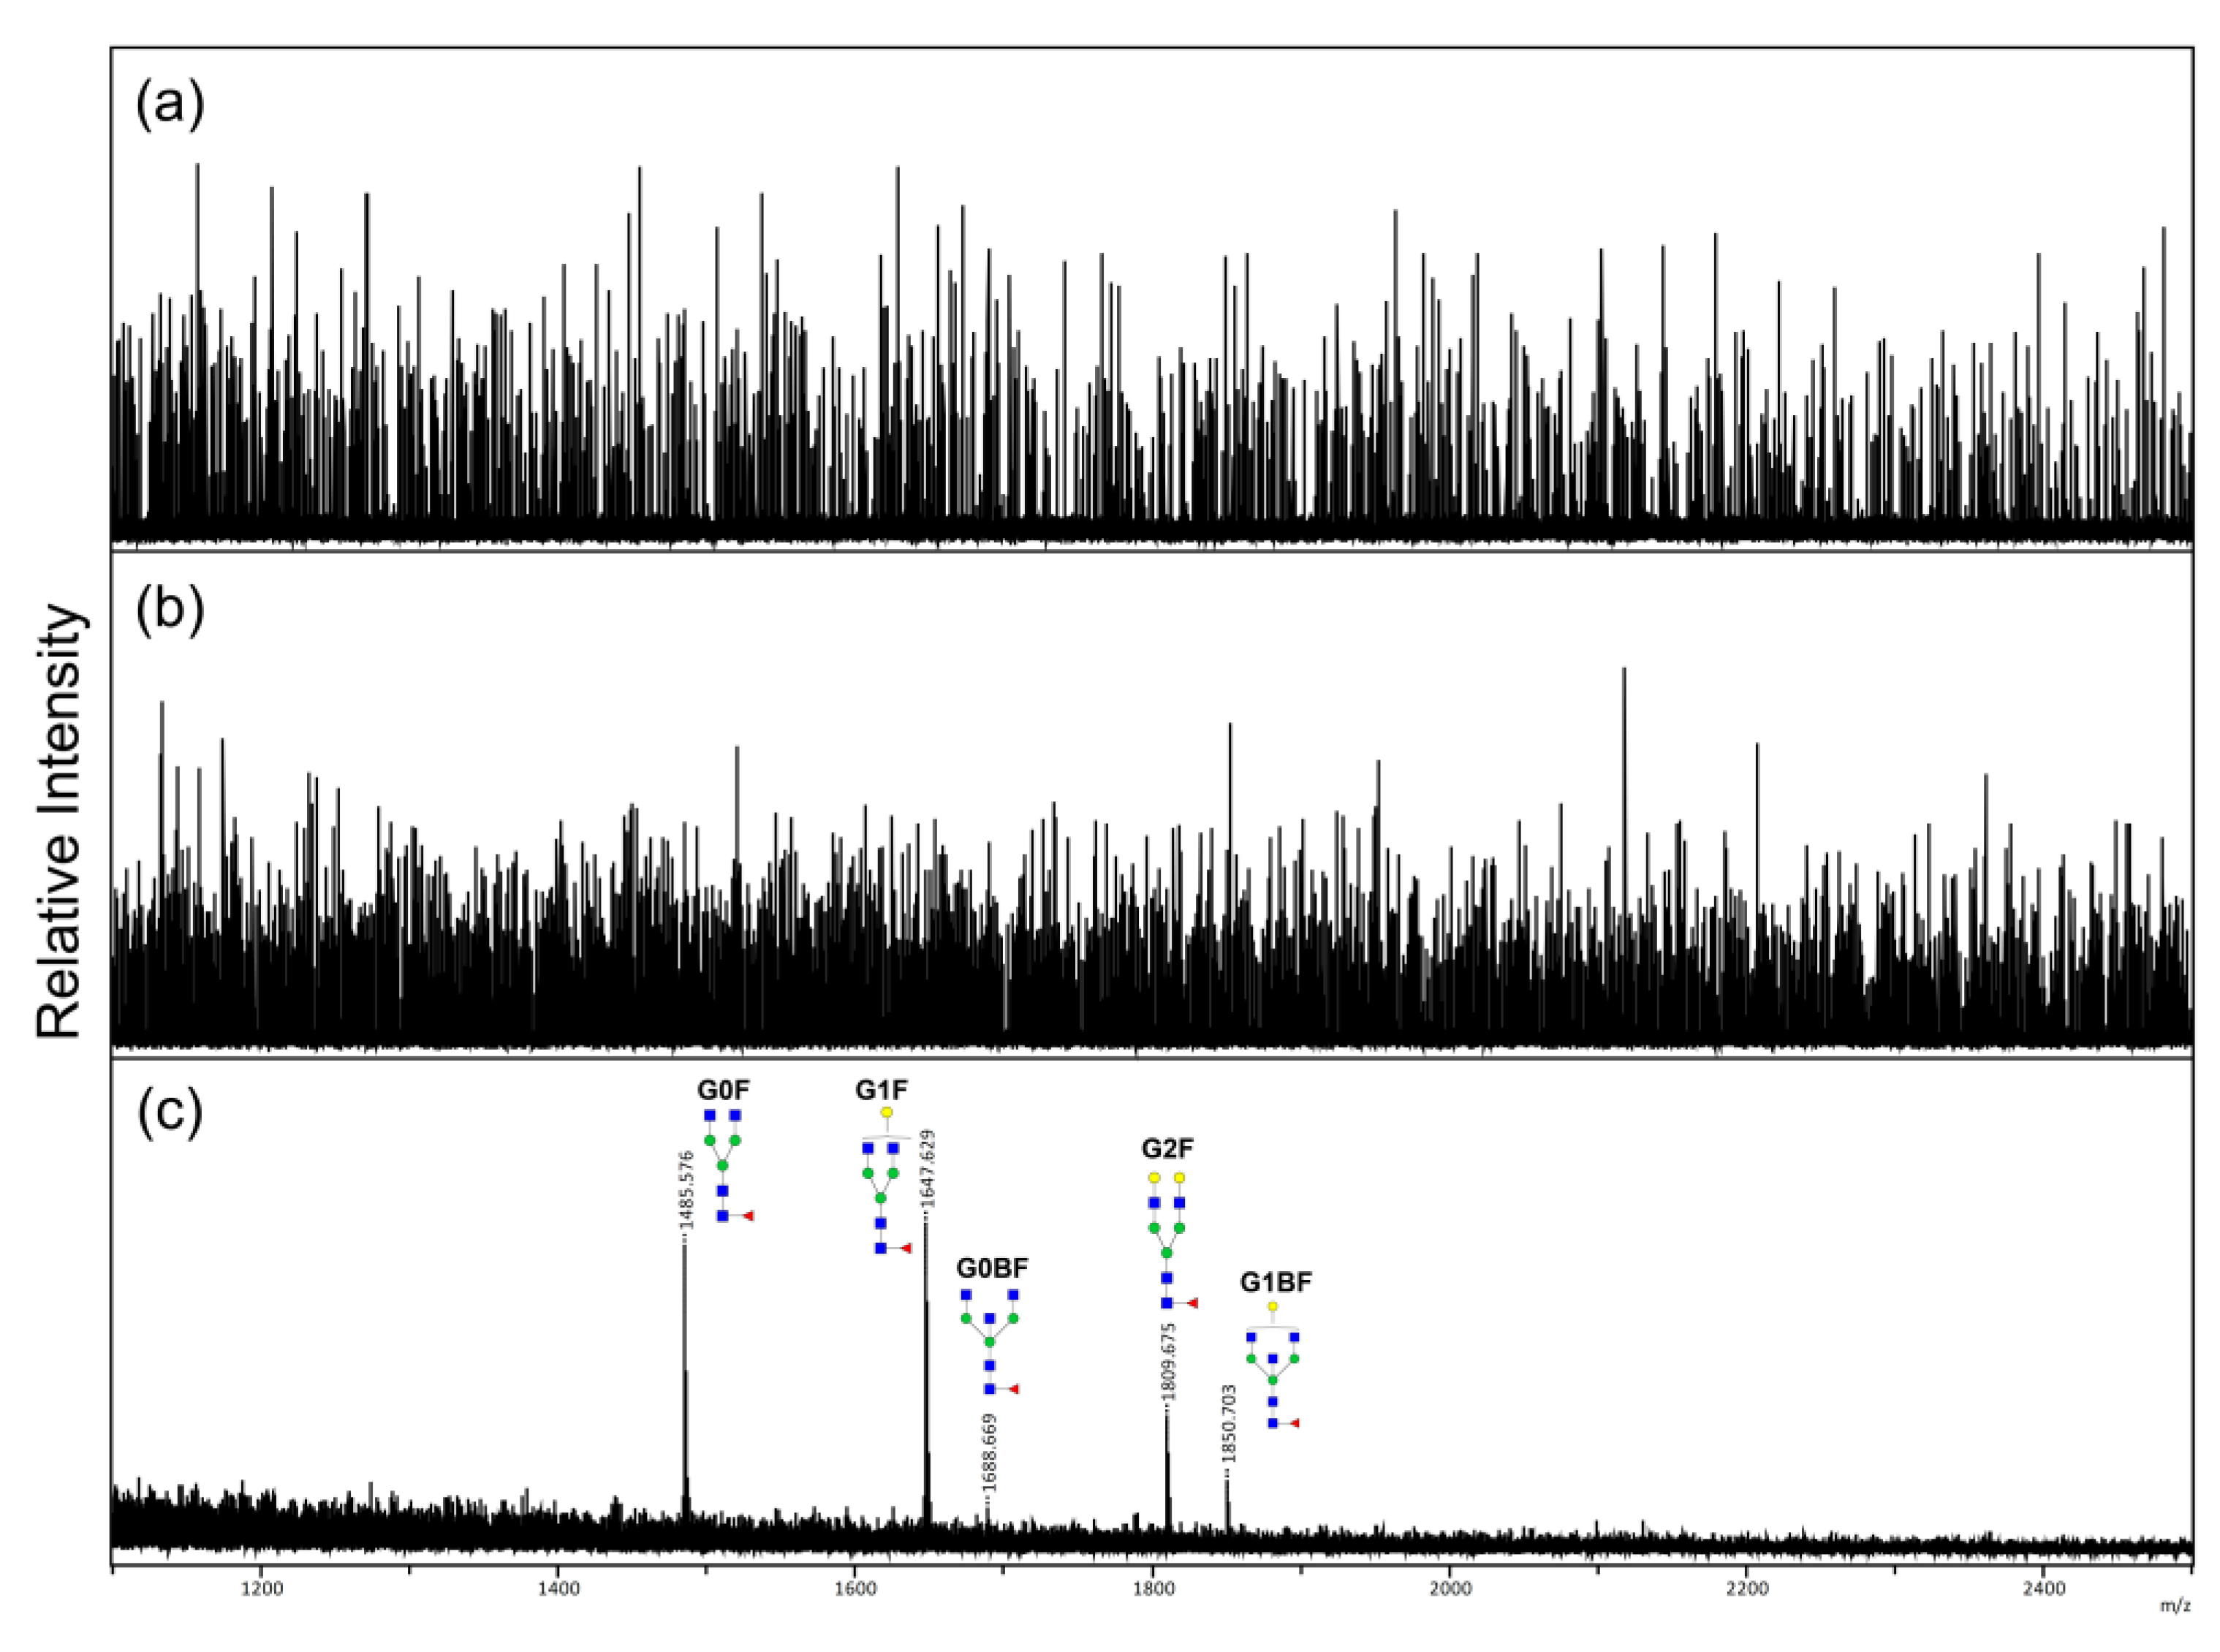
Figure 2.
Direct MALDI analysis of diluted IgG antibody digests. The spotted IgG antibody concentrations were (a) 8.3 pmol, (b) 3.3 pmol, (c) 1.7 pmol, (d) 330 fmol, (e) 170 fmol, (f) 33 fmol, (g) 17 fmol, and (h) 3.3 fmol, respectively. DAN/DHB was used as the matrix. For comparison, some of the detected oligosaccharide structures (G0F, G1, G1F, G2, G0BF, G2F, G1BF) are highlighted.
Figure 2.
Direct MALDI analysis of diluted IgG antibody digests. The spotted IgG antibody concentrations were (a) 8.3 pmol, (b) 3.3 pmol, (c) 1.7 pmol, (d) 330 fmol, (e) 170 fmol, (f) 33 fmol, (g) 17 fmol, and (h) 3.3 fmol, respectively. DAN/DHB was used as the matrix. For comparison, some of the detected oligosaccharide structures (G0F, G1, G1F, G2, G0BF, G2F, G1BF) are highlighted.
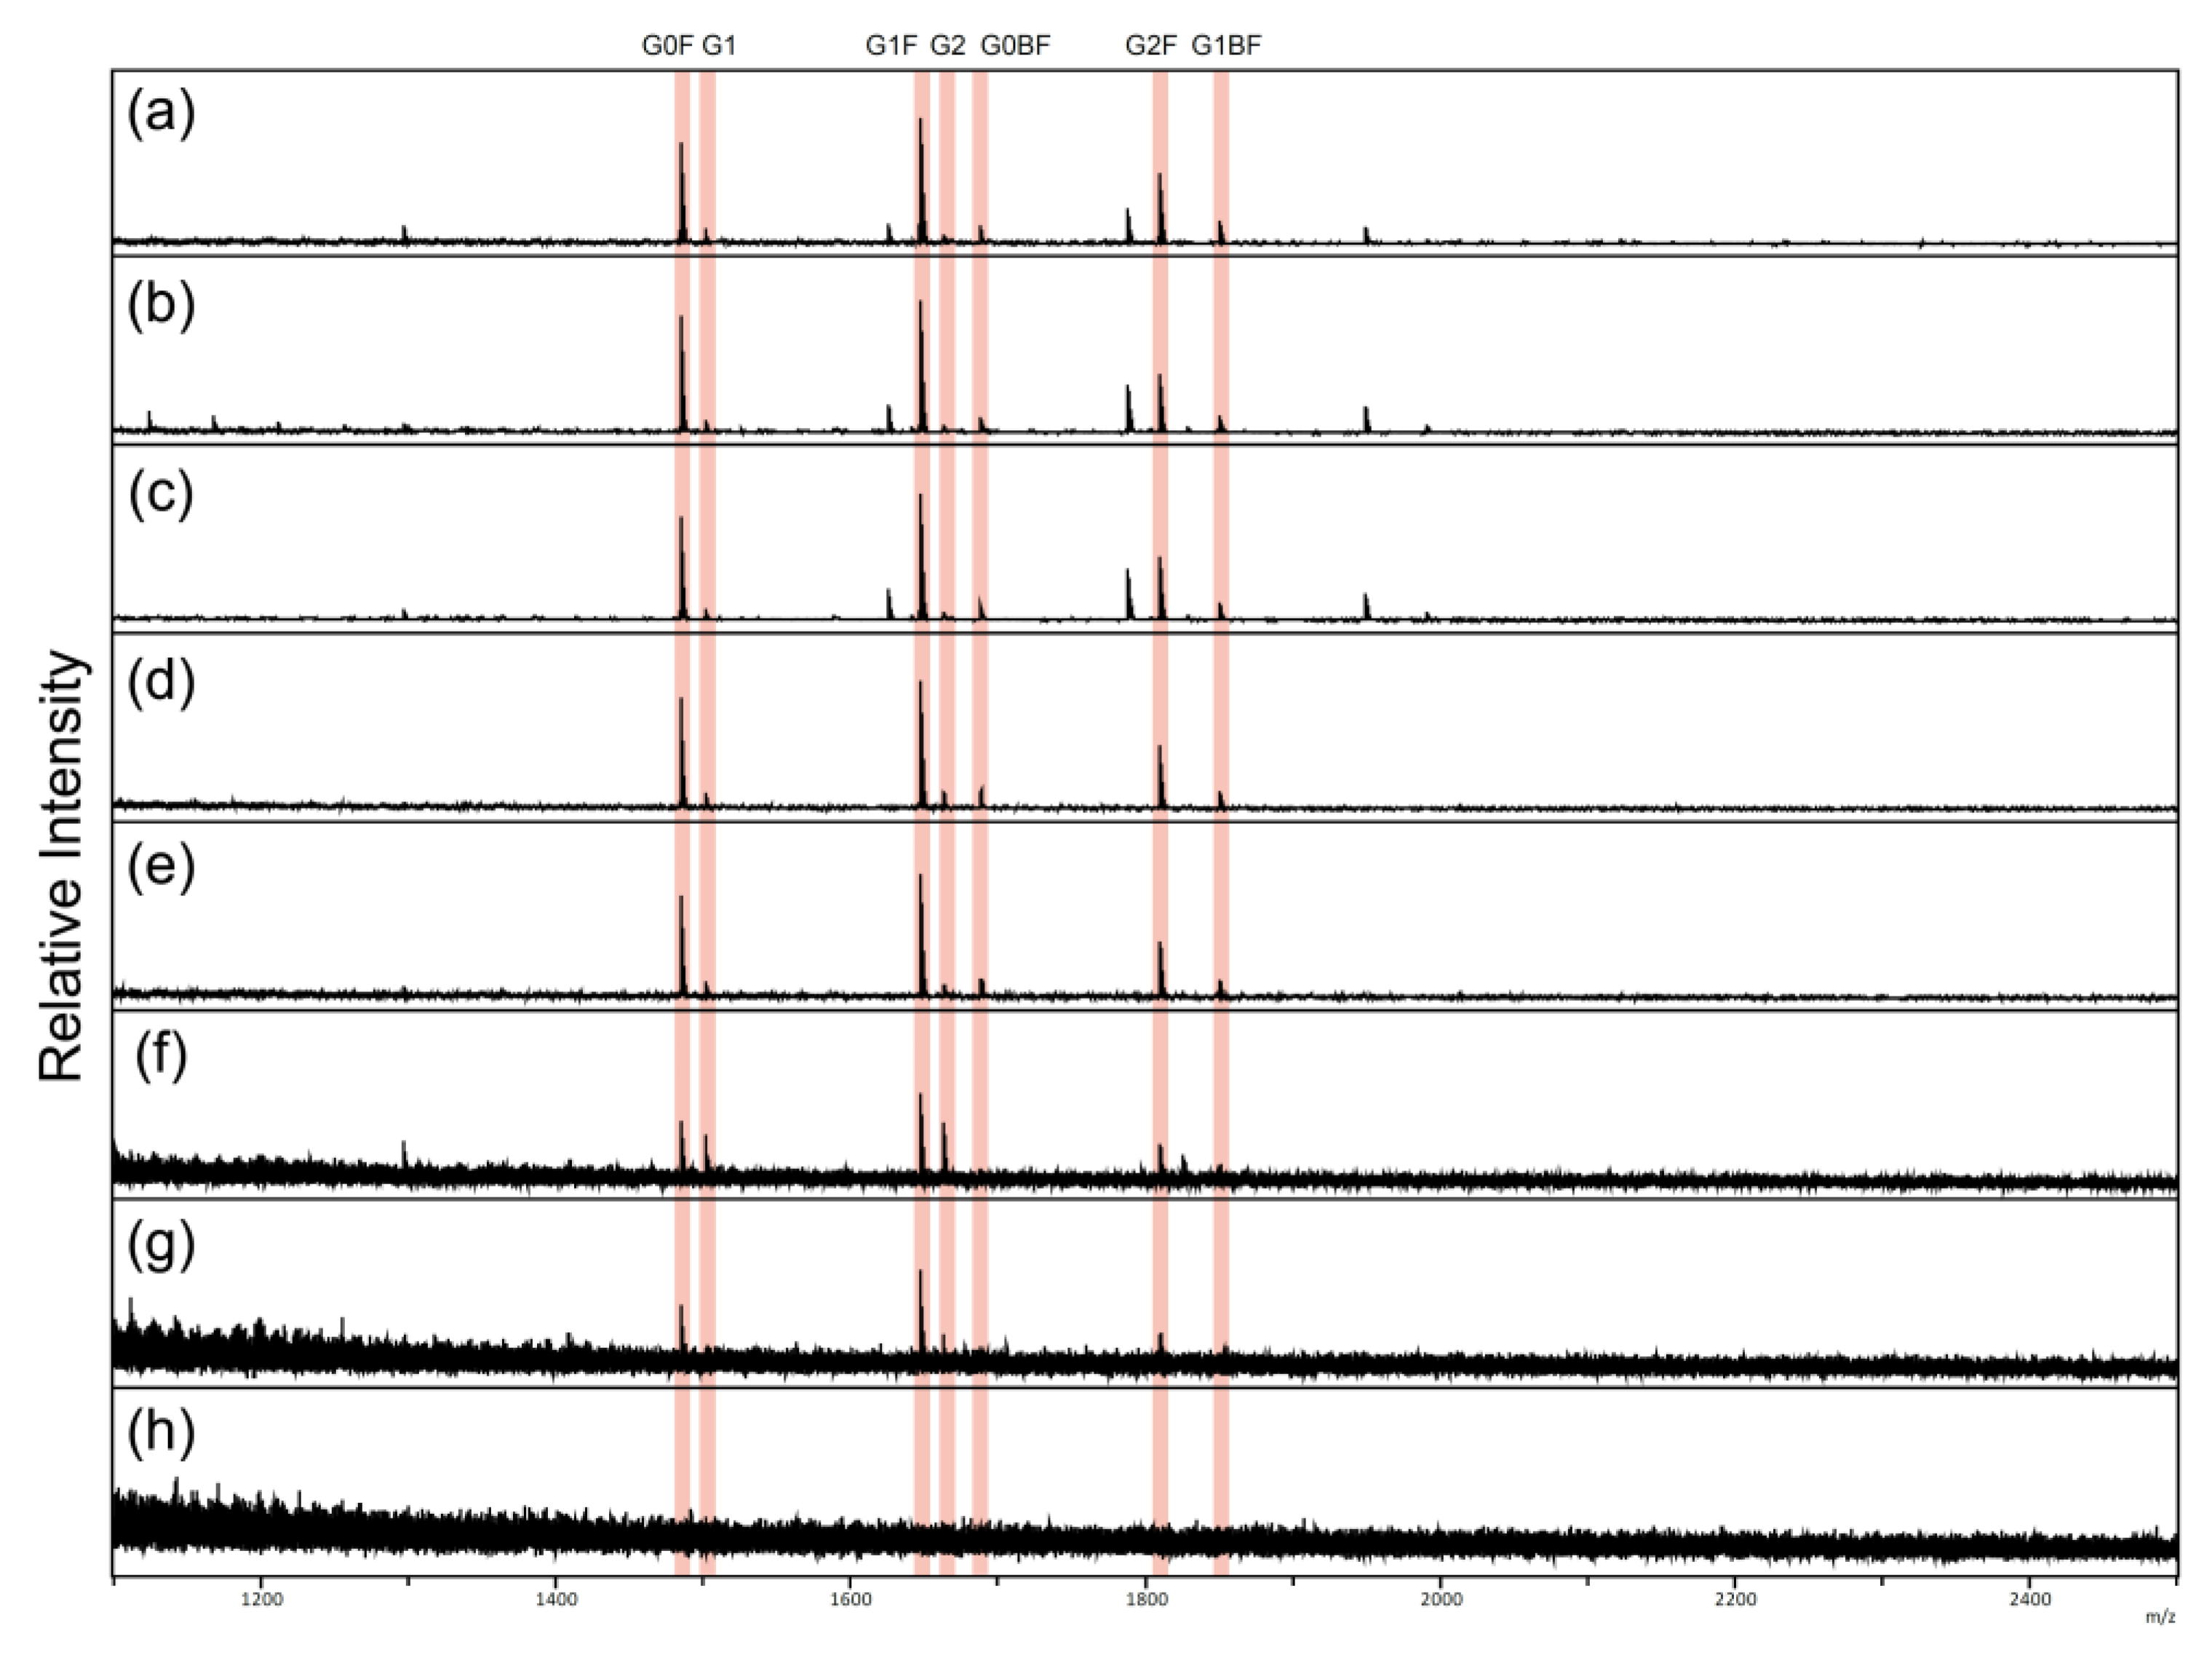
Figure 3.
Comparison of diluted IgG antibody digests. (a) Comparison of the signal-to-noise ratio of major oligosaccharide peaks at different IgG antibody concentrations (DAN/DHB matrix). The mean signal-to-noise ratio and standard deviation are shown. (b, c) Enlarged spectra obtained using the DAN/DHB matrix. IgG antibody amounts were (b)1.7 pmol and (c)330 fmol. The m/z values of the DAN adduct are shown in red.
Figure 3.
Comparison of diluted IgG antibody digests. (a) Comparison of the signal-to-noise ratio of major oligosaccharide peaks at different IgG antibody concentrations (DAN/DHB matrix). The mean signal-to-noise ratio and standard deviation are shown. (b, c) Enlarged spectra obtained using the DAN/DHB matrix. IgG antibody amounts were (b)1.7 pmol and (c)330 fmol. The m/z values of the DAN adduct are shown in red.
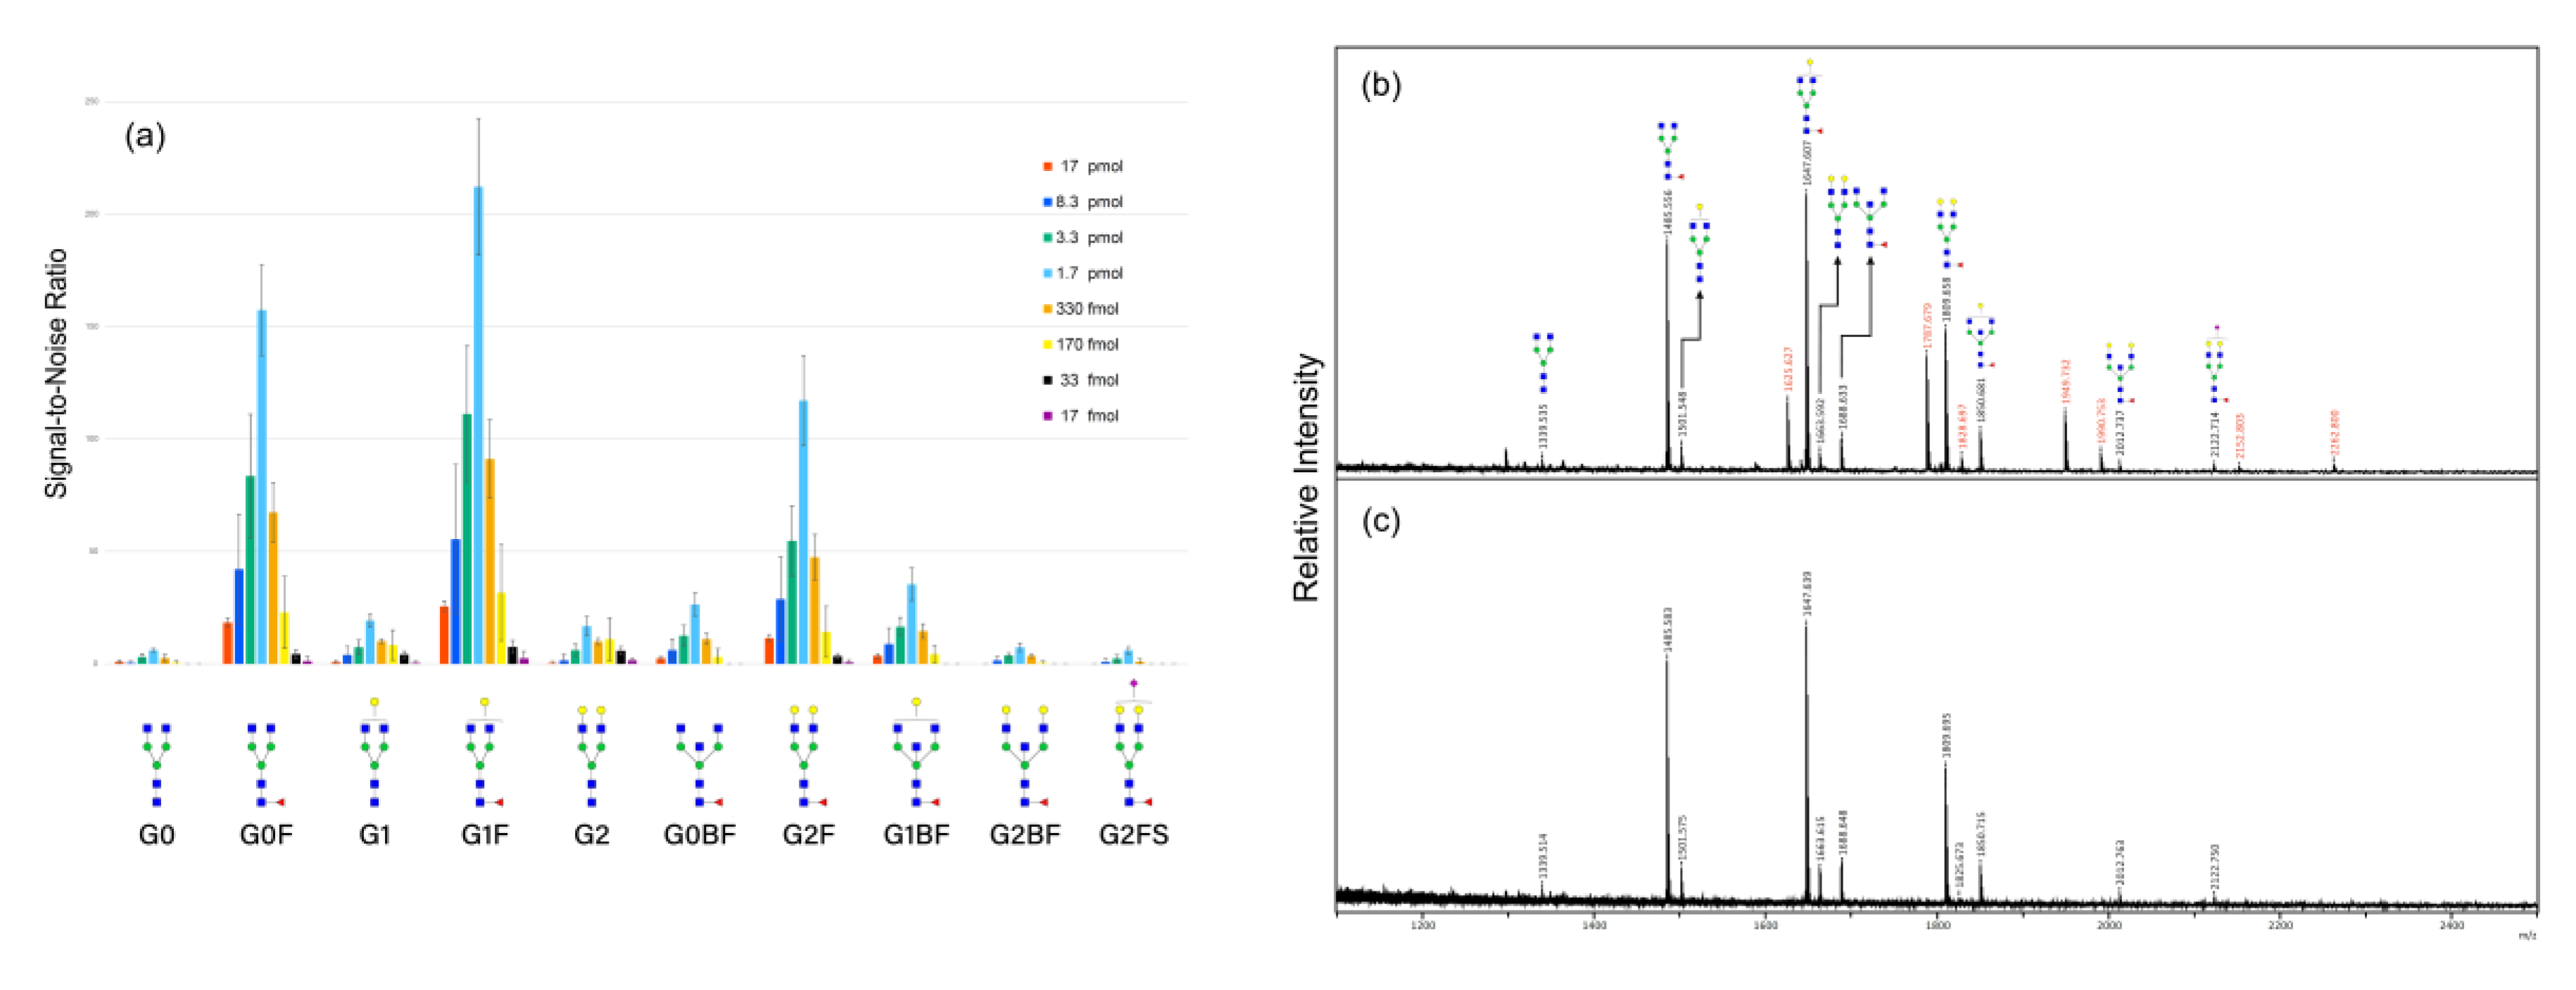
Figure 4.
MALDI direct analysis of diluted IgG antibody digests with DHB/0.1% TFA matrix and DHB matrix. The spotted IgG antibody concentrations were (a) 8.3 pmol, (b) 3.3 pmol, (c) 1.7 pmol, (d) 330 fmol, (e) 170 fmol, (f) 33 fmol, (g) 17 fmol, and (h) 3.3 fmol, respectively. For comparison, some of the detected oligosaccharide structures (G0F, G1, G1F, G2, G0BF, G2F, G1BF) are highlighted.
Figure 4.
MALDI direct analysis of diluted IgG antibody digests with DHB/0.1% TFA matrix and DHB matrix. The spotted IgG antibody concentrations were (a) 8.3 pmol, (b) 3.3 pmol, (c) 1.7 pmol, (d) 330 fmol, (e) 170 fmol, (f) 33 fmol, (g) 17 fmol, and (h) 3.3 fmol, respectively. For comparison, some of the detected oligosaccharide structures (G0F, G1, G1F, G2, G0BF, G2F, G1BF) are highlighted.
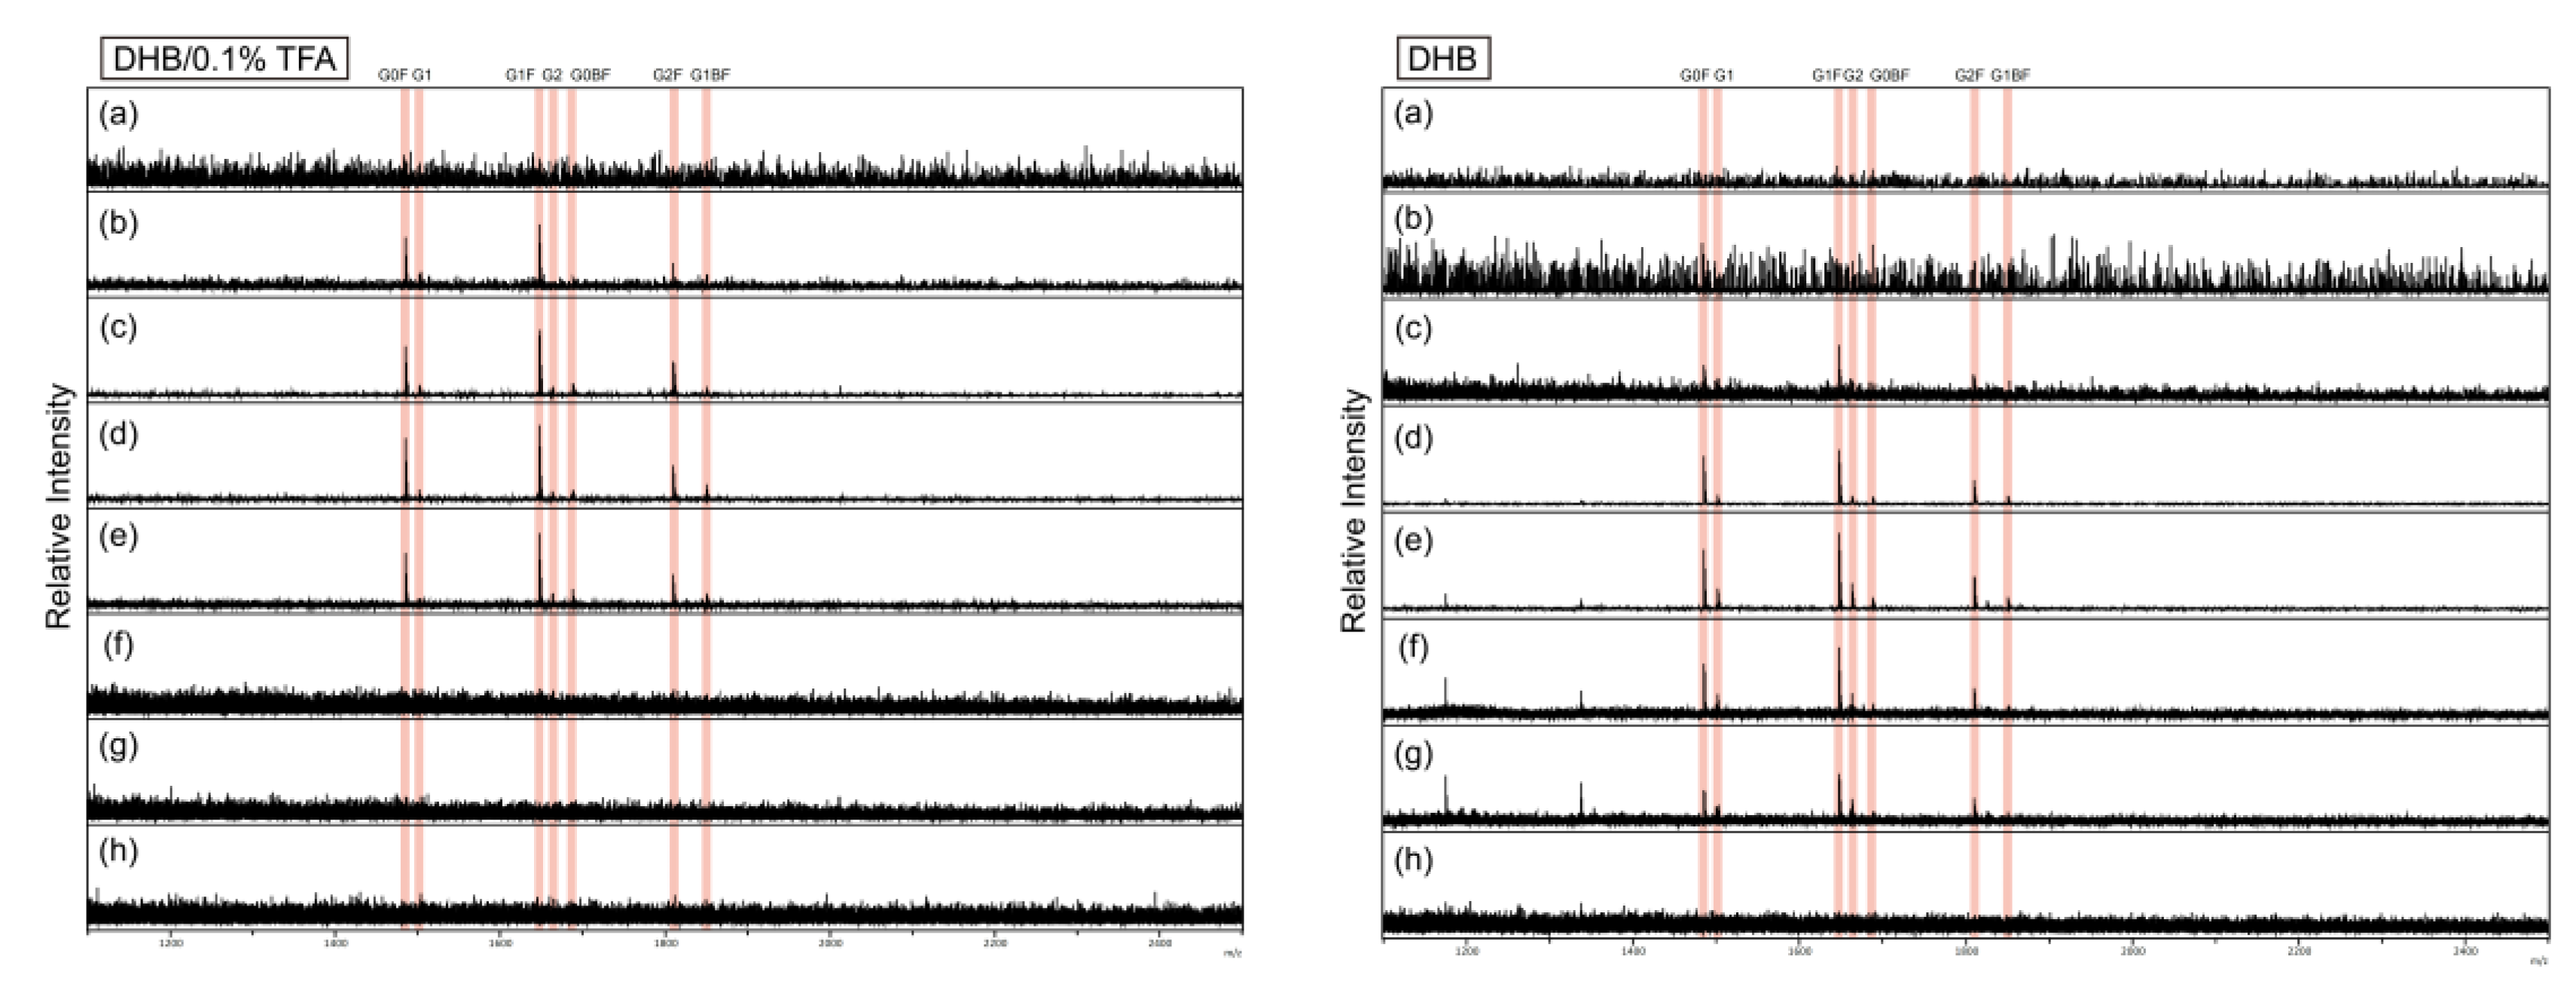
Figure 5.
Comparison of the signal-to-noise ratios for N-glycan detection at optimal IgG antibody concentrations in each matrix. Since the IgG antibody concentration that provided the highest sensitivity for N-glycan detection was 1.7 pmol in the DAN/DHB and DHB/0.1% TFA matrices and 330 fmol in the DHB matrix, the signal-to-noise ratios for these IgG amounts were compared.
Figure 5.
Comparison of the signal-to-noise ratios for N-glycan detection at optimal IgG antibody concentrations in each matrix. Since the IgG antibody concentration that provided the highest sensitivity for N-glycan detection was 1.7 pmol in the DAN/DHB and DHB/0.1% TFA matrices and 330 fmol in the DHB matrix, the signal-to-noise ratios for these IgG amounts were compared.
Disclaimer/Publisher’s Note: The statements, opinions and data contained in all publications are solely those of the individual author(s) and contributor(s) and not of MDPI and/or the editor(s). MDPI and/or the editor(s) disclaim responsibility for any injury to people or property resulting from any ideas, methods, instructions or products referred to in the content. |
© 2026 by the authors. Licensee MDPI, Basel, Switzerland. This article is an open access article distributed under the terms and conditions of the Creative Commons Attribution (CC BY) license.
Copyright: This open access article is published under a Creative Commons CC BY 4.0 license, which permit the free download, distribution, and reuse, provided that the author and preprint are cited in any reuse.


