
Submitted:
26 May 2026
Posted:
27 May 2026
You are already at the latest version
Abstract
Surface defects in balsa wood panels can compromise visual quality, mechanical reliability, and industrial acceptance, especially in applications where lightweight wood materials are used under strict quality requirements. Manual inspection remains common in balsa wood processing; however, it is time-consuming, subjective, and prone to human error. This study designed and evaluated a YOLOv11-based deep learning detection architecture adapted to automated surface defect inspection in balsa wood panels. A custom image dataset was constructed from real panel surfaces acquired under industrial inspection conditions, and all visible surface failures were consolidated into a single target class named Defect. The images were annotated using Label Studio and adapted to the YOLOv11 detection format. Seven YOLOv11 configurations were systematically evaluated by varying model scale, input image resolution, number of epochs, batch size, initial learning rate, and optimizer strategy. The experimental results showed that YOLOv11_m512 achieved the best overall performance, with a precision of 0.829, recall of 0.889, mAP@0.5 of 0.870, and mAP@0.5:0.95 of 0.354, while maintaining a model size of 38.61 MB and an inference time of 34.09 ms per image. The comparative analysis demonstrated that increasing image resolution alone did not improve detection performance, as high-resolution AdamW-based configurations showed lower mAP values and higher inference times. Instead, the best results were obtained by balancing backbone capacity, input resolution, optimizer strategy, and batch size. Qualitative inference results confirmed that the proposed model can detect cracks, stains, knots, splits, and localized discontinuities under heterogeneous wood grain and illumination conditions. The findings support the feasibility of integrating YOLOv11-based computer vision into automated quality-control systems for balsa wood panel inspection, providing a more objective and consistent alternative to manual inspection.
Keywords:
balsa wood panels
; surface defect detection
; YOLOv11
; quality control
; industrial automation
1. Introduction
Balsa wood (Ochroma pyramidale) is a lightweight natural material widely used in industrial sectors where a high strength-to-weight ratio is required, including aerospace, automotive, marine, wind-energy, and construction applications. Its low density, ease of processing, and mechanical versatility make it a valuable raw material for the production of panels, cores, and structural components. In Ecuador, and particularly in the province of Los Ríos, the production and processing of balsa wood represent an economically relevant activity linked to local manufacturing and export-oriented industries. However, the industrial value of balsa wood depends strongly on the surface quality of the processed panels, since visible and structural defects may reduce product reliability, affect mechanical performance, and compromise final acceptance by customers.
Surface defects in balsa wood panels may include cracks, splits, knots, stains, mineral marks, holes, sanding irregularities, adhesive lines, and localized discontinuities. These defects can originate during tree growth, harvesting, drying, storage, cutting, or panel processing. Although some imperfections are superficial, others may indicate deeper structural weaknesses that affect the performance of the material in demanding applications. For this reason, quality-control procedures in balsa processing plants require accurate and consistent inspection mechanisms capable of identifying defective regions before the panels are incorporated into final products.
Traditional inspection of balsa wood panels is commonly performed manually by trained operators. Although human inspection can provide useful practical judgment, it is inherently subjective, time-consuming, and susceptible to fatigue, lighting variability, operator experience, and production speed.
Recent advances in artificial intelligence, deep learning, and computer vision have enabled the development of robust models for visual inspection tasks. Convolutional neural networks and modern object detection architectures have been successfully applied in industrial defect detection, agricultural monitoring, medical imaging, and automated quality-control systems. In particular, YOLO-based models have gained attention due to their ability to perform real-time object detection with a favorable balance between accuracy and inference speed. These characteristics make YOLO architectures suitable for industrial inspection scenarios where defective regions must be detected rapidly and consistently from RGB images.
Despite the progress achieved in automated visual inspection, the detection of defects in balsa wood panels remains challenging. Unlike manufactured materials with homogeneous surfaces, balsa wood exhibits natural texture variability, grain transitions, tonal differences, knots, stains, and panel joints that may visually resemble actual defects.
Motivated by this need, the present study proposes a YOLOv11-based deep learning architecture for the automated detection of surface defects in balsa wood panels. The inspection task was formulated as a single-class detection problem, where all visible surface failures were consolidated into the Defect class. This design decision was aligned with the practical objective of industrial inspection: identifying whether a panel region presents a defect that may require rejection, rework, or further verification. Instead of focusing on fine-grained defect taxonomy, the proposed approach prioritizes reliable localization of defective regions for quality-control support.
The remainder of this paper is organized as follows. Section 2 presents the related work on computer vision, deep learning, and automated defect detection. Section 3 describes the study context, image acquisition process, dataset construction and annotation protocol, YOLOv11-based architecture, experimental configurations, training procedure, and evaluation metrics. Section 4 reports the comparative results of the evaluated YOLOv11 configurations, including global performance, hyperparameter impact, convergence analysis, radar-based comparison, qualitative inference, and error analysis. Section 5 discusses the implications of the results, model limitations, potential biases, and mitigation strategies. Finally, Section 6 presents the main conclusions and future research directions for improving robustness and industrial deployment.
2. Related Work
Automated visual inspection has become a central research direction for industrial quality control because manual inspection is slow, subjective, and difficult to reproduce under variable production conditions. In the wood-processing domain, recent studies have moved from generic image classification toward object detection, anomaly detection, and pixel-level segmentation for defects such as knots, cracks, bark, scratches, holes, and surface damage. Within the Scopus records analyzed for this study, the most relevant contributions were those focused on wood panels, particleboard, timber surfaces, veneer, and deployable deep learning architectures for real-time surface inspection.
Zhang et al. proposed a deep-learning method for particleboard surface defect detection and recognition, combining anomaly-oriented detection and residual feature extraction to improve the identification of defects in wooden industrial products [1]. Del Tejo-Catala et al. introduced WoodAD, a dataset and benchmark for wood anomaly detection, emphasizing the need for more realistic datasets beyond standard anomaly-detection benchmarks [2]. Ge et al. developed DMD-YOLO, an improved YOLOv8-based model designed for wood surface defect detection under industrial conditions [3]. Ali et al. focused on real-time surface crack detection in wood, showing the practical relevance of deep learning image analysis for manufacturing quality control [4]. Jing et al. further extended this direction by proposing SDE-YOLO for oriented wood defect detection, addressing the limitation of horizontal bounding boxes when defect geometry and size are important for wood utilization [5].
Li et al. proposed an improved YOLOv8n model for wood panel defect detection, highlighting the need to increase both accuracy and convergence speed in panel inspection [6]. Qin et al. introduced EFCW-YOLO, a lightweight YOLOv8n-based model that integrates contextual modeling and efficient attention for automated wood surface defect detection [7]. Lin et al. proposed WDNET-YOLO for structural timber defect detection, targeting defects such as cracks and knots that affect load-bearing capacity and building safety [8]. Kang et al. presented CFIS-YOLO, a lightweight multi-scale fusion network optimized for edge-device deployment in wood defect detection [9]. Dou and You designed an improved YOLOv8 model to address small-target characteristics and complex backgrounds in wood surface inspection [10]. Long and Lin adapted YOLOv8x for ultrathin fiberboard, where small-scale defects and large variations in defect size make manual inspection insufficient for modern production lines [11].
Yanai and Ishikawa compared several semantic segmentation architectures for wood surface defect detection, including FCN, PSPNet, DeepLabv3+, DANet, SegFormer, and Swin Transformer, illustrating the relevance of dense prediction when defect boundaries must be characterized precisely [12]. Luo et al. adapted visual foundation models for wood defect segmentation through instance linking and feature disentanglement, addressing inter-class similarity and fuzzy defect boundaries in automated visual inspection [13]. Wang et al. proposed FDD-YOLO to improve small-target and multi-scale wood surface defect detection [14], while Wang et al. later presented DRR-YOLO as a multiscale improved YOLOv8 method for non-destructive, rapid, and economical wood surface inspection [15]. Liu et al. developed a lightweight multi-scale feature fusion method for detecting defects on water-based wood paint surfaces, which is relevant for industrial finishing scenarios involving scratches, holes, blisters, and cracks [16]. Chen et al. proposed YOLOv8-OCHD, a lightweight detector aimed at reducing missed detections, improving speed, and supporting deployment on embedded devices for subtle wood surface defects [17]. Coutinho et al. designed a real-time automated visual inspection system for decorative wood panels aligned with the Zero Defects Manufacturing framework and deployable on an NVIDIA Jetson Nano [18]. Zhu et al. proposed a lightweight wood defect segmentation network based on multi-dimension boundary perception and guidance, specifically addressing obscure boundaries, intra-class differences, and inter-class similarity [19].
The most recent studies show a stronger emphasis on practical deployment, YOLOv11-based architectures, and high-resolution datasets for industrial wood inspection. Ban et al. proposed a lightweight vision-based system for automated wood surface defect detection in construction materials, explicitly noting that practical workflow requirements and real-time deployability remain underexplored compared with algorithmic improvements [20]. Wu et al. presented SGCDT-YOLO, an improved YOLOv11n model that combines multi-scale feature fusion, content-aware selective mechanisms, and attention modules for wood surface defect detection [21]. Qu et al. proposed WD-SEG, a deep learning framework for accurate segmentation of subtle wood defects under low contrast, complex background interference, and feature ambiguity [22]. Li et al. studied defect detection in melamine-impregnated paper decorative particleboard, reinforcing the importance of automated quality control in panel furniture manufacturing [23]. Yang et al. introduced a lightweight YOLO-based model with a dual-path fused attention network to reduce omission rates in small-target wood defect detection while controlling model complexity [24]. Jia et al. released a public high-resolution dataset for surface defect detection on water-based coated wood products, providing annotated images of scratches, cracks, bubbles, and holes collected in an operational production facility [25]. Ly Duc and Vo Thanh proposed YOLOv11-GATFormer, a unified framework that combines YOLOv11, graph attention, and a Transformer-based classification head for industrial wood surface defect detection and classification [26].
3. Materials and Methods
3.1. Study Area and Industrial Inspection Context
The study was conducted in an industrial balsa wood processing facility located in Quevedo canton, Los Ríos Province, Ecuador. This region is characterized by a strong agricultural and forestry-related economy, where balsa wood production and processing represent an important industrial activity. The selected facility specializes in the production of balsa wood panels intended for applications in sectors where low weight, mechanical resistance, and surface quality are critical requirements.
Balsa wood panels are widely used in high-value industrial sectors, including aerospace, automotive, renewable energy, marine applications, and lightweight construction. In these applications, surface quality is a relevant factor because visible and non-visible defects may compromise both the mechanical performance and the visual appearance of the final product. Defects such as cracks, knots, mineral stains, structural discontinuities, and surface irregularities can reduce product reliability, affect customer acceptance, and increase rework during the manufacturing process.
In the evaluated industrial context, surface inspection was traditionally performed by human operators through visual examination of the panels. Although manual inspection is commonly used in wood-processing environments, it presents several limitations, including subjectivity, operator fatigue, inconsistent criteria, and reduced repeatability under continuous production conditions. These limitations make it difficult to guarantee stable and timely detection of surface defects, especially when the defects are small, irregular, or visually subtle.
To address this limitation, the present study focuses on designing a deep learning-based model architecture for an automated defect detection system in balsa wood panels. The inspection problem was formulated as an industrial quality-control task in which the model must analyze panel surface images and identify regions associated with structural or visual defects. In this context, the model architecture was designed to learn the visual patterns of defective balsa wood surfaces and to generate detection outputs that can assist the automatic acceptance or rejection of panels within an industrial production environment.
3.2. Balsa Wood Panel Image Acquisition
Image acquisition was carried out in the production environment of the balsa wood processing facility described in subSection 3.1. The objective of this stage was to obtain a representative set of surface images from balsa wood panels under real industrial inspection conditions. The images were collected during the panel production process, where surface irregularities and visible defects naturally appear as a consequence of material variability, handling, cutting, drying, and manufacturing operations.
Representative examples of the acquired balsa wood panel images are shown in Figure 1. These samples illustrate the visual variability present in the dataset, including differences in wood grain, panel texture, lighting conditions, surface stains, cracks, splits, knots, and localized discontinuities.
A total of 292 images were captured over several days using a 13 MP mobile phone camera. This acquisition strategy allowed the dataset to include different surface appearances, lighting variations, panel textures, and defect patterns observed in routine production. The captured images corresponded to balsa wood panel surfaces containing different types of visible imperfections, including cracks, gaps, honeycomb-like defects, knots, pith-related defects, checks, and stains.
Although the original images were initially organized according to individual defect categories, all defect types were later consolidated into a single target class named Defect. This decision was aligned with the main objective of this study, which is to design a deep learning-based model architecture for an automated defect detection system in balsa wood panels, rather than to develop a fine-grained defect classification approach. Therefore, the image acquisition process was oriented toward constructing a dataset that enables the proposed architecture to learn representative visual patterns of defective surfaces and automatically localize regions associated with quality failures. In this way, the dataset supports the development of a model architecture capable of assisting automated industrial inspection by identifying whether a panel surface contains defects that may compromise its quality or suitability for production.
All images were acquired in RGB format, preserving color information because visual differences in stains, cracks, and surface discontinuities may provide relevant cues for defect detection. The resulting image set constituted the basis for the subsequent annotation, preprocessing, and model training stages.
3.3. Dataset Construction and Annotation Protocol
Initially, the acquired images were grouped according to visible defect patterns observed during the production process, including cracks, gaps, honeycomb-like defects, knots, pith-related defects, checks, and stains. However, these categories were later unified into the Defect class to define a consistent detection task suitable for industrial quality inspection. This strategy allowed the proposed model architecture to focus on learning common visual characteristics associated with surface failures, such as discontinuities, stains, irregular textures, and structural marks, regardless of their specific origin.
The final dataset consisted of 292 RGB images of balsa wood panel surfaces. These images were divided into two subsets: 208 images were assigned to the training set, and 84 images were used for validation. This split was defined to train the proposed architecture on representative defective surface patterns and to evaluate its ability to generalize to unseen panel images during the validation stage.
The annotation process was performed using Label Studio, an open-source data labeling platform [27]. Each defective region was manually marked and assigned to the Defect class.
Representative annotated samples were visually inspected and associated with Cohen’s kappa agreement values, providing an additional reference for annotation reliability. As illustrated in Figure 2, the annotated examples include defects of different sizes, shapes, and visual characteristics, confirming that the labeling protocol was able to consistently capture a broad range of surface failures in balsa wood panels.
After the annotation stage, the final labels were adapted to the YOLOv11 object detection format used in the training pipeline. In this format, each image is associated with a text file containing one annotation per line, represented by the class identifier and the normalized bounding-box coordinates.
3.4. Image Preprocessing and Data Augmentation
All images were processed in RGB format to preserve color and texture information associated with surface failures, including stains, cracks, knots, splits, and localized discontinuities. During training, the YOLOv11 pipeline resized the input images according to the selected experimental configuration and normalized pixel values internally. This preprocessing stage was essential to standardize the input data while preserving the visual characteristics of balsa wood surfaces, which are relevant for distinguishing natural wood grain from actual defects.
To artificially enhance variability and mitigate overfitting to specific visual conditions, the training dataset underwent domain-relevant data augmentation. The objective of this stage was to expose the proposed model architecture to variations that may occur in real industrial inspection scenarios, such as illumination changes, camera position variations, partial occlusions, and surface texture differences. The applied transformations included random occlusion, brightness/contrast adjustment, hue/saturation shift, mosaic augmentation, and random scaling and rotation.
Random occlusion was used to simulate partial loss of visual information caused by shadows, surface interruptions, or temporary obstruction during image acquisition. Brightness and contrast adjustments were applied within a range to emulate different illumination conditions in the inspection environment. Hue and saturation shifts of up to units were used to account for RGB sensor variability and color differences in balsa wood surfaces. Mosaic augmentation combined multiple images into a single composite sample, increasing the diversity of surface patterns and defect contexts observed by the model. Finally, random scaling and rotation were applied with up to 20% scale variation and rotation to improve robustness against changes in camera alignment and panel positioning.
Figure 3 shows representative examples of the augmentation effects applied during training. These transformations contributed to improving the generalization capacity of the proposed architecture by allowing the model to learn defect-related visual patterns under variable acquisition conditions.
3.5. Proposed YOLOv11-Based Detection Architecture
The proposed detection framework was designed using a YOLOv11-based object detection architecture adapted to the automatic identification of surface defects in balsa wood panels.
Recent studies have shown that YOLOv11 introduces architectural improvements aimed at increasing detection speed, accuracy, and robustness in complex visual environments [28]. Based on this principle, the objective of this stage was to define a deep learning model architecture capable of detecting defective regions with an adequate balance between localization accuracy, computational efficiency, and suitability for integration into an automated industrial inspection workflow. This design criterion is particularly relevant because balsa wood defects may appear at different scales, shapes, orientations, and contrast levels, making it necessary to extract both fine local details and high-level semantic information from panel surface images.
Following the general structure of modern YOLO-style detectors, the architecture is organized into three main components: backbone, neck, and detection head, as shown in Figure 4. The backbone is responsible for extracting hierarchical visual features from the input RGB image. In this stage, convolutional blocks progressively transform the original image into feature maps with different spatial resolutions, allowing the network to capture low-level texture patterns, intermediate structural cues, and high-level defect-related representations. This is essential for distinguishing actual defects from natural balsa wood grain, tonal variations, and panel joint patterns.
The final stage of the backbone incorporates the Spatial Pyramid Pooling-Fast (SPPF) module, which increases the receptive field and aggregates contextual information without introducing a high computational burden. This component is useful for surface defect inspection because some defects appear as small localized marks, while others correspond to elongated cracks, dark stains, knots, or structural discontinuities distributed across larger regions. By enriching the contextual representation, the SPPF module helps the model preserve relevant defect information before multi-scale feature fusion.
The neck performs feature aggregation by combining feature maps from different backbone levels. In the YOLOv11 architecture, C3k2 blocks are used to improve feature fusion while maintaining computational efficiency. This stage strengthens the interaction between shallow spatial details and deeper semantic information, which is important for detecting subtle defect boundaries and irregular surface patterns. Multi-scale aggregation allows the model to improve robustness when defects vary in size, contrast, and position within the balsa panel image. This design is consistent with recent advances in efficient object detection, where improved cross-scale feature interaction has been shown to enhance detection performance without excessively increasing computational cost [29].
Finally, the detection head generates the task-specific outputs, including the predicted bounding boxes, objectness confidence, and class probability associated with the Defect class. Since the proposed system was formulated as a single-class detection problem, the head focuses on localizing defective regions rather than differentiating among multiple defect categories. This design is aligned with the main objective of the study, which is to design a model architecture for an automated defect detection system capable of identifying whether a balsa wood panel contains quality failures that require rejection, rework, or further inspection.
Although the proposed framework is based on the standard YOLOv11 detection structure, its architectural rationale is supported by recent improvements in efficient real-time object detection. Partial convolution strategies have demonstrated that reducing redundant computation and memory access can improve inference efficiency in hardware-constrained scenarios [30]. Similarly, gather-and-distribute mechanisms have shown that strengthening multi-scale feature interaction can improve the detection of small or visually complex targets [29]. In addition, shape-aware localization losses such as Shape-IoU provide a useful reference for improving bounding-box regression when target regions present irregular geometries [31]. These principles support the architectural design adopted in this study, where the detection model must identify surface defects with variable morphology while remaining suitable for automated industrial inspection.
3.6. Experimental Configurations and Hyperparameter Settings
To systematically identify the most suitable YOLOv11 configuration for automated surface defect detection in balsa wood panels, seven experimental setups were designed and evaluated. These configurations were defined to analyze the influence of input image resolution, backbone scale, number of training epochs, batch size, initial learning rate, and optimizer strategy on defect localization accuracy and computational efficiency. The experimental design was aligned with the objective of this study, which is to design a deep learning-based model architecture for an automatic defect detection system rather than to perform fine-grained defect classification. Table 1 summarizes the configurations evaluated in this study.
YOLOv11 was selected because it provides an updated real-time object detection framework with improved feature extraction, optimized efficiency, and support for object detection tasks [32]. In addition, the selected hyperparameters were defined according to common YOLO training settings, where image size, batch size, number of epochs, learning rate, optimizer, momentum, and weight decay directly influence convergence behavior, detection performance, and generalization capacity [33,34]. The baseline configuration was established using the default YOLOv11 training parameters with an input size of 640 pixels and 50 epochs. This setup served as the reference point for comparing more specialized configurations. The remaining experiments explored nano, small, and medium YOLOv11 variants to evaluate the trade-off between model capacity and inference feasibility. Lower image resolutions, such as 512 pixels, were included to assess faster and lighter configurations, whereas higher resolutions, such as 768 and 1024 pixels, were used to improve the detection of small cracks, stains, knots, and localized surface discontinuities. Since larger image sizes increase memory consumption, the batch size was progressively reduced in the highest-resolution configurations.
The optimizer strategy was also varied to examine its effect on model convergence. Default optimization was used in the baseline and nano-scale experiments, while SGD with momentum was tested to improve stable convergence in small and medium configurations. AdamW with weight decay was incorporated in higher-resolution models to promote regularization and reduce overfitting, especially considering the limited size of the custom balsa wood defect dataset. This systematic configuration analysis provides the experimental basis for identifying the most appropriate YOLOv11 architecture for automatic defect detection in industrial balsa wood panel inspection.
Table 2 provides a detailed description of each configuration and its experimental rationale. These descriptions are important for interpreting the comparative results, since each setup was designed to test a specific balance between detection accuracy, training stability, model complexity, and computational cost. In particular, the medium-backbone configurations were expected to provide stronger feature representations, whereas the nano and small configurations were included to analyze lighter alternatives suitable for future deployment in constrained industrial inspection environments.
This systematic configuration analysis establishes a robust experimental framework for comparing YOLOv11-based detection models under the specific visual conditions of balsa wood panel inspection. By varying model scale, resolution, training duration, and optimization strategy, the study provides a controlled basis for selecting the architecture that best supports an automatic surface defect detection system in an industrial quality-control scenario.
3.7. Model Training Procedure
The training process was conducted using Google Colab (Google LLC, Mountain View, CA, USA), leveraging an NVIDIA Tesla T4 GPU (NVIDIA Corporation, Santa Clara, CA, USA) provided by the Google Compute Engine backend. The implementation was developed in Python using the Ultralytics YOLO framework, which provides configurable training parameters such as input image size, number of epochs, batch size, initial learning rate, optimizer, momentum, weight decay, and device selection. The computational environment included 12.7 GB of system RAM, approximately 15 GB of usable GPU memory, and 112 GB of disk space, of which approximately 38 GB were used during the experiments. GPU acceleration was explicitly enabled in the YOLOv11 training configuration by setting device=0, ensuring that the model used the available CUDA-compatible hardware during all training iterations.
The dataset was accessed from Google Drive and loaded through the YOLO configuration file, which defined the training and validation directories, the number of classes, and the class name used in this study. Since the detection task was formulated as a single-class problem, the configuration file defined one class only, where class identifier 0 corresponded to Defect. This setup allowed the training pipeline to process each annotated image as part of an automatic surface defect detection task for balsa wood panels.
3.8. Evaluation Metrics
The YOLOv11 configurations were evaluated using a set of experimental descriptors, detection performance metrics, training loss values, and computational efficiency indicators. The selected variables were: precision, recall, mAP50, mAP50-95, seg_loss, cls_loss, box_loss. These variables allowed a comprehensive comparison between detection accuracy, convergence behavior, model complexity, and inference efficiency.
3.8.1. Precision
Precision measures the proportion of predicted defective regions that were correctly detected. In the context of balsa wood panel inspection, high precision indicates a low number of false alarms.
where represents true positives and represents false positives.
3.8.2. Recall
Recall measures the proportion of real defective regions that were correctly detected by the model. This metric is important because missed defects may compromise the quality of the final balsa wood panel.
where represents false negatives.
3.8.3. mAP50
The mAP50 metric represents the mean Average Precision computed at an Intersection over Union threshold of 0.50. This metric evaluates whether the predicted bounding boxes overlap sufficiently with the annotated defect regions.
where C is the number of classes and is the Average Precision for class c at an IoU threshold of 0.50. Since this study uses only one class, Defect, .
3.8.4. mAP50-95
The mAP50-95 metric provides a stricter evaluation by averaging the Average Precision across IoU thresholds from 0.50 to 0.95 with a step of 0.05.
where represents each IoU threshold and C is the number of classes.
3.8.5. Segmentation Loss
The variable seg_loss measures the error associated with the predicted defect region masks when a segmentation-based YOLOv11 configuration is used. It quantifies the difference between the predicted mask and the ground-truth annotation.
where is the predicted mask, is the ground-truth mask, is the segmentation loss function, and N is the number of annotated instances.
3.8.6. Classification Loss
The variable cls_loss measures the classification error of the model. In this study, it evaluates how well the model assigns the detected region to the Defect class.
where is the ground-truth class label and is the predicted probability for the Defect class.
3.8.7. Bounding Box Loss
The variable box_loss measures the localization error between the predicted bounding box and the ground-truth bounding box. Lower values indicate better spatial localization of defective regions.
where is the predicted bounding box, is the ground-truth bounding box, and is the bounding-box regression loss.
4. Results
4.1. Comparative Analysis of the Different Models
Table 3 presents the global detection performance, model size, and inference time obtained for each YOLOv11 configuration evaluated in the balsa wood defect detection task. These results provide a comparative overview of the trade-off between detection accuracy, localization robustness, model complexity, and computational efficiency. The analysis is particularly relevant for this study because the objective is not only to obtain high detection accuracy, but also to identify a model architecture suitable for integration into an automated surface defect inspection system.
Among the evaluated configurations, YOLOv11_m512 achieved the best overall detection performance, with the highest mAP@0.5 value of 0.870 and the highest mAP@0.5:0.95 value of 0.354. This result indicates that the medium backbone combined with a moderate input resolution of 512 pixels and SGD optimization provided the most effective balance for detecting defects in balsa wood panels. The improvement in mAP@0.5 suggests that this configuration was more capable of correctly identifying defective regions, while the higher mAP@0.5:0.95 reflects better localization robustness under stricter IoU thresholds.
The YOLOv11_s640 configuration obtained the second-best mAP@0.5:0.95 value of 0.326, with a precision of 0.843 and an inference time of 33.91 ms per image. This result suggests that the small backbone with 640-pixel images and SGD optimization represents a competitive alternative when a lower model size is required. Compared with YOLOv11_m512, this configuration reduced the model size from 38.61 MB to 18.28 MB, while maintaining relatively strong detection performance. Therefore, YOLOv11_s640 may be useful in scenarios where computational resources are more limited.
The highest precision was obtained by YOLOv11_n512, with a value of 0.857. However, its mAP@0.5 value of 0.721 and mAP@0.5:0.95 value of 0.311 were lower than those achieved by YOLOv11_m512 and YOLOv11_s640. This indicates that although YOLOv11_n512 produced fewer false positive detections, its overall localization and detection robustness were more limited. This behavior is consistent with the reduced capacity of the nano backbone, which may be less effective at learning complex surface defect patterns such as cracks, stains, knots, and irregular discontinuities.
The baseline model achieved the fastest inference time, with 28.81 ms per image, and the smallest model size together with YOLOv11_n512. However, its mAP@0.5:0.95 value of 0.294 was lower than those of YOLOv11_m512, YOLOv11_s640, and YOLOv11_n512. This result shows that the baseline configuration provides an efficient reference model but does not offer the strongest localization performance for the proposed defect detection task.
The high-resolution AdamW-based configurations, YOLOv11_s768, YOLOv11_m768_AdamW, and YOLOv11_m1024_AdamW, showed lower performance than expected. In particular, YOLOv11_m1024_AdamW produced the highest inference time, 67.34 ms per image, while obtaining one of the lowest mAP@0.5:0.95 values. These results suggest that increasing image resolution did not necessarily improve detection performance for this dataset. The reduced batch sizes required by the higher-resolution configurations and the limited number of training images may have affected convergence and generalization.
4.2. Training Loss and Convergence Analysis
Figure 5 shows the evolution of mAP@0.5 and mAP@0.5:0.95 scores across all YOLOv11 configurations during training. In general, the evaluated models exhibit a progressive increase in detection performance during the first training epochs, indicating that the architectures were able to learn representative visual patterns associated with defective regions in balsa wood panels. The mAP@0.5 curves in Figure 5a reach higher values than the mAP@0.5:0.95 curves in Figure 5b, which is expected because mAP@0.5 uses a more permissive IoU threshold, whereas mAP@0.5:0.95 evaluates localization quality under stricter overlap conditions.
Among all configurations, YOLOv11_m512 exhibits the most consistent and superior convergence behavior. Its mAP@0.5 curve increases rapidly during the initial epochs and remains above the other configurations for most of the training process, reaching the strongest final performance. The same behavior is observed in the mAP@0.5:0.95 curve, where YOLOv11_m512 achieves the highest localization robustness. This confirms that the medium backbone combined with a 512-pixel input size and SGD optimization provided the most effective configuration for learning surface defect patterns in balsa wood panels. YOLOv11_s640 also shows competitive performance, particularly during the early and intermediate epochs, although its final mAP@0.5:0.95 remains below YOLOv11_m512. In contrast, the high-resolution AdamW-based configurations, especially YOLOv11_m768_AdamW and YOLOv11_m1024_AdamW, present slower and less stable mAP growth, suggesting that increasing input resolution did not improve convergence under the available dataset size and batch-size constraints.
Figure 6 presents the evolution of bounding box loss and classification loss during training for all YOLOv11 configurations. The box loss curves in Figure 6a decrease progressively across epochs, indicating improved localization of defective regions. Similarly, the classification loss curves in Figure 6b show a strong reduction during the first epochs, followed by a more gradual stabilization phase. This behavior indicates that the models learned to assign defective regions to the Defect class while progressively refining bounding-box localization.
The loss curves further support the selection of YOLOv11_m512 as the best-performing architecture. This configuration achieves the lowest final box loss and the lowest classification loss among the evaluated models, indicating better spatial localization and stronger class prediction stability. YOLOv11_s640 also demonstrates favorable convergence, with low final losses and competitive mAP values. Conversely, YOLOv11_s768, YOLOv11_m768_AdamW, and YOLOv11_m1024_AdamW maintain higher final loss values, which is consistent with their lower mAP results reported in Table 3. Overall, these convergence patterns confirm that the best results were obtained not by increasing image resolution alone, but by selecting an appropriate balance between model scale, optimizer strategy, input size, and batch configuration.
4.3. Impact of Hyperparameters
Figure 7 illustrates the trade-off between localization accuracy and inference speed for each YOLOv11 configuration evaluated in the balsa wood defect detection task.
The horizontal axis represents the average inference time per image, while the vertical axis shows the mAP@0.5:0.95 value. The circle size corresponds to the model size in megabytes, providing an additional visual reference for computational complexity. This representation allows a direct comparison among the evaluated configurations by jointly considering accuracy, inference efficiency, and storage requirements.
4.4. Model Performance Comparison
Figure 8 presents a radar-based comparison of the evaluated YOLOv11 configurations using six normalized criteria: precision, recall, mAP@0.5, mAP@0.5:0.95, inference speed, and model size. In this analysis, the speed and model size axes were represented using inverse normalization, meaning that higher values indicate faster inference and lower storage requirements, respectively. This representation provides a compact visual summary of the trade-off between detection performance and computational efficiency, which is essential for selecting a model suitable for automated industrial inspection of balsa wood panels.
As shown in Figure 8, YOLOv11_m512 achieved the most favorable overall profile among the evaluated configurations. This model obtained the strongest values in recall, mAP@0.5, and mAP@0.5:0.95, confirming its superior capacity to detect defective regions and maintain better localization robustness under stricter IoU thresholds. Although its model size is larger than that of the baseline and nano configurations, its inference speed remains competitive, indicating that the medium backbone at 512 pixels provides an effective balance between feature representation capacity and computational cost.
The YOLOv11_s640 configuration also presents a balanced radar profile. It achieved competitive precision, recall, and mAP values while maintaining a smaller model size than YOLOv11_m512. This behavior suggests that YOLOv11_s640 is a suitable alternative when computational resources are more limited or when deployment requires a lighter model without a substantial loss in detection accuracy. Its performance confirms that a small backbone with 640-pixel input resolution and SGD optimization can capture relevant visual patterns associated with balsa wood surface defects.
The YOLOv11_Baseline and YOLOv11_n512 configurations stand out in the efficiency-related axes, particularly speed and model size. These models are lightweight and suitable for rapid inference; however, their mAP@0.5:0.95 values are lower than those obtained by YOLOv11_m512 and YOLOv11_s640. This indicates that although lightweight configurations may reduce computational cost, their reduced representation capacity can limit their ability to accurately localize irregular defects such as cracks, stains, knots, and surface discontinuities.
In contrast, the high-resolution AdamW-based configurations, YOLOv11_s768, YOLOv11_m768_AdamW, and YOLOv11_m1024_AdamW, showed less favorable radar profiles. Despite using larger input resolutions, these models did not achieve superior detection performance and also presented lower efficiency due to increased inference time and larger model size. This result reinforces the finding that increasing image resolution alone does not guarantee better performance, especially when the available dataset is limited and the batch size must be reduced due to GPU memory constraints.
4.5. Inference and Visual Results
Figure 9 presents representative qualitative inference results obtained using the best-performing configuration, YOLOv11_m512. This model was selected based on its superior quantitative performance, achieving the highest mAP@0.5 and mAP@0.5:0.95 values among all evaluated configurations. The visual examples show the model’s ability to detect defective regions on balsa wood panel surfaces under different visual conditions, including variations in illumination, wood grain texture, defect size, orientation, and background appearance.
The qualitative results demonstrate that the proposed model can localize different types of surface defects, including cracks, elongated splits, dark stains, knots, and localized discontinuities. These defects appear with different scales and shapes, which confirms the relevance of using a detection-based architecture rather than a simple image-level classification approach. In several cases, the model correctly identifies small and narrow defects embedded within the natural texture of the balsa wood, suggesting that the learned features are sufficiently discriminative to separate actual surface failures from normal wood grain patterns.
The results also show that YOLOv11_m512 maintains stable detection behavior across heterogeneous panel appearances. Some samples include strong tonal variation, visible panel joints, darker regions, and changes in surface reflectance, yet the model continues to identify the defective regions with visually coherent bounding boxes. This is relevant for industrial inspection because balsa wood panels may present natural texture variability that can be confused with defects during manual inspection.
4.6. Architectural Adaptation of the Selected YOLOv11_m512 Model
The final adapted model was not defined as a completely new YOLOv11 variant with redesigned internal operators, but as a task-specific YOLOv11-based detection architecture optimized for the visual characteristics of balsa wood defects.
Figure 10 summarizes the task-specific adaptation of the selected YOLOv11_m512 model for balsa wood defect detection.
4.6.1. Adapted Input Layer and Resolution Standardization
The first adaptation of the selected YOLOv11_m512 model was the standardization of the input layer to process RGB balsa wood panel images at a fixed resolution of pixels. Let be the original RGB image acquired from a balsa wood panel surface. The input transformation applied before feeding the image into the network is defined as follows:
where denotes the resizing operation to pixels. The pixel values were normalized to the range as:
where represents the pixel location and denotes the color channel. This input adaptation was selected to preserve relevant visual information related to texture, color, contrast, cracks, stains, knots, splits, and localized discontinuities, while avoiding the computational burden observed in higher-resolution configurations.
4.6.2. Medium-Scale Backbone for Hierarchical Defect Feature Extraction
At the backbone level, the selected YOLOv11_m512 configuration uses a medium-scale feature extractor to learn hierarchical representations from balsa wood panel surfaces. The feature extraction process can be represented as:
where is the feature map produced at layer l, denotes the backbone operation at that level, and represents its trainable parameters. The initial feature map is defined as:
The hierarchical structure allows the model to progressively extract low-level texture features, intermediate surface irregularities, and high-level defect-related representations. This process is particularly relevant for balsa wood inspection because natural grain transitions and tonal variations can visually resemble actual defects. The medium backbone increases the representational capacity of the model compared with nano and small variants, while maintaining a lower computational cost than higher-resolution configurations.
The general feature hierarchy can be expressed as:
where contains finer spatial details, represents intermediate features, and contains deeper semantic information. This multi-level representation is essential for detecting defects with different sizes, shapes, and visual contrasts.
4.6.3. Contextual Feature Representation Through the SPPF Module
The final stage of the backbone incorporates contextual feature aggregation through the Spatial Pyramid Pooling-Fast (SPPF) module. This component expands the effective receptive field without excessively increasing the computational cost. Given a high-level feature map , the contextual representation can be formulated as:
where denotes max-pooling with kernel size , and represents feature concatenation followed by convolutional transformation. This operation allows the model to combine local and contextual information, helping it distinguish isolated defects from natural wood grain, stains, panel joints, and broader surface patterns.
For balsa wood inspection, this contextual representation is important because some defects appear as small localized marks, while others correspond to elongated cracks or larger surface discontinuities. Therefore, the adapted model benefits from contextual information before the multi-scale fusion stage.
4.6.4. Multi-Scale Feature Aggregation in the Neck
The neck component of the adapted architecture aggregates feature maps from different backbone levels to improve detection robustness. This stage combines shallow spatial details with deeper semantic information, which is necessary for detecting both small cracks and larger defects. The multi-scale fusion process can be expressed as:
where is the fused feature map at scale s, denotes the neck fusion operation, and represents upsampling from a deeper feature level. In concatenation-based feature fusion, this operation can be represented as:
where represents the convolutional transformation applied after concatenation. This multi-scale aggregation enables the model to preserve fine details from shallow layers while incorporating semantic information from deeper layers.
For the balsa wood defect detection task, this adaptation is relevant because surface failures vary considerably in scale and morphology. Small dark spots and narrow cracks require high-resolution spatial details, whereas knots, stains, and larger structural discontinuities require broader contextual understanding. The experimental results confirmed that YOLOv11_m512 provided the most effective balance for this multi-scale detection requirement.
4.6.5. Single-Class Detection Head for Defect Localization
The detection head was adapted to the single-class industrial inspection task. Instead of predicting multiple object categories, the final output layer was configured to detect only one class, named Defect. For each candidate prediction i, the detection head outputs a bounding box and a defect confidence score:
where represents the predicted bounding-box center, are the predicted width and height, and is the probability that the region contains a defect. Since the number of target classes is one, the class set is defined as:
The predicted defect probability is obtained through a sigmoid activation:
where is the logit produced by the detection head for prediction i. This modification reduces the classification complexity and aligns the model with the practical objective of the proposed system: localizing defective regions that may require rejection, rework, or manual verification.
5. Discussion
The proposed YOLOv11-based architecture for automated surface defect detection in balsa wood panels demonstrated promising performance for industrial visual inspection. The comparative experiments showed that YOLOv11_m512 achieved the best overall results among the seven evaluated configurations, with a precision of 0.829, recall of 0.889, mAP@0.5 of 0.870, and mAP@0.5:0.95 of 0.354. These results indicate that the model was able to detect most defective regions while maintaining a reasonable level of localization robustness under stricter IoU thresholds. The high recall value is particularly relevant in the context of quality control, since missed defects may lead to the acceptance of panels with cracks, stains, knots, splits, or localized discontinuities that could compromise product quality.
The superiority of YOLOv11_m512 suggests that the medium backbone, combined with a 512-pixel input resolution and SGD optimization, provided the most effective balance between feature extraction capacity and training stability. Unlike the baseline and nano configurations, which were smaller and faster but less robust in terms of localization, YOLOv11_m512 was better able to learn complex defect-related visual patterns embedded within the natural texture of balsa wood. This is important because balsa panels exhibit heterogeneous grain structures, tonal variations, panel joints, and surface reflectance changes that may visually resemble actual defects. Therefore, the stronger representation capacity of the medium model contributed to improved discrimination between true defects and natural surface patterns.
The results also showed that increasing input resolution alone did not guarantee better detection performance. The YOLOv11_m768_AdamW and YOLOv11_m1024_AdamW configurations obtained lower mAP@0.5 and mAP@0.5:0.95 values despite using larger image sizes. In particular, YOLOv11_m1024_AdamW produced the highest inference time, 67.34 ms per image, while achieving one of the lowest mAP@0.5:0.95 values. This behavior may be associated with the reduced batch size required by high-resolution training, the limited number of annotated images, and the increased difficulty of optimizing larger input representations under constrained GPU memory. These findings reinforce the idea that model performance depends on the interaction between architecture scale, image resolution, optimizer strategy, batch size, and dataset characteristics, rather than on a single hyperparameter.
The qualitative inference results further support the quantitative findings. The YOLOv11_m512 model successfully detected defects with different visual characteristics, including small dark spots, elongated cracks, surface splits, knots, stains, and irregular discontinuities.
Despite these promising results, the mAP@0.5:0.95 value of 0.354 indicates that localization under strict IoU thresholds remains a challenging aspect of the task. This result suggests that, although the model can detect defective regions effectively, the predicted bounding boxes may not always match the ground-truth annotations with high spatial precision. This limitation is understandable because balsa wood defects frequently present irregular boundaries, low contrast, elongated shapes, and ambiguous transitions between defective and non-defective areas. Future improvements could incorporate more precise annotation strategies, additional training samples, and alternative localization losses to improve bounding-box alignment.
Another relevant limitation is the possibility of false positive detections caused by natural wood patterns. Some non-defective regions, such as grain transitions, adhesive lines, panel joints, stains, shadows, or sanding marks, may resemble surface failures. In an industrial inspection system, false positives may increase the number of panels sent for manual verification or unnecessary rework. However, from a quality-control perspective, this behavior may be preferable to false negatives in early deployment stages, because missing a critical defect could have a greater impact on product reliability. Future work should therefore include hard-negative mining, where visually confusing but acceptable wood patterns are intentionally incorporated into training to reduce false alarms.
Overall, the results confirm that YOLOv11_m512 provides the most effective architecture for automated surface defect detection in balsa wood panels among the evaluated configurations. The model achieved the best balance between detection accuracy, recall, localization performance, and inference efficiency. These findings support the feasibility of integrating YOLOv11-based computer vision into industrial quality-control workflows, while also identifying opportunities for improving localization accuracy, reducing false positives, and expanding the dataset for broader generalization.
6. Conclusions and Future Work
6.1. Conclusions
This study presented a YOLOv11-based deep learning architecture for the automated detection of surface defects in balsa wood panels. The proposed approach was designed to support industrial quality-control processes by identifying defective regions in panel surfaces using a single target class, Defect. This formulation allowed the model to focus on the localization of visually relevant surface failures, including cracks, splits, knots, stains, and localized discontinuities, rather than performing a fine-grained classification of defect types.
A total of seven YOLOv11 configurations were systematically evaluated by varying model scale, input image resolution, number of epochs, batch size, learning rate, and optimizer strategy. The experimental results showed that YOLOv11_m512 achieved the best overall performance, with a precision of 0.829, recall of 0.889, mAP@0.5 of 0.870, and mAP@0.5:0.95 of 0.354. This configuration also maintained a feasible inference time of 34.09 ms per image and a model size of 38.61 MB, demonstrating an effective balance between detection accuracy, localization robustness, and computational efficiency.
The comparative analysis revealed that increasing image resolution alone did not necessarily improve detection performance. High-resolution configurations based on AdamW, such as YOLOv11_m768_AdamW and YOLOv11_m1024_AdamW, showed lower mAP values and higher inference times. In contrast, the YOLOv11_m512 configuration provided stronger convergence and better defect localization, suggesting that model capacity, image resolution, batch size, and optimizer strategy must be jointly balanced for this type of industrial inspection task.
The qualitative inference results confirmed the practical applicability of the proposed architecture. The best-performing model was able to detect defects under heterogeneous surface conditions, including variations in wood grain, illumination, panel texture, defect morphology, and background appearance. These results support the feasibility of integrating YOLOv11-based computer vision into automated inspection systems for balsa wood panel quality control, reducing dependence on manual inspection and providing a foundation for more objective and consistent industrial decision-making.
6.2. Future Work
Future work will focus on improving the robustness and generalization capacity of the proposed defect detection architecture. First, the dataset should be expanded with additional images acquired from different industrial environments, lighting conditions, camera positions, panel types, and production batches. This extension would allow the model to learn a wider range of surface appearances and reduce the risk of overfitting to a specific inspection context.
A second research direction involves refining the annotation protocol. Although the single-class Defect formulation is suitable for binary industrial inspection, future versions of the dataset could include multiple defect categories, such as cracks, knots, stains, splits, holes, and adhesive or joint-related defects. This would allow the system not only to detect defective regions, but also to support defect-type analysis and more detailed quality grading.
Future studies should also incorporate hard-negative samples into the training process. These samples should include non-defective regions that visually resemble defects, such as natural grain transitions, sanding marks, shadows, panel joints, and harmless color variations. Including these challenging examples would help reduce false positives and improve the reliability of the system in real production environments.
Finally, future work will address real-time deployment in industrial inspection hardware. The selected model should be tested on edge-computing platforms such as Raspberry Pi, NVIDIA Jetson, or other embedded devices connected to industrial cameras. This stage would allow the validation of inference speed, processing stability, and integration with automated rejection or alert mechanisms. A 5-fold cross-validation framework should also be implemented to provide statistically robust mean performance metrics and standard deviations, strengthening the reproducibility and reliability of the proposed approach.
References
- Zhang, C.; Wang, C.; Zhao, L.; Qu, X.; Gao, X. A method of particleboard surface defect detection and recognition based on deep learning. Wood Mater. Sci. Eng. 2025, 20, 50–61. [Google Scholar] [CrossRef]
- del Tejo-Catala, O.; Perez, J.; Garcia, N.; Perez-Cortes, J.C.; Del Ser, J. WoodAD: A New Dataset and a Comparison of Deep Learning Approaches for Wood Anomaly Detection. Expert Syst. 2025, 42. [Google Scholar] [CrossRef]
- Ge, Y.; Ji, H.; Liu, X. Wood surface defect detection based on improved YOLOv8. Signal Image Video Process. 2025, 19. [Google Scholar] [CrossRef]
- Ali, A.R.; Ramadan, M.W.A.; Helal, M. Real-Time Detection of Surface Cracks in Wood Using Deep Learning-Based Image Analysis for Quality Control. In Proceedings of the 2025 International Telecommunications Conference, ITC-Egypt; 2025; 2025, pp. 740–745. [Google Scholar] [CrossRef]
- Jing, H.; Zhou, W.; Cai, S.; Ge, C. SDE-YOLO:A Real-time Method for Oriented Wood Defect Detection based on SimAM. In Proceedings of the 2025 International Conference on Signal Processing, Computer Networks and Communications, SPCNC; 2025; 2025, pp. 456–464. [Google Scholar] [CrossRef]
- Li, R.; Zhong, S.; Yang, X. Wood Panel Defect Detection Based on Improved YOLOv8n. BioResources 2025, 20, 2556–2573. [Google Scholar] [CrossRef]
- Qin, M.; Li, H.; An, H.; Tong, X.; Huang, Y.; Dong, S.; Liang, Z. EFCW-YOLO: A High-Performance Lightweight Model for Automated Wood Surface Defect Detection. Forests 2025, 16. [Google Scholar] [CrossRef]
- Lin, X.; Xiao, X.; Sun, L.; Yang, X.; Leng, C.; Li, Y.; Niu, Z.; Meng, Y.; Gong, W. An Enhanced YOLOv8 Model with Symmetry-Aware Feature Extraction for High-Accuracy Solar Panel Defect Detection. Symmetry 2025, 17. [Google Scholar] [CrossRef]
- Kang, J.; Cen, Y.; Cen, Y.; Wang, K.; Liu, Y. CFIS-YOLO: a lightweight multi-scale fusion network for edge-deployable wood defect detection. Wood Mater. Sci. Eng. 2025. [Google Scholar] [CrossRef]
- Dou, W.; You, J. A Novel Wood Surface Defect Detection Model Based on Improved YOLOv8. BioResources 2025, 20, 5709–5730. [Google Scholar] [CrossRef]
- Long, Y.; Lin, W. Surface Defect Detection of Ultrathin Fiberboard Based on Improved YOLOv8x. J. Nondestruct. Eval. 2025, 44. [Google Scholar] [CrossRef]
- Yanai, Y.; Ishikawa, T. Comparative Evaluation of Deep Learning Methods for Wood Surface Defect Detection: A Comprehensive Study of Semantic Segmentation Approaches. In Proceedings of the Proceedings - 2025 International Symposium on Multimedia, ISM; 2025; 2025, pp. 69–72. [Google Scholar] [CrossRef]
- Luo, Q.; Xu, W.; Su, J.; Yang, C.; Gui, W.; Silven, O. Efficient Adaptation of Visual Foundation Models for Wood Defect Segmentation via Instance Linking and Feature Disentanglement. IEEE Trans. Instrum. Meas. 2025, 74. [Google Scholar] [CrossRef]
- Wang, B.; Wang, R.; Chen, Y.; Yang, C.; Teng, X.; Sun, P. FDD-YOLO: A Novel Detection Model for Detecting Surface Defects in Wood. Forests 2025, 16. [Google Scholar] [CrossRef]
- Wang, R.; Chen, Y.; Zhang, G.; Liang, F.; Mou, X.; Jin, H. DRR-YOLO: A Multiscale Wood Surface Defect Detection Method Based on Improved YOLOv8. IEEE Sens. J. 2025, 25, 16702–16719. [Google Scholar] [CrossRef]
- Liu, C.; Chen, K.; Wang, N.; Shi, W.; Jia, N. A lightweight multi-scale feature fusion method for detecting defects in water-based wood paint surfaces. Meas. J. Int. Meas. Confed. 2025, 253. [Google Scholar] [CrossRef]
- Chen, Z.; Feng, J.; Zhu, X.; Wang, B. YOLOv8-OCHD: A Lightweight Wood Surface Defect Detection Method Based on Improved YOLOv8. IEEE Access 2025, 13, 84435–84450. [Google Scholar] [CrossRef]
- Coutinho, B.; Martins, T.; Pereira, E.; Gonçalves, G. Real-Time Automated Visual Inspection of Decorative Wood Panels for Zero Defects Manufacturing. Proceedings of the Proceedings of the International Conference on Informatics in Control, Automation and Robotics 2025, Vol. 2, 446–456. [Google Scholar] [CrossRef]
- Zhu, Y.; Lin, Y.; Xu, Z.; Chen, D.; Zheng, K.; Yuan, Y. A lightweight wood defect segmentation network via multi-dimension boundary perception and guidance. Eng. Appl. Artif. Intell. 2025, 162. [Google Scholar] [CrossRef]
- Ban, T.; Fu, X.; Guo, S.; Dong, G. Lightweight vision-based system for automated wood surface defect detection in construction materials. Autom. Constr. 2026, 187. [Google Scholar] [CrossRef]
- Wu, J.; Zhang, A.; Deng, C.; Xu, J. SGCDT-YOLO: A multi-scale feature fusion network with content-aware selective mechanisms for wood surface defect detection. AIP Adv. 2026, 16. [Google Scholar] [CrossRef]
- Qu, J.; Pang, Y.; Wang, Z. WD-SEG: A Deep Learning Framework for Delicate and Accurate Wood Defect Segmentation. BioResources 2026, 21, 2925–2947. [Google Scholar] [CrossRef]
- Li, R.; Xu, Z.; Yang, F.; Yang, B. Defect detection for melamine-impregnated paper decorative particleboard surface based on deep learning. Wood Mater. Sci. Eng. 2026, 21, 379–392. [Google Scholar] [CrossRef]
- Yang, Q.; Chen, S.; Zhang, J.; Wu, Y.; Xu, F. An Improved YOLO Lightweight Wood Surface Defect Detection Model Integrated with a Dual-Path Fused Attention Network. Forests 2026, 17. [Google Scholar] [CrossRef]
- Jia, N.; Chen, K.; Liu, C.; Wang, N. A Public Image Dataset for Surface Defect Detection of Water-Based Coated Wood Products. Sci. Data 2026, 13. [Google Scholar] [CrossRef] [PubMed]
- Ly Duc, M.; Vo Thanh, K. YOLOv11-GATFormer: A unified framework for wood surface defect detection and classification. Proceedings of the Institution of Mechanical Engineers, Part C: Journal of Mechanical Engineering Science 2026. [Google Scholar] [CrossRef]
- Label Studio: Open-source data labeling tool. Available online: https://labelstud.io (accessed on 2026-05-24).
- Alif, M.A.R. YOLOv11 for Vehicle Detection: Advancements, Performance, and Applications in Intelligent Transportation Systems. arXiv 2024, arXiv:cs. [Google Scholar] [CrossRef]
- Wang, C.; He, W.; Nie, Y.; Guo, J.; Liu, C.; Han, K.; Wang, Y. Gold-YOLO: Efficient Object Detector via Gather-and-Distribute Mechanism. Proc. Adv. Neural Inf. Process. Syst. 2023, Vol. 36, 51094–51112. [Google Scholar] [CrossRef]
- Chen, J.; Kao, S.h.; He, H.; Zhuo, W.; Wen, S.; Lee, C.H.; Chan, S.H.G. Run, Don’t Walk: Chasing Higher FLOPS for Faster Neural Networks. In Proceedings of the Proceedings of the IEEE/CVF Conference on Computer Vision and Pattern Recognition (CVPR), 2023; pp. 12021–12031. [Google Scholar] [CrossRef]
- Wang, G.; Zhao, X.; Dang, D.; Wang, J.; Chen, Y. Enhancing Object Detection with Shape-IoU and Scale–Space–Task Collaborative Lightweight Path Aggregation. Appl. Sci. 2025, 15, 11976. [Google Scholar] [CrossRef]
- Ultralytics. Ultralytics YOLO11. 2024. Available online: https://docs.ultralytics.com/models/yolo11/ (accessed on 2026-05-25).
- Ultralytics. Model Training with Ultralytics YOLO. 2023. Available online: https://docs.ultralytics.com/modes/train/ (accessed on 2026-05-25).
- Ultralytics. Ultralytics YOLO Hyperparameter Tuning Guide. 2023. Available online: https://docs.ultralytics.com/guides/hyperparameter-tuning/ (accessed on 2026-05-25).
Figure 1.
Representative samples of balsa wood panel surface images acquired for the defect detection dataset.
Figure 1.
Representative samples of balsa wood panel surface images acquired for the defect detection dataset.
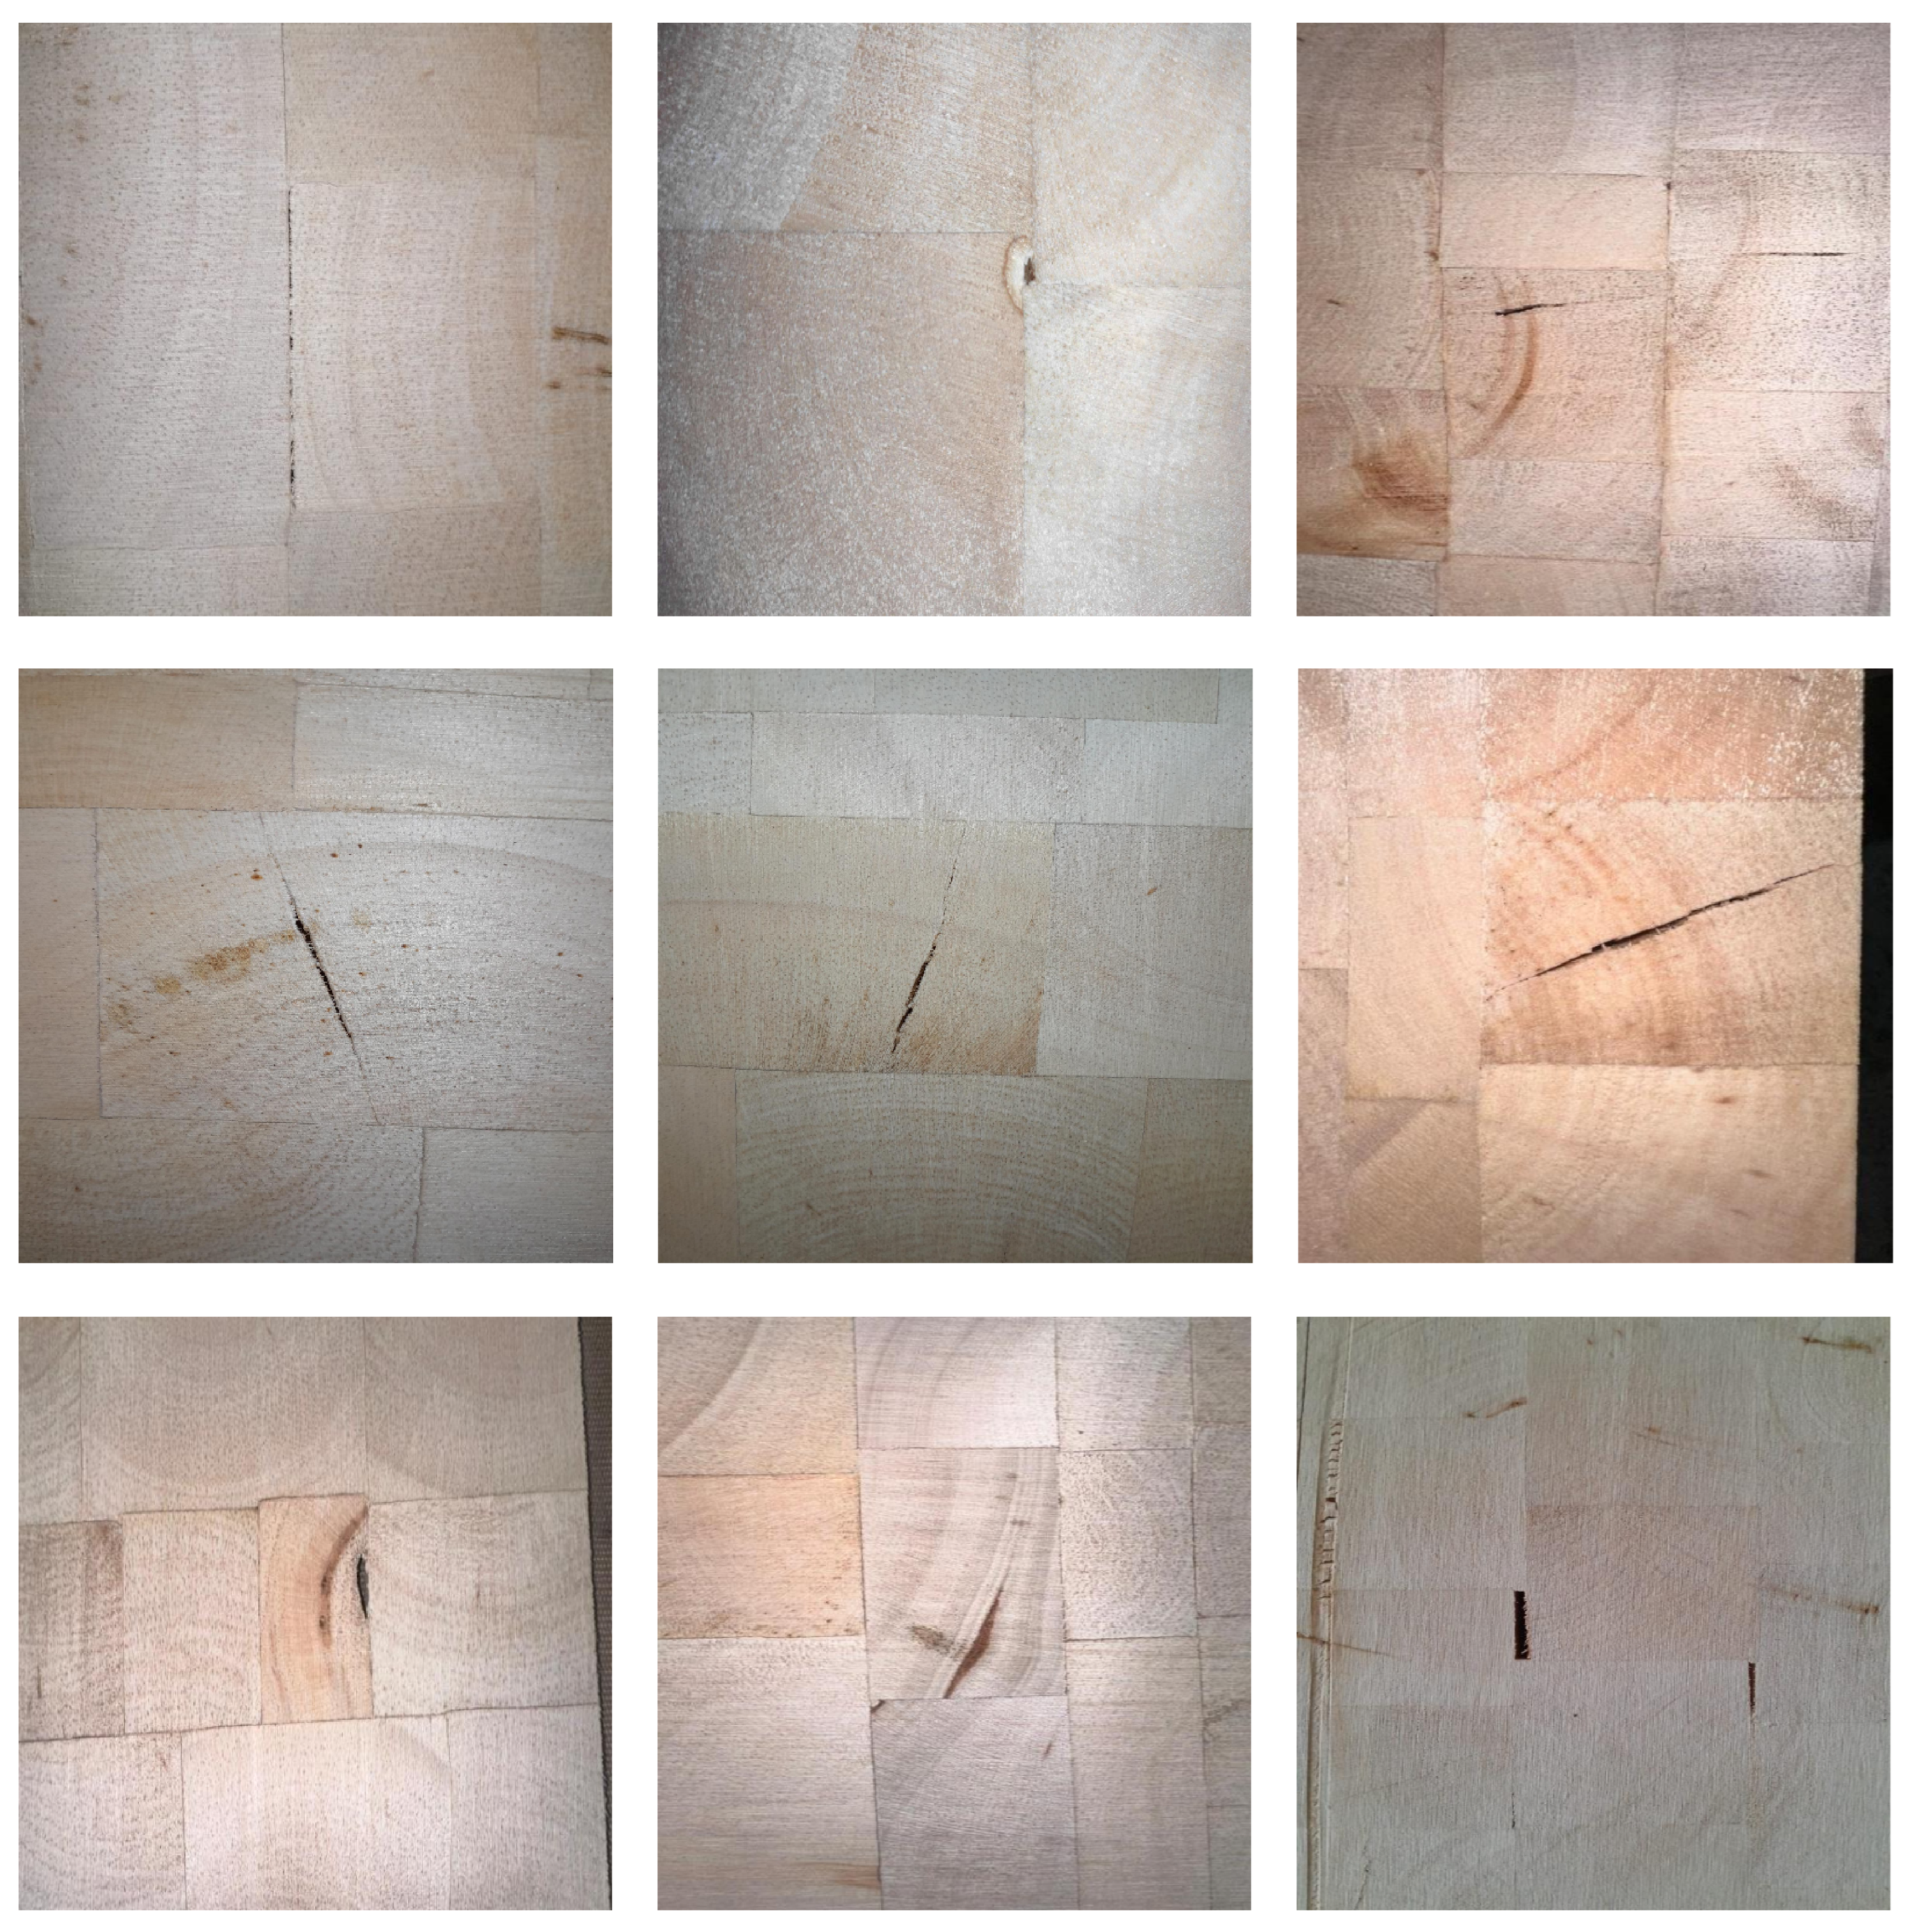
Figure 2.
Representative annotated examples of balsa wood panel defects, showing bounding-box labels and Cohen’s agreement values associated with the annotation process.
Figure 2.
Representative annotated examples of balsa wood panel defects, showing bounding-box labels and Cohen’s agreement values associated with the annotation process.
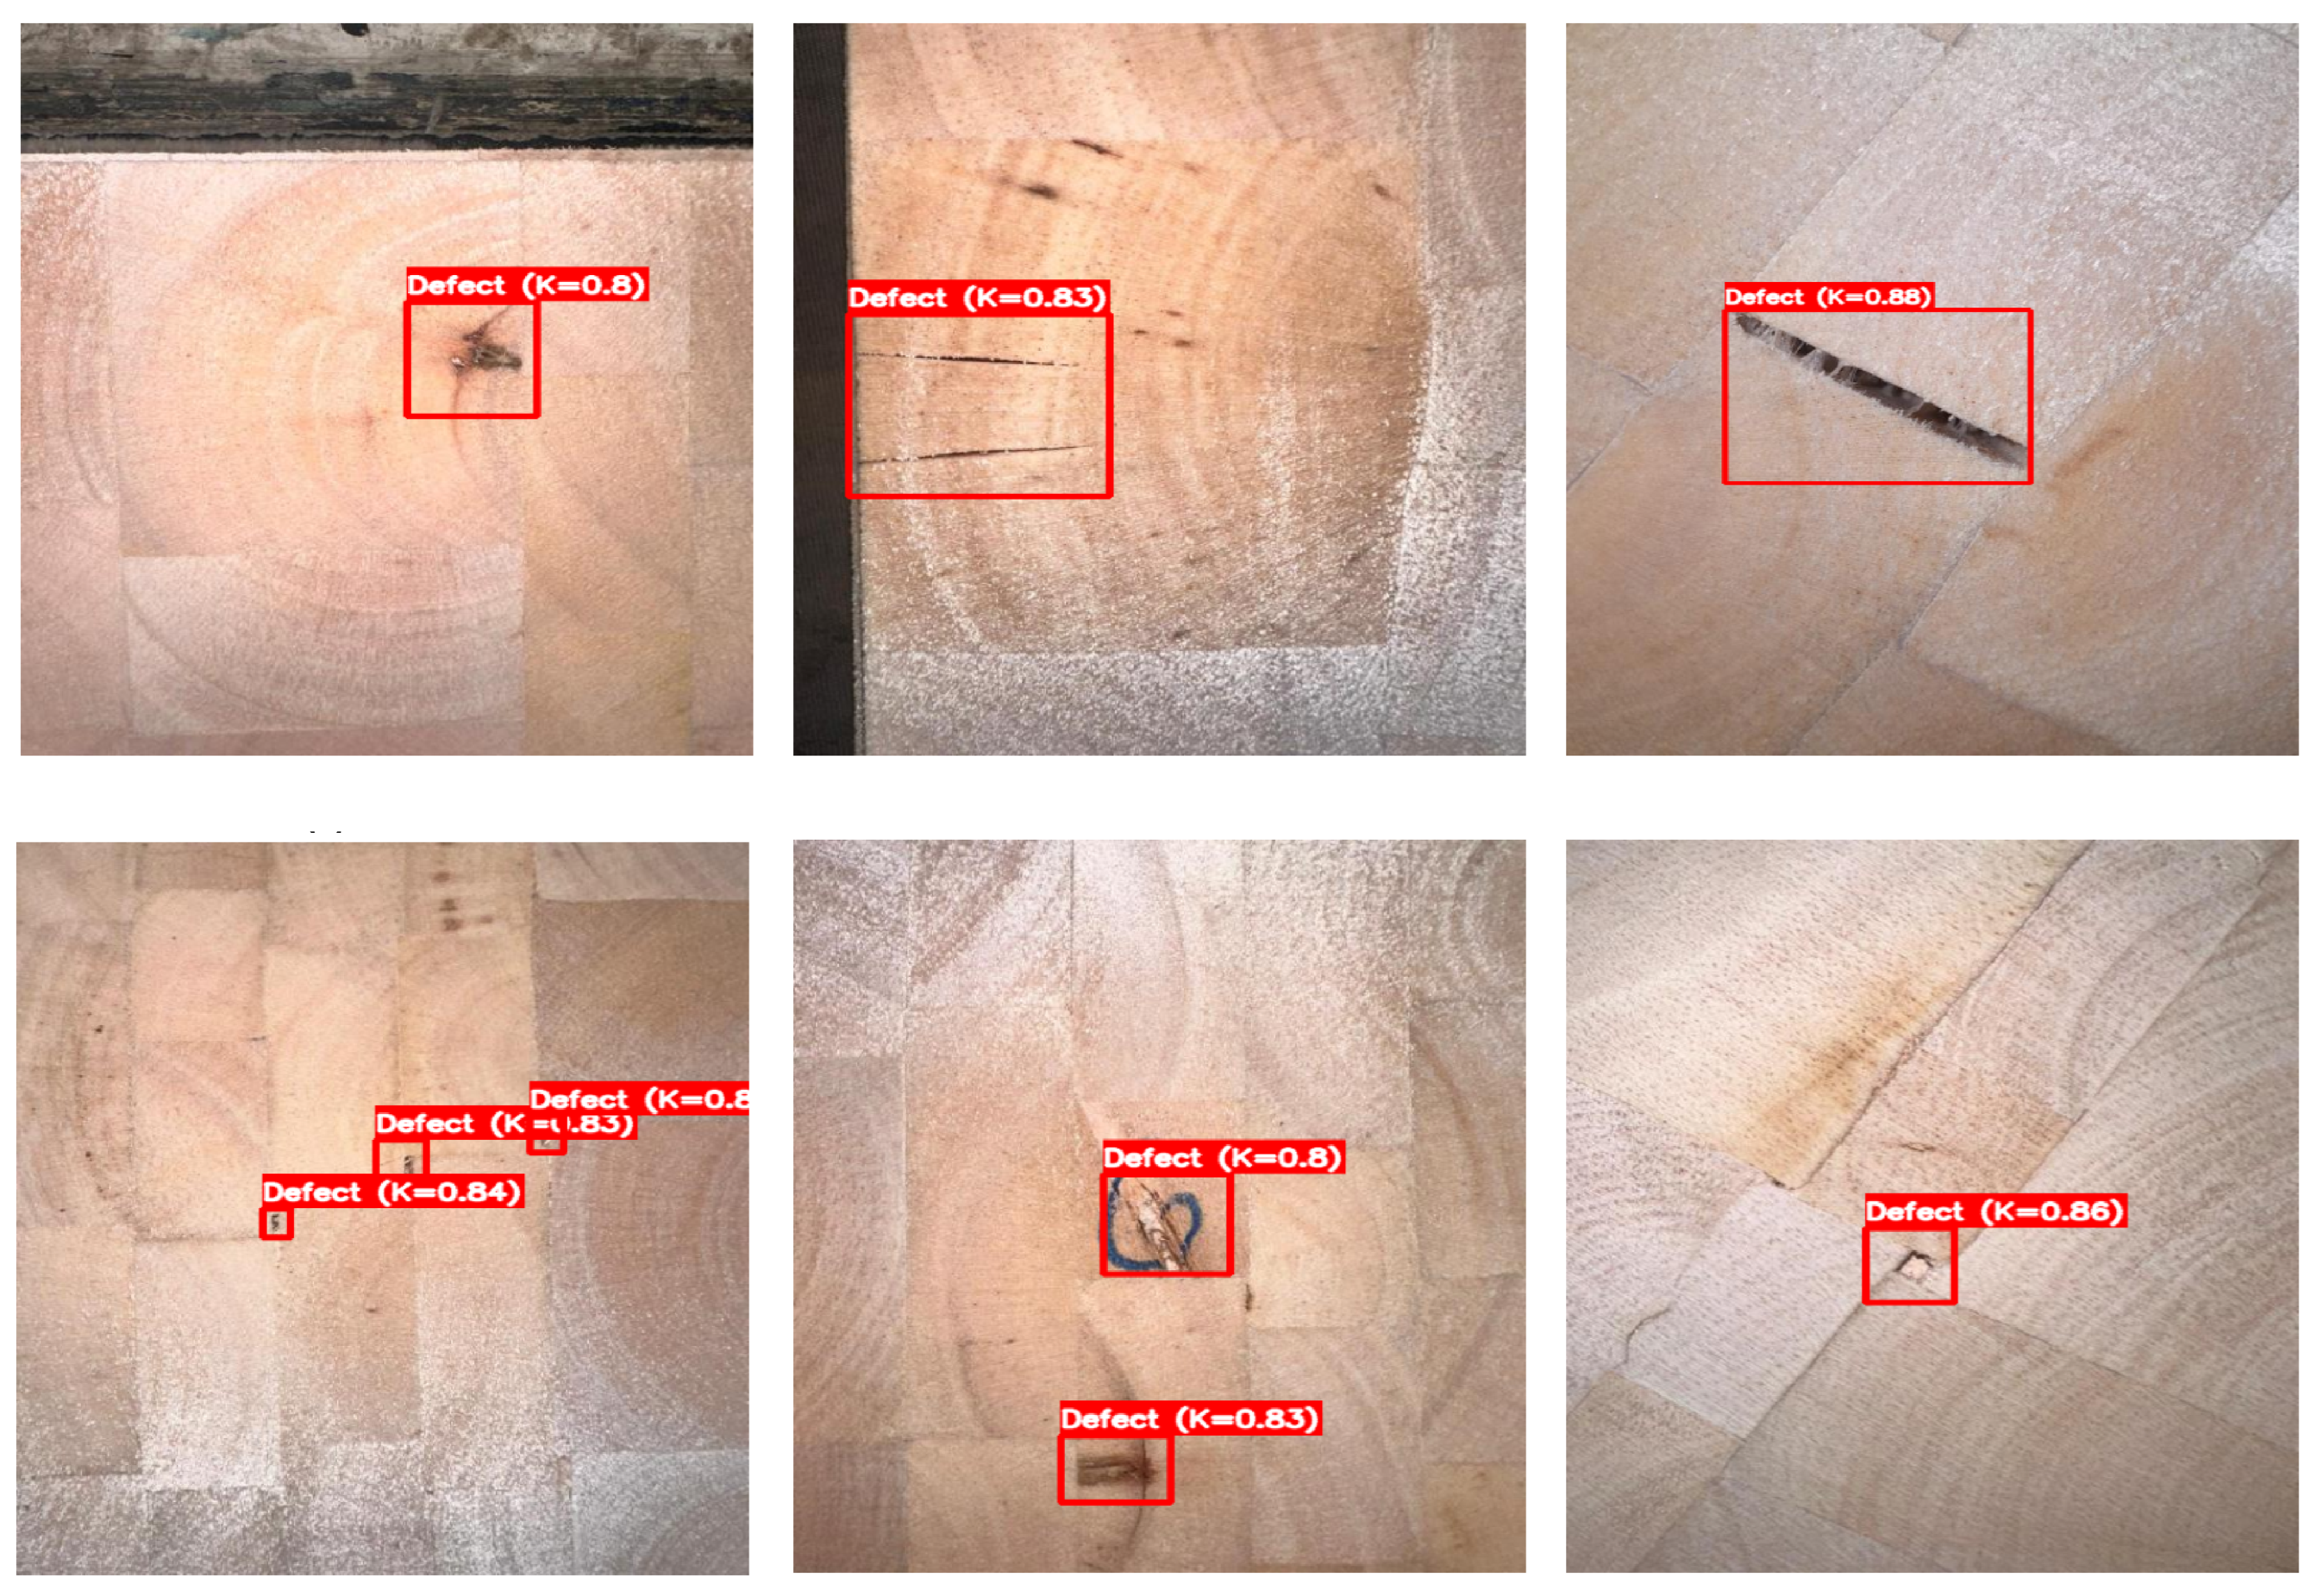
Figure 3.
Illustrative examples of the augmentation effects used in training: (a) random occlusion to simulate partial visual obstruction; (b) brightness/contrast variations to emulate illumination changes; (c) hue/saturation shifts to account for sensor and color variability; and (d) rotation/scale transformations to reproduce camera alignment and panel positioning changes.
Figure 3.
Illustrative examples of the augmentation effects used in training: (a) random occlusion to simulate partial visual obstruction; (b) brightness/contrast variations to emulate illumination changes; (c) hue/saturation shifts to account for sensor and color variability; and (d) rotation/scale transformations to reproduce camera alignment and panel positioning changes.
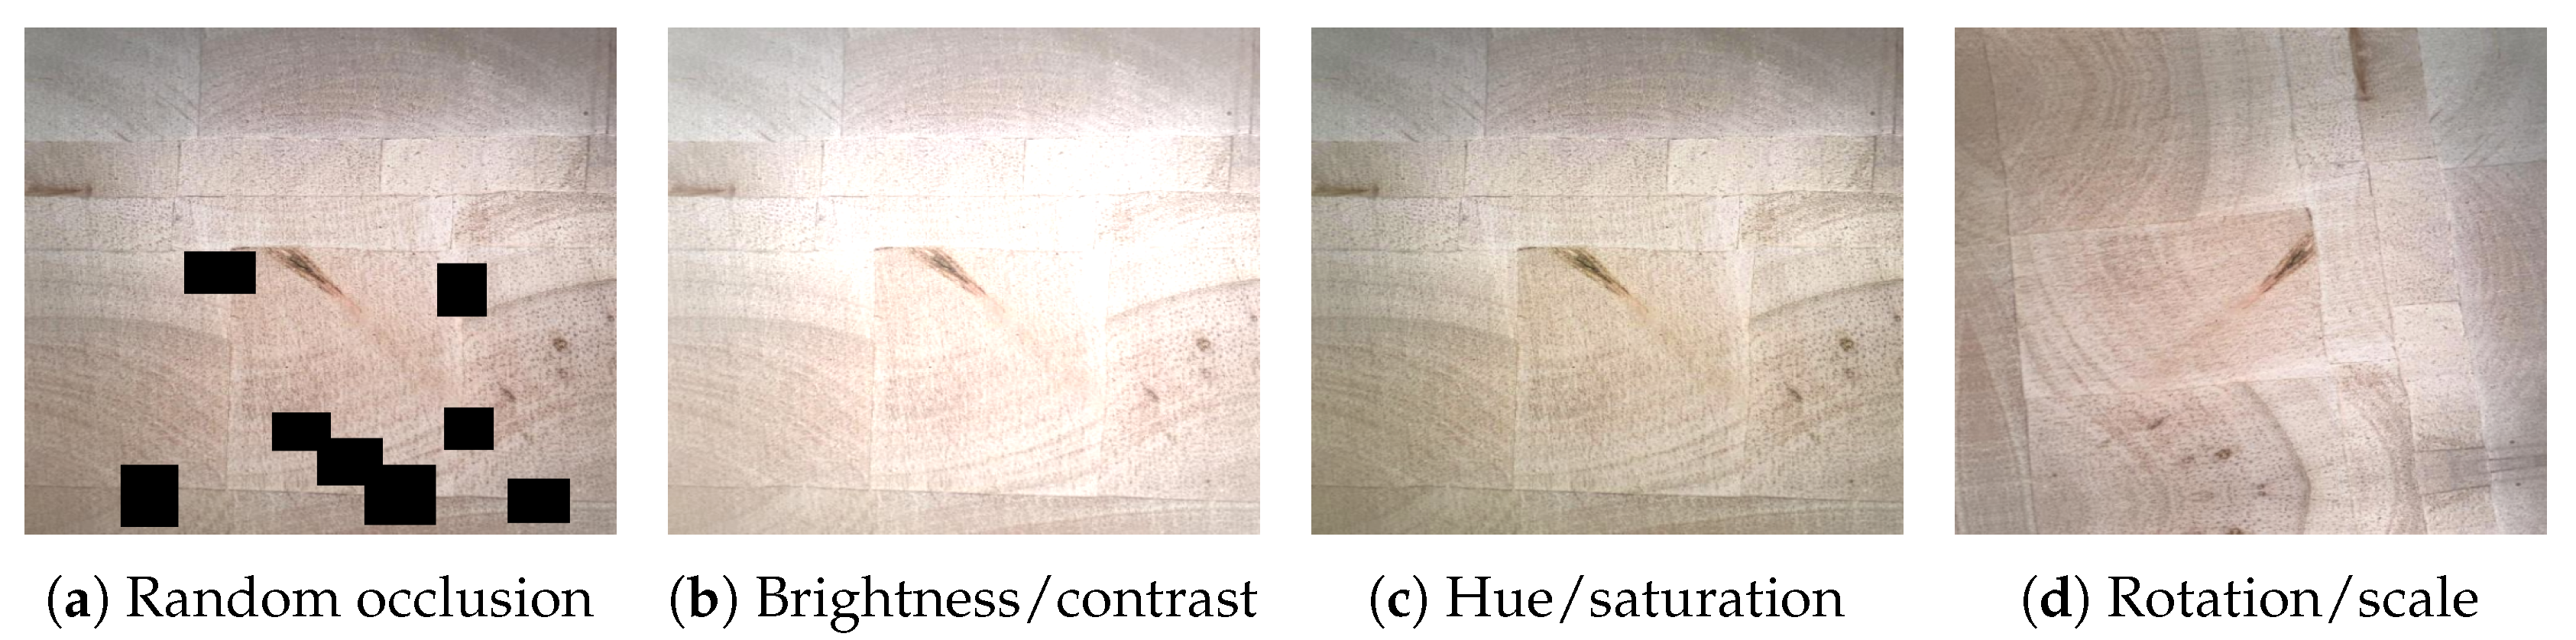
Figure 4.
Schematic diagram of the YOLOv11 network architecture.
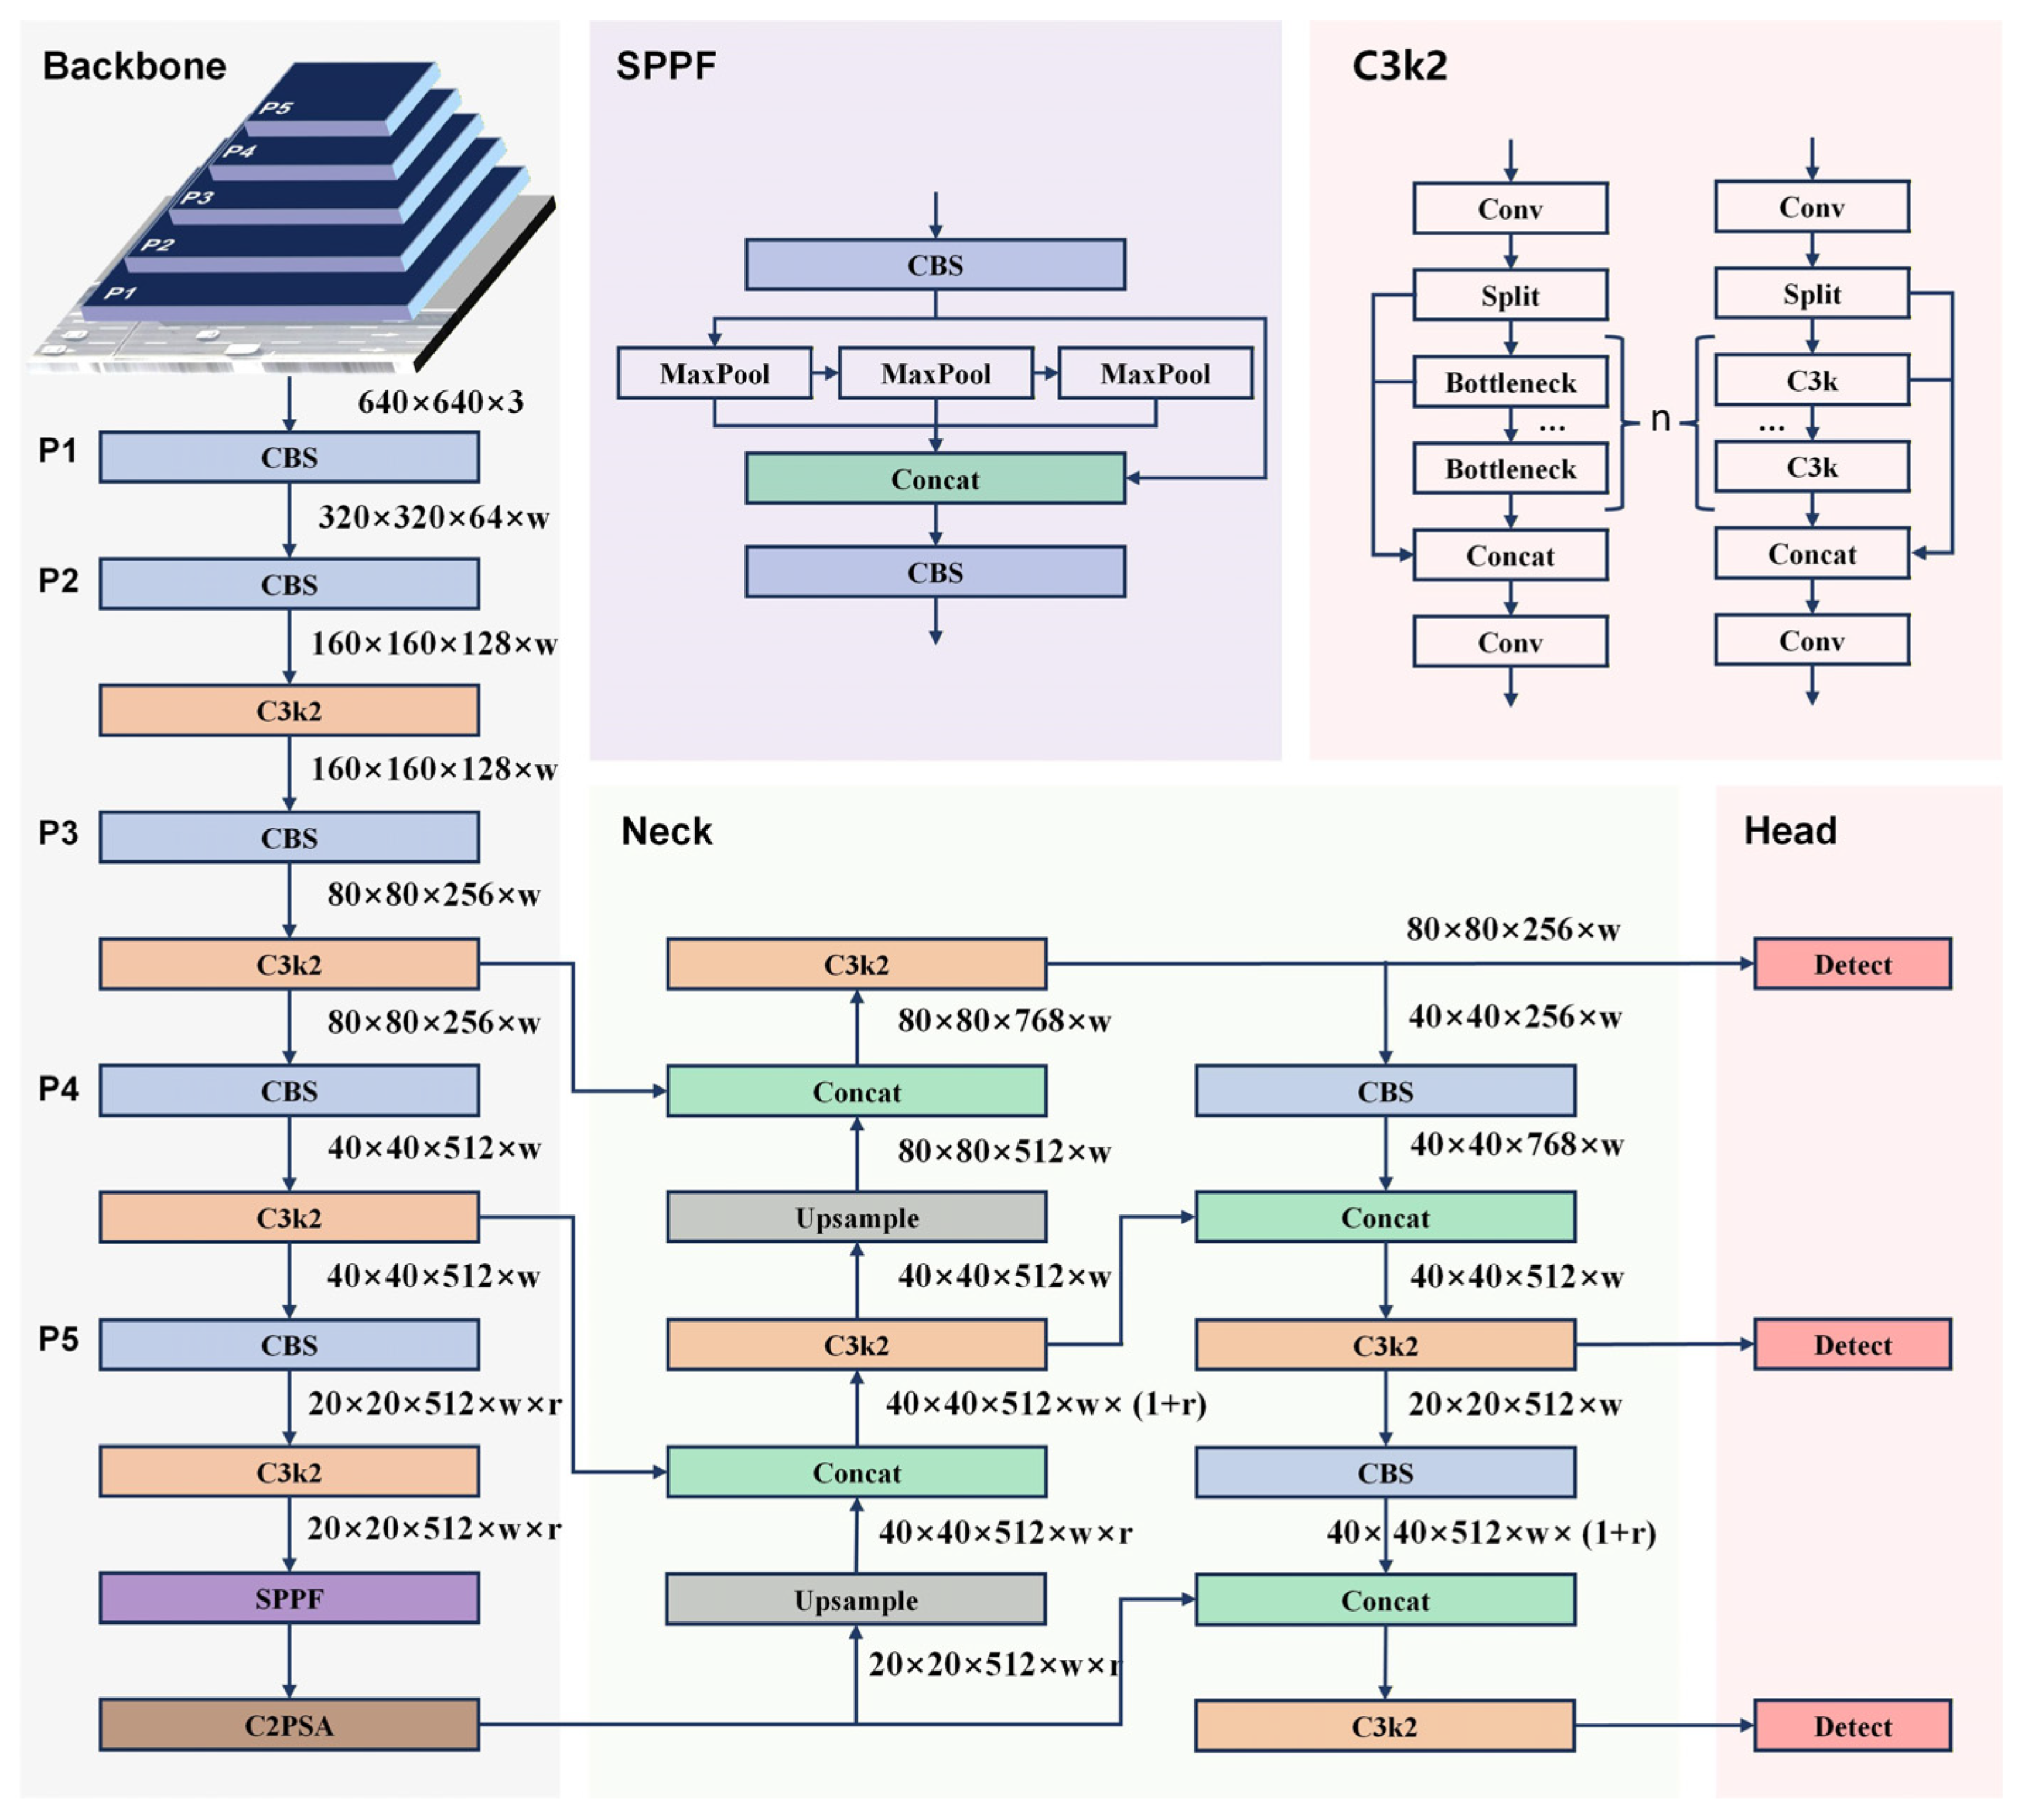
Figure 5.
Training mAP progression curves for all YOLOv11 configurations. Lines represent a five-epoch moving average used to highlight convergence trends.
Figure 5.
Training mAP progression curves for all YOLOv11 configurations. Lines represent a five-epoch moving average used to highlight convergence trends.
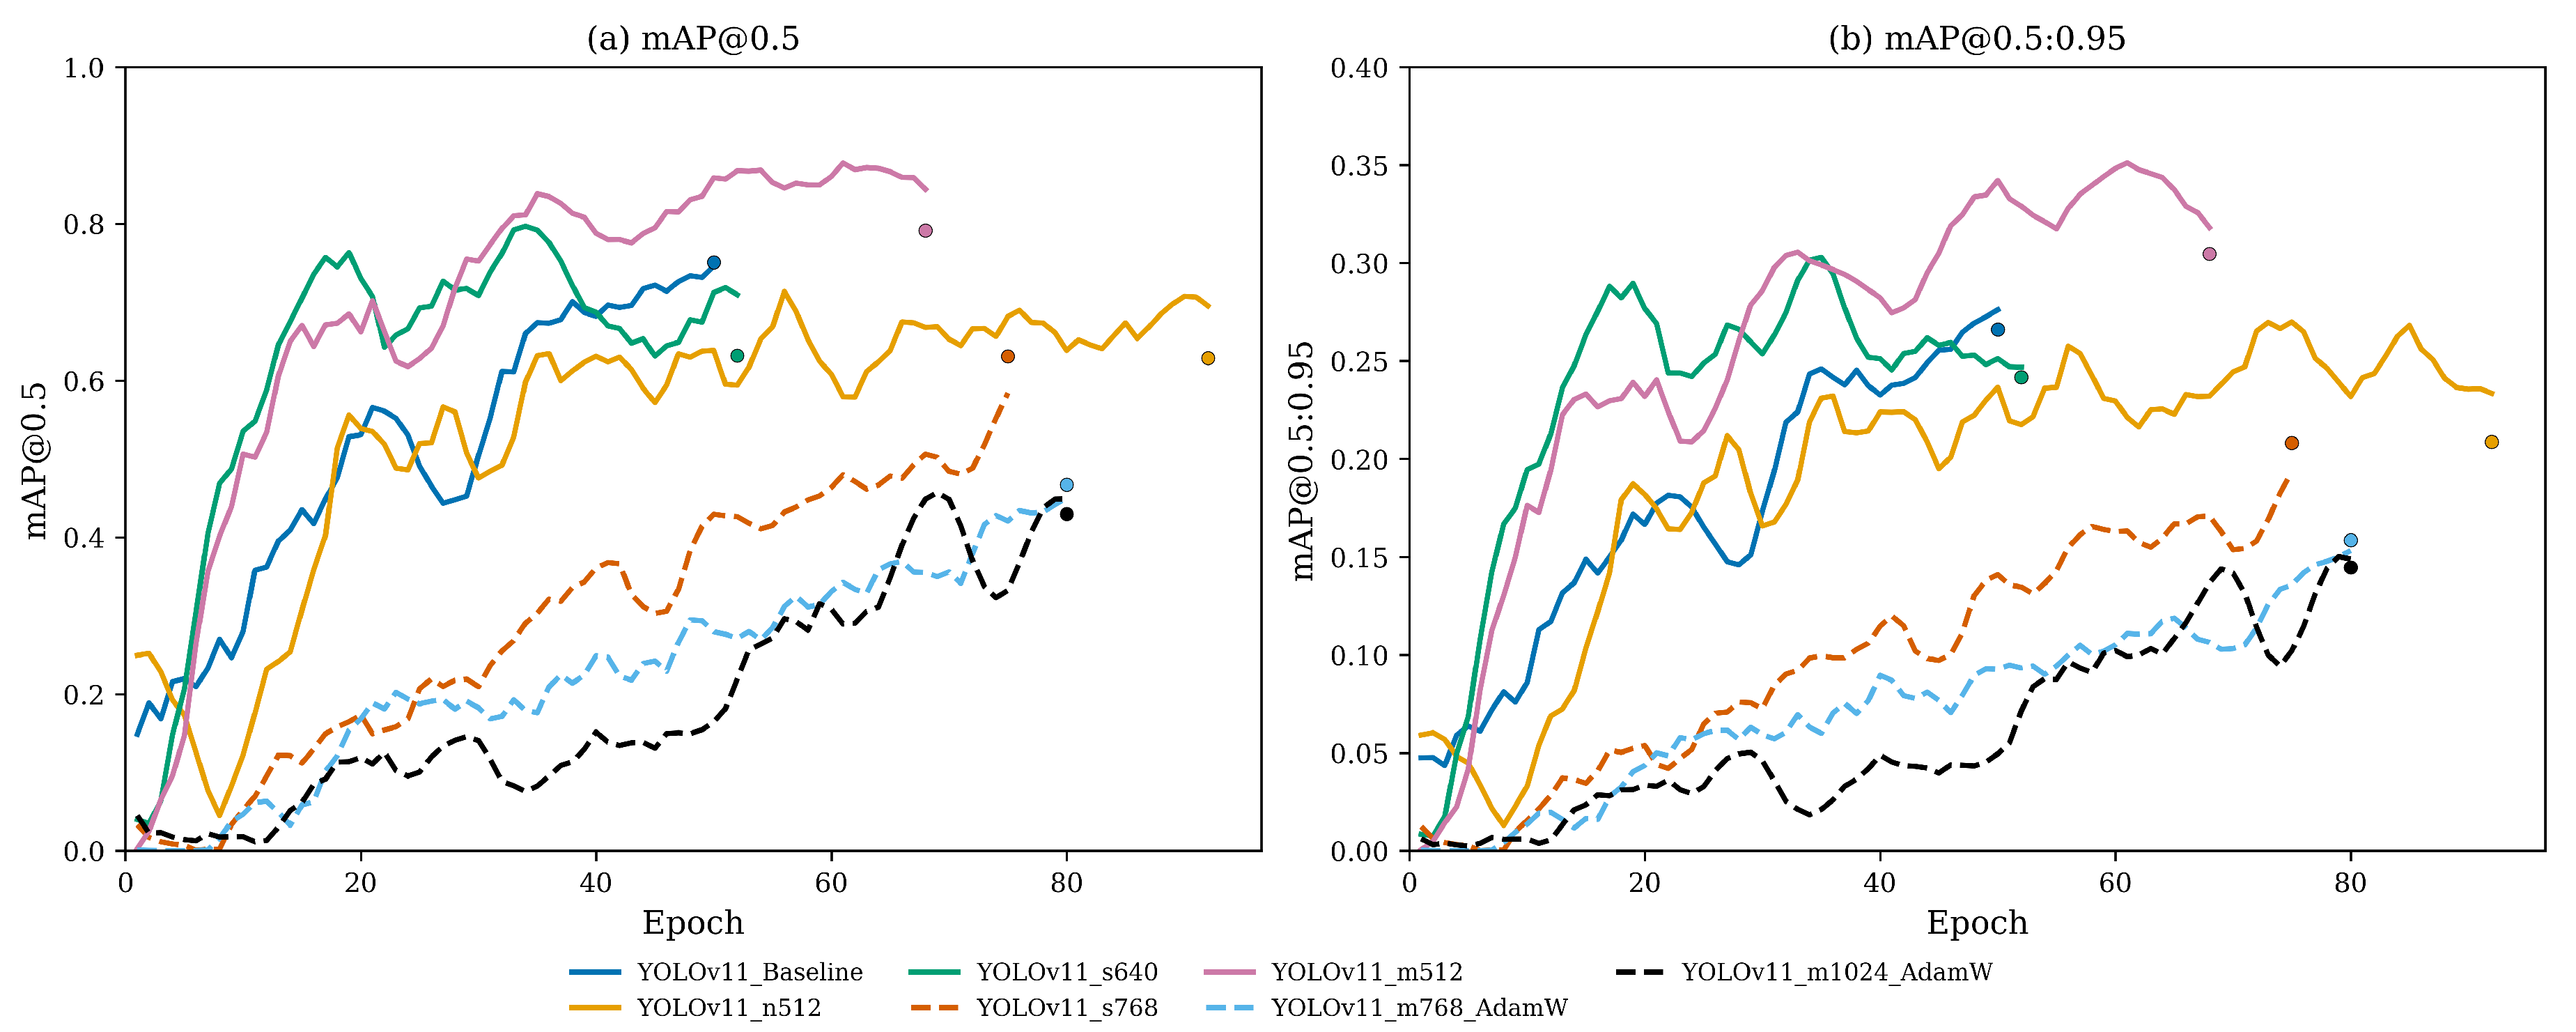
Figure 6.
Training loss curves for all YOLOv11 configurations. Thin transparent lines represent the original epoch-wise values, while solid lines represent a five-epoch moving average used to highlight convergence behavior.
Figure 6.
Training loss curves for all YOLOv11 configurations. Thin transparent lines represent the original epoch-wise values, while solid lines represent a five-epoch moving average used to highlight convergence behavior.
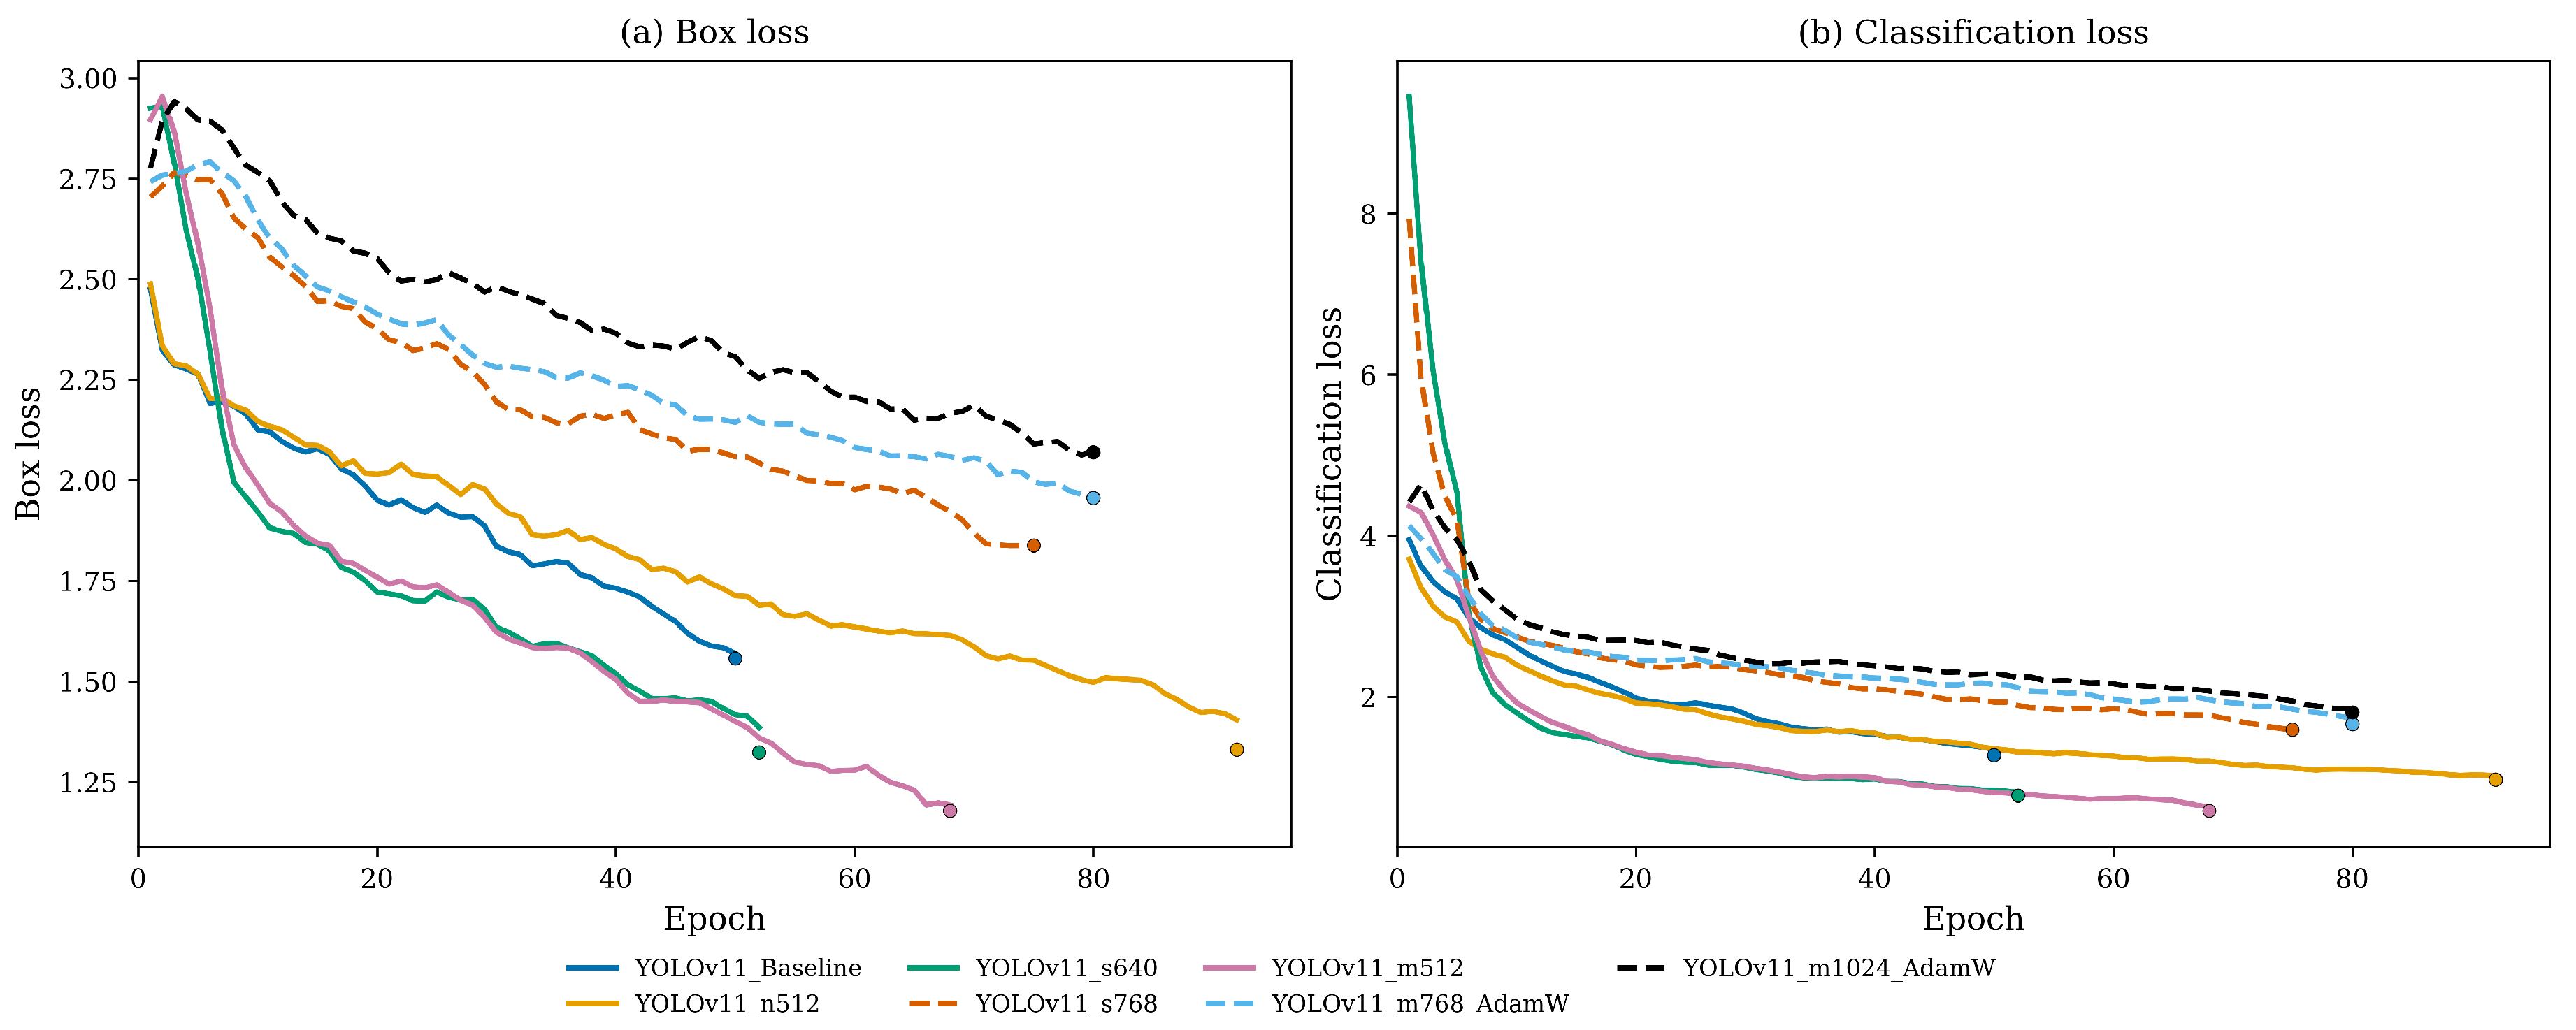
Figure 7.
Trade-off between localization accuracy and inference speed for each YOLOv11 configuration. The horizontal axis represents inference time per image, the vertical axis represents mAP@0.5:0.95, and the circle size corresponds to the model size in MB.
Figure 7.
Trade-off between localization accuracy and inference speed for each YOLOv11 configuration. The horizontal axis represents inference time per image, the vertical axis represents mAP@0.5:0.95, and the circle size corresponds to the model size in MB.
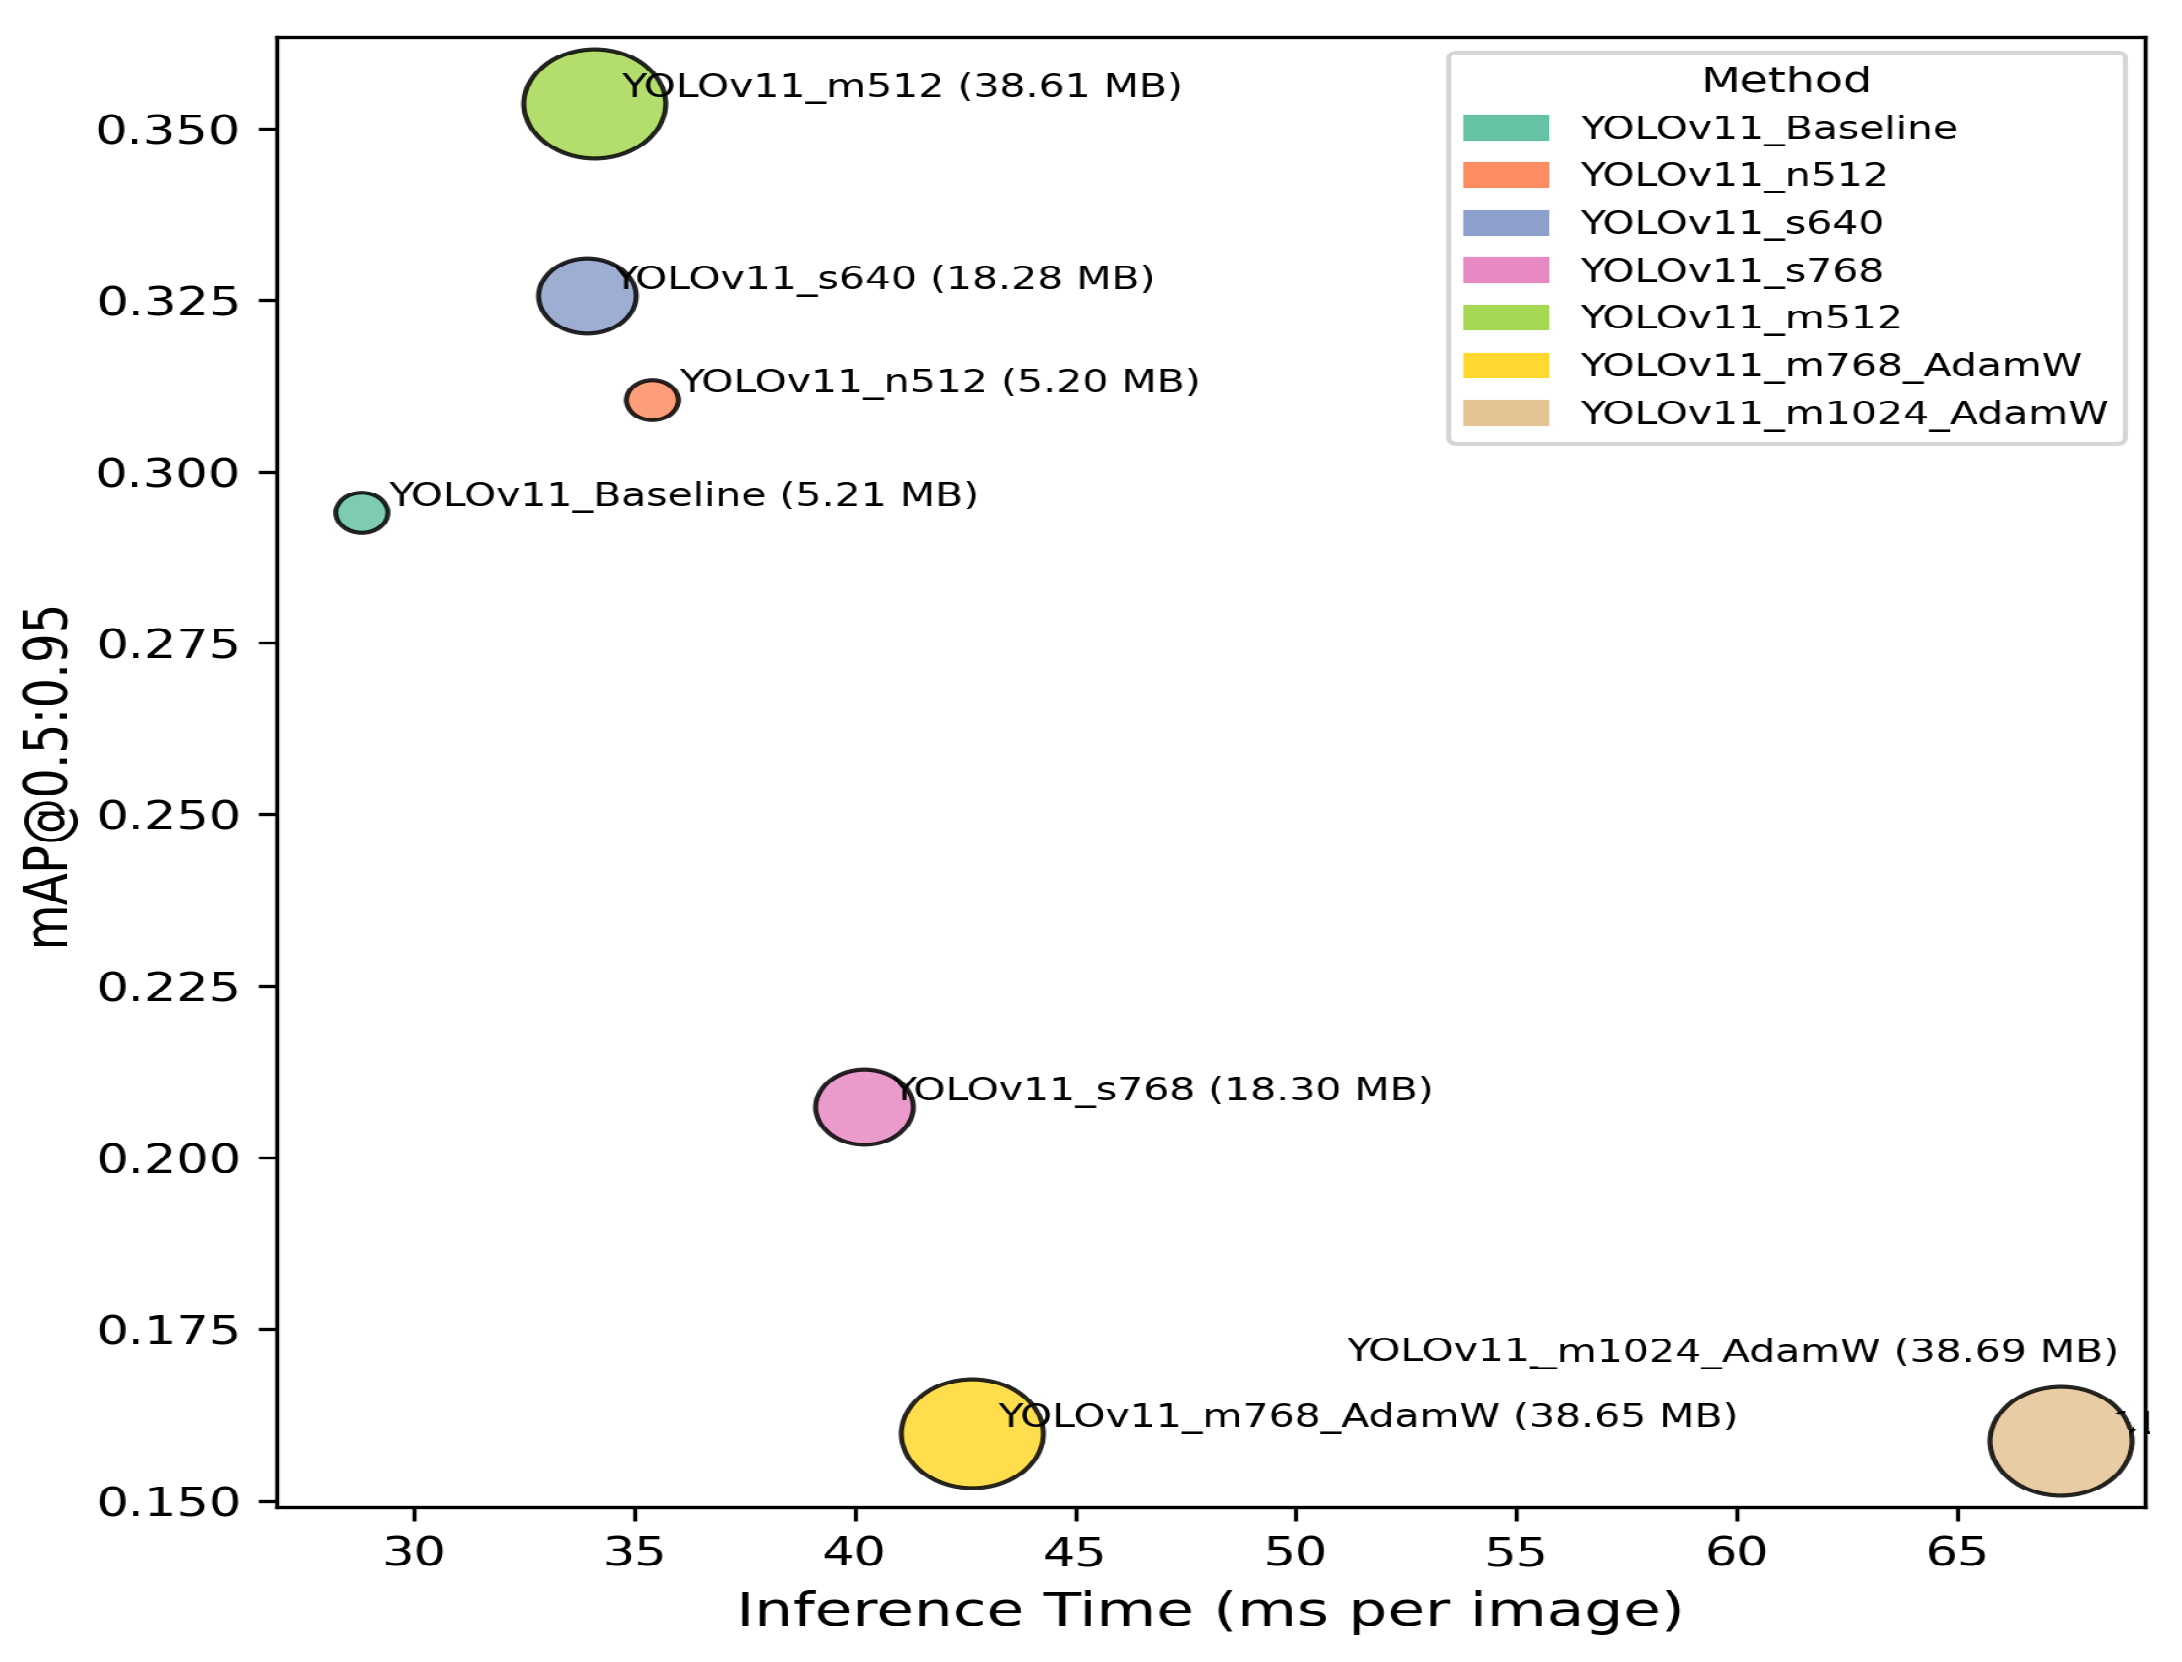
Figure 8.
Radar chart comparison of YOLOv11 configurations considering precision, recall, mAP@0.5, mAP@0.5:0.95, inference speed, and model size. Speed and model size were inversely normalized, so higher values indicate faster inference and smaller model size.
Figure 8.
Radar chart comparison of YOLOv11 configurations considering precision, recall, mAP@0.5, mAP@0.5:0.95, inference speed, and model size. Speed and model size were inversely normalized, so higher values indicate faster inference and smaller model size.
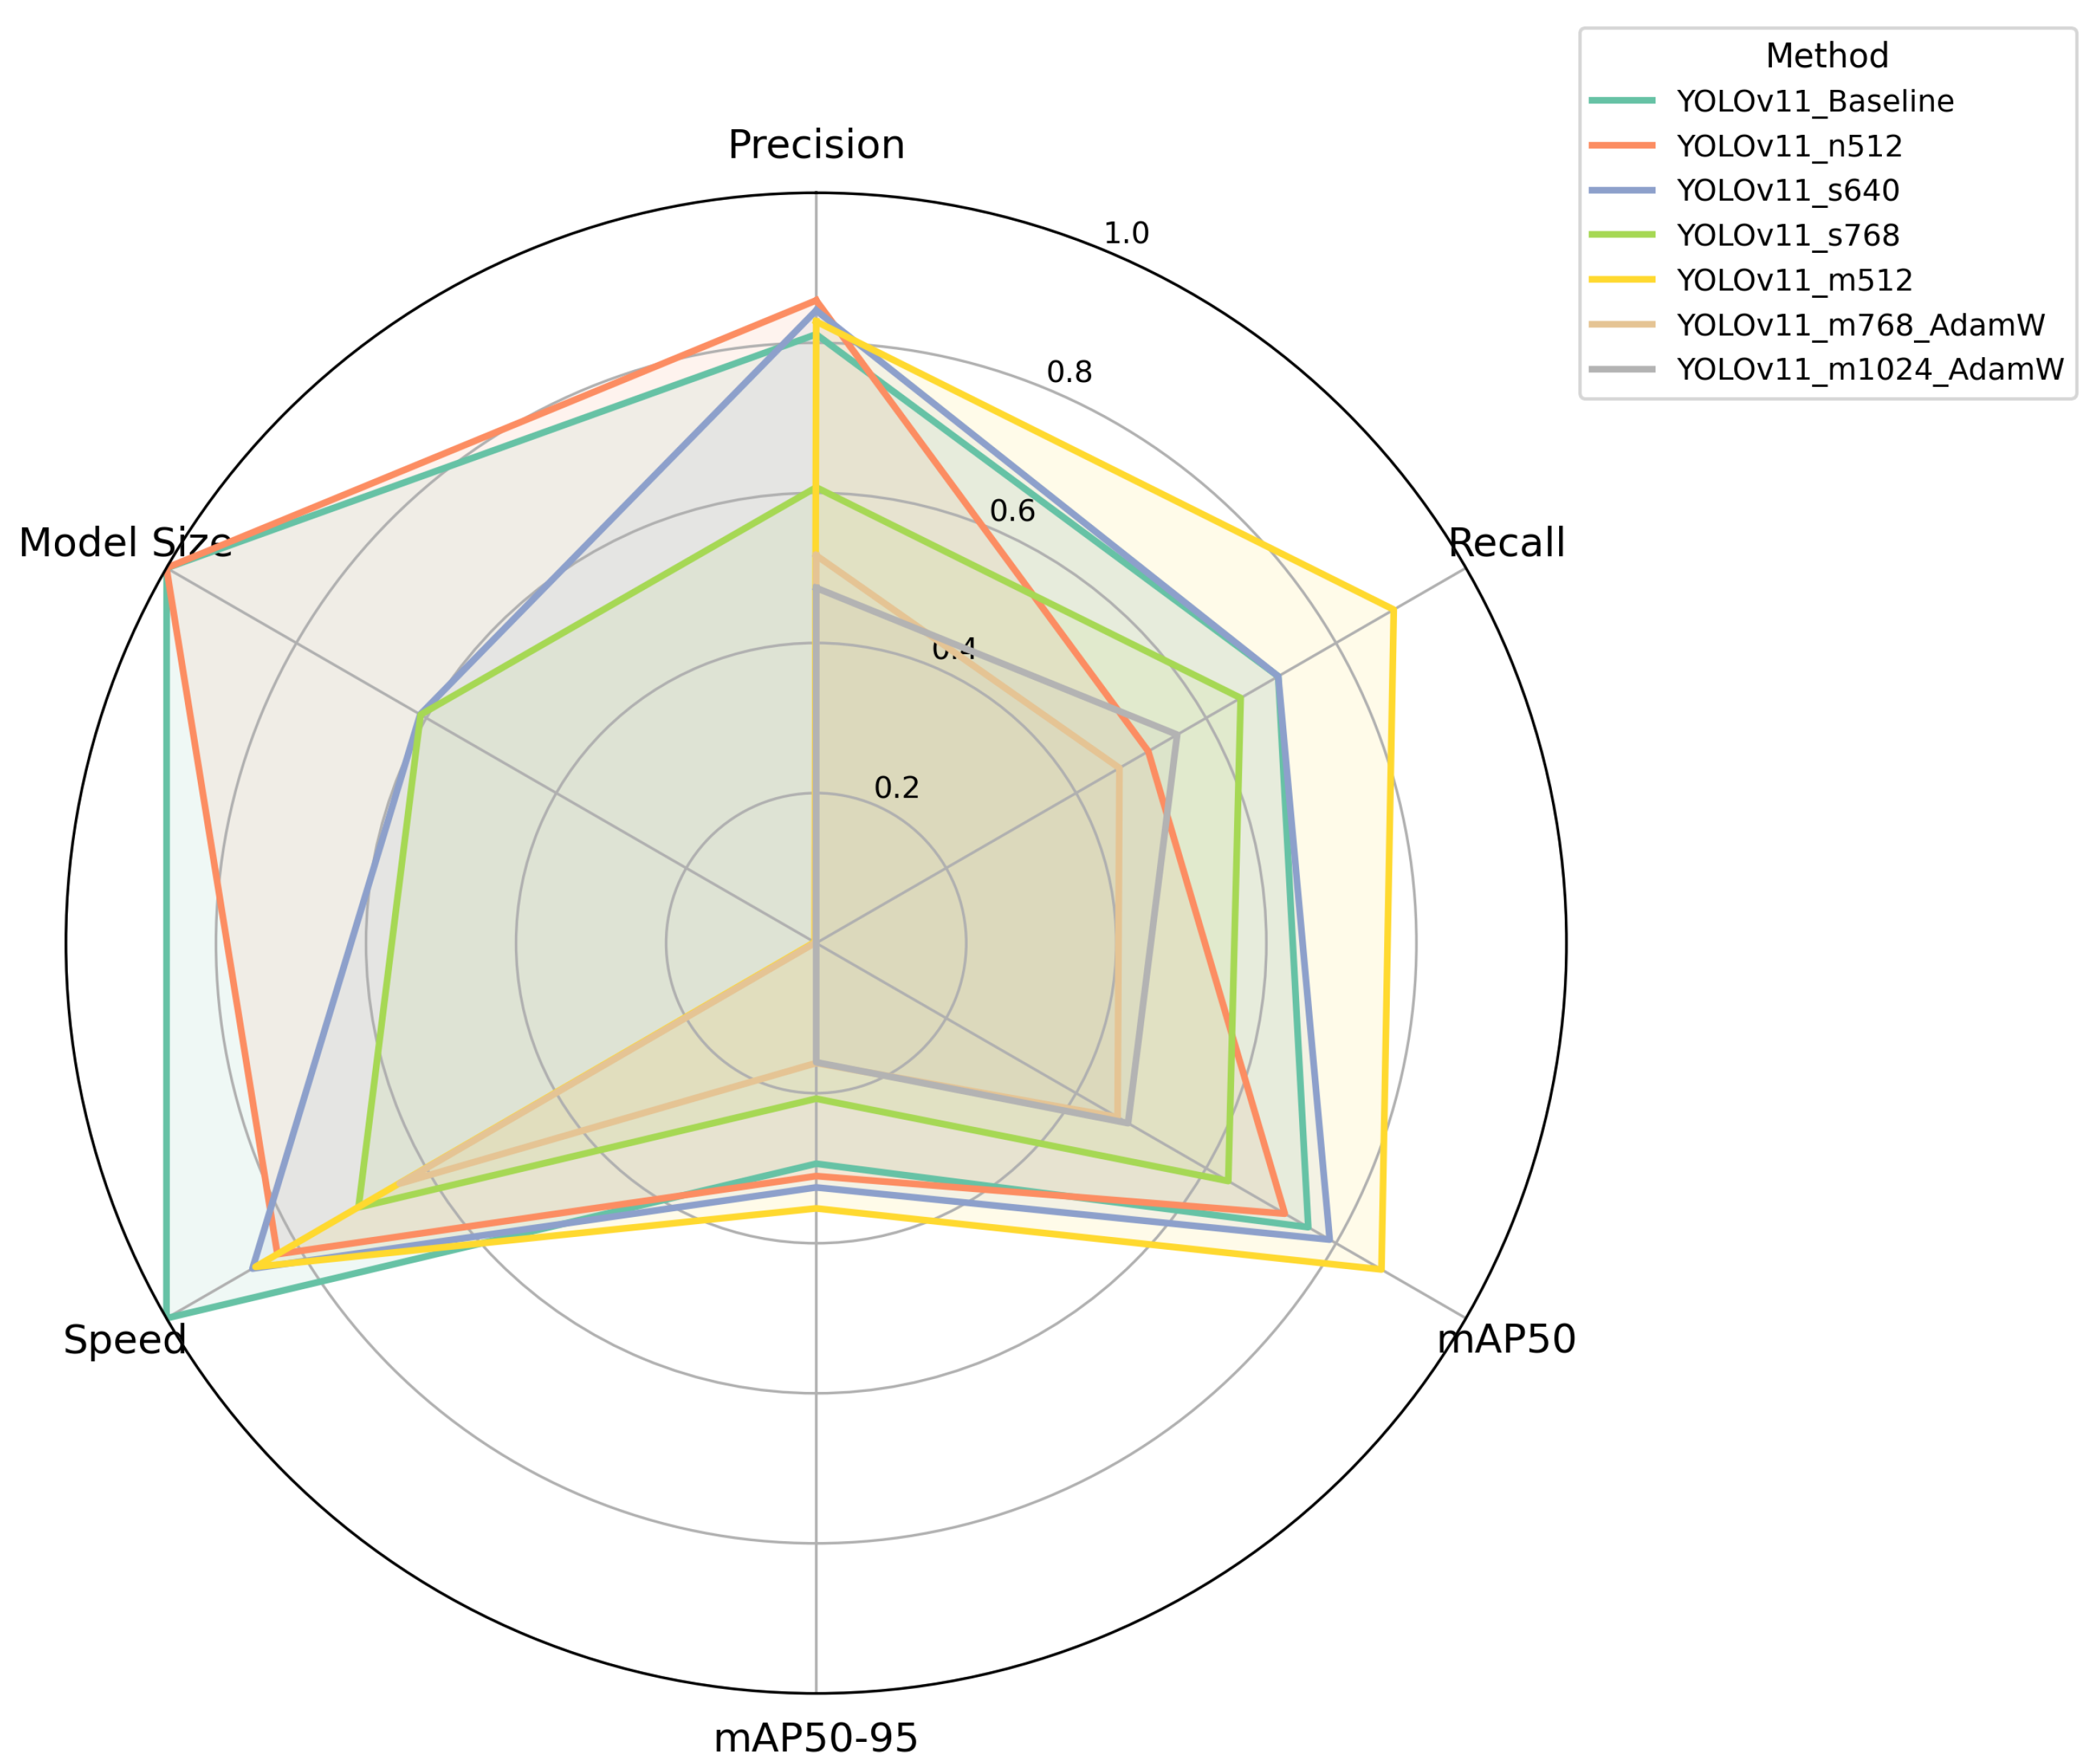
Figure 9.
Representative qualitative inference results obtained with the best-performing YOLOv11_m512 configuration. Each detected surface defect is marked with a red bounding box and labeled as Defect.
Figure 9.
Representative qualitative inference results obtained with the best-performing YOLOv11_m512 configuration. Each detected surface defect is marked with a red bounding box and labeled as Defect.
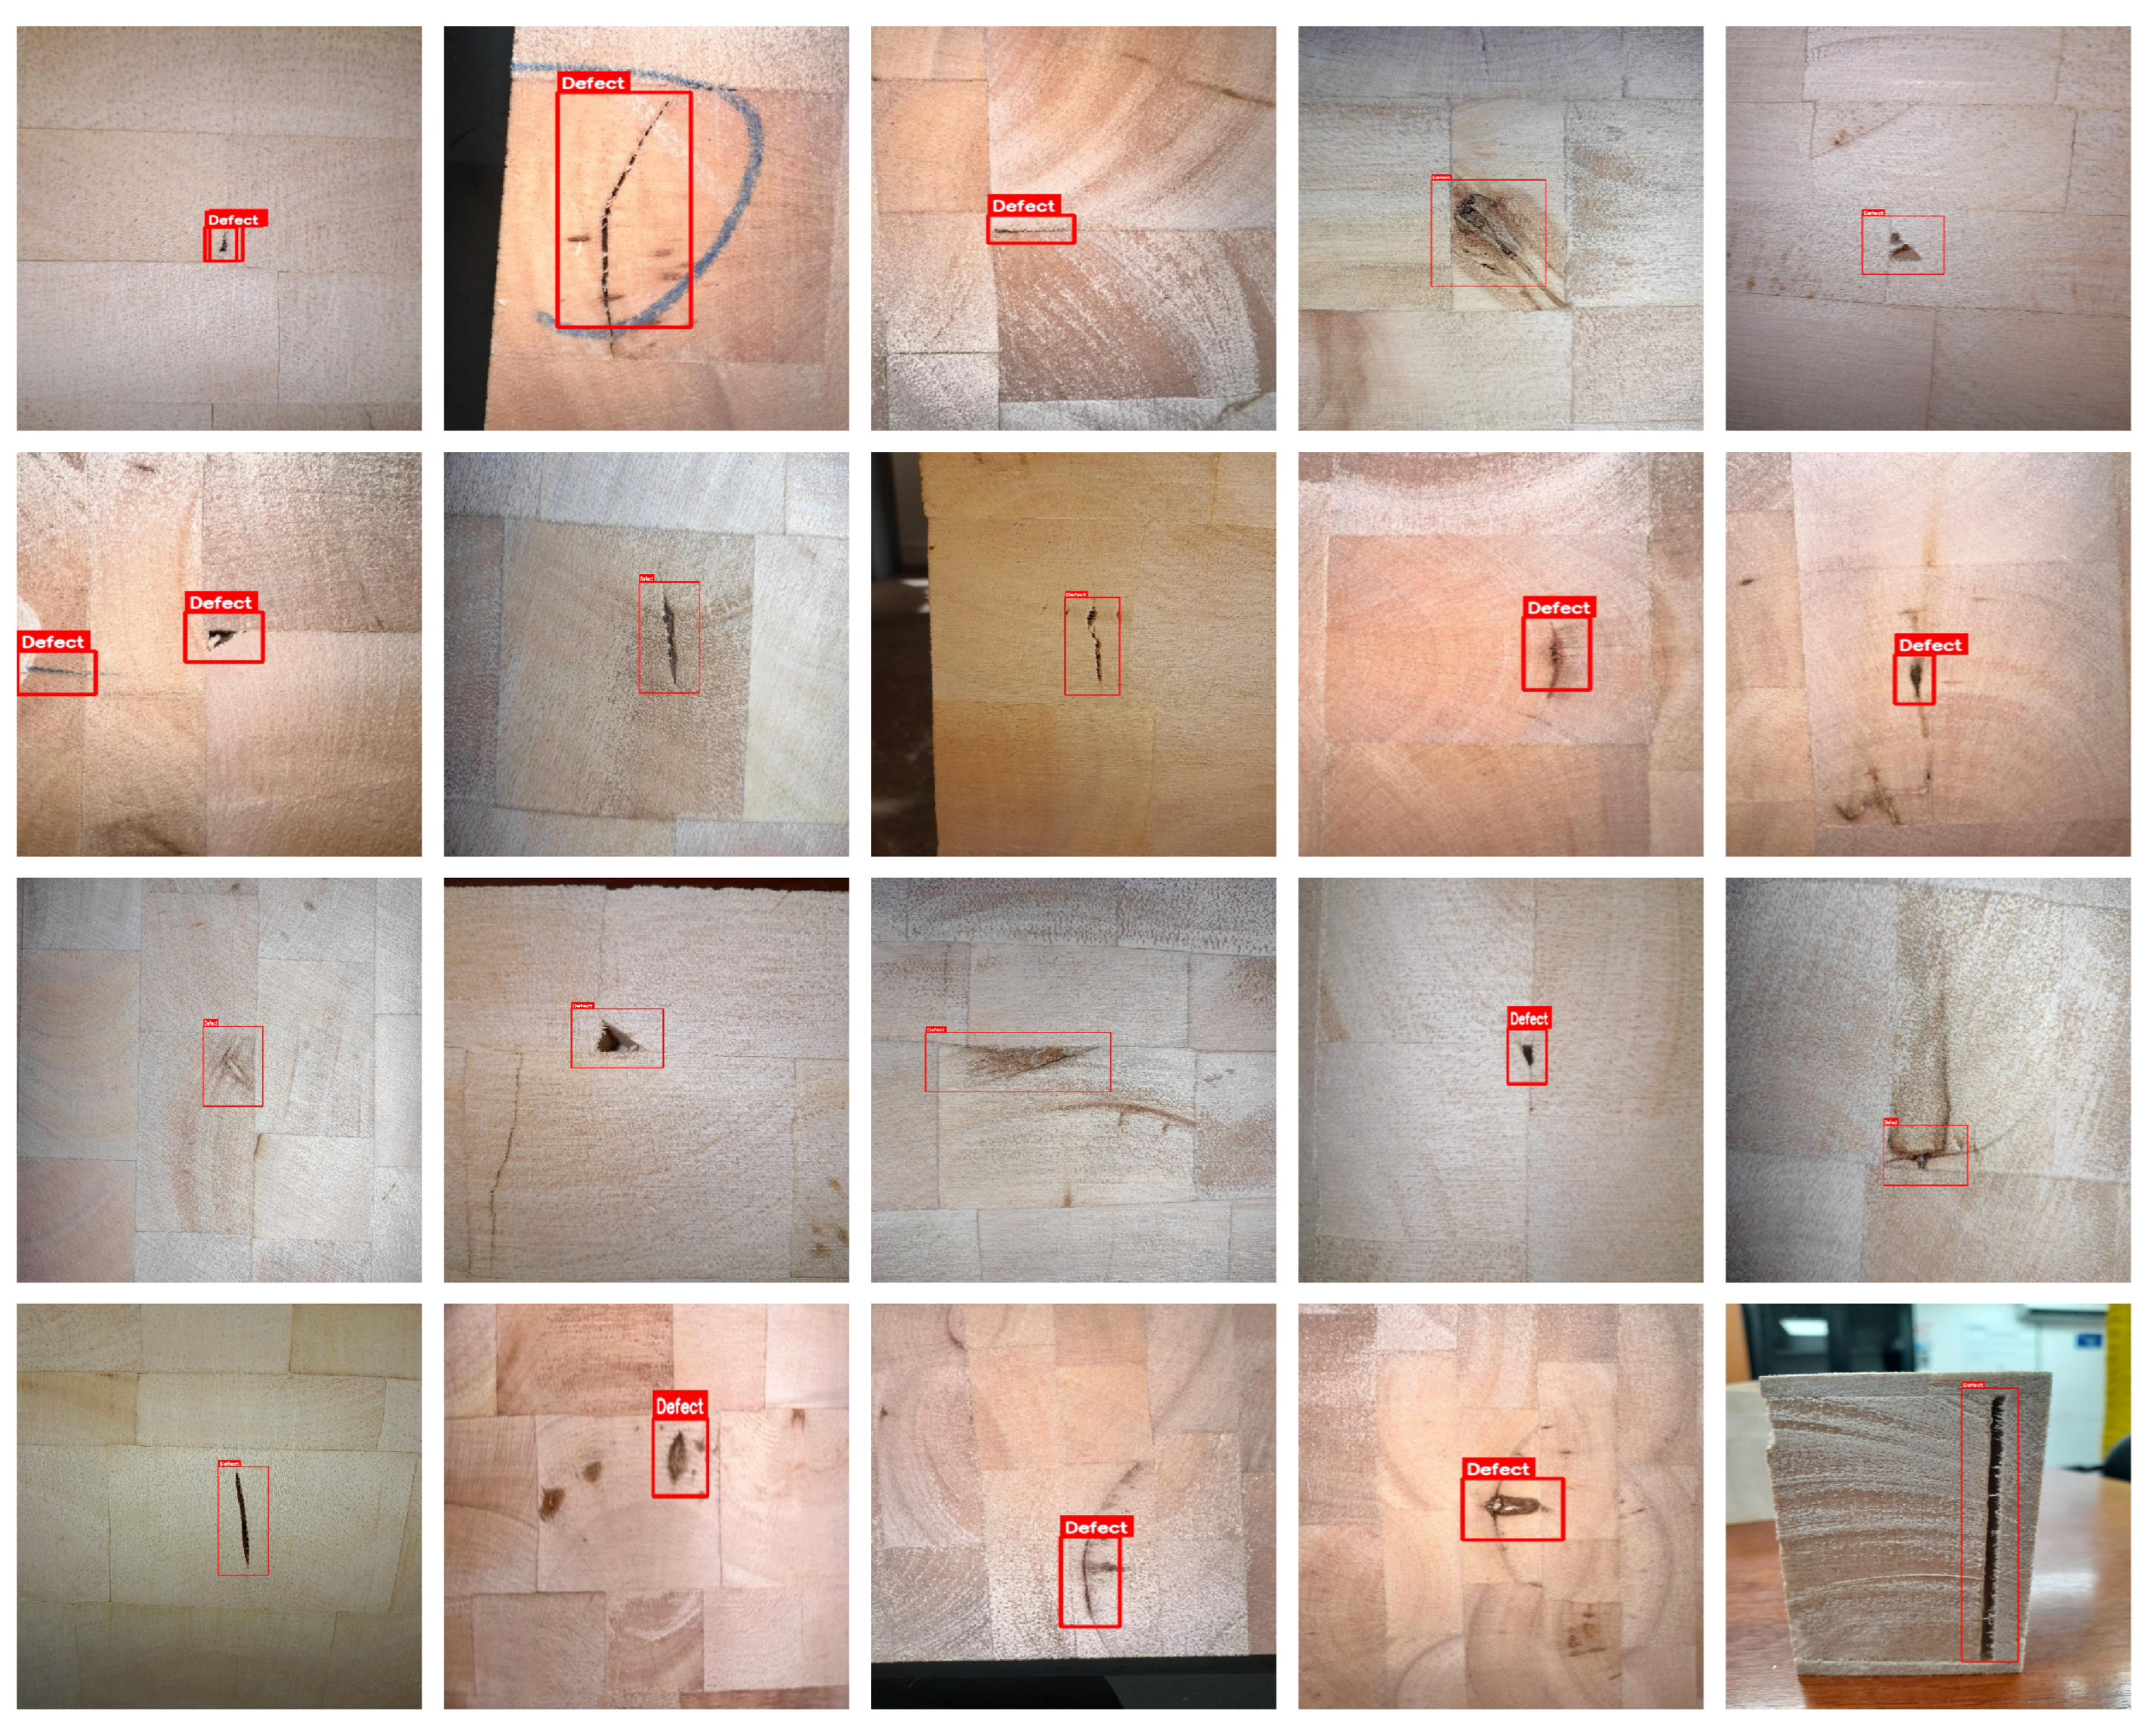
Figure 10.
Architectural adaptation of the selected YOLOv11_m512 model for automated balsa wood panel inspection. The proposed adaptation uses a RGB input resolution, a medium-scale YOLOv11 backbone for hierarchical feature extraction, multi-scale feature aggregation in the neck, and a single-class detection head focused on the localization of defective regions.
Figure 10.
Architectural adaptation of the selected YOLOv11_m512 model for automated balsa wood panel inspection. The proposed adaptation uses a RGB input resolution, a medium-scale YOLOv11 backbone for hierarchical feature extraction, multi-scale feature aggregation in the neck, and a single-class detection head focused on the localization of defective regions.
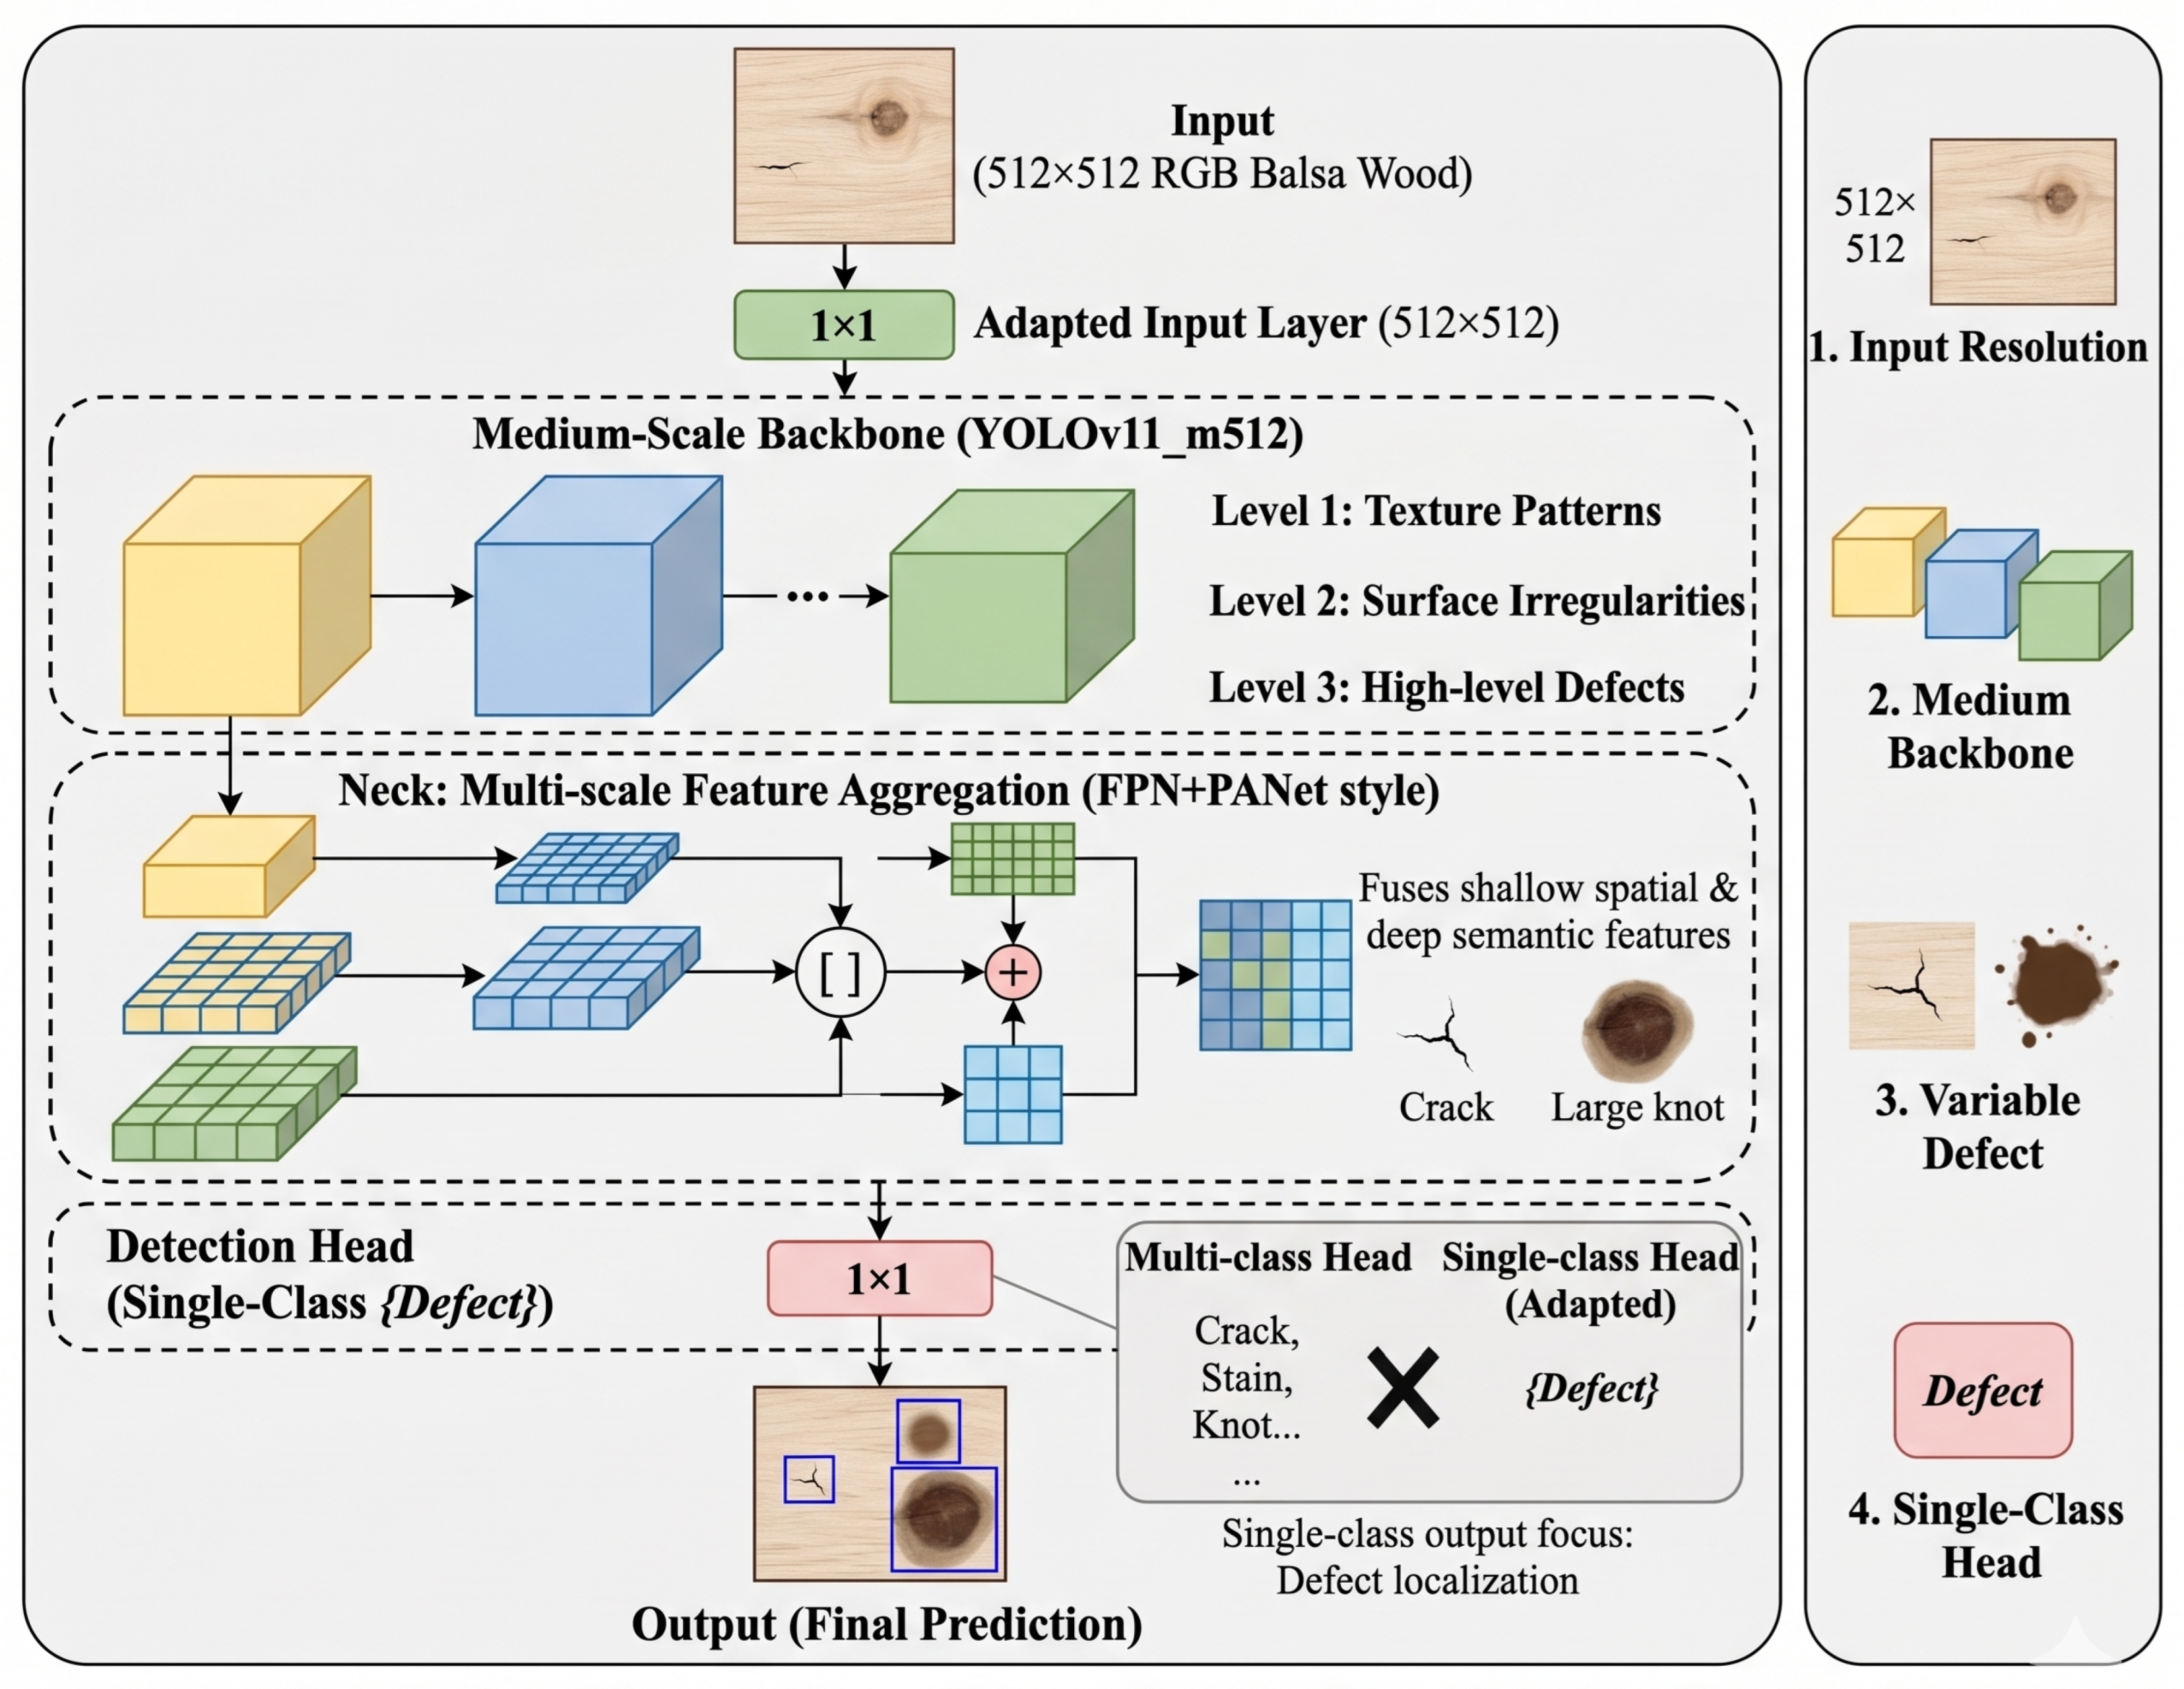

Table 1.
Summary of YOLOv11 configurations for balsa wood defect detection.
| Method | Img Size | Epochs | Batch | lr0 | Optimizer |
|---|---|---|---|---|---|
| YOLOv11_Baseline | 640 | 50 | 8 | – | Default |
| YOLOv11_n512 | 512 | 100 | 8 | 0.005 | Default |
| YOLOv11_s640 | 640 | 75 | 8 | 0.003 | SGD + Momentum 0.937 |
| YOLOv11_s768 | 768 | 75 | 4 | 0.003 | AdamW + WD = 0.0002 |
| YOLOv11_m512 | 512 | 75 | 8 | 0.002 | SGD + Momentum 0.937 |
| YOLOv11_m768_AdamW | 768 | 80 | 4 | 0.002 | AdamW + WD = 0.0001 |
| YOLOv11_m1024_AdamW | 1024 | 80 | 2 | 0.002 | AdamW + WD = 0.0001 |
Table 2.
Detailed description of each YOLOv11 configuration.
| Method | Description |
|---|---|
| YOLOv11_Baseline | Baseline configuration using default YOLOv11 training parameters with an input resolution of , 50 epochs, and the default optimizer. This setup was used as the reference configuration for performance comparison. |
| YOLOv11_n512 | Nano backbone configuration with a reduced input resolution of and extended training over 100 epochs. This experiment was designed to evaluate whether a lightweight model can achieve stable convergence when trained for a longer period. |
| YOLOv11_s640 | Small backbone configuration using images, 75 epochs, and SGD with momentum. This setup was intended to assess whether a small model with a stable optimization strategy can improve defect localization while maintaining moderate computational requirements. |
| YOLOv11_s768 | Small backbone configuration using a higher input resolution of , reduced batch size, and AdamW with weight decay. This configuration was designed to improve the detection of small and elongated defects while controlling overfitting through regularization. |
| YOLOv11_m512 | Medium backbone configuration using images and SGD with momentum. This setup evaluated whether a stronger backbone can improve feature extraction even at a moderate image resolution, balancing accuracy and training efficiency. |
| YOLOv11_m768_AdamW | Medium backbone configuration with images, 80 epochs, and AdamW with weight decay. This experiment was designed to strengthen multi-scale feature learning and improve generalization for defects with variable shapes, sizes, and contrast levels. |
| YOLOv11_m1024_AdamW | Medium backbone configuration using very high-resolution images of , reduced batch size, and AdamW with weight decay. This setup was designed to maximize fine-grained defect localization, especially for small cracks, stains, knots, and subtle surface discontinuities. |
Table 3.
Global performance metrics, model size, and inference time for each YOLOv11 configuration.
| Method | Precision | mAP@0.5 | mAP@0.5:0.95 | Size (MB) | Inf. Time (ms) |
|---|---|---|---|---|---|
| YOLOv11_Baseline | 0.811 | 0.757 | 0.294 | 5.21 | 28.81 |
| YOLOv11_n512 | 0.857 | 0.721 | 0.311 | 5.20 | 35.39 |
| YOLOv11_s640 | 0.843 | 0.790 | 0.326 | 18.28 | 33.91 |
| YOLOv11_s768 | 0.607 | 0.634 | 0.207 | 18.30 | 40.20 |
| YOLOv11_m512 | 0.829 | 0.870 | 0.354 | 38.61 | 34.09 |
| YOLOv11_m768_AdamW | 0.517 | 0.464 | 0.160 | 38.65 | 42.64 |
| YOLOv11_m1024_AdamW | 0.473 | 0.480 | 0.159 | 38.69 | 67.34 |
Disclaimer/Publisher’s Note: The statements, opinions and data contained in all publications are solely those of the individual author(s) and contributor(s) and not of MDPI and/or the editor(s). MDPI and/or the editor(s) disclaim responsibility for any injury to people or property resulting from any ideas, methods, instructions or products referred to in the content. |
© 2026 by the authors. Licensee MDPI, Basel, Switzerland. This article is an open access article distributed under the terms and conditions of the Creative Commons Attribution (CC BY) license (http://creativecommons.org/licenses/by/4.0/).
Copyright: This open access article is published under a Creative Commons CC BY 4.0 license, which permit the free download, distribution, and reuse, provided that the author and preprint are cited in any reuse.


