

Submitted:
25 May 2026
Posted:
26 May 2026
You are already at the latest version
Abstract
Municipal solid waste (MSW) management is a critical challenge to advancing recycling and circular economic approaches. This review provides a comprehensive overview of MSW management, encompassing sourcing, policy frameworks, characterization techniques, separation technologies, preprocessing strategies, and utilization pathways. First, generation patterns and sourcing mechanisms are discussed in both U.S. and global contexts, with emphasis on the influence of policy frameworks on waste reduction and diversion. Second, characterization techniques are evaluated, focusing on physical and chemical analysis for material recyclability. Third, sorting technologies are critically re-viewed, covering conventional methods and emerging sensor-based approaches. Pre-processing techniques are then evaluated for their role in improving downstream con-version efficiency. Finally, valorization pathways such as waste-to-syngas, waste-to-biochar, and waste-to-sustainable aviation fuel (SAF) are assessed in terms of their role in climate mitigation and the circular economy. It is anticipated that this re-view provides a foundational reference for researchers, policymakers, and industry stakeholders aiming to strengthen the recyclability infrastructure and maximize the efficiency of MSW management systems in the framework of the circular economy.

Keywords:
municipal solid waste
; sorting technologies
; waste characterization
; resource recovery
; circular economy
; sustainability
1. Introduction
Rapid industrialization, population growth, and high consumption rates are driving substantial municipal solid waste (MSW) generation, which is posing serious environmental consequences around the globe. The global generation of MSW in 2020 was 2.1 billion tonnes, which is projected to reach 3.4 billion by the year 2050, with an average per capita generation of approximately 0.74 kg [1]. This contributes around 2.38 billion tonnes of CO2 equivalent emissions annually [2]. As a reference point, regional data (Figure 1.) show that the East Asia and Pacific regions exhibit the highest MSW generation rates, expected to rise from 602 MT/year in 2025 to 714 MT/year by 2050 due to substantial population and economic growth. Conversely, regions like Sub-Saharan Africa, South Asia, and the Middle East and North Africa show alarming waste generation trends with projected increases of nearly threefold and twofold by 2050. North America and Europe, while generating a lower amount of total waste, have significantly higher per capita waste production due to higher living standards and consumption. For instance, North American per capita waste generation was 2.21 kg/day in 2016, projected to increase to 2.37 kg/day by 2030 and 2.50 kg/day by 2050.
In 2018, the US Environmental Protection Agency (EPA) reported that 292 million tons of MSW were generated in 2018, with a total carbon footprint of approximately 193 million metric tons of CO2 equivalent, primarily due to methane emissions from landfills [3]. Of this total waste, 32% (94 million tons) was recycled and composted, 11.8 % (34 million tons) was used for energy recovery, and over 50% (146 million tons) was landfilled [3]. Several factors, including the pattern of higher consumption and disposal, limited recycling and energy recovery infrastructure, and inconsistent local, state, and federal-level policies and regulations lead to higher dependency on landfilling. [4]. Historical trends in MSW generation in the US from 1960 to 2018 demonstrate substantial shifts in waste composition over time (Table A1). Paper waste generation peaked between 1970 and 2000, accounting for around 36% of total MSW generated. However, there was a decrease in paper waste generation after the 1980s, reaching 23.1% in 2018, likely due to increased recycling efforts and the shift toward digitalization. In contrast, food waste generation followed a reverse trend, with continuous increases after the 1980s, reaching 21.6% in 2018 due to increased food consumption and population growth. The contributions of glass and metals to overall MSW composition have shown a downward trend from 10.5% and 11.4% in 1970 to 4.2% and 8.8% in 2018, respectively, due to the shift towards plastic packaging and the availability of more recycling facilities. Overall, there has been a notable increase in food and plastic waste generation, coupled with a reduction in paper, metal and glass waste. Table A2. further shows that MSW composition varies substantially across regions. For example, Phoenix reported the highest yard waste fraction (29.91%), whereas Connecticut, Delaware, and Vermont showed relatively high food waste fractions of 22.3%, 21.1%, and 20.8%, respectively. However, these composition values are not fully standardized across studies and should be interpreted cautiously.
MSW is a heterogeneous material, comprising a variety of materials such as food, plastics, paper, yard waste, textiles, glass, metals, ceramics, and more. This heterogeneity makes it difficult to accurately estimate the quantity and quality of fuel products inherently available [5]. Maximizing material recovery from MSW begins with efficient sorting and separation, which can transform single or mixed waste streams into high-quality recyclables and energy resources. The necessity of waste characterization arises to quantify the heterogeneity of waste and standardize the waste management processes. Characterization studies on MSW generally observe the properties such as overall composition, chemical composition, physical and bulk properties, determines the feasibility of MSW as a feedstock for recycling [6,7,8]. MSW characterization also impacts the efficient sorting of MSW as it provides the necessary knowledge to distinguish between different fractions of MSW [9]. Automated sorting techniques, ranging from direct methods e.g., magnetic and eddy current separation to indirect sensor-based approaches such as optical sorting, spectral imaging, and hyperspectral imaging, rely heavily on such characterization data to optimize recovery rates and ensure the quality of recyclable streams [10]. MSW sorting leads to the preprocessing and homogenization of MSW through size reduction, decontamination, and compaction. Zhang et al. performed several preprocessing schemes to derive different particle sizes to compare the effect of different techniques, highlighting the necessity for adaptation of different techniques for heterogeneous MSW [11]. Recent studies have examined mechanical recycling, thermal processes and biological methods as key techniques for MSW bioconversion yield enhancement through waste-to-energy conversion. However, the heterogeneous composition and complex mechanisms of MSW conversion have hindered the performance of some of the significant industrial bioconversion processes, such as biochemical and thermochemical routes.
Previous studies on MSW valorization have largely focused on individual pathways or specific waste fractions. With the growing emphasis on MSW sorting, there is a need for a holistic review that integrates all stages of management from generation and source separation to collection, characterization, sorting, and resource recovery. Nevertheless, comprehensive end-to-end assessments remain limited. This study addresses that gap by reviewing the literature and highlighting recent technological advances across the MSW value chain, including conversion into bioenergy and value-added products. Section 2 provides an overview of MSW management, while Section 3, Section 4, Section 5, Section 6, Section 7 and Section 8 examine advancements in sourcing, storage, collection and transportation, characterization, sorting, and utilization pathways. Building on these discussions, Section 9 reviews government policies relevant to each stage of MSW management.
2. Overview of MSW Management
Solid waste handling encompasses the entire spectrum of MSW management, including storage, collection, transportation, treatment, and utilization of MSW for various applications. The final stage includes recovery and recycling, bioenergy production, energy conversion to more useful forms, and landfilling. Data collection for the composition and characterization of MSW is an important aspect of formulating a plan for its effective handling. Intensive data collection on waste management from both a global and regional perspective is indispensable, as the current dataset lacks the information for the different fractions of MSW (paper, plastic, food, textile, metal, glass) and their composition on a wet and dry basis.
Rising global waste generation, the diverse composition of MSW across regions, varying regulatory frameworks, and technological gaps in MSW treatment methods, including recycling and energy recovery, are important considerations for collecting more data to support sustainable waste management. Nonetheless, addressing these challenges is further complicated due to the lack of standardized terminologies used all over the world, which makes it challenging to comprehend shared challenges and opportunities in MSW handling [12].
Municipal or private collection agencies collect and transport the MSW stored in the stationary containers e.g., bins and dumpsters and transport them to collection facilities or transfer stations. For transportation, compaction trucks equipped with features such as electronic control systems for efficient operation are used for residential waste collection. These vehicles are large self-loading compactors and container trucks designed for automatic loading of waste from residential containers, their compaction for efficient transport, and exchange storage containers at transfer stations. The transfer stations act as intermediate facilities between MSW generation sources and the processing or disposal facility, where the multiple collection vehicles drop off the MSW and the waste is loaded into large trucks, rails or barges for long-distance transportation [13]. Transfer stations enhance cost effectiveness by reducing the number of trips required in case the disposal facility is located far from the city, thereby cutting fuel, labor and vehicle maintenance costs [14]. Transfer stations eliminate the need for collection vehicles to travel long distances, which results in more frequent waste collection from residential areas, improving overall MSW collection efficiency.
3. Sourcing of MSW
The effectiveness of MSW management is influenced by various factors, including geographical location, climate, seasonality, human resources and availability of waste disposal facilities [15]. MSW sourcing impacts the handling severely. Systematic control over MSW sourcing can minimize the negative effects of waste exposure on public health, the ecosystem and overall quality of life [16]. MSW, being a heterogeneous mixture generated from diverse sources, reflects the broader human activity, behavior, and culture. Identifying the source of MSW is crucial for understanding generation trends and their management. Primarily, MSW sources are generally classified into residential and commercial categories, as indicated by most statewide waste characterization studies in the US [17,18,19].
Residential sources are further classified into single-housing and multi-housing residential sources based on the collection methods [20]. The efficiency of MSW sourcing depends upon the choice and frequency of MSW collection, source separation of MSW into organics, hazardous materials, and general waste [21]. To better understand the implications of MSW sourcing, Figure 2a. provides a comprehensive visualization of MSW generation, composition of different fractions and proportions managed through recycling, landfill and combustion in the US. This showcases the predominance of landfilling facilities as the largest disposal method receiving 146.12 Mt MSW where major fractions were food waste, paper and plastic waste. The recycling and composting facilities in the US account for 111.69 Mt with significant contributions from paper and cardboard, food waste, metal and plastics. The limited fraction of waste going to waste-to-energy combustion facilities (34.55 Mt) is due to the strict regulations and high capital and operational costs required for setting up the combustion plants. Figure 2b. shifts the focus to the global scale for MSW generation, composition of different fractions and comparison of the fraction of MSW going for recycling, landfill, and combustion facility.
While reviewing the waste characterization studies, a lack of comprehensive end-to-end research was observed on MSW sourcing. This gap can be attributed to the complexity and the variability in waste management systems across different regions. Variation in waste generation patterns, collection patterns and socioeconomic factors significantly impact the characterization of MSW sourcing. To address this heterogeneity, the integrated Internet of Things (IoT) and AI offer promising solutions for predicting patterns and the sustainable management of the MSW [23], which have been discussed in detail in our previous review [24]. Implementation of AI can facilitate smart waste sorting, predictive modelling, and optimization of conversion technologies by accurately forecasting MSW sourcing trends.
Evaluating the environmental and economic impact of MSW sourcing is essential and can be achieved through Life Cycle Assessment (LCA) and Techno-economic Analysis (TEA). Laurent et al. reviewed 222 LCA studies on solid waste management systems, observing that many focus on specific waste types or methodological aspects [25]. Laso et al. investigated pneumatic collection systems for residential sources and found them to be significantly more effective in reducing emissions compared with the conventional collection system [26]. Banar et al. analyzed five scenarios incorporating variable sources, collection methods, and management pathways, concluding that source separation of organic waste can significantly lower the emissions [27]. While TEA studies provide critical insights into the economic impact of MSW sourcing, they are often limited to the handling and transportation stages, with few focusing on the sourcing phase [28,29]. The following sections provide a detailed breakdown of MSW sources in the US and worldwide, offering insights into their characteristics and management challenges.
3.1. MSW Sourcing in the US
3.1.1. Residential Sources
Residential MSW, often referred to as ‘garbage’ or ‘trash’, is primarily generated by single-family and multi-family households and typically includes post-consumer packaging materials such as plastic, paper, food waste, and metal containers. Residential MSW constitutes a significant proportion of a country’s total waste, with rural and urban areas exhibiting distinct waste compositions. Studies indicate that approximately 40% of residential MSW consists of organic waste, predominantly from food waste [30].
State-based characterization studies in the US highlight several consistent patterns in residential waste composition. The scarcity of recyclable paper, such as old-corrugated containers (OCC), is often linked to the success of curbside recycling programs. California’s waste characterization study highlights the importance of such a program, reporting reduced prevalence of OCC in residential MSW [30]. Similarly, plastic materials are prevalent components of residential MSW, posing significant challenges for recycling and resource recovery. Studies in California and New York document a wide variety of plastics in residential MSW [31,32]. Additionally, construction and demolition (C&D) debris are often mistakenly disposed of in residential waste, reflecting the need for public awareness campaigns. The New York City waste characterization study has identified such contamination in residential MSW [32]. However, the presence of electronic waste (e-waste) in residential MSW is relatively low due to the programs available in most states to divert it.
Urban and rural areas differ significantly in waste generation and composition. Pathak et al. report that per capita waste generation was maximum for urban sources (0.14 Kg/day) compared to rural sources (0.10 kg/day). Rural households typically produce higher quantities of organic waste due to greater dependency on homegrown or unprocessed food. In contrast, urban homes generate more plastic waste, driven by the higher consumption of packaged foods and single-use plastics [33]. Figure A1 shows the trend in residential MSW generation across various states of the US. The finding in this table highlights the need for region-specific waste characterization and management strategies to improve efficiency of recycling.
Household hazardous waste (HHW) adds another layer of complexity to residential MSW management. This category includes common household waste like paints, cleaning chemicals, batteries, and pesticides, all of which require separate handling and disposal protocols. These materials are prohibited from regular waste disposal and are instead collected separately at designated drop-off stations. In the US, the EPA mandates specific federal disposal procedures for ozone-depleting refrigerants dumped by households [34].
3.1.2. Commercial Sources
Commercial MSW sources are generated by small businesses, warehouses, educational institutes, government offices, and restaurants, excluding construction and demolition waste [17]. The composition of commercial MSW varies regionally, due to the diversity of commercial and industrial establishments in the region. As illustrated in Figure A2 commercial MSW composition varies considerably across U.S. states. Organic waste and paper waste are the dominant fractions in most states, although their relative contributions differ substantially. Delaware, Pennsylvania, and Michigan show high organic waste fractions of approximately 36–42%, whereas hawaii, Tennessee, and Rhode Island show higher paper fractions of approximately 32–41%. Plastic waste remains within a narrower range of approximately 14–20%, indicating its persistent presence across commercial waste streams. In contrast, metals and glass contribute relatively small fractions, generally below 6%, which is largely due to the high recycling rates or reduced glass usage in packaging.
3.2. MSW Sourcing – A Global View
3.2.1. Residential MSW
Residential waste sourcing worldwide exhibits similarities to US practices in terms of collection but varies from region to region. In Europe, source-segregated waste collection is a priority, while the Asia Pacific region largely relies on mixed collection systems. Conversely, regions such as Africa and Latin America have limited residential MSW collection infrastructure [1]. The residential MSW generation patterns show disparities across regions, with developed countries like France, Germany and the United Kingdom producing significantly higher volumes of residential waste annually as compared to developing countries [35]. This might be due to economic development, consumption behavior and waste management practices.
Per capita hazardous waste generation varies across countries, and the lack of standardization challenges makes global comparison challenging. Implementing specific sorting for this waste is crucial, as improper sorting can disrupt the recycling process. Alarmingly, recent reports indicate a rising trend in hazardous waste generation in countries like China and across the European Union since 2014-15. This trend underscores the complexity of managing hazardous MSW compared to residential and commercial MSW. Hence, measures must be taken towards the formation of policies on waste reduction and responsible sourcing [36].
3.2.2. Commercial Sources
Commercial waste management poses a global challenge due to the diverse composition of the waste streams and the variability of commercial facilities. Factors such as per capita income and the nature of industrial sectors in each region heavily influence waste generation patterns. Most countries show an upward trend in the generation of commercial waste streams, with notable exceptions being Germany and Japan [37]. This decline could be attributed to stringent policies promoting the source separation of MSW. Despite the declining trends, Germany and Japan still exhibit the highest generation of commercial MSW, which indicates the extensive presence of commercial and industrial establishments [37]. Commercial sources are treated differently globally due to the variation in government policies. For instance, in Germany, the responsibility for commercial waste disposal lies directly with the country’s 3.6 million businesses. The implementation of Germany’s five-step waste management strategy is governed by the ‘Commercial Wastes Ordinance (GewAbfV)’, which mandates the separation and recycling of various waste streams. These include paper, cardboard, glass, plastics, metals, wood, textiles, biowaste, and other production-specific waste fractions [38].
3.3. Flow of Residual MSW to Landfills
Residual MSW, which remains after recycling and material recovery, is often processed at material recovery facilities (MRFs) before being transported to landfills. Contaminated materials, multi-layer plastics (e.g., juice boxes, laminated chip bags, cardboard with plastic liners), and industrial composites often enter landfills due to inadequate recycling infrastructure [39]. Additionally, other materials such as plastic containers with food or oil residues and specific plastics like PVC and polystyrene, are discarded in landfills despite their recovery potential due to high processing costs and insufficient recycling infrastructure [40]. Similarly, materials including hazardous waste, low-value metals, non-recyclable e-waste, and rubber are also landfilled due to contamination, high separation costs, or insufficient demand for recovery [41].
Residual MSW follows a systematic pathway starting from the generation point (residential and commercial sources) to collection points, MRFs, and finally, landfills. At MRFs, advanced technologies like eddy current separators, magnetic separators, optical sorters, and air separation methods are used to extract recyclable materials. The remaining residuals, which are often contaminated or non-recyclable, are transported to landfills using specialized vehicles designed for handling large volumes of waste. Demetrious et al. compared the composition of residuals at MRF in Australia, the UK and Canada, which found that the primary constituents of residuals were organics, plastic, paper and glass [42].
4. MSW Handling, Collection, and Transportation
The four major methods employed for MSW collection are curbside/alley, drop off, door-to-door, and pneumatic collection [43,44]. In the US, the most common methods employed for MSW collection are curbside collection and drop-off systems. However, local municipalities require door-to-door collection for waste such as hazardous and bulky materials, which generally do not fit into the curbside bins [45]. Curbside collection involves residents placing waste into designated containers of various types and sizes, typically located a short distance from the residential establishments. Separate bins are allocated for collecting different fractions of MSW, including organic waste (food waste and compostables), recyclables (bottles, cans, jars, cardboard, cartons and paper) and landfill (wrappers, styrofoam, plastic bags and plastic utensils) [46]. Dedicated trucks, usually equipped with compactors, are responsible for the transportation and management of these containers [47]. However, curbside collection may present public health concerns due to odor generation from food waste, especially if there is a significant delay in the collection of waste. To address the challenge raised by curbside collection, particularly in relation to public health, and to make the collection and transportation system more efficient, recent efforts have focused on optimizing the waste collection routes. These research advancements include estimating container fill times, promoting source separation through flow distribution models [44], vehicle routing mechanisms [48], developing mathematical models to define optimum road networks for MSW collection [49] and using GPS-based algorithms to reduce fuel consumption [50].
Drop-off methods are designed for collecting recyclable materials and other materials such as bulky non-recyclable waste e.g., furniture and construction debris, special waste streams from any specific location and non-recyclable residuals from the recyclables stream, which end up in the landfills [51]. Once MSW is source-separated, it is brought to designated drop-off locations equipped with color-coded containers, in which each color represents a specific type of waste [52]. These locations often include facilities for compacting, shredding, and baling to streamline large-scale MSW handling. In many developed countries, these facilities can handle waste types such as glass, furniture and electronic appliances. However, this system has not been widely adopted in densely populated countries due to space requirements, high investment costs, the heterogeneity of MSW and the need for adequate infrastructure [53].
Door-to-door collection, commonly found in South Asian countries, involves collectors picking up waste directly from households. This method is convenient for residents but can be impacted by climate and terrain. However, rapid urbanization and industrialization have hindered the effective implementation of this approach in developing countries. Recent research highlights a reduction in the efficacy of this method, where the majority of MSW in developing countries consists of organic matter (64-80%) and minimal recyclable streams (11-15%) [54,55]. The high moisture content of MSW complicates the sorting process and poses challenges for onsite processing. To improve door-to-door collection in developing countries, effective policies, new technologies and the use of software applications for real-time monitoring are essential.
Although pneumatic collection methods are modern and efficient solutions considered as alternatives to the above-mentioned techniques and are commonly employed in highly developed urban areas, their use in the United States remains limited due to high initial investment and energy consumption. These systems use a centralized piping infrastructure to collect MSW from residential buildings. The pneumatic system operates by using airflow to suction waste from collection bins installed in each apartment to a central collection facility. At this facility, waste is sorted into specific categories such as paper, plastic, and food, followed by preprocessing either onsite or transportation to a specific treatment plant [56]. The collection and transportation of MSW is the biggest contributor to the handling costs of MSW. It involves moving MSW from its source to transfer stations, processing facilities, or disposal sites. The cost associated with collection and transportation has a significant impact on waste management plans. In both developed and developing countries, the cost allocated to this sector is approximately 50-75% and 70-90%, respectively, due to high labor demands [57].
Separation of waste into various streams is crucial when mixed waste stream collection occurs, as it is essential for the treatment and utilization of MSW. The collected MSW is sent to an MRF for separating waste into different waste streams, such as recyclable and non-recyclable residuals (also known as residual MSW). The recovered waste stream is then sold to the market, while the remaining non-recyclable residuals are sent to a landfill for disposal [58]. However, treatment of solid waste is required before the utilization and disposal of a particular waste stream. In the US, municipalities use a variety of treatment methods depending upon the nature of MSW. From a waste-to-energy perspective, these methods are thermal treatment (incineration as the most widely used method, followed by gasification and pyrolysis) and non-thermal methods (landfilling and anaerobic digestion) [59]. The residual MSW is typically sent to the landfill or incineration plant after treatment. Also, in big cities such as New York, the materials (made up of paper, plastic and other industrial composites), which are not easily recyclable or do not have high market demand, are more suitable and preferred waste streams for waste-to-energy plants for incineration. The residual ash coming out from incineration plants is used in construction projects. Lancaster County in Pennsylvania has a separate waste-to-energy facility, operated by Covanta Holdings Corp., which processes approximately 1200 tons of MSW while maintaining air emissions below the set limits [60].
5. Characterization of MSW
Waste characterization is a critical and continuous process that plays an important role in every phase of the MSW management system. After sourcing and collection, it helps in identifying the composition of the generated waste, which is crucial for effective waste management. During transportation, it aids in selecting the appropriate handling methods and optimizing the logistics based on properties such as bulk density and moisture content of waste. At the disposal stage, characterization data helps ensure the most suitable processing of waste [61]. MSW characterization is fundamental for minimizing waste generation and planning a suitable management and valorization strategy [62]. However, the heterogeneous nature of MSW presents significant challenges for accurate characterization. Characterization requires differentiation based on the physical, chemical and biological properties of waste. Additionally, it may involve assessing the thermal properties (such as calorific value, combustion efficiency), optical and visual properties (such as color, reflectance, transmittance and transparency), structural properties (such as tensile strength, porosity, rigidity) and electromagnetic properties such as conductivity and dielectric behavior [63,64].
The physical characterization focuses on moisture content, bulk density and particle size of different components of MSW. Particle size plays a crucial role in determining the design of crushers and mechanical separators, influencing the efficiency of material handling. For example, a smaller particle size provides a large surface area to the microbes during anaerobic digestion, enhancing the degradation and increasing biomethane yield [65]. In addition, bulk density measurement of solid waste is crucial to control the conversion process, like incineration and pyrolysis, where density can affect combustion or thermal decomposition rate and the quality of bioproducts formed [66]. The determination of chemical characteristics of MSW is important for evaluating the potential for energy recovery and environmental impacts within the waste management system. Proximate analysis quantifies the volatile content, ash, and fixed carbon. These parameters are critical for determining the energy potential of the waste and for selecting appropriate thermochemical routes such as combustion, pyrolysis, or gasification [67]. Ultimate analysis determines the elemental composition of waste i.e. carbon, oxygen, hydrogen, phosphorus, potassium and C/N ratio [67]. A high content of carbon and hydrogen indicates greater combustibility, which is important for the incineration process [68].
Similarly, the presence of high concentrations of biodegradables in MSW indicates less elemental carbon content, whereas non-biodegradable fractions contribute to higher carbon levels in MSW [66]. The biological properties of MSW are assessed to quantify its degradability and biogas production potential. One critical parameter is biochemical methane potential (BMP), which determines the capacity of organic waste to produce methane during anaerobic digestion. Additionally, volatile solids, cellulose, hemicellulose, and lignin contents influence the biodegradability of MSW. Microbes excrete specific enzymes which can digest cellulose, polysaccharides and proteins into fatty acids, amino acids and sugars [69].
5.1. MSW Characterization Protocols
EPA advocates two approaches for the characterization of MSW: (1) sampling, sorting, and weighing individual waste components, and (2) a material flows approach utilizing production data for the materials and products [70]. The first approach described above requires a certain confidence level for the assessment results. The waste characterization follows guidelines such as i) ASTM D5231-92, which outlines a standard test method for the determination of the composition of unprocessed MSW [71] and ii) UNEP framework for developing an integrated solid waste management plan, including waste characterization and quantification [72]. The ASTM D5231-92 protocol, titled “Standard Test Method for Determination of the Composition of Unprocessed Municipal Solid Waste”, provides a systematic framework for sampling and manually sorting MSW into broad material categories. It is primarily designed to offer a simple, reproducible approach suitable for classroom demonstrations, training, and educational exercises, rather than for high-resolution waste characterization. While it helps illustrate general waste composition trends, the method lacks the granularity required for assessing recyclability, as it does not differentiate between recyclable subcategories (e.g., different plastics, paper grades, or contamination levels) nor capture material quality metrics critical for material recovery facilities. UNEP has listed a procedure for sample collection that includes listing material types, determining the required sample size based on 80% or 90% confidence level and considering the factors such as timing of sample collection, seasonal variations, site selections and analytical methodologies [73]. The waste could be classified by origin (industrial, consumer, commercial) and destination (landfill, recycling, and other ways). Each U.S state has its own material classification; for example, California uses a standard list of 67 material category [19].
5.2. Detection and Characterization of Hazardous Waste Material in MSW
A hazardous waste characteristic indicates a waste poses a significant risk, warranting its classification as hazardous. EPA classifies hazardous waste into four categories: the F-list (non-specific waste), K-list(source-specific waste), P-list(Discarded commercial chemical products) and U-list(similar to P-list) [34]. Additionally, EPA defines that waste could still be classified as a hazardous waste if it exhibits any of the four physical/chemical characteristics – ignitability, corrosivity, reactivity and toxicity as explained in Table 1 [74]. As per the regulations set by the US EPA under the RCRA Act, solid waste can be identified as hazardous in two ways. Waste can be classified as hazardous either if it exhibits specific hazardous properties or if it is listed by the EPA as hazardous based on a criterion that it poses significant current or potential risks to human health or the environment [75]. While it may initially appear straightforward to distinguish between hazardous and nonhazardous waste through chemical and toxicological analysis, additional factors must be considered to assess the actual level of hazard posed by waste chemical composition [74]. Subtitle C, outlined in RCRA sections 3001-3023, establishes the nationwide hazardous waste management program, such as the identification and categorization of hazardous wastes, and the establishment of standards for generators, transporters, and owners. It also includes operators of treatment, storage, and disposal facilities, as well as provisions for permitting, inspections, and enforcement. Interestingly, most of the states have received authorization to implement some or all of the RCRA Subtitle C program. These state-level RCRA programs must, at a minimum, adhere to the federal program's standards, but they also have the flexibility to adopt more rigorous requirements if they choose [76].
5.3. Characterization of Recyclable and E-waste
Around 23% of the MSW generated in the US is recycled [81]. US EPA issued guidance to help state and local governments standardize the measurement of recycling, aiming to make data comparable across regions. Developed with input from the waste industry and government experts, the standards support coordinated waste system planning. Characterizing recyclable waste is important because it establishes the evidence base for designing effective recovery systems, policy interventions, and infrastructure investments [82]. Detailed composition data allows municipalities to quantify the recycling potential of disposed materials, identify priority streams such as paper, plastics, and food, and estimate greenhouse gas mitigation benefits of diversion [83]. Waste characterization also supports extended producer responsibility (EPR) legislation, provides critical inputs for life cycle assessments (LCAs), and techno-economic analyses (TEAs) of recycling pathways [30]. At the operational level, accurate composition profiles enable MRFs and local governments to anticipate contamination issues, optimize collection routes, and adapt to changing consumer packaging trends. Without such data, recycling system planning risks being based on assumptions that may not reflect local waste realities, leading to inefficiencies or underutilized infrastructure. Despite the wealth of recyclable waste characterization studies in the United States, several research gaps remain. First, there is a lack of standardization across studies, as varying material categories, sampling strategies, and reporting units hinder comparability between jurisdictions, even though EPA guidance exists to support uniform measurement [84]. Temporal resolution is also limited, with most studies conducted intermittently rather than continuously, thereby missing seasonal and year-to-year variations in waste composition influenced by consumer behavior or market disruptions. Additionally, certain waste streams, such as commercial and industrial recyclables, construction and demolition debris, and emerging materials like textiles and compostables, remain underrepresented. Contamination and material quality metrics are often inadequately captured, reducing the utility of composition data for optimizing MRFs performance or selecting the recycling pathway.
E-waste generation in the US reached 7.18 million tons in 2022, with only 30% of the waste being recycled and the rest being sent to landfills [85]. The characterization of the e-waste is largely lacking due to insufficient national reporting frameworks and municipal collection systems that apply different definitions and sampling methods, and because informal flows and undocumented exports confound mass balances [86]. E-waste is a highly complex waste stream composed of both hazardous and non-hazardous materials, primarily driven by printed circuit boards (PCBs). It typically consists of ~50% steel, 13% copper, aluminum, and other metals, and 21% plastics, along with small but significant fractions of hazardous substances (~1%). Precious metals, though present in trace amounts (gold 0.1%, silver 0.2%, palladium 0.005%), account for about 95% of the financial value supporting recycling operations [87]. It also contains heavy metals such as lead, chromium, cadmium, and mercury, and a lack of characterization data could pose a threat to environmental and human health [88]. To address data gaps, Kahhat & Williams proposed a material flow analysis framework integrating primary survey data with secondary recycling, landfill, and trade datasets to estimate e-waste flows. Their study estimated that of 40 million end-of-life units generated, ~30% were reused domestically, 6–29% exported, 17–21% landfilled, and 20–47% recycled, highlighting substantial uncertainty in end-of-life pathways [89]. The variability reflects uncertainties in user behavior, but the framework demonstrates a scalable approach for quantifying e-waste flows across devices and countries. Despite EPA guidance and recovery programs, the absence of a unified federal EPR framework has resulted in fragmented state-level regulation and voluntary industry initiatives, limiting standardized tracking and financing mechanisms for end-of-life management [90]. Consequently, low recycling rates, inadequate compositional data, and decentralized governance continue to hinder effective circular-economy implementation and resource recovery in the U.S. e-waste sector.
6. Sorting of MSW for Enhanced Recycling
Waste management development is dictated by societal development, e.g., in the US, the free market leaning towards the large landfills drives the policies. However, a movement towards high diversion from landfills is rising, which will require innovation for efficient sorting for recycling [91]. Appropriate sorting of the different fractions of MSW is critical as improper disposal, such as landfilling or incineration without prior sorting, can lead to soil and groundwater contamination when waste is landfilled and air pollution when incinerated [92]. Because of the potential impacts, waste sorting is widely recognized as an effective method for reducing pollution and enhancing recycling efforts [93]. Sorting technologies for solid waste can be categorized into two main approaches: direct and indirect processes, each defined by the type of interactions between the particles and the corresponding force field of the separator [94]. Direct sorting techniques utilize the inherent properties of materials, applying an external field to facilitate separation [95]. On the contrary, indirect sorting techniques involve the extraction and identification of materials' characteristics, such as color, form, texture, and spectral features, using sensors and actuators (Huang et al., 2017). With advances in machine learning and sensor technology, these techniques are becoming more relevant day by day for challenging waste fractions, as discussed in the following subsections. Figure 3. illustrates the sorting of a mixed recycling stream at a typical MRF in the US to recover marketable materials. However, there exist considerable variations in MRF across the states in terms of technology adopted (automation or manual), infrastructure, market value of the product being recovered and regional recycling programs. In the US, single-stream MRF primarily processes a single stream of recyclable materials, ensuring these are separated from organic waste and other non-recyclable materials. Some MRFs process the source-separated materials and are referred to as “high-grade MRFs”. These facilities further sort or refine recyclables to produce high-quality outputs. Source-separated materials are typically sorted at the point of disposal into distinct categories such as paper, metal, plastic or glass [96]. Mixed-waste MRFs, process waste stream that combines recyclables with organic waste. These facilities separate recyclables, while organics are sent for composting or RDF facility [91]. Contamination of inbound recyclables by organics poses a big challenge to the MRF and can damage the equipment. There exists an inbound contamination rate of 16% in the US, which can significantly hinder the recovery rate at MRFs [97].
Typically, at MRF, the process begins with the collection of mixed recycling streams from residential and commercial sources, either through curbside or drop-off programs. The collected materials are then transported to the MRF via transfer stations [91]. At the MRF, the mixed recycling stream undergoes an initial presorting stage, during which large objects, hazardous materials, plastic bags, and non-recyclable items that could potentially damage sorting equipment are removed through visual inspection. The clean stream is then transferred onto conveyor belts for further sorting through a series of mechanical, magnetic, optical, and manual processes designed to segregate materials based on properties such as color, size, and shape [10].
Magnetic separators extract ferrous metals such as steel and iron, while eddy current separators recover non-ferrous items, including aluminum cans. Optical sorters, equipped with near-infrared (NIR) sensors, identify and separate different types of plastics based on their resin codes (Smith et al., 2019). Despite these advanced automation systems, manual sorting remains a critical component at various stages of the process to ensure the highest quality of the sorted output. Manual sorting following optical separation is essential for recovering materials that may not be effectively captured by automated systems. These materials include colored plastics (e.g., laundry detergent containers), polyethylene terephthalate (PET) soda bottles, and high-density polyethylene (HDPE) milk jugs. Finally, the sorted materials are compacted using baling machines and packaged separately for shipment to specialized processing facilities. This multi-faceted approach ensures the efficient recovery of high-quality recyclable materials, supporting the downstream recycling processes.
6.1. Direct Sorting Techniques
6.1.1. Magnetic Separation
Magnetic separation involves the use of Neodymium (NdFeB) magnets to separate ferrous and non-ferrous components of solid waste [95]. The ferromagnetic portions are attracted to the magnets and the waste is sorted based on magnetic strength, such as strong, medium, weak or non-magnetic [99]. MRFs often use different configurations of magnets to recover ferrous materials from other recyclables [100]. Primary drum magnets separate ferrous metals from shredded output, while over-belt magnets capture residual ferrous material from non-ferrous streams on a conveyor belt. A magnetic ballistic separator provides a clean stream of ferrous products by using inertia to propel ferrous particles, which have significant non-ferrous attachment, beyond a splitter [101]. The addition of rare earth element (REE) magnets ensures the separation of even slightly magnetic austenitic stainless steel and offers a much stronger magnetic force of up to 25 times the pull of conventional ceramic magnets. REE-based magnetic separation is particularly useful for recovering low-magnetic, minute iron fragments that have limited response to standard ferrite magnets [101,102].
Different techniques based on magnetic fields are employed to separate metallic elements. Magnetic drums are cylindrical in shape and are utilized to separate ferrous metals from non-ferrous or mixed streams. This system consists of a magnetic drum having a permanent magnetic assembly within its half circumference. When a stream of waste is allowed to come in proximity to drums, the strong magnetic field attracts ferrous materials on the rotating drum surface. As a result, the ferrous materials move to the edge of the drum and collected in designated bins [10]. Additionally, magnetic head pulley systems, where the pulley is placed at the end of a conveyer belt with an integrated magnetic assembly, are another option for sorting. The magnetic overhead belt system consists of an overhead belt integrated with a magnetic assembly, placed perpendicular to the direction of the mixed stream of waste.
Similarly, magnetic density separation is used in recycling industries to segregate metallic and nonmetallic waste based on differences in their density and behavior towards a magnetic field. Magnetic fluid is used as a separation medium and is mixed with the waste stream. The segregation is achieved by varying the density of magnetic fluid, which results in the floating of recyclable materials with different densities at different levels [103]. A shredder combined with a magnet is used in MRFs for processing the mixed waste consisting of different grades of paper and ferrous metals (e.g., iron, steel). The shredder breaks down the large pieces of waste into smaller pieces, which are then passed through a magnetic field (magnetic drum or overhead magnet) to extract ferrous metals [104].
6.1.2. Air Separation
Air separation methods utilize the principle of inertia, where light material is carried horizontally or upward by an air medium, depending on the use of horizontal or vertical separators, while heavy material settles [99]. The efficiency of air separation depends on the factors such as wind speed, the shape of the cylinder, the inclination of the air flow, and granularity [99]. In a typical MRF, air separation is employed to remove lightweight materials, such as paper, plastic, foam, and rubber, which are collectively known as shredder residue. Suction is often used to remove these light materials, while compressed air is used to remove specific materials from the stream, especially to separate fines and other light materials from glass [100]. In vertical air separation systems, the airflow pushes lighter materials upward while heavier materials are collected at the bottom [105]. Cyclone separators are used effectively in recycling units, which operate by utilizing centrifugal forces created by a rapidly spinning air vortex. The centrifugal force pushes the heavier particles towards the outer wall, while lighter materials remain near the center [91].
6.1.3. Eddy Current Separation
Eddy current separation relies on Faraday’s law of magnetic induction, which states that a voltage is generated in a material when magnetic flux density (B) changes with time (t), given by the equation:
-dB/dt=V/A (i)
Where B = magnetic flux density, V= voltage, A = cross-section of enclosed area normal to the lines of magnetic flux.
The current produced by an induced voltage in an electrical conductor is called “eddy current”. In this technique, waste materials are passed over a drum that houses a high-speed assembly of permanent magnets, generating an alternating magnetic field. This causes the metallic waste to be separated from the non-metallics where the ferrous metals are attracted to the drum and brushed off, the non-ferrous metals are thrown clear of the drum, and the non-metallics are drawn away from the drum by gravity [106].
6.1.4. Sink/Float Separation
The sink/float separation technique is particularly effective for separating plastic materials. Polyolefins, which have densities under 1000 kg/m3, are easily separated from other plastic types, such as PET, PVC, PS, and others [107]. Nonetheless, PVC and PET have a similar density range, complicating the implementation of this method. In such cases, methods like X-ray fluorescence detection are employed which involves irradiating plastic materials with X-rays to detect secondary radiation emitted by chlorine atoms in PVC. A multi-step process involving fluids of varying specific gravities can effectively separate different waste fractions. Quelal et al. separated virgin and post-consumer plastics from MSW using the sink float technique along with water, ethanol and NaCl solutions. The separation based on density achieved higher recovery rates of 70 – 99.70%. In post-consumer plastic waste, different plastics were recovered in the range of 8% to 37% (Meneses Quelal et al., 2022). Sangobtip et al. implemented a three-stage sink float separation to separate six type of plastic HDPE, polypropylene (PP), PVC, PS, PET and acrylonitrile–butadiene–styrene copolymers (ABS) [109]. Another study introduced a computational fluid dynamics (CFD) model to optimize dense medium drum (DMD) separators by providing insight into the physics of flow dynamics inside the separator which predicted polymer separation behavior with less than 7% error [110]. These studies show the continuous development of the sink float method towards increasing efficiency, which will impact the recycling of plastic waste.
6.2. Indirect Sorting Techniques
6.2.1. Laser Induced Breakdown Spectroscopy (LIBS)
This spectrum-based measurement technique utilizes an intensive laser pulse to create high-temperature plasma, which emits light in the cooling phase. The emitted light from this plasma is collected by a charge-coupled device and analyzed by a spectrometer to determine the elemental composition of a material. A typical LIBS system includes a laser, spectrometer, and optics positioned above a conveyor belt. By analyzing the relative intensity of spectral lines, LIBS can effectively classify materials such as plastic waste (PET, PP, PS, HDPE, LDPE, PVC), metals and glasses [10,111]. Huber et al. identified PVC waste in an industrial materials sorting plant using LIBS, as PVC is generally sorted out in energy recovery applications of mixed plastic waste due to the possible formation of hydrochloric acid [112]. In another study, classification of PET, PVC and PS was done using a simple LIBS setup, utilizing spectral lines or molecular bands. The signal ratios from elemental lines of different polymers were analyzed, with the most important ratio corresponding to H/C1 and C2/C1 [113]. The importance of combining LIBS with algorithms such as Artificial Neural Network (ANNs) and Principal Component Analysis (PCA), especially in plastic classification, has significantly enhanced the accuracy as compared to traditional methods. K-Nearest Neighbor (kNN) is one of the most significant methods for high-precision plastic classification using simplified arithmetic [114]. The LIBS system has been used for past sorting applications by performing high-resolution mapping of geological samples with a repetition rate of 1kHz and spatial resolution of 50 μm [115].
One such integration of PCA and kNN with LIBS was used to classify plastics (acrylonitrile, polyamide, polycarbonate, polyethylene and polymethyl) with 99.6% accuracy. while classifying categories of plastics viz. acrylonitrile, polyamide, polycarbonate, polyethylene and polymethyl. PCA reduced spectral data dimensionality, reducing training time to 168 seconds and classification time to less than 0.02 seconds per sample [114]. Although LIBS has shown promising results, a similar composition of most polymers (HDPE/LDPE and PS/polycarbonate) leads to the generation of similar LIBS spectra, which makes the classification process difficult. This problem was overcome by applying spectral descriptors and kNN method, which extracted only the relevant chemical information from the polymer spectra of 20 virgin polymers [116].
Further, combining LIBS with Raman or IR spectroscopy could help in addressing this problem. In addition, we remark that the absence of an open-source LIBS database, limited sample size using spectra from the same polymer type, and limited information about the potential of LIBS for assessing metal contaminants are some of the areas that remain underexplored.
6.2.2. X-ray Based Sorting
X-ray based sorting technologies utilize X-rays to penetrate materials, resulting in absorption and transmittance through the detector, which produces object-specific X-ray spectra [117]. This technique is categorized into two main categories – Dual energy X-ray transmission (DE-XRT) and X-ray fluorescence (XRF), as shown in Figure 4. DE-XRT is primarily used for recovering metals from recyclable streams, where the dual emission X-ray (two X-rays with different wavelengths) is applied on the material and the higher density metals are separated from lower density metals based on X-ray attenuation. This technique is especially effective for sorting materials with different atomic numbers [118].
XRF is a non-destructive technique that is ideal for the recovery of different grades of plastics (mainly PVC, PET, PP), metals (stainless steel or aluminum) and contaminants (arsenic, copper) in heavily soiled waste [119] . The incident X-rays excite the individual atoms present within the object and emit secondary (fluorescent) X-rays, which contain the characteristic features of the element present. One of the striking features of the XRF technique is its integration into big recycling facilities to refine separation. It can penetrate up to 1 mm within the object and analyze black polymers and surface contaminated fractions in milliseconds [120]. Bezati et al. showed that XRF with a tracer system can be a solution for the high-speed sorting of black plastics into different categories [121] . XRF has been applied previously to separate out PVC from PET, which can be difficult due to the similarity in their density. Removal of PVC from the waste stream containing PET avoids the formation of chlorinated compounds upon reprocessing of the PET recyclates [122]. XRF has the unique advantage of detecting tracers even in a black polymer matrix, but the number of tracers is limited by the periodic table. To improve the accuracy of polypropylene sorting, Energy Dispersive X-ray fluorescence (EDXRF) has been proposed, which can also recognize black polymer and surface contamination [123].
7. Preprocessing of MSW
Following collection, MSW is directed into several management pathways such as landfilling, recycling, waste-to-energy, composting, or other thermo-chemical and biological conversions. Preprocessing denotes the unit operations performed between collection and post-processing to meet the requirements of the chosen pathway. As discussed in Section 4, MSW destined for landfilling is gathered from municipal, commercial, and institutional sources, transported to the landfill, tipped at the working face, and then spread and compacted within designated cells using landfill compactors or bulldozers [124].
MSW presents greater feedstock challenges than other biomass, primarily due to its heterogeneity, variable elemental composition, and high moisture content (often exceeding 75%) [125]. The high moisture content of MSW is another challenge and is responsible for high energy input in drying, which creates techno-economic hurdles. The waste composition and generation rates vary significantly across income groups [126]. For instance, high-income countries produce more dry waste such as paper, cardboard, metal, plastic etc., which are relatively easy to recycle. Conversely, over 50% of MSW generated in low-income countries consists of organic fractions, which pose significant management challenges [127]. To address these challenges, pretreatment processes are implemented to reduce feedstock variability and improve conversion efficiency.
Pre-processing often begins at the source separation stage. For instance, achieving a homogeneous particle size during incineration and maintaining a consistent feed to the combustion chamber are primary objectives for ensuring a steady fuel output from MSW feedstock. Figure 5. illustrates the various preprocessing methods employed to prepare MSW feedstock for valorization. Removing non-combustible materials like construction debris, leather, metals, glass, and low calorific value waste, such as food waste, enhances fuel efficiency. Consequently, various techniques are employed based on the facilities to separate noncombustible and lower calorific value materials [128].
The choice of preprocessing techniques depends on the specific waste management approach. Preprocessing methods serve to homogenize materials, eliminate moisture, consolidate waste, remove contaminants, and reduce particle size, among other functions [128]. Preprocessing may involve sorting unwanted materials, extracting metallic and non-metallic components, separating organic fractions, and employing mechanical and biological treatments [129].
Various pretreatment methods have been studied extensively for MSW valorization, particularly for anaerobic digestion, where mechanical, thermal, and pelletization methods have been widely studied. Mechanical pretreatment reduces particle size and increases surface area, thereby improving substrate accessibility. Thermal pretreatment, one of the most widely used pretreatment methods for industries, is effective in removing pathogens. However, selection of the temperature is important as higher temperatures can lead to particle agglomeration or the formation of melanoidins, which may hinder downstream processes [130]. Further innovations to improve economic viability include utilizing systems that operate at low heat and oxygen levels to produce refuse-derived fuel, co-digesting multiple feedstocks to improve biogas yields, genetic engineering and system biology to modify the microbes for higher biomass conversion rates, and co-processing MSW-derived biocrude with petroleum crude fraction [131,132].
7.1. Mechanical Preprocessing
Waste compaction is a key mechanical preprocessing technique used to remove unwanted materials from MSW. This process uses high pressure to reduce waste volume with the overall goal of increasing treatment efficiency and reducing GHG emissions. Compaction is typically carried out at transfer stations, in collection containers, in transportation trucks and at landfill sites. Initial compactions occur in waste collection trucks, enabling the transportation of larger waste quantities. Furthermore, compaction offers several advantages, including moisture removal, cost efficiency, increased landfill capacity, improved waste stability and reduced production of leachate [133].
However, the effectiveness of compaction depends on the composition of MSW, the thickness of waste layers, and the type of equipment used for compaction, all of which influence the unit weight of compacted waste [134]. For waste incineration, sorting is not typically performed. Instead, a pre-processing step known as “fluffing” is used. It involves loosening the waste into smaller and uniform particles to increase surface area. This improvement enhances air circulation during combustion, leading to more efficient and complete burning while reducing GHG emissions [135]. Due to the heterogeneity of MSW, size reduction is a critical preprocessing step for its effective valorization. Reducing particle size not only enhances homogeneity but also increases the surface area for reaction, which facilitates improved reaction and better yield. For example, organic cotton with an average diameter of 25 µm after milling showed a fivefold increase in reaction and yield during enzymatic hydrolysis [136]. Similarly, methane generation during anaerobic digestion improved by 25% when the particle size was reduced to 0.5 cm. However, particle sizes below 0.5 cm can cause clogging, mixing, and foaming issues. During pyrolysis, smaller particle sizes are preferred as they increase the syngas yield [137]. Smaller particle size and compaction reduce the water permeability of the waste, resulting in less generation of leachate and ensuring minimal contamination of groundwater [138].
Considering the importance of the size reduction of MSW, several mechanical preprocessing techniques are used. Shredding is commonly used with low to high-torque shredders using blades that cut materials against a fixed wall, as they pass through the unit [139]. Shredded MSW can subsequently be used for incineration or landfilling. Size reduction through shredding not only increases the surface areas but also enhances compaction and bulk density of the material. As a result, it reduces the space required in landfills and ensures efficient combustion in incineration facilities. Additional mechanical systems include screw conveyors, which transport the materials, while rotating shafts on opposite axes assist in shredding. Ball mills are also used, where heavy balls within a rotary drum break down materials into small fragments [140]. Another mechanical pre-processing method involves the use of trommels for size-based separation of MSW, in which the feedstock passes through a rotary cylindrical drum with varying size openings along the cylinder wall, facilitating sorting based on size. Soft materials are separated, while rigid and larger materials are discharged, enabling size-based preprocessing [128]. While combining with a rotary drum, trommels are particularly effective for anaerobic digestion. Rotary drum aids in reducing waste particle size and separating the organic fraction of the waste, resulting in a large surface area for microbial activity [141]. This combination resulted in enhanced methane production by 18-36% [142].
7.2. Thermal Preprocessing
Thermal preprocessing applied after MSW collection include low-temperature drying (about 60–120 °C) to reduce moisture and stabilize fuel, pasteurization to meet sanitation when routing the organic fraction to anaerobic digestion (e.g., 70°C for ≥1 h or equivalent regimes), pressurized steam autoclaving (120–170°C) that sterilizes mixed MSW and fiberizes paper to improve downstream separation, thermal hydrolysis (140–170°C, short residence) that solubilizes organics, lowers viscosity, and can improve dewaterability and methane yields, hydrothermal and steam-based treatments (e.g., liquid hot water or steam-explosion) that open lignocellulosic structure and accelerate hydrolysis, hydrothermal carbonization (180–250°C, wet/pressurized) that converts organic fraction into a pumpable slurry and energy-dense hydrochar and torrefaction (200–300°C, low oxygen) that yields a more hydrophobic, grindable refuse-derived fuel (RDF) with higher energy density [143]. In practice, composting lines prioritize sterilization or thermal hydrolysis for improved digestibility. Steam explosion is a common lignocellulosic biomass pretreatment method used during bioethanol production, and it is performed at 200–260 °C for 5–10 min under rapid decompression with the purpose of lignin activation by using high-pressure steam of 1–3 MPa[144] . However, it has also been used to produce solid fuel pellets during the steam explosion, which causes plant cell walls to explode, exposing cellulose fibers and depolymerized lignin to be more accessible for densification [145].
7.3. Pelletizing
Pelletizing is done by first removing the non-combustible fraction of the waste, and then the combustible materials are densified under pressure. Pelletization is done after sorting and size reduction steps, producing refuse-derived fuel (RDF), These pellets can be used as a feedstock for combustion or for char production. This preprocessing technique aims to increase the bulk density of materials. Although higher moisture content is required for effective compaction, the heat and shear generated during densification can remove up to 30% moisture in a single pass [146]. Cardboard and paper pellets exhibit better bulk density results as compared to other feedstocks [147]. For RDF production, pre-processing steps are required to address the heterogeneity of MSW, particularly for application in cement industries [148]. This includes source separation, sorting, grinding and shredding, followed by steps such as screening, shredding, size reduction, classification/separation, drying, and densification [125]. Pelletizing converts the combustible fraction of MSW into densified cylinders after removal of noncombustible materials, and it typically follows sorting and size reduction.
7.4. Washing and Decontamination
Contamination poses a significant challenge to the valorization of MSW into bioenergy and biofuels. Plastic and paper are commonly contaminated with dirt, food waste, ink, labels, adhesives, nails, and other foreign materials [149]. Contamination has a detrimental impact on the quality of recycled products. Therefore, removing the contaminants is critical for a clean stream of feedstock. Washing is a key treatment method for decontamination, particularly important for plastic. Pre-washing is done to remove the heavily contaminated materials which can be detrimental to the equipment. Following pre-washing, either wet or dry washing techniques are applied.
Wet washing involves the use of detergent or chemical solutions, such as NaOH, to remove food particles, stickies, and glues using either hot or cold water. Dry washing relies on friction between the particles to separate dirt and contamination, with the clean particles retained on the screen [150]. For the paper fraction of MSW, various methods such as pulping, cleaning, screening, and enzymatic washing are employed to get a cleaner, recyclable paper stream. Cleaning and screening are done to remove nails, paper clips, and rocks by using centrifugal cleaners for the weight separation of the contaminants [149]. Deinking is used to remove ink from paper, employing various surfactants, with ultrasound and floating techniques being particularly effective to remove toner ink [125].
8. Utilization of MSW for Bioenergy and Value-added Products
The composition and properties of MSW exhibit substantial variation due to climate, local policies, economic status, lifestyle, seasonality, and so on [151,152,153]. This variability poses a significant challenge in the research and development of conversion processes for value-added products. These processes may be selected based on quantity of generated waste, such as paper, food, textiles, plastic, metal, glass, wood waste and others [125]. Furthermore, the selection could also be influenced by local market conditions for the derived products, land availability, community acceptance, life cycle impacts and techno-economic feasibility. Due to these variations related to composition and properties, the existing research technologies for other solid fuels cannot be directly applied towards MSW conversion without implementing substantial modifications [154]. Therefore, it is important to understand the specific characteristics such as sorting, preprocessing, technology selection, and challenges associated with the heterogeneous nature of MSW, as discussed in subsequent sections.
The conversion of different fractions of MSW into various bio products has emerged as a promising substitute globally, driven by technological advancements such as improved upcycling through pyrolysis, plasma gasification, and co-hydrothermal carbonization [155], automated sorting and preprocessing systems by robotics and ML algorithms [156], enhanced bioprocessing methods using synthetic biology and an advanced enzymatic cocktail [157], and AI AI-enabled smart waste management system [158]. At present, biofuels are being recognized as sustainable power sources, offering potential solutions for resolving the worries emerging from energy security and mitigating climate change [159].
The selection of the most suitable technology for utilizing MSW depends on waste generation patterns and their physical, chemical, and biological properties. Substantial research has been done around the globe on harnessing MSW to produce energy in the form of heat, power, liquid and gaseous biofuels, bioproducts and other renewable carbon resources [155,160]. The strategies for converting MSW into various value-added products are summarized into four routes: biochemical, thermochemical, physiochemical and cutting-edge technologies, as shown in Figure 6.
Biochemical pathways include the microbial breakdown of moisture-containing biomass having higher biodegradable content for obtaining energy-dense fuels. During anaerobic digestion, the organic fraction of MSW, including kitchen waste, wastepaper, and wood, is digested in an anaerobic digester to produce raw biogas. The impurities present in raw biogas, which include carbon dioxide (CO2), ammonia (NH3) and hydrogen sulfide (H2S), are subsequently removed using techniques such as pressure swing adsorption for CO2, acid or amine scrubbing for NH3, and chemical scrubbing to remove H2S [165]. The compressed and purified form of biogas is used for electricity generation. On the other hand, thermochemical routes (e.g., refuse-derived fuel, gasification, pyrolysis, incineration/combustion) are more useful for the conversion of moisture-free biomass having substantial non-biodegradable organic fractions [157]. Thermochemical process converts the biomass mainly into solid (biochar), liquid (bio-oil), gaseous (syngas), heat and fuel through high temperature (range 300-1700 °C) and high-pressure reactions [166]. The operating conditions of thermochemical processes make them a versatile option to utilize organic biomass having high lignin content, which cannot be degraded using biochemical routes. One of the key end products of these processes is syngas, a mixture of carbon monoxide, hydrogen, and methane, produced by gasification, pyrolysis, and incineration of MSW fractions [167]. Syngas is used in turbines, fuel cells or boilers for electricity generation and heating applications. During gasification, carbon-containing waste is heated within a temperature range of 500-900 °C in an oxygen-rich environment to produce syngas. Pyrolysis occurs at temperatures ranging from 300-1000 °C in oxygen-free conditions, yielding char, syngas and bio-oil [168].
The high temperature facilitates critical reactions such as volatile cracking (to obtain simple gaseous products), decarboxylation (removing CO2 from organic molecules) and dehydration (eliminating water molecules) to form more stable and energy-rich products [169]. The physico-chemical routes include physical, chemical and transesterification processes for the conversion of solid waste, which are difficult to manage, such as vegetable oils, fats and greases into biodiesel or liquid fuels [170]. Vegetable oils can be treated and valorized with the electro-demulsification method, where an electric current (typically ranging from 0.5-1.5 V cm-1) is applied to separate the suspension into two products: hydrocarbon liquid and concentrated sludge containing oils. The liquid stream of hydrocarbons is used in a refinery as high-quality fuel and sludge is considered a low-quality fuel with its potential use for chemical synthesis [171].
Cutting-edge technologies comprise fermentation pathways such as dark fermentation, photo fermentation and combined fermentation methods, as well as bio-electrochemical processes, including microbial fuel cell (MFC) and microbial electrolysis cell (MEC) [172]. These processes focus on converting organic fractions of MSW into biohydrogen, electricity and bioproducts [173]. Photo fermentation is mainly dependent on purple non-sulfur bacteria including Rhodobacter sp., Rhodopseudomonas sp., and Rhodospirillum sp. and has the additional advantage of high biowaste conversion yield and biohydrogen yield compared to dark fermentation [174]. Recently, a new concept has been introduced where thermochemical processes are combined with biological processes to enhance bioenergy recovery along with economic benefits. For instance, combining pyrolysis of raw food waste and its digestate obtained from an anaerobic digester located at a commercial facility improved biogas and bio-oil yield by 7.4 wt% and 60.3 wt%, respectively [175]. In another experiment, hydrothermal liquefaction was integrated with anaerobic digestion with the idea of recovering the residual carbon from anaerobic digestate, resulting in biogas yield from 3.9-22.6 m3 kg-1 and bio-crude yield of 20-42 wt%, with a high heating value of 28.4-31.2 MJ kg-1 [176]. Figure 7. highlights the major bioproducts formed along with associated treatment methods using different types of MSW. Food waste is mainly utilized through anaerobic digestion and fermentation processes for biofuel production, whereas paper waste serves as a cellulose-rich feedstock for enzymatic conversion. In contrast, plastic waste such as polyethylene terephthalate (PET) requires depolymerization and microbial upgrading routes for the production of high-value chemicals.
8.1. Thermochemical Properties of MSW Fractions
Thermochemical utilization of MSW depends on fraction-specific heating values, moisture and ash content, and elemental composition, which collectively determines conversion efficiency, emissions, and operational stability. The lower heating value (LHV) of MSW depends strongly on composition and can be interpreted using proximate and ultimate analyses. Moisture and ash lower LHV, while high volatile matter promotes ignition, benefiting pyrolysis and gasification [130]. Food waste, with high moisture content, reduces the overall LHV of MSW, which in turn impacts the efficiency of energy recovery processes [177]. Plastics (excluding PVC and PET) are strong thermochemical feedstocks due to high volatile matter; PVC and PET exhibit ~5% and ~10% fixed carbon, respectively [178]. Carbon content varies by polymer: PE/PP/PS are ~85% C, whereas PVC and PET are ~35–40% and ~60–65% due to higher Cl and O content [178]. Accordingly, plastics (except PVC) can exhibit very high LHVs, e.g., 43,910 kJ kg⁻¹ for PP [130,179].
The 2019 Waste-to-Energy reports on MSW highlights key challenges in utilizing MSW for conversion processes: i) the need of high energy expenditure on drying as >75% water is present in significant fractions of MSW, ii) concentration of nitrogen and sulfur in food and yard waste, which may be up to 20 × higher than those found in other lignocellulosic feedstocks, and iii) dioxins formation during combustion of inorganic waste [180].
On the other hand, ash plays a critical role in thermochemical conversion processes, influencing reaction pathways. Biomass typically comprises oxides, carbonates, sulfates, chlorides, and silicates of inorganic element [181]. Alkali metals are often present in water-soluble or ion-exchangeable forms, while alkaline earth metals tend to be more structurally bound to the biomass matrix. So, heavy metals are usually present in trace concentration but can exhibit high mobility under thermochemical conditions [182]. In case of gasification, alkali metals, especially potassium and sodium exhibit strong catalytic activity in biomass gasification process. Potassium is particularly effective in lowering energy activation and increasing reaction rates, resulting in higher carbon conversion and increased syngas yields [183]. However, excessive content can cause operational challenges. Chloride associated alkalis (e.g., KCl, NaCl) are especially problematic due to their volatility and corrosive behavior. In pyrolysis process, the main impact is created by reducing bio-oil yield, and increased gas and char formation [184]. If potassium is presented it promotes dehydration, decarboxylation, and cracking reactions, decreasing stability. So, feedstock with high alkali content required pretreatment (e.g., washing or acid leaching) to improve liquid fuel yield [185]. In case of SAF production pathways, syngas upgrading or bio-oil hydrotreatment, alkali metals are detrimental to catalysts especially the ash can neutralize acidic catalyst sites and cause irreversible catalyst deactivation [186]. Therefore, controlling alkali metal content is essential for maintaining high conversion efficiency and meeting fuel quality specification. The main impact will be accelerating catalyst sintering and deactivation, increasing metal contamination in intermediate products [187]. Stringent feedstock characterization and ash management strategies are therefore required to ensure process reliability and regulatory compliance. These constraints emphasize the importance of fraction specific handling, and advanced characterization strategies to enable efficient thermochemical utilization of heterogeneous MSW streams.
8.2. Waste to Sustainable Aviation Fuel (SAF)
MSW-to-SAF pathways offer significant decarbonization potential but remain constrained by feedstock heterogeneity, syngas cleanliness requirements, and absence of fully integrated LCA/TEA. SAF is expected to play a central role in decarbonizing aviation by 2050, and MSW is increasingly evaluated as a feedstock. However, variability in financial, operational, and policy contexts complicates comparison across pathways, leaving gaps in understanding technical, environmental, and TEA outcomes. ASTM has approved multiple SAF pathways, including hydro processed esters and fatty acids (HEFA), Fischer–Tropsch synthetic paraffinic kerosene (FT-SPK), alcohol-to-jet (ATJ), sugar-to-iso-paraffins (SIP) and catalytic hydrothermolysis jet (CHJ) [188]. Among these, FT-SPK is the most deployed pathway for MSW-derived SAF, while others remain in development. Scale-up priorities include feedstock conditioning for gasification compatibility and integrated LCA/TEA frameworks [189].
Recent initiatives include: (i) Southern Research’s JP-8 production via SPK-A with autothermal reforming and hybrid FT integration [190]; (ii) Fulcrum Bioenergy’s MSW gasification + FT facility in Gary, Indiana, processing ~70,000 tons yr⁻¹ to produce ~33 million gallons of aviation fuel with >80% GHG reductions and certification under RFS and LCFS [191]; and (iii) the Altalto Immingham project targeting >50,000 tonnes of residential and commercial MSW for SAF, with claimed 70% GHG reductions [192,193]. Nevertheless, MSW-to-SAF remains constrained by feedstock heterogeneity and the need for clean syngas for FT, and current pathways generally lack evidence of carbon negativity at full system scale.
A central approach for SAF production is gasification and FT synthesis, where MSW is pretreated and gasified into synthesis gas (CO and H2), then catalytically converted into liquid hydrocarbons that are upgraded into SAF [188,194]. This process looks straightforward, yet each stage has significant challenges. MSW waste as a feedstock is not just chemically variable, it is also spatially and temporally inconsistent [195]. The supply chain must coordinate collection, sorting, preprocessing, and transportation. In addition, ash and trace metals represent some of the most recalcitrant components in MSW, posing significant technical challenges for downstream conversion processes [196].
In MSW gasification-FT systems, inorganic ash and trace elements including alkali metals, chlorine and heavy metals are carried into the gasifier. These impurities deposit on catalyst surfaces, blocking active sites, promoting sintering, and accelerating deactivation, thereby reducing catalyst activity and lifetime [197]. Removing these species from syngas is technically necessary and involves major steps such as scrubbing, filters, and chemical cleanup. All of these will reduce energy but add capital and operating costs [198]. Ash also contains toxic substances that can form corrosive compounds under high temperatures [199]. Even with effective syngas purification, only a fraction of the input carbon is converted into liquid fuels, with the remainder lost as CO₂, CO, or light gases unless additional measures such as CO₂ recycling or external hydrogen integration are employed [200].
Scaling up SAF production requires collaboration among feedstock suppliers, fuel producers, airlines, and policymakers to share knowledge, invest in research and build partnerships that address technical, financial, and logistical barriers [201]. Diversifying feedstocks reduces competition with food and environmental impacts, while advances in catalysts, process optimization, gasification, pyrolysis, and bioconversion improve conversion efficiency and lower production costs [202]. Another option to reduce the capital cost is incorporating renewable energy sources which can help reduce carbon footprint of SAF production. Emerging AI-enabled material recovery facilities (AI-MRF) equipped with smart conveyor systems offers a promising pathway to reduce feedstock heterogeneity by enabling precise, real-time classification and separation of MSW streams, to improve economic viability [24,203].
8.3. Waste to Syngas
Syngas quality from MSW gasification and plasma conversion is highly sensitive to moisture, ash, and contaminants, requiring robust feed conditioning and gas-cleaning strategies to enable reliable downstream use. Syngas production from MSW varies substantially with feedstock composition, moisture content, gasification agent, and operating conditions [167]. Plasma gasification (630–850 °C) has produced syngas with LHV of 6.79 MJ m-3 [204]. Increased moisture can raise H2 while lowering CO via the water–gas shift reaction [205]. In steam gasification, Hu et al. reported H₂ yields up to 277.67 mL g-1 for MSW moisture content of 10 to 60%, with improved performance at Ca/C = 0.7 and moisture ~40% [206]. Persistent barriers include equipment fouling from ash/heavy metals and formation of styrene, tar (e.g., toluene, naphthalene, phenol, biphenyl), and corrosive gases (H2S, COS), which require improved gas cleaning and process integration [167].
Recent literature emphasis that syngas quality from MSW is not determined by the reactor alone, but is a system level outcome governed by feedstock variability, operating severity, and the design of gas-cleaning trains. Together these factors determine whether tar formation, acid-gas corrosion, or catalyst deactivation becomes the limiting factor [207,208]. In this context, variability in MSW and RDF, especially in moisture content and chlorine- and sulfur-containing components, can lead to unstable operating conditions that complicate scale-up and reduce long-term reliability. As a result, feed specification and preprocessing become key design considerations, on par with reactor temperature and gasifying agent selection [208]. Among downstream constraints, tar remains the most persistent bottleneck for syngas utilization. Recent studies show that deep tar reduction cannot be achieved through reactor tuning alone and instead requires multistage gas cleaning systems. These typically involve particulate removal, catalytic cracking or reforming, and acid-gas scrubbing [207]. Another approach such as plasma-assisted conversion has been explored as complementary strategies for tar reduction. The high temperatures can effectively break down heavy hydrocarbons while simultaneously converting inorganic residues into inert slag. Nevertheless, the deployment of this pathway is influenced by their electricity driven energy demand and associated costs. This has motivated the development of two stage or hybrid configurations in which plasma is used as a secondary conditioning step, targeting residual tars and refractory species in the product gas rather than serving as the primary conversion route [209]. In addition, experimental and modeling efforts aimed at tailoring MSW derived syngas toward specific targets, such as hydrogen rich compositions under steam gasification, show that steam gasification and catalytic strategies can substantially alter syngas composition and improve reactor level performance. However, these improvements alone are insufficient to produce deployable syngas without effective control of tar and heteroatom derived impurities through integrated gas cleaning systems [210]. Consistent with broader syntheses of MSW gasification studies, limitations related to tar formation, gas cleaning requirements, and operational stability are more frequently identified as barriers to scale-up and end-use compatibility [211]. Experimental demonstrations further underscore that deployable waste-to-syngas systems must address contaminant management as rigorously as gas yield. This has driven the integration of catalytic and wet-cleaning trains to ensure downstream compatibility and operational robustness under realistic MSW derived feed variability [212].
8.4. Waste to Biochar
Biochar production from organic MSW fractions provides a dual opportunity for landfill diversion and carbon sequestration, but consistent performance requires feedstock standardization and contaminant management. Landfilling and incineration create major environmental burdens through methane emissions, leachate generation, and formation of heavy-metal-rich ash and air pollutants [213,214]. In the U.S., landfills contributed 17.1% of total methane emissions (119.8 million metric tons CO2e) in a 2022 inventory [215]. Biochar production via pyrolysis offers an alternative pathway to divert organic MSW fractions, produce a recalcitrant carbon material with higher C/N than the feedstock, and support carbon sequestration and soil benefits.
Mixed MSW biochar research is expanding, but inconsistent feedstock composition across studies leads to variability in biochar physicochemical properties [216]. Given U.S. landfill composition of food waste (24.14%), plastics (18.46%), paper (11.78%), metals (9.53%), and yard trimmings (7.21%) [217], substantial organic carbon is available for conversion. Biochar sequestration potential has been estimated at 2.57–6.60 Gt CO2e yr-1, alongside soil benefits such as improved water retention and cation exchange capacity [218]. Specific studies demonstrate functionality: art paper biochar produced at 600 °C achieved Pb(II) sorption capacity of 1500 mg g-1 due to reactive calcite phases [219]. Biochar produced at >500 °C is generally better suited for sequestration, whereas ≤300 °C chars may better support soil fertility [220]. Recent work demonstrates that co-pyrolysis can systematically influence biochar yield and quality, particularly when heterogeneous MSW-derived organics are co-processed with complementary waste fractions such as plastics, yard trimmings, or other carbon-rich residues. In these systems, the resulting biochar is not governed by temperature alone, but by a blend-chemistry effect in which the identity and proportion of the co-fed fraction shape secondary reactions, carbon retention, and solid-phase structure [221,222]. In this context, co-pyrolysis of corn stem and polyethylene at 600 °C yielded 31.8% biochar with 76.53% carbon, supporting sequestration and soil enhancement [223]. Controlled experiments using mixed municipal and horticultural wastes demonstrate that the feed blending ratio, along with the catalytic environment when applicable, is a primary factor controlling both biochar yield and surface functionality [221]. Experimental evidence suggests that co-pyrolysis of MSW with lignocellulosic feedstocks in the presence of low cost, waste-derived catalysts influence devolatilization and secondary reactions, reinforcing the importance of feed selection and controlled conditions in determining biochar physicochemical properties [224]. Studies on biomass and plastic co-pyrolysis show that hydrogen-rich polymer volatiles modify the balance between condensation and cracking reactions. This enables purposeful tuning of solid residue properties when contaminant constraints such as ash, halogens, and metals are treated as primary design variables [222]. Beyond their influence on carbon yield and char chemistry, co-pyrolysis strategies are increasingly used for contaminant stabilization, which ultimately conditions whether MSW-derived biochars can be safely deployed in environmental applications. Waste co-pyrolysis studies targeting problematic inorganics show that sludge mineral or slag assisted co-processing can promote heavy-metal stabilization in the solid phase through the formation of more stable mineral associated or residual fractions [225]. Reviews of sewage sludge and biomass co-pyrolysis consistently report that co-feeding biomass reduces heavy metal concentrations and ecological risk in sludge-derived biochars, reinforcing the need to consider solid-phase safety alongside char yield and carbon sequestration objectives [226].
Above discussion highlights that valorization outcomes from MSW are fundamentally design dependent, affected by feed composition, processing severity, and contaminant management. Table 2 presents MSW fraction–to–valorization route selection recommended pathways and constraints. Across all valorization routes, feedstock conditioning and contaminant control are the dominant determinants of conversion efficiency, product quality, and environmental performance.
9. Government Policies Influencing MSW Management
Policymaking drives effective municipal solid waste management practices by establishing the regulatory framework for achieving circular economic goals and protecting public health and the environment. Accurate data collection and analysis form the foundation for effective policymaking. Two primary conceptual approaches utilized for estimating MSW generation are “top-down” material balance models from industrial statistics and “bottom-up” measurement-based models [228]. The “top-down” approach derives data from the manufacturing phase of the material’s life cycle, where the commercial statistics from industrial associations and trade unions are used to create a material flow analysis for resource productivity. Examples include waste-extended input-output (IO) models, which assess resource productivity and MSW generation [229]. The “bottom-up” model involves direct data collection from various waste management facilities, including landfills, waste-to-energy facilities, and MRFs. Data is primarily gathered through field surveys and sampling during the post-consumer use phase of the material’s life cycle. In the US, state environmental organizations (SEOs) and certain non-governmental organizations (NGOs) voluntarily conduct audits and waste characterization studies, collected from the sub-regional or municipal level to regional, state and national estimates, which can be combined to help in the formulation of waste management policies [230].
The Resource Conservation and Recovery Act (RCRA) of 1976 serves as the foundation legislation for solid waste management in the US [76]. Under title 40 of the Code of Federal Regulations (CFR), EPA provides guidelines on the development and implementation of state solid waste management plans encompassing policies, procedures and criteria for effective regional solid waste management planning outlined in Section 4002 (a,b) of the Solid Waste Disposal Act [231]. It regulates the landfill design, operation, and closure to ensure compliance with these standards, which are enforced at the county level by federal and state governments through inspections, permits, and penalties for non-compliance with prior approval from the EPA. These plans must clearly define the roles and responsibilities of state and local authorities, allocate federal funding to the responsible authorities, and establish strategies for implementing and coordinating regional planning, as specified in Section 4006(b) [232]. Section 4005 (c) prohibits the establishment of new open dumps, mandating that all solid waste must be either utilized as a resource or disposed of in a sanitary landfill (compliant with section 4004(a)) [231].
Although public involvement strategies are incorporated into yearly work plans, as mandated by 40 CFR 25.11, community-level engagement varies significantly [233]. While Title 40 of CFR emphasizes EPA’s mission to protect human health and the environment, practical implementation at the various county levels is often hindered by challenges such as irregular inspections of landfills, delays in issuing permits, and insufficient enforcement of regulations. Moreover, cross-state comparison of national MSW management data is not reliable due to differences in MSW composition, local infrastructure and state policies [234]. This disparity requires states to have specific guidelines and regulations for solid waste management plans aligned with federal requirements, allowing states to adopt a flexible approach to address unique challenges related to waste type, population density and economic factors. For instance, Missouri’s solid waste management laws meet federal RCRA Subtitle D requirements and include additional provisions for permitting, inspections, enforcement, investigation, and solid waste cleanup [235]. State-level regulations are often more stringent than the EPA guidelines. The Texas Administrative Code (Title 30) defines MSW more broadly than the EPA as ‘solid waste resulting from or incidental to municipal, community, commercial, institutional and recreational activities, including garbage, rubbish, ashes, street cleanings, dead animals, abandoned automobiles and all other solid waste other than industrial solid waste [236]. Other types of waste, such as hazardous and toxic, require separate policies and frameworks for handling. The RCRA Act of 1976 authorizes the EPA to oversee the hazardous waste life cycle and establishes a framework for managing hazardous solid waste [81]. Prior to 1980, hazardous materials were often co-disposed with the MSW [237]. However, the amendments to the RCRA act in 1984 required the development of environmentally protective landfill standards and emphasized long-term strategies for managing hazardous waste, including waste reduction, efficient transportation, proper disposal, and increased recycling rates [238]. In 1990, the Coalition of Northeastern Governors (CONEG) passed the Model Toxics Reduction Act, which mandates the reduction of toxic substances such as cadmium, mercury, lead, and hexavalent chromium in packaging materials [239]. This regulation has been widely adopted in nineteen states to reduce the disposal of hazardous waste in landfill [240]. The EPA also regulates certain “household hazardous wastes,” limiting disposal of 220 pounds per month per family or small business, allowing safe co-disposal with residential solid waste [241]. Another significant waste category in solid waste management is “white goods,” which includes discarded domestic and commercial appliances like washers, stoves, and refrigerators. Many states have enacted bans on the disposal of white goods in landfills and approximately 75% of these appliances are made of steel, which is typically recycled [242]. Across the US, individual states and cities have enacted various waste disposal bans. North Carolina has established bans on the disposal of white goods, aluminum cans, scrap tires, lead-acid batteries, plastic bottles, computer equipment and televisions [243]. According to the Electronics Recycling Coordination Clearinghouse (ERCC), 25 states, including the District of Columbia, have passed legislation promoting the reuse and proper recycling of e-waste [244].
The US EPA has put waste reduction and reuse as part of its sustainable waste management. The ‘reduce, reuse, recycle’ program encourages sustainable consumer behavior, such as ‘thinking before buying’, while targeting to enhance the recycling facilities, minimize contamination and reducing greenhouse gas emissions by 50% [245]. According to the EPA’s Fiscal Year 2022-2026 strategic plan (objective 6.3), significant focus has been given on reducing food waste and ensuring safe disposal of 2.96 billion tons of solid, industrial, and hazardous waste [246]. However, the current US policies, such as the RCRA Act, emphasize waste disposal over waste reduction. Furthermore, the MSW management is primarily overseen by individual states, leading to a fragmented approach [247]. States such as New York have legislated the installation of biogas capture for landfills having a waste capacity of 2.5 million m3 and with an annual NMVOC emission rate greater than or equal to 34 Mt [248]. Such policies are aimed at reducing the overall GHG emissions and making reusing and recycling more lucrative compared to landfilling. Programs such as extended producer responsibility (EPR) make the producers responsible for managing their products at end-of-life, incentivizing more sustainable and innovative product designs [249]. EPR frameworks include California (SB-54), which delegates the responsibility of recycling plastics and packaging material to the manufacturers [250]. Many states set rules on single-use plastic bags, polystyrene, or require itemized provision of single-use service ware (e.g., Washington State restrictions that require customers to request utensils). These laws reduce MSW generation upstream [251].
Developed countries often emphasize advanced waste management practices, including recycling, waste reduction, and reuse [252]. In contrast, developing countries tend to rely more on landfills or open dumping as primary disposal methods, though recycling and resource recovery initiatives are gaining momentum [253]. Many countries have adopted waste reduction measures, such as banning plastic materials. The Chinese government has implemented policies aimed at source reduction to achieve ‘zero waste cities.’ These measures have resulted in a 3-15% reduction in greenhouse gases from household waste in cities such as Shenzhen, Xining, Panjin, and Tongling [254]. Responsible sourcing has also emerged as a validated strategy to reduce MSW generation per capita, and the governments of different countries are looking to utilize it. The “pay-as-you-throw” (PAYT) model implemented in Japan demonstrated a 20-30% decrease in residual waste, highlighting the effectiveness of economic incentives [255]. Similarly, Germany has also successfully introduced comprehensive waste segregation systems, categorizing waste into streams such as paper, glass, light packaging, and biodegradable materials [256]. Despite the potential of government policies to drive change, their success depends upon the participation of citizens. Public awareness and engagement are critical, as waste management policies center around the consciousness of individuals at the source of waste generation.
The EPA promotes waste-to-energy initiatives, the federal government supports various recycling programs, establishes recycling targets, and provides funding for recycling infrastructure under policies such as the ‘Save Our Seas 2.0 Act’ [257]. Furthermore, the US government collaborates with international organizations to address global waste management challenges. This cooperation includes sharing the best practices for the recovery and valorization of the MSW stream to reduce landfill dependency. For resource recovery, the local authorities may establish long-term contracts for the delivery of solid waste to MRFs [245]. The compositional analysis at these facilities is critical, as it directly impacts the recovery potential of material and energy [96]. However, there exists a gap in framing the standardized methods for assessing fuel value, and determining the reclaimed proportion of industrial waste, paper, glass and metals. In the US, waste management programs typically focus on separating wet garbage from dry recyclables [258].
The discrepancy in recycling in the U.S. can be attributed to the lack of a dedicated policy for the recycling strategy [259]. The US used to be dependent on China for the export of recyclables. However, in 2017-2018, China implemented the ‘National Sword Policy’ banning the export of recyclables [125]. This incident, alongside the underdeveloped recycling industry in the US, led to a crisis in the management of recyclables. To increase the recycling scenario, the US EPA has undertaken the “National Recycling Strategy’ in 2018, which aims to increase the recycling rate to 50% by 2030 through five strategic objectives: expanding recycling markets, improving collection and infrastructure, reducing contamination in recyclable materials, strengthening policies, and standardizing data collection protocols [83]. Despite ongoing efforts, many initiatives fall short of achieving their intended outcomes due to the absence of comprehensive nationwide legislation. The US EPA itself acknowledges this limitation and emphasizes that the successful implementation of the ‘National Recycling Strategy’ requires collaboration across federal, state, tribal, and local levels of government [76]. In nutshell, the policies regarding MSW management have evolved through the enactment of the RCRA Act of 1976 for the landfills standards, hazardous waste management, and recycling initiatives. However, the lack of recycling policies has been acknowledged by the US EPA only by 2018, and the success of the ‘National Recycling Policy’ has the potential to unify all the stakeholders to revitalize the recycling industry by providing harmonized legislation, standardized methodologies and active collaboration within the different levels of the government.
10. Conclusions
MSW generation is increasing at a pace that challenges existing management systems, with global quantities projected to rise from approximately 2.0 to 3.4 billion tonnes per year by 2050 and a substantial fraction still mismanaged or landfilled. This scale necessitates a transition from end-of-pipe disposal strategies toward integrated, circular MSW systems that preserve material quality, minimize residuals, and maximize resource recovery across the entire value chain, from bin to final product.
This review demonstrates that two interventions dominate both climate and circularity outcomes: (i) effective source separation, particularly of organic fractions, to mitigate landfill methane emissions, and (ii) high-fidelity sorting to protect the quality and value of recyclable and convertible materials. Landfilled organics remain a leading contributor to methane emissions, making targeted diversion, coupled with landfill gas controls, among the most immediate and impactful mitigation levers. At the facility level, advances in sorting, especially multi-sensor, AI-enabled systems integrating optical, spectral, and X-ray techniques, have transformed MRFs from manually intensive operations into data-driven platforms capable of achieving high classification accuracy at industrial throughput. When paired with standardized characterization protocols, including hazardous fractions, these systems reduce operational risk and improve downstream process reliability.
Across valorization pathways, feedstock conditioning and contaminant control consistently emerge as the primary determinants of performance. Biochemical routes are best suited for wet, biodegradable fractions, whereas thermochemical platforms, incineration with energy recovery, gasification to syngas, and pyrolysis to bio-oil and biochar, are currently the most deployment-ready options for heterogeneous MSW. However, their efficiency, emissions profile, and economic viability are highly sensitive to sorting quality, preprocessing intensity, and system integration. Among these routes, biochar production from organic MSW fractions offers particular promise by combining landfill diversion with durable carbon sequestration and soil co-benefits, although consistency in biochar properties requires feedstock standardization and careful management of ash and contaminants. MSW-to-SAF pathways show strong long-term potential, especially through gasification and Fischer–Tropsch synthesis, but remain constrained by feedstock heterogeneity, syngas cleanliness requirements, and the absence of carbon-negative performance at scale.
Looking forward, the future of MSW management lies in digitally enabled, system-level optimization. Integration of artificial intelligence with real-time sensing, LCA, and TEA can enable adaptive control of sorting, preprocessing, and routing decisions based on material quality, market conditions, and environmental objectives. Such “smart” MSW systems would dynamically allocate waste streams to the most appropriate recovery or conversion pathway, maximizing both economic value and environmental benefit. Equally important is policy alignment: harmonized characterization standards, incentives for source separation, extended producer responsibility frameworks, and markets for recovered materials and carbon-negative products are essential to sustain deployment at scale.
In summary, achieving circularity in MSW management requires coordinated advances in source separation, high-resolution sorting, right-sized preprocessing, and conversion technologies, supported by robust data, policy coherence, and market demand. With continued innovation and integration, MSW can transition from a disposal burden to a resilient source of renewable carbon, energy, and materials, contributing meaningfully to climate mitigation and resource conservation goals.
Author Contributions
Conceptualization, R.R. and L.P.; methodology, R.R., A.S., M.S., N.H., R.K., R.T., S.R., V.R., and L.P.; formal analysis, R.R.; investigation, R.R.; resources, L.P.; data curation, R.R., N.H., R.K., and R.T.; writing—original draft preparation, R.R., A.S., N.H., R.K., R.T., and S.R.; writing—review and editing, L.P.; visualization, R.R., A.S., M.S., R.T., S.R., and L.P.; supervision, L.P.; project administration, L.P.; funding acquisition, L.P. All authors have read and agreed to the published version of the manuscript.
Funding
This material is based upon work supported by the US Department of Energy’s Office of Critical Minerals and Energy Innovation (CMEI) under the Bioenergy Technologies Office (BETO) Award Number DE-EE0009669.
Data Availability Statement
No new data were created or analyzed in this study. Data sharing is not applicable to this article.
Acknowledgments
We would like to acknowledge the valuable support of Srijana Guilford and Jesse Troublefield (The Town of Cary, NC). The contributions of L.P. are in part supported by the E.J. ‘‘Woody’’ Rice Professorship Endowment.
Generative AI statement: During the preparation of this manuscript, OpenAI’s ChatGPT (GPT-5) tool was used for assistance with language editing, text organization, and overall writing clarity. After using this tool, the authors reviewed, edited, and verified all content as needed, and take full responsibility for the scientific accuracy and content of the published article.
Conflicts of Interest
The authors declare no conflict of interest.
Appendix A

Table A1.
MSW generation data across categories from 1960 to 2018 [84,260,261]. Metal includes ferrous, aluminum, and other nonferrous metals, while “others” include electrolytes in batteries and fluff pulp, fecal matter, and miscellaneous inorganic wastes.
| Materials | Percentage of waste generated (1960-2018) | |||||||||
| 1960 | 1970 | 1980 | 1990 | 2000 | 2005 | 2010 | 2015 | 2017 | 2018 | |
| Paper | 34.0 | 36.6 | 36.4 | 34.9 | 36.0 | 33.4 | 28.4 | 26.0 | 24.9 | 23.1 |
| Plastic | 0.4 | 2.4 | 4.5 | 8.2 | 10.5 | 11.6 | 12.5 | 13.2 | 13.2 | 12.2 |
| Food | 13.8 | 10.6 | 8.6 | 11.5 | 12.6 | 13.0 | 14.2 | 15.2 | 15.1 | 21.6 |
| Textile | 2.0 | 1.7 | 1.7 | 2.8 | 3.9 | 4.5 | 5.3 | 6.1 | 6.3 | 5.8 |
| Glass | 7.6 | 10.5 | 10.0 | 6.3 | 5 .2 | 4.9 | 4.6 | 4.4 | 4.6 | 4.2 |
| Metal | 12.3 | 11.4 | 10.2 | 7.9 | 7.8 | 8.0 | 8.9 | 9.1 | 9.4 | 8.8 |
| Rubber & leather | 2.1 | 2.5 | 2.8 | 2.8 | 2.7 | 2.9 | 3.1 | 3.3 | 3.4 | 3.1 |
| Wood | 3.4 | 3.1 | 4.6 | 5.9 | 5.6 | 5.8 | 6.3 | 6.2 | 6.8 | 6.2 |
| Yard trimmings | 22.7 | 19.2 | 18.1 | 16.8 | 12.5 | 12.6 | 13.3 | 13.2 | 13.1 | 12.1 |
| Other | 1.6 | 2.1 | 3.2 | 2.9 | 3.0 | 3.2 | 3.4 | 3.3 | 3.2 | 2.9 |
Table A2.
Percentage composition of MSW generated across regions in the US (Other category includes *C&D waste, household hazardous waste (HHW) and other materials & **electronics, HHW, tires, mattresses).
Table A2.
Percentage composition of MSW generated across regions in the US (Other category includes *C&D waste, household hazardous waste (HHW) and other materials & **electronics, HHW, tires, mattresses).
| Region | Year | Paper | Plastic | Food | Textile | Yard | Glass | Metal | Wood | Other | Ref |
| Phoenix | 2015 | 12.6 | 9.8 | 14.68 | N/A | 29.91 | 1.9 | N/A | N/A | 31.1* | [262] |
| California | 2021 | 15.5 | 13.7 | 10.9 | 3.5 | 6.7 | 2.3 | 4.9 | 10.6 | 31.9** | [20] |
| Colorado | 2018 | 19.2 | 13.2 | 18.2 | 5.4 | 10.5 | 4.2 | 4.7 | 0.9 | 23.7** | [263] |
| Connecticut | 2015 | 23.1 | 11.8 | 22.3 | 5.7 | 6.9 | 2.5 | 3.5 | 7.4 | 16.8** | [264] |
| Delaware | 2016 | 23.6 | 14.9 | 21.1 | 5.2 | 4.4 | 2.6 | 3.1 | 6.5 | 18.6** | [17] |
| Illinois | 2015 | 21.1 | 15.4 | 20.2 | 6.9 | 5.1 | 4.2 | 4.3 | 5.1 | 17.7** | [265] |
| Vermont | 2018 | 22 | 12.4 | 20.8 | 6.1 | 1.5 | 2.3 | 2.7 | 5.2 | 27** | [266] |
Figure A1.
Composition of residential waste in ten states of the United States. Data was extracted from Solid Waste management plan reports from [17,18,264,265,266,267,268,269,270]. Other waste includes C&D, residual and electronic waste for some of the state data.
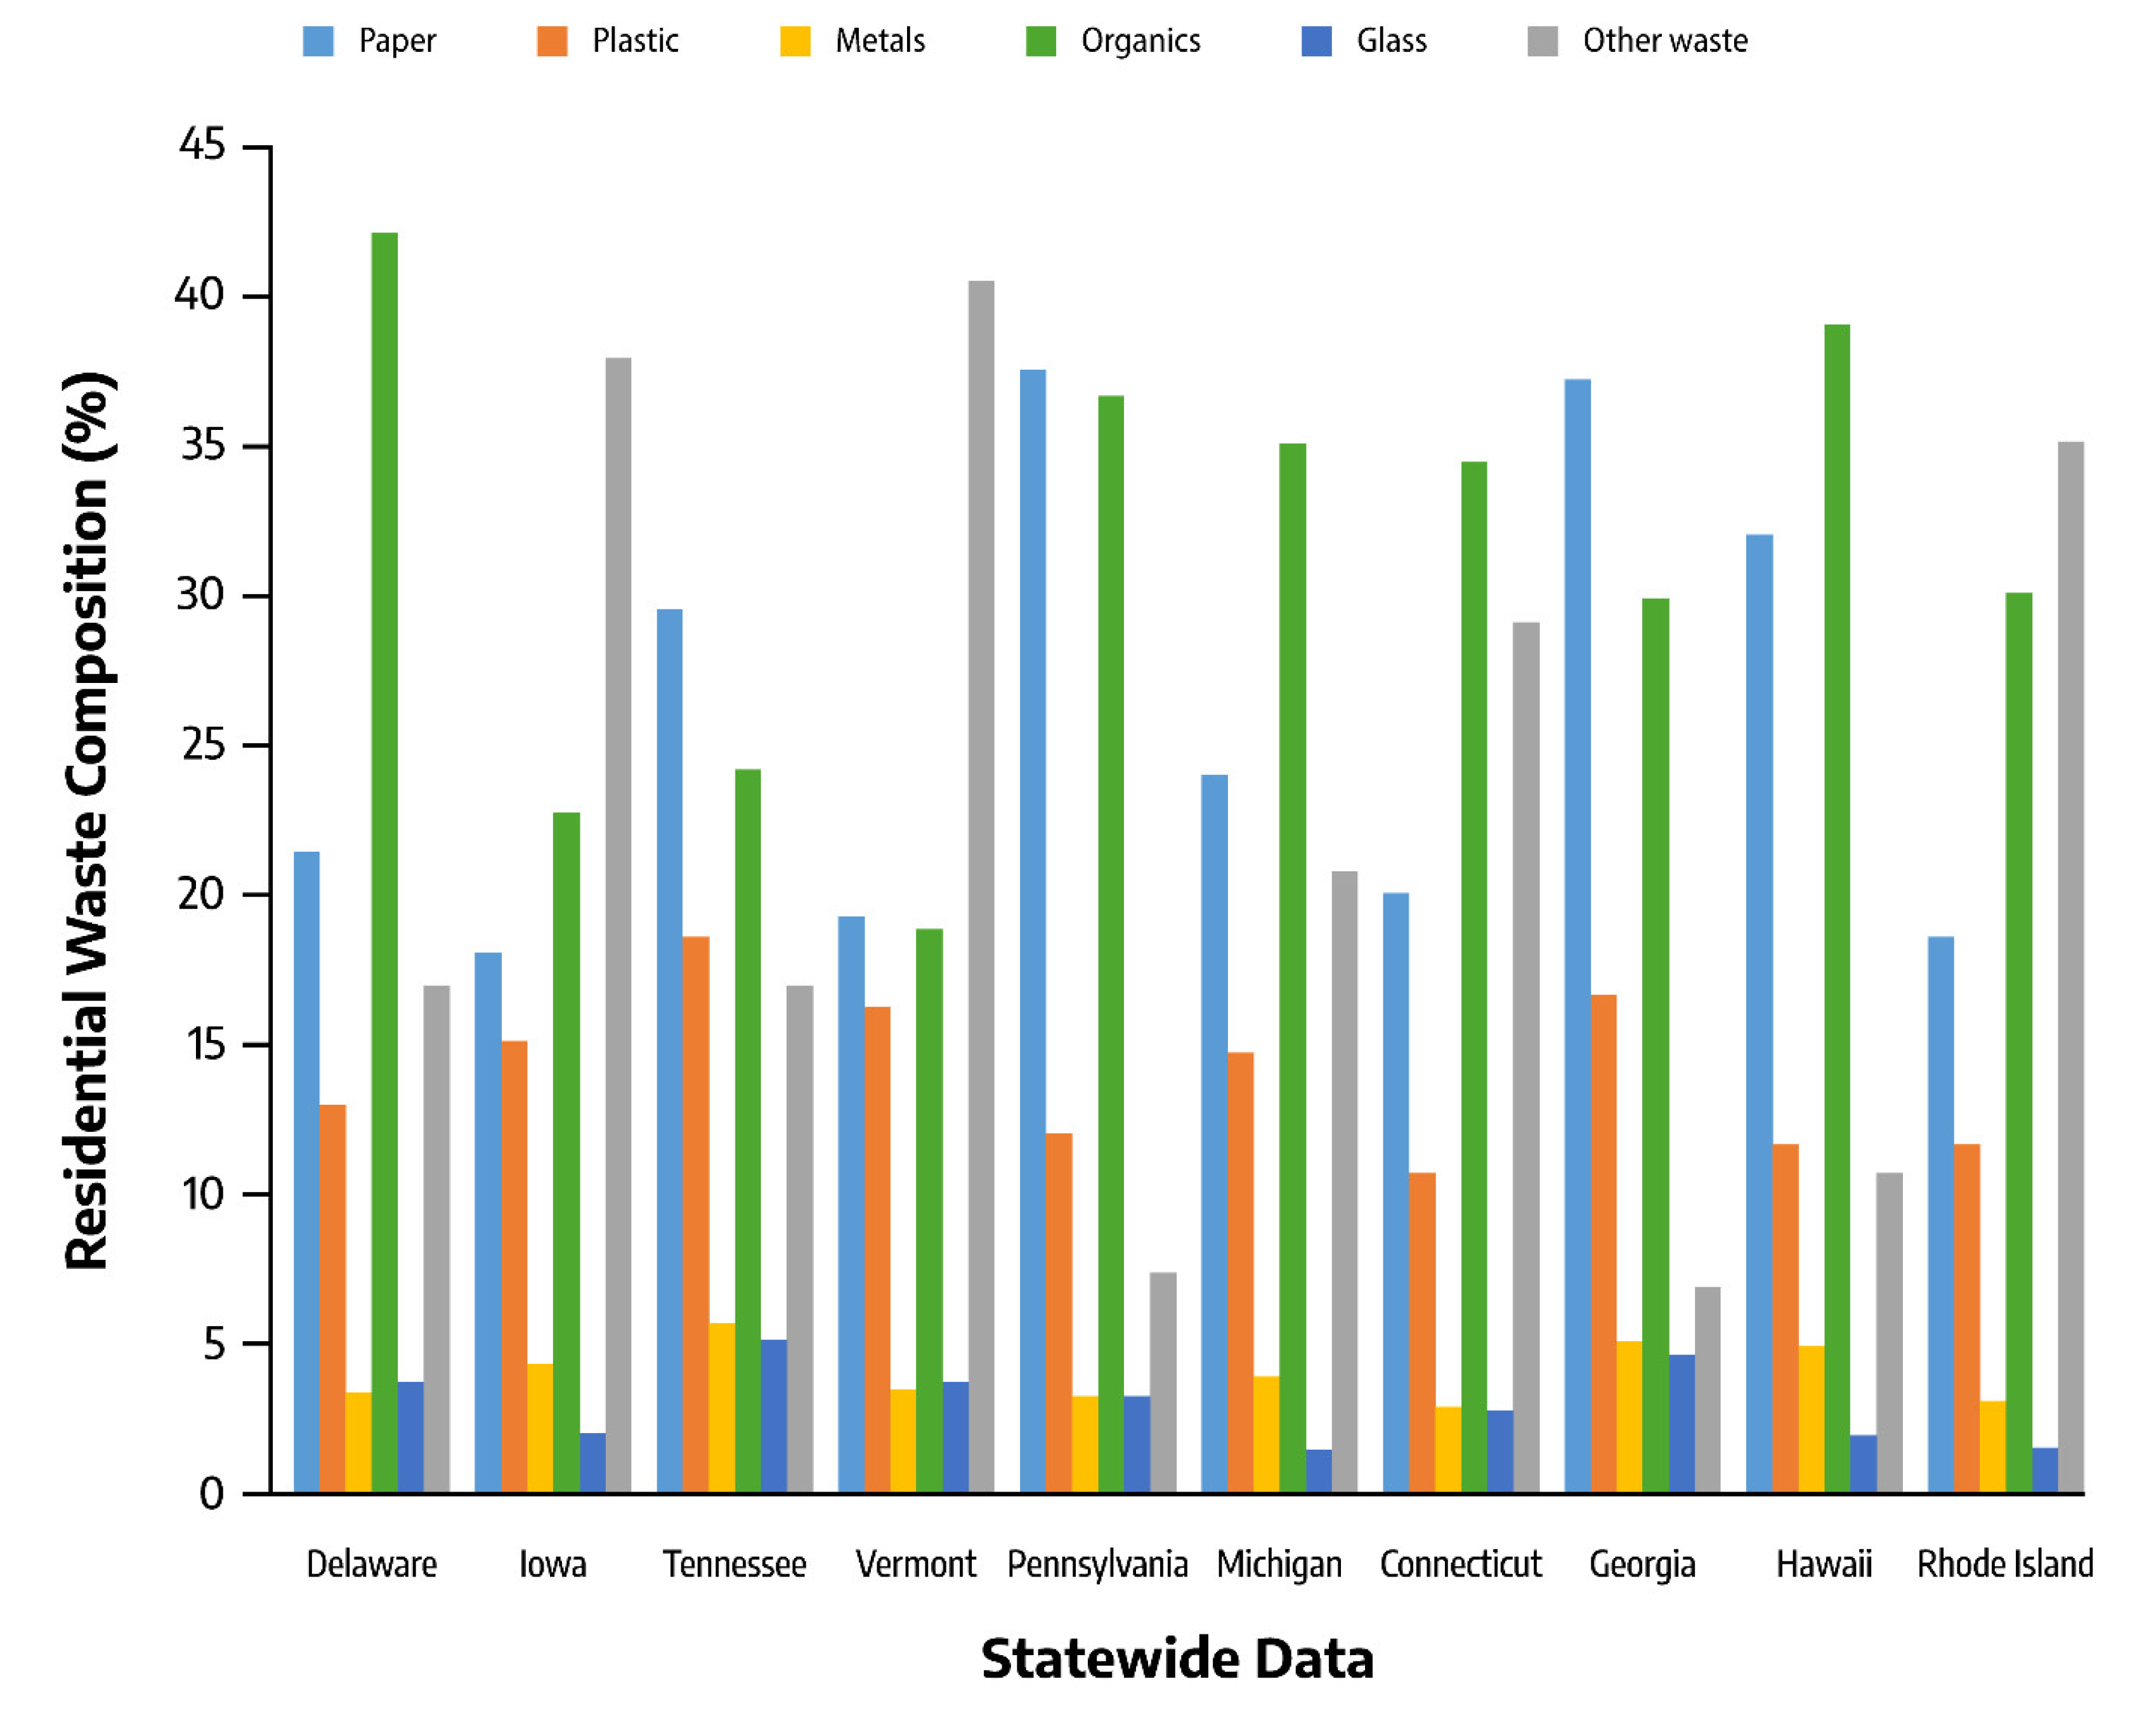
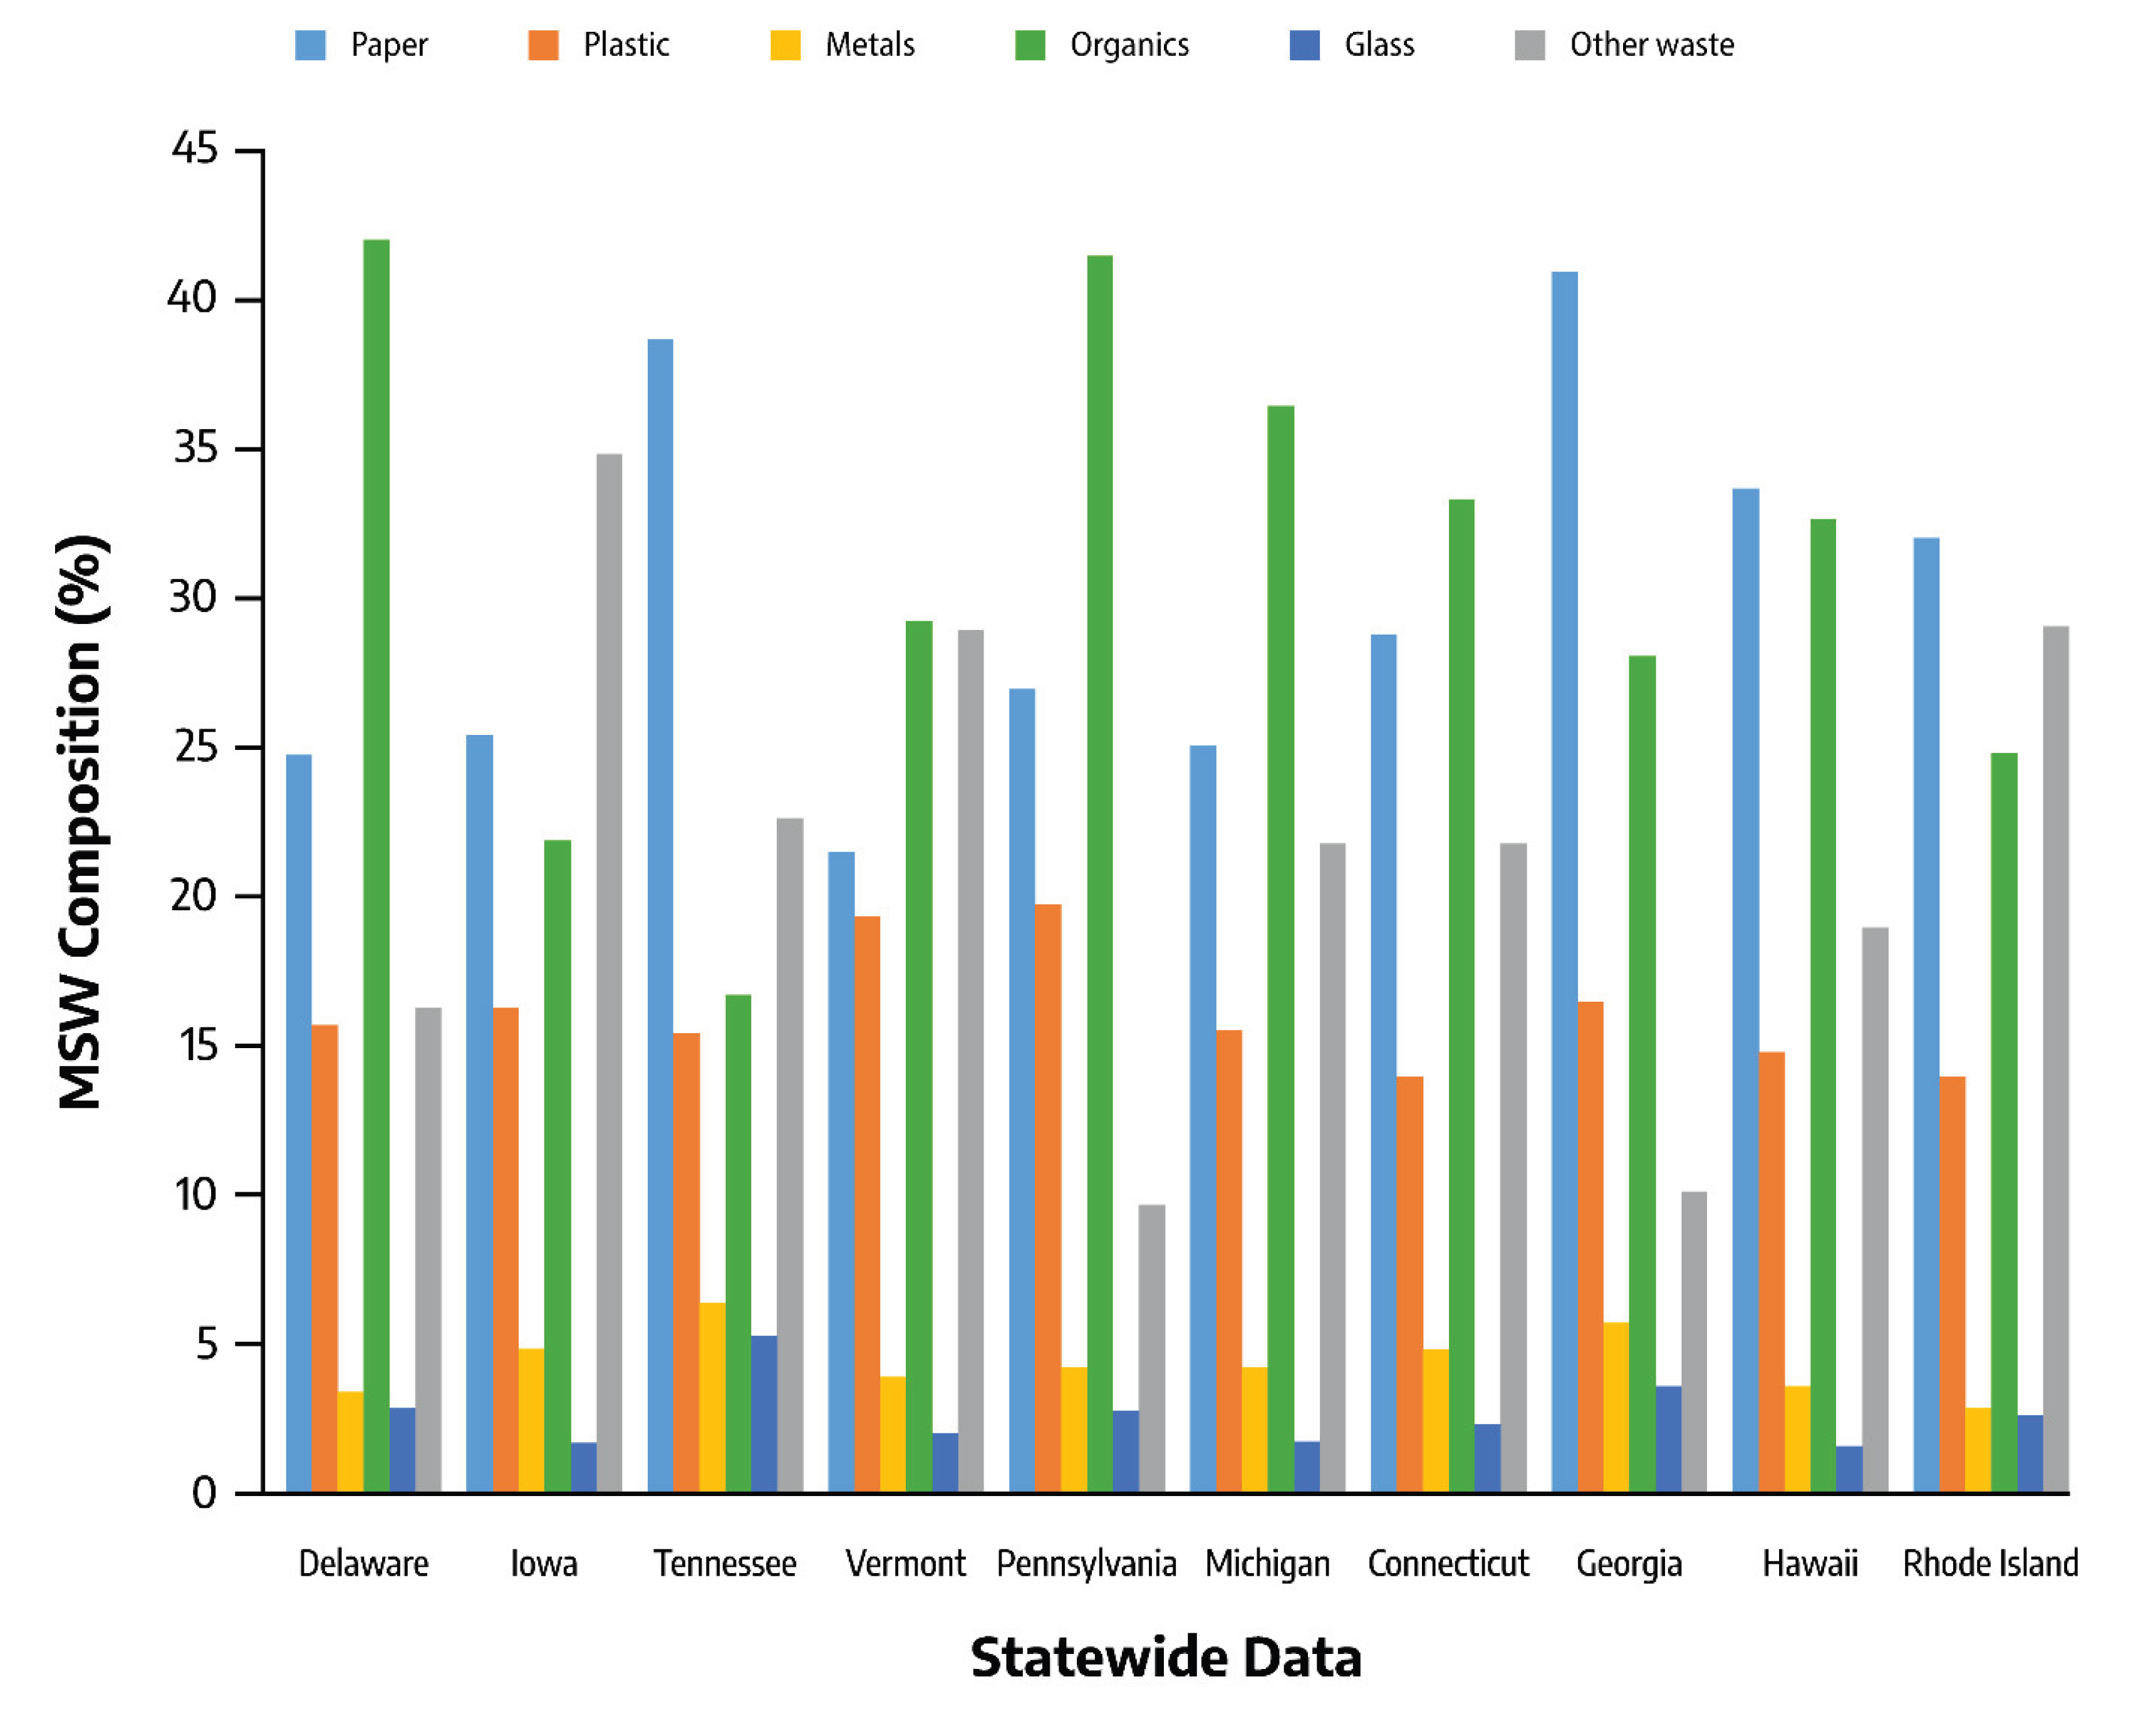
References
- Kaza, S.; Yao, L.; Bhada-Tata, P.; Woerden, F. Van What a Waste 2.0: A Global Snapshot of Solid Waste Management to 2050. In Urban Development Series; World Bank Publications., 2018. [Google Scholar]
- Waste Atlas What a Waste: An Updated Look into the Future of Solid Waste Management. Available online: https://www.worldbank.org/en/news/immersive-story/2018/09/20/what-a-waste-an-updated-look-into-the-future-of-solid-waste-management (accessed on 13 August 2025).
- US EPA National Overview: Facts and Figures on Materials, Wastes and Recycling. Available online: https://www.epa.gov/facts-and-figures-about-materials-waste-and-recycling/national-overview-facts-and-figures-materials (accessed on 7 October 2024).
- Hoornweg, D.; Bhada-Tata, P. What a Waste: A Global Review of Solid Waste Management. Available online: https://documents1.worldbank.org/curated/en/302341468126264791/pdf/68135-REVISED-What-a-Waste-2012-Final-updated.pdf (accessed on 21 February 2025).
- Mohanty, S.S.; Koul, Y.; Varjani, S.; Pandey, A.; Ngo, H.H.; Chang, J.S.; Wong, J.W.C.; Bui, X.T. A Critical Review on Various Feedstocks as Sustainable Substrates for Biosurfactants Production: A Way towards Cleaner Production. Microb. Cell Fact. 2021, 20, 1–13. [Google Scholar] [CrossRef]
- Roy, H.; Alam, S.R.; Bin-Masud, R.; Prantika, T.R.; Pervez, Md.N.; Islam, Md.S.; Naddeo, V. A Review on Characteristics, Techniques, and Waste-to-Energy Aspects of Municipal Solid Waste Management: Bangladesh Perspective. Sustainability 2022, 14, 10265. [Google Scholar] [CrossRef]
- Clemente, E.; Domingues, E.; Quinta-Ferreira, R.M.; Leitão, A.; Martins, R.C. European and African Landfilling Practices: An Overview on MSW Management, Leachate Characterization and Treatment Technologies. J. Water Process Eng. 2024, 66, 105931. [Google Scholar] [CrossRef]
- Siddique, R. Utilization of Municipal Solid Waste (MSW) Ash in Cement and Mortar. Resour. Conserv. Recycl. 2010, 54, 1037–1047. [Google Scholar] [CrossRef]
- Gu, B.; Jiang, S.; Wang, H.; Wang, Z.; Jia, R.; Yang, J.; He, S.; Cheng, R. Characterization, Quantification and Management of China’s Municipal Solid Waste in Spatiotemporal Distributions: A Review. Waste Manag. 2017, 61, 67–77. [Google Scholar] [CrossRef] [PubMed]
- Gundupalli, S.P.; Hait, S.; Thakur, A. A Review on Automated Sorting of Source-Separated Municipal Solid Waste for Recycling. Waste Manag. 2017, 60, 56–74. [Google Scholar] [CrossRef]
- Zhang, Y.; Kusch-Brandt, S.; Gu, S.; Heaven, S. Particle Size Distribution in Municipal Solid Waste Pre-Treated for Bioprocessing. Resources 2019, 8, 166. [Google Scholar] [CrossRef]
- Silva de Souza Lima Cano, N.; Iacovidou, E.; Rutkowski, E.W. Typology of Municipal Solid Waste Recycling Value Chains: A Global Perspective. J. Clean. Prod. 2022, 336, 130386. [Google Scholar] [CrossRef]
- MassDEP. Massachusetts Department of Environmental Protection: 2016 Waste Characterization Study. Available online: https://www.epa.gov/sites/default/files/2016-03/documents/r02002.pdf (accessed on 22 February 2025).
- Singh, G.K.; Gupta, K.; Chaudhary, S. Solid Waste Management: Its Sources, Collection, Transportation and Recycling. Int. J. Environ. Sci. Dev. 2014, 5, 347–351. [Google Scholar] [CrossRef]
- Sondh, S.; Upadhyay, D.S.; Patel, S.; Patel, R.N. Strategic Approach towards Sustainability by Promoting Circular Economy-Based Municipal Solid Waste Management System- A Review. Sustain. Chem. Pharm. 2024, 37, 101337. [Google Scholar] [CrossRef]
- Karak, T.; Bhagat, R.M.; Bhattacharyya, P. Municipal Solid Waste Generation, Composition, and Management: The World Scenario. Crit. Rev. Environ. Sci. Technol. 2012, 42, 1509–1630. [Google Scholar] [CrossRef]
- DSWA Delaware Solid Waste Authority (DSDWA) Waste-Characterization Study FY 2016. Available online: https://dswa.com/wp-content/uploads/2017/02/Final-Report-DSWA-Waste-Characterization-FY-2016-January-2017.pdf (accessed on 21 October 2024).
- Michigan Department of Environmental Quality. Economic Impact Potential and Characterization of Municipal Solid Waste in Michigan, USA. Available online: https://misbf.org/economic-impact-potential-and-characterization-of-municipal-solid-waste-in-michigan/ (accessed on 21 October 2024).
- Cascadia Consulting Group. Targeted Statewide Waste Characterization Study: Detailed Characterization of Commercial Self-Haul and Drop-Box Waste; Contractor’s Report to the California Integrated Waste Management Board: Sacramento, CA, USA, 2006. Available online: www.ciwmb.ca.gov/Publications/default.asp?pubid=1179.
- CalRecycle California Department of Resources Recycling and Recovery (CalRecycle) Waste Characterization Report. Available online: https://calrecycle.ca.gov/wcs/dbstudy/ (accessed on 6 August 2024).
- Chuah, S.-C.; Putit, L.; Singh, J.K. Assessing Residents Intention towards Municipal Solid Waste Source Separation: A Case Study of Malaysia. J. Malays. Inst. Plan. 2023, 21, 382–399. [Google Scholar] [CrossRef]
- US EPA Sustainable Materials Management (SMM) - Materials and Waste Management in the United States Key Facts and Figures. Available online: https://catalog.data.gov/dataset/sustainable-materials-management-smm-materials-and-waste-management-in-the-united-states-key-fa12 (accessed on 6 January 2025).
- Zhang, J.; Yang, H.; Xu, X. Research on Service Design of Garbage Classification Driven by Artificial Intelligence. Sustainability 2023, 15, 16454. [Google Scholar] [CrossRef]
- Rao, R.; Singh, S.; Salas, M.; Sarker, A.; Kumar, R.; Wang, Y.; Lucia, L.; Mittal, A.; Yarbrough, J.; Barlaz, M.A. AI-Powered Municipal Solid Waste Management: A Comprehensive Review from Generation to Utilization. Front. Energy Res. 2025, 13, 1670679. [Google Scholar] [CrossRef]
- Laurent, A.; Bakas, I.; Clavreul, J.; Bernstad, A.; Niero, M.; Gentil, E.; Hauschild, M.Z.; Christensen, T.H. Review of LCA Studies of Solid Waste Management Systems – Part I: Lessons Learned and Perspectives. Waste Manag. 2014, 34, 573–588. [Google Scholar] [CrossRef]
- Laso, J.; García-Herrero, I.; Margallo, M.; Bala, A.; Fullana-i-Palmer, P.; Irabien, A.; Aldaco, R. LCA-Based Comparison of Two Organic Fraction Municipal Solid Waste Collection Systems in Historical Centres in Spain. Energies . 2019, 12, 1407. [Google Scholar] [CrossRef]
- Banar, M.; Cokaygil, Z.; Ozkan, A. Life Cycle Assessment of Solid Waste Management Options for Eskisehir, Turkey. Waste Manag. 2009, 29, 54–62. [Google Scholar] [CrossRef]
- Leme, M.M.V.; Rocha, M.H.; Lora, E.E.S.; Venturini, O.J.; Lopes, B.M.; Ferreira, C.H. Techno-Economic Analysis and Environmental Impact Assessment of Energy Recovery from Municipal Solid Waste (MSW) in Brazil. Resour. Conserv. Recycl. 2014, 87, 8–20. [Google Scholar] [CrossRef]
- Khan, M.M.U.H.; Jain, S.; Vaezi, M.; Kumar, A. Development of a Decision Model for the Techno-Economic Assessment of Municipal Solid Waste Utilization Pathways. Waste Manag. 2016, 48, 548–564. [Google Scholar] [CrossRef] [PubMed]
- CalRecycle Waste Characterization Studies Listing. Available online: https://www2.calrecycle.ca.gov/wastecharacterization/study (accessed on 11 August 2025).
- California Department of Resources Recycling and Recovery California Waste Characterization Study. Available online: https://ecology.wa.gov/accessibility.
- NYC Department of Sanitation. NYC Waste Characterization Study. Available online: https://www.nyc.gov/assets/dsny/downloads/resources/reports/waste-characterization-studies/2023/wcs-2023.pdf (accessed on 22 February 2025).
- Pathak, D.R.; Mainali, B.; Abuel-Naga, H.; Angove, M.; Kong, I. Quantification and Characterization of the Municipal Solid Waste for Sustainable Waste Management in Newly Formed Municipalities of Nepal. Waste Manag. Res. 2020, 38, 1007–1018. [Google Scholar] [CrossRef]
- US EPA Electronic Code of Federal Regulations, Title 40: Protection of Environment, Part 261—Identification and Listing of Hazardous Waste. Available online: https://www.ecfr.gov/current/title-40/chapter-I/subchapter-I/part-261 (accessed on 6 October 2024).
- OECD Stats. Municipal Waste: Generation and Treatment. Available online: https://stats.oecd.org/index.aspx?DataSetCode=MUNW# (accessed on 6 October 2024).
- OECD Data. Hazardous Waste: Generation and Movements. Available online: https://data-explorer.oecd.org (accessed on 6 October 2024).
- OECD Database Waste- Municipal Waste: Generation and Treatment. Available online: https://data-explorer.oecd.org/vis (accessed on 16 December 2024).
- Federal Statistical Office of Germany. Waste Management in Germany 2023 – Facts, Data, Figures. Available online: www.bmuv.de/en/publications.
- Singh, N.; Hui, D.; Singh, R.; Ahuja, I.P.S.; Feo, L.; Fraternali, F. Recycling of Plastic Solid Waste: A State of Art Review and Future Applications. Compos. B Eng. 2017, 115, 409–422. [Google Scholar] [CrossRef]
- Ncube, L.K.; Ude, A.U.; Ogunmuyiwa, E.N.; Zulkifli, R.; Beas, I.N. An Overview of Plasticwaste Generation and Management in Food Packaging Industries. Recycling 2021, 6, 1–25. [Google Scholar] [CrossRef]
- Awino, F.B.; Apitz, S.E. Solid Waste Management in the Context of the Waste Hierarchy and Circular Economy Frameworks: An International Critical Review. Integr. Environ. Assess. Manag. 2024, 20, 9–35. [Google Scholar] [CrossRef] [PubMed]
- Demetrious, A.; Verghese, K.; Stasinopoulos, P.; Crossin, E. Comparison of Alternative Methods for Managing the Residual of Material Recovery Facilities Using Life Cycle Assessment. Resour. Conserv. Recycl. 2018, 136, 33–45. [Google Scholar] [CrossRef]
- Mohsenizadeh, M.; Tural, M.K.; Kentel, E. Municipal Solid Waste Management with Cost Minimization and Emission Control Objectives: A Case Study of Ankara. Sustain. Cities Soc. 2020, 52, 101807. [Google Scholar] [CrossRef]
- Yadav, V.; Kalbar, P.P.; Karmakar, S.; Dikshit, A.K. A Two-Stage Multi-Attribute Decision-Making Model for Selecting Appropriate Locations of Waste Transfer Stations in Urban Centers. Waste Manag. 2020, 114, 80–88. [Google Scholar] [CrossRef]
- US EPA Chapter 4. Solid Waste Collection and Disposal Programs. 2003. [Google Scholar]
- Chen, H.; Yang, Y.; Jiang, W.; Song, M.; Wang, Y.; Xiang, T. Source Separation of Municipal Solid Waste: The Effects of Different Separation Methods and Citizens’ Inclination—Case Study of Changsha, China. J. Air Waste Manag. Assoc. 2017, 67, 182–195. [Google Scholar] [CrossRef]
- Yadav, V.; Karmakar, S. Sustainable Collection and Transportation of Municipal Solid Waste in Urban Centers. Sustain. Cities Soc. 2020, 53, 101937. [Google Scholar] [CrossRef]
- Longo, H.; De Aragão, M.P.; Uchoa, E. Solving Capacitated Arc Routing Problems Using a Transformation to the CVRP. Comput. Oper. Res. 2006, 33, 1823–1837. [Google Scholar] [CrossRef]
- Botti, L.; Battini, D.; Sgarbossa, F.; Mora, C. Door-to-Door Waste Collection: Analysis and Recommendations for Improving Ergonomics in an Italian Case Study. Waste Manag. 2020, 109, 149–160. [Google Scholar] [CrossRef]
- Singh, D.; Dikshit, A.K.; Kumar, S. Smart Technological Options in Collection and Transportation of Municipal Solid Waste in Urban Areas: A Mini Review. Waste Manag. Res. 2024, 42, 3–15. [Google Scholar] [CrossRef] [PubMed]
- Yadav, V.; Karmakar, S.; Dikshit, A.K.; Vanjari, S. A Feasibility Study for the Locations of Waste Transfer Stations in Urban Centers: A Case Study on the City of Nashik, India. J. Clean. Prod. 2016, 126, 191–205. [Google Scholar] [CrossRef]
- Hettiarachchi, H.; Meegoda, J.N.; Ryu, S. Organic Waste Buyback as a Viable Method to Enhance Sustainable Municipal Solid Waste Management in Developing Countries. Int. J. Environ. Res. Public Health 2018, Vol. 15, 2483. [Google Scholar] [CrossRef]
- Tsalis, T.; Amarantidou, S.; Calabró, P.; Nikolaou, I.; Komilis, D. Door-to-Door Recyclables Collection Programmes: Willingness to Participate and Influential Factors with a Case Study in the City of Xanthi (Greece). Waste Manag. Res. 2018, 36, 760–766. [Google Scholar] [CrossRef]
- Ogwueleka, T.C. Survey of Household Waste Composition and Quantities in Abuja, Nigeria. Resour. Conserv. Recycl. 2013, 77, 52–60. [Google Scholar] [CrossRef]
- Thanh, N.P.; Matsui, Y.; Fujiwara, T. Household Solid Waste Generation and Characteristic in a Mekong Delta City, Vietnam. J. Environ. Manag. 2010, 91, 2307–2321. [Google Scholar] [CrossRef] [PubMed]
- Mangialardi, G.; Trullo, G.; Valerio, F.; Corallo, A. Sustainability of a Pneumatic Refuse System in the Metropolitan Area: A Case Study in Southern Apulia Region. Procedia Soc. Behav. Sci. 2016, 223, 799–804. [Google Scholar] [CrossRef]
- Amal, L.; Son, L.H.; Chabchoub, H. SGA: Spatial GIS-Based Genetic Algorithm for Route Optimization of Municipal Solid Waste Collection. Environ. Sci. Pollut. 2018, 25, 27569–27582. [Google Scholar] [CrossRef]
- Olafasakin, O.; Ma, J.; Bradshaw, S.L.; Aguirre-Villegas, H.A.; Benson, C.; Huber, G.W.; Zavala, V.M.; Mba-Wright, M. Techno-Economic and Life Cycle Assessment of Standalone Single-Stream Material Recovery Facilities in the United States. Waste Manag. 2023, 166, 368–376. [Google Scholar] [CrossRef] [PubMed]
- Mukherjee, C.; Denney, J.; Mbonimpa, E.G.; Slagley, J.; Bhowmik, R. A Review on Municipal Solid Waste-to-Energy Trends in the USA. Renew. Sustain. Energy Rev. 2020, 119, 109512. [Google Scholar] [CrossRef]
- LCSWMA. Lancaster Waste-To-Energy Facility. Available online: https://www.lcswma.org/facility/lancaster-waste-to-energy-facility/ (accessed on 21 December 2024).
- Zhu, Y.; Zhang, Y.; Luo, D.; Chong, Z.; Li, E.; Kong, X. A Review of Municipal Solid Waste in China: Characteristics, Compositions, Influential Factors and Treatment Technologies. Environ. Dev. Sustain. 2021, 23, 6603–6622. [Google Scholar] [CrossRef]
- Shah, A. V.; Srivastava, V.K.; Mohanty, S.S.; Varjani, S. Municipal Solid Waste as a Sustainable Resource for Energy Production: State-of-the-Art Review. J. Environ. Chem. Eng. 2021, 9, 105717. [Google Scholar] [CrossRef]
- Wang, J.; Qiao, Z. A Comprehensive Review of Landfill Leachate Treatment Technologies. Front. Environ. Sci. 2024, 12, 1439128. [Google Scholar] [CrossRef]
- Zainol, N.; Mustafa, N.; Aziz, N.H.; Azman, A.N.; Shaiful, M.; Karim, A. Dielectric Materials Development Using Bio-Waste: A Review. J. Electr. Syst. Inf. Technol. 2023 2023, 10 10, 1–23. [Google Scholar] [CrossRef]
- Zamri, M.F.M.A.; Hasmady, S.; Akhiar, A.; Ideris, F.; Shamsuddin, A.H.; Mofijur, M.; Fattah, I.M.R.; Mahlia, T.M.I. A Comprehensive Review on Anaerobic Digestion of Organic Fraction of Municipal Solid Waste. Renew. Sustain. Energy Rev. 2021, 137, 110637. [Google Scholar] [CrossRef]
- Azam, M.; Jahromy, S.S.; Raza, W.; Raza, N.; Lee, S.S.; Kim, K.H.; Winter, F. Status, Characterization, and Potential Utilization of Municipal Solid Waste as Renewable Energy Source: Lahore Case Study in Pakistan. Environ. Int. 2020, 134, 105291. [Google Scholar] [CrossRef]
- Xing, J.; Luo, K.; Wang, H.; Gao, Z.; Fan, J. A Comprehensive Study on Estimating Higher Heating Value of Biomass from Proximate and Ultimate Analysis with Machine Learning Approaches. Energy 2019, 188, 116077. [Google Scholar] [CrossRef]
- Daskin, M.; Erdoğan, A.; Güleç, F.; Okolie, J.A. Generalizability of Empirical Correlations for Predicting Higher Heating Values of Biomass. Energy Sources Part A Recovery Util. Environ. Eff. 2024, 46, 5434–5450. [Google Scholar] [CrossRef]
- Jain, S.; Jain, S.; Wolf, I.T.; Lee, J.; Tong, Y.W. A Comprehensive Review on Operating Parameters and Different Pretreatment Methodologies for Anaerobic Digestion of Municipal Solid Waste. Renew. Sustain. Energy Rev. 2015, 52, 142–154. [Google Scholar] [CrossRef]
- US EPA Characterization of Municipal Solid Waste in the United States: 1998 Update. Available online: https://archive.epa.gov/epawaste/nonhaz/municipal/web/pdf/98charac.pdf (accessed on 7 October 2024).
- ASTM International Standard Test Method for Determination of the Composition of Unprocessed Municipal Solid Waste. Available online: https://standards.iteh.ai/catalog/standards/sist/f3234b28-9ef3-4e6e-92da-8e203aa32405/astm-d5231-922016 (accessed on 7 October 2024).
- United Nations Environment Program. Developing Integrated Solid Waste Management Plan, Waste Characterization and Quantification. Available online: https://www.unep.org/resources/report/developing-integrated-solid-waste-management-plan-training-manual-vol-2-assessment (accessed on 6 October 2024).
- Washington State Department of Ecology. Guidelines for Waste Characterization Studies in the State of Washington. Available online: https://apps.ecology.wa.gov/publications/documents/1507040.pdf (accessed on 7 October 2024).
- US EPA Defining Hazardous Waste: Listed, Characteristic and Mixed Radiological Wastes. Available online: https://www.epa.gov/hw/defining-hazardous-waste-listed-characteristic-and-mixed-radiological-wastes (accessed on 7 October 2024).
- US EPA Hazardous Waste Characteristics: A User-Friendly Reference Document. Available online: http://www.epa.gov/epawaste/wyl/stateprograms.htm.
- US EPA Resource Conservation and Recovery Act (RCRA) and Federal Facilities. Available online: https://www.epa.gov/enforcement/resource-conservation-and-recovery-act-rcra-and-federal-facilities (accessed on 27 October 2024).
- US EPA. Method: 1110a (Corrositivity toward Steel). Available online: https://www.epa.gov/sites/default/files/2015-12/documents/1110a.pdf (accessed on 8 September 2025).
- US EPA Hazardous Waste Characteristics: A User-Friendly Reference Document. October 2009; 2009.
- US EPA. Method 1311 (Toxicity Characteristic Leaching Procedure). Available online: https://www.epa.gov/sites/default/files/2015-12/documents/1311.pdf (accessed on 8 September 2025).
- US EPA Safe Water Drinking Act. Available online: https://www.epa.gov/sdwa (accessed on 27 October 2024).
- US EPA Sustainable Materials Management: Non-Hazardous Materials and Waste Management Hierarchy. Available online: https://www.epa.gov/smm/sustainable-materials-management-non-hazardous-materials-and-waste-management-hierarchy (accessed on 27 October 2024).
- Kaufman, S.M.; Themelis, N.J. Using a Direct Method to Characterize and Measure Flows of Municipal Solid Waste in the United States. J. Air Waste Manag. Assoc. 2009, 59, 1386–1390. [Google Scholar] [CrossRef]
- US EPA National Recycling Strategy. Available online: https://www.epa.gov/circulareconomy/national-recycling-strategy (accessed on 25 September 2025).
- EPA Fact Sheet Advancing Sustainable Material Management: 2016 and 2017. Available online: https://www.epa.gov/facts-and-figures-about-materials-waste-and-recycling/advancing-sustainable-materials-management (accessed on 7 October 2024).
- Baldé, C.P.; Angelo, E. D.’.; Luda, V.; Deubzer, O.; Kuehr, R. Global Transboundary E-Waste Flows Monitor; 2022. [Google Scholar]
- Baldé, C.P.; Kuehr, R.; Yamamoto, T.; McDonald, R.; Althaf, S.; Bel, G.; Deubzer, O.; Fernandez-Cubillo, E.; Forti, V.; Gray, V.; et al. Global Transboundary E-Waste Flows Monitor; The United Nations Institute for Training and Research (UNITAR), 2022; ISBN 9789261387815. [Google Scholar]
- Vats, M.C.; Singh, S.K.; Vats, M.C. E-Waste Characteristic and Its Disposal; 2014; Vol. 1. [Google Scholar]
- Kahhat, R.; Kim, J.; Xu, M.; Allenby, B.; Williams, E.; Zhang, P. Exploring E-Waste Management Systems in the United States. Resour. Conserv. Recycl. 2008, 52, 955–964. [Google Scholar] [CrossRef]
- Kahhat, R.; Williams, E. Materials Flow Analysis of E-Waste: Domestic Flows and Exports of Used Computers from the United States. Resour. Conserv. Recycl. 2012, 67, 67–74. [Google Scholar] [CrossRef]
- US EPA. National Strategy for Electronics Stewardship: Interagency Task Force on Electronics Stewardship.
- Cimpan, C.; Maul, A.; Jansen, M.; Pretz, T.; Wenzel, H. Central Sorting and Recovery of MSW Recyclable Materials: A Review of Technological State-of-the-Art, Cases, Practice and Implications for Materials Recycling. J. Environ. Manag. 2015, 156, 181–199. [Google Scholar] [CrossRef]
- Zhang, B.; Lai, K. hung; Wang, B.; Wang, Z. From Intention to Action: How Do Personal Attitudes, Facilities Accessibility, and Government Stimulus Matter for Household Waste Sorting? J. Environ. Manag. 2019, 233, 447–458. [Google Scholar] [CrossRef]
- Luo, H.; Zhao, L.; Zhang, Z. The Impacts of Social Interaction-Based Factors on Household Waste-Related Behaviors. Waste Manag. 2020, 118, 270–280. [Google Scholar] [CrossRef]
- Huang, J.; Pretz, T.; Bian, Z. Intelligent Solid Waste Processing Using Optical Sensor Based Sorting Technology. Proceedings-2010 3rd International Congress on Image and Signal Processing, CISP 2010 2010, 4, 1657–1661. [Google Scholar] [CrossRef]
- Gaustad, G.; Olivetti, E.; Kirchain, R. Improving Aluminum Recycling: A Survey of Sorting and Impurity Removal Technologies. Resour. Conserv. Recycl. 2012, 58, 79–87. [Google Scholar] [CrossRef]
- Bradshaw, S.L.; Aguirre-Villegas, H.A.; Boxman, S.E.; Benson, C.H. Material Recovery Facilities (MRFs) in the United States: Operations, Revenue, and the Impact of Scale. Waste Manag. 2025, 193, 317–327. [Google Scholar] [CrossRef]
- The Recycling Partnership The 2020 State of Curbside Recycling Report. Available online: https://recyclingpartnership.org/stateofcurbside/ (accessed on 12 January 2025).
- Smith, Y.R.; Nagel, J.R.; Rajamani, R.K. Eddy Current Separation for Recovery of Non-Ferrous Metallic Particles: A Comprehensive Review. Miner. Eng. 2019, 133, 149–159. [Google Scholar] [CrossRef]
- Tao, Z.; Youcai, Z.; Atta Nyankson, E. Mechanical Separation of Municipal Solid Waste with Horizontal Air Separator. Resour. Recovery Technol. Munic. Rural Solid Waste 2023, 131–157. [Google Scholar] [CrossRef]
- Pressley, P.N.; Levis, J.W.; Damgaard, A.; Barlaz, M.A.; DeCarolis, J.F. Analysis of Material Recovery Facilities for Use in Life-Cycle Assessment. Waste Manag. 2015, 35, 307–317. [Google Scholar] [CrossRef]
- Brooks, L.; Gaustad, G.; Gesing, A.; Mortvedt, T.; Freire, F. Ferrous and Non-Ferrous Recycling: Challenges and Potential Technology Solutions. Waste Manag. 2019, 85, 519–528. [Google Scholar] [CrossRef]
- Svoboda, J.; Fujita, T. Recent Developments in Magnetic Methods of Material Separation. Miner. Eng. 2003, 16, 785–792. [Google Scholar] [CrossRef]
- Luciani, V.; Bonifazi, G.; Rem, P.; Serranti, S. Upgrading of PVC Rich Wastes by Magnetic Density Separation and Hyperspectral Imaging Quality Control. Waste Manag. 2015, 45, 118–125. [Google Scholar] [CrossRef]
- Feil, A.; Pretz, T.; Julius, J.; Go, N.; Bosling, M.; Johnen, K. Metal Waste. In Waste: A Handbook for Management; Elsevier, 2019; pp. 211–223. ISBN 9780128150603. [Google Scholar]
- Bashir, M.J.K.; Chong, S.-T.; Chin, Y.-T.; Yusoff, S.; Aziz, H.A. Single Waste Stream Processing and Material Recovery Facility (MRF); Springer, 2022; pp. 71–164. ISBN 978-3-030-89336-1. [Google Scholar]
- Smith, Y.R.; Nagel, J.R.; Rajamani, R.K. Eddy Current Separation for Recovery of Non-Ferrous Metallic Particles: A Comprehensive Review. Miner. Eng. 2019, 133, 149–159. [Google Scholar] [CrossRef]
- Bauer, M.; Lehner, M.; Schwabl, D.; Flachberger, H.; Kranzinger, L.; Pomberger, R.; Hofer, W. Sink–Float Density Separation of Post-Consumer Plastics for Feedstock Recycling. J. Mater. Cycles Waste Manag. 2018, 20, 1781–1791. [Google Scholar] [CrossRef]
- Meneses Quelal, W.O.; Velázquez-Martí, B.; Ferrer Gisbert, A. Separation of Virgin Plastic Polymers and Post-Consumer Mixed Plastic Waste by Sinking-Flotation Technique. Environ. Sci. Pollut. Res. 2022, 29, 1364–1374. [Google Scholar] [CrossRef]
- Pongstabodee, S.; Kunachitpimol, N.; Damronglerd, S. Combination of Three-Stage Sink–Float Method and Selective Flotation Technique for Separation of Mixed Post-Consumer Plastic Waste. Waste Manag. 2008, 28, 475–483. [Google Scholar] [CrossRef]
- Dimas, T.; Peeters, J.; Eggers, A.; Vanierschot, M. Development and Calidation of a Computational Fluid Dynamics Model for the Optimization of a Sink-Float Separator for Plastics Recycling. Procedia CIRP 2022, 105, 116–121. [Google Scholar] [CrossRef]
- Roh, S.B.; Park, S.B.; Oh, S.K.; Park, E.K.; Choi, W.Z. Development of Intelligent Sorting System Realized with the Aid of Laser-Induced Breakdown Spectroscopy and Hybrid Preprocessing Algorithm-Based Radial Basis Function Neural Networks for Recycling Black Plastic Wastes. J. Mater. Cycles Waste Manag. 2018, 20, 1934–1949. [Google Scholar] [CrossRef]
- Huber, N.; Eschlböck-Fuchs, S.; Scherndl, H.; Freimund, A.; Heitz, J.; Pedarnig, J.D. In-Line Measurements of Chlorine Containing Polymers in an Industrial Waste Sorting Plant by Laser-Induced Breakdown Spectroscopy. Appl. Surf. Sci. 2014, 302, 280–285. [Google Scholar] [CrossRef]
- Holub, D.; Palásti, D.J.; Fintor, K.; Pořízka, P.; Galbács, G.; Kaiser, J. Classification of Diverse Plastic Samples by LIBS and Raman Data Fusion. Polym. Test. 2024, 134, 108414. [Google Scholar] [CrossRef]
- Yan, X.; Peng, X.; Qin, Y.; Xu, Z.; Xu, B.; Li, C.; Zhao, N.; Li, J.; Ma, Q.; Zhang, Q. Classification of Plastics Using Laser-Induced Breakdown Spectroscopy Combined with Principal Component Analysis and K Nearest Neighbor Algorithm. Results Opt. 2021, 4, 100093. [Google Scholar] [CrossRef]
- Rifai, K.; Doucet, F.; Özcan, L.; Vidal, F. LIBS Core Imaging at KHz Speed: Paving the Way for Real-Time Geochemical Applications. Spectrochim. Acta Part B At. Spectrosc. 2018, 150, 43–48. [Google Scholar] [CrossRef]
- Gajarska, Z.; Brunnbauer, L.; Lohninger, H.; Limbeck, A. Identification of 20 Polymer Types by Means of Laser-Induced Breakdown Spectroscopy (LIBS) and Chemometrics. Anal. Bioanal. Chem. 2021, 413, 6581. [Google Scholar] [CrossRef]
- Howard, I.A.; Busko, D.; Gao, G.; Wendler, P.; Madirov, E.; Turshatov, A.; Moesslein, J.; Richards, B.S. Sorting Plastics Waste for a Circular Economy: Perspectives for Lanthanide Luminescent Markers. Resour. Conserv. Recycl. 2024, 205, 107557. [Google Scholar] [CrossRef]
- Neubert, K.; Wotruba, H. Investigations on the Detectability of Rare-Earth Minerals Using Dual-Energy x-Ray Transmission Sorting. J. Sustain. Metall. 2017, 3, 3–12. [Google Scholar] [CrossRef]
- Zhao, Y.; Li, J. Sensor-Based Technologies in Effective Solid Waste Sorting: Successful Applications, Sensor Combination, and Future Directions. Environ. Sci. Technol. 2022, 56, 17531–17544. [Google Scholar] [CrossRef] [PubMed]
- Scientific, Evident. Scrap Recycling with XRF – Sort More, Sort Faster, and Increase Your Profits. Available online: https://www.olympus-ims.com/en/applications/scrap-recycling-xrf-sort/ (accessed on 5 January 2025).
- Bezati, F.; Froelich, D.; Massardier, V.; Maris, E. Addition of X-Ray Fluorescent Tracers into Polymers, New Technology for Automatic Sorting of Plastics: Proposal for Selecting Some Relevant Tracers. Resour. Conserv. Recycl. 2011, 55, 1214–1221. [Google Scholar] [CrossRef]
- Larder, R.R.; Hatton, F.L. Enabling the Polymer Circular Economy: Innovations in Photoluminescent Labeling of Plastic Waste for Enhanced Sorting. ACS Polym. Au 2022, 2023, 182–201. [Google Scholar] [CrossRef] [PubMed]
- Tsuchimoto, I.; Kajikawa, Y. Recycling of Plastic Waste: A Systematic Review Using Bibliometric Analysis. Sustainability 2022, Vol. 14 14, 16340. [Google Scholar] [CrossRef]
- Nanda, S.; Berruti, F. Municipal Solid Waste Management and Landfilling Technologies: A Review. Environ. Chem. Lett. 2021, 19, 1433–1456. [Google Scholar] [CrossRef]
- Lin, Y.; Ding, L.; Burli, P.H.; Brown, R.M.; Herrera Diaz, M.A. MSW Characterization and Preprocessing for Biofuels and Bioproducts. Adv. Bioenergy 2023, 8, 197–238. [Google Scholar] [CrossRef]
- D’Adamo, I.; Gastaldi, M.; Rosa, P. Recycling of End-of-Life Vehicles: Assessing Trends and Performances in Europe. Technol. Forecast. Soc. Change 2020, 152, 119887. [Google Scholar] [CrossRef]
- Khan, A.H.; López-Maldonado, E.A.; Alam, S.S.; Khan, N.A.; López, J.R.L.; Herrera, P.F.M.; Abutaleb, A.; Ahmed, S.; Singh, L. Municipal Solid Waste Generation and the Current State of Waste-to-Energy Potential: State of Art Review. Energy Convers. Manag. 2022, 267, 115905. [Google Scholar] [CrossRef]
- Fitzgerald, G.C. Pre-Processing and Treatment of Municipal Solid Waste (MSW) Prior to Incineration. Waste To Energy Convers. Technol. 2013, 55–71. [Google Scholar] [CrossRef]
- Raj, T.; Sompura, S.; Chandrasekhar, K.; Singh, S.K.; Pandey, S.; Singh, L.K.; Rajput, M.S.; Kumar, D.; Bhatia, S.K.; Patel, A.K.; et al. Technology Development and Challenges for the Transformation of Municipal Solid Waste into Sustainable Energy Production. Biomass Bioenergy 2023, 178, 106965. [Google Scholar] [CrossRef]
- Hoang, Q.N.; Vanierschot, M.; Blondeau, J.; Croymans, T.; Pittoors, R.; Van Caneghem, J. Review of Numerical Studies on Thermal Treatment of Municipal Solid Waste in Packed Bed Combustion. Fuel Commun. 2021, 7, 100013. [Google Scholar] [CrossRef]
- Lindfors, C.; Elliott, D.C.; Prins, W.; Oasmaa, A.; Lehtonen, J. Co-Processing of Biocrudes in Oil Refineries. Energy Fuels 2023, 37, 799–804. [Google Scholar] [CrossRef]
- Małgorzata, H.; Andrzej, B. Predicting Fuel Properties of Torrefied Refuse-Derived Fuel Using Experimental and Regression Modeling. Fuel 2026, 405, 136481. [Google Scholar] [CrossRef]
- Voicu, G.; Lazea, M.; Constantin, G.A.; Stefan, E.M.; Munteanu, M.G. Finite Element Analysis of the Compaction Plate from a Garbage Truck. E3S Web Conf. 2020, 180, 04006. [Google Scholar] [CrossRef]
- Pulat, H.F.; Yukselen-Aksoy, Y. Compaction Behavior of Synthetic and Natural MSW Samples in Different Compositions. Waste Manag. Res. 2013, 31, 1255–1261. [Google Scholar] [CrossRef] [PubMed]
- Tihin, G.L.; Mo, K.H.; Onn, C.C.; Ong, H.C.; Taufiq-Yap, Y.H.; Lee, H.V. Overview of Municipal Solid Wastes-Derived Refuse-Derived Fuels for Cement Co-Processing. Alex. Eng. J. 2023, 84, 153–174. [Google Scholar] [CrossRef]
- Yeh, A.I.; Huang, Y.C.; Chen, S.H. Effect of Particle Size on the Rate of Enzymatic Hydrolysis of Cellulose. Carbohydr. Polym. 2010, 79, 192–199. [Google Scholar] [CrossRef]
- Luo, S.; Xiao, B.; Hu, Z.; Liu, S. Effect of Particle Size on Pyrolysis of Single-Component Municipal Solid Waste in Fixed Bed Reactor. Int. J. Hydrog. Energy 2010, 35, 93–97. [Google Scholar] [CrossRef]
- Bereziuk, O. V.; Lemeshev, M.S.; Bogachuk, V. V.; Akselrod, R.B.; Vinnichuk, A.P.; Smolarz, A.; Arshidinova, M.; Kulakova, O. Increasing the Efficiency of Municipal Solid Waste Pre-Processing Technology to Reduce Its Water Permeability. Biomass as Raw Material for the Production of Biofuels and Chemicals 2021, 33–41. [Google Scholar] [CrossRef]
- Pavankumar, E.; Baskaran, S.; Prithivirajan, R.; Vinoth Kumar, S.; Karpagaraj, A. Development of Multi-Functioning Organic Waste Shredding Machine for Natural Compost. Lect. Notes Mech. Eng. 2021, 23, 1043–1055. [Google Scholar] [CrossRef]
- Saravacos, G.; Kostaropoulos, A.E. Mechanical Processing Equipment. Food Eng. Ser. 2016, 149–232. [Google Scholar] [CrossRef]
- Almulla, L.; Thomas, B.M.; Jallow, M.F.A.; Al-Roumi, A.; Devi, Y.; Jacob, J. Rotary Drum Composting of Organic School Wastes and Compost Valorization. Sustainability 2024, Vol. 16 16, 2428. [Google Scholar] [CrossRef]
- Zhu, B.; Gikas, P.; Zhang, R.; Lord, J.; Jenkins, B.; Li, X. Characteristics and Biogas Production Potential of Municipal Solid Wastes Pretreated with a Rotary Drum Reactor. Bioresour. Technol. 2009, 100, 1122–1129. [Google Scholar] [CrossRef]
- Mazzei, H.G.; Specchia, S. Latest Insights on Technologies for the Treatment of Solid Medical Waste: A Review. J. Environ. Chem. Eng. 2023, 11, 109309. [Google Scholar] [CrossRef]
- Khan, M.A.; Hameed, B.H.; Siddiqui, M.R.; Alothman, Z.A.; Alsohaimi, I.H. Hydrothermal Conversion of Food Waste to Carbonaceous Solid Fuel—A Review of Recent Developments. Foods 2022, 11, 4036. [Google Scholar] [CrossRef]
- Roy, R.; Hewetson, B.; Schooff, B.; Bandi, S.; LaTour, P.; Iverson, B.D.; Fry, A. Steam Explosion Treated Biomass as a Renewable Fuel Source: A Review from Collection to Combustion. Fuel 2024, 378, 132883. [Google Scholar] [CrossRef]
- Gao, W.; Zhang, Y.; Mo, A.; Jiang, J.; Liang, Y.; Cao, X.; He, D. Removal of Microplastics in Water: Technology Progress and Green Strategies. Green. Anal. Chem. 2022, 3, 100042. [Google Scholar] [CrossRef]
- Smith, Z.; Isaac, B.; Tumuluru, J.S.; Yancey, N. Grinding and Pelleting Characteristics of Municipal Solid Waste Fractions. Energies 2024, Vol. 17 17, 29. [Google Scholar] [CrossRef]
- Shapouri, M.; Hassanzadeh Moghimi, O. RDF Production from Municipal Wastes (Case Study: Babol City). Environ. Energy Econ. Res. 2018, 2, 137–144. [Google Scholar] [CrossRef]
- Brown, R.M.; Hoover, A.N.; Klinger, J.L.; Wahlen, B.D.; Hartley, D.; Lee, H.; Thompson, V.S. Decontamination of Mixed Paper and Plastic Municipal Solid Waste Increases Low and High Temperature Conversion Yields. Front. Energy Res. 2022, 10, 834832. [Google Scholar] [CrossRef]
- Genuino, H.C.; Ruiz, M.P.; Heeres, H.J.; Kersten, S.R.A. Pyrolysis of Mixed Plastic Waste (DKR-350): Effect of Washing Pre-Treatment and Fate of Chlorine. Fuel Process. Technol. 2022, 233, 107304. [Google Scholar] [CrossRef]
- Zhou, H.; Meng, A.; Long, Y.; Li, Q.; Zhang, Y. An Overview of Characteristics of Municipal Solid Waste Fuel in China: Physical, Chemical Composition and Heating Value. Renew. Sustain. Energy Rev. 2014, 36, 107–122. [Google Scholar] [CrossRef]
- Mendes, P.; Santos, A.C.; Nunes, L.M.; Teixeira, M.R. Evaluating Municipal Solid Waste Management Performance in Regions with Strong Seasonal Variability. Ecol. Indic. 2013, 30, 170–177. [Google Scholar] [CrossRef]
- Yi, S.; Yoo, K.Y.; Hanaki, K. Characteristics of MSW and Heat Energy Recovery between Residential and Commercial Areas in Seoul. Waste Manag. 2011, 31, 595–602. [Google Scholar] [CrossRef]
- Soni, A.; Gupta, S.K.; Rajamohan, N.; Yusuf, M. Waste-to-Energy Technologies: A Sustainable Pathway for Resource Recovery and Materials Management. Mater. Adv. 2025, 6, 4598–4622. [Google Scholar] [CrossRef]
- Prajapati, P.; Varjani, S.; Singhania, R.R.; Patel, A.K.; Awasthi, M.K.; Sindhu, R.; Zhang, Z.; Binod, P.; Awasthi, S.K.; Chaturvedi, P. Critical Review on Technological Advancements for Effective Waste Management of Municipal Solid Waste — Updates and Way Forward. Environ. Technol. Innov. 2021, 23, 101749. [Google Scholar] [CrossRef]
- Satav, A.G.; Kubade, S.; Amrutkar, C.; Arya, G.; Pawar, A. A State-of-the-Art Review on Robotics in Waste Sorting: Scope and Challenges. Int. J. Interact. Des. Manuf. (IJIDeM) 2023, 17, 2789–2806. [Google Scholar] [CrossRef]
- Ochieng, R.; Gebremedhin, A.; Sarker, S. Integration of Waste to Bioenergy Conversion Systems: A Critical Review. Energies 2022, Vol. 15 15, 2697. [Google Scholar] [CrossRef]
- Olawade, D.B.; Fapohunda, O.; Wada, O.Z.; Usman, S.O.; Ige, A.O.; Ajisafe, O.; Oladapo, B.I. Smart Waste Management: A Paradigm Shift Enabled by Artificial Intelligence. Waste Manag. Bull. 2024, 2, 244–263. [Google Scholar] [CrossRef]
- Singh, R.P.; Tyagi, V. V.; Allen, T.; Ibrahim, M.H.; Kothari, R. An Overview for Exploring the Possibilities of Energy Generation from Municipal Solid Waste (MSW) in Indian Scenario. Renew. Sustain. Energy Rev. 2011, 15, 4797–4808. [Google Scholar] [CrossRef]
- Salem, K.S.; Clayson, K.; Salas, M.; Haque, N.; Rao, R.; Agate, S.; Singh, A.; Levis, J.W.; Mittal, A.; Yarbrough, J.M.; et al. A Critical Review of Existing and Emerging Technologies and Systems to Optimize Solid Waste Management for Feedstocks and Energy Conversion. Matter 2023, 6, 3348–3377. [Google Scholar] [CrossRef]
- Chintagunta, A.D.; Jacob, S.; Banerjee, R. Integrated Bioethanol and Biomanure Production from Potato Waste. Waste Manag. 2016, 49, 320–325. [Google Scholar] [CrossRef]
- Nishimura, H.; Tan, L.; Sun, Z.Y.; Tang, Y.Q.; Kida, K.; Morimura, S. Efficient Production of Ethanol from Waste Paper and the Biochemical Methane Potential of Stillage Eluted from Ethanol Fermentation. Waste Manag. 2016, 48, 644–651. [Google Scholar] [CrossRef]
- Blank, L.M.; Narancic, T.; Mampel, J.; Tiso, T.; O’Connor, K. Biotechnological Upcycling of Plastic Waste and Other Non-Conventional Feedstocks in a Circular Economy. Curr. Opin. Biotechnol. 2020, 62, 212–219. [Google Scholar] [CrossRef]
- Bayard, R.; Benbelkacem, H.; Gourdon, R.; Buffière, P. Characterization of Selected Municipal Solid Waste Components to Estimate Their Biodegradability. J. Environ. Manag. 2018, 216, 4–12. [Google Scholar] [CrossRef]
- Werkneh, A.A. Biogas Impurities: Environmental and Health Implications, Removal Technologies and Future Perspectives. Heliyon 2022, 8. [Google Scholar] [CrossRef]
- Nandhini, R.; Berslin, D.; Sivaprakash, B.; Rajamohan, N.; Vo, D.V.N. Thermochemical Conversion of Municipal Solid Waste into Energy and Hydrogen: A Review. Environ. Chem. Lett. 2022, 20:3 2022(20), 1645–1669. [Google Scholar] [CrossRef] [PubMed]
- Wang, B.; Gupta, R.; Bei, L.; Wan, Q.; Sun, L. A Review on Gasification of Municipal Solid Waste (MSW): Syngas Production, Tar Formation, Mineral Transformation and Industrial Challenges. Int. J. Hydrog. Energy 2023, 48, 26676–26706. [Google Scholar] [CrossRef]
- Yang, Y.; Liew, R.K.; Tamothran, A.M.; Foong, S.Y.; Yek, P.N.Y.; Chia, P.W.; Van Tran, T.; Peng, W.; Lam, S.S. Gasification of Refuse-Derived Fuel from Municipal Solid Waste for Energy Production: A Review. Environ. Chem. Lett. 2021, 19, 2127. [Google Scholar] [CrossRef]
- Varjani, S.; Shahbeig, H.; Popat, K.; Patel, Z.; Vyas, S.; Shah, A. V.; Barceló, D.; Hao Ngo, H.; Sonne, C.; Shiung Lam, S.; et al. Sustainable Management of Municipal Solid Waste through Waste-to-Energy Technologies. Bioresour. Technol. 2022, 355, 127247. [Google Scholar] [CrossRef]
- Yaashikaa, P.R.; Kumar, P.S.; Saravanan, A.; Varjani, S.; Ramamurthy, R. Bioconversion of Municipal Solid Waste into Bio-Based Products: A Review on Valorisation and Sustainable Approach for Circular Bioeconomy. Sci. Total Environ. 2020, 748, 141312. [Google Scholar] [CrossRef]
- Elektorowicz, M.; Habibi, S.; Chifrina, R. Effect of Electrical Potential on the Electro-Demulsification of Oily Sludge. J. Colloid Interface Sci. 2006, 295, 535–541. [Google Scholar] [CrossRef]
- Rao, R.; Basak, N. Development of Novel Strategies for Higher Fermentative Biohydrogen Recovery along with Novel Metabolites from Organic Wastes: The Present State of the Art. Biotechnol. Appl. Biochem. 2021, 68, 421–444. [Google Scholar] [CrossRef]
- Rao, R.; Basak, N. Sequential Dark-Photo Batch Fermentation and Kinetic Modelling for Biohydrogen Production Using Cheese Whey as a Feedstock. Appl. Biochem. Biotechnol. 2022, 194, 3930–3960. [Google Scholar] [CrossRef]
- Rao, R.; Basak, N. Process Optimization and Mathematical Modelling of Photo-Fermentative Hydrogen Production from Dark Fermentative Cheese Whey Effluent by Rhodobacter Sphaeroides O.U.001 in 2-L Cylindrical Bioreactor. Biomass Convers. Biorefin. 2023, 13, 3929–3952. [Google Scholar] [CrossRef]
- Opatokun, S.A.; Kan, T.; Al Shoaibi, A.; Srinivasakannan, C.; Strezov, V. Characterization of Food Waste and Its Digestate as Feedstock for Thermochemical Processing. Energy Fuels 2016, 30, 1589–1597. [Google Scholar] [CrossRef]
- Eboibi, B.E.; Lewis, D.M.; Ashman, P.J.; Chinnasamy, S. Integrating Anaerobic Digestion and Hydrothermal Liquefaction for Renewable Energy Production: An Experimental Investigation. Environ. Prog. Sustain. Energy 2015, 34, 1662–1673. [Google Scholar] [CrossRef]
- Wang, D.; Tang, Y.-T.; He, J.; Yang, F.; Robinson, D. Generalized Models to Predict the Lower Heating Value (LHV) of Municipal Solid Waste (MSW). Energy 2021, 216, 119279. [Google Scholar] [CrossRef]
- Zhou, H.; Meng, A.; Long, Y.; Li, Q.; Zhang, Y. Classification and Comparison of Municipal Solid Waste Based on Thermochemical Characteristics. J. Air Waste Manag. Assoc. 2014, 64, 597–616. [Google Scholar] [CrossRef]
- Sørum, L.; Grønli, M.G.; Hustad, J.E. Pyrolysis Characteristics and Kinetics of Municipal Solid Wastes. Fuel 2001, 80, 1217–1227. [Google Scholar] [CrossRef]
- US DOE EERE Waste-to-Energy from Municipal Solid Wastes. Available online: https://www.energy.gov/eere/bioenergy/articles/waste-energy-municipal-solid-wastes-report (accessed on 27 October 2024).
- Ding, L.; Cheng, M.H.; Lin, Y.; Lin, K.T.; Sale, K.L.; Sun, N.; Donohoe, B.S.; Ray, A.E.; Li, C. Understanding the Impacts of Inorganic Species in Woody Biomass for Preprocessing and Pyrolysis–A Review. Energy 2025, 322, 135697. [Google Scholar] [CrossRef]
- Gomes, H.I.; Mayes, W.M.; Rogerson, M.; Stewart, D.I.; Burked, I.T. Alkaline Residues and the Environment: A Review of Impacts, Management Practices and Opportunities. J. Clean. Prod. 2016, 112, 3571–3582. [Google Scholar] [CrossRef]
- Zhao, D.; Wang, Y.; Wang, G.; Han, W.; Liu, H.; Wang, H.; Liu, H.; Guo, S. Exploring the Mechanism of Alkali Metal K-Catalyzed Biomass Char Gasification Using in-Situ DRIFTS and Molecular Simulation. Chem. Eng. J. 2024, 500, 157367. [Google Scholar] [CrossRef]
- Wongmat, Y.; Wagner, D.R.; Wongmat, Y.; Wagner, D.R. Effect of Potassium Salts on Biochar Pyrolysis. Energies 2022, Vol. 15 15. [Google Scholar] [CrossRef]
- Pienihäkkinen, E.; Lindfors, C.; Ohra-Aho, T.; Oasmaa, A. Improving Fast Pyrolysis Bio-Oil Yield and Quality by Alkali Removal from Feedstock. Energy Fuels 2022, 36, 3654–3664. [Google Scholar] [CrossRef]
- Zhang, S.; Ma, J.; Jiang, F. Monitoring Street-Level Improper Dumpsites via a Multi-Modal and LLM-Based Framework. Resour. Conserv. Recycl. 2025, 218, 108227. [Google Scholar] [CrossRef]
- Pham, P.T.H.; Pham, C.Q.; Dam, T.T.; Nguyen, Q.A.; Nguyen, T.M. A Comprehensive Review of Catalyst Deactivation and Regeneration in Heavy Oil Hydroprocessing. Fuel Process. Technol. 2025, 267, 108170. [Google Scholar] [CrossRef]
- Shahabuddin, M.; Alam, M.T.; Krishna, B.B.; Bhaskar, T.; Perkins, G. A Review on the Production of Renewable Aviation Fuels from the Gasification of Biomass and Residual Wastes. Bioresour. Technol. 2020, 312, 123596. [Google Scholar] [CrossRef]
- Zhang, L.; Oladejo, J.; Dawodu, A.; Yang, L.; Xiao, Y. Sustainable Jet Fuel from Municipal Solid Waste–Investigation of Carbon Negativity and Affordability Claims. Resour. Conserv. Recycl. 2024, 210, 107819. [Google Scholar] [CrossRef]
- Rockey, J.; Venkataraman, V. Technology Developers Report CTL Jet Fuel Project. Available online: https://www.nationalcarboncapturecenter.com/wp-content/uploads/2021/01/Southern-Research-Coal-to-Liquid-Jet-Fuel-Project-2017.pdf (accessed on 5 October 2024).
- Fulcrum BioEnergy, Inc. Available online: https://www.prnewswire.com/news-releases/fulcrum-targets-northwest-indiana-for-the-location-of-its-next-waste-to-fuel-plant-300765266.html (accessed on 5 October 2024).
- Velocys, British Airways & Shell. Available online: https://velocys.com/2019/08/20/plans-submitted-for-the-first-waste-to-jet-fuel-plant-in-the-uk-and-europe/ (accessed on 5 October 2024).
- Green Car Congress Altalto Waste-to-Jet Fuel Plant Advances in UK; BA, Shell, Velocys. Available online: https://www.greencarcongress.com/2019/08/20190822-altalto.html (accessed on 5 October 2024).
- Montoya Sánchez, N.; Link, F.; Chauhan, G.; Halmenschlager, C.; El-Sayed, H.E.M.; Sehdev, R.; Lehoux, R.; de Klerk, A. Conversion of Waste to Sustainable Aviation Fuel via Fischer–Tropsch Synthesis: Front-End Design Decisions. Energy Sci. Eng. 2022, 10, 1763–1789. [Google Scholar] [CrossRef]
- Agwe, T.M.; Twesigye-omwe, M.N.; Ukundimana, Z.; Rotimi, D.; Gupta, S. Effects of Seasonal Variations of the Physio-Chemical Properties of Municipal Solid Waste on Effective Materials and Resources Recovery. Sci. Rep. 2025 15:1 2025, 15, 4548. [Google Scholar] [CrossRef] [PubMed]
- Vrabie, C.; Vrabie, C. Converting Municipal Waste to Energy through the Biomass Chain, a Key Technology for Environmental Issues in (Smart) Cities. Sustainability 2021, Vol. 13 13. [Google Scholar] [CrossRef]
- Chang, C.Y.; Wang, C.F.; Mui, D.T.; Cheng, M.T.; Chiang, H.L. Characteristics of Elements in Waste Ashes from a Solid Waste Incinerator in Taiwan. J. Hazard. Mater. 2009, 165, 766–773. [Google Scholar] [CrossRef]
- Puri, L.; Hu, Y.; Naterer, G. Critical Review of the Role of Ash Content and Composition in Biomass Pyrolysis. Front. Fuels 2024, 2, 1378361. [Google Scholar] [CrossRef]
- Lehmusto, J.; Tesfaye, F.; Karlström, O.; Hupa, L. Ashes from Challenging Fuels in the Circular Economy. Waste Manag. 2024, 177, 211–231. [Google Scholar] [CrossRef]
- Ng, K.S.; Farooq, D.; Yang, A. Global Biorenewable Development Strategies for Sustainable Aviation Fuel Production. Renew. Sustain. Energy Rev. 2021, 150, 111502. [Google Scholar] [CrossRef]
- Nguyen, N.; Tyner, W.E. Assessment of the Feasibility of the Production of Alternative Jet Fuel and Diesel Using Catalytic Hydrothermolysis Technology: A Stochastic Techno-Economic Analysis. In Biofuels, Bioproducts and Biorefining; WGROUP:STRING:PUBLICATION, 2022; Volume 16, pp. 91–104, Available online: REQUESTEDJOURNAL:JOURNAL:19321031. [Google Scholar] [CrossRef]
- Scown, C.D.; Baral, N.R.; Tanjore, D.; Rapp, V. Matching Diverse Feedstocks to Conversion Processes for the Future Bioeconomy. Curr. Opin. Biotechnol. 2023, 84, 103017. [Google Scholar] [CrossRef]
- Thiyagarajan, R.; Rao, R.; Salas, M.; Haque, N.; Sarker, A.; Kumar, R.; Tripathy, A.; Srinivasan, V.; Wang, Y.; Yarbrough, J.; et al. Techno-Economics of Hydrocarbon Fuel Production and Recyclables Recovery from Landfill-Destined Municipal Solid Waste: AI-Enhanced Materials Recovery Facility Design. J. Clean. Prod. 2025, 525, 146643. [Google Scholar] [CrossRef]
- Zhang, Q.; Dor, L.; Yang, W.; Blasiak, W. Eulerian Model for Municipal Solid Waste Gasification in a Fixed-Bed Plasma Gasification Melting Reactor. Energy Fuels 2011, 25, 4129–4137. [Google Scholar] [CrossRef]
- Veksha, A.; Giannis, A.; Yuan, G.; Tng, J.; Chan, W.P.; Chang, V.W.C.; Lisak, G.; Lim, T.T. Distribution and Modeling of Tar Compounds Produced during Downdraft Gasification of Municipal Solid Waste. Renew. Energy 2019, 136, 1294–1303. [Google Scholar] [CrossRef]
- Hu, M.; Guo, D.; Ma, C.; Hu, Z.; Zhang, B.; Xiao, B.; Luo, S.; Wang, J. Hydrogen-Rich Gas Production by the Gasification of Wet MSW (Municipal Solid Waste) Coupled with Carbon Dioxide Capture. Energy 2015, 90, 857–863. [Google Scholar] [CrossRef]
- Jayanarasimhan, A.; Pathak, R.M.; Shivapuji, A.M.; Rao, L. Tar Formation in Gasification Systems: A Holistic Review of Remediation Approaches and Removal Methods. ACS Omega 2024, 9, 2060–2079. [Google Scholar] [CrossRef]
- Ungureanu, N.; Vlăduț, N.-V.; Biriș, S.-Ștefan; Ionescu, M.; Gheorghiță, N.-E. Municipal Solid Waste Gasification: Technologies, Process Parameters, and Sustainable Valorization of By-Products in a Circular Economy. Sustainability 2025, 17, 6704. [Google Scholar] [CrossRef]
- Nagar, V.; Kaushal, R. A Review of Recent Advancement in Plasma Gasification: A Promising Solution for Waste Management and Energy Production. Int. J. Hydrog. Energy 2024, 77, 405–419. [Google Scholar] [CrossRef]
- Saputro, B.A.; Dafiqurrohman, H.; Supriatna, N.K.; Yan, M.; Aji Nugroho, R.A.; Wang, W.-C.; Surjosatyo, A. Steam Gasification of Municipal Solid Waste (MSW) Using Fe2O3/Al2O3, and Zeolite Catalysts in a Fixed-Bed Gasifier for Hydrogen-Rich Syngas Production. Int. J. Hydrog. Energy 2025, 158, 150446. [Google Scholar] [CrossRef]
- Kun, U.H.; Ksepko, E. Advancing Municipal Solid Waste Management Through Gasification Technology. Processes 2025, 13, 2000. [Google Scholar] [CrossRef]
- Koritár, M.; Haydary, J. Reduction of Tar, Sulfur, Chlorine and CO2 in Syngas Produced by Gasification of Refuse-Derived Fuel Pellets. Sci. Rep. 2025, 15, 18446. [Google Scholar] [CrossRef] [PubMed]
- Rao, R.; Pena, L.; Haque, N.; Salas, M.; Bera, S.; Mittal, A.; Yarbrough, J.; Pal, L. Upconversion of Non-Recycled MSW Paper Fractions into Biochar via Slow Pyrolysis and Life Cycle Analysis: Pathways to Net Negative GHG Emission. J. Environ. Manag. 2026, 397, 128341. [Google Scholar] [CrossRef]
- Salem, K.S.; Kasera, N.K.; Rahman, M.A.; Jameel, H.; Habibi, Y.; Eichhorn, S.J.; French, A.D.; Pal, L.; Lucia, L.A. Comparison and Assessment of Methods for Cellulose Crystallinity Determination. Chem. Soc. Rev. 2023, 52, 6417–6446. [Google Scholar] [CrossRef]
- US EPA Landfill Methane Outreach Program Frequent Questions about Landfill Gas. Available online: https://www.epa.gov/lmop/frequent-questions-about-landfill-gas (accessed on 5 August 2025).
- Salehiyoun, A.R.; Zilouei, H.; Safari, M.; Di Maria, F.; Samadi, S.H.; Norouzi, O. An Investigation for Improving Dry Anaerobic Digestion of Municipal Solid Wastes by Adding Biochar Derived from Gasification of Wood Pellets. Renew. Energy 2022, 186, 1–9. [Google Scholar] [CrossRef]
- US EPA Consumer Recycling Education and Outreach Grant Program. Available online: https://www.epa.gov/infrastructure/ (accessed on 25 September 2025).
- Singh, E.; Kumar, A.; Mishra, R.; You, S.; Singh, L.; Kumar, S.; Kumar, R. Pyrolysis of Waste Biomass and Plastics for Production of Biochar and Its Use for Removal of Heavy Metals from Aqueous Solution. Bioresour. Technol. 2021, 320, 124278. [Google Scholar] [CrossRef]
- Xu, X.; Hu, X.; Ding, Z.; Chen, Y.; Gao, B. Waste-Art-Paper Biochar as an Effective Sorbent for Recovery of Aqueous Pb(II) into Value-Added PbO Nanoparticles. Chem. Eng. J. 2017, 308, 863–871. [Google Scholar] [CrossRef]
- Saleem, H.; Ahmad, M.; Rashid, J.; Ahmad, M.; Al-Wabel, M.I.; Amin, M. Carbon Potentials of Different Biochars Derived from Municipal Solid Waste in a Saline Soil. Pedosphere 2022, 32, 283–293. [Google Scholar] [CrossRef]
- Ghorbannezhad, P.; Soleymani, N.; Abbasi, M. Co-Pyrolysis of Municipal and Horticultural Wastes for Enhanced Biochar and Bio-Oil Production: A Response Surface Methodology Approach. Fuel 2023, 350, 128795. [Google Scholar] [CrossRef]
- Wang, Z.; Burra, K.G.; Lei, T.; Gupta, A.K. Co-Pyrolysis of Waste Plastic and Solid Biomass for Synergistic Production of Biofuels and Chemicals-A Review. Prog. Energy Combust. Sci. 2021, 84, 100899. [Google Scholar] [CrossRef]
- Razzak, S.A. Municipal Solid and Plastic Waste Derived High-Performance Biochar Production: A Comprehensive Review. J. Anal. Appl. Pyrolysis 2024, 181, 106622. [Google Scholar] [CrossRef]
- Gao, N.; Humphrey Milandile, M.; Tariq Sipra, A.; Su, S.; Miskolczi, N.; Quan, C. Co-Pyrolysis of Municipal Solid Waste (MSW) and Biomass with Co/Sludge Fly Ash Catalyst. Fuel 2022, 322, 124127. [Google Scholar] [CrossRef]
- Zhang, S.; Gu, W.; Geng, Z.; Bai, J.; Dong, B.; Zhao, J.; Zhuang, X.; Shih, K. Immobilization of Heavy Metals in Biochar by Co-Pyrolysis of Sludge and CaSiO3. J. Environ. Manag. 2023, 326, 116635. [Google Scholar] [CrossRef]
- Mohamed, B.A.; Ruan, R.; Bilal, M.; Khan, N.A.; Awasthi, M.K.; Amer, M.A.; Leng, L.; Hamouda, M.A.; Vo, D.N.; Li, J. Co-Pyrolysis of Sewage Sludge and Biomass for Stabilizing Heavy Metals and Reducing Biochar Toxicity: A Review. Environ. Chem. Lett. 2023, 21, 1231–1250. [Google Scholar] [CrossRef]
- Zhang, H.; Yu, H.; Sun, W.; Lin, S.; Zhang, C. Beneficiation of Silver and Silver-Bearing Lead–Zinc Ores: A Review. Miner. Eng. 2024, 208, 108608. [Google Scholar] [CrossRef]
- Zhou, C.; Ma, S.; Yu, X.; Chen, Z.; Liu, J.; Yan, L. A Comparison Study of Bottom-up and Top-down Methods for Analyzing the Physical Composition of Municipal Solid Waste. J. Ind. Ecol. 2022, 26, 240–251. [Google Scholar] [CrossRef]
- Vines, V.; Pasquali, M.; Ganguli, S.; Meyer, D.E. Understanding the Trade-Offs of National Municipal Solid Waste Estimation Methods for Circular Economy Policy. J. Clean. Prod. 2023, 412, 137349. [Google Scholar] [CrossRef] [PubMed]
- Tchobanoglous, G.; Kreith, F. Handbook of Solid Waste Management; 2002. [Google Scholar]
- US EPA. 40 CFR Part 256: Guidelines for Development and Implementation of State Solid Waste Management Plans. Available online: https://www.ecfr.gov/current/title-40/chapter-I/subchapter-I/part-256 (accessed on 27 October 2024).
- US EPA Environmental Protection Agency 40 CFR Part 258 Revisions to Criteria for Municipal Solid Waste Landfills. 1997.
- Code of Federal Regulations 40 CFR 25.11 Work Elements in Financial Assistance Agreements (up to Date as of 8-12-2025). Available online: https://www.ecfr.gov/current/title-40/chapter-I/subchapter-A/part-25/section-25.11 (accessed on 13 August 2025).
- Kollikkathara, N.; Feng, H.; Stern, E. A Purview of Waste Management Evolution: Special Emphasis on USA. Waste Manag. 2009, 29, 974–985. [Google Scholar] [CrossRef]
- Missouri Revised Statutes Chapter 260 Conservation, Resources and Development Chapter 260 - Environment Control. Available online: https://law.justia.com/codes/missouri/title-xvi/chapter-260/ (accessed on 27 October 2024).
- Title 30 Texas Administrative Code: Title 30. Environmental Quality. Available online: https://www.tceq.texas.gov/permitting/air/rules/state (accessed on 13 August 2025).
- Reinhart, D. A Review of Recent Studies on the Sources of Hazardous Compounds Emitted from Solid Waste Landfills: A U.S. Experience. Waste Manag. Res. 1993, 11, 257–268. [Google Scholar] [CrossRef]
- Bearden, D.M.; Tiemann, M.; Copeland, C.; Esworthy, R.; Luther, L.; Yen, J.H.M.J.E. Environmental Laws: Summaries of Statutes Administered by the Environmental Protection Agency. Available online: https://sgp.fas.org/crs/misc/RL30798.pdf (accessed on 8 September 2025).
- Schneeweiss, J. Proper Packaging Planning: Do We Need a Federal Law? Va. Environ. Law. J. 1996, 15, 443–467. [Google Scholar]
- Millar, S.A. Testing for Toxics in Packaging. Pap. Film. Foil Convert. 2005, 79, 22. [Google Scholar]
- Del Delumyea, R. Practical and Legal Problems Relating to the Proper Disposal of Hazardous Household Chemicals/Waste. In Municipal Solid Wastes. In Municipal Solid Wastes; CRC Press: Florida, 1996. [Google Scholar]
- Starkey, D.; Hill, K. A Legislator’s Guide to Municipal Solid Waste Management; The National Conference of State Legislatures: Denver, CO, USA, 1996; ISBN 1-55516-519-2. [Google Scholar]
- DEQ, N.C. North Carolina Landfill Disposal Bans. Available online: https://www.deq.nc.gov/about/divisions/waste-management/solid-waste-section/compliance-and-monitoring/items-banned-disposal-landfills (accessed on 7 October 2024).
- Electronic Waste Legislation. Map of States with Legislation. Available online: https://www.ecycleclearinghouse.org/contentpage.aspx?pageid=10 (accessed on 7 October 2024).
- US EPA. EPA Releases Bold National Strategy to Transform Recycling in America. Available online: https://www.epa.gov/newsreleases/epa-releases-bold-national-strategy-transform-recycling-america (accessed on 27 October 2024).
- US EPA. EPA Strategic Plan for FY 2022-2026. Available online: https://www.epa.gov/system/files/documents/2022-03/fy-2022-2026-epa-strategic-plan.pdf (accessed on 27 October 2024).
- Sicotte, D.M.; Seamon, J.L. Solving the Plastics Problem: Moving the U.S. from Recycling to Reduction. Soc. Nat. Resour. 2021, 34, 393–402. [Google Scholar] [CrossRef]
- NYSDEC. Methane Reduction Plan. Albany, NY, USA, May 2017. Available online: https://extapps.dec.ny.gov/docs/administration_pdf/mrpfinal.pdf (accessed on 10 August 2025).
- NCSL. Extended Producer Responsibility Report. Available online: https://documents.ncsl.org/wwwncsl/Environment/Extended-Producer-Responsibility-f01.pdf (accessed on 8 September 2025).
- CalRecycle Building California’s Circular Economy: Plastic Pollution Prevention and Packaging Producer Responsibility Act Implementation. Available online: www.calrecycle.ca.gov/Publications/.
- Ross Strategic Plastic Packaging Stakeholder Advisory Committee Final Report. 2021.
- Maalouf, A.; Agamuthu, P. Waste Management Evolution in the Last Five Decades in Developing Countries – A Review. Waste Manag. Res. 2023, 41, 1420–1434. [Google Scholar] [CrossRef]
- IFC The World Has a Waste Problem. Here’s How to Fix It. Available online: https://www.ifc.org/en/blogs/2024/the-world-has-a-waste-problem (accessed on 17 August 2025).
- Liu, Z.; Xu, Y.; Adams, M.; Liu, W.; Walker, T.R.; Domenech, T.; Bleischwitz, R.; Geng, Y. Comparative Analysis of the Contribution of Municipal Waste Management Policies to GHG Reductions in China. Waste Manag. Res. 2023, 41, 860–870. [Google Scholar] [CrossRef]
- Sakai, S.; Ikematsu, T.; Hirai, Y.; Yoshida, H. Unit-Charging Programs for Municipal Solid Waste in Japan. Waste Manag. 2008, 28, 2815–2825. [Google Scholar] [CrossRef] [PubMed]
- Han, H.; Zhang, Z. The Impact of the Policy of Municipal Solid Waste Source-Separated Collection on Waste Reduction: A Case Study of China. J. Mater. Cycles Waste Manag. 2017, 19, 382–393. [Google Scholar] [CrossRef]
- Save Our Seas 2.O Act, P.L. 116–224. United States Congress. Save Our Seas 2.0 Act, Public Law No. 116-224. Available online: https://www.congress.gov/116/plaws/publ224/PLAW-116publ224.pdf (accessed on 27 October 2024).
- US EPA. Contracting Best Practices: Source Separation Requirement or Preference. Available online: https://www.epa.gov/transforming-waste-tool/contracting-best-practices-source-separation-requirement-or-preference (accessed on 7 October 2024).
- Iglesias Saragih, A.; Janjevic, M.; Winkenbach, M. Revitalizing Municipal Solid Waste Recycling: Review of Current U.S. Policies and Potential Directions for the Circular Economy. MIT. Sci. Policy Rev. 2024, 5, 50–57. [Google Scholar] [CrossRef]
- EPA fact sheet Advancing Sustainable Materials Management: 2018 Fact Sheet. Available online: https://www.epa.gov/sites/default/files/2021-01/documents/2018_ff_fact_sheet_dec_2020_fnl_508.pdf (accessed on 6 October 2024).
- US EPA Advancing Sustainable Materials Management: 2015 Fact Sheet. Available online: https://www.epa.gov/sites/default/files/2018-07/documents/2015_smm_msw_factsheet_07242018_fnl_508_002.pdf (accessed on 6 October 2024).
- City of Phoenix report Waste Characterization Study 2015. Available online: https://www.phoenix.gov/publicworkssite/Documents/WasteCharacterizationStudyCombined2014-15.pdf (accessed on 7 October 2024).
- CDPHE Colorado Department of Public Health and Environment (CDPHE) - Periodic Reports. Available online: https://cdphe.colorado.gov/hm/swreports (accessed on 30 December 2024).
- CT DEEP Connecticut Department of Energy and Environmental Protection (CT DEEP) Statewide Waste Characterization Study Final Report. Available online: https://portal.ct.gov/-/media/deep/waste_management_and_disposal/solid_waste_management_plan/cmmsfinal2015mswcharacterizationstudypdf.pdf (accessed on 21 February 2025).
- Illinois EPA Waste Characterization Update- Final Report. Available online: https://illinoisrecycles.org/wp-content/uploads/2014/10/2015-Waste-Characterization-Update-FINAL.pdf (accessed on 27 October 2024).
- VT ANR Vermont Waste Characterization Study 2018 Final Report. Available online: https://dec.vermont.gov/sites/dec/files/wmp/SolidWaste/Documents/2018-VT-Waste-Characterization.pdf (accessed on 21 February 2025).
- Tennessee Department of Environment and Conservation Tennessee Department of Environment and Conservation. 2015-2025 Solid Waste and Materials Management Plan. Available online: https://www.tn.gov/environment/program-areas/solid-waste/2015-2025-solid-waste-management-plan.html (accessed on 21 October 2024).
- Vermont Department of Environmental Conservation 2023 Vermont Waste Composition Study. Available online: https://dec.vermont.gov/sites/dec/files/wmp/SolidWaste/Documents/2023-VT-Waste-Composition-Study.pdf (accessed on 21 October 2024).
- Iowa Department of Natural Resources 2022 Iowa Statewide Material Characterization Study. Available online: www.scsengineers.com.
- Pennsylvania Department of Environmental Protection Statewide Waste Composition Study. Available online: https://files.dep.state.pa.us/Waste/Recycling/RecyclingPortalFiles/Documents/wastecompositionstudy.pdf (accessed on 21 October 2024).
Figure 1.
MSW generation by region—Middle East and North Africa (MENA), Sub-Saharan Africa (SSA), Latin America and Caribbean (LAC), North America (NA), South Asia (SA), Europe and Central Asia (ECA), and East Asia and Pacific (EAP)—projected to 2050, reflecting population growth and urbanization, data from [1].
Figure 1.
MSW generation by region—Middle East and North Africa (MENA), Sub-Saharan Africa (SSA), Latin America and Caribbean (LAC), North America (NA), South Asia (SA), Europe and Central Asia (ECA), and East Asia and Pacific (EAP)—projected to 2050, reflecting population growth and urbanization, data from [1].
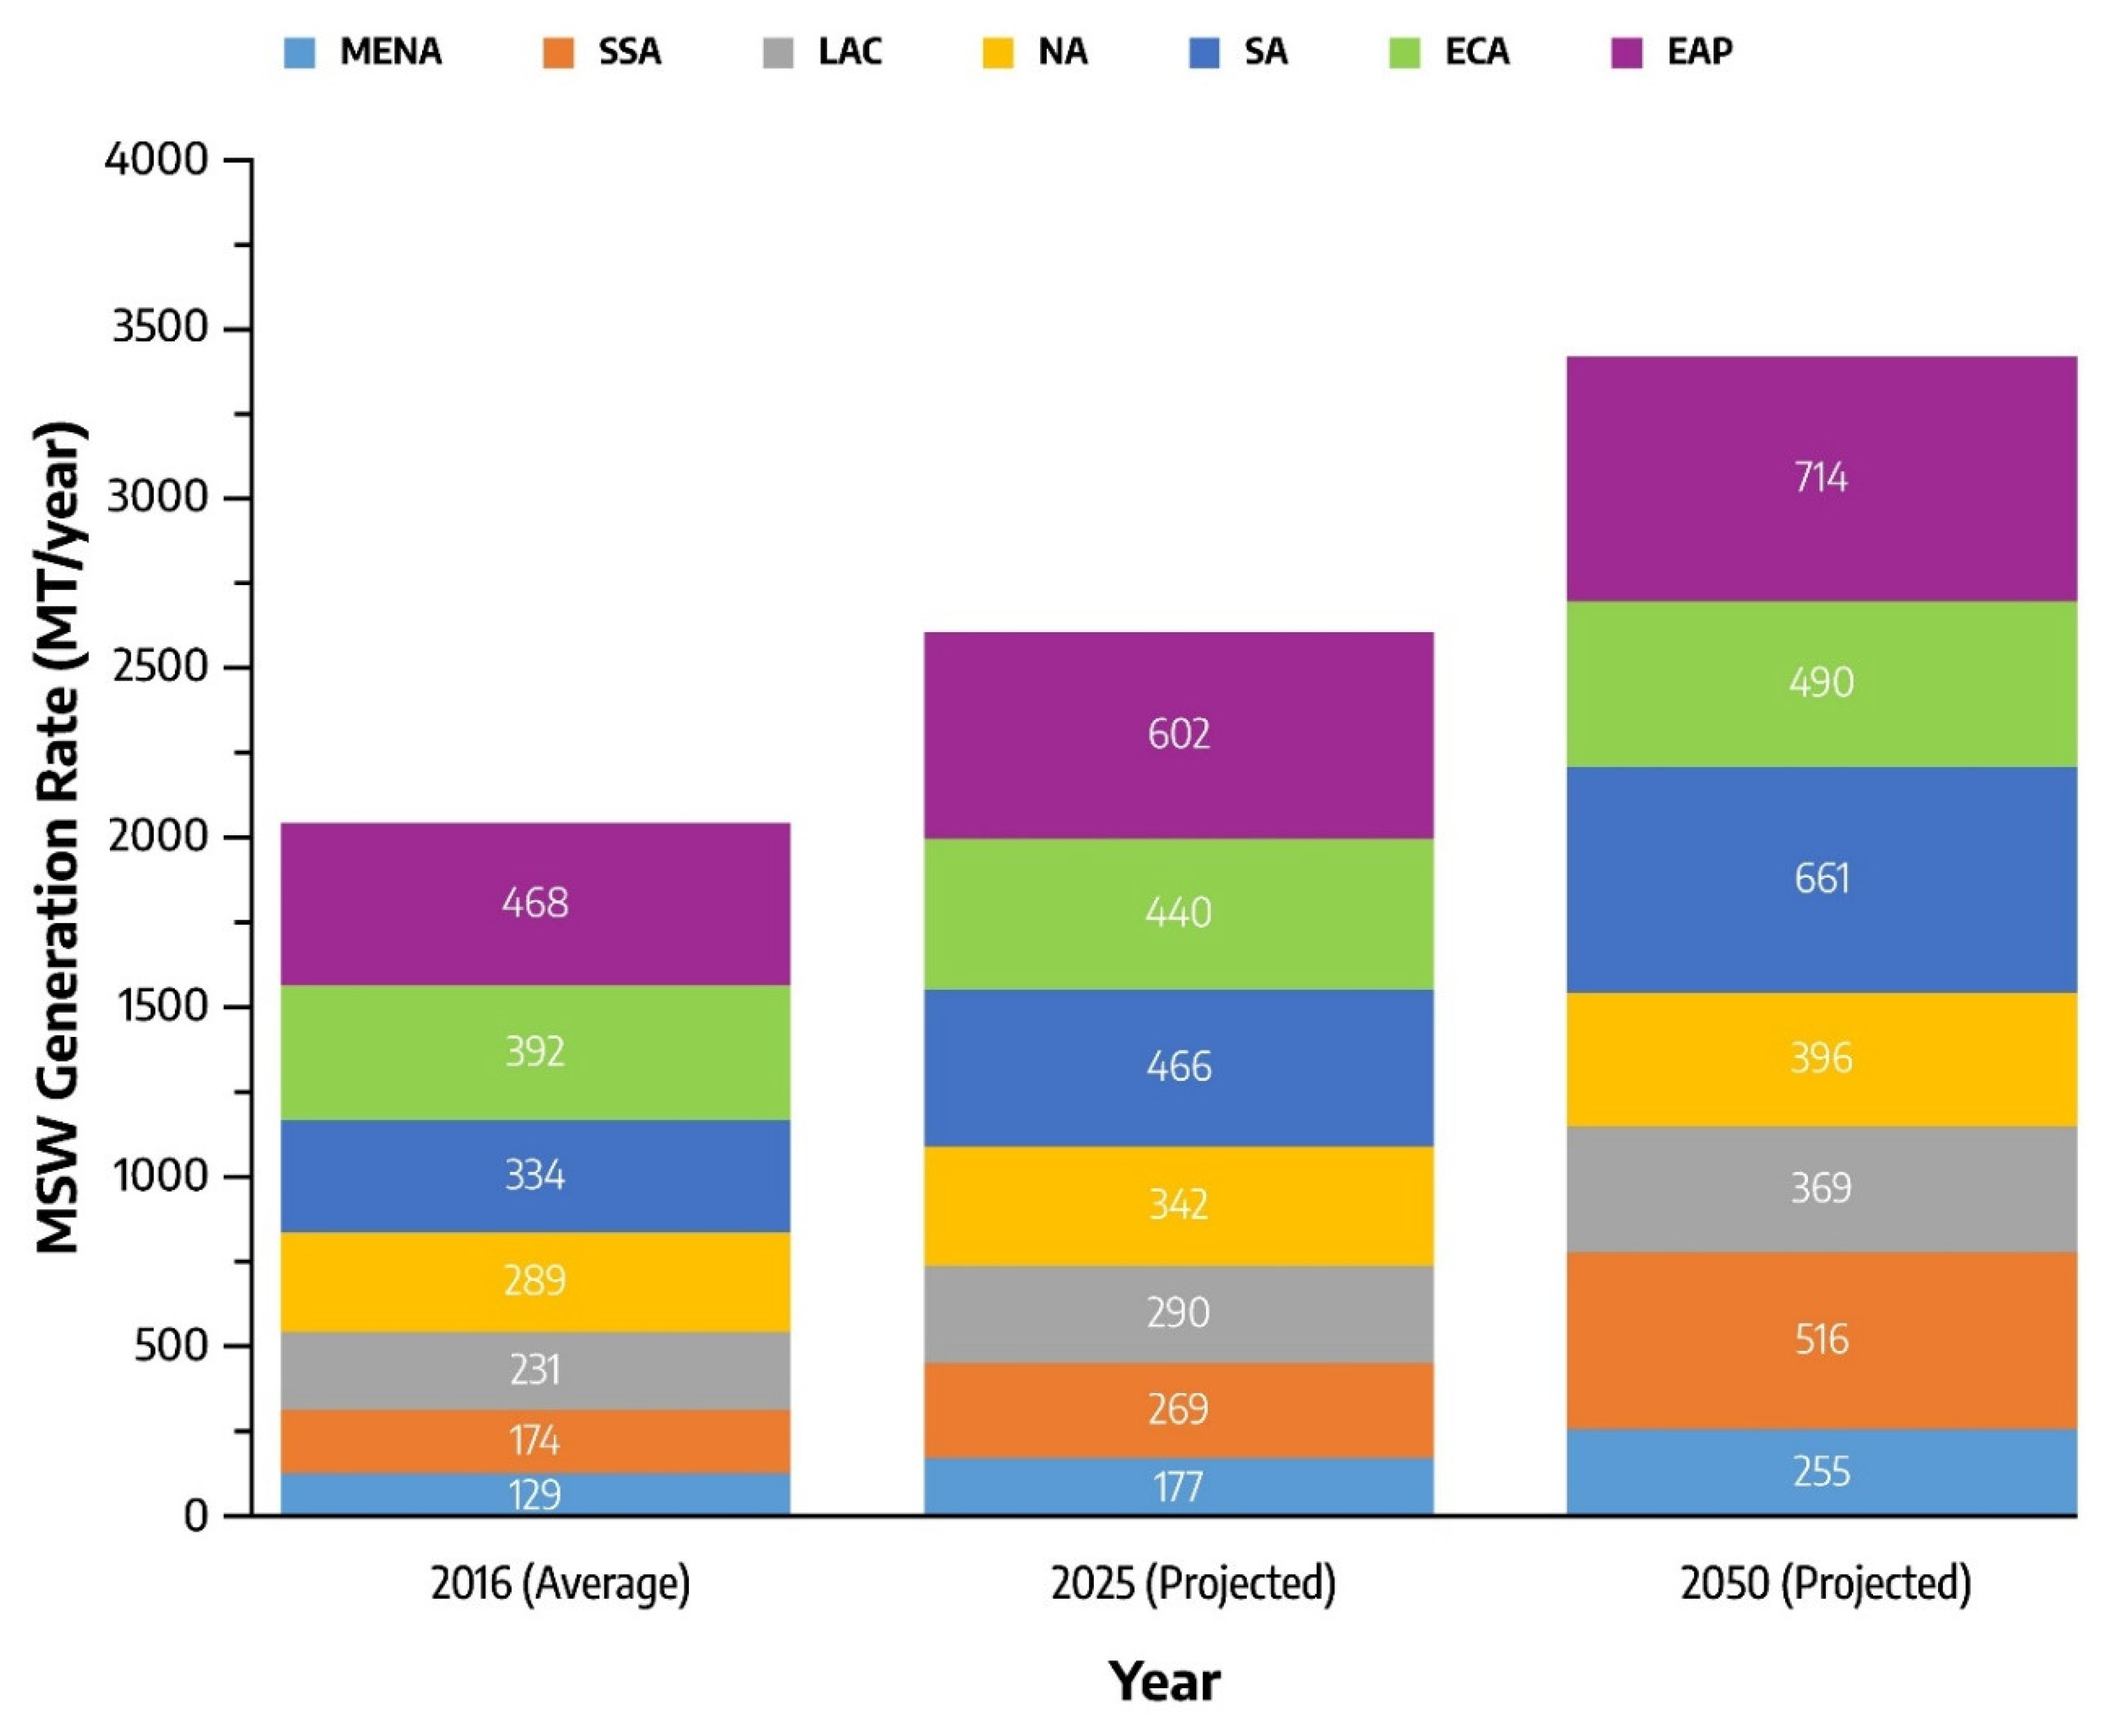
Figure 2.
MSW generation, composition and final disposal. (a) Global MSW scenario based on the World Bank report on the global snapshot of solid waste generation by 2050 [1] (b) US MSW generation in 2018 based on the US EPA report on materials and waste management, data from [22].
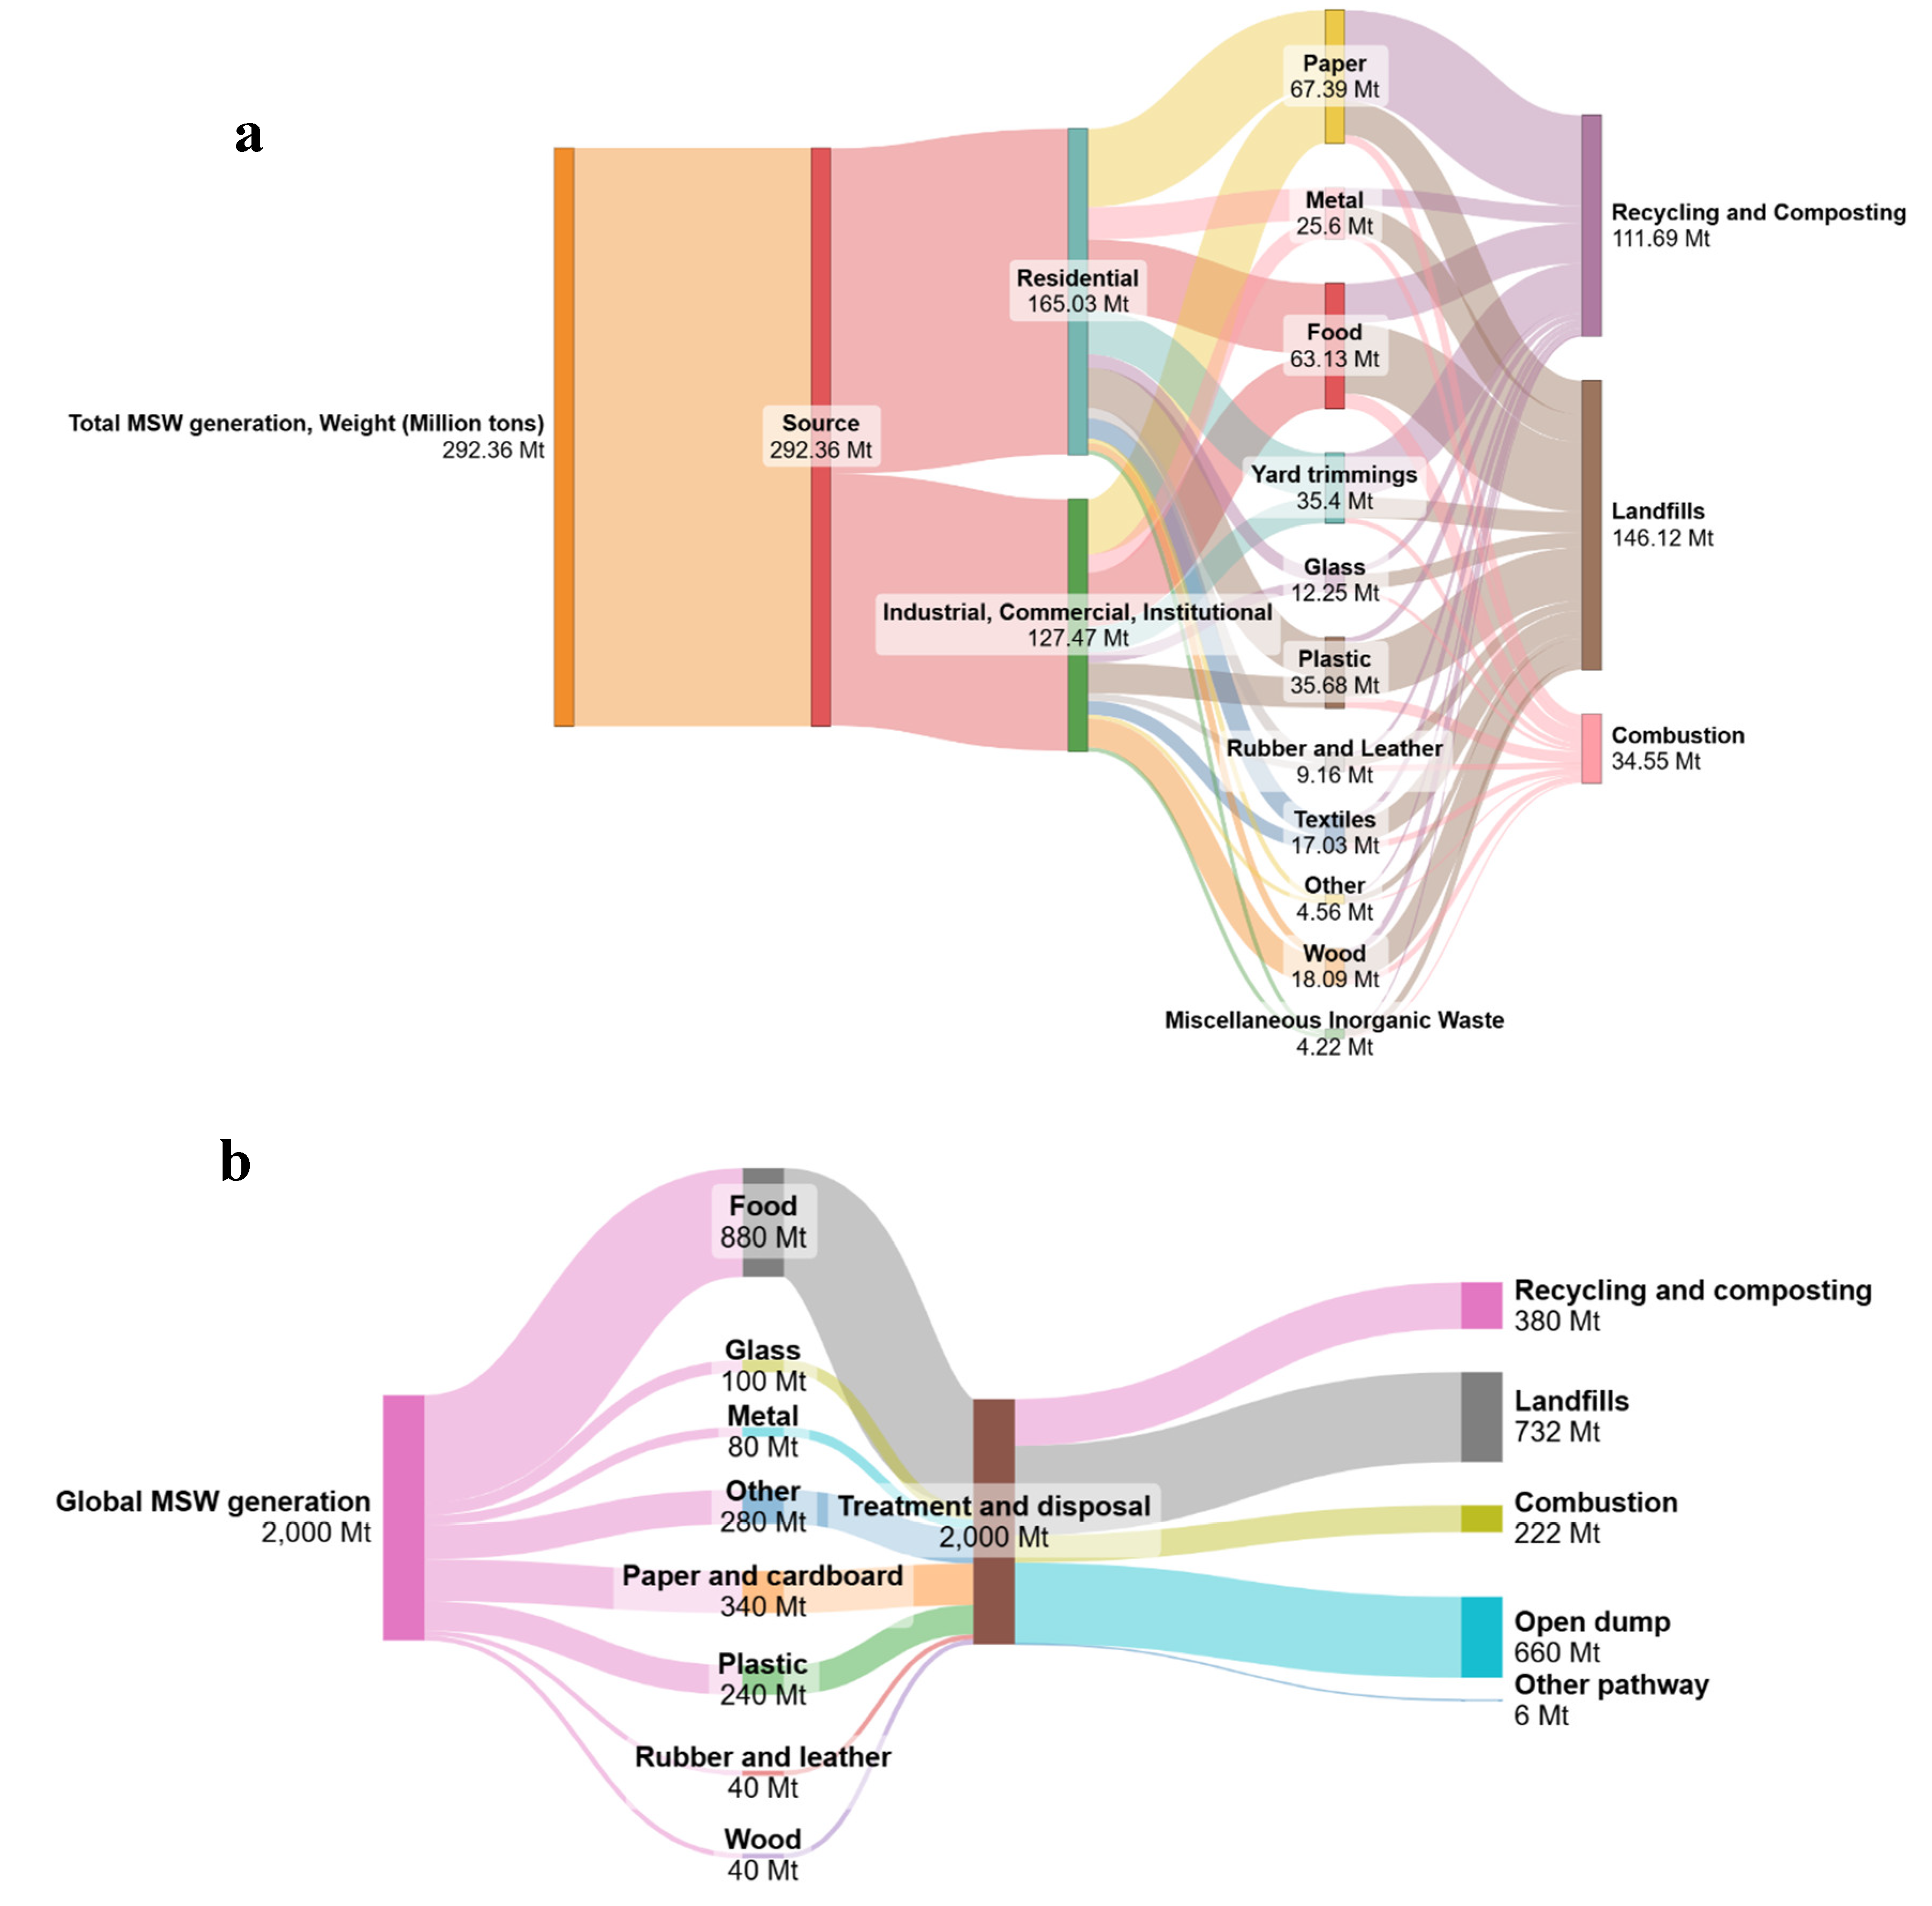
Figure 3.
Material flow in a typical US MRF, showing key sorting stages using mechanical, magnetic, optical, and manual methods to produce high-quality outputs.
Figure 3.
Material flow in a typical US MRF, showing key sorting stages using mechanical, magnetic, optical, and manual methods to produce high-quality outputs.
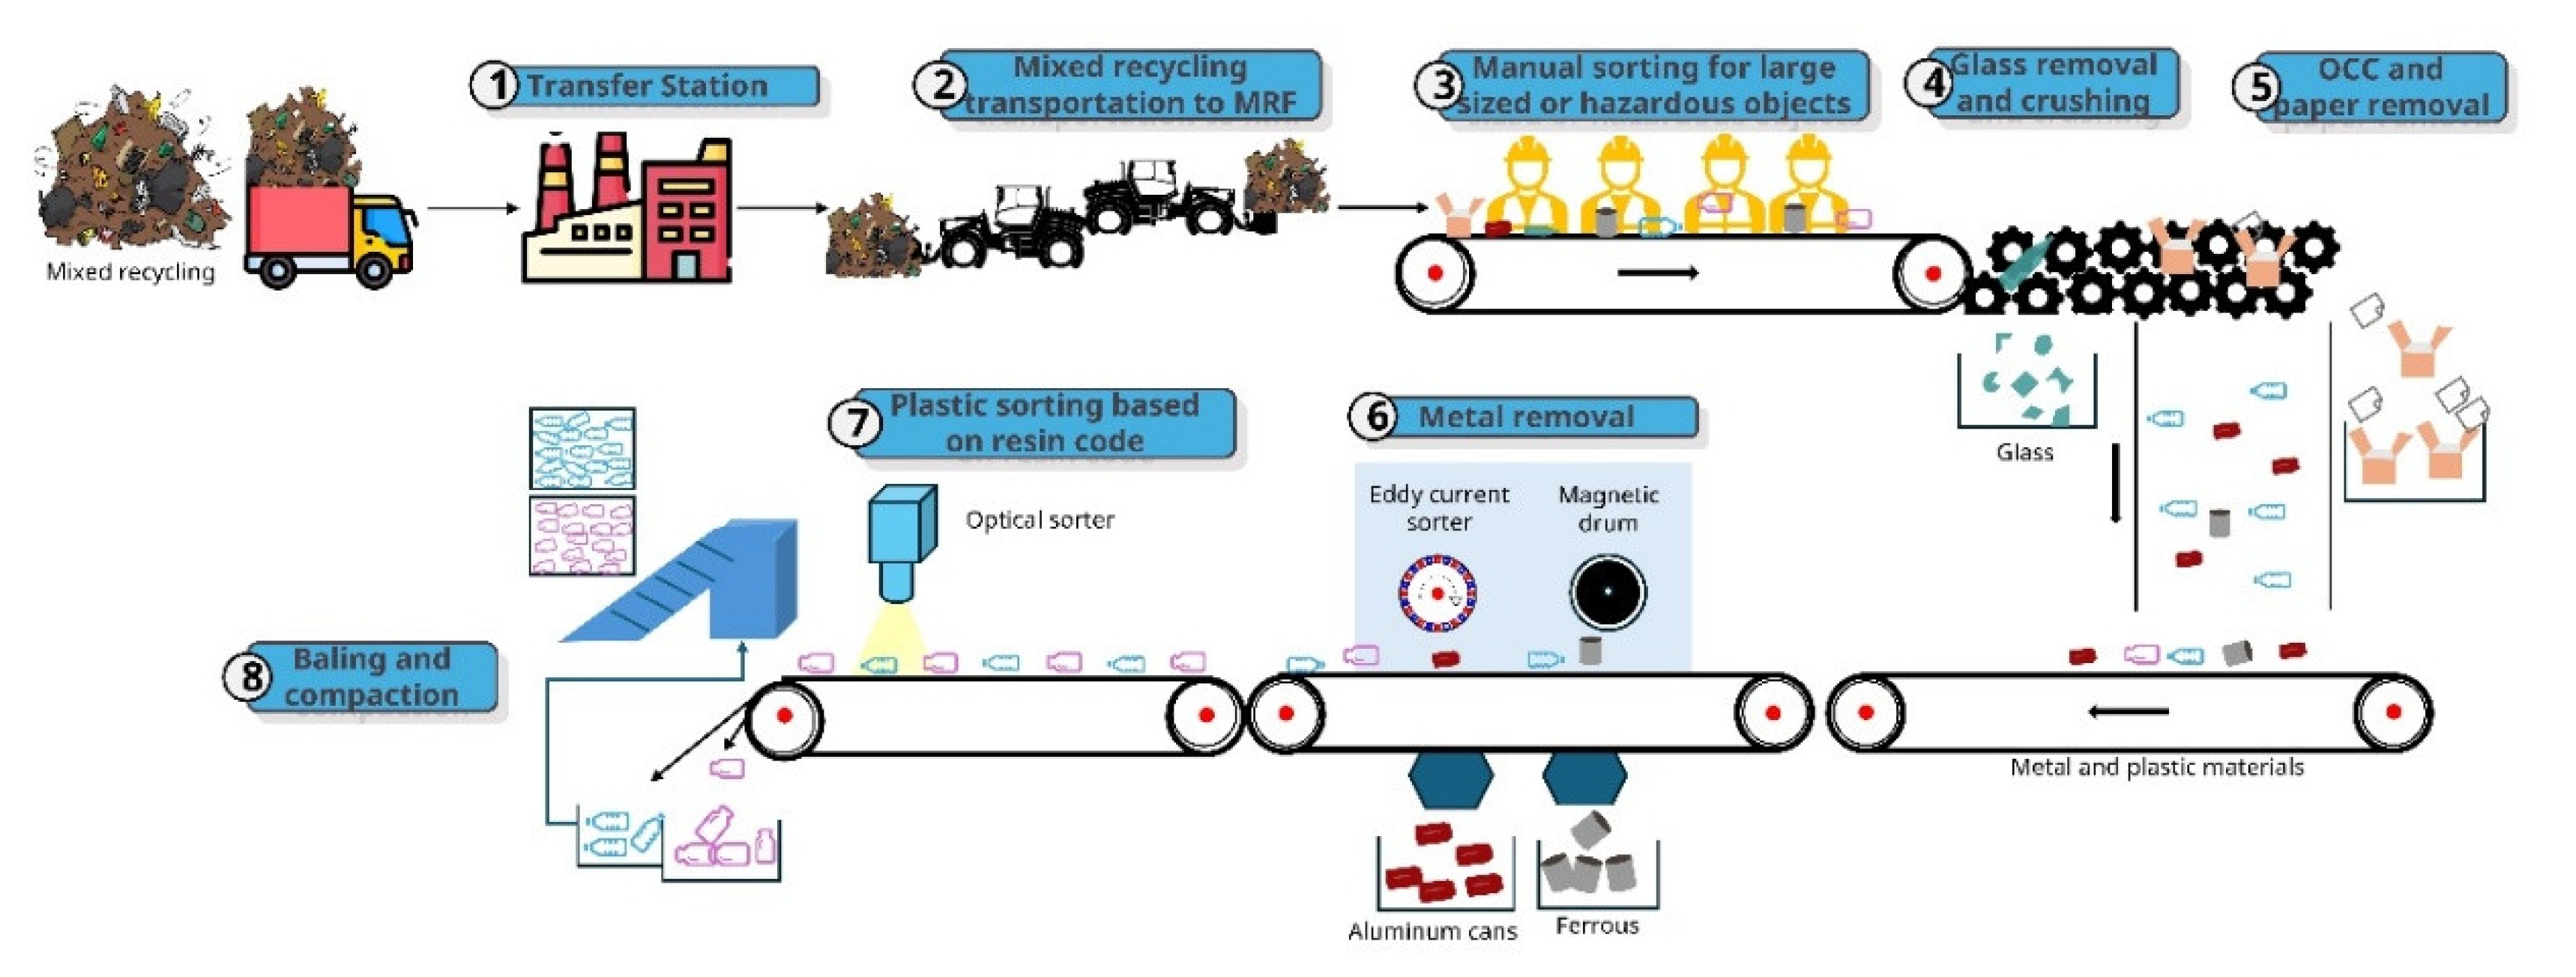
Figure 4.
a) De-XRT and b) XRF techniques for sorting materials based on composition and density used in waste management and recycling facilities, Adapted from [10].
Figure 4.
a) De-XRT and b) XRF techniques for sorting materials based on composition and density used in waste management and recycling facilities, Adapted from [10].
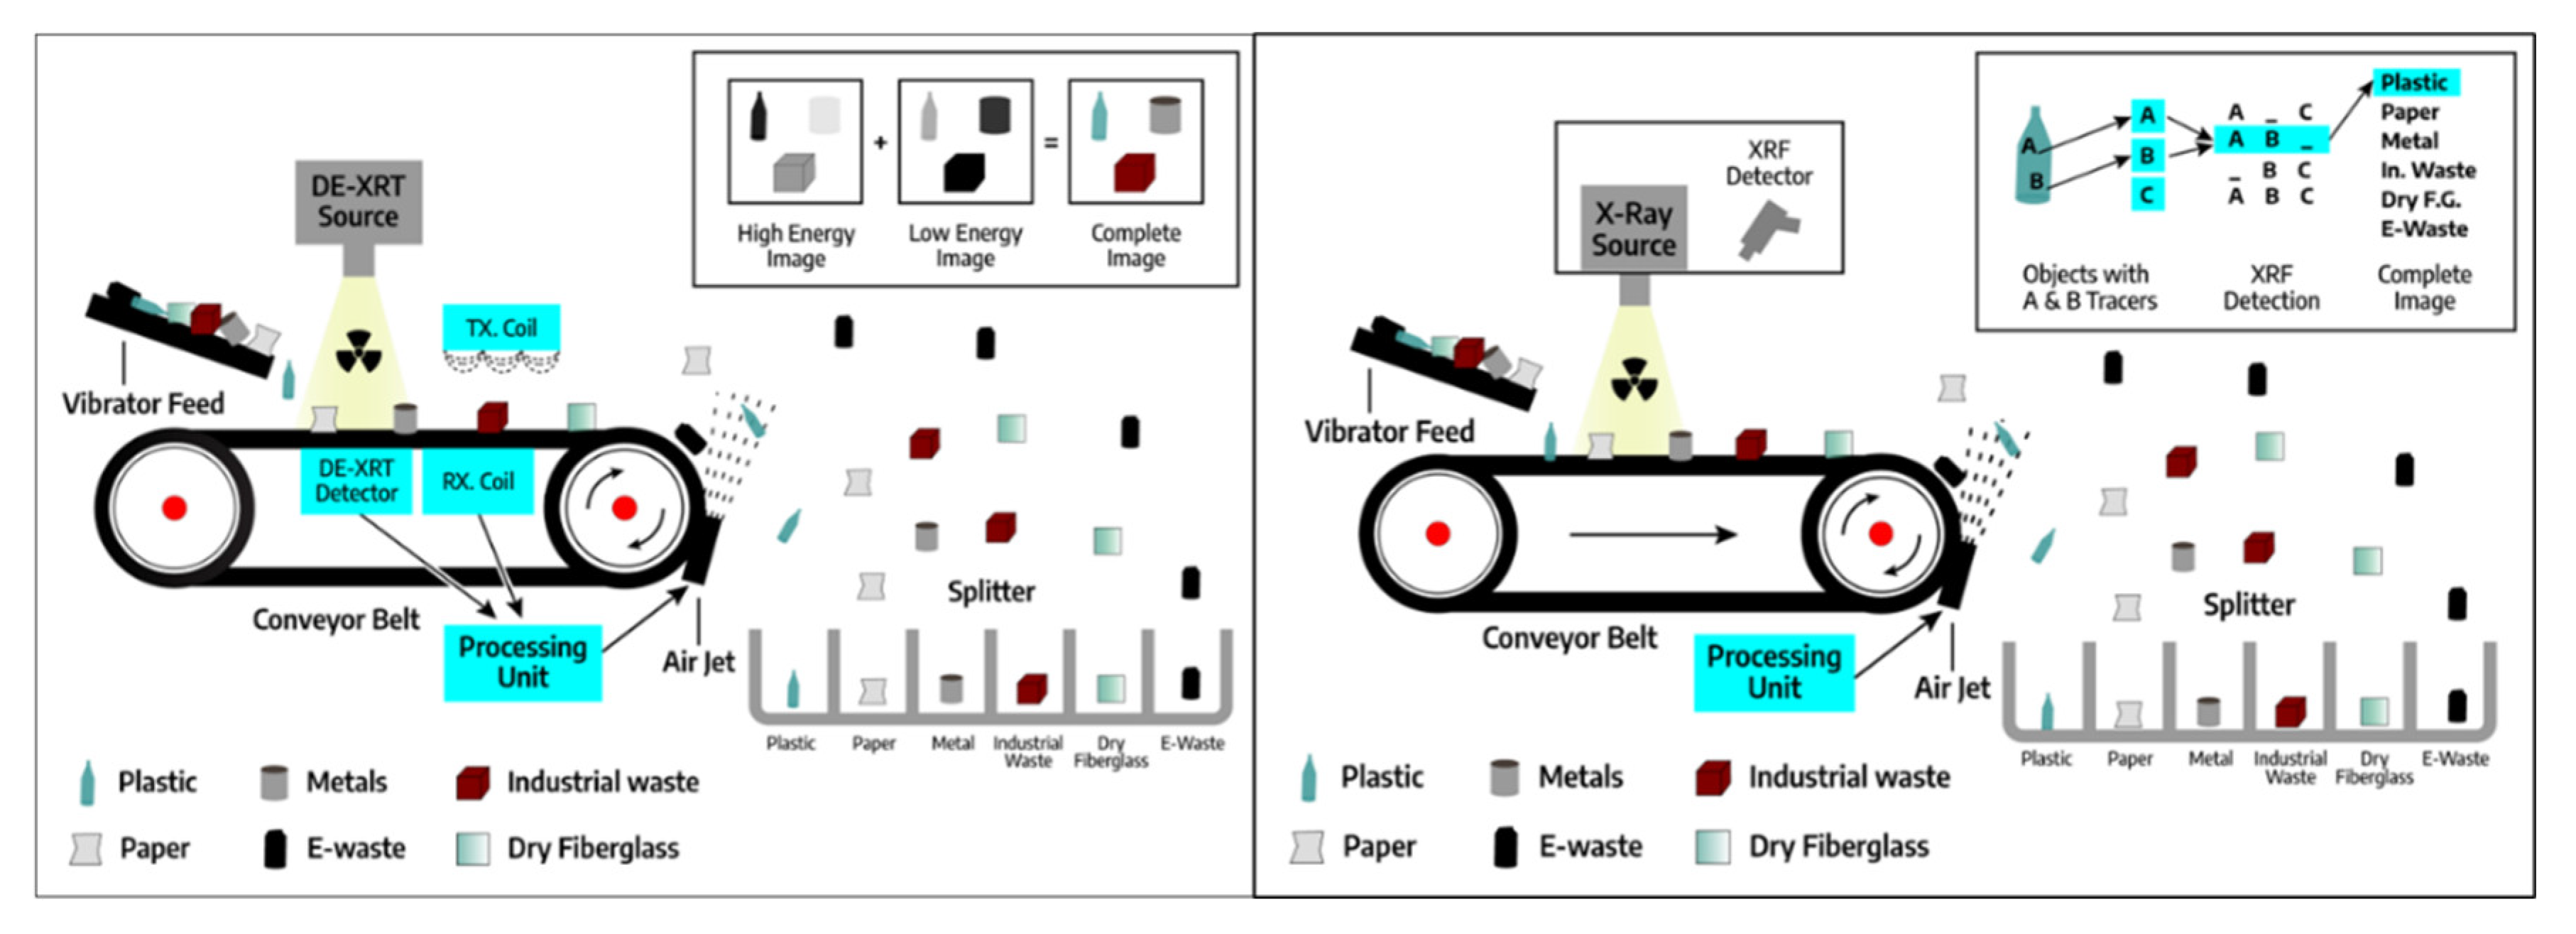
Figure 5.
Preprocessing methods for obtaining conversion-ready feedstock, including size reduction, screening & separation, densification, chemical & enzymatic treatment, drying, and mixing.
Figure 5.
Preprocessing methods for obtaining conversion-ready feedstock, including size reduction, screening & separation, densification, chemical & enzymatic treatment, drying, and mixing.
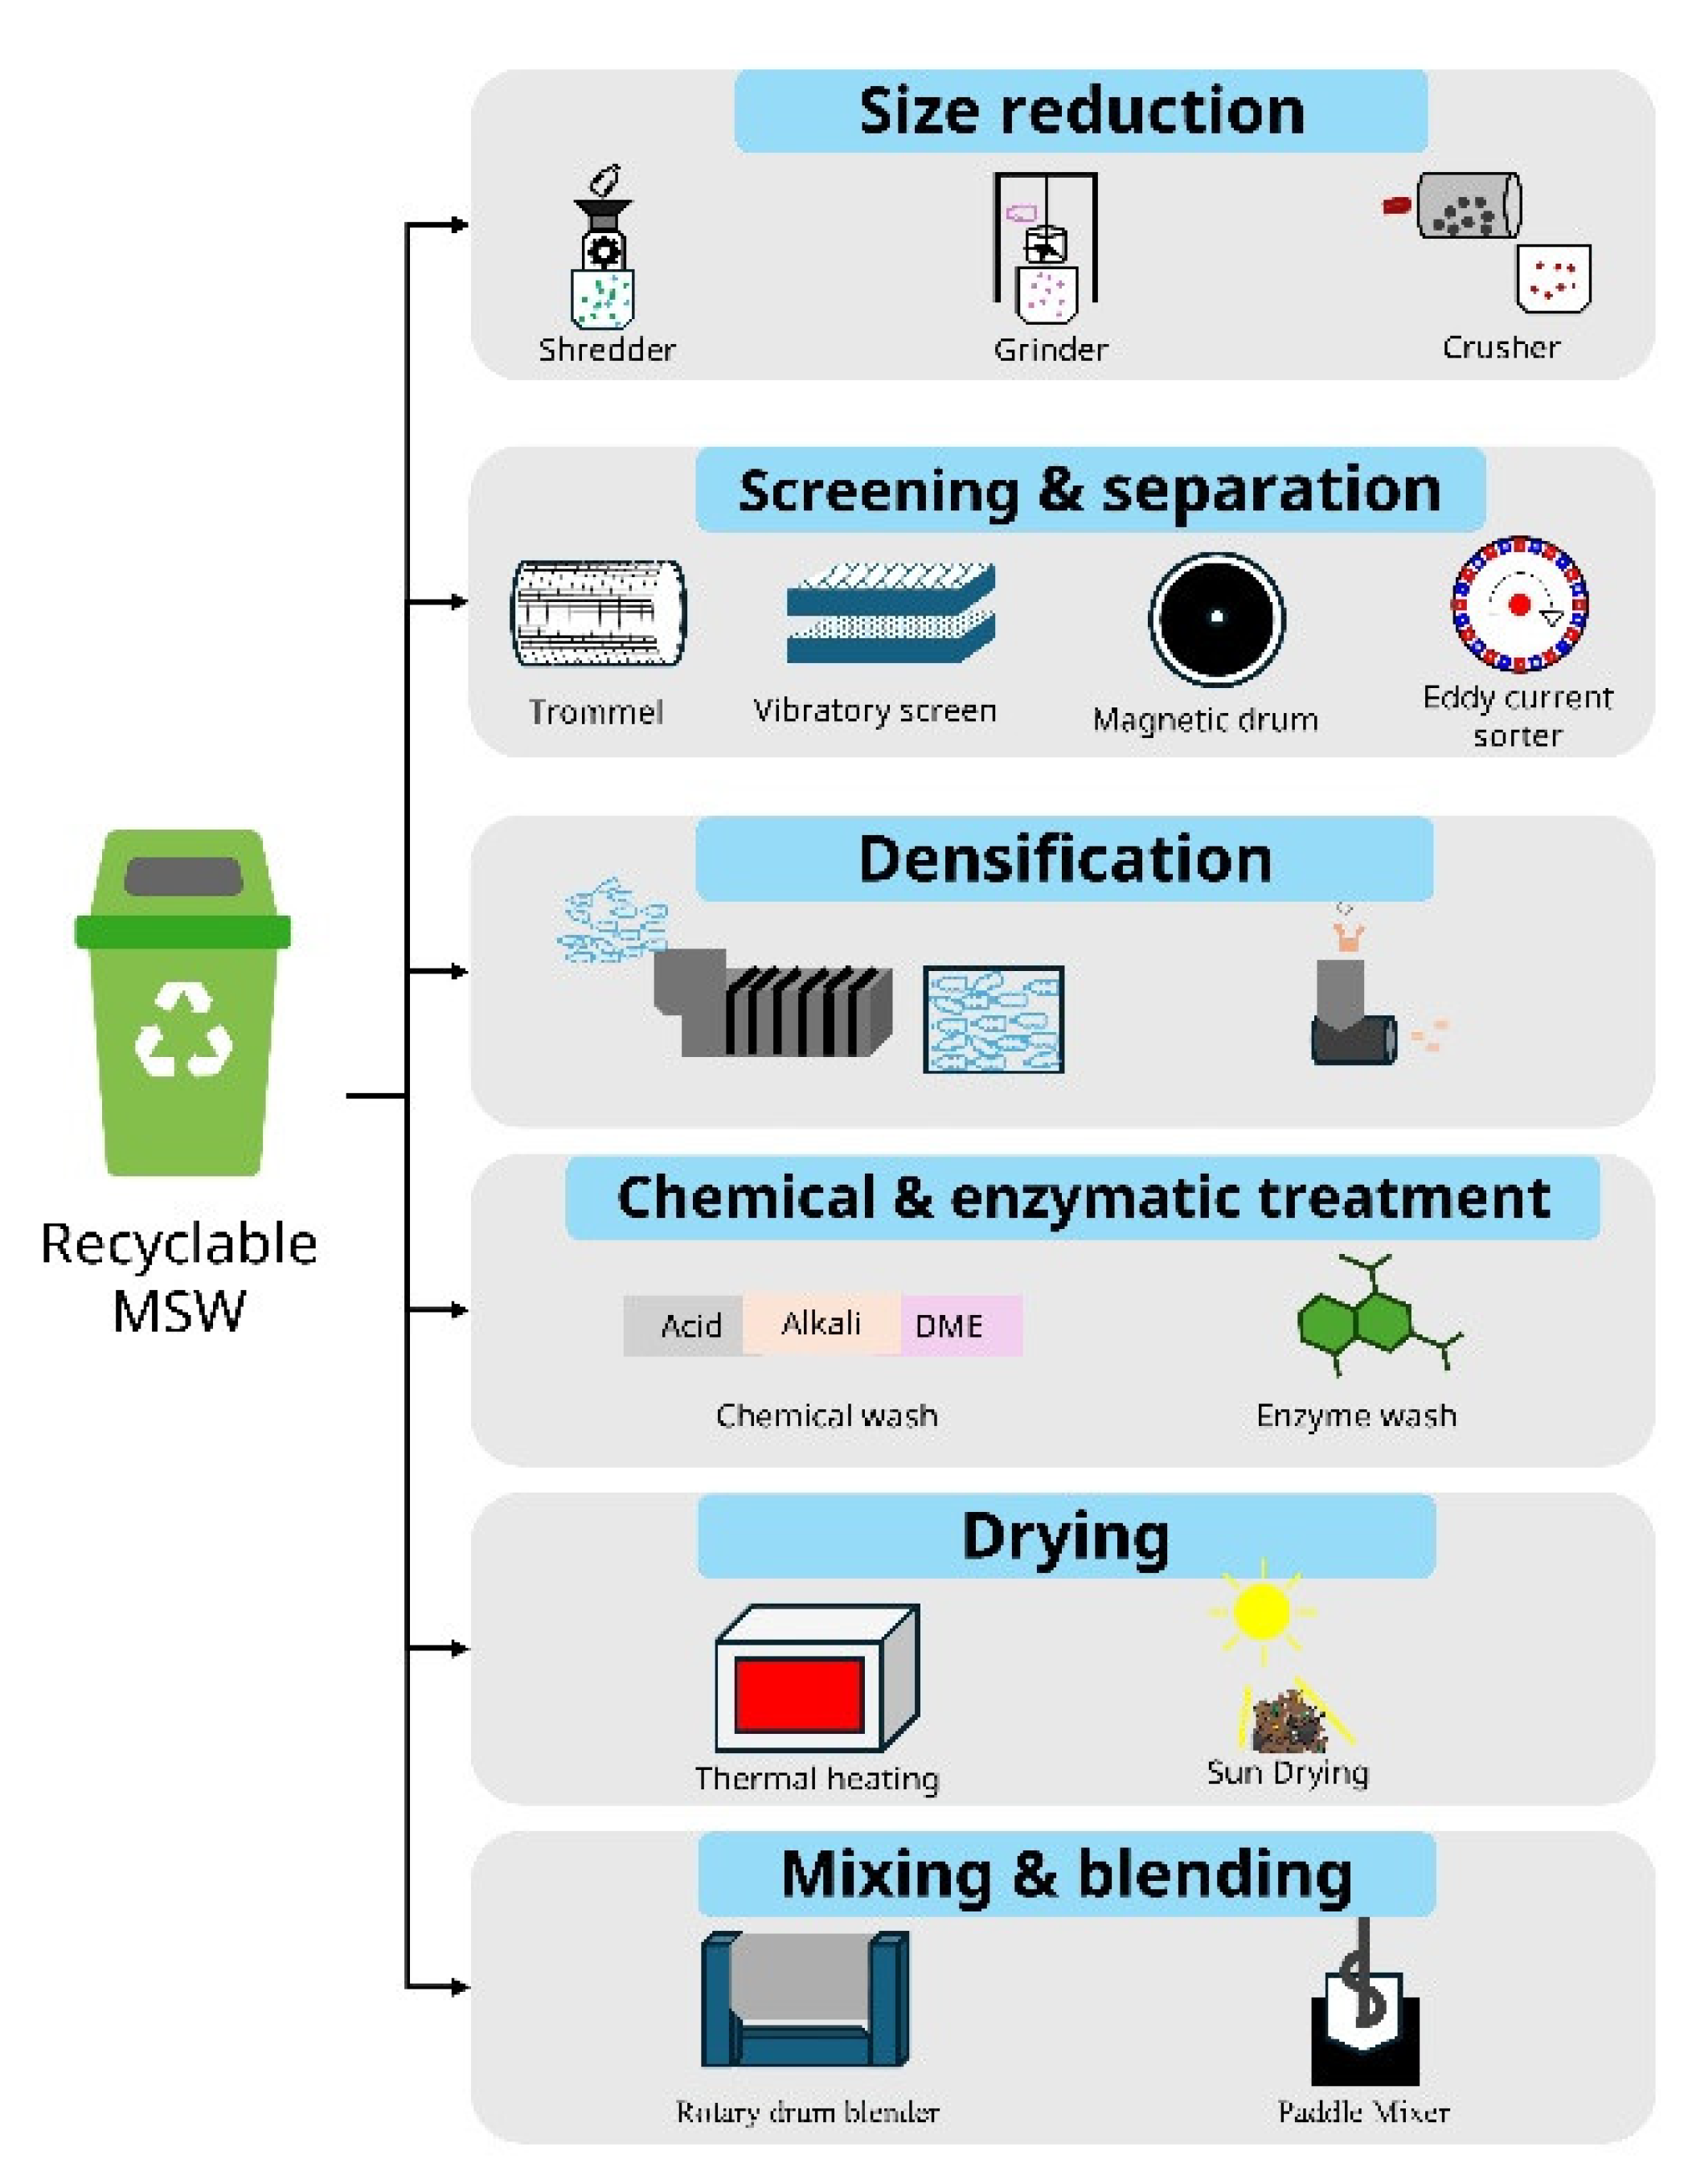
Figure 6.
MSW to bioenergy and biopower technologies for the valorization of MSW towards circular bioeconomy.
Figure 6.
MSW to bioenergy and biopower technologies for the valorization of MSW towards circular bioeconomy.
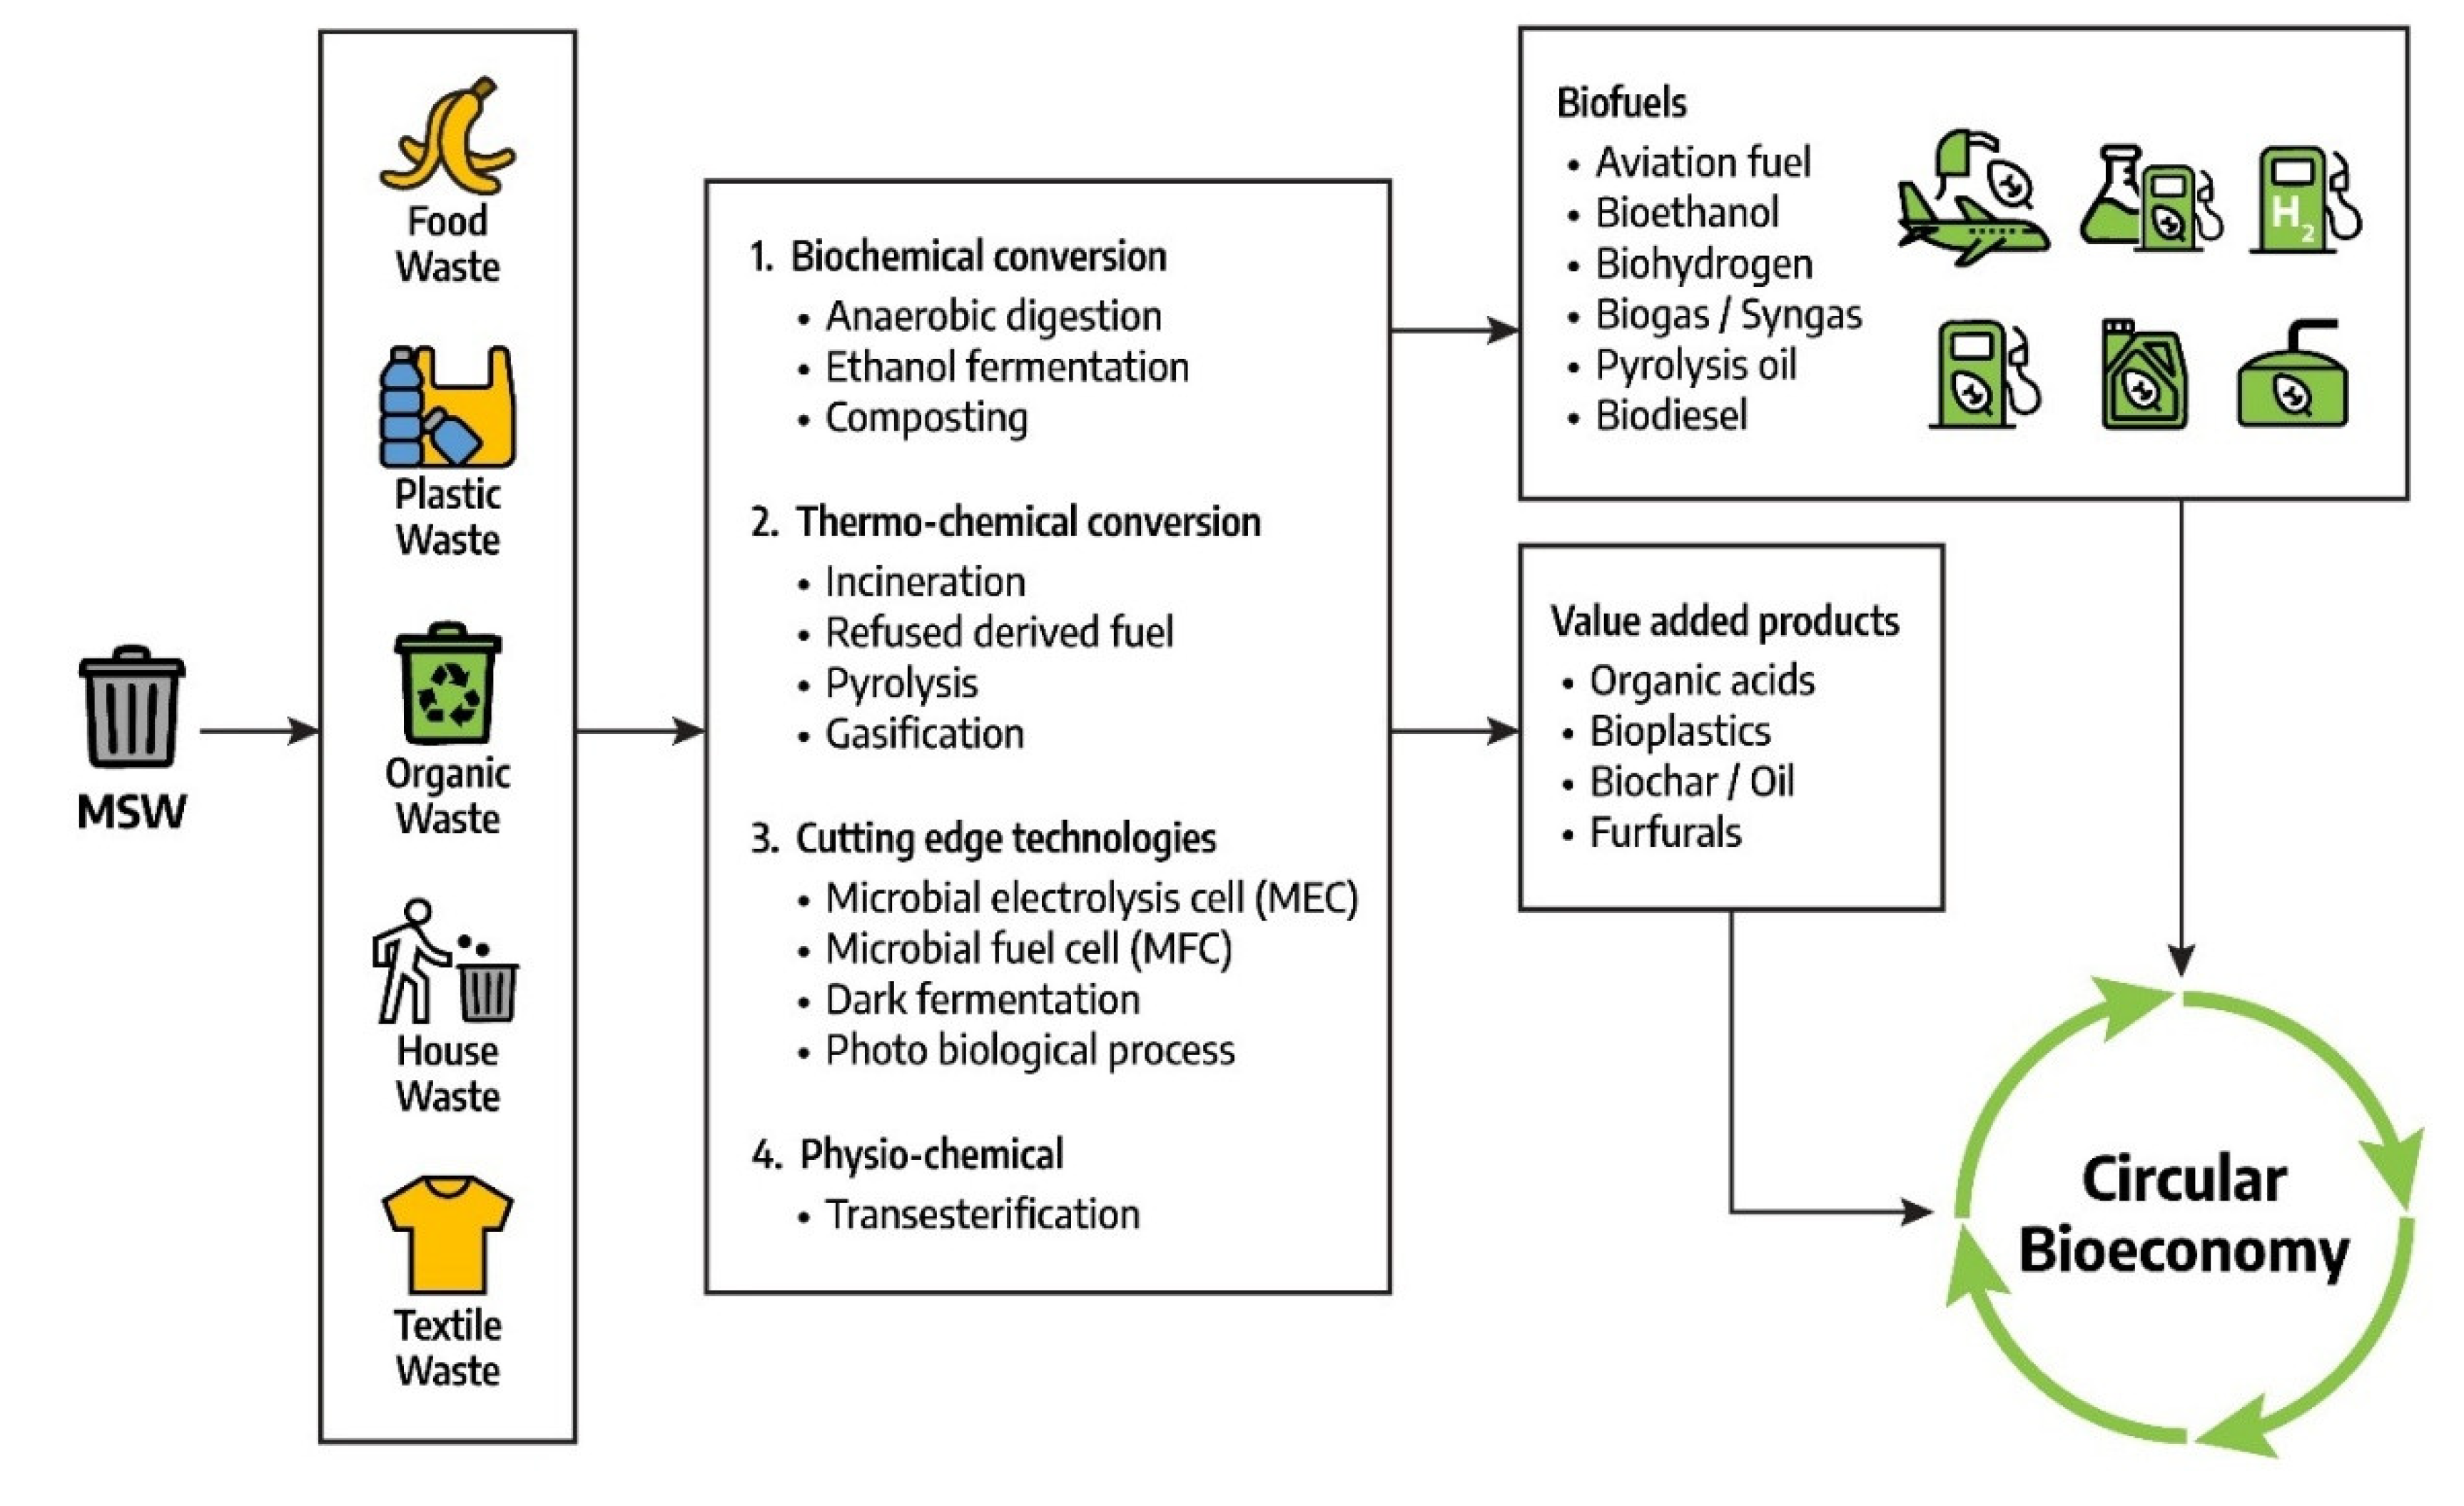
Figure 7.
Conversion of different fractions of MSW into various bioproducts mainly through anaerobic digestion and fermentation, illustrating the potential of diverting MSW into sustainable bioproducts such as methane, biohydrogen, ethanol and other value-added products [161,162,163,164].
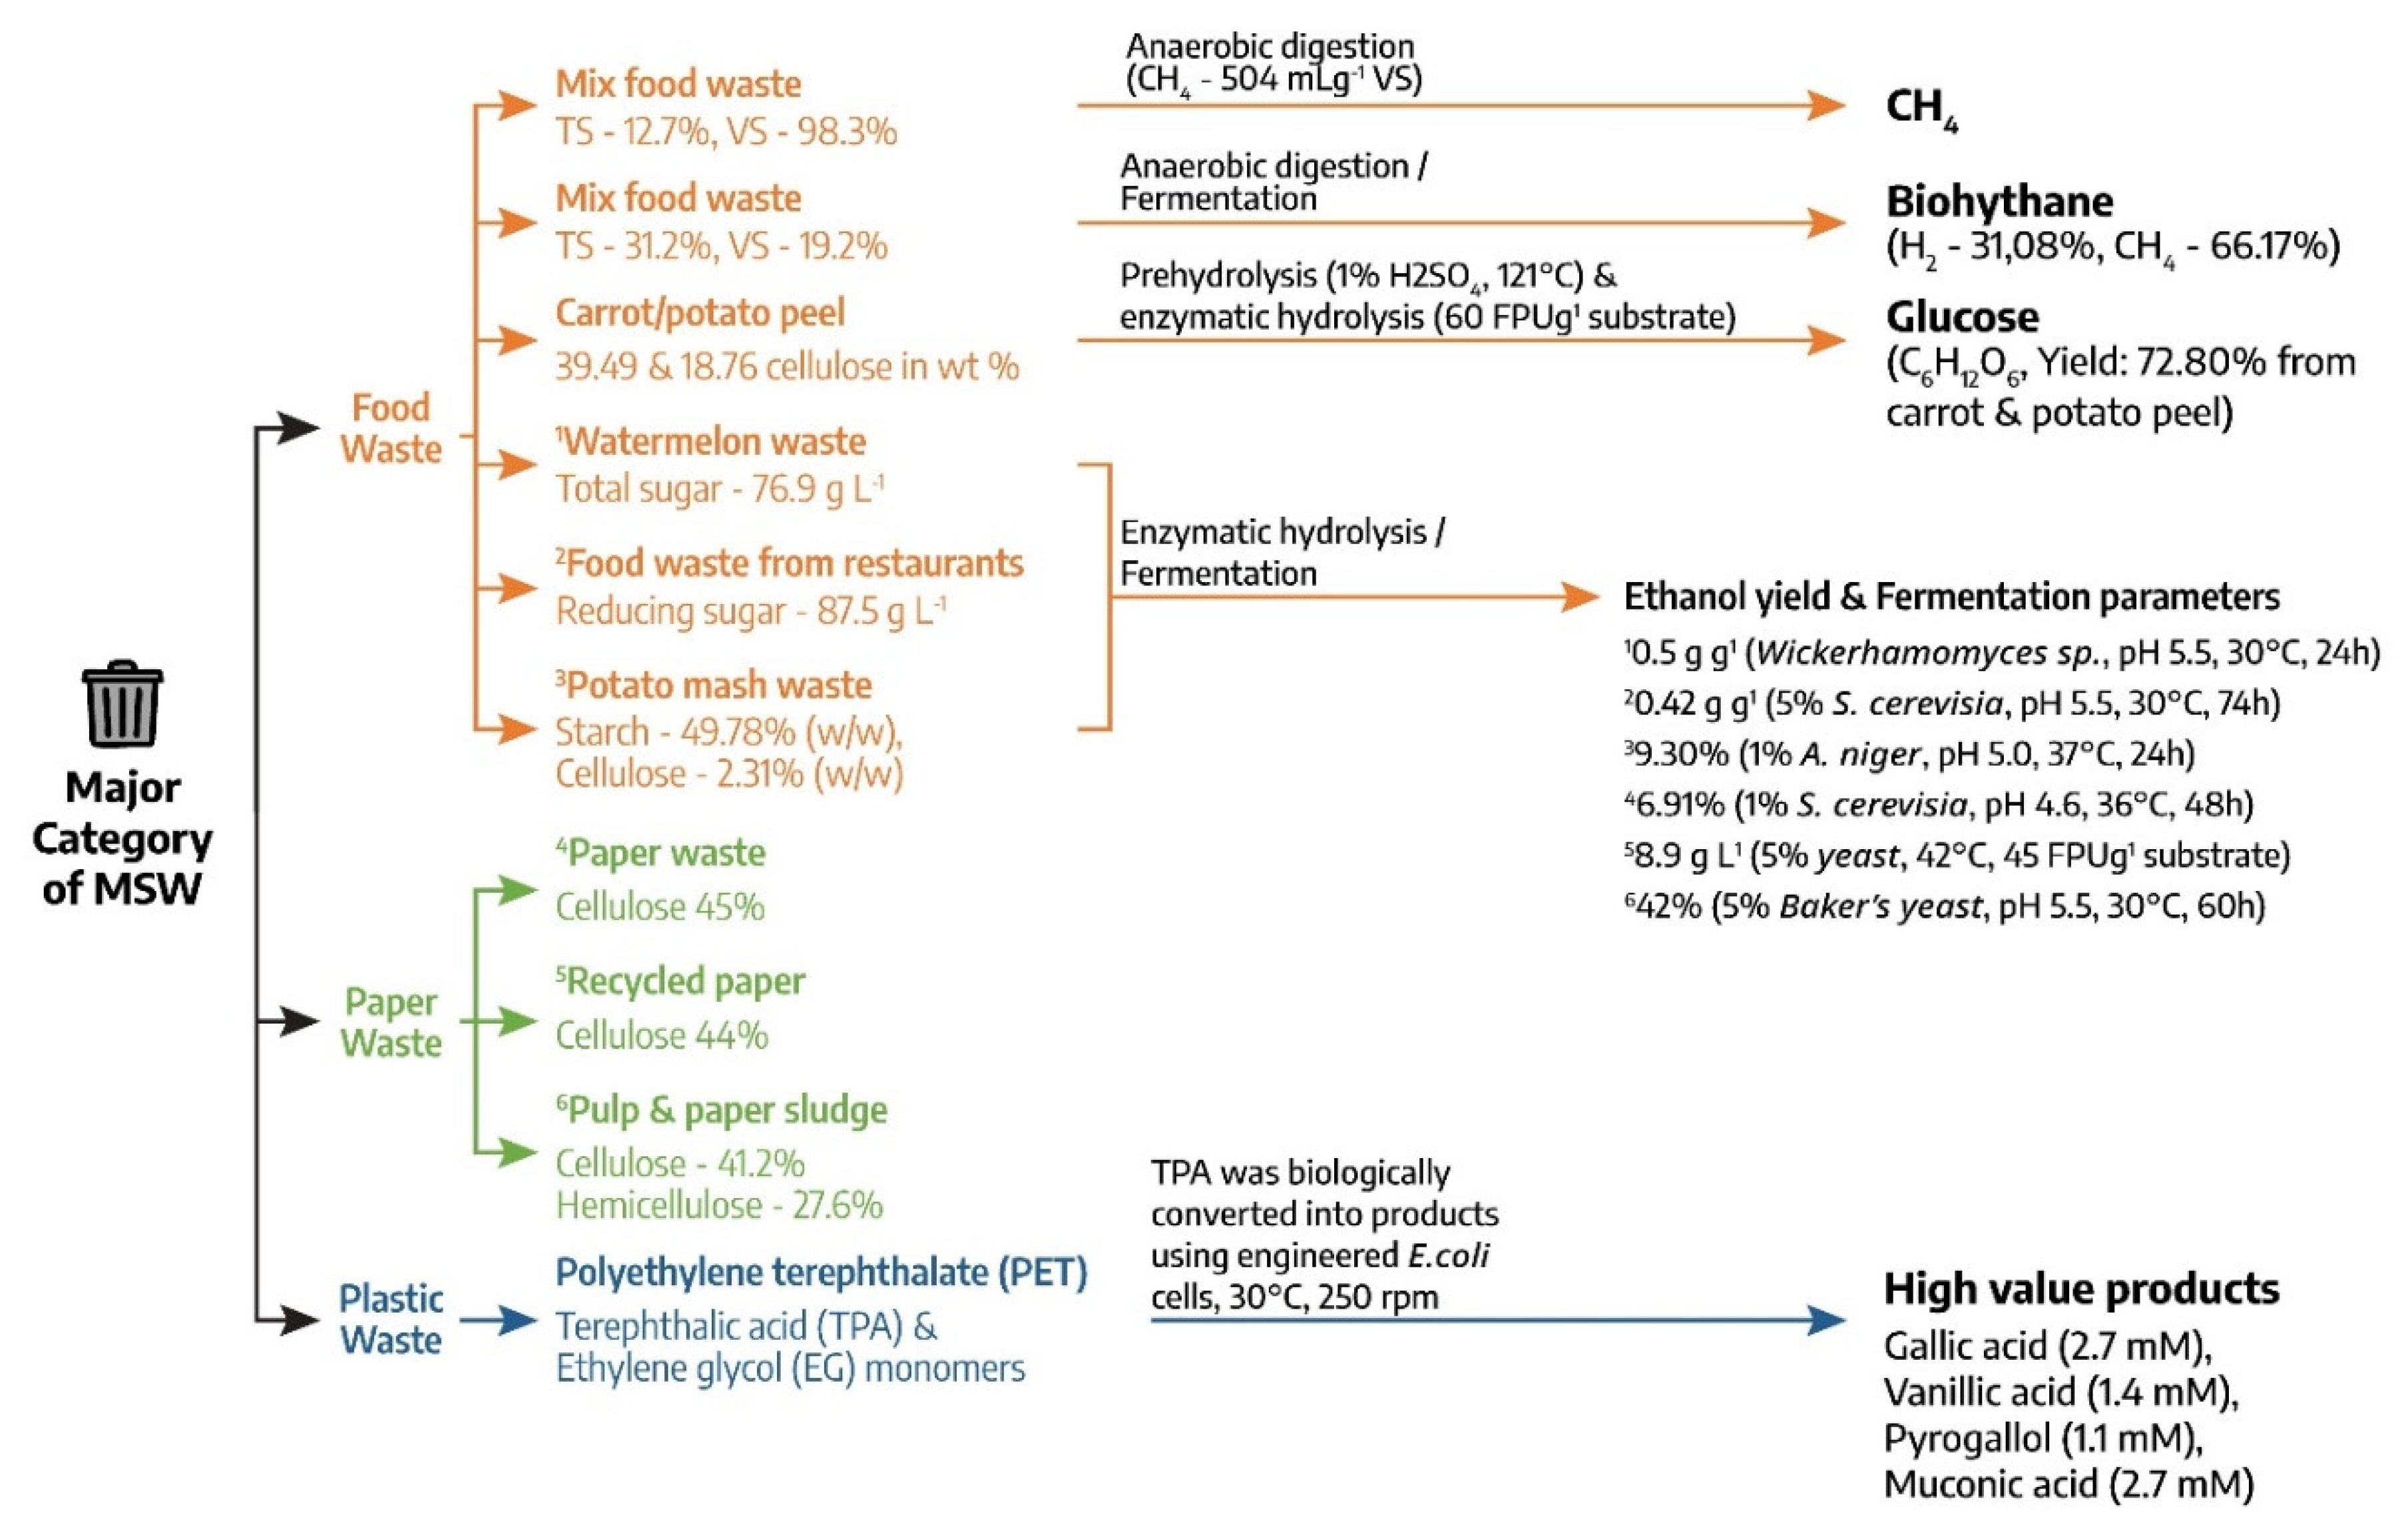
Table 1.
Hazardous waste characteristics defined by the U.S. EPA.
| Characteristics | Definition and key Criteria | Examples | Waste Code | Regulatory Reference |
| Ignitability | Easily ignitable wastes. Determined by flash point test; some solids (e.g., wood, paper) may qualify. Includes compressed gases and oxidizers. | Flammable liquids; wood; paper; oxidizers; compressed gases | D001 | [75] |
| Corrosivity | Waste with pH ≤ 2.0 or ≥ 12.5, or that corrodes steel per EPA protocol. | Sulfuric acid from automotive batteries | D002 | [34,77] |
| Reactivity | Waste that explodes, ignites, reacts violently with water, or releases toxic gases (e.g., cyanide/sulfide, pH 2–12.5). | Explosives; discarded munitions; reactive chemicals | D003 | [34,78] |
| Toxicity | Determined by TCLP, which simulates landfill leaching and tests for 39 chemicals. Exceeding thresholds classifies waste as toxic. | Leachate with heavy metals, solvents, pesticides | D004–D043 (depending on chemical) | [79,80] |
Table 2.
MSW fraction–to–valorization route selection recommended pathways and constraints.
| MSW fraction / condition | Best-fit valorization route(s) | Rationale | Key constraints / risks | Representative citations |
| High-moisture organics (food, yard) | Anaerobic digestion, composting, hydrothermal routes | High biodegradability, avoids drying | NH₃/H₂S management, contamination | [69,165] |
| Cellulosic paper/wood (clean) | AD/fermentation, pyrolysis, gasification | Convertible to biogas/sugars, char/syngas | Moisture variability, sorting needed | [164] |
| Mixed plastics (non-PVC dominated) | Pyrolysis, gasification, WtE | High LHV/volatiles; energy dense | Contamination and drying, halogens | [130] |
| PVC-rich or halogenated plastics | Avoid thermal routes unless robust scrubbing | Halogens cause acid gas/dioxin risks | HCl formation, corrosive emissions | [122] |
| Mixed residuals (high heterogeneity) | Incineration/WtE, plasma gasification | Tolerates heterogeneity | Ash/heavy metals, tar/corrosives | [167,204] |
| Ash-rich paper/composites | Biochar (controlled pyrolysis), WtE with ash handling | Higher char yield, alkalinity potential | Metals/ash handling, quality control | [216] |
| Lipid-rich wastes (FOG, oils) | Physico-chemical routes (biodiesel, electro-demulsification) | Direct liquid fuel pathway | Feedstock variability; water removal | [170,171] |
| Syngas-to-fuels (FT/SAF) feedstock | Gasification + FT (SAF), ATR integration | Drop-in fuels, scalable | Clean syngas required, policy/TEA sensitivity | [188,227] |
| Carbon sequestration priority | Biochar from organics/paper | Durable carbon, soil benefits | Feed contamination, property variability | [218,220] |
Disclaimer/Publisher’s Note: The statements, opinions and data contained in all publications are solely those of the individual author(s) and contributor(s) and not of MDPI and/or the editor(s). MDPI and/or the editor(s) disclaim responsibility for any injury to people or property resulting from any ideas, methods, instructions or products referred to in the content. |
© 2026 by the authors. Licensee MDPI, Basel, Switzerland. This article is an open access article distributed under the terms and conditions of the Creative Commons Attribution (CC BY) license (http://creativecommons.org/licenses/by/4.0/).
Copyright: This open access article is published under a Creative Commons CC BY 4.0 license, which permit the free download, distribution, and reuse, provided that the author and preprint are cited in any reuse.


