

Submitted:
25 May 2026
Posted:
26 May 2026
You are already at the latest version
Abstract
Undergraduate nursing students are trained to promote health in clinical and community settings, but their own health-promoting behaviors occur in the context of academic demands, clinical training, work responsibilities, and limited time for self-care. This cross-sectional analytic study described health-promoting lifestyles among 506 undergraduate nursing students at the Centro Universitario de Ciencias de la Salud, Universidad de Guadalajara; assessed internal consistency, factorability, and exploratory dimensional evidence for the Health-Promoting Lifestyle Profile II (HPLP-II); identified empirical lifestyle profiles; and examined cross-sectional associations of perceived stress, health-professional advice seeking, and health-information sources with HPLP-II scores. The overall median HPLP-II score was 2.40 (IQR: 2.06, 2.79). Internal consistency was high for the global scale (Cronbach’s alpha = 0.961) and ranged from acceptable to high across subscales (alpha = 0.812–0.900). Two lifestyle profiles were identified: Low HPLP (58.1%) and High HPLP (41.9%). In the primary HC3 robust model, health-professional advice seeking was associated with higher global HPLP-II scores (beta = 0.242, 95% CI: 0.140, 0.344; p < 0.001), whereas academic stress and vacation-period stress showed small inverse adjusted associations with HPLP-II scores. Sensitivity analyses, including IPTW, a modified HPLP-II score excluding Health Responsibility, and a model excluding willingness to improve lifestyle, showed advice-seeking coefficients in the same positive direction. The exploratory stress-by-advice-seeking interaction was not statistically significant. Findings should be interpreted as associations rather than causal effects.
Keywords:
health-promoting lifestyle
; HPLP-II
; nursing students
; academic stress
; health-professional advice
; propensity score
; IPTW
; robust regression
1. Introduction
Undergraduate education overlaps with a developmental period in which many young adults negotiate new autonomy, social roles, health behaviors, and professional identity [1]. In nursing, this transition occurs within a professional program that combines theoretical coursework, examinations, clinical rotations, and early responsibility for patient-centered care [2,3,4]. These demands frequently coexist with irregular schedules, sleep disruption, financial strain, employment, and concern about clinical performance, factors repeatedly linked to stress, psychological distress, and inconsistent self-care among nursing students [3,5,6].
Health-promoting lifestyles refer to self-initiated behaviors intended to maintain or improve well-being and are central to Pender’s health promotion model [7,8,9]. The Health-Promoting Lifestyle Profile II (HPLP-II) operationalizes this construct through six dimensions: Health Responsibility, Nutrition, Physical Activity, Stress Management, Spiritual Growth, and Interpersonal Relations [8,10,11]. Nursing students are an important population for this construct because they are preparing to promote preventive behaviors while developing personal habits that are relevant to future professional role modeling [12,13,14].
International studies indicate that nursing students do not uniformly translate health-related knowledge into health-promoting lifestyle practices [12,15,16,17]. Physical activity, nutrition, rest, and stress-management behaviors are commonly reported as weaker areas, suggesting that health-related knowledge may coexist with less consistent health-promoting behavior under demanding educational conditions [13,18,19]. This pattern is relevant for nursing education because self-care is often discussed in relation to resilience, well-being, and the capacity to model health-promoting practices in clinical and community settings [14,18].
Academic stress is one of the most consistent contextual challenges reported in nursing education [3,4,5]. Systematic reviews and empirical studies link nursing-student stress to psychological well-being, coping, burnout, and academic or clinical performance concerns [2,6,20]. These findings support examining stress not only as an outcome of the educational environment but also as a potential correlate of health-promoting lifestyle behaviors [3,13,21].
Health-professional advice seeking and other forms of help-seeking may reflect or involve access to nutrition, psychological, medical, rehabilitation, or physical-activity guidance, but help-seeking is a staged and socially patterned behavior rather than a randomly assigned exposure [22,23]. Students who seek professional advice may differ from non-seekers in perceived need, motivation, health awareness, stigma, service availability, and access to resources, which makes crude comparisons vulnerable to self-selection and confounding [22,23,24]. Propensity score methods, including inverse probability of treatment weighting, can improve balance on observed covariates in observational studies, although they do not remove unmeasured confounding or justify causal interpretation in cross-sectional designs [24,25,26].
This study aimed to describe health-promoting lifestyles among undergraduate nursing students at CUCS, Universidad de Guadalajara; evaluate internal consistency, factorability, and exploratory dimensional evidence for the HPLP-II in this sample; identify empirical lifestyle profiles; and estimate adjusted cross-sectional associations of academic stress, health-professional advice seeking, health-information sources, and selected health behaviors with global HPLP-II scores [10,11,24,27]. A secondary aim was to explore whether the association between academic stress and HPLP-II scores differed by health-professional advice seeking, given the conceptual overlap between stress, support seeking, and self-care [6,22,28]. Because the study is cross-sectional, all inferential language is framed in terms of association rather than causation [25,29]. The moderation analysis is treated as exploratory and hypothesis-generating because detecting interaction effects in field studies is often statistically difficult [28].
2. Materials and Methods
2.1. Study Design and Setting
A cross-sectional observational study was conducted during the 2025 academic period at the Centro Universitario de Ciencias de la Salud (CUCS), Universidad de Guadalajara, Jalisco, Mexico, and the reporting structure followed STROBE recommendations for observational studies [29]. The exact Google Forms opening and closing dates were not retained in the de-identified analytic file. The target population comprised undergraduate students enrolled in the Bachelor of Science in Nursing program.
2.2. Participants and Sampling
The required sample size was calculated using OpenEpi for a finite population of 2,455 students, a 97% confidence level, and a 5% margin of error, yielding a minimum sample of 396 participants. This precision-based estimate assumed maximum variability for a descriptive proportion and was not intended as a formal power calculation for multivariable, factor-analytic, or interaction analyses. To increase precision, 506 complete analytic records were included. A semester-stratified recruitment strategy was used, with academic semester serving as the stratification variable. Because participation was voluntary through an electronic form and the de-identified analytic file did not retain invitation-tracking information, the number invited by stratum and the response rate could not be reconstructed; representativeness is therefore interpreted cautiously.
2.3. Data Collection
Data were collected electronically using Google Forms. The questionnaire included sociodemographic variables, behavioral variables, perceived academic stress, health-professional advice seeking, willingness to improve lifestyle, and the HPLP-II. Participation was voluntary.
2.4. Measures
2.4.1. Sociodemographic and Behavioral Variables
Students reported age, sex, current semester, employment status, weekly working hours, financial support, economic-support source, current residence, housing type, household composition, tobacco smoking, alcohol consumption, and main source of health information. Employment status was coded as study only or study and work. Weekly working hours were grouped as no work, flexible shift ( hours), part-time (24 hours), and full-time (48 hours). Economic-support source was grouped as none, parents, scholarship, or partner/family. Residence categories were Guadalajara, Zapopan, San Pedro Tlaquepaque, Tonalá, and other municipalities. Housing type was coded as owned, rented, or borrowed; household composition as family, alone, friends, or partner; and health-information source as social media, official websites, research articles, books, or other sources. Binary tobacco and alcohol indicators were used in the outcome model; ordinal frequency scores from the original response options were used in the propensity-score model.
2.4.2. Health-Professional Advice Seeking
Health-professional advice seeking was coded as a binary variable indicating whether the student currently sought self-care advice from health-related professionals, including physicians, nutritionists, psychologists, therapists, or physical trainers. This variable was conceptualized as a support-seeking behavior and not as a randomized intervention because help-seeking among students in the health professions depends on perceived need, attitudes, stigma, disclosure, and access to services [22,23]. The questionnaire did not record the specific type of professional consulted, so this measure represents broad health-professional support seeking rather than a specific advice or support modality. This heterogeneity may average domain-specific pathways, such as nutrition-oriented advice being more closely related to Nutrition scores and psychological support being more closely related to Stress Management scores.
2.4.3. Perceived Academic Stress and Willingness to Improve
Students rated perceived stress during active academic periods and vacation periods from 0 (no stress) to 10 (extreme stress). The vacation-period stress item used the same anchors and was included to distinguish stress during academic activity from stress during lower-demand periods. Willingness to improve lifestyle was self-rated from 0 (lowest willingness) to 10 (highest willingness). These single-item numerical ratings were used to reduce response burden in a questionnaire that also included the 52-item HPLP-II; they were analyzed as perceived ratings rather than as multidimensional psychometric scales.
2.4.4. Health-Promoting Lifestyle Profile II
Health-promoting lifestyles were measured using the Spanish-translated version of the Health-Promoting Lifestyle Profile II (HPLP-II), based on Pender’s health promotion model [7,8,30]. The instrument contains 52 items scored on a 4-point Likert scale from 1 (Never) to 4 (Routinely), and it includes six dimensions: Health Responsibility, Nutrition, Physical Activity, Stress Management, Spiritual Growth, and Interpersonal Relations [8,9,10]. Global and subscale scores were calculated as item means, yielding a range from 1.00 to 4.00 [11,15]. Because Spanish-language applications of the HPLP-II may vary across student populations, internal consistency, corrected item-total correlations, factorability, and exploratory dimensional structure were evaluated in this sample [10,11,27].
2.5. Statistical Analysis
Categorical variables were summarized as frequencies and percentages. Continuous variables were examined using Shapiro-Wilk tests and visual diagnostics [31]. Because age and HPLP-II scores were non-normally distributed, they were summarized using medians and interquartile ranges (IQR). Sex-based comparisons used Chi-square tests or Fisher’s exact tests for categorical variables and Wilcoxon rank-sum tests for continuous variables. Statistical significance was set at .
Psychometric analyses included Cronbach’s alpha, standardized alpha, corrected item-total correlations, Kaiser–Meyer–Olkin (KMO) factorability diagnostics, and Bartlett’s test of sphericity [32,33,34]. Principal component analysis (PCA) was used only as a descriptive eigenvalue check, whereas exploratory factor analysis (EFA) was used for latent-dimensional assessment with maximum likelihood extraction and promax oblique rotation, given the expected correlations among health-promoting lifestyle domains [35]. The six-factor EFA was specified to correspond to the theoretical HPLP-II domains rather than selected from the Kaiser criterion alone. Lifestyle profiles were identified using k-means clustering on the six HPLP-II subscale scores [36]. Before clustering, subscale scores were z-standardized to reduce the influence of differences in subscale variability. Candidate solutions from two to five clusters were fitted with 100 random starts and compared using average silhouette width; the final number of clusters was selected primarily by the largest average silhouette value, with interpretability of the resulting profiles considered secondarily. The selected solution was described using cluster centers, profile frequencies, and associations with health-professional advice seeking, information source, stress, and willingness to improve lifestyle [37].
The primary outcome was the global HPLP-II score. The primary multivariable model included health-professional advice seeking, the single-item perceived academic stress rating during the academic period, the single-item vacation-period stress rating, willingness to improve lifestyle, age, sex, semester, working hours, economic support, residence, housing type, household composition, health-information source, tobacco use, and alcohol use. Heteroskedasticity-consistent HC3 robust standard errors were used for inference [38,39]. Coefficients are interpreted as adjusted mean differences in HPLP-II scores associated with each covariate. Subscale-specific models used the same covariate structure, with Benjamini–Hochberg false-discovery-rate adjustment across key terms [40]. Two additional HC3 sensitivity models were conducted: one using a modified global HPLP-II score excluding the Health Responsibility subscale to address conceptual overlap with health-professional advice seeking, and one refitting the primary model without willingness to improve lifestyle because its temporal role could not be established in the cross-sectional design.
To evaluate the robustness of the health-professional advice association, a propensity score for health-professional advice seeking was estimated using observed covariates and applied through stabilized inverse probability of treatment weighting (IPTW) [24,25,26]. The propensity-score model included age, sex, semester, working-hours category, economic-support source, residence, housing type, household composition, health-information source, academic-period stress, vacation-period stress, willingness to improve lifestyle, tobacco frequency, and alcohol frequency. Weights were truncated at the 1st and 99th percentiles, and covariate balance was evaluated using standardized mean differences [26,41]. Weighted outcome models used HC3 robust sandwich standard errors to account for heteroskedasticity under weighting. Because including an estimated propensity score directly as a regression covariate can create bias under some conditions, IPTW was treated as the primary propensity-score sensitivity analysis rather than as the main outcome model [42]. Complete-case analysis was used for multivariable models; after recoding, all 506 analytic records had complete data for the primary model. A secondary logistic model examined low HPLP-II status, defined as scores at or below the empirical 25th percentile [43]. An interaction term between academic stress and health-professional advice seeking was added in a separate exploratory model. Because interaction tests often have lower statistical power and because this analysis was not the primary endpoint, the moderation results are interpreted cautiously [28].
2.6. Software
All analyses were conducted in R version 4.5.3 (2026-03-11). The R packages used in the reproducible pipeline were readxl 1.4.5, dplyr 1.2.1, tidyr 1.3.2, ggplot2 4.0.2, broom 1.0.12, sandwich 3.1-1, lmtest 0.9-40, cobalt 4.6.2, openxlsx 4.2.8.1, purrr 1.2.1, stringr 1.6.0, forcats 1.0.1, cluster 2.1.8.2, knitr 1.51, scales 1.4.0, and ggsci 4.2.0. The de-identified analytic dataset, R scripts, documentation, and reproducibility files are archived in Zenodo at 10.5281/zenodo.20382384; the all-versions DOI is 10.5281/zenodo.20382383.
3. Results
3.1. Sample Characteristics
The final sample included 506 undergraduate nursing students. Most participants were female (79.6%), reflecting the gender distribution commonly observed in nursing programs. The median age was 21.0 years (IQR: 20.0, 22.8), with no statistically significant sex-based difference in age ().
Employment status differed by sex (), with a higher proportion of male students combining study and work compared with female students (58.3% vs. 45.7%). Weekly working hours also differed by sex (), with full-time work reported by 21.4% of male students and 10.4% of female students. Financial support was more common among female students than male students (80.4% vs. 64.1%, ).
Current residence, health-professional advice seeking, tobacco smoking, and alcohol consumption did not differ significantly by sex. Overall, 26.7% of students reported seeking health-professional advice, 8.7% reported tobacco smoking, and 62.8% reported alcohol consumption. Full descriptive results for Table 1 are shown below, and a complete summary of all covariates used in the multivariable and propensity-score models is provided in Supplementary Table S0.
3.2. HPLP-II Scores
The overall median HPLP-II score was 2.40 (IQR: 2.06, 2.79) on the 1.00–4.00 scale. The highest median subscale scores were observed for Interpersonal Relations (2.78; IQR: 2.33, 3.11) and Spiritual Growth (2.67; IQR: 2.22, 3.22). The lowest median scores were observed for Stress Management (2.12; IQR: 1.75, 2.50) and Physical Activity (2.12; IQR: 1.75, 2.88). For visual comparison, Figure 1 displays subscale means and standard deviations, and the dashed reference line uses the overall mean (2.46), whereas the text and Table 2 emphasize medians and IQRs because score distributions were non-normal.
Global HPLP-II scores did not differ significantly by sex (). Most subscales also showed no statistically significant sex-based differences. Physical Activity was the exception, with male students reporting higher scores than female students (median 2.50 vs. 2.00; ). The HPLP-II score distribution by sex is summarized in Table 2.
3.3. Psychometric Properties
Internal consistency was high for the HPLP-II total score (Cronbach’s alpha = 0.961; standardized alpha = 0.961) and acceptable to high across subscales (alpha range: 0.812–0.900). Corrected item-total correlations supported the coherence of the global score and subscales, with median corrected item-total correlations of 0.557 for the total scale and 0.525–0.680 across subscales. Factorability diagnostics supported factor analysis (KMO = 0.954; Bartlett’s test , ). As a descriptive eigenvalue check, PCA identified nine components with eigenvalues greater than 1; the first six components explained 52.8% of total variance. The promax-rotated six-factor EFA was specified to correspond to the theoretical HPLP-II domains and retained as a descriptive dimensional check, but the exact fit test was statistically significant, indicating that the factor structure should be interpreted as exploratory rather than confirmatory. Full item and reliability results, ranked item means, PCA scree diagnostics, and promax EFA pattern loadings are provided in Supplementary Tables S1–S2, S5–S6, and Supplementary Figure S2. Because oblique pattern coefficients can occasionally exceed 1.0 when factors are correlated, the EFA loadings were interpreted descriptively and not as confirmatory validation evidence.
3.4. Empirical HPLP-II Profiles
A two-profile k-means solution based on z-standardized subscale scores was selected by average silhouette width (0.366; higher than 0.283 for the three-profile solution). The Low HPLP profile included 294 students (58.1%), with a mean global HPLP-II score of 2.10. The High HPLP profile included 212 students (41.9%), with a mean global HPLP-II score of 2.95. The profiles differed across all six dimensions, particularly Stress Management, Physical Activity, Health Responsibility, and Spiritual Growth (Figure 2). The z-standardized centers were uniformly negative for the Low HPLP profile and uniformly positive for the High HPLP profile, indicating a broad level separation across domains rather than sharply distinct qualitative patterns.
Health-professional advice seeking was more frequent in the High HPLP profile than in the Low HPLP profile (37.3% vs. 19.0%; , Cramer’s ). Profiles were also associated with health-information source (), academic stress (), vacation-period stress (), and willingness to improve lifestyle (). Mean academic stress was lower in the High HPLP profile than in the Low HPLP profile (7.55 vs. 7.97).
3.5. Primary Robust Multivariable Associations
The primary HC3 robust multivariable model explained 19.3% of the variance (adjusted ; robust Wald , ). Regression coefficients for the main substantive model terms are shown in Table 3. Health-professional advice seeking was associated with a higher global HPLP-II score (, 95% CI: 0.140, 0.344; ) after adjustment for sociodemographic, academic, behavioral, household, and information-source covariates.
The single-item perceived academic stress rating (, 95% CI: -0.061, -0.0005; ) and vacation-period stress rating (, 95% CI: -0.044, -0.001; ) showed small inverse adjusted associations with HPLP-II scores, with confidence intervals close to the null. Willingness to improve lifestyle was associated with higher scores (, 95% CI: 0.020, 0.077; ). Compared with social media as the reference source of health information, research articles (, ) and official websites (, ) were associated with higher HPLP-II scores. Tobacco use had a negative association with a confidence interval crossing the null (, ), and alcohol use was not associated with the global score ().
3.6. Robust and Sensitivity Analyses
Low HPLP-II status was defined as a global score at or below the empirical 25th percentile (), corresponding to 132 students (26.1%) because nine students had scores tied at the threshold value. In the robust logistic model, health-professional advice seeking was associated with lower odds of low HPLP-II status (OR = 0.49, 95% CI: 0.27, 0.88; ), while vacation-period stress was associated with higher odds (OR = 1.21, 95% CI: 1.08, 1.35; ). Research articles as a health-information source were also associated with lower odds of low HPLP-II status relative to social media (OR = 0.30, 95% CI: 0.13, 0.72; ). Tobacco and alcohol use were not significantly associated with low HPLP-II status in this model.
The IPTW sensitivity analysis reduced observed covariate imbalance for health-professional advice seeking. Across the 32 displayed covariate rows, the maximum absolute standardized mean difference decreased from 0.376 before weighting to 0.101 after truncated stabilized weighting, with one covariate remaining only marginally above the conventional 0.10 threshold (Figure 3). Propensity-score distributions suggested acceptable overlap between advice-seeking groups, although positivity and unmeasured confounding remain assumptions. The effective sample size after truncated weighting was 445.6. In the IPTW marginal weighted model, health-professional advice seeking remained associated with higher global HPLP-II scores (, 95% CI: 0.118, 0.339; ). In the IPTW model additionally adjusted for stress and willingness to improve lifestyle, the health-professional advice association was similar (, 95% CI: 0.126, 0.338; ).
Two additional HC3 sensitivity models addressed potential construct overlap and covariate specification. When the Health Responsibility subscale was excluded from the global HPLP-II score, health-professional advice seeking retained a positive adjusted coefficient (, 95% CI: 0.114, 0.320; ). When willingness to improve lifestyle was removed from the primary model, the advice-seeking coefficient also remained positive (, 95% CI: 0.169, 0.375; ). Detailed propensity-score distribution, balance diagnostics, overlap plots, subscale-specific models, item-level results, and these additional sensitivity models are provided in the Supplementary Material.
3.7. Exploratory Interaction Analysis
An exploratory interaction model was fitted to examine whether the association between academic stress and global HPLP-II score differed by health-professional advice seeking status. The interaction coefficient for health-professional advice seeking by academic stress was positive but not statistically significant (, ). This result does not provide evidence of statistical moderation at the prespecified threshold.
The model-based visualization is provided in Supplementary Figure S5 for hypothesis generation only. A cautious interpretation is that students who reported health-professional advice seeking had higher model-estimated mean HPLP-II scores overall, particularly across the mid-to-high academic-stress range, although the difference in slopes by advice-seeking status was statistically uncertain.
4. Discussion
This study describes health-promoting lifestyles among undergraduate nursing students, evaluates the HPLP-II in this sample, and estimates adjusted cross-sectional associations of academic stress, health-professional advice seeking, and selected health behaviors with global HPLP-II scores. Six findings are most relevant. First, the HPLP-II showed high internal consistency, although the exploratory factor results indicate that dimensional structure should not be treated as confirmatory evidence. Second, the overall HPLP-II profile was generally moderate to low, with Stress Management and Physical Activity showing the lowest scores. Third, two sample-derived k-means profiles were identified, and the High HPLP profile had more frequent health-professional advice seeking, lower stress, and greater willingness to improve lifestyle. Fourth, health-professional advice seeking was associated with higher global HPLP-II scores in the primary robust model and in IPTW sensitivity analysis. Fifth, this advice-seeking association remained positive in additional models excluding the Health Responsibility subscale from the outcome and excluding willingness to improve lifestyle from the covariate set. Sixth, academic stress and vacation-period stress showed small inverse adjusted associations with global HPLP-II scores, whereas tobacco use had a negative association with a confidence interval crossing the null after robust adjustment. The exploratory interaction between academic stress and health-professional advice seeking was not statistically significant.
The descriptive HPLP-II pattern is consistent with prior research indicating that nursing students frequently report incomplete adoption of health-promoting behaviors despite their professional training in health promotion [12,13,15,16,17]. The relatively higher scores in Interpersonal Relations and Spiritual Growth may reflect the importance of social ties, family support, peer connection, and meaning-making as coping resources during professional education [12,16,18]. In contrast, lower scores in Stress Management and Physical Activity are compatible with the time constraints, clinical demands, and academic pressure described in nursing education literature [2,3,4].
The sex-based difference in Physical Activity is noteworthy. Although the global lifestyle score and most subscales did not differ by sex, male students reported higher Physical Activity scores. This finding may reflect differences in time availability, cultural norms, safety perceptions, access to exercise facilities, domestic responsibilities, or preferences for exercise modalities. The present analysis cannot determine the source of the difference, but it may warrant attention to barriers that could differ by sex and social context when designing physical-activity promotion strategies for nursing students.
The association between health-professional advice seeking and higher HPLP-II scores was consistent in the primary robust model and in the IPTW sensitivity analysis after weighting reduced observed covariate imbalance. This finding should be interpreted carefully. HPLP-II Health Responsibility includes items related to reporting symptoms, asking health professionals questions, discussing health concerns, and seeking guidance, so the exposure and global outcome may conceptually overlap. However, the advice-seeking coefficient remained positive when the Health Responsibility subscale was excluded from the global score, suggesting that the association was not limited to those overlapping items. This pattern is compatible with, but does not establish, greater reported access to health-related guidance, reinforcement, or self-care resources among students who seek health-professional advice. It may also reflect unmeasured differences between students who seek advice and those who do not, including health awareness, family resources, prior health concerns, personality traits, or access to services. Propensity-score weighting helps adjust for observed covariates but does not transform this cross-sectional analysis into a causal design [24,25]. Therefore, the result supports an association between advice seeking and healthier lifestyle scores, not an estimated causal effect of professional advice.
The single-item perceived academic stress rating showed an inverse association with global HPLP-II score. This aligns with literature in which stress in nursing education has been reported alongside poorer coping, burnout symptoms, reduced rest, and less consistent self-care [20]. However, the directionality cannot be determined. Higher stress may coincide with lower engagement in healthy behaviors, but students with fewer self-care resources may also experience academic demands as more stressful. Longitudinal data would be needed to clarify temporal ordering and estimate within-person changes over time.
The exploratory moderation analysis should not be overinterpreted. Students who reported health-professional advice seeking had higher model-estimated mean HPLP-II scores overall, particularly across mid-to-high academic-stress levels, but the stress-by-advice-seeking interaction was not statistically significant. Consequently, the findings do not support a claim that the stress-HPLP-II association differs by health-professional advice-seeking status in this sample. At most, the visual pattern can inform hypotheses for future studies with longitudinal designs, clearer exposure definitions, and greater power to test interaction effects.
4.1. Strengths
This study has several strengths. It used a relatively large sample of undergraduate nursing students, analyzed the HPLP-II as a continuous scale, evaluated reliability and exploratory structure in the analytic sample, and used HC3 robust standard errors for the primary model. It also used profile analysis to summarize multidimensional lifestyle patterns and IPTW as a propensity-score sensitivity analysis for health-professional advice seeking. Finally, it distinguishes primary adjusted associations from exploratory interaction analyses, reducing the risk of overstating moderation findings.
4.2. Limitations
The main limitation is the cross-sectional design, which precludes causal inference and assessment of temporal ordering. Participation was voluntary through an electronic questionnaire, and invitation counts and response rates by semester could not be reconstructed from the de-identified analytic file; therefore, self-selection and incomplete representativeness remain possible. All measures were self-reported, which may introduce recall bias and social desirability bias. Perceived academic stress, vacation-period stress, and willingness to improve lifestyle were measured with single-item numerical ratings, which reduces respondent burden but limits content validity and does not capture the multidimensional structure that validated multi-item stress or motivation scales could provide. Willingness to improve lifestyle is temporally ambiguous in this design and may function as a prior motivational factor, a correlate of advice seeking, or a marker closely related to the outcome; the sensitivity model excluding this covariate partially addresses, but does not eliminate, this concern. Health-professional advice seeking was measured as a broad binary variable and did not capture type, duration, frequency, quality, or purpose of advice seeking; consequently, it may combine heterogeneous pathways such as nutrition or exercise guidance, medical advice, and psychological or therapeutic support, potentially diluting or obscuring subscale-specific associations. In addition, advice seeking may overlap conceptually with HPLP-II Health Responsibility items; the modified-score sensitivity analysis reduces this concern but cannot remove all construct-related overlap. The propensity score adjusted only for measured covariates and cannot account for unobserved confounding. The model explained a modest proportion of HPLP-II variance, indicating that other individual, institutional, and contextual factors are likely related to students’ health-promoting behaviors. The factor analysis was exploratory, and the significant exact fit test indicates that the six-dimensional structure should be used descriptively rather than as definitive construct validation in this sample. The k-means profiles are data-driven, primarily separated lower versus higher levels across domains, and require external validation before being used for classification or screening. The interaction analysis was exploratory and non-significant. Finally, results come from a single university setting and may not generalize to all nursing students or institutions.
4.3. Implications for Nursing Education
The findings are consistent with the relevance of considering student wellness as part of professional formation, not only as an individual responsibility. Institutional attention to access to mental health care, nutrition advice, physical-activity opportunities, and stress-management resources may be relevant components of institutional wellness strategies and should be evaluated prospectively. However, the present results should be used to motivate further evaluation and institutional planning, not as evidence that a specific advice or support service is effective.
5. Conclusions
Undergraduate nursing students in this sample reported generally moderate to low health-promoting lifestyles, with the lowest scores in Stress Management and Physical Activity. The HPLP-II showed high internal consistency, and two sample-derived k-means profiles descriptively separated students with broadly lower versus higher health-promoting behaviors. Higher perceived academic and vacation-period stress ratings showed small inverse adjusted associations with global HPLP-II scores, while health-professional advice seeking showed positive adjusted associations in robust, IPTW, and additional sensitivity analyses. The exploratory interaction between academic stress and health-professional advice seeking was not statistically significant, so the study does not provide evidence that the stress-HPLP-II association differs by advice-seeking status. Future longitudinal studies are needed to evaluate whether structured institutional support precedes changes in health-promoting behaviors, and intervention studies would be required to test effectiveness.
Supplementary Materials
The following supporting information can be downloaded at the website of this paper posted on Preprints.org: complete analytic covariate summary, variable and HPLP-II item map, reliability tables, EFA pattern loadings, k-means diagnostics, subscale-specific robust models, propensity-score diagnostics, additional sensitivity models, propensity-score overlap plots, PCA scree plot, ranked HPLP-II item means, subscale coefficient figures, and the exploratory interaction visualization.
Author Contributions
Conceptualization, A.E.S.S., C.A.Z.F. and J.B.-R.; methodology, J.B.-R., G.L.H. and C.A.Z.F.; software, J.B.-R.; validation, A.E.S.S., G.L.H., V.H.O.C., J.A.M.G., J.B.-R. and C.A.Z.F.; formal analysis, J.B.-R.; investigation, A.E.S.S., J.A.M.G. and C.A.Z.F.; resources, C.A.Z.F. and G.L.H.; data curation, A.E.S.S. and J.B.-R.; writing—original draft preparation, A.E.S.S. and J.B.-R.; writing—review and editing, A.E.S.S., G.L.H., V.H.O.C., J.A.M.G., J.B.-R. and C.A.Z.F.; visualization, J.B.-R.; supervision, G.L.H., V.H.O.C., J.B.-R. and C.A.Z.F.; project administration, C.A.Z.F. All authors have read and agreed to the published version of the manuscript.
Funding
This research received no external funding.
Institutional Review Board Statement
The study was conducted in accordance with the Declaration of Helsinki and approved by the Research Committee, Research Ethics Committee, and Biosafety Committee of the Centro Universitario de Ciencias de la Salud (CUCS), Universidad de Guadalajara. The official evaluation report was issued by the Academic Secretariat/Research Coordination under reference CUCS/CINV/0079/25, registration number 25-62, and approval report number CI-03925. The Research Committee and Research Ethics Committee approved the protocol in a joint ordinary session held on 8 May 2025, and the Biosafety Committee approved it in an ordinary session held on 5 May 2025; the final approval report was issued in Guadalajara, Jalisco, Mexico, on 16 May 2025.
Informed Consent Statement
Informed consent was obtained from all subjects involved in the study.
Data Availability Statement
The de-identified analytic dataset, R analysis code, documentation, and supporting reproducibility files are publicly available in Zenodo at 10.5281/zenodo.20382384. The all-versions DOI for the Zenodo record is 10.5281/zenodo.20382383. Raw identifiable or potentially identifiable data are not publicly available due to participant-confidentiality and institutional restrictions.
Acknowledgments
The authors thank the Specialty in Public Health Nursing and the Department of Nursing at CUCS, Universidad de Guadalajara, for logistical support, and the undergraduate nursing students who voluntarily participated in the study.
Conflicts of Interest
The authors declare no conflicts of interest.
Abbreviations
The following abbreviations are used in this manuscript:
| CUCS | Centro Universitario de Ciencias de la Salud |
| EFA | Exploratory factor analysis |
| HC3 | Heteroskedasticity-consistent standard errors, type 3 |
| HPLP-II | Health-Promoting Lifestyle Profile II |
| IPTW | Inverse probability of treatment weighting |
| IQR | Interquartile range |
| KMO | Kaiser–Meyer–Olkin |
| PCA | Principal component analysis |
References
- Arnett, J.J. Emerging adulthood: A theory of development from the late teens through the twenties. Am. Psychol. 2000, 55, 469–480. [Google Scholar] [CrossRef]
- Chernomas, W.M.; Shapiro, C. Stress, depression, and anxiety among undergraduate nursing students. Int. J. Nurs. Educ. Scholarsh. 2013, 10, 255–266. [Google Scholar] [CrossRef]
- Pulido-Martos, M.; Augusto-Landa, J.M.; López-Zafra, E. Sources of stress in nursing students: a systematic review of quantitative studies. Int. Nurs. Rev. 2012, 59, 15–25. [Google Scholar] [CrossRef]
- Labrague, L.J. Umbrella review: Stress levels, sources of stress, and coping mechanisms among student nurses. Nurs. Rep. 2024, 14, 362–375. [Google Scholar] [CrossRef] [PubMed]
- Vo, N.T.; Chiu, H.Y.; Chuang, Y.H.; Huang, H.C. Prevalence of stress and anxiety among nursing students: A systematic review and meta-analysis. Nurse Educ. 2023, 48, E90–E95. [Google Scholar] [CrossRef]
- Li, Z.S.; Hasson, F. Resilience, stress, and psychological well-being in nursing students: A systematic review. Nurse Educ. Today 2020, 90, 104440. [Google Scholar] [CrossRef] [PubMed]
- Pender, N.J.; Murdaugh, C.L.; Parsons, M.A. Health Promotion in Nursing Practice, 7th ed.; Pearson: Boston, MA, 2015. [Google Scholar]
- Walker, S.N.; Sechrist, K.R.; Pender, N.J. The Health-Promoting Lifestyle Profile: Development and psychometric characteristics. Nurs. Res. 1987, 36, 76–81. [Google Scholar] [CrossRef]
- Kuan, G.; Kueh, Y.C.; Abdullah, N.; Tai, E.L.M. Psychometric properties of the health-promoting lifestyle profile II: cross-cultural validation of the Malay language version. BMC Public Health 2019, 19. [Google Scholar] [CrossRef] [PubMed]
- Pérez-Fortis, A.; Ulla Díez, S.M.; Padilla, J.L. Psychometric properties of the Spanish version of the Health-Promoting Lifestyle Profile II. Res. Nurs. Health 2012, 35, 301–313. [Google Scholar] [CrossRef] [PubMed]
- Zambrano Bermeo, R.N.; Estrada Gonzalez, C.; Herrera Guerra, E. Reliability and Validity of the Health-Promoting Lifestyle Profile II Spanish Version in University Students. Healthcare 2024, 12, 1330. [Google Scholar] [CrossRef]
- Mak, Y.W.; Kao, A.H.F.; Tam, L.W.Y. Health-promoting lifestyle and quality of life among Chinese nursing students. Prim. Health Care Res. Dev. 2018, 19, 629–636. [Google Scholar] [CrossRef] [PubMed]
- Hwang, Y.H.; Oh, J. Factors affecting health-promoting behaviors among nursing students. Int. J. Environ. Res. Public Health 2020, 17, 6291. [Google Scholar] [CrossRef]
- Stanulewicz, N.; Knox, E.; Narayanasamy, M.; Shivji, N.; Khunti, K.; Blake, H. Effectiveness of lifestyle health promotion interventions for nurses: A systematic review. Int. J. Environ. Res. Public Health 2020, 17, 17. [Google Scholar] [CrossRef]
- Al-Kandari, F.; Vidal, V.L.; Thomas, D.S. Health-promoting lifestyle and body mass index among College of Nursing students in Kuwait. Nurs. Health Sci. 2008, 10, 43–50. [Google Scholar] [CrossRef]
- Chow, S.K.Y.; Lam, K.M.; Lie, S.H. Do demographic factors and a health-promoting lifestyle influence the self-rated health of college nursing students? BMC Nurs. 2018, 17, 50. [Google Scholar] [CrossRef]
- Gurusamy, J.; Amudhan, S.; Veerabhadraiah, K.B.; Palaniappan, M. Health-promoting behaviours, their relationships and correlates in nursing students: Implications for nursing education and practice. J. Prof. Nurs. 2022, 39, 69–75. [Google Scholar] [CrossRef]
- Slemon, A.; Jenkins, E.; Bailey, E. Enhancing conceptual clarity of self-care for nursing students: A scoping review. Nurse Educ. Pract. 2021, 55, 103178. [Google Scholar] [CrossRef]
- Gawlik, K.S.; Teall, A.M.; Zeno, R.; Newtz, C.; Conrad, K.; Kolcun, K.; Bobek, H.; Deerhake, A.; Sullivan, K.; Rengers, B.; et al. Integrating wellness into curricula using the ten dimensions of wellness as a framework. J. Prof. Nurs. 2024, 50, 73–82. [Google Scholar] [CrossRef]
- Gibbons, C.; Dempster, M.; Moutray, M. Stress, coping and burn-out in nursing students. Int. J. Nurs. Stud. 2010, 47, 1299–1309. [Google Scholar] [CrossRef] [PubMed]
- Berdida, D.J.E.; Grande, R.A.N. Academic stress, COVID-19 anxiety, and quality of life among nursing students: The mediating role of resilience. Int. Nurs. Rev. 2022, 70, 34–42. [Google Scholar] [CrossRef] [PubMed]
- Bamine, V.; Tanaka, K. Help-seeking in nursing and medical students: A concept analysis. J. Res. Nurs. 2025, 30, 125–138. [Google Scholar] [CrossRef]
- Alqhtani, S.S.; Aldhafeeri, N.A.; Alotaibi, L.; Alanzi, H.; Alshamrani, W.; Alqhtani, N.; Selim, A. Nursing students’ attitudes and intentions towards seeking professional psychological help: The mediating role of emotional intelligence. BMC Psychol. 2025, 13, 144. [Google Scholar] [CrossRef] [PubMed]
- Austin, P.C. An introduction to propensity score methods for reducing the effects of confounding in observational studies. Multivar. Behav. Res. 2011, 46, 399–424. [Google Scholar] [CrossRef]
- Rosenbaum, P.R.; Rubin, D.B. The central role of the propensity score in observational studies for causal effects. Biometrika 1983, 70, 41–55. [Google Scholar] [CrossRef]
- Austin, P.C.; Stuart, E.A. Moving towards best practice when using inverse probability of treatment weighting using the propensity score to estimate causal treatment effects in observational studies. Stat. Med. 2015, 34, 3661–3679. [Google Scholar] [CrossRef] [PubMed]
- Enríquez Reyna, M.C.; Peche Alejandro, P.; Ibarra González, Á.D. Propiedades psicométricas de la versión en español del instrumento Health-Promoting Lifestyle Profile-II en universitarios mexicanos. Enfermería Glob. 2022, 21, 398–423. [Google Scholar] [CrossRef]
- McClelland, G.H.; Judd, C.M. Statistical difficulties of detecting interactions and moderator effects. Psychol. Bull. 1993, 114, 376–390. [Google Scholar] [CrossRef]
- von Elm, E.; Altman, D.G.; Egger, M.; Pocock, S.J.; Gøtzsche, P.C.; Vandenbroucke, J.P. The Strengthening the Reporting of Observational Studies in Epidemiology (STROBE) statement: Guidelines for reporting observational studies. PLoS Med. 2007, 4, e296. [Google Scholar] [CrossRef]
- Walker, S.N.; Sechrist, K.R.; Pender, N.J. Health Promotion Model–Instruments to Measure Health Promoting Lifestyle: Health-Promoting Lifestyle Profile [HPLP II] (Adult Version); Technical report; University of Michigan: Ann Arbor, MI, 1995. [Google Scholar]
- Shapiro, S.S.; Wilk, M.B. An analysis of variance test for normality (complete samples). Biometrika 1965, 52, 591–611. [Google Scholar] [CrossRef]
- Cronbach, L.J. Coefficient alpha and the internal structure of tests. Psychometrika 1951, 16, 297–334. [Google Scholar] [CrossRef]
- Kaiser, H.F.; Rice, J. Little Jiffy, Mark IV. Educ. Psychol. Meas. 1974, 34, 111–117. [Google Scholar] [CrossRef]
- Bartlett, M.S. Tests of significance in factor analysis. Br. J. Stat. Psychol. 1950, 3, 77–85. [Google Scholar] [CrossRef]
- Fabrigar, L.R.; Wegener, D.T.; MacCallum, R.C.; Strahan, E.J. Evaluating the use of exploratory factor analysis in psychological research. Psychol. Methods 1999, 4, 272–299. [Google Scholar] [CrossRef]
- Lloyd, S. Least squares quantization in PCM. IEEE Trans. Inf. Theory 1982, 28, 129–137. [Google Scholar] [CrossRef]
- Rousseeuw, P.J. Silhouettes: A graphical aid to the interpretation and validation of cluster analysis. J. Comput. Appl. Math. 1987, 20, 53–65. [Google Scholar] [CrossRef]
- MacKinnon, J.G.; White, H. Some heteroskedasticity-consistent covariance matrix estimators with improved finite sample properties. J. Econom. 1985, 29, 305–325. [Google Scholar] [CrossRef]
- Hayes, A.F.; Cai, L. Using heteroskedasticity-consistent standard error estimators in OLS regression: An introduction and software implementation. Behav. Res. Methods 2007, 39, 709–722. [Google Scholar] [CrossRef]
- Benjamini, Y.; Hochberg, Y. Controlling the false discovery rate: A practical and powerful approach to multiple testing. J. R. Stat. Soc. Ser. B 1995, 57, 289–300. [Google Scholar] [CrossRef]
- Austin, P.C. Balance diagnostics for comparing the distribution of baseline covariates between treatment groups in propensity-score matched samples. Stat. Med. 2009, 28, 3083–3107. [Google Scholar] [CrossRef]
- Hade, E.M.; Lu, B. Bias associated with using the estimated propensity score as a regression covariate. Stat. Med. 2013, 33, 74–87. [Google Scholar] [CrossRef] [PubMed]
- Hosmer, D.W.; Lemeshow, S.; Sturdivant, R.X. Applied Logistic Regression, 3 ed.; Wiley, 2013. [Google Scholar] [CrossRef]
Figure 1.
HPLP-II dimension scores of undergraduate nursing students (). Bars show subscale means and error bars show one standard deviation. The dashed line represents the overall HPLP-II mean (2.46) as a visual reference; medians and interquartile ranges are reported in the text and Table 2 because score distributions were non-normal.
Figure 1.
HPLP-II dimension scores of undergraduate nursing students (). Bars show subscale means and error bars show one standard deviation. The dashed line represents the overall HPLP-II mean (2.46) as a visual reference; medians and interquartile ranges are reported in the text and Table 2 because score distributions were non-normal.
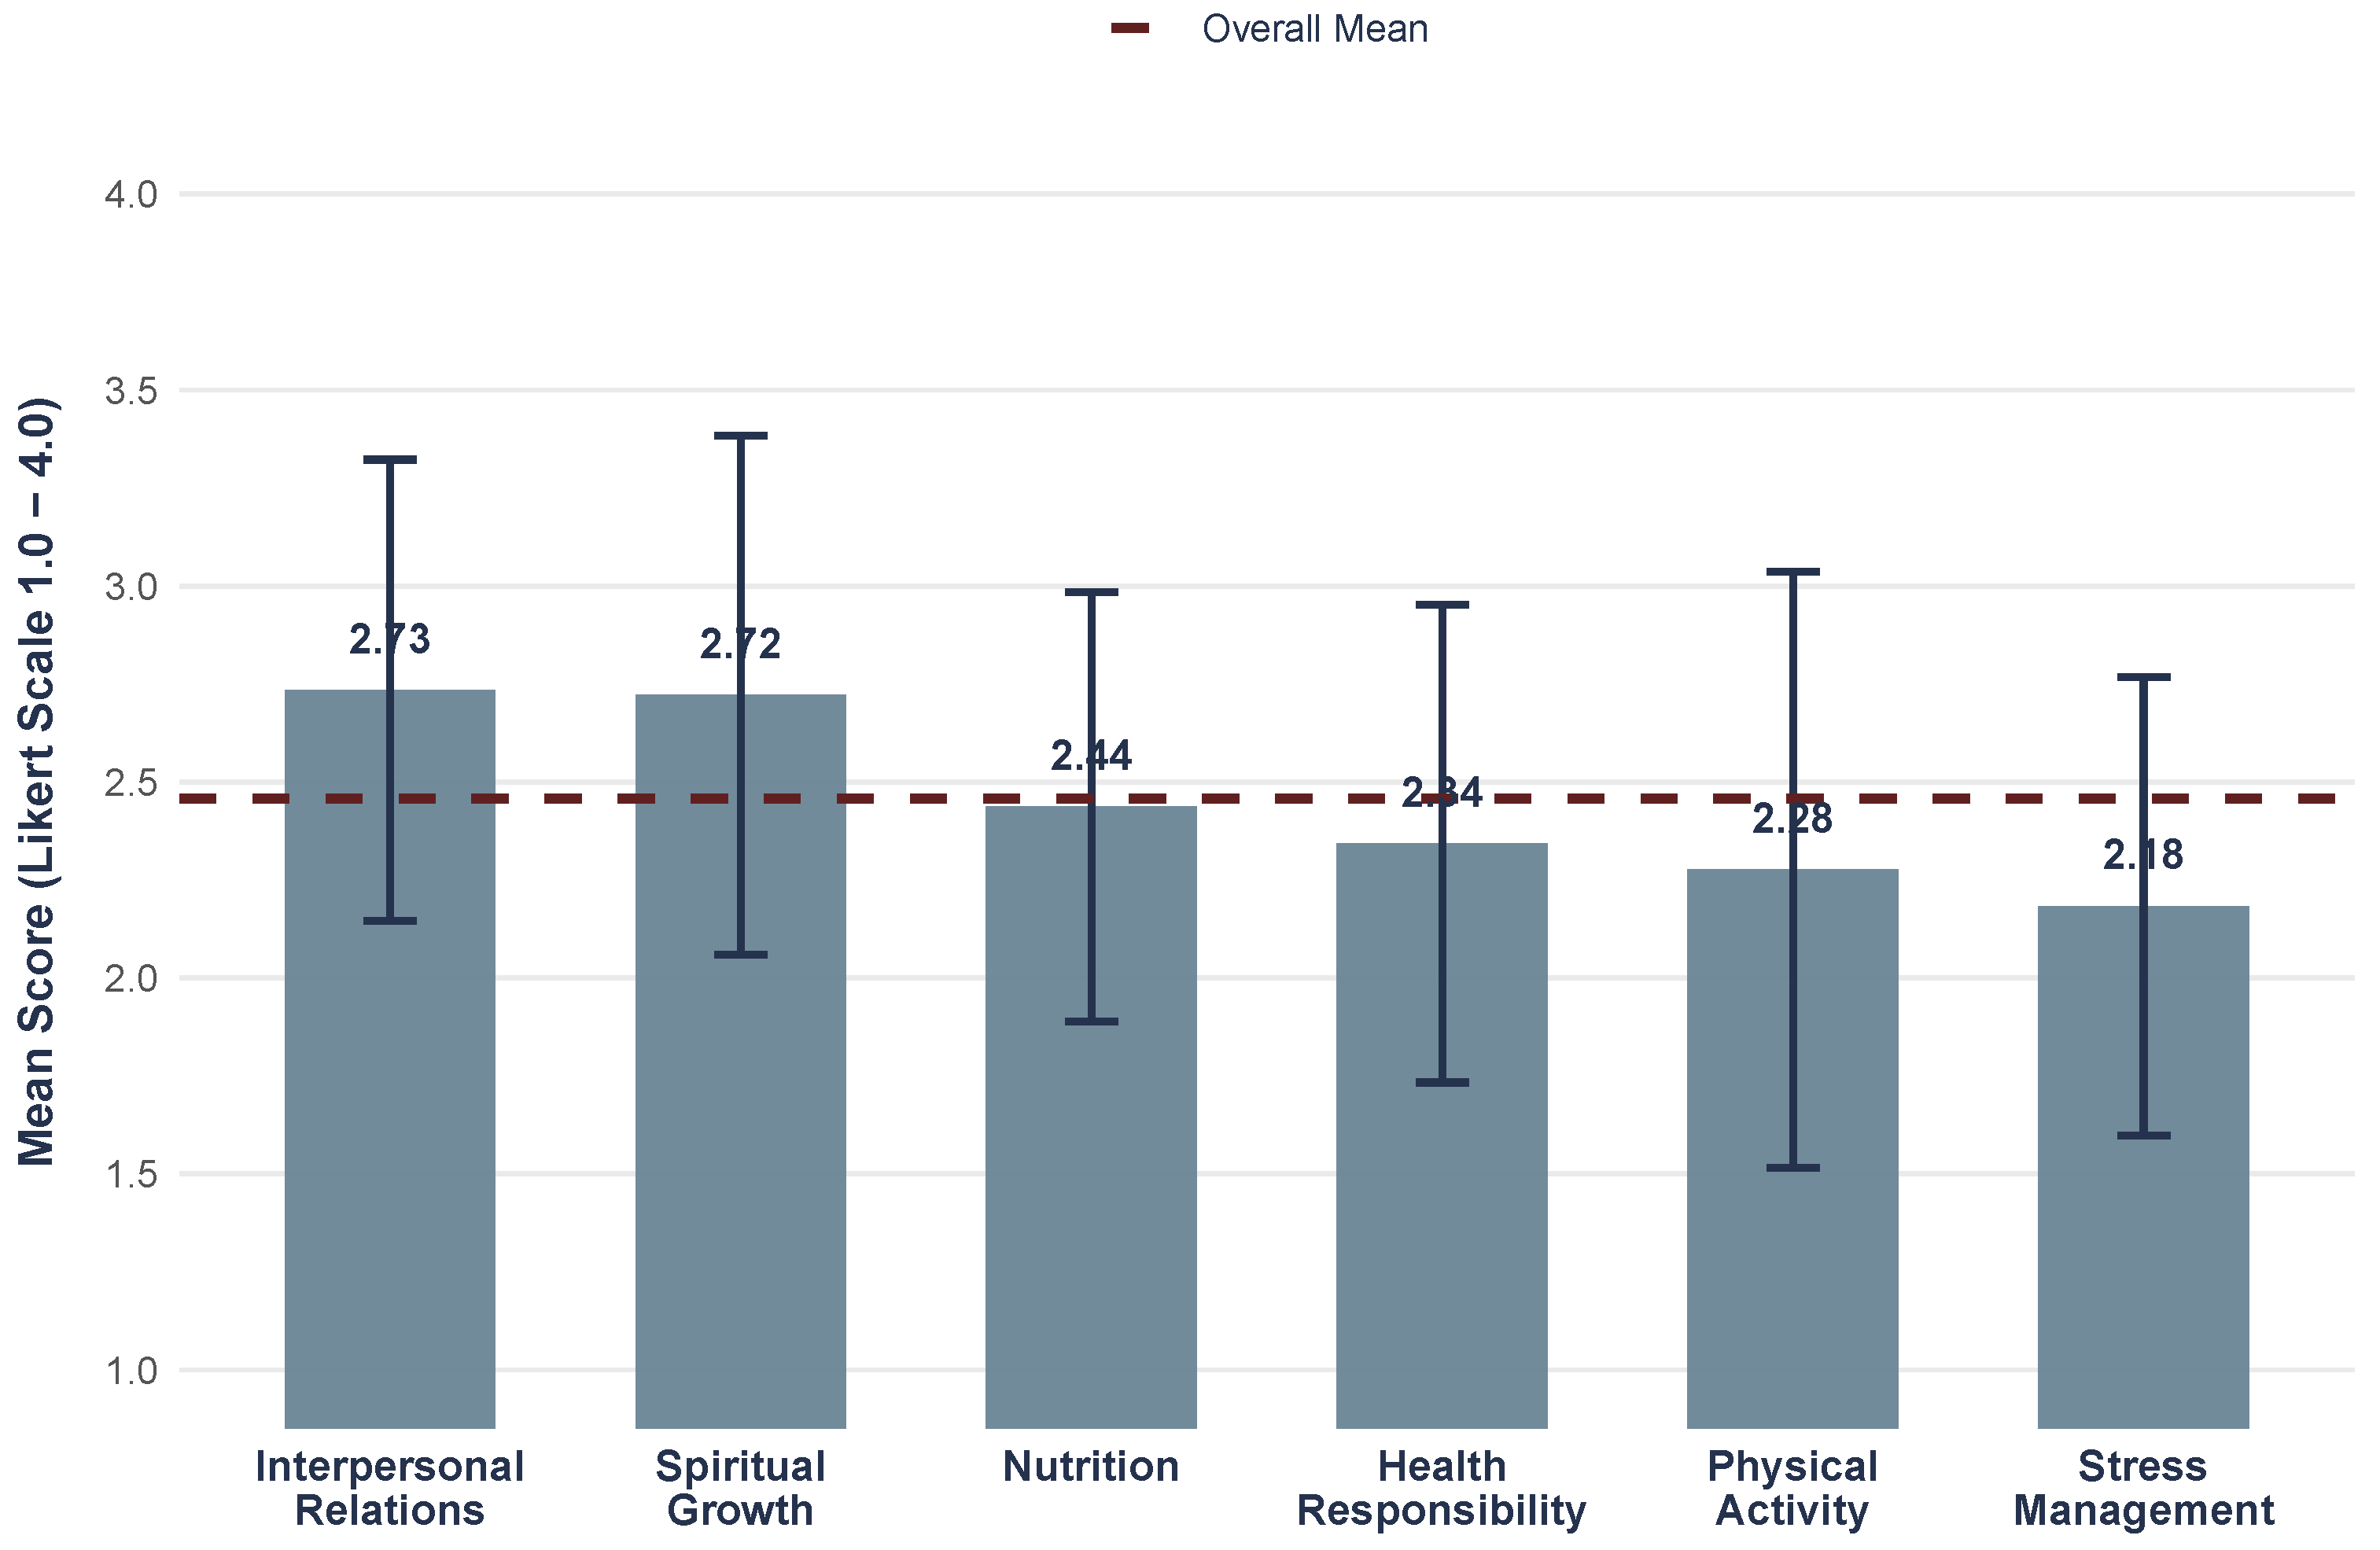
Figure 2.
Empirical HPLP-II lifestyle profiles based on the six subscale scores (). Clusters were derived from z-standardized subscale scores; plotted values show raw 1.00–4.00 subscale medians and interquartile ranges (25th–75th percentiles).
Figure 2.
Empirical HPLP-II lifestyle profiles based on the six subscale scores (). Clusters were derived from z-standardized subscale scores; plotted values show raw 1.00–4.00 subscale medians and interquartile ranges (25th–75th percentiles).
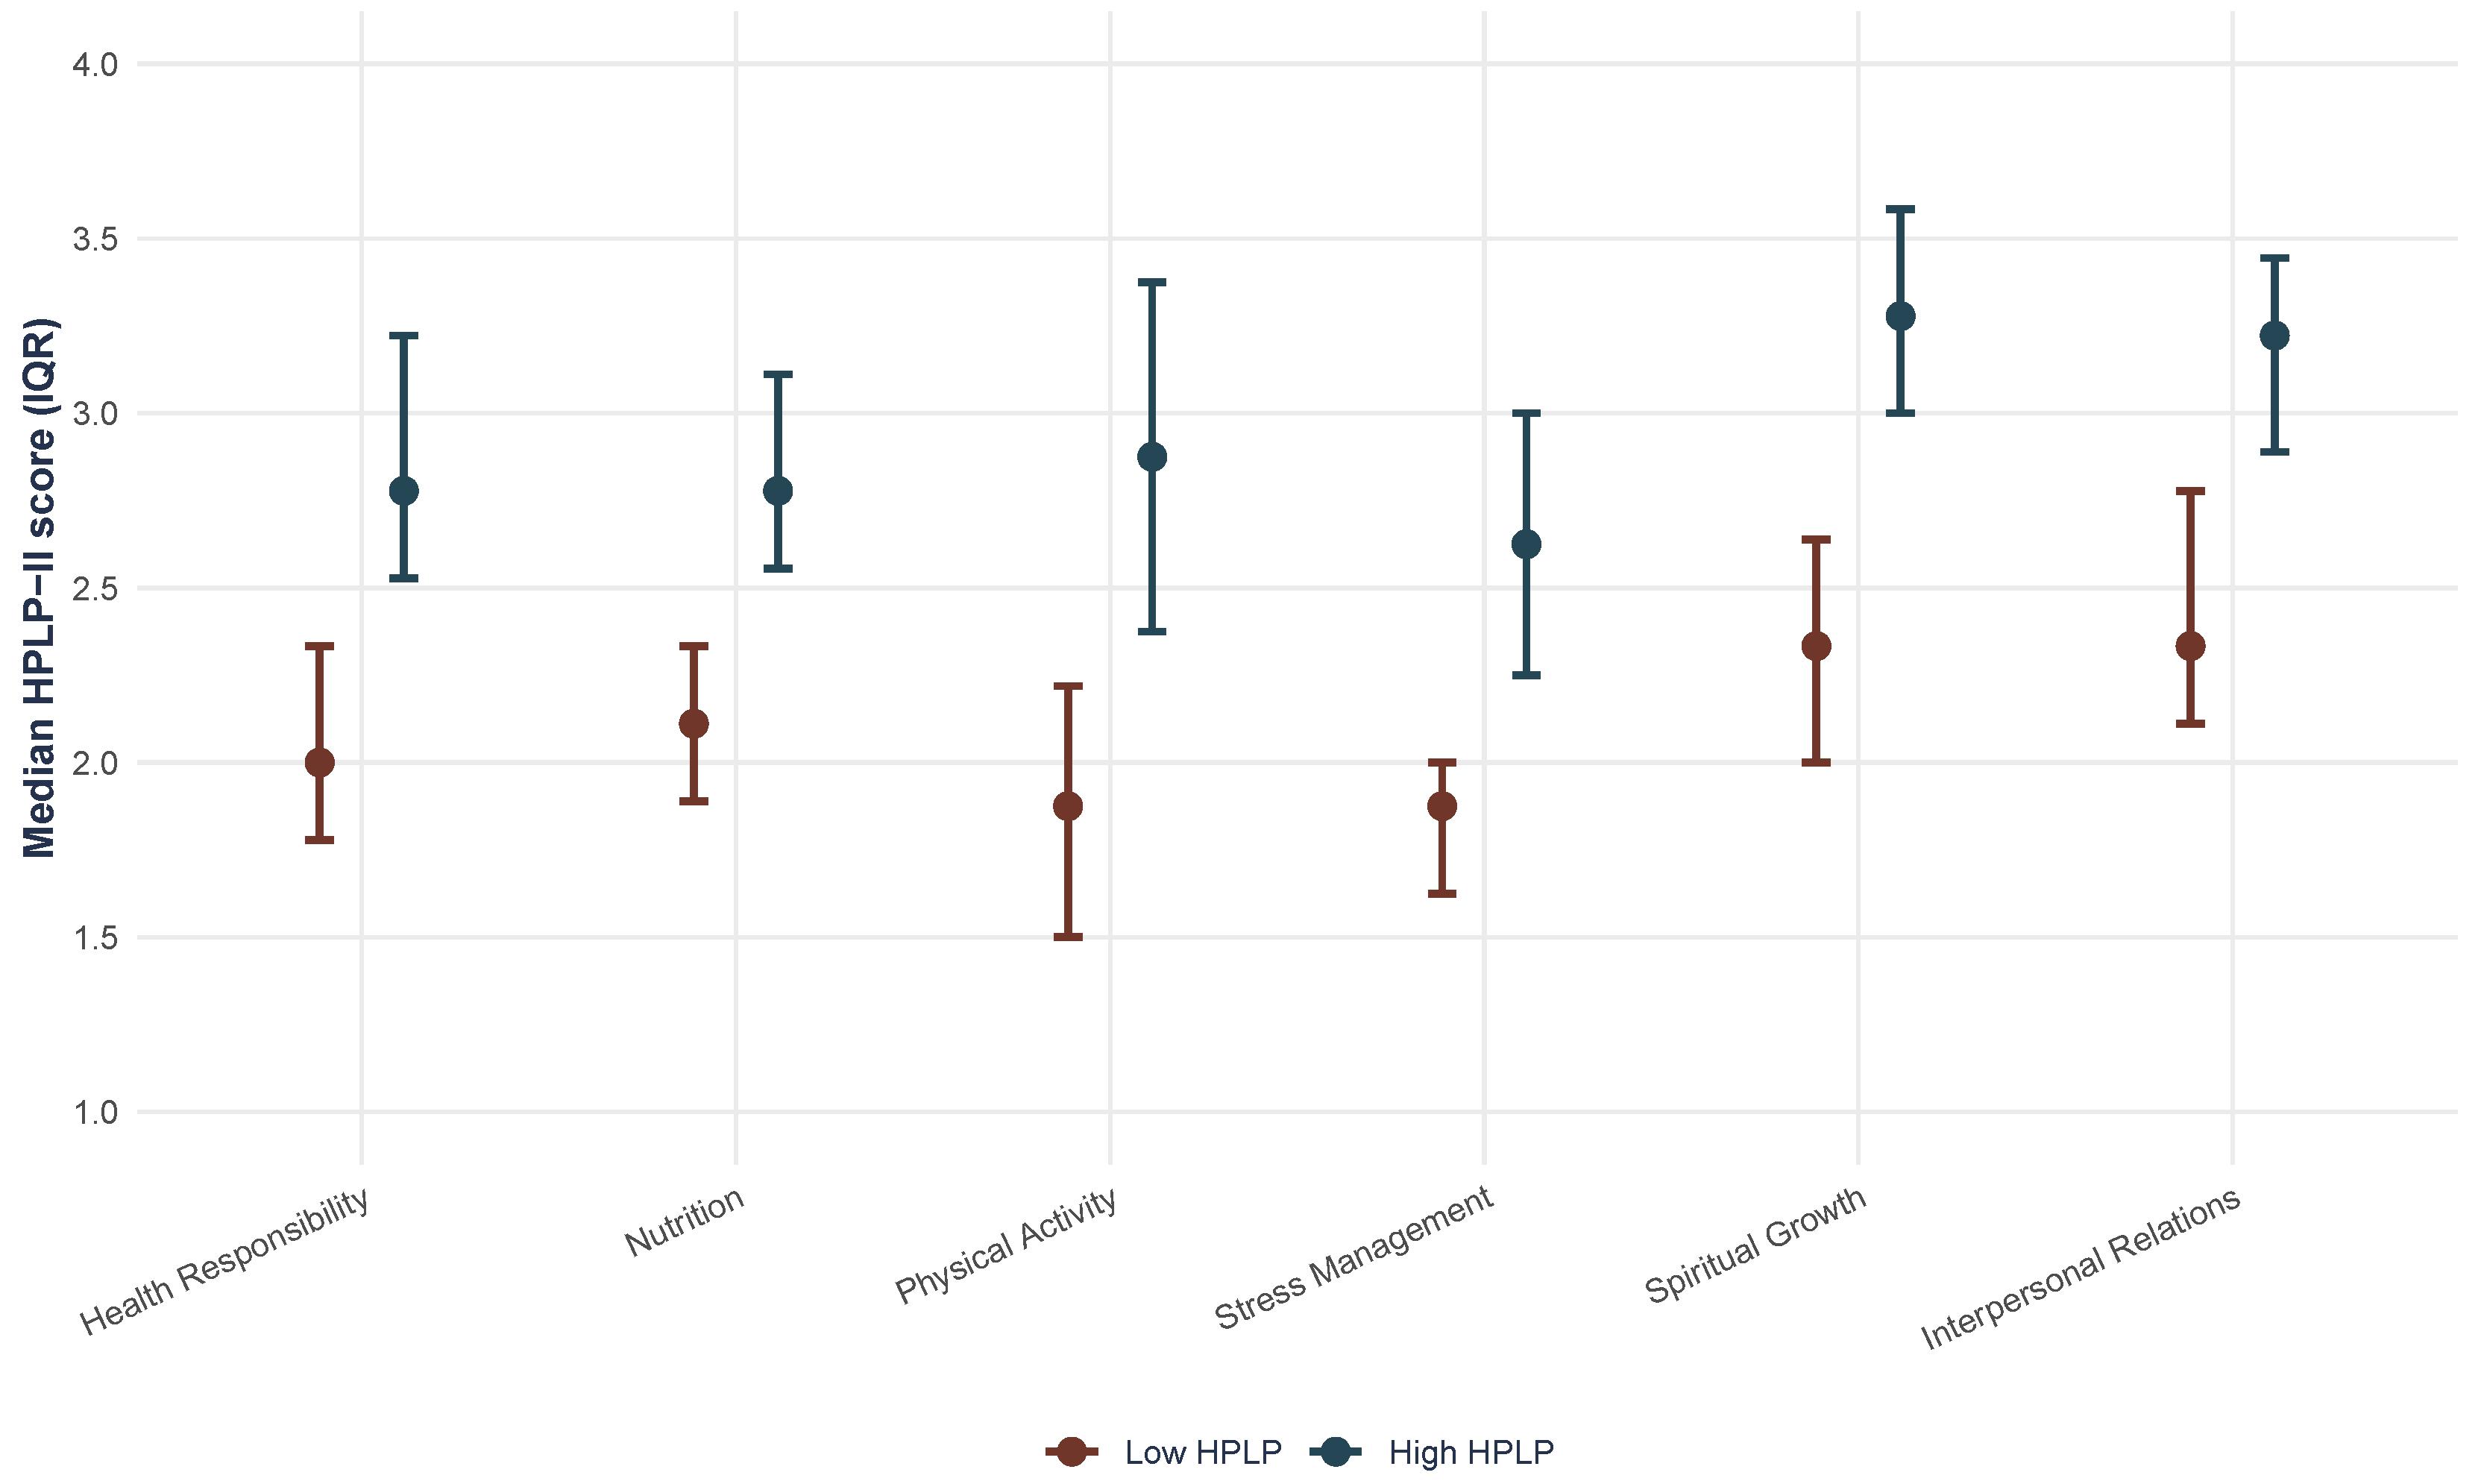
Figure 3.
Covariate balance before and after stabilized inverse probability weighting for health-professional advice seeking. Points show absolute standardized mean differences before weighting and after truncated stabilized weighting; the dashed vertical line marks the conventional 0.10 threshold.
Figure 3.
Covariate balance before and after stabilized inverse probability weighting for health-professional advice seeking. Points show absolute standardized mean differences before weighting and after truncated stabilized weighting; the dashed vertical line marks the conventional 0.10 threshold.
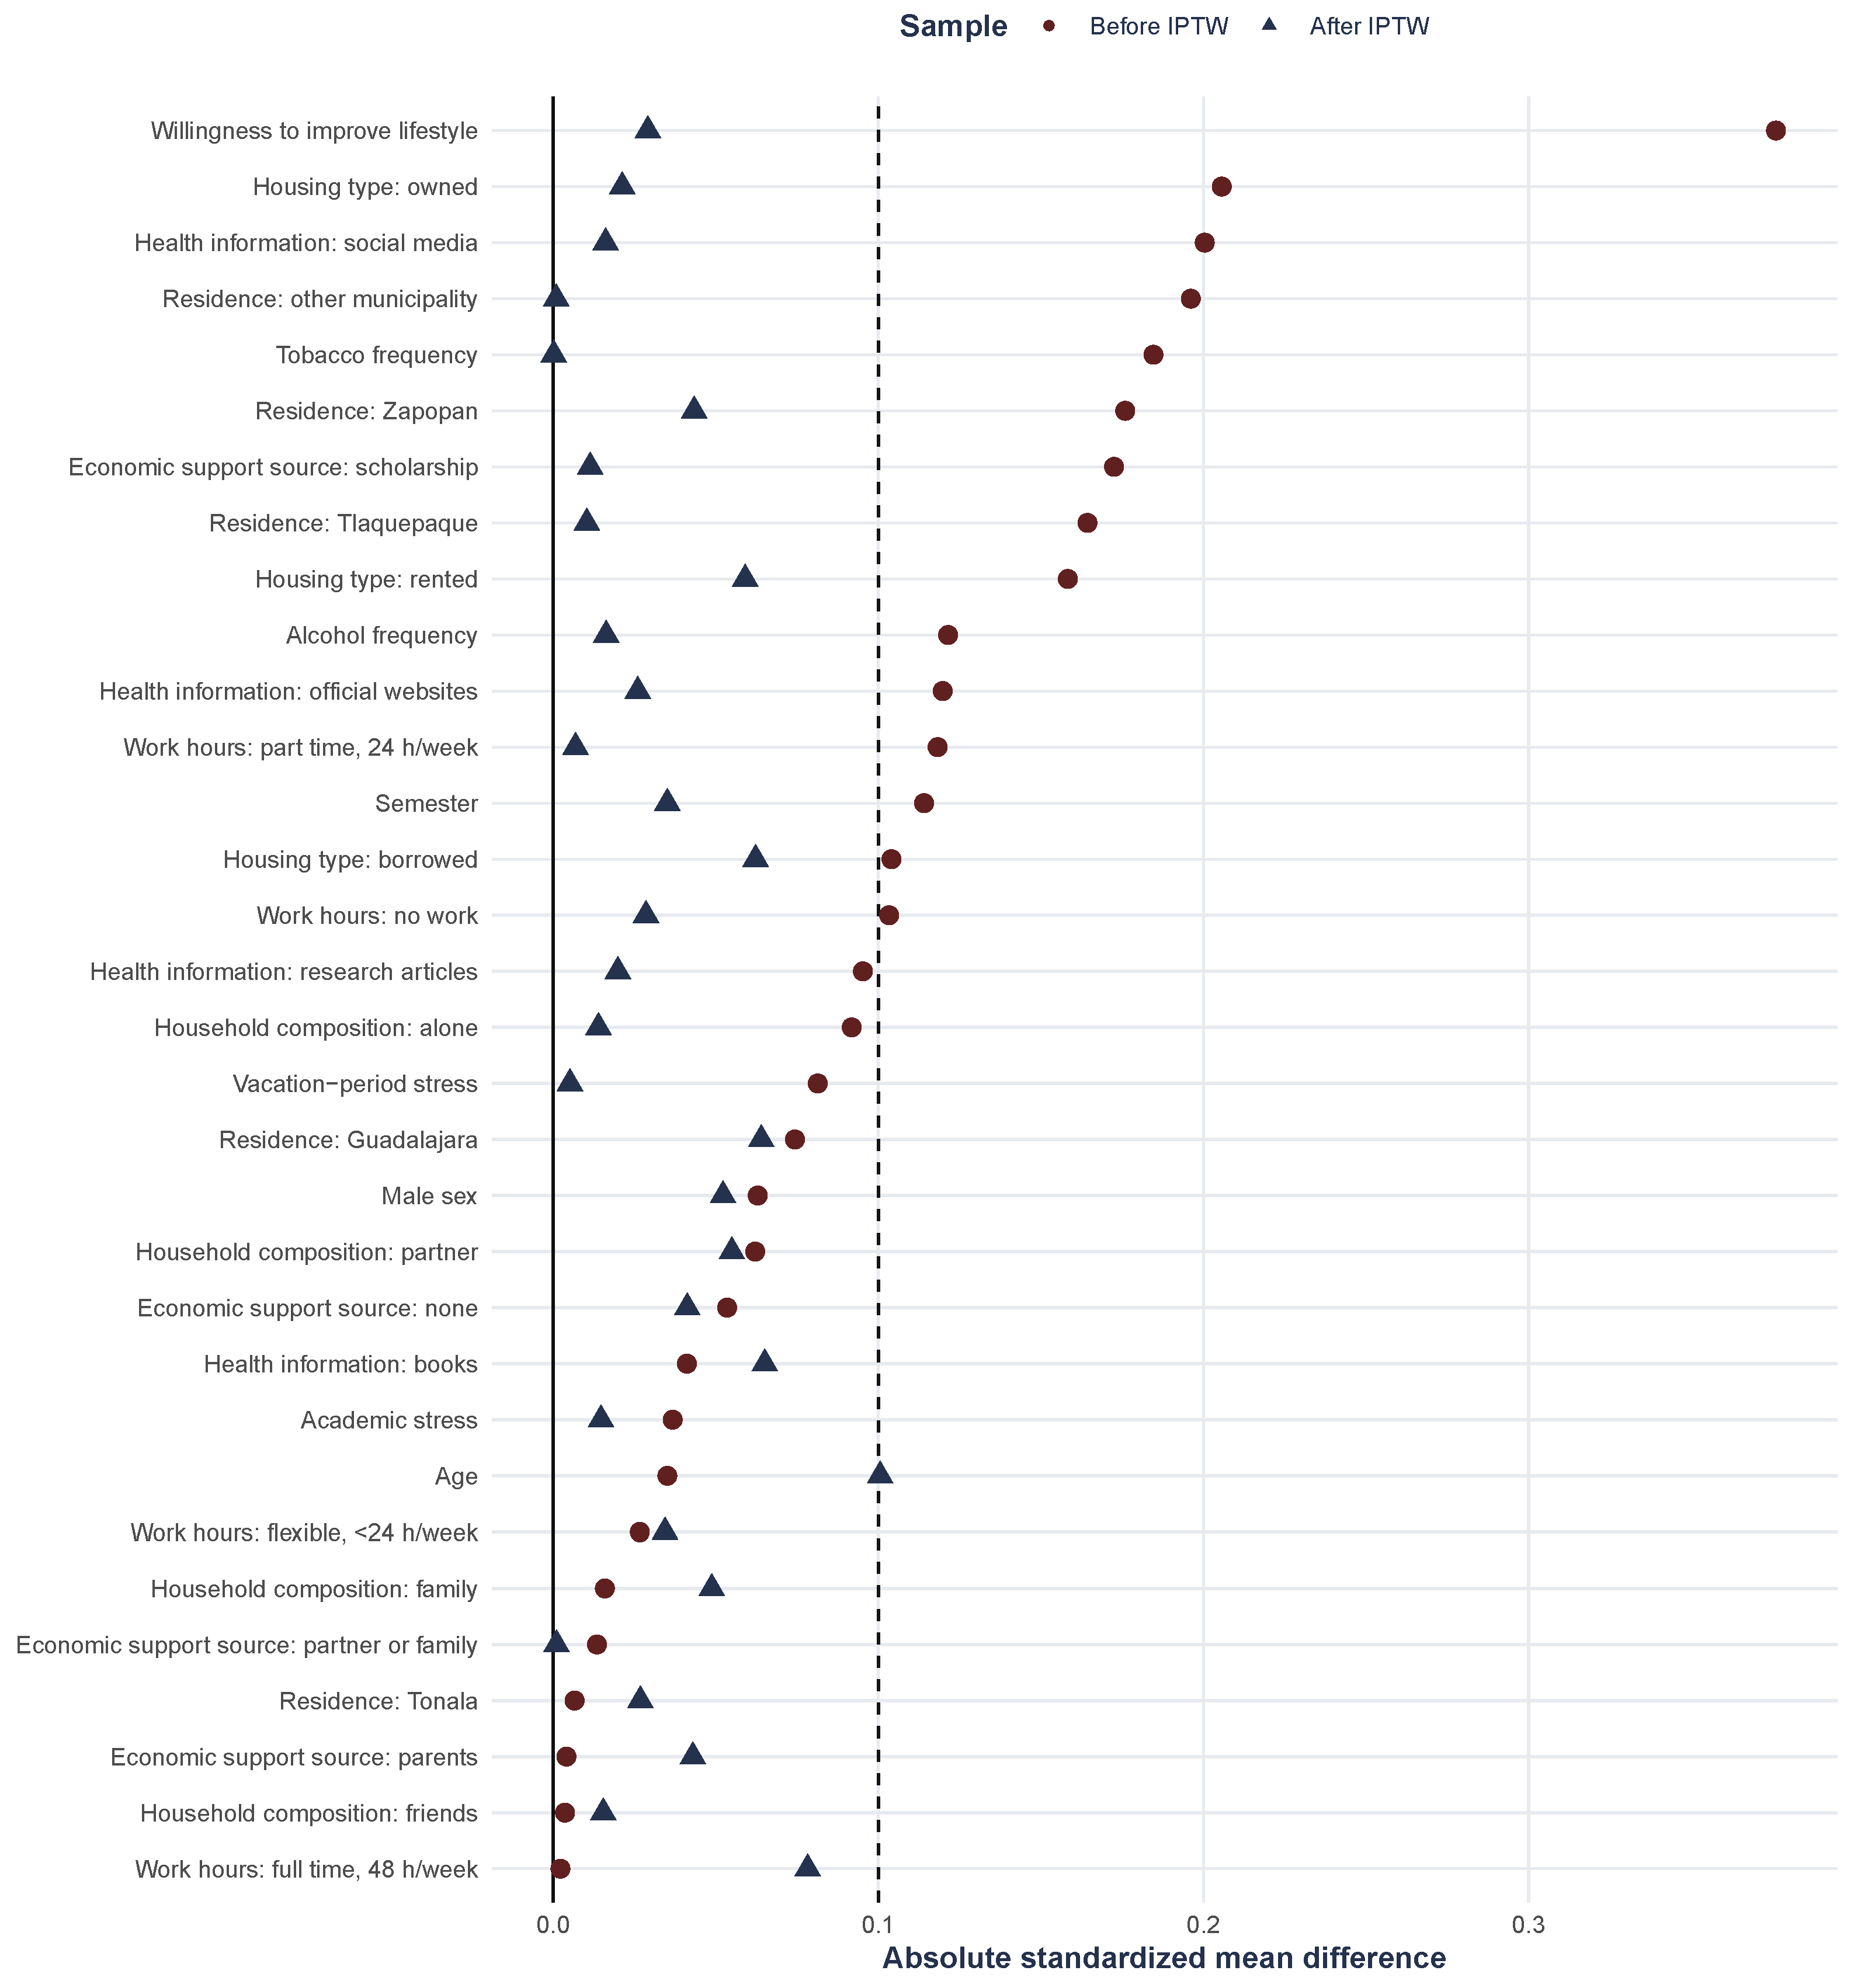

Table 1.
Sociodemographic and behavioral characteristics stratified by sex (N = 506).
| Variable | Total (N = 506) | Female (n = 403) | Male (n = 103) | P value |
| Age (years) (Median, IQR) | 21.0 (20.0, 22.8) | 21.0 (20.0, 22.0) | 21.0 (20.0, 23.0) | 0.067 |
| Employment Status | ||||
| Study only | 262 (51.8) | 219 (54.3) | 43 (41.7) | 0.030 |
| Study and work | 244 (48.2) | 184 (45.7) | 60 (58.3) | |
| Working Hours per Week | ||||
| No work | 262 (51.8) | 219 (54.3) | 43 (41.7) | 0.012 |
| Flexible shift (< 24 h) | 109 (21.5) | 88 (21.8) | 21 (20.4) | |
| Part-time (24 h) | 71 (14.0) | 54 (13.4) | 17 (16.5) | |
| Full-time (48 h) | 64 (12.6) | 42 (10.4) | 22 (21.4) | |
| Economic Support | ||||
| Yes | 390 (77.1) | 324 (80.4) | 66 (64.1) | |
| No | 116 (22.9) | 79 (19.6) | 37 (35.9) | |
| Current Residence | ||||
| Guadalajara | 189 (37.4) | 146 (36.2) | 43 (41.7) | 0.128 |
| Zapopan | 132 (26.1) | 103 (25.6) | 29 (28.2) | |
| San Pedro Tlaquepaque | 73 (14.4) | 63 (15.6) | 10 (9.7) | |
| Tonalá | 57 (11.3) | 42 (10.4) | 15 (14.6) | |
| Other municipalities | 55 (10.9) | 49 (12.2) | 6 (5.8) | |
| Health-Professional Advice Seeking | ||||
| Yes | 135 (26.7) | 110 (27.3) | 25 (24.3) | 0.621 |
| No | 371 (73.3) | 293 (72.7) | 78 (75.7) | |
| Tobacco Smoking | ||||
| Yes | 44 (8.7) | 32 (7.9) | 12 (11.7) | 0.319 |
| No | 462 (91.3) | 371 (92.1) | 91 (88.3) | |
| Alcohol Consumption | ||||
| Yes | 318 (62.8) | 245 (60.8) | 73 (70.9) | 0.076 |
| No | 188 (37.2) | 158 (39.2) | 30 (29.1) |
Table 2.
Descriptive statistics and sex-based comparison of HPLP-II scores (range 1.00–4.00).
| HPLP-II Dimension | Total (N = 506) | Female (n = 403) | Male (n = 103) | P value |
| Global HPLP-II Score (Median, IQR) | 2.40 (2.06, 2.79) | 2.40 (2.06, 2.79) | 2.46 (2.09, 2.79) | 0.448 |
| Interpersonal Relations (Median, IQR) | 2.78 (2.33, 3.11) | 2.78 (2.33, 3.17) | 2.67 (2.22, 3.06) | 0.157 |
| Spiritual Growth (Median, IQR) | 2.67 (2.22, 3.22) | 2.67 (2.22, 3.22) | 2.67 (2.17, 3.22) | 0.772 |
| Nutrition (Median, IQR) | 2.33 (2.00, 2.78) | 2.33 (2.00, 2.78) | 2.44 (2.11, 2.78) | 0.261 |
| Health Responsibility (Median, IQR) | 2.33 (1.89, 2.67) | 2.33 (1.89, 2.67) | 2.33 (2.00, 2.67) | 0.766 |
| Physical Activity (Median, IQR) | 2.12 (1.75, 2.88) | 2.00 (1.62, 2.81) | 2.50 (2.00, 3.06) | |
| Stress Management (Median, IQR) | 2.12 (1.75, 2.50) | 2.12 (1.75, 2.50) | 2.12 (1.88, 2.62) | 0.082 |
Table 3.
Selected coefficients from the primary multivariable HC3 robust linear model for global HPLP-II score.
Table 3.
Selected coefficients from the primary multivariable HC3 robust linear model for global HPLP-II score.
| Model term | Coefficient () | Robust SE | 95% CI | P value |
| Health-professional advice seeking (yes vs. no) | 0.242 | 0.052 | [0.140, 0.344] | |
| Academic stress rating (0–10) | -0.031 | 0.016 | [-0.061, -0.0005] | 0.047 |
| Vacation-period stress (0–10) | -0.023 | 0.011 | [-0.044, -0.001] | 0.036 |
| Willingness to improve lifestyle (0–10) | 0.049 | 0.014 | [0.020, 0.077] | |
| Flexible work ( h/week) | 0.148 | 0.059 | [0.033, 0.263] | 0.012 |
| Official websites as health-information source | 0.104 | 0.051 | [0.005, 0.204] | 0.041 |
| Research articles as health-information source | 0.243 | 0.068 | [0.108, 0.377] | |
| Tobacco use | -0.157 | 0.084 | [-0.323, 0.009] | 0.064 |
| Alcohol use | 0.032 | 0.047 | [-0.059, 0.124] | 0.489 |
Note: Full model also adjusted for age, sex, semester, working-hours categories, economic support, residence, housing type, household composition, and all health-information-source categories. Reference category for health-information source: social media.
Disclaimer/Publisher’s Note: The statements, opinions and data contained in all publications are solely those of the individual author(s) and contributor(s) and not of MDPI and/or the editor(s). MDPI and/or the editor(s) disclaim responsibility for any injury to people or property resulting from any ideas, methods, instructions or products referred to in the content. |
© 2026 by the authors. Licensee MDPI, Basel, Switzerland. This article is an open access article distributed under the terms and conditions of the Creative Commons Attribution (CC BY) license (http://creativecommons.org/licenses/by/4.0/).
Copyright: This open access article is published under a Creative Commons CC BY 4.0 license, which permit the free download, distribution, and reuse, provided that the author and preprint are cited in any reuse.


