

Submitted:
26 May 2026
Posted:
26 May 2026
You are already at the latest version
Abstract
Ship detection in synthetic aperture radar (SAR) imagery, an indispensable all-weather technology for marine engineering and coastal safety, remains challenging in complex nearshore scenes due to coupled speckle noise, sea-land clutter, large scale variation, and extreme class imbalance. Existing decoupled pipelines fail to jointly mitigate these degradations, leading to high false alarm rates and poor generalization. We propose DN-AnchorNet, an end-to-end unified framework integrating a detection-oriented structure-preserving enhancement branch, a scale-adaptive anchor mechanism, and an adaptive weighted Smooth L1 loss. The detection-guided enhancement branch operates without paired clean data to preserve critical ship structures. The scale-adaptive anchor design enhances matching for small, elongated, and arbitrarily oriented ships, while the tailored loss improves robustness against hard samples and scale errors under class imbalance. Extensive experiments on challenging nearshore subsets of RSDD-SAR and SSDD+ show that DN-AnchorNet achieves the best overall performance among all compared representative oriented object detectors, with AP₅₀ values of 0.699 and 0.610, and F1-scores of 0.757 and 0.689, respectively. A strict zero-shot cross-dataset evaluation on HRSID further demonstrates strong generalization to unseen marine SAR conditions. These results confirm that joint optimization achieves a favorable accuracy-false alarm balance for practical coastal monitoring applications. Code is available at: https://github.com/yongqi011210/Dn-anchornet.
Keywords:
synthetic aperture radar
; marine ship detection
; coastal SAR imagery
; detection-oriented denoising
; structure-preserving enhancement
; adaptive anchors
; adaptive weighted smooth L1 loss
1. Introduction
Nearshore waters are of critical strategic importance to maritime transportation, economic activities, and national maritime security, making reliable and efficient vessel surveillance in coastal regions a high-priority task [1]. As an active microwave imaging modality with all-weather, all-day, and high-resolution imaging capabilities, synthetic aperture radar (SAR) has become an indispensable tool for ship detection in complex maritime environments [2]. However, accurate ship detection in nearshore SAR imagery remains a formidable challenge, as imaging conditions are often highly cluttered and target characteristics exhibit extreme variability. Recent review work has systematically summarized the development of deep-learning-based SAR ship detection and the performance evolution of existing networks on public benchmarks such as SSDD+ and HRSID [3].
In practical coastal scenes, the performance of SAR ship detection remains constrained by three interrelated challenges. First, nearshore backgrounds introduce intense interference from land, harbors, islands, docks, and sea clutter, which, together with the inherent multiplicative speckle noise in SAR imagery, can easily obscure weak ship responses and reduce the effective signal-to-clutter ratio (SCR) of the detector [3]; however, traditional denoising methods are usually applied as an independent preprocessing step and are therefore decoupled from downstream detection optimization, often suppressing noise at the expense of target structure preservation [4]. Second, ship targets exhibit extensive variations in scale, aspect ratio, and orientation, ranging from very small inshore fishing boats to large offshore cargo vessels, yet commonly used fixed-scale and fixed-aspect-ratio anchor settings remain unable to adapt well to such continuous geometric variations, especially when targets are small, elongated, or densely distributed [5]. Third, the distribution of training samples is highly imbalanced in coastal SAR images, with sparse ship targets surrounded by a vast number of background pixels, which induces severe learning bias and insufficient discriminability for small or weak targets [6]; meanwhile, standard regression losses such as Smooth L1 fail to provide consistent sensitivity across targets of different scales and exhibit limited effectiveness for hard samples under such extreme imbalance [7].
More importantly, these issues are usually addressed in isolation, whereas the performance degradation observed in nearshore SAR detection is rarely caused by a single factor. Instead, it results from the coupled effects across denoising, proposal generation, and regression learning, which means that optimizing only one stage of the pipeline is inherently insufficient for achieving stable and robust performance in complex coastal environments.
Beyond the above design-level limitations, another practical concern is that many recent detection frameworks pursue accuracy improvements at the cost of substantially increased architectural complexity, while their robustness and deployment suitability for real-world coastal monitoring scenarios remain underexplored. For operational SAR ship detection, a practical framework should deliver not only improved accuracy under noise and clutter, but also a reasonable balance among representation quality, localization reliability, and false-alarm control.
These considerations motivate the development of a unified framework that jointly optimizes multiple stages of the detection pipeline, rather than treating them as isolated components. To this end, this paper proposes DN-AnchorNet, an end-to-end framework for nearshore SAR ship detection that jointly improves denoising, anchor generation, and bounding-box regression within a unified optimization pipeline. Instead of introducing isolated modifications to individual stages, the proposed framework is designed to coordinate feature enhancement, proposal matching, and localization refinement, thereby better mitigating the coupled degradations observed in complex coastal SAR scenes while maintaining the practicality of engineering deployment.
The main contributions of this work are summarized as follows:
(1) A structure-preserving denoising branch jointly optimized with the detection pipeline.
Unlike conventional standalone preprocessing-based denoising methods, this module is trained end-to-end under the guidance of the downstream detection objective, suppressing speckle noise and inshore background interference without compromising the target edges and structural details critical for accurate ship localization.
(2) A scale-adaptive anchor generation mechanism with center-offset compensation.
By establishing a dynamic mapping between feature pyramid levels and real target scale distributions, this design significantly improves proposal matching for ships with diverse sizes, aspect ratios and arbitrary orientations, especially for small, elongated vessels in densely distributed cluttered coastal scenes.
(3) An adaptive weighted Smooth L1 (ASL1) loss for robust bounding-box regression.
This loss integrates error-adaptive weighting and sample-difficulty reweighting, enhancing the model’s sensitivity to tiny localization errors while prioritizing hard sample learning under severe foreground-background class imbalance, boosting localization stability in noisy low-SCR SAR scenes.
(4) Extensive in-domain performance validation and cross-dataset generalization evaluation.
The proposed DN-AnchorNet is evaluated on two widely recognized nearshore SAR ship detection benchmarks, with supplementary zero-shot cross-domain testing on an independent high-resolution SAR dataset. Quantitative results confirm the superiority of the proposed multi-module collaborative optimization framework over state-of-the-art rotated detectors, especially in complex coastal scenes with noise and clutter.
The remainder of this paper is organized as follows. Section 2 reviews related work on SAR ship detection. Section 3 presents the proposed DN-AnchorNet framework in detail. Section 4 reports the experimental settings and comparative results. Section 5 concludes the paper and discusses future research directions.
2. Related Work
2.1. Research on the Decoupling of Denoising and Detection Tasks in SAR Imagery
Synthetic aperture radar (SAR) imagery inherently contains multiplicative speckle noise induced by its coherent imaging mechanism, which is commonly characterized by a Gamma distribution [8]. For ship detection tasks in complex nearshore scenes—including harbors, docks, islands, and coastal built-up areas—strong background scattering frequently coexists with dim small ship targets. In this scenario, speckle noise is tightly coupled with scene textures, resulting in blurred target boundaries, weakened structural features, and thus increased difficulty in robust ship detection. Particularly under extremely low signal-to-clutter ratio (SCR) conditions, the performance of traditional detection algorithms degrades drastically [2]. Accordingly, despeckling and denoising have long been recognized as an indispensable preprocessing step in SAR-based ship target analysis [4].
Early SAR denoising methods, represented by the Lee filter [8], Frost filter [9], and their improved variants [10], were mainly developed based on local statistical modeling of speckle noise for suppression. While these methods can improve the visual quality of SAR imagery and enhance the signal-to-noise ratio to a certain extent, they are generally designed as standalone preprocessing tools decoupled from the subsequent ship detection task. Consequently, the conventional “denoise-then-detect” pipeline fails to enable joint optimization of the denoising process with the downstream detector; more importantly, these filtering-based methods tend to weaken target edges and fine-grained structural features, which are critical for downstream target localization and recognition [11].
With the development of deep learning, data-driven denoising models—such as convolutional autoencoders (CAE) [12] and U-Net-based architectures [13]—have achieved remarkable improvements in speckle suppression and SAR image restoration quality. Benefiting from their strong nonlinear feature learning capability, these methods can effectively capture high-dimensional nonlinear image priors, and consistently outperform traditional statistical filters in terms of fine detail preservation and recovery. However, most existing deep denoising models are still optimized primarily for pixel-level image restoration, rather than for preserving detection-oriented discriminative features. In complex nearshore SAR scenes, excessive smoothing during denoising will inevitably erode the weak scattering responses of dim small targets, reduce the feature distinguishability between targets and background clutter, and ultimately limit the improvement of final ship detection accuracy [14]. Existing studies have further confirmed that, although deep learning-based denoising can bring benefits to SAR target analysis, the improvement in detection performance is often very limited when the denoising model is not explicitly aligned with the optimization objective of the downstream detection task [15].
To address this limitation, two main research directions have gradually emerged. The first is the joint denoising–detection framework, which integrates image restoration and target detection into an end-to-end pipeline. Zhang et al. introduced a multi-task learning framework for joint despeckling and ship detection in SAR imagery, modeling the detection task as three cooperative objectives to learn robust features against speckle noise [16]. Zhao et al. proposed MLDet, which further integrates detection, clutter suppression, and segmentation, and demonstrated improved robustness in complex backgrounds [17]. The second direction is detection-internal feature enhancement, which directly strengthens the discriminability of target features within the detection network without relying on pre-denoising. For example, Pan et al. targeted the core challenges of SAR ship detection (lack of color/texture features, severe interference from coastal background scattering), integrated the brightness and density prior knowledge of ship targets into an attention mechanism, and proposed a plug-and-play BDAM module. This method effectively suppresses land clutter interference while preserving key scattering characteristics of targets, providing a representative SAR-specific attention-guided feature enhancement paradigm [18]. These studies confirm that tighter coupling between image restoration, feature enhancement, and detection can yield significant performance benefits in challenging SAR ship detection scenarios.
Overall, existing studies have demonstrated that introducing denoising preprocessing or in-network feature enhancement can improve SAR target detection to some extent. However, most methods still have two key limitations: first, joint denoising–detection frameworks mostly adopt loosely coupled multi-task learning, failing to fully align the denoising process with the optimization goals of detection tasks, which easily leads to over-smoothing of weak scattering features of small targets; second, existing feature enhancement methods still insufficiently consider the preservation of target contours, structural details, and localization-relevant features in cluttered coastal scenes. Consequently, there remains an urgent need for a detection-oriented integrated processing strategy that can jointly suppress background interference while maintaining the semantic and geometric information required for reliable ship detection in nearshore SAR imagery.
2.2. Research on Multi-Scale Object Detection and Anchor Box Generation Mechanism
Ship targets in SAR imagery usually exhibit substantial variation in size, aspect ratio, and orientation, ranging from small nearshore boats to large offshore vessels [3]. This large geometric diversity poses a major challenge for conventional anchor design. In mainstream detectors such as SSD [19], Faster R-CNN [20], and RetinaNet [6], anchors are usually predefined with fixed scales and aspect ratios. Although this design is effective for many natural-image benchmarks, its adaptability is severely limited in SAR ship detection, where targets are often highly elongated, sparsely distributed across scales, and affected by heavy clutter and speckle noise.
To improve multi-scale feature representation, feature pyramid structures such as Feature Pyramid Network (FPN) have been widely adopted [21]. By combining high-level semantic information with low-level spatial details, FPN significantly enhances the detector’s ability to handle targets of different sizes. Recent SAR-specific detectors have also explored attention-enhanced multi-scale feature learning; for example, LCAS-DetNet validated multi-scale feature extraction and noise resistance on the HRSID and SSDD datasets, demonstrating that attention-based feature enhancement can improve detection robustness in cluttered SAR scenes [22]. However, even with such feature-level improvements, the anchor settings in most detectors remain manually specified and cannot dynamically reflect the true scale distribution of targets in different SAR scenes.This limitation becomes more pronounced in coastal environments, where the scale composition of ship targets may vary drastically across inshore and offshore regions.
Anchor-free detectors, such as CenterNet [23], FCOS [24], and CornerNet [25], alleviate the dependence on handcrafted anchors by predicting target locations directly from keypoints or dense points. In addition, methods such as FoveaBox [26] attempt to learn localization behavior in a more data-driven manner. These approaches reduce the burden of manual anchor design and have shown competitive performance in many visual detection tasks. Nevertheless, in coastal SAR imagery, the simultaneous presence of arbitrary orientations, elongated structures, large scale variation, and strong background interference still makes precise localization extremely challenging [14]. In particular, boundary alignment and spatial matching remain problematic when ship targets are small, densely distributed, or partially contaminated by clutter.
To better handle oriented objects, a number of rotated detection methods have been proposed. Some anchor-based approaches explicitly incorporate angle parameters into the anchor representation and combine them with adaptive scaling strategies to improve matching for arbitrarily oriented objects [27]. Meanwhile, two-stage oriented detectors such as Oriented R-CNN [28], RoI Transformer [29], and Gliding Vertex [30] further enhance proposal quality and feature alignment through rotation-aware region extraction and geometric transformation. More recently, single-stage oriented detectors such as YOLOv8-OBB [31] and H2RBOX-URC [32] have extended efficient one-stage frameworks to rotated object prediction and improved detection performance for small or densely distributed targets. Even so, their robustness may still decline significantly in the presence of severe speckle noise, highly heterogeneous coastal backgrounds, or substantial geometric variation.
In summary, existing studies have improved multi-scale and oriented detection from several perspectives, including feature pyramid fusion, anchor-free localization, rotated anchor design, and geometry-aware detection heads. However, in coastal SAR scenes, proposal generation remains a critical bottleneck because ship targets often vary simultaneously in scale, aspect ratio, and orientation under heavy clutter and noise interference. This suggests that anchor design for nearshore SAR ship detection still requires stronger adaptation to target geometry and feature-layer characteristics, to achieve more reliable proposal matching and localization.
2.3. Research on Bounding-Box Regression Losses and Hard-Sample Reweighting
Bounding-box regression is a core component of object detection, and Smooth L1 loss has long been one of the most widely used regression objectives due to its stable convergence and moderate sensitivity to outliers [7]. However, the tolerance of Smooth L1 loss to localization errors is not consistent across targets of different scales. In particular, for small objects, even a slight pixel-level deviation may lead to a substantial drop in Intersection over Union (IoU), making precise localization far more difficult.
To better align the optimization objective with localization quality, a series of IoU-based regression losses have been proposed, such as IoU Loss, Generalized IoU (GIoU) [33], and Distance IoU (DIoU) [34]. These losses directly optimize the overlap or geometric relationship between predicted and ground-truth boxes, and they have shown clear benefits in many object detection tasks. However, when applied to small targets or noisy SAR scenes, their effectiveness is often severely diminished because the overlap between predicted and ground-truth boxes can easily become extremely small, resulting in unstable or weak gradient signals [33]. This problem is particularly evident when target boundaries are blurred by speckle noise or background clutter.
In addition to regression loss design, hard-sample emphasizing strategies have also been widely explored in dense detection. Representative examples include Focal Loss [6] and Varifocal Loss [35], which suppress the dominance of easy samples and place greater emphasis on informative or difficult examples. Although these methods are mainly designed for classification or sample-quality reweighting rather than for direct bounding-box regression, they reflect a core insight: under highly imbalanced training conditions, assigning more attention to hard samples can significantly improve the learning effectiveness of the detector. This insight is also highly relevant to SAR ship detection, where sparse targets are surrounded by a large amount of background and low-quality positives may easily interfere with optimization [1,36].
Another important issue is that most existing regression and reweighting strategies are developed mainly for natural-image benchmarks, such as COCO and PASCAL VOC, where object boundaries are relatively clear and image noise is comparatively limited [20]. In contrast, coastal SAR imagery often contains strong speckle noise, low-SNR targets, blurred contours, and partial occlusion. Under such conditions, low-quality positive samples, weak scattering responses, and large foreground–background imbalance can jointly reduce regression stability and limit the effectiveness of standard hard-sample mining strategies [14,37]. Therefore, directly applying conventional regression objectives to SAR ship detection is insufficient to ensure accurate localization in complex coastal scenes.
Overall, existing regression losses and hard-sample emphasizing strategies provide valuable insights for improving localization performance. However, most of them are not specifically designed for the unique characteristics of coastal SAR imagery, where small targets, noisy backgrounds, weak boundaries, and imbalanced samples jointly affect optimization. Therefore, there remains a need for a regression-oriented optimization strategy that is more sensitive to small localization errors while being better suited to noisy and imbalanced SAR ship detection scenarios.
3. The Proposed DN-AnchorNet Framework
3.1. Framework Overview and Optimization Criteria
3.1.1. Overall Architecture and Workflow
To address the core challenges of ship detection in complex nearshore SAR scenes, including intense speckle noise, severe background clutter, extensive scale variation of targets, and severe sample imbalance, this paper proposes DN-AnchorNet, an end-to-end detection framework that jointly integrates a structure-preserving denoising branch, a scale-adaptive anchor generation mechanism, and a robust regression optimization scheme. The overall architecture of the proposed framework is illustrated in Figure 1.
The framework consists of four sequentially connected and jointly optimized stages, forming a complete detection pipeline:
(1) Structure-preserving Enhancement Stage
The input SAR image is first fed into a dedicated structure-preserving enhancement module, which is designed to suppress speckle-related interference and background clutter while preserving critical structural details and high-frequency scattering information of ship targets. Unlike conventional preprocessing-based denoising schemes that are decoupled from the detection task, this module is optimized end-to-end with the entire detection pipeline. It does not aim to reconstruct a clean SAR image from paired supervision; instead, it generates a detection-oriented enhanced representation constrained by input–output structural consistency and guided by downstream localization and recognition objectives.
(2). Multi-scale Feature Extraction Stage
The denoised feature-enhanced image is passed into the backbone network for hierarchical feature extraction. In this work, a ResNet-50 backbone [38] is adopted to extract multi-level semantic features, which are further fused and enhanced by a Feature Pyramid Network (FPN) [21] to generate a set of multi-scale feature maps from P2 to P6. This design strengthens the feature representation of ship targets with diverse sizes, and provides robust multi-scale feature support for subsequent proposal generation and oriented detection.
(3) Adaptive Proposal Generation Stage
The generated multi-scale feature maps are input into the Region Proposal Network (RPN), where candidate anchors are generated and refined. To address the challenge of extensive scale variation and elongated geometry of ships in coastal SAR imagery, DN-AnchorNet introduces a scale-adaptive anchor generation strategy with center-offset compensation. This design is intended to improve the anchor-target matching quality, and to provide more accurate initial proposals for small, elongated, and arbitrarily rotated ship targets.
(4). Rotated Detection and Refinement Stage
The candidate regions generated by the RPN are sent to the Rotated ROI Head, which performs rotation-aware feature extraction, target classification, and fine-grained bounding box regression. Each rotated bounding box is represented by 5 parameters: center coordinates (x, y), width w, height h, and rotation angle θ. Compared with conventional axis-aligned detection, this rotated representation can more accurately describe the true geometry of arbitrarily oriented ships, and avoids including excessive invalid background information in candidate regions, which is beneficial for improving localization accuracy in dense and cluttered coastal scenes.
The above four stages are jointly optimized in an end-to-end manner, and their training process is driven by a unified multi-task loss function, which is detailed in the following section.
3.1.2. Unified Loss Function Design
To simultaneously optimize target detection performance and preserve the structural integrity of enhanced SAR representations, DN-AnchorNet employs a unified joint loss function that integrates target detection loss and a structure-preserving consistency loss. The target detection loss comprises classification and bounding-box regression terms at both the RPN and Rotated ROI Head stages. Unlike supervised image restoration methods, the proposed denoising loss does not require paired clean SAR images; instead, it is computed between the original SAR input and the denoising module output to prevent excessive content distortion or over-smoothing during detection-oriented denoising.
The overall loss function is formulated as:
where and denote the loss terms for the RPN and the Rotated ROI Head, respectively, each consisting of classification and bounding-box regression components. denotes the self-constrained denoising loss computed between the original SAR image and the denoising output. In this study, is empirically set to 0.3 to maintain detection-oriented optimization while allowing the denoising branch to provide effective auxiliary supervision. It should be noted that does not rely on paired clean data. Instead, it constrains the denoised output to preserve the structural information of the original input, while the downstream detection loss guides the module to suppress interference harmful to localization and classification.
To achieve both pixel-level fidelity and structural consistency, we design as a weighted sum of pixel-level L1 loss and Structural Similarity Index Measure (SSIM) loss:
where denotes the original SAR image, denotes the output of the denoising module, and balances the contributions of the L1 and SSIM terms. The SSIM-based term is defined as:
where denotes the standard Structural Similarity Index Measure computed between the denoised outputand the original SAR image. SSIM is a widely used image similarity measure for evaluating structural consistency between two images, and a larger SSIM value indicates higher similarity. Therefore, is adopted as a loss term such that minimizing encourages the denoised output to retain the structural information of the original SAR image. The SSIM function itself follows the standard definition and is not redefined in this paper.
The L1 term constrains pixel-level consistency between the original SAR image and the denoised output, while the SSIM term helps preserve structural information, including edges, textures, scattering responses, and ship contours. Since the original SAR image itself contains speckle noise, this loss is not intended to reconstruct a clean image from paired supervision. Instead, it serves as a self-constrained denoising regularization term that prevents the denoising module from excessively modifying target-related structures. The actual suppression of detection-unfriendly noise and clutter is jointly guided by the downstream detection loss. By combining content consistency and structural preservation, the denoising loss helps maintain target contours and texture cues required for subsequent proposal generation and oriented localization.
Building on this, the RPN loss consists of classification and bounding-box regression components. The classification branch uses binary cross-entropy to estimate object presence probability, with positive-sample weighting mitigating class imbalance, reinforcing true positives, and reducing interference from negative samples. For bounding-box regression, traditional L1 or L2 losses face inherent trade-offs between small and large targets, while the regression of small or weak ship targets in SAR images is particularly sensitive to localization errors under noisy coastal backgrounds. In addition, bounding-box regression is only valid for positive anchors with ground-truth targets, while negative anchors must be excluded to avoid invalid supervision. To address these limitations, we propose an adaptive weighted Smooth L1 (ASL1) loss which is defined as:
where denote the regression error between the -th predicted bounding box and its corresponding ground truth, is the threshold parameter that divides the error interval into quadratic and linear regions. When the prediction error , the loss behaves as a quadratic function, enhancing the gradient for small errors and facilitating faster model convergence. When , the loss is linear, preventing large outlier errors from disrupting training. To adaptively adjust according to the evolving error distribution during training while maintaining numerical stability, we employ an exponential moving average (EMA) mechanism to update iteratively:
where is the training iteration index, is the EMA smoothing coefficient (set to 0.9) , and denotes the mean absolute regression error over all valid positive samples in the current batch. The initial threshold is set to 1.0, consistent with the standard Smooth L1 loss. The EMA-based dynamic update of ensures that the loss function automatically adapts its sensitivity across training stages: it is more tolerant to large errors in the early training phase, while becoming increasingly sensitive to fine localization errors as the model converges.
The final regression loss is computed by applying a valid positive sample mask and a sample-difficulty-aware weight to each individual ASL1 loss:
where denotes the valid positive regression mask (1 for positive samples, 0 for background samples), denotes the difficulty-aware weight assigned to the -th positive sample, and is the number of valid positive samples. Background samples are excluded from the regression loss because they do not have valid bounding-box regression targets. The valid regression mask ensures that only positive anchors with valid ground-truth targets contribute to the regression loss, eliminating invalid supervision from background samples. The sample-difficulty-aware weight further assigns higher weights to hard positive samples with larger localization errors, directing the model’s attention to the most informative samples during optimization. This design significantly improves the regression accuracy for small and weak ship targets that are easily overwhelmed by background clutter.
Finally, the training loss for the Rotated ROI Head also consists of classification and bounding box regression components. The classification branch uses cross-entropy loss to estimate multi-class probabilities for each ROI, distinguishing object categories from background. Unlike the binary cross-entropy in the RPN, the ROI Head performs finer-grained multi-class classification, employing a softmax activation for normalized probabilities. The bounding box regression also uses the adaptive Smooth L1 loss. Since ROI inputs are candidate boxes filtered by the RPN, the error distribution is more concentrated and regression targets are more precise. Therefore, the loss threshold β is fixed to a small constant to focus on fine-scale deviations, and the dynamic threshold update is omitted to simplify training stability. This design reflects the distinct optimization objectives of the two stages: the RPN prioritizes robust coarse localization under large initial error variations, while the ROI Head focuses on stable and accurate refinement of pre-selected rotated proposals. This ensures stable rotated-box refinement without introducing invalid regression supervision from negative samples.
Based on the above unified loss function, DN-AnchorNet realizes the joint optimization of denoising enhancement and target detection. The following sections will detail the specific implementation of each core module.
3.2. Image Denoising Module
Traditional object detection methods typically rely on feature extractors to learn target representations directly from raw SAR images. However, due to the inherent speckle noise, sea surface reflections, and non-Gaussian statistics of SAR imagery, direct feature extraction often fails to distinguish weak small targets from complex backgrounds, limiting detection performance. To address this, DN-AnchorNet incorporates a dedicated image denoising module (Figure 2) as a jointly optimized auxiliary branch. It should be emphasized that this module does not rely on paired clean SAR images as supervised restoration targets. Instead, it learns a detection-oriented denoising mapping from the original SAR input. The denoised output is constrained by a self-constrained denoising loss computed between the original input and the module output, so that important structural information can be preserved while interference harmful to downstream detection is suppressed. In this way, the module can reduce noise-related background disturbance while maintaining target edges, scattering responses, and structural details, thereby providing higher-quality inputs for subsequent feature extraction and localization. Unlike conventional preprocessing-based denoising, the proposed module is jointly optimized with the detection network, so that the denoising process is jointly guided by the self-constrained denoising loss and downstream localization and recognition objectives.
The internal components of the denoising module are described as follows:
(1) High-Frequency Protection (HF Protect) Module
The image is first fed into the High-Frequency Protection module (HF Protect). This module introduces a learnable high-pass filtering branch that actively extracts and enhances high-frequency details in the original SAR image. Through convolution operations, the module extracts high-frequency components and fuses them with the input image via weighted addition, effectively preventing edge blurring commonly caused by traditional convolutions and ensuring the integrity of key structures such as ship contours and coastlines. The fusion process can be described as:
where denotes the high-pass convolution,is the fusion weight, is the input image, andis the output after the high-frequency protection module. Here, controls the contribution of the high-frequency branch in the fusion process. Its introduction is intended to balance detail preservation and noise suppression: a relatively larger value strengthens edge and texture retention, whereas a smaller value reduces the risk of amplifying noise-sensitive high-frequency responses. Therefore, serves as a trade-off factor that prevents the denoising process from excessively smoothing target boundaries while maintaining overall representation stability.
(2) Multi-Layer Convolutional Encoder
Meanwhile, the multi-layer convolutional encoder progressively extracts deep semantic features of the image through successive convolution and downsampling layers, building a comprehensive understanding of the global context of the image. These features provide rich semantic information to support subsequent attention enhancement and TR (Texture Reconstruction) components. Compared with the HF Protect branch, which focuses more on local structural details, the encoder emphasizes global semantic abstraction and provides complementary contextual information for the denoising process.
(3) Dual-Branch Feature Fusion Module
The feature fusion module is primarily responsible for merging the outputs of the previous two modules to effectively combine high-frequency detail features with deep semantic information. At this stage, the fusion module employs a weighted fusion strategy to integrate outputs from the HF protect module and the convolutional encoder, fully leveraging the advantages of both. Specifically, the detail features extracted by the high-frequency protection module effectively preserve edge information and structural details, while the deep semantic features provided by the convolutional encoder help in comprehensively understanding the global context of the image. Through this feature fusion, the model better balances detail restoration and semantic understanding, thereby avoiding excessive modification of the original SAR content while strengthening target-related structural and textural cues for detection. This design is motivated by the observation that denoising in coastal SAR imagery should not rely solely on local filtering or global semantic abstraction alone; instead, both types of information are required to suppress clutter while preserving ship-related structures.
(4) Multi-Scale Gated Decoder with Attention Enhancement
The decoding stage employs a multi-scale gated pyramid that progressively fuses shallow details with deep semantic features, combined with progressive upsampling to restore spatial resolution while minimizing information loss. Key components include the Attention Module and Texture Reconstruction (TR) module. The Attention Module adopts a dual-path design: Channel Attention enhances high-brightness scattering from ship structures, improving target saliency, while Spatial Attention suppresses background noise (waves, rocks), sharpening target boundaries. These two paths work synergistically to enhance target-relevant features and suppress background interference, enabling the decoder to selectively emphasize target-related responses during reconstruction, rather than merely recovering image resolution.
The TR module further enriches target textures by capturing long-range spatial dependencies via an improved non-local mechanism and reconstructing anisotropic scattering features with direction-aware convolution. In addition, the structure-preserving consistency constraint between the original input image and the enhanced output helps prevent texture distortion and excessive smoothing, ensuring that the enhanced image maintains the structural integrity and target-related details of the original SAR image. This component is particularly important for SAR imagery, where weak scattering targets may be easily submerged by clutter and where excessive smoothing may damage orientation-sensitive texture cues.
Subsequently, the Feature Fusion Center integrates outputs from HF Protection, shallow encoder features, and deep semantic maps, applying channel and spatial attention to adaptively recalibrate cross-scale features:
where and represent channel attention and spatial attention operations, respectively. ,,and denote the high-frequency, shallow, and deep features, respectively.Through adaptive recalibration across channels and spatial locations, this fusion strategy enhances multi-level feature expressiveness and provides more informative representations for downstream detection.
(5) Residual Connection and Content-Aware Scaling Fusion
Finally, the residual connection and scaling fusion strategy incorporate a content-aware scaling map generation network to dynamically assess the denoising requirements of different regions, achieving pixel-level adaptive weighted fusion. The specific fusion process can be expressed as:
where denotes the Sigmoid activation function; is the feature output from the decoder; represents the noise prior information; is the reconstructed residual from the decoder; is the original input image,and is the final enhanced output .The residual formulation helps preserve the original SAR content, while the adaptive scaling mechanism allows the network to apply different enhancement strengths to different regions. Since no paired clean SAR image is used as supervision, the proposed denoising module should not be regarded as an independent supervised image restoration model. Instead, it is guided by both the downstream detection objective and the self-constrained denoising loss. In this way, the module can suppress detection-unfriendly interference while retaining ship contours and structurally important regions.
3.3. Feature Extraction Network
The denoised image output by the image denoising module is fed into the feature extraction network to obtain robust and discriminative semantic representations for ship detection. This network consists of three core components: the backbone network, the FPN neck, and the oriented detection head, which are described in detail below.
3.3.1. Backbone Network
The backbone network adopts the classic ResNet-50 architecture proposed in [38], which effectively alleviates the vanishing gradient problem in deep networks and enhances multi-level feature representation through deep residual connections. Although more advanced backbone networks have been proposed in recent years, ResNet-50 is selected in this study for three key reasons: (1) it provides a favorable balance between representational capacity, training stability, and computational cost; (2) it is the most widely used backbone in existing SAR ship detection and rotated object detection studies, enabling fair and reliable comparison with representative rotated object detection methods; (3) it has strong generalization ability for SAR imagery with limited training samples. During training, the backbone is initialized with ImageNet pre-trained weights to leverage general visual priors. To improve the model’s generalization and training stability, the first two residual stages of the backbone are frozen to retain low-level edge and texture priors and avoid overfitting, while the Batch Normalization layers in the middle and higher stages are fine-tuned to ensure effective adaptation to the statistical characteristics of SAR images. This design allows the network to retain general visual priors from pre-training, while adapting higher-level semantic representations to the unique characteristics of SAR ship targets.
3.3.2. Feature Pyramid Network (FPN) Neck
To meet the detection requirements of ship targets with extensive scale variations, the multi-level semantic feature maps output by the backbone network are further fused and enhanced by the FPN [21]. The FPN employs a top-down pathway with lateral connections to combine high-level semantic information with low-level spatial details, generating scale-consistent and semantically rich multi-scale feature maps from P2 to P6, which cover a wide range of target scales from small nearshore fishing boats to large offshore cargo vessels. This design is particularly suitable for coastal SAR ship detection, where targets often exhibit substantial scale variation, and small targets require both fine spatial details and sufficient semantic support for accurate detection. The FPN enhances the fusion of high-level semantic features and low-level spatial details across different scales, thereby improving the detection performance of small targets in multi-scale detection tasks. Compared with using single-scale backbone features alone, this pyramidal fusion strategy provides significantly stronger support for proposal generation and oriented localization across ships of different sizes.
3.3.3. Oriented Detection Head
The detection head adopts the Oriented R-CNN [28] framework as the base detection module. Oriented R-CNN is a two-stage detection framework that introduces explicit orientation regression mechanisms during both the RoI extraction and regression stages, effectively adapting to the arbitrary orientation of targets in rotated object detection tasks. The adoption of Oriented R-CNN is motivated by its strong compatibility with proposal-based refinement, its explicit modeling of object orientation, and its representative performance in rotated object detection, which is well suited to ship targets with elongated shapes and arbitrary directions in coastal SAR imagery. The final multi-scale feature maps output by the FPN serve as high-quality inputs for the subsequent RPN and Rotated ROI Head, supporting precise object localization and classification. This combination of ResNet-50, FPN, and Oriented R-CNN therefore provides a stable, efficient, and geometry-aware feature extraction pipeline for the proposed DN-AnchorNet framework.
3.4. Region Proposal Network
The RPN plays a core role in object detection. Its task is to generate a series of candidate regions (anchors) from the feature maps, which are then further classified and regressed to precisely localize objects. In nearshore radar image scenarios, ship targets exhibit large scale variations, diverse shapes, and dense distributions. Traditional RPN typically generates a set of predefined anchors at each feature map location, with fixed scales and aspect ratios. For example, a common setting uses three scales combined with three aspect ratios, producing nine anchors per location. However, this static design cannot adapt to the high variability in target scale and shape. Especially for small targets or those with extreme aspect ratios, fixed anchors often struggle to match, leading to severe class imbalance between positive and negative samples or ineffective training, which in turn degrades the quality of proposals and recall rate of the RPN.
To address these limitations, we introduce an adaptive anchor generation strategy that dynamically links anchor sizes with the feature map structure, thereby enhancing the RPN’s adaptability to ships with diverse scales and shapes and improving the coverage and quality of candidate regions. As illustrated in Figure 3, the proposed strategy consists of three coordinated components: scale-adaptive anchor allocation across different feature levels, anchor center alignment for reducing spatial mismatch, and flexible aspect-ratio design for elongated ship targets.
As shown in Figure 3, the proposed mechanism first establishes a dynamic correspondence between feature pyramid levels and anchor scales, so that the generated anchors better match the receptive field and target-size distribution of each feature level. The adaptive anchor generation mechanism incorporates the core concept of “feature-level receptive field–anchor size matching,” which enables the base anchor size to be adaptively adjusted according to the stride of the corresponding feature map. The core computation formula is:
where is the base anchor size for the l-th feature pyramid level, is an empirical scaling factor (set to 8 in this study), and denotes the stride of the l-th feature map relative to the input image.
This strategy enables high-level feature maps (with large receptive fields and large strides) to automatically generate large-scale anchors for covering large offshore ships, while low-level feature maps (with small receptive fields and small strides) produce small-scale anchors to enhance the detection of small nearshore targets. This dynamic matching design ensures that the anchor size is consistent with the receptive field of the corresponding feature layer, significantly improving the feature alignment for targets of different scales.
In addition to scale adaptation, we employ an anchor center alignment technique to correct the systematic error caused by placing anchor centers at the top-left corner of the feature map grid in traditional methods. The improved anchor center coordinates in the original image space are calculated as:
where represent the grid indices on the feature map, is the stride of the corresponding feature map, and are the anchor center coordinates in the original image. This offset strategy aligns the anchor centers with the actual receptive field centers of the feature map grid, significantly reducing spatial misalignment between anchors and target regions, and improving the positive sample matching rate, which is especially critical for small target detection.
Based on the scale-adaptive design, we further adopt a multi-aspect-ratio anchor combination strategy to improve coverage for ship targets with varying aspect ratios. The anchor set for each feature map level is formalized as:
where denotes the predefined set of aspect ratios (set to {1:3, 1:5, 1:7} in this work, to adapt to the elongated shape of SAR ship targets), and serves as the scalar reference size for generating anchors within the set . This design enables anchors to adapt in both scale and shape dimensions, thereby improving the coverage and matching quality with real ship targets of diverse sizes and aspect ratios.
3.5. ROI Head Module
The ROI Head module is responsible for performing fine-grained feature extraction, target classification, and bounding box regression on the rotated candidate regions generated by the RPN. Through an efficient rotation alignment mechanism, it achieves accurate recognition and localization of multi-angle targets. This module applies the Rotated RoIAlign operation to extract features corresponding to each rotated candidate box from the multi-scale feature maps output by the FPN. Rotated RoIAlign enables precise spatial sampling of rotated regions, avoiding the feature misalignment and background interference caused by traditional axis-aligned methods. This ensures that the extracted features strictly cover the true orientation and shape of the target.
For the features extracted by Rotated RoIAlign, the ROI Head employs two fully connected layers for high-dimensional encoding, producing richer semantic representations.The encoded features are then fed into two branches:
(1) Classification Branch: Outputs the target class probabilities to determine the object category in the proposal or whether it is background.
(2) Regression Branch: Predicts the precise parameters of the rotated bounding box, including center coordinates, width, height, and rotation angle, enabling fine adjustments of target location and orientation.
4. Experiments and Analysis
4.1. Datasets and Evaluation Protocol
To assess both the in-domain detection performance and the cross-dataset transferability of the proposed DN-AnchorNet, experiments were conducted on three publicly available SAR ship detection datasets with complementary characteristics, namely RSDD-SAR [39], SSDD+ [40], and HRSID [41]. The key statistics of these datasets, including the number of SAR images and annotated ship instances, are systematically summarized in Table 1.
These datasets differ substantially in scene complexity, target distribution, image resolution, scale range, and annotation specification. RSDD-SAR and SSDD+ are both dedicated coastal SAR ship detection datasets, containing abundant challenging samples with sea-land clutter interference, dense target docking, multi-scale ship targets, and low signal-to-noise ratio (SNR) conditions. HRSID is a widely used high-resolution SAR ship dataset annotated in COCO format, covering diverse imaging modes, radar platforms, and a balanced mix of open-sea and nearshore scenes. Its significant differences in imaging parameters and scene composition from RSDD-SAR make it an ideal benchmark for cross-dataset generalization evaluation.
It should be explicitly clarified that the evaluation protocol adopted in this study differs fundamentally from the standard protocol used in most existing SAR ship detection works, which is the core reason for the observed performance gap compared to the state-of-the-art (SOTA) results reported in the literature. Two critical design choices distinguish our evaluation framework, which are tailored to evaluate the practical deployment readiness of SAR ship detection models in real-world coastal monitoring scenarios, rather than pursuing optimal in-distribution performance on simplified benchmark tasks:
(1) For in-domain evaluation on RSDD-SAR and SSDD+, we intentionally curate the most challenging nearshore complex scene subsets as test sets, rather than using the full official test sets that contain a large proportion of simple open-sea samples;
(2) For cross-dataset generalization evaluation on HRSID, we adopt a strict zero-shot transfer setting, where no training or fine-tuning data from HRSID is utilized at any stage.
Specifically, the detailed experimental configurations for each dataset are described as follows.
For RSDD-SAR, the training set was directly taken from the predefined official training folder containing 5,000 images, which covers diverse imaging modes (strip-map, spotlight), polarization modes, and scene types (open sea, nearshore, harbor, island), providing representative and comprehensive training samples for coastal SAR ship detection. To rigorously evaluate performance under particularly challenging conditions, the test set was deliberately curated to represent a hard subset rather than the full dataset distribution. It consists of 159 carefully selected nearshore images that contain a high proportion of complex inshore scenes with severe sea-land clutter, dense target distribution, and extreme scale variation. These images were chosen to specifically stress-test detection in the most difficult coastal scenarios, rather than to provide an average performance over the entire RSDD-SAR benchmark. Consequently, the detection scores obtained on this subset are naturally lower than those reported on the standard, more balanced test split, and should be interpreted with this evaluation protocol in mind.
For SSDD+, we used 46 partitioned nearshore images from its official test set as our evaluation benchmark, excluding all open-sea samples with uniform backgrounds. These images predominantly feature noisy samples affected by severe speckle noise, low-contrast ship targets submerged in background clutter, and densely docked ships with overlapping bounding boxes. This test subset is particularly suitable for evaluating model robustness under low SNR and strong background interference conditions, which are common in real-world nearshore monitoring tasks. As with RSDD-SAR, this focused selection targets the most failure-prone cases, and the resulting performance metrics are expected to be conservative relative to evaluations on the complete SSDD+ test set.
To improve the transparency and reproducibility of the subset-based evaluation, the nearshore test subsets were selected according to explicit scene-level criteria, including the presence of sea-land clutter, harbor or island backgrounds, densely docked ships, small or weak ship targets, strong speckle noise, and large scale variation. The corresponding image lists for RSDD-SAR and SSDD+ are provided in the project repository to facilitate independent verification and fair comparison.
For the cross-dataset generalization task on HRSID, the experimental protocol introduces an even larger performance gap relative to standard in-domain results. Although the official HRSID dataset provides a standard split of 3,642 training images and 1,962 test images, the HRSID training set was entirely excluded from our experimental pipeline. All models were trained solely on the RSDD-SAR training set and directly evaluated on the full official HRSID test set without any fine-tuning, domain adaptation, or prior exposure to HRSID imaging characteristics, including radar frequency, resolution, incidence angle, and clutter statistics. This zero-shot cross-dataset transfer setting creates a significant domain shift and intentionally evaluates pure generalization ability across datasets, which is a far stricter test than standard in-domain training and evaluation. Because most previously reported high AP50 results on HRSID are obtained under in-domain training and testing protocols, the performance under our cross-dataset protocol is naturally lower and should be interpreted as a measure of transferability rather than absolute in-domain detection accuracy.
Overall, the above configurations intentionally prioritize evaluation on difficult, realistic nearshore scenes and cross-domain generalization over maximizing benchmark scores. The resulting AP50 values are thus expected to appear lower than those reported for methods optimized on standard, less adverse test sets or under in-domain training-testing protocols. This deliberate evaluation protocol allows for a more meaningful assessment of how well the proposed DN-AnchorNet may perform in actual operational coastal monitoring scenarios.
4.2. Implementation Details and Evaluation Metrics
To ensure the comparability and fairness of all experimental results, all tests for DN-AnchorNet were conducted under uniform conditions with Oriented R-CNN as the baseline model, with detailed experimental settings provided in Table 2. All input images were normalized and resized to the same resolution before being fed into the network.
Regarding the evaluation metrics, Recall, Precision, AP₅₀ and F1-score are adopted to evaluate the overall detection performance, while custom-defined False Positive Rate (FPR) and False Positives Per Image (FPPI) are used to quantify the false-alarm suppression capability of the model in cluttered coastal scenes.
Recall and Precision measure the model’s ability to cover real targets and avoid false detections, respectively. AP₅₀ denotes the average precision at the Intersection over Union (IoU) threshold of 0.5, and F1-score is the harmonic mean of Recall and Precision for comprehensive performance evaluation.
Considering that true negatives (TN) are not explicitly defined in dense SAR ship detection tasks, the FPR in this paper is custom-defined as the proportion of false positives in all predicted positive samples, with a lower value indicating better false-alarm suppression. It is calculated as:
where is the number of correctly detected ship targets, and is the number of false detections.
In addition, FPPI represents the average number of false positives per test image, which can intuitively reflect the model’s performance in practical maritime surveillance scenarios. It is calculated as:
where denotes the total number of false detections across all test images, and denotes the total number of test images.
4.3. Ablation Studies
To systematically validate the effectiveness of each proposed module and their synergistic effects, we conduct two groups of ablation experiments: individual module ablation and combined module ablation.
4.3.1. Individual Module Ablation
This section evaluates the impact of individual modules on target detection performance. Separate validation experiments were conducted on the image denoising module, adaptive anchor mechanism, and Adaptive Smooth L1 loss, with results summarized in Table 3 and Table 4.
On the RSDD-SAR test set, the denoising module delivers the most significant improvement, increasing Recall from 0.723 to 0.787 (+8.9%) and F1-score from 0.663 to 0.735 (+10.8%), while reducing FPR from 38.77 to 31.13 (−19.7%) and FPPI from 1.71 to 1.33 (−22.2%), indicating enhanced feature discriminability and reduced background noise interference. The adaptive anchor mechanism improves proposal quality and localization, boosting Recall to 0.752 (+4.0%) and F1-score to 0.688 (+3.8%), with moderate reductions in FPR and FPPI. The Adaptive Smooth L1 loss primarily enhances bounding-box regression stability, with F1-score rising from 0.663 to 0.676 (+2.0%) and FPR decreasing from 38.77 to 37.04 (−4.5%). Together, these modules improve the framework from three complementary perspectives: input restoration, proposal matching, and regression refinement.
On the SSDD+ test set, similar trends are observed. The denoising module increases Precision from 0.582 to 0.713 (+22.5%) and F1-score from 0.609 to 0.665 (+9.2%), while reducing FPR from 41.80 to 28.67 (−31.4%) and FPPI from 1.72 to 0.93 (−45.9%). The adaptive anchor mechanism improves performance under scale variation, with AP50 increasing from 0.579 to 0.591 and F1-score rising from 0.609 to 0.629. The Adaptive Smooth L1 loss also improves regression stability, increasing AP50 to 0.588 and reducing FPPI from 1.72 to 1.46 (−15.1%). These results suggest that the three modules provide consistent but different contributions under complex maritime conditions, with the denoising module showing the strongest individual effect on SSDD+.
Figure 4 shows a comparison of SAR images before and after denoising. It can be seen that the denoising module suppresses speckle noise while preserving the edge structures of ship targets, resulting in more distinguishable target–background contrast.
Figure 5 and Figure 6 present qualitative comparisons for dense-target and strong-noise scenarios, respectively. In the dense-target case (Figure 5), the adaptive-anchor variant achieves superior target coverage compared with the baseline, demonstrating that scale-adaptive anchor allocation enhances proposal matching for densely distributed ship targets. In the strong-noise condition (Figure 6), the denoising module effectively reduces spurious detections, which reveals that the structure-preserving enhancement branch can mitigate noise interference. These visual observations serve as qualitative evidence and should be analyzed alongside the quantitative results in Table 3 and Table 4. Corresponding results confirm that the adaptive-anchor mechanism improves detection coverage, while the denoising module yields substantial reductions in FPR and FPPI.
4.3.2. Combined Module Ablation
To comprehensively evaluate the specific impact of each improvement module on target detection performance, we tested different combinations of the image denoising module, adaptive anchor mechanism, and Adaptive Smooth L1 loss, and observed the performance under various configurations.
As shown in Table 5, on the RSDD-SAR test set, the combination of the denoising module and the adaptive anchor mechanism increased Recall to 0.799 and yielded an F1-score of 0.750; the false-positive metrics FPR and FPPI were 29.27 and 1.24, respectively, indicating that this combination maintains high recall while also reducing false alarms. When the denoising module was paired with the Adaptive Smooth L1 loss, the F1-score remained 0.750, but FPR decreased further to 26.91 and FPPI to 1.06, suggesting that the loss modification helps refine the regression decision boundary. By contrast, the combination of the adaptive anchor mechanism and the Adaptive Smooth L1 loss achieved the lowest precision and recall among all pairwise combinations, resulting in a lower F1-score (0.691) and significantly higher false-positive indicators, which severely limited the overall performance. The full integration of all three modules achieved the best overall result, with Recall of 0.762, Precision of 0.752, AP50 of 0.699, F1-score of 0.757, FPR of 24.83, and FPPI of 0.94. Compared with the baseline in Table 3, this full configuration improves AP50 by 8.0% (0.647 → 0.699), increases F1-score by 14.2% (0.663 → 0.757), reduces FPR by 36.0% (38.77 → 24.83), and lowers FPPI by 45.0% (1.71 → 0.94).
As shown in Table 6, consistent performance trends emerge on the SSDD+ dataset. The combination of denoising and adaptive anchors achieves an F1-score of 0.667 with 0.85 false alarms per image (FPPI), demonstrating stable performance. When integrating denoising with the Adaptive Smooth L1 loss, the F1-score slightly decreases to 0.651 while FPPI increases to 0.89. The adaptive-anchor and Adaptive Smooth L1 configuration yields comparable results (F1-score: 0.655, FPPI: 1.22). The tri-module integration again delivers the best overall performance, with Recall of 0.685, Precision of 0.726, AP50 of 0.610, F1-score of 0.689, FPR of 25.39, and FPPI of 0.80. Compared with the baseline in Table 4, this full configuration improves AP50 by 5.4% (0.579 → 0.610), increases F1-score by 13.1% (0.609 → 0.689), reduces FPR by 39.3% (41.80 → 25.39), and lowers FPPI by 53.5% (1.72 → 0.80).
In summary, the denoising module, the adaptive anchor mechanism, and the Adaptive Smooth L1 loss demonstrated consistent and complementary benefits across two representative SAR datasets. The denoising module contributed most strongly to false-positive suppression and feature purification, the adaptive anchor mechanism improved proposal matching for geometrically diverse ships, and the Adaptive Smooth L1 loss enhanced localization stability. Their joint application produced the best overall results in terms of AP50, F1-score, FPR, and FPPI, showing that coordinated optimization across image restoration, anchor adaptation, and regression refinement is more effective than introducing any single component alone.
4.4. Overall Performance Comparison
To provide a broader comparison with representative oriented object detectors under the current experimental setting, three two-stage rotated object detectors were selected as comparison baselines: Faster R-CNN [20], RoI Transformer [29], and Gliding Vertex [30]. In addition, two widely used anchor-free single-stage oriented detectors, YOLOv8-OBB [31] and H2RBOX-URC [32], were included to provide a more comprehensive evaluation. To improve fairness, all compared models were trained under the same input resolution, optimizer setting, learning-rate schedule, and training-epoch configuration as described in Table 2. All reported results are presented as mean ± standard deviation over three independent runs, so as to provide a more reliable evaluation of both detection performance and experimental stability.
As shown in Table 7, DN-AnchorNet achieves the highest mean AP₅₀ and F1-score on the RSDD-SAR test set among the compared methods, reaching 0.699 ± 0.007 in AP₅₀ and 0.757 ± 0.006 in F1-score. Its Recall is 0.762 ± 0.007, which is comparable to Faster R-CNN (0.765 ± 0.012), RoI Transformer (0.768 ± 0.008), and Gliding Vertex (0.762 ± 0.007), while its Precision of 0.752 ± 0.006 is also among the highest results and is only slightly lower than that of H2RBOX-URC (0.790 ± 0.011). These results indicate that the proposed combination of denoising, adaptive anchor generation, and regression refinement improves the balance between detection coverage and localization quality in complex coastal SAR scenes. Compared with Faster R-CNN in terms of mean performance, DN-AnchorNet improves AP₅₀ from 0.616 to 0.699 and F1-score from 0.549 to 0.757, while reducing FPR from 57.14 to 24.83 and FPPI from 3.82 to 0.94. Compared with Gliding Vertex, DN-AnchorNet also shows clear gains in AP₅₀, F1-score, and false-alarm-related metrics.
It is also worth noting that DN-AnchorNet does not achieve the lowest false-positive indicators on the RSDD-SAR test set. Anchor-free single-stage detectors such as YOLOv8-OBB and H2RBOX-URC obtain lower mean FPR/FPPI values, namely 23.10 ± 1.88 / 0.85 ± 0.28 and 18.08 ± 1.92 / 0.51 ± 0.30, respectively, compared with DN-AnchorNet, which obtains 24.83 ± 0.99 / 0.94 ± 0.16. However, these lower false-positive rates are accompanied by substantially lower Recall and AP₅₀. Specifically, YOLOv8-OBB and H2RBOX-URC achieve mean Recall values of 0.370 ± 0.014 and 0.512 ± 0.018, and mean AP₅₀ values of 0.507 ± 0.009 and 0.493 ± 0.011, respectively, which are all clearly below those of DN-AnchorNet. This suggests that their lower false-positive rates are partly associated with more conservative detection behavior and reduced target coverage, especially for small or low-contrast vessels. By contrast, DN-AnchorNet maintains the highest mean AP₅₀ and F1-score while preserving competitive precision and relatively low false-positive indicators, indicating a more favorable trade-off between detection coverage and false-alarm suppression.
As presented in Table 8, DN-AnchorNet also achieves the highest mean AP₅₀ and F1-score on the SSDD+ test set among all compared methods. Specifically, it obtains the highest Recall of 0.685 ± 0.007, the highest AP₅₀ of 0.610 ± 0.009, and the highest F1-score of 0.689 ± 0.009. Its Precision reaches 0.726 ± 0.010, which is the second-highest value overall, slightly lower than H2RBOX-URC (0.810 ± 0.008), but higher than YOLOv8-OBB (0.712 ± 0.012) and all compared two-stage detectors. These results suggest that DN-AnchorNet maintains strong detection coverage and competitive classification quality under the SSDD+ setting. Compared with Faster R-CNN in terms of mean performance, DN-AnchorNet improves AP₅₀ from 0.474 to 0.610 and F1-score from 0.532 to 0.689, while reducing FPR from 50.98 to 25.39 and FPPI from 2.26 to 0.80. Compared with RoI Transformer, DN-AnchorNet still achieves higher mean AP₅₀ and F1-score, further demonstrating the effectiveness of the proposed framework under different coastal SAR conditions.
Similar to the RSDD-SAR case, DN-AnchorNet does not provide the lowest FPR or FPPI on SSDD+. H2RBOX-URC achieves the minimum mean FPR/FPPI values, namely 15.89 ± 1.66 / 0.46 ± 0.65, whereas DN-AnchorNet attains 25.39 ± 0.88 / 0.80 ± 0.32, which are still clearly lower than those of Faster R-CNN (50.98 ± 1.12 / 2.26 ± 0.41) and Gliding Vertex (43.33 ± 1.41 / 1.70 ± 0.56). YOLOv8-OBB also reports a slightly higher FPR (27.69 ± 1.27) and FPPI (0.90 ± 0.49) than DN-AnchorNet, while suffering from the lowest Recall (0.344 ± 0.017) and a much lower AP₅₀ (0.450 ± 0.012). These observations indicate that DN-AnchorNet does not minimize false alarms at the expense of target coverage; instead, it preserves stronger detection capability while maintaining relatively low false-positive indicators. Moreover, the small standard deviations of DN-AnchorNet on both datasets suggest that its performance remains stable across the three repeated runs.
Figure 7 presents comparative detection results across multiple models, evaluating performance on two representative SAR images containing small, medium, and large vessels under complex backgrounds. In the first test case, Faster R-CNN produces 3 false positives (FPs) and 2 false negatives (FNs), RoI Transformer generates 4 FPs and 3 FNs, and Gliding Vertex achieves 2 FPs and 2 FNs. YOLOv8-OBB yields 3 FPs and 6 FNs, while H2RBOX-URC results in 3 FPs and 1 FN. In contrast, DN-AnchorNet reduces these errors to 2 FPs and 1 FN. In the second challenging scenario, YOLOv8-OBB outputs 1 FP and 1 FN, whereas H2RBOX-URC produces 2 FPs and 1 FN. DN-AnchorNet detects all targets without false alarms (0 FPs, 0 FNs), showing qualitatively stronger robustness in the presented cluttered coastal cases. However, these visual examples are intended as qualitative evidence and should be interpreted together with the quantitative results in Table 7 and Table 8.
The experimental results demonstrate that DN-AnchorNet achieves higher AP₅₀ and F1-score than the compared methods on the two evaluated datasets, while maintaining competitive precision and relatively low false-positive indicators. These results support the effectiveness of the proposed denoising branch, adaptive anchor mechanism, and Adaptive Smooth L1 loss for coastal SAR ship detection in noisy and cluttered environments. Nevertheless, further validation on larger-scale and more diverse SAR datasets would be valuable for a more comprehensive assessment of generalization.
4.5. Cross-Dataset Generalization on HRSID
To examine whether the proposed DN-AnchorNet can be transferred to unseen SAR data distributions, an additional cross-dataset generalization experiment was conducted on the HRSID dataset. Different from the in-domain evaluations on RSDD-SAR and SSDD+, HRSID was not used for model training or fine-tuning in this study. Instead, all models were trained only on the RSDD-SAR training set and then directly evaluated on the full official HRSID test set containing 1,962 images. This setting introduces a clear domain shift between the training and testing data, including differences in imaging conditions, scene distribution, target scale, background complexity, and annotation characteristics. Therefore, this experiment is used as a supplementary evaluation to assess the transferability and robustness of the proposed framework under unseen SAR ship detection scenarios.
The experimental results are reported in Table 9. Compared with the baseline Oriented R-CNN, DN-AnchorNet improves Recall from 0.651 to 0.668, Precision from 0.685 to 0.716, AP₅₀ from 0.594 to 0.619, and F1-score from 0.668 to 0.689. Meanwhile, FPR decreases from 18.93 to 17.94, and FPPI decreases from 0.51 to 0.42. These results indicate that the proposed framework not only improves in-domain detection performance, but also provides better cross-dataset robustness under distribution shifts.
Among all compared methods, DN-AnchorNet achieves the best overall performance on the full official HRSID test set, with the highest Recall, Precision, AP₅₀, and F1-score, as well as the lowest FPR and FPPI. This demonstrates that the proposed framework can better preserve target coverage while suppressing false alarms under cross-dataset conditions. Specifically, the structure-preserving denoising branch helps reduce dataset-specific noise and background interference, the adaptive anchor mechanism improves proposal matching for ships with different scales and aspect ratios, and the adaptive Smooth L1 loss enhances localization robustness when the testing data distribution differs from the training set.
Compared with other representative rotated detectors, DN-AnchorNet shows a more balanced performance in both detection accuracy and false-alarm suppression. For example, RoI Transformer and Gliding Vertex obtain relatively competitive Precision values, but their Recall and F1-score are lower than those of DN-AnchorNet. Faster R-CNN shows higher false-positive indicators, with FPR and FPPI reaching 34.85 and 1.00, respectively. In contrast, DN-AnchorNet achieves the lowest FPR of 17.94 and the lowest FPPI of 0.42, indicating that it can reduce false detections while maintaining stronger target detection capability. Overall, the HRSID generalization experiment provides supplementary evidence for the transferability and robustness of DN-AnchorNet across different SAR ship detection datasets.
5. Conclusions and Future Work
This paper addresses the coupled challenges of speckle noise, large scale variation, sea-land background clutter, and severe sample imbalance in nearshore SAR ship detection for marine engineering and coastal safety applications. We propose DN-AnchorNet, an end-to-end unified detection framework that jointly integrates a structure-preserving denoising branch, a scale-adaptive anchor generation mechanism, and an adaptive weighted Smooth L1 regression loss.
Experimental results on the challenging nearshore-only subsets of RSDD-SAR and SSDD+ marine SAR benchmarks demonstrate that DN-AnchorNet achieves higher AP₅₀ and F1-score than all compared representative oriented object detectors, while maintaining competitive precision and significantly lower false alarm rates. These results confirm that coordinated optimization across detection-oriented enhancement, anchor adaptation, and regression refinement provides a more practical solution for operational coastal marine monitoring systems, especially in cluttered environments with small, weak, or densely docked ship targets. Furthermore, the strict zero-shot cross-dataset evaluation on HRSID shows that, when trained solely on RSDD-SAR and tested on the full HRSID test set without any fine-tuning, DN-AnchorNet still attains the best overall performance, indicating that the proposed joint optimization framework effectively enhances generalization ability across unseen marine SAR imaging conditions.
Nevertheless, the proposed framework still has several limitations that need to be addressed in future work. First, the additional computational cost introduced by the denoising branch may limit its applicability in real-time on-board processing scenarios, such as satellite-borne SAR systems, unmanned surface vehicles (USVs), and edge computing devices deployed at sea. Second, although experiments on three widely used marine SAR datasets demonstrate the effectiveness and transferability of the proposed method, further validation on larger-scale datasets covering different sea states, radar frequencies, geographical regions, and imaging modes is still needed to comprehensively assess its robustness in diverse marine environments. Third, systematic statistical analysis of repeated experiments and controlled robustness evaluation under extreme marine conditions (such as high sea states and heavy rainfall) would provide more solid evidence for the stability of the reported improvements.
Therefore, future work will focus on the following directions: (1) lightweight network design and model quantization for real-time deployment on resource-constrained marine platforms; (2) unsupervised cross-domain adaptation techniques to improve performance across different SAR sensors and marine regions; (3) systematic robustness benchmarking under varying noise levels and sea conditions; and (4) extending the proposed framework to other critical marine SAR interpretation tasks, such as oil spill detection, offshore platform monitoring, and marine debris tracking.
Author Contributions
Conceptualization, Yongqi Kang; methodology, Yongqi Kang and Haiping Qu; software, Yongqi Kang; validation, Yongqi Kang; formal analysis, Yongqi Kang; investigation, Yongqi Kang; resources, Haiping Qu; data curation, Yongqi Kang; writing—original draft preparation, Yongqi Kang; writing—review and editing, Haiping Qu; visualization, Yongqi Kang; supervision, Haiping Qu; project administration, Haiping Qu; funding acquisition, Haiping Qu. All authors have read and agreed to the published version of the manuscript.
Funding
This research was funded by the Natural Science Foundation of Shandong Province, China (Grant No. ZR2022MF292).
Data Availability Statement
The Code presented in this article are publicly available in https://github.com/yongqi011210/Dn-anchornet. The public datasets RSDD-SAR, SSDD+ and HRSID used in this study are available from the corresponding authors of the respective datasets, with detailed information provided in the References section.
Acknowledgments
We sincerely acknowledge the contributors of the RSDD-SAR, SSDD+ and HRSID datasets for making their data publicly available, which has supported this research work.
Conflicts of Interest
The authors declare no conflicts of interest. The funders had no role in the design of the study; in the collection, analyses, or interpretation of data; in the writing of the manuscript; or in the decision to publish the results.
References
- Cao, S.; Zhao, C.; Dong, J.; Fu, X. Ship Detection in Synthetic Aperture Radar Images under Complex Geographical Environments, Based on Deep Learning and Morphological Networks. Sensors 2024, 24, 4290. [CrossRef]
- Chen, H.; He, M.; Yang, Z.; Gan, L. MCEM: Multi-Cue Fusion with Clutter Invariant Learning for Real-Time SAR Ship Detection. Sensors 2025, 25, 5736. [CrossRef]
- Li, J.; Xu, C.; Su, H.; Gao, L.; Wang, T. Deep Learning for SAR Ship Detection: Past, Present and Future. Remote Sens. 2022, 14, 2712. [CrossRef]
- Shin, S.; Kim, Y.; Hwang, I.; Kim, J.; Kim, S. Coupling Denoising to Detection for SAR Imagery. Appl. Sci. 2021, 11, 5569. [CrossRef]
- Zhao, X.; Zhang, B.; Tian, Z.; Xu, C.; Wu, F.; Sun, C. An Anchor-Free Method for Arbitrary-Oriented Ship Detection in SAR Images. In Proceedings of the 2021 SAR in Big Data Era (BIGSARDATA), Nanjing, China, 22–24 September 2021; pp. 1–4. [CrossRef]
- Lin, T.-Y.; Goyal, P.; Girshick, R.; He, K.; Dollár, P. Focal Loss for Dense Object Detection. IEEE Trans. Pattern Anal. Mach. Intell. 2020, 42, 318–327. [CrossRef]
- Girshick, R. Fast R-CNN. In Proceedings of the IEEE International Conference on Computer Vision, Santiago, Chile, 7–13 December 2015; pp. 1440–1448. [CrossRef]
- Lee, J.S. Digital image enhancement and noise filtering by use of local statistics. IEEE Trans. Pattern Anal. Mach. Intell. 1980, PAMI-2, 165–168. [CrossRef]
- Frost, V.S.; Stiles, J.A.; Shanmugan, K.S.; Holtzman, J.C. A model for radar images and its application to adaptive digital filtering of multiplicative noise. IEEE Trans. Pattern Anal. Mach. Intell. 1982, PAMI-4, 157–166. [CrossRef]
- Lee, J.S.; Wen, J.H.; Ainsworth, T.L.; Chen, K.S.; Chen, A.J. Improved sigma filter for speckle filtering of SAR imagery. IEEE Trans. Geosci. Remote Sens. 2009, 47, 202–213. [CrossRef]
- Wang, P.; Zhang, H.; Patel, V.M. SAR image despeckling using a convolutional neural network. IEEE Signal Process. Lett. 2017, 24, 1763–1767. [CrossRef]
- Guo, J.; Li, Y.; Liu, H.; Li, W. Compact convolutional autoencoder for SAR target recognition. IET Radar Sonar Navig. 2020, 14, 967–972. [CrossRef]
- Ronneberger, O.; Fischer, P.; Brox, T. U-Net: Convolutional Networks for Biomedical Image Segmentation. In Proceedings of the International Conference on Medical Image Computing and Computer-Assisted Intervention, Munich, Germany, 5–9 October 2015; pp. 234–241. [CrossRef]
- Yao, X.; Shen, Y.; Lei, Y. FSMD–Net: Joint Spatial–Channel Spectral Modeling for SAR Ship Detection in Complex Inshore Scenarios. Remote Sens. 2026, 18, 1254. [CrossRef]
- Tang, J.; Zhang, F.; Ma, F.; Gao, F.; Yin, Q.; Zhou, Y. How SAR Image Denoise Affects the Performance of DCNN-Based Target Recognition Method. In Proceedings of the 2021 IEEE International Geoscience and Remote Sensing Symposium (IGARSS), Brussels, Belgium, 11–16 July 2021; pp. 3609–3612. [CrossRef]
- Zhang, X.; Huo, C.; Xu, N.; Jiang, H.; Cao, Y.; Ni, L.; Pan, C. Multitask Learning for Ship Detection From Synthetic Aperture Radar Images. IEEE J. Sel. Top. Appl. Earth Obs. Remote Sens. 2021, 14, 8048–8062. [CrossRef]
- Zhao, M.; Zhang, X.; Kaup, A. Multitask Learning for SAR Ship Detection With Gaussian-Mask Joint Segmentation. IEEE Transactions on Geoscience and Remote Sensing 2023, 61, 1–16. [CrossRef]
- Pan, Y.; Ye, L.; Xu, Y.; Liang, J. Integrating Prior Knowledge into Attention for Ship Detection in SAR Images. Appl. Sci. 2023, 13, 2941. [CrossRef]
- Liu, W.; Anguelov, D.; Erhan, D.; Szegedy, C.; Reed, S.; Fu, C.-Y.; Berg, A.C. SSD: Single Shot MultiBox Detector. In Proceedings of the European Conference on Computer Vision, Amsterdam, The Netherlands, 11–14 October 2016; pp. 21–37. [CrossRef]
- Ren, S.; He, K.; Girshick, R.; Sun, J. Faster R-CNN: Towards Real-Time Object Detection with Region Proposal Networks. IEEE Trans. Pattern Anal. Mach. Intell. 2017, 39, 1137–1149. [CrossRef]
- Lin, T.-Y.; Dollár, P.; Girshick, R.; He, K.; Hariharan, B.; Belongie, S. Feature Pyramid Networks for Object Detection. In Proceedings of the IEEE Conference on Computer Vision and Pattern Recognition, Honolulu, HI, USA, 21–26 July 2017; pp. 936–944. [CrossRef]
- Liu, J.; Liao, D.; Wang, X.; Li, J.; Yang, B.; Chen, G. LCAS-DetNet: A Ship Target Detection Network for Synthetic Aperture Radar Images. Appl. Sci. 2024, 14, 5322. [CrossRef]
- Zhou, X.; Wang, D.; Krähenbühl, P. Objects as points. arXiv 2019, arXiv:1904.07850. https://arxiv.org/abs/1904.07850.
- Tian, Z.; Shen, C.; Chen, H.; He, T. FCOS: Fully Convolutional One-Stage Object Detection. In Proceedings of the IEEE/CVF International Conference on Computer Vision, Seoul, Republic of Korea, 27 October–2 November 2019; pp. 9626–9635. [CrossRef]
- Law, H.; Deng, J. CornerNet: Detecting Objects as Paired Keypoints. Int. J. Comput. Vis. 2020, 128, 642–656. [CrossRef]
- Kong, T.; Sun, F.; Liu, H.; Jiang, Y.; Li, L.; Shi, J. FoveaBox: Beyond Anchor-based Object Detection. IEEE Trans. Image Process. 2020, 29, 7389–7398. [CrossRef]
- Yang, X.; Li, W.; Wang, H.; Wang, P.; Fu, K. R3Det: Refined Single-Stage Detector with Feature Refinement for Rotating Object. In Proceedings of the AAAI Conference on Artificial Intelligence, Virtual Event, 2–9 February 2021; pp. 3163–3171. [CrossRef]
- Xie, X.; Cheng, G.; Wang, J.; Yao, X.; Han, J. Oriented R-CNN for Object Detection. In Proceedings of the IEEE/CVF International Conference on Computer Vision, Montreal, QC, Canada, 11–17 October 2021; pp. 3500–3509. [CrossRef]
- Ding, J.; Xue, N.; Long, Y.; Xia, G.-S.; Lu, Q. Learning RoI Transformer for Oriented Object Detection in Aerial Images. In Proceedings of the IEEE/CVF Conference on Computer Vision and Pattern Recognition, Long Beach, CA, USA, 15–20 June 2019; pp. 2844–2853. [CrossRef]
- Xu, Y.; Fu, M.; Wang, Q.; Wang, Y.; Chen, K.; Xia, G.-S.; Bai, X. Gliding Vertex on the Horizontal Bounding Box for Multi-Oriented Object Detection. IEEE Trans. Pattern Anal. Mach. Intell. 2021, 43, 1452–1459. [CrossRef]
- Jocher, G.; Chaurasia, A.; Qiu, J. Ultralytics YOLO (Version 8.0.0) [Computer software]. Ultralytics, 2023. Available online: https://github.com/ultralytics/ultralytics (accessed on 20 April 2026).
- Zhang, X.; Yang, X.; Li, Y.; Yang, J.; Cheng, M.-M.; Li, X. RSAR: Restricted State Angle Resolver and Rotated SAR Benchmark. In Proceedings of the IEEE/CVF Conference on Computer Vision and Pattern Recognition (CVPR), Nashville, TN, USA, 10–17 June 2025; pp. 7416–7426. [CrossRef]
- Rezatofighi, H.; Tsoi, N.; Gwak, J.Y.; Sadeghian, A.; Reid, I.; Savarese, S. Generalized Intersection over Union: A Metric and A Loss for Bounding Box Regression. In Proceedings of the IEEE/CVF Conference on Computer Vision and Pattern Recognition, Long Beach, CA, USA, 15–20 June 2019; pp. 658–666. [CrossRef]
- Zheng, Z.; Wang, P.; Liu, W.; Li, J.; Ye, R.; Ren, D. Distance-IoU Loss: Faster and Better Learning for Bounding Box Regression. In Proceedings of the AAAI Conference on Artificial Intelligence, New York, NY, USA, 7–12 February 2020; pp. 12993–13000. [CrossRef]
- Zhang, H.; Wang, Y.; Dayoub, F.; Sunderhauf, N. VarifocalNet: An IoU-aware Dense Object Detector. In Proceedings of the IEEE/CVF Conference on Computer Vision and Pattern Recognition, Nashville, TN, USA, 20–25 June 2021; pp. 8510–8519. [CrossRef]
- Geng, Z.; Xu, Y.; Wang, B.-N.; Yu, X.; Zhu, D.-Y.; Zhang, G. Target Recognition in SAR Images by Deep Learning with Training Data Augmentation. Sensors 2023, 23, 941. [CrossRef]
- Zhao, P.; Chen, J.; Wan, H.; Cao, Y.; Wang, S.; Zhang, Y.; Li, Y.; Huang, Z.; Wu, B. Few-Shot Object Detection for SAR Images via Context-Aware and Robust Gaussian Flow Representation. Remote Sens. 2025, 17, 391. [CrossRef]
- He, K.; Zhang, X.; Ren, S.; Sun, J. Deep Residual Learning for Image Recognition. In Proceedings of the 2016 IEEE Conference on Computer Vision and Pattern Recognition (CVPR), Las Vegas, NV, USA, 27–30 June 2016; pp. 770–778. [CrossRef]
- Xu, C.; Su, H.; Li, J.; Liu, Y.; Yao, L.; Gao, L.; Yan, W.; Wang, T. RSDD-SAR: Rotated ship detection dataset in SAR images. J. Radars 2022, 11, 581–599. [CrossRef]
- Zhang, T.; Zhang, X.; Li, J.; Wang, B.; Xu, X. SAR Ship Detection Dataset (SSDD): Official Release and Comprehensive Data Analysis. Remote Sens. 2021, 13, 3690. [CrossRef]
- Wei, S.; Zeng, X.; Qu, Q.; Wang, M.; Su, H.; Shi, J. HRSID: A High-Resolution SAR Images Dataset for Ship Detection and Instance Segmentation. IEEE Access 2020, 8, 120234–120254. [CrossRef]
Figure 1.
The overall architecture for DN-AnchorNet.
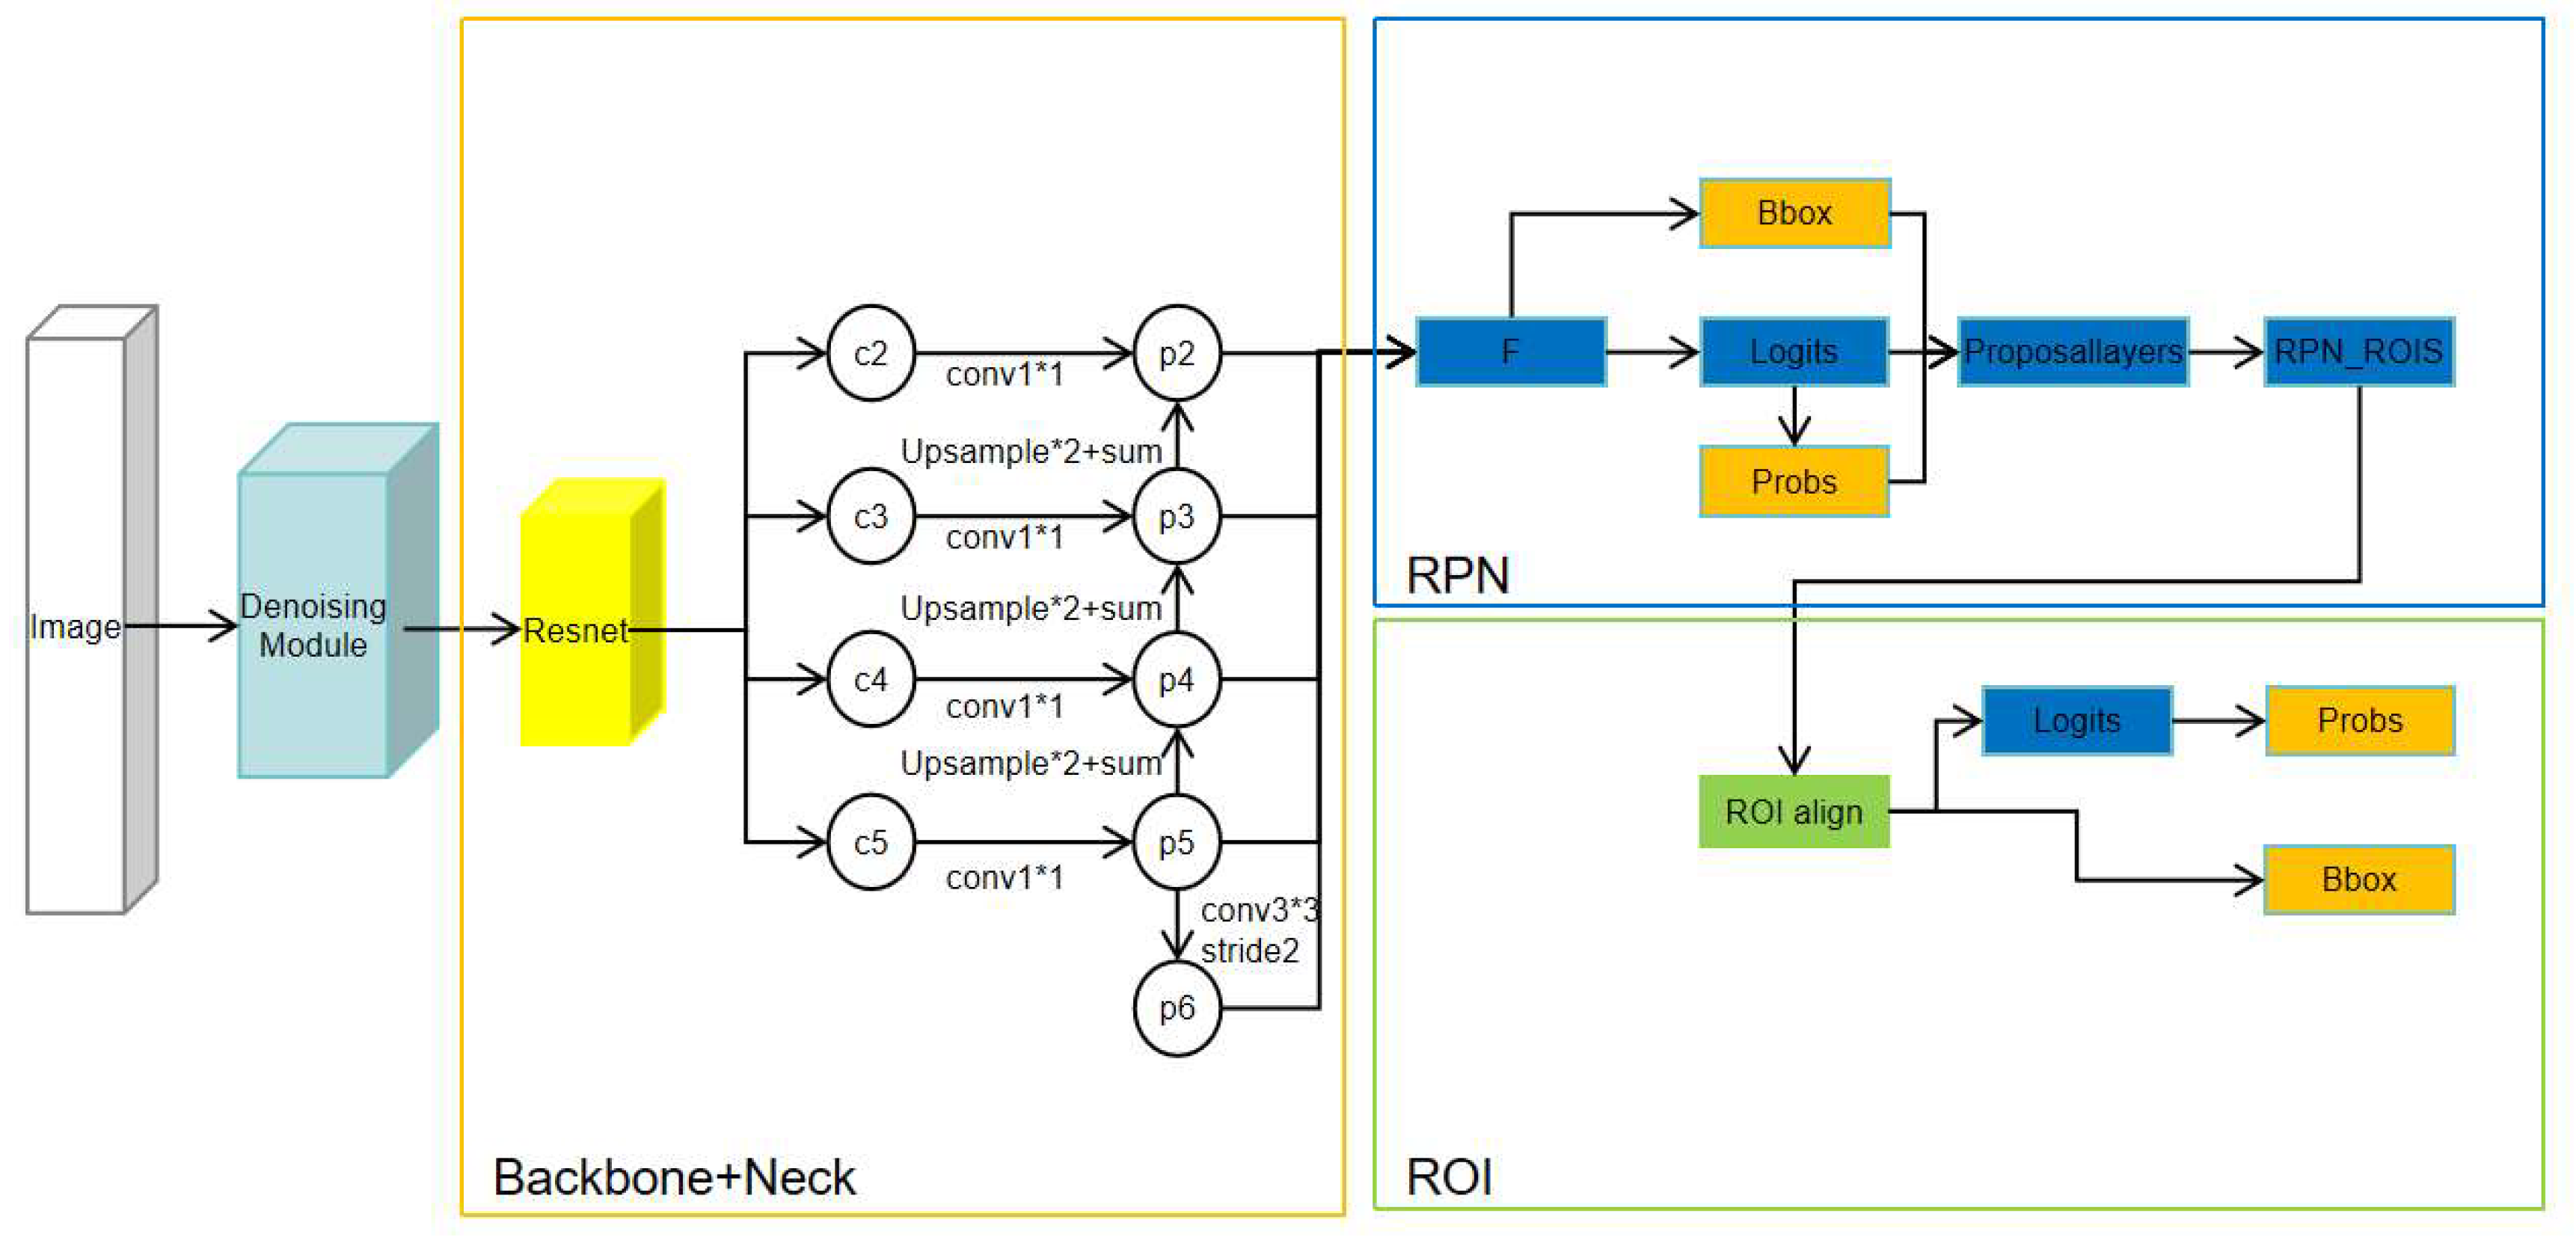
Figure 2.
The model architecture for Denoising Module.
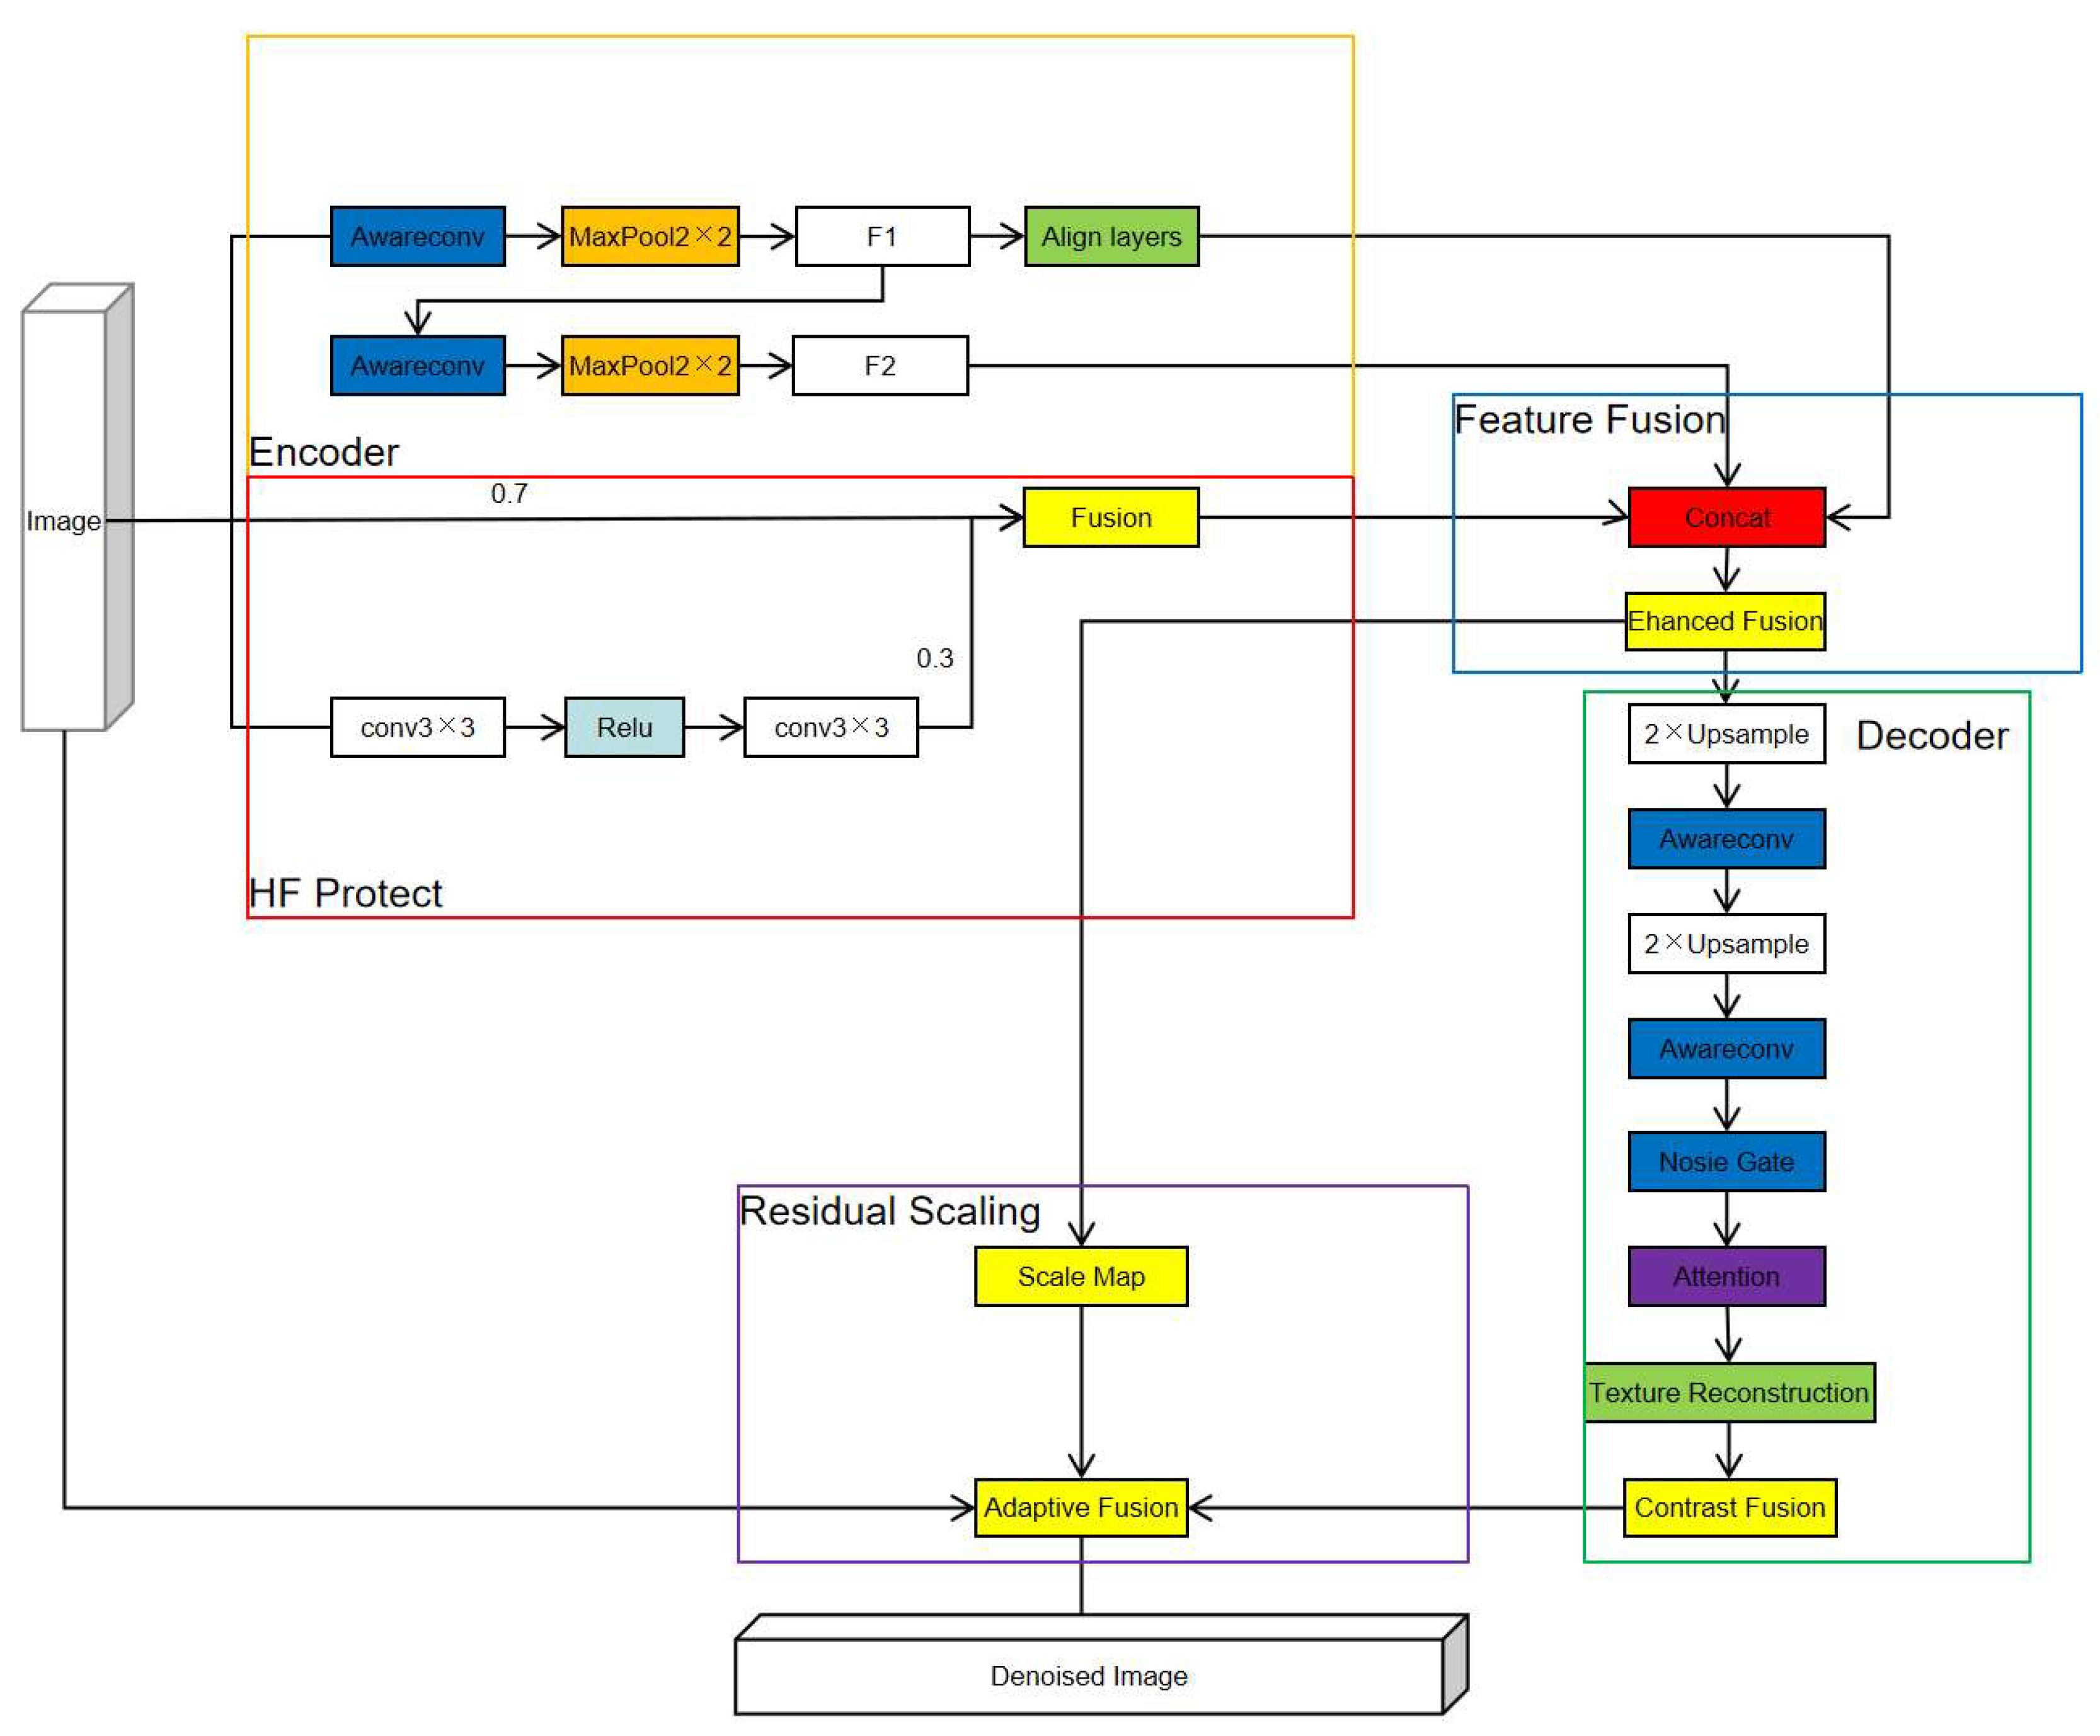
Figure 3.
Schematic illustration of the proposed adaptive anchor generation strategy in the RPN. Different feature pyramid levels generate anchors with adaptive scales, refined center positions, and flexible aspect ratios, thereby improving proposal matching for ship targets with diverse sizes and elongated shapes.
Figure 3.
Schematic illustration of the proposed adaptive anchor generation strategy in the RPN. Different feature pyramid levels generate anchors with adaptive scales, refined center positions, and flexible aspect ratios, thereby improving proposal matching for ship targets with diverse sizes and elongated shapes.
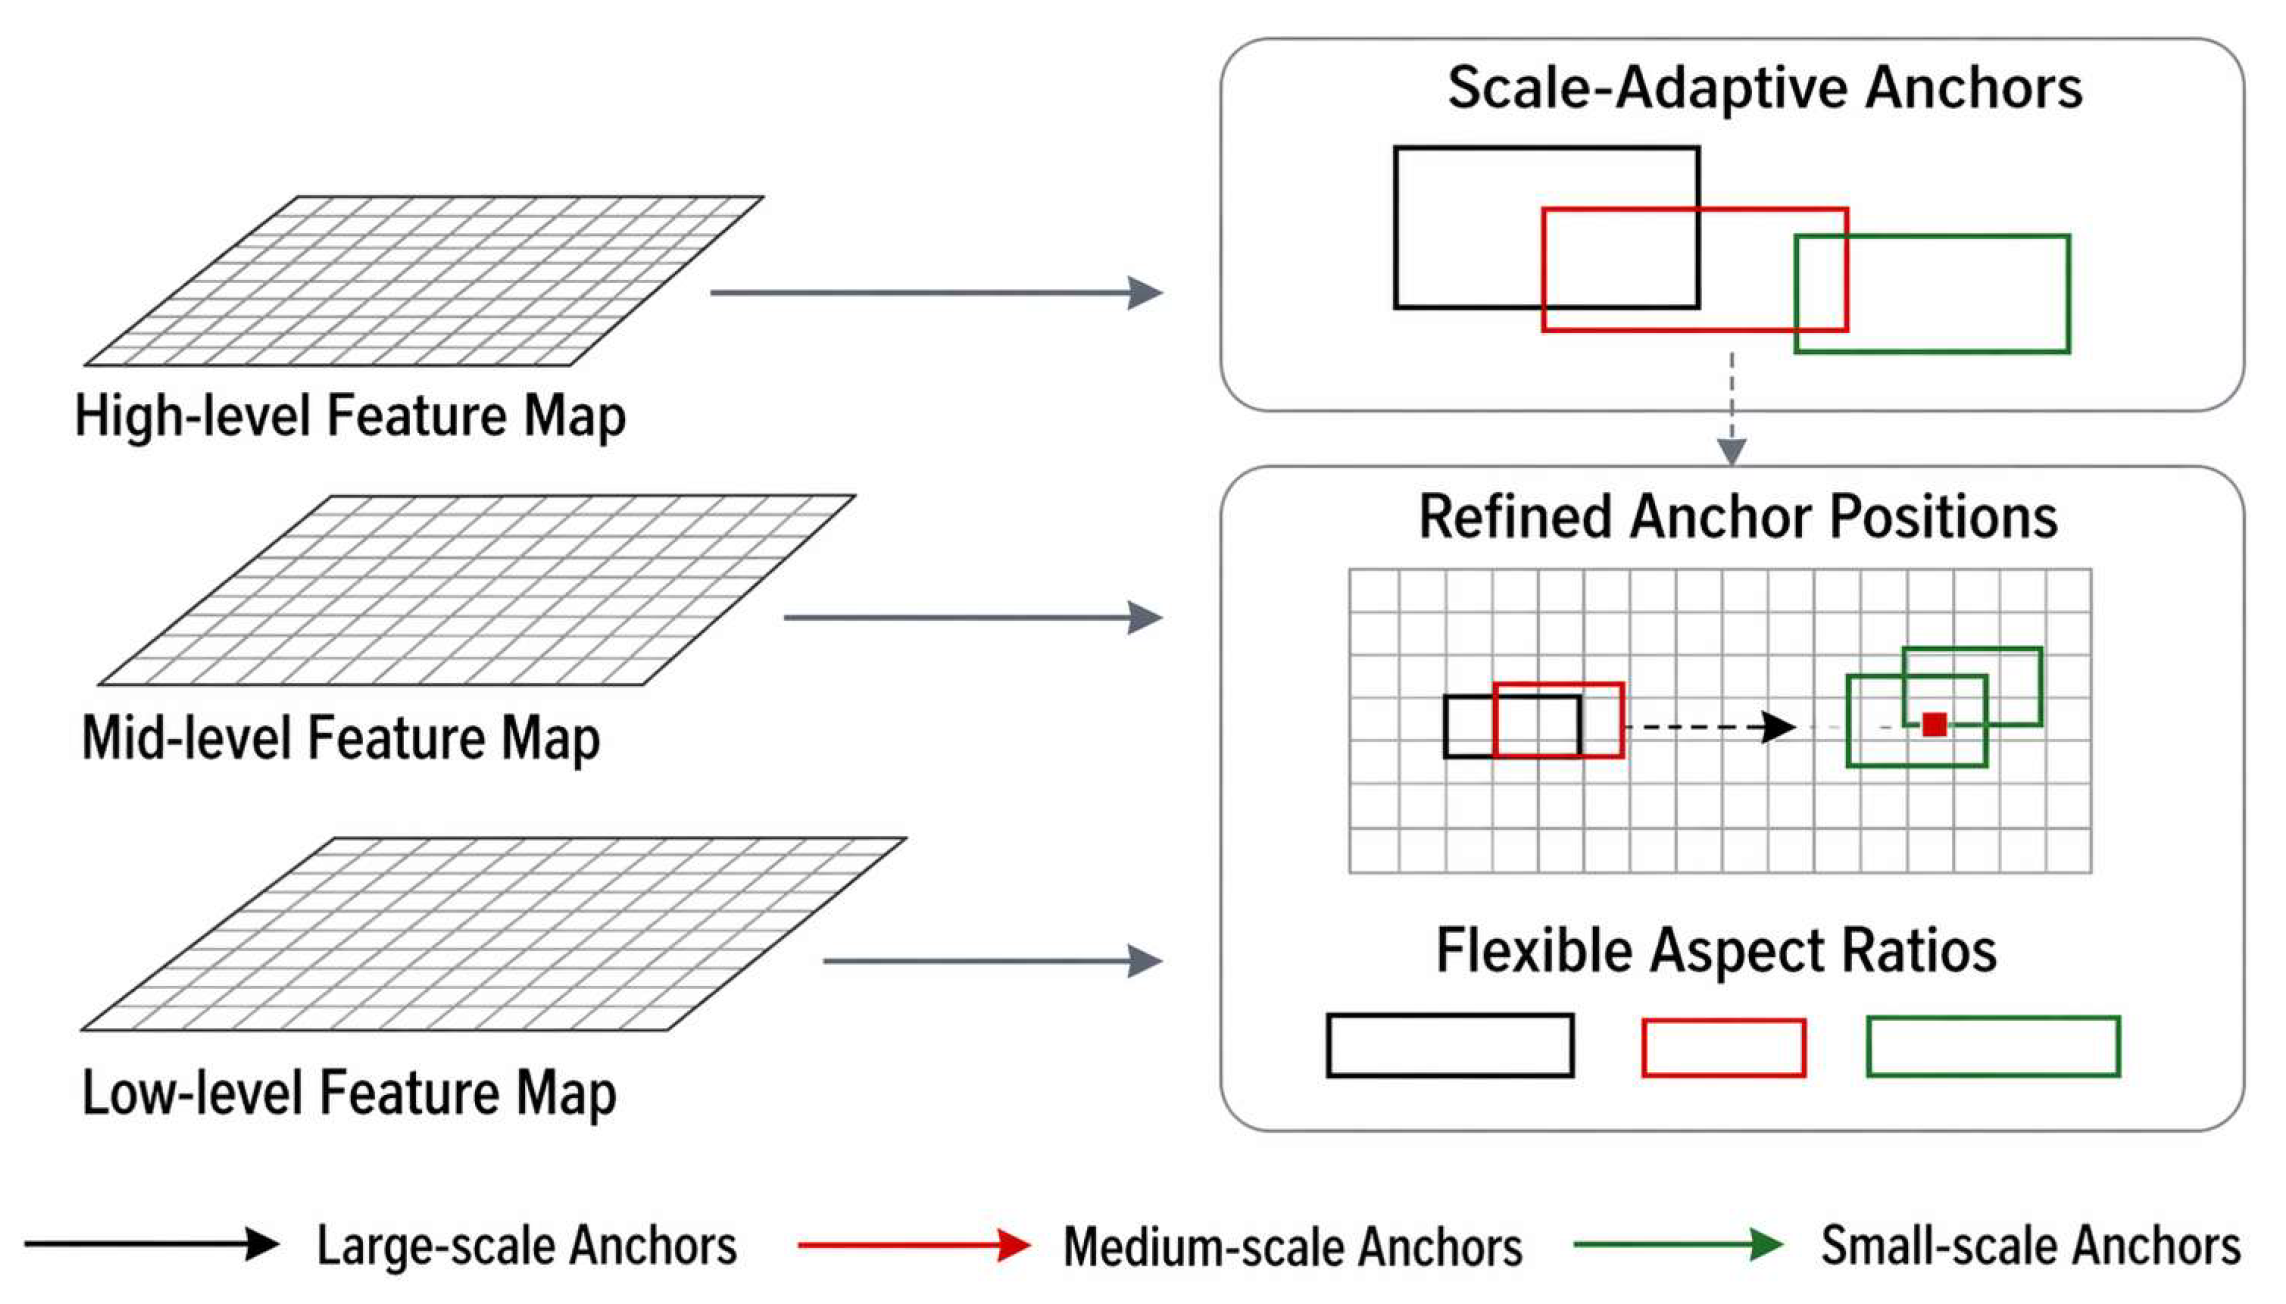
Figure 4.
Comparison of SAR images before and after denoising.
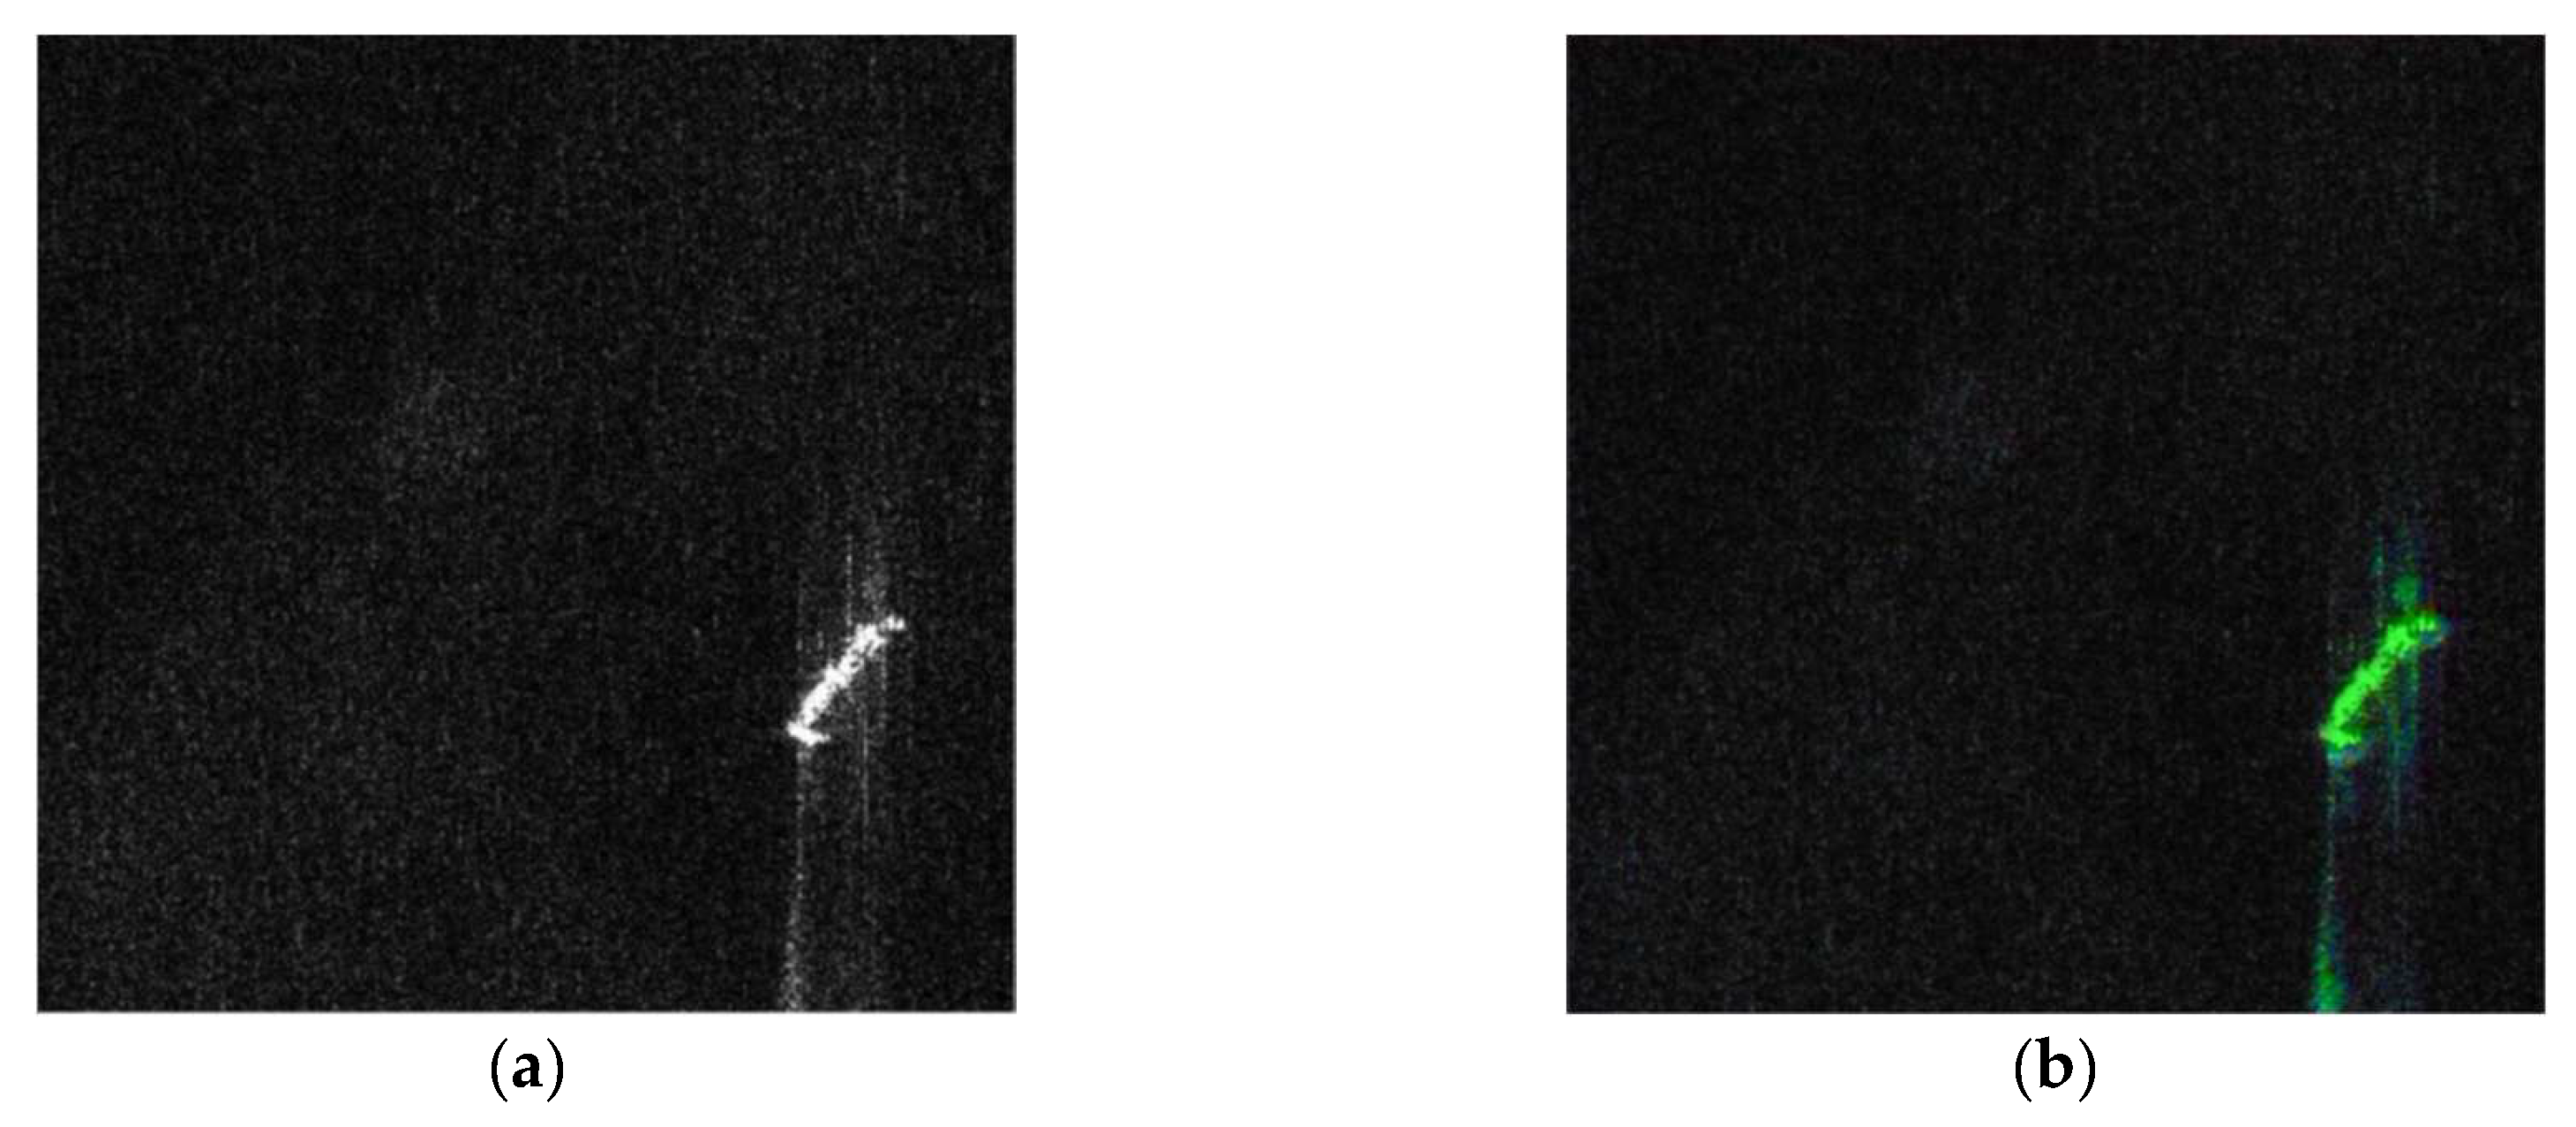
Figure 5.
Detection results under dense-target conditions: (a) Ground Truth; (b) Baseline; (c) Denoising module; (d) Adaptive Anchors; € Adaptive Smooth L1.
Figure 5.
Detection results under dense-target conditions: (a) Ground Truth; (b) Baseline; (c) Denoising module; (d) Adaptive Anchors; € Adaptive Smooth L1.
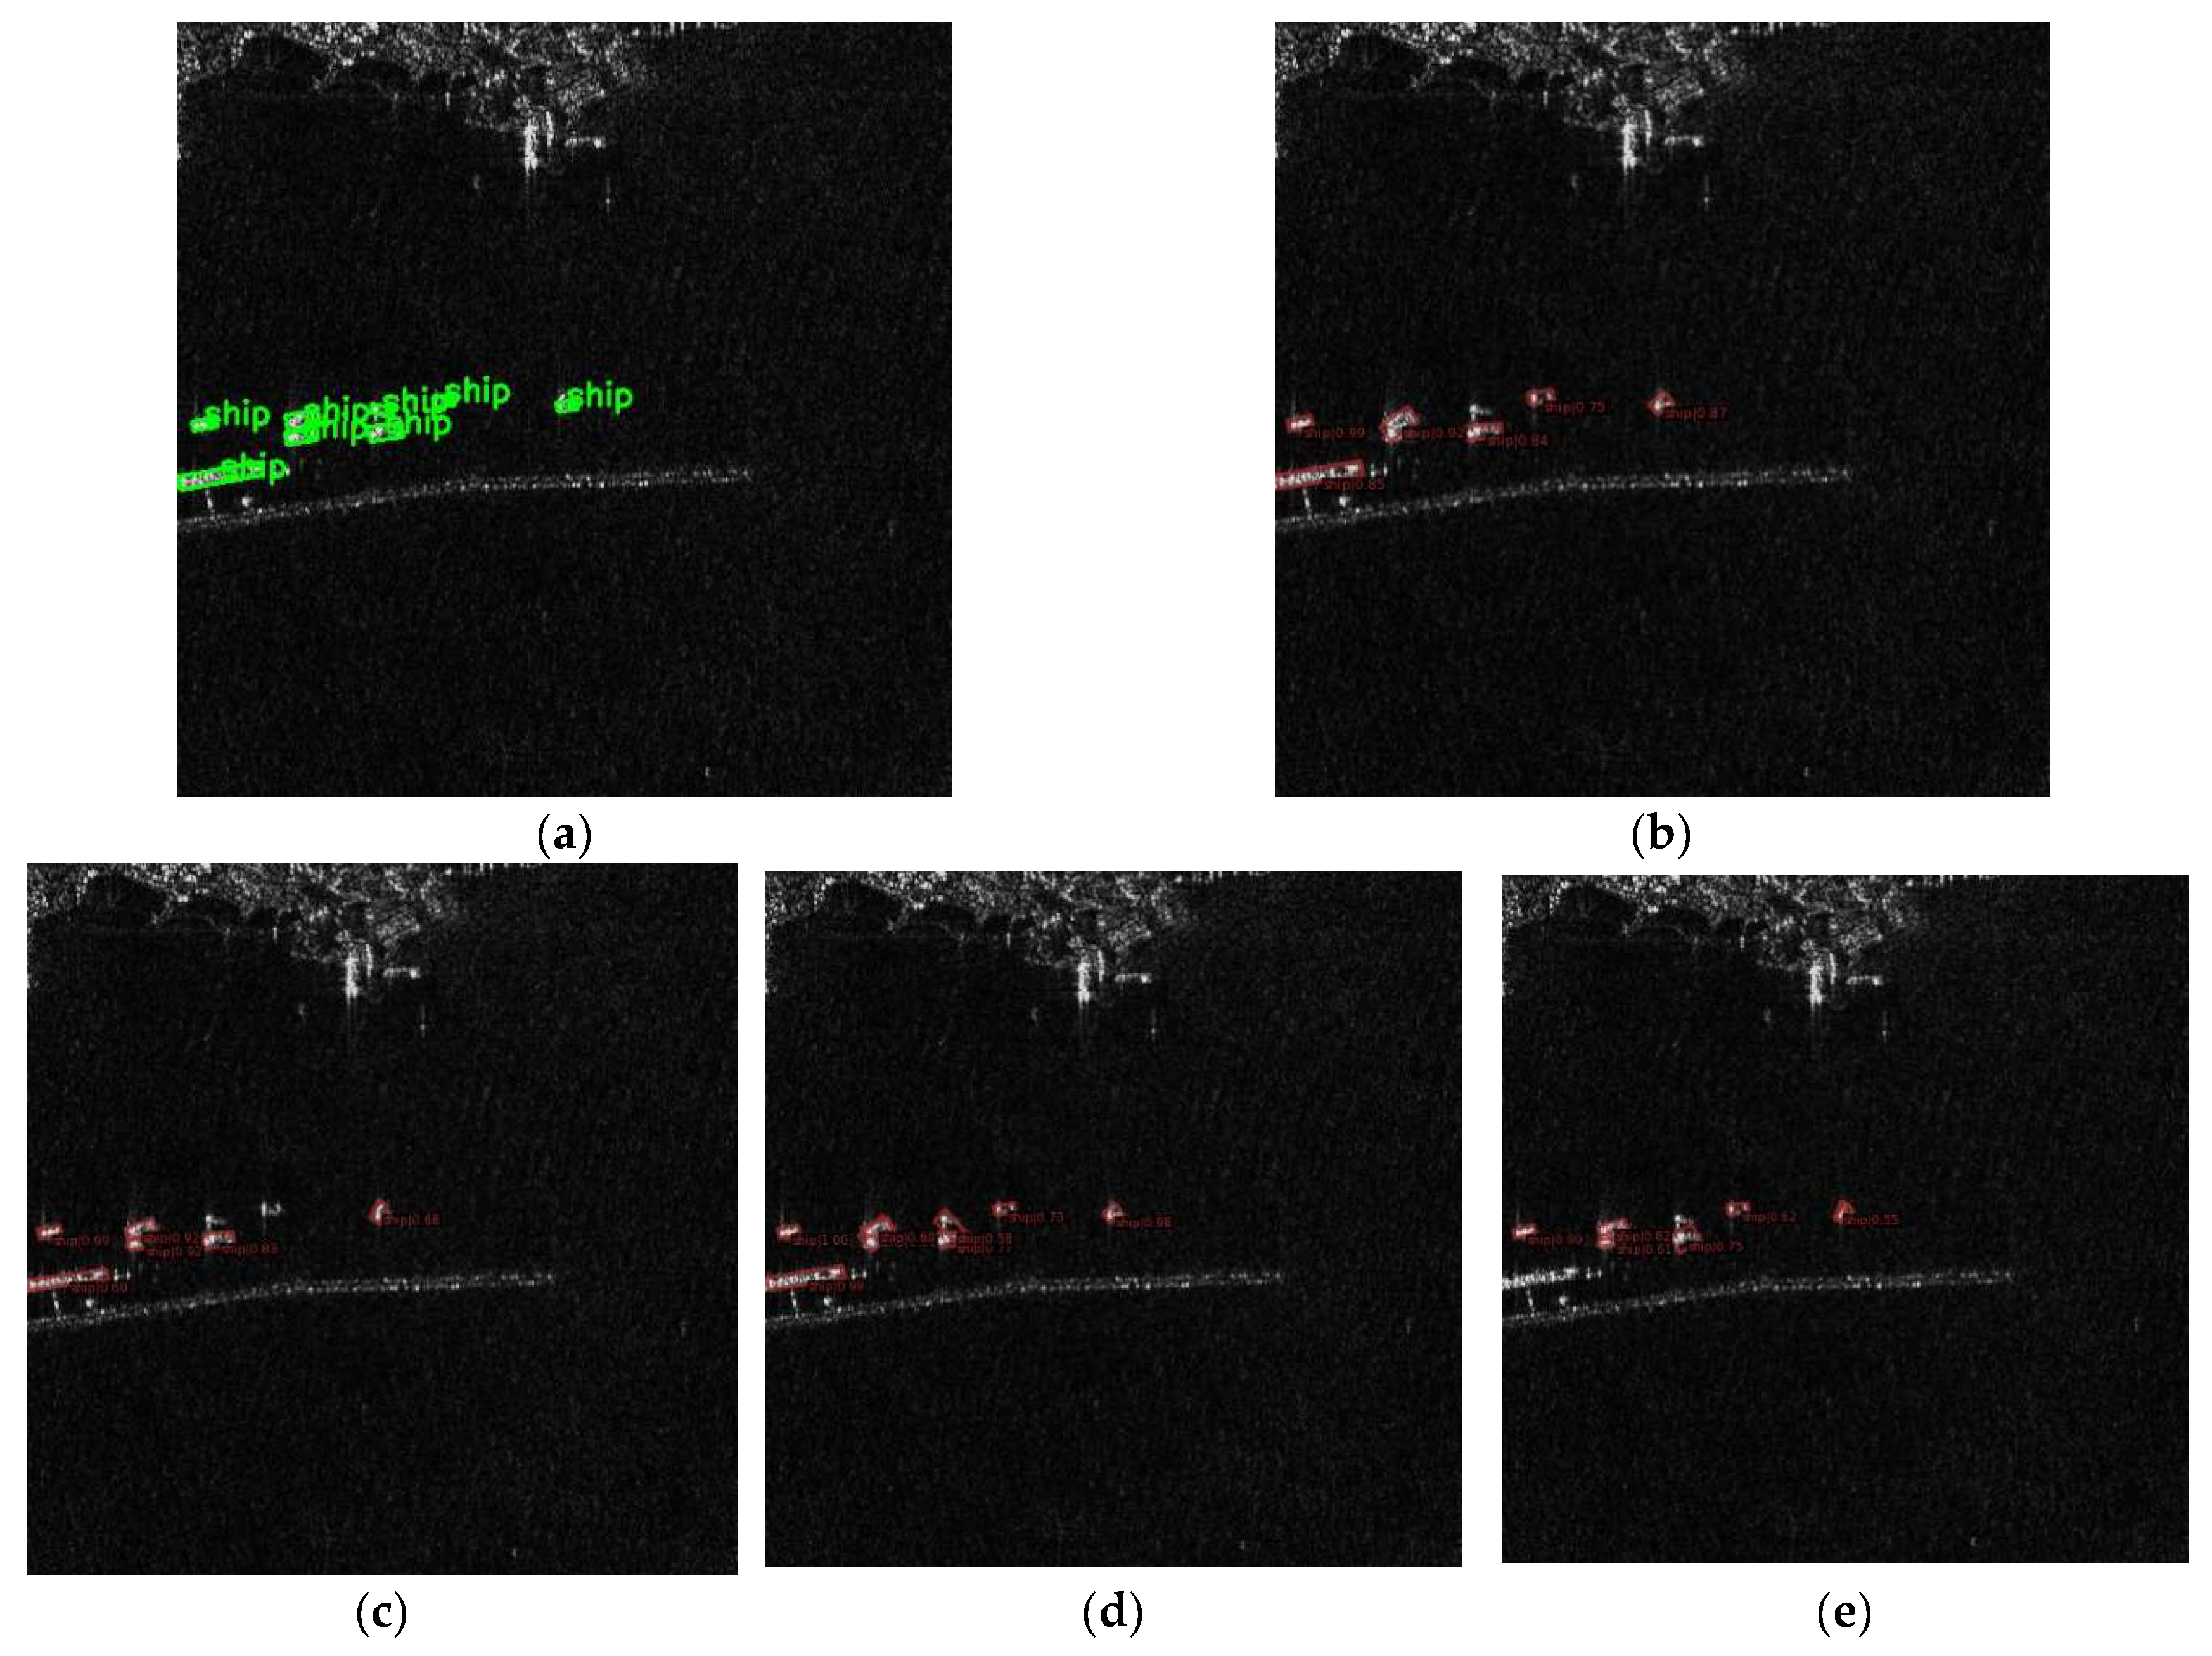
Figure 6.
Detection results under strong noise interference: (a) Ground Truth; (b) Baseline; (c) Denoising module; (d) Adaptive Anchors; (e) Adaptive Smooth L1.
Figure 6.
Detection results under strong noise interference: (a) Ground Truth; (b) Baseline; (c) Denoising module; (d) Adaptive Anchors; (e) Adaptive Smooth L1.
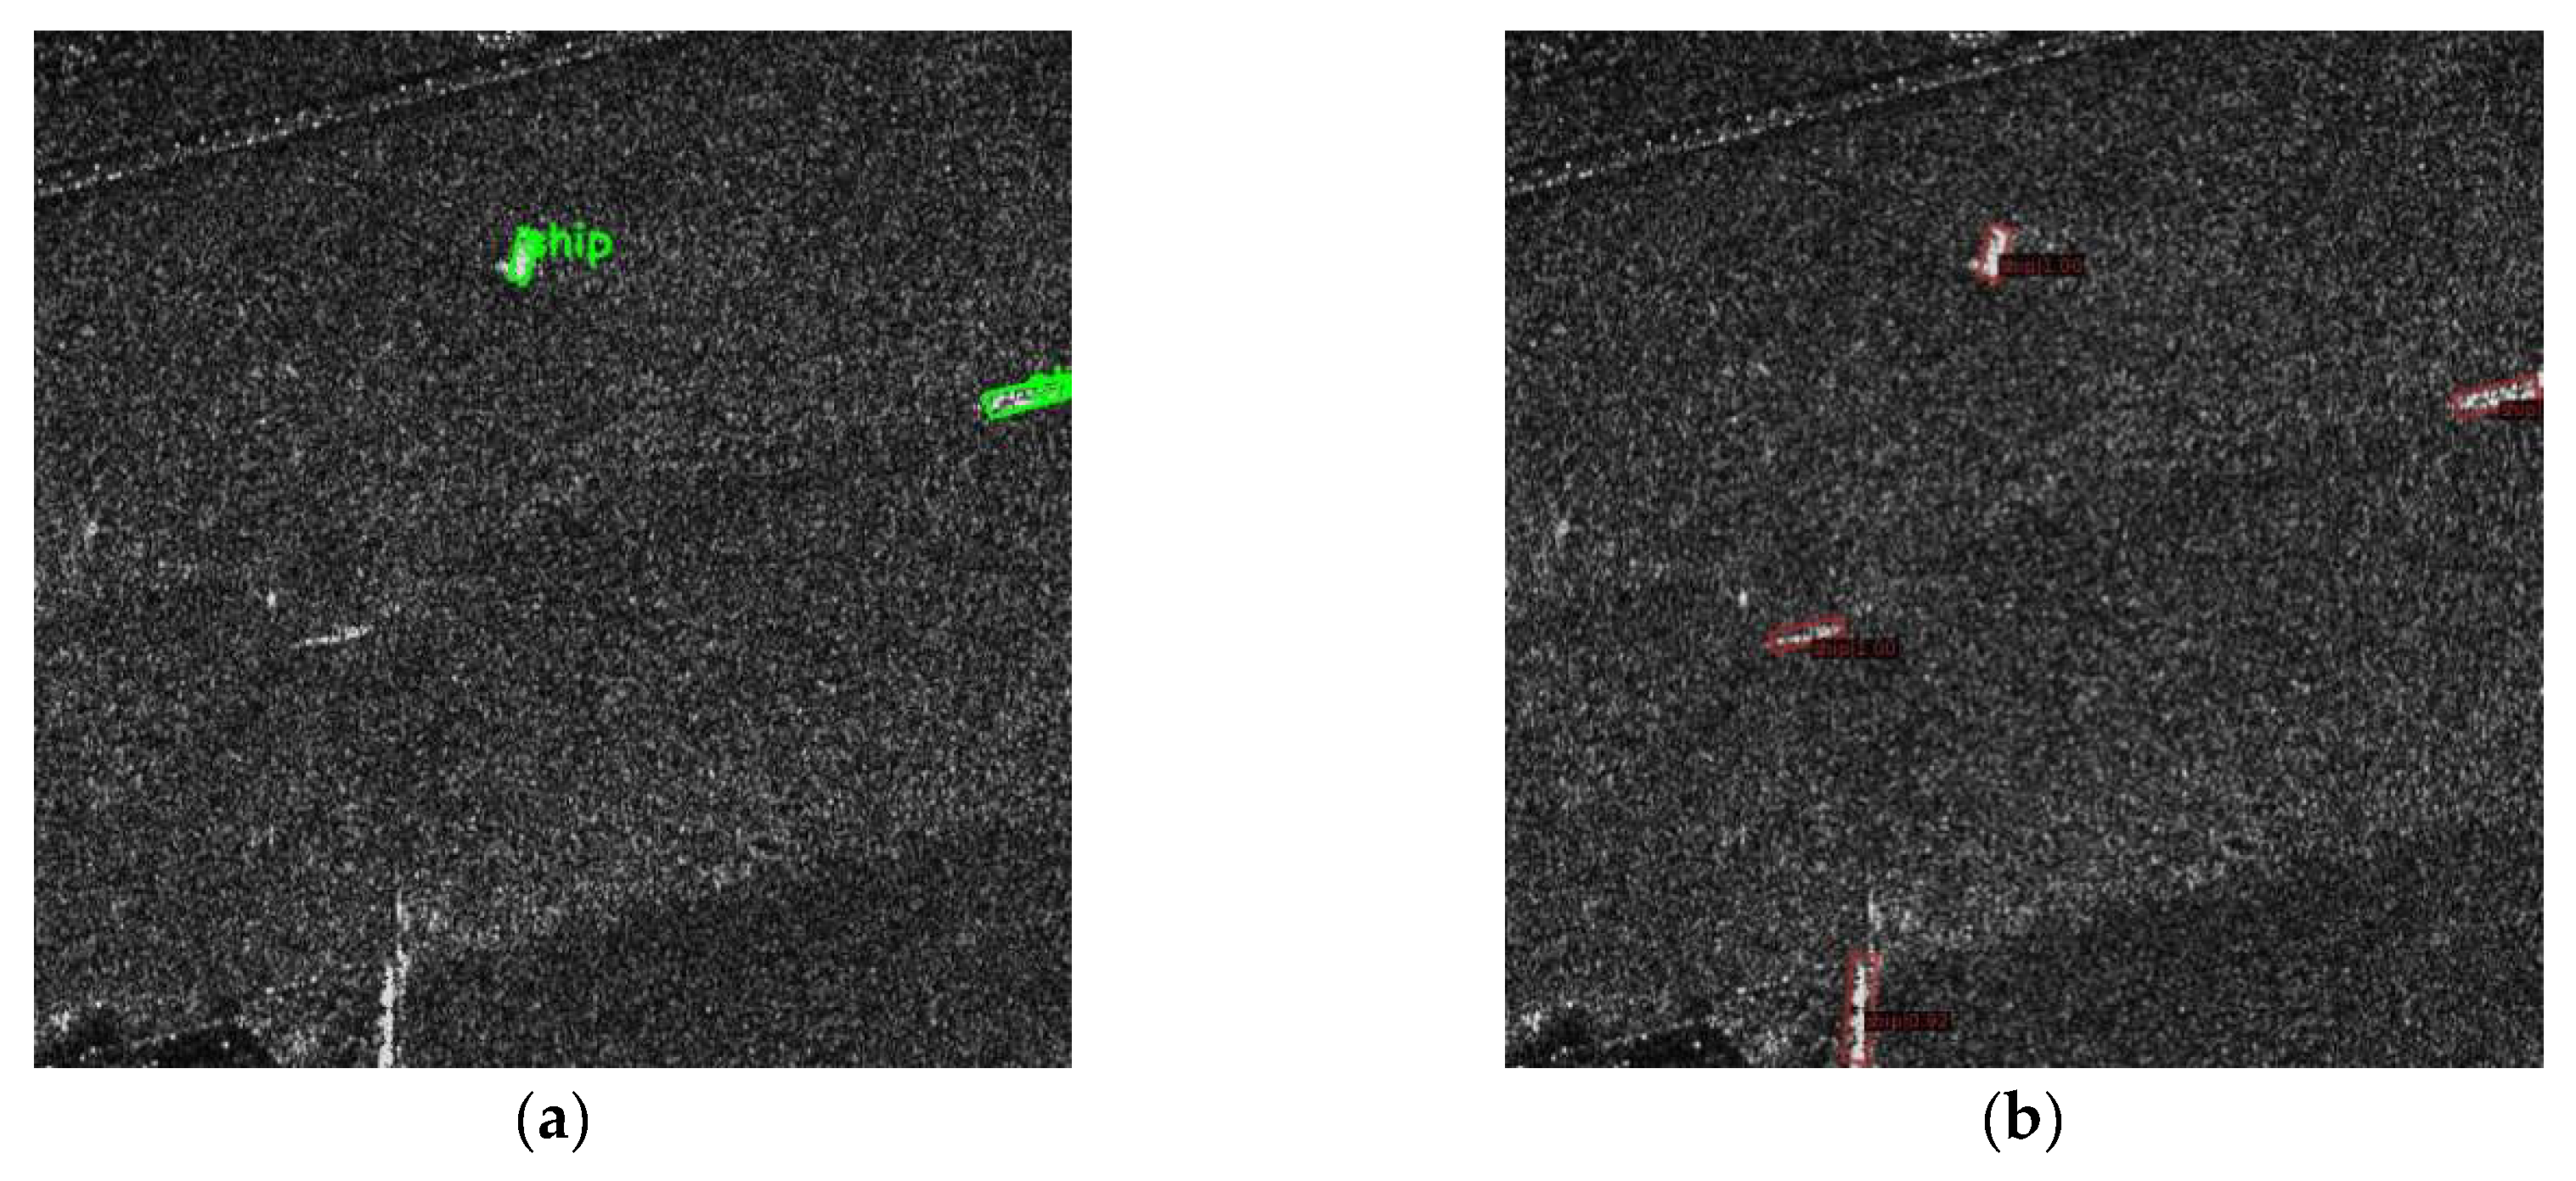
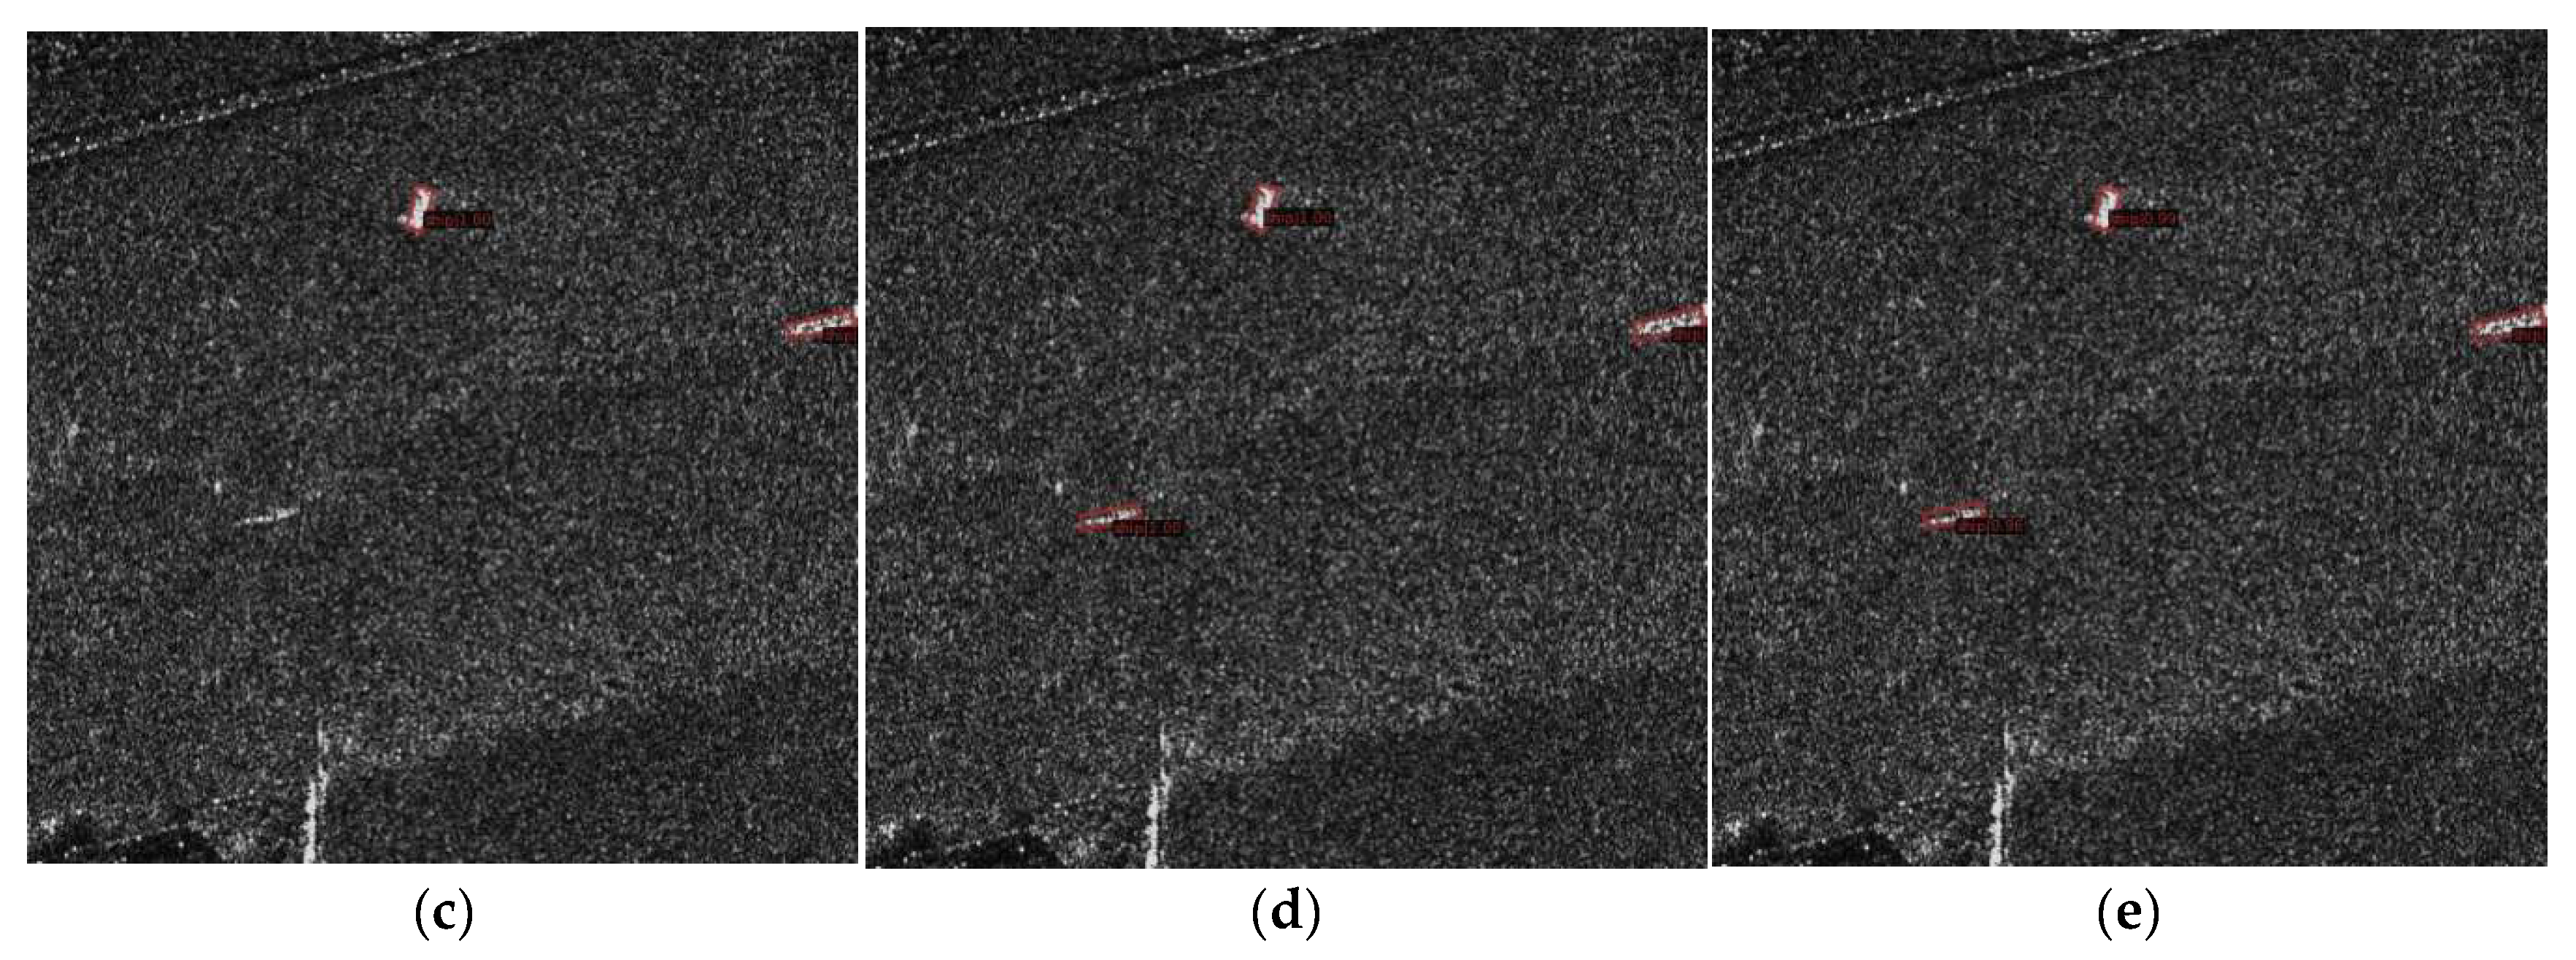
Figure 7.
Comparative detection results across multiple models: (a) Ground Truth; (b) Faster R-CNN; (c) RoI Transformer; (d) Gliding Vertex; (e) YOLOv8-OBB; (f) H2RBOX-URC; (g) DN-AnchorNet.
Figure 7.
Comparative detection results across multiple models: (a) Ground Truth; (b) Faster R-CNN; (c) RoI Transformer; (d) Gliding Vertex; (e) YOLOv8-OBB; (f) H2RBOX-URC; (g) DN-AnchorNet.
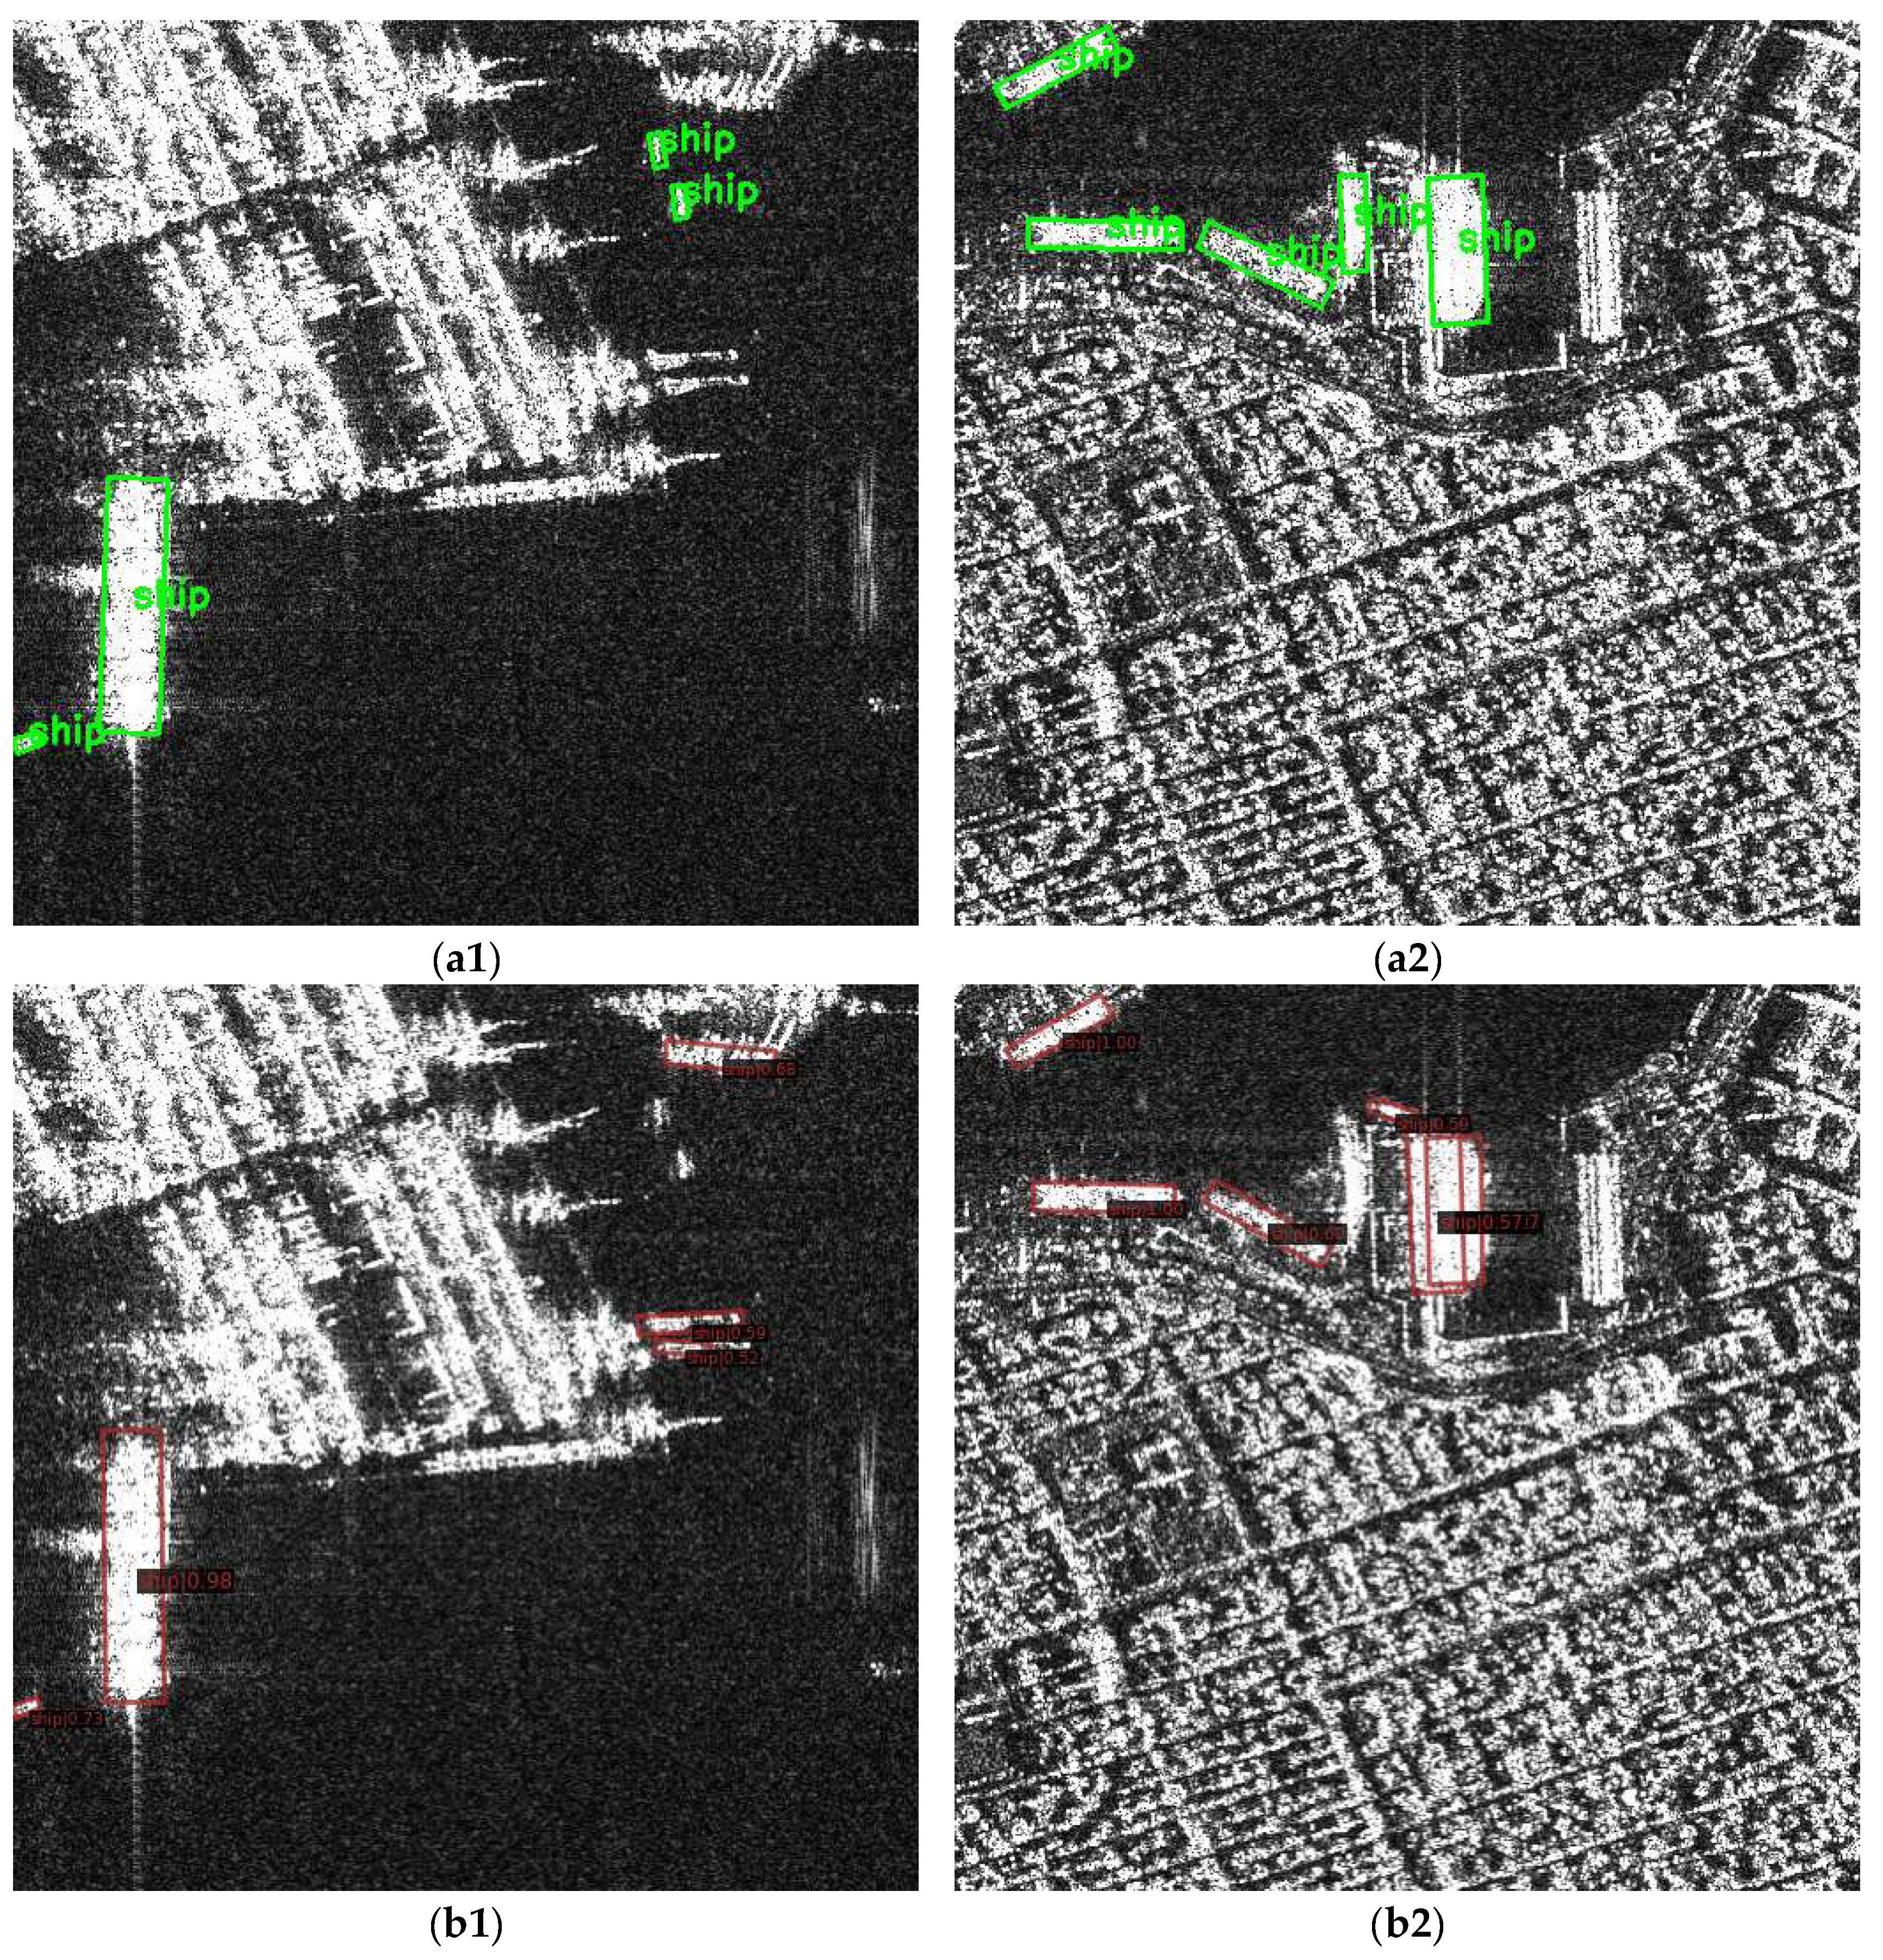
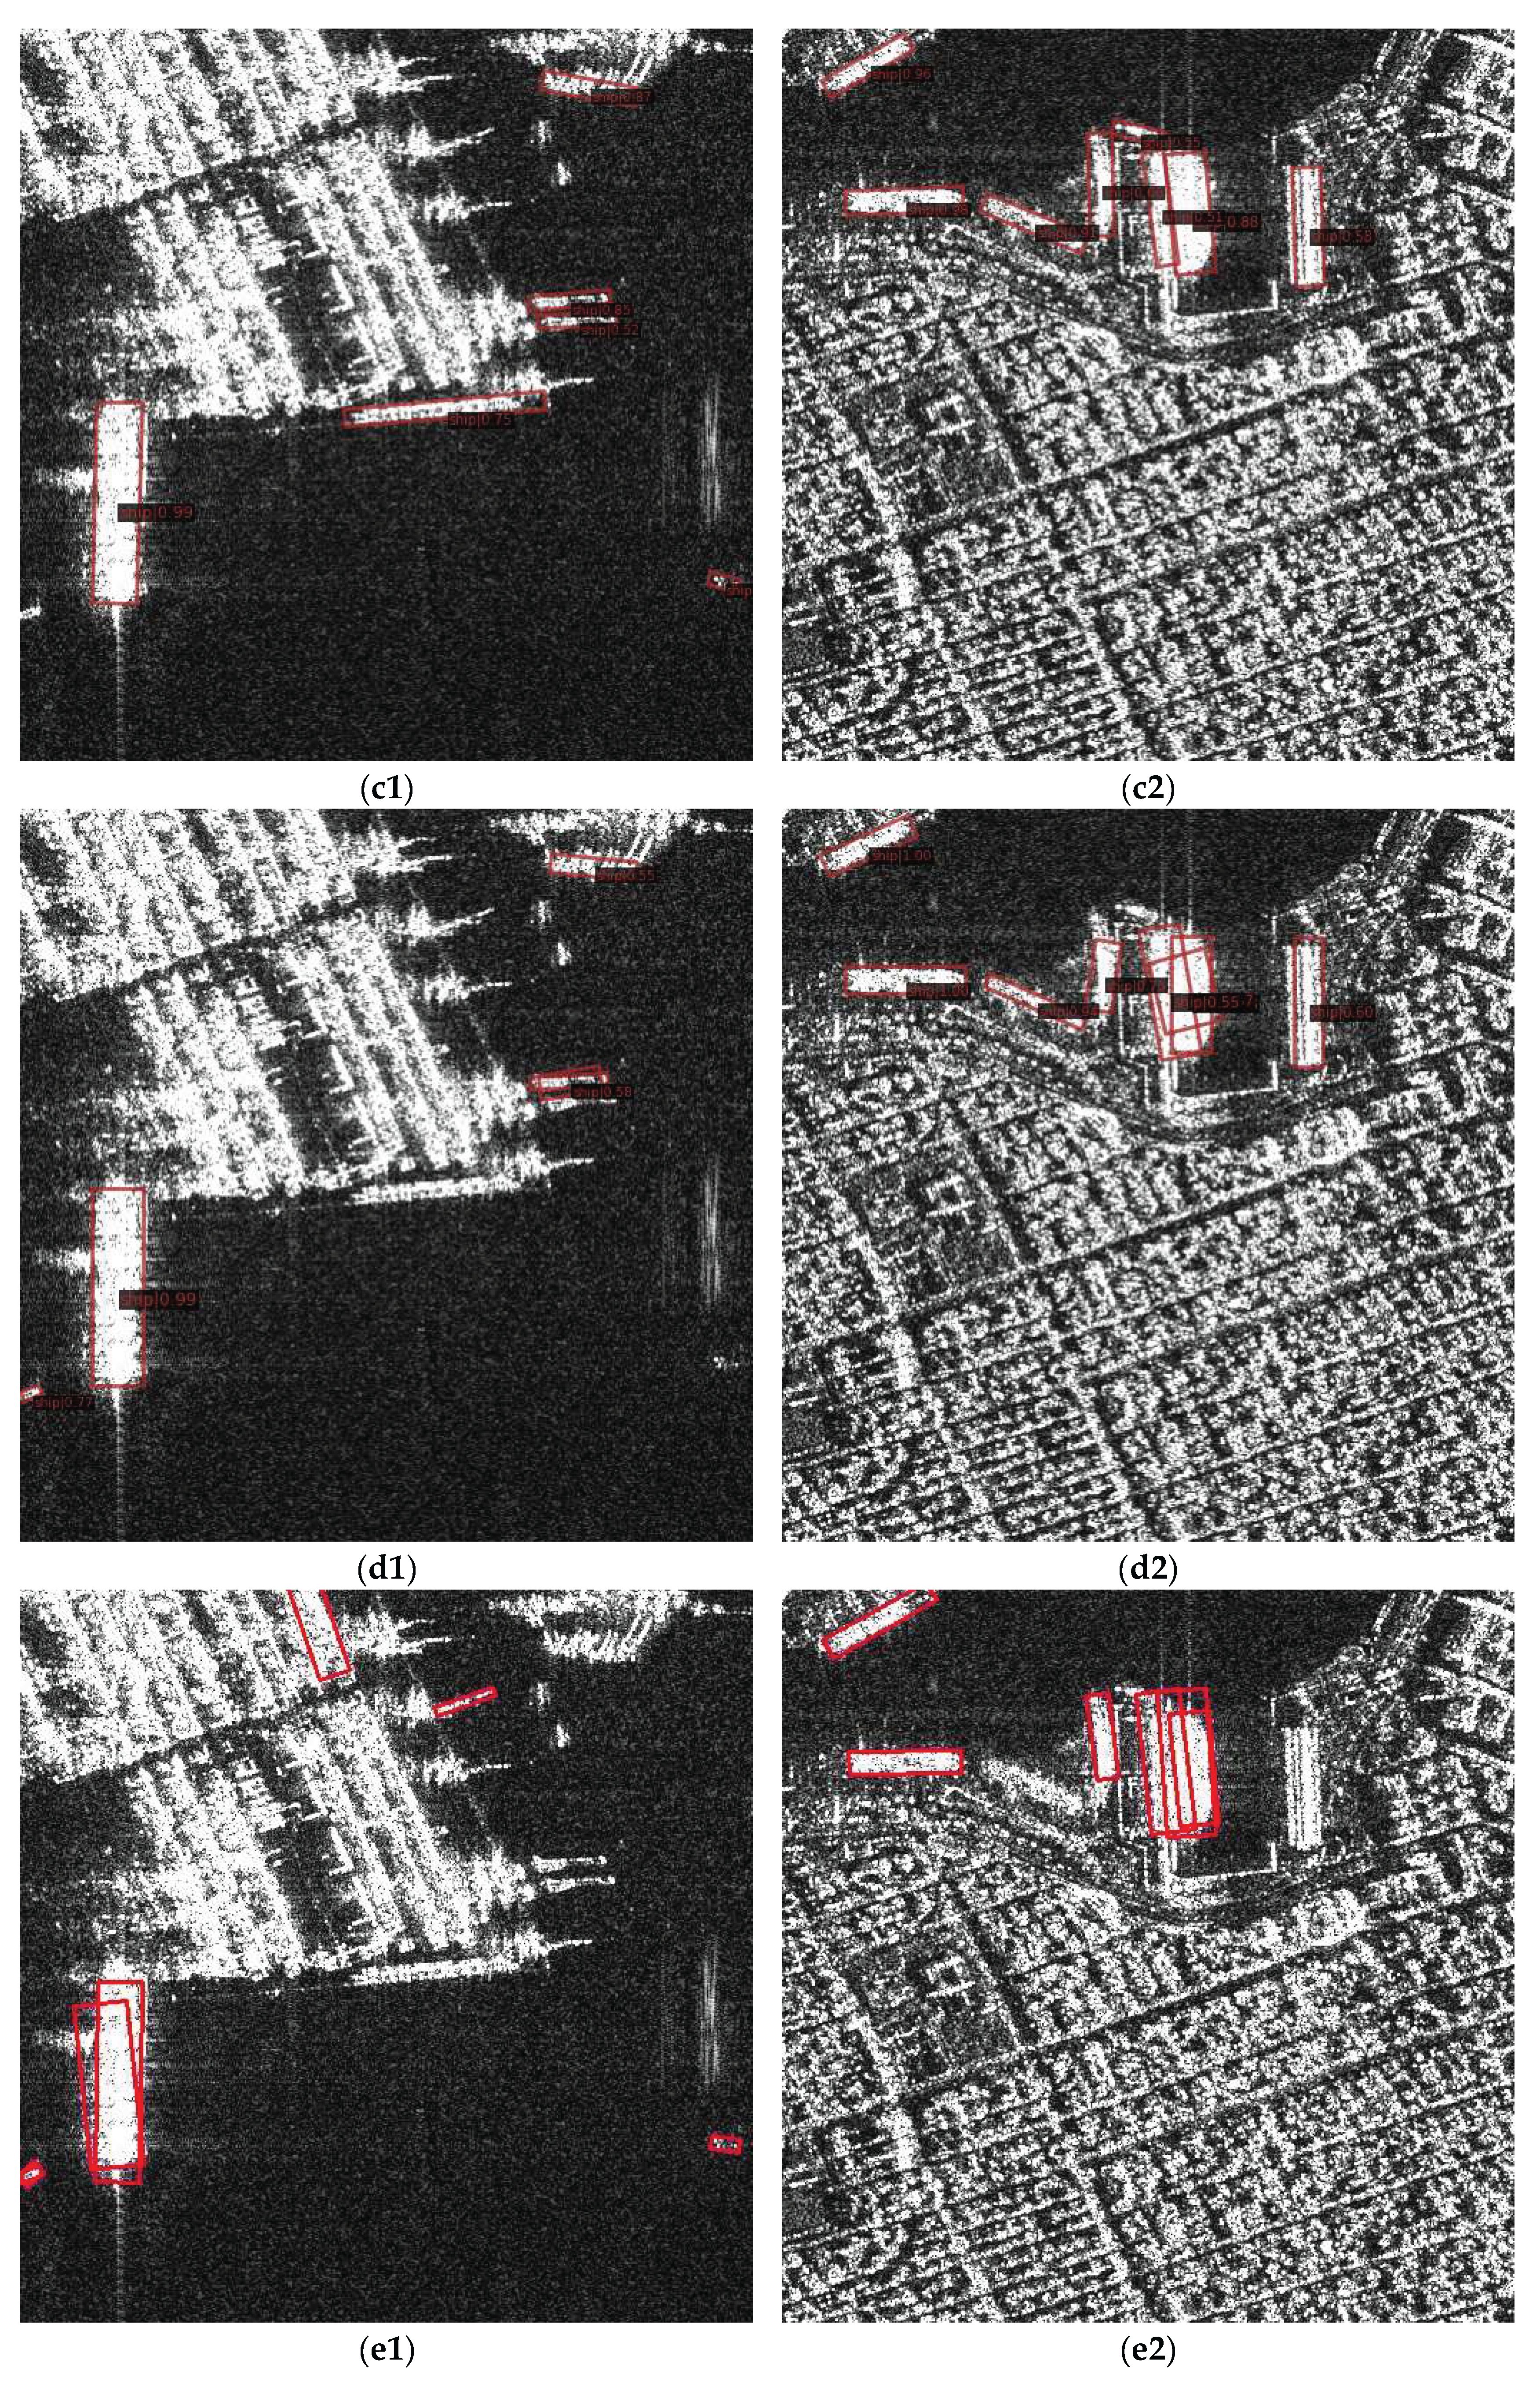
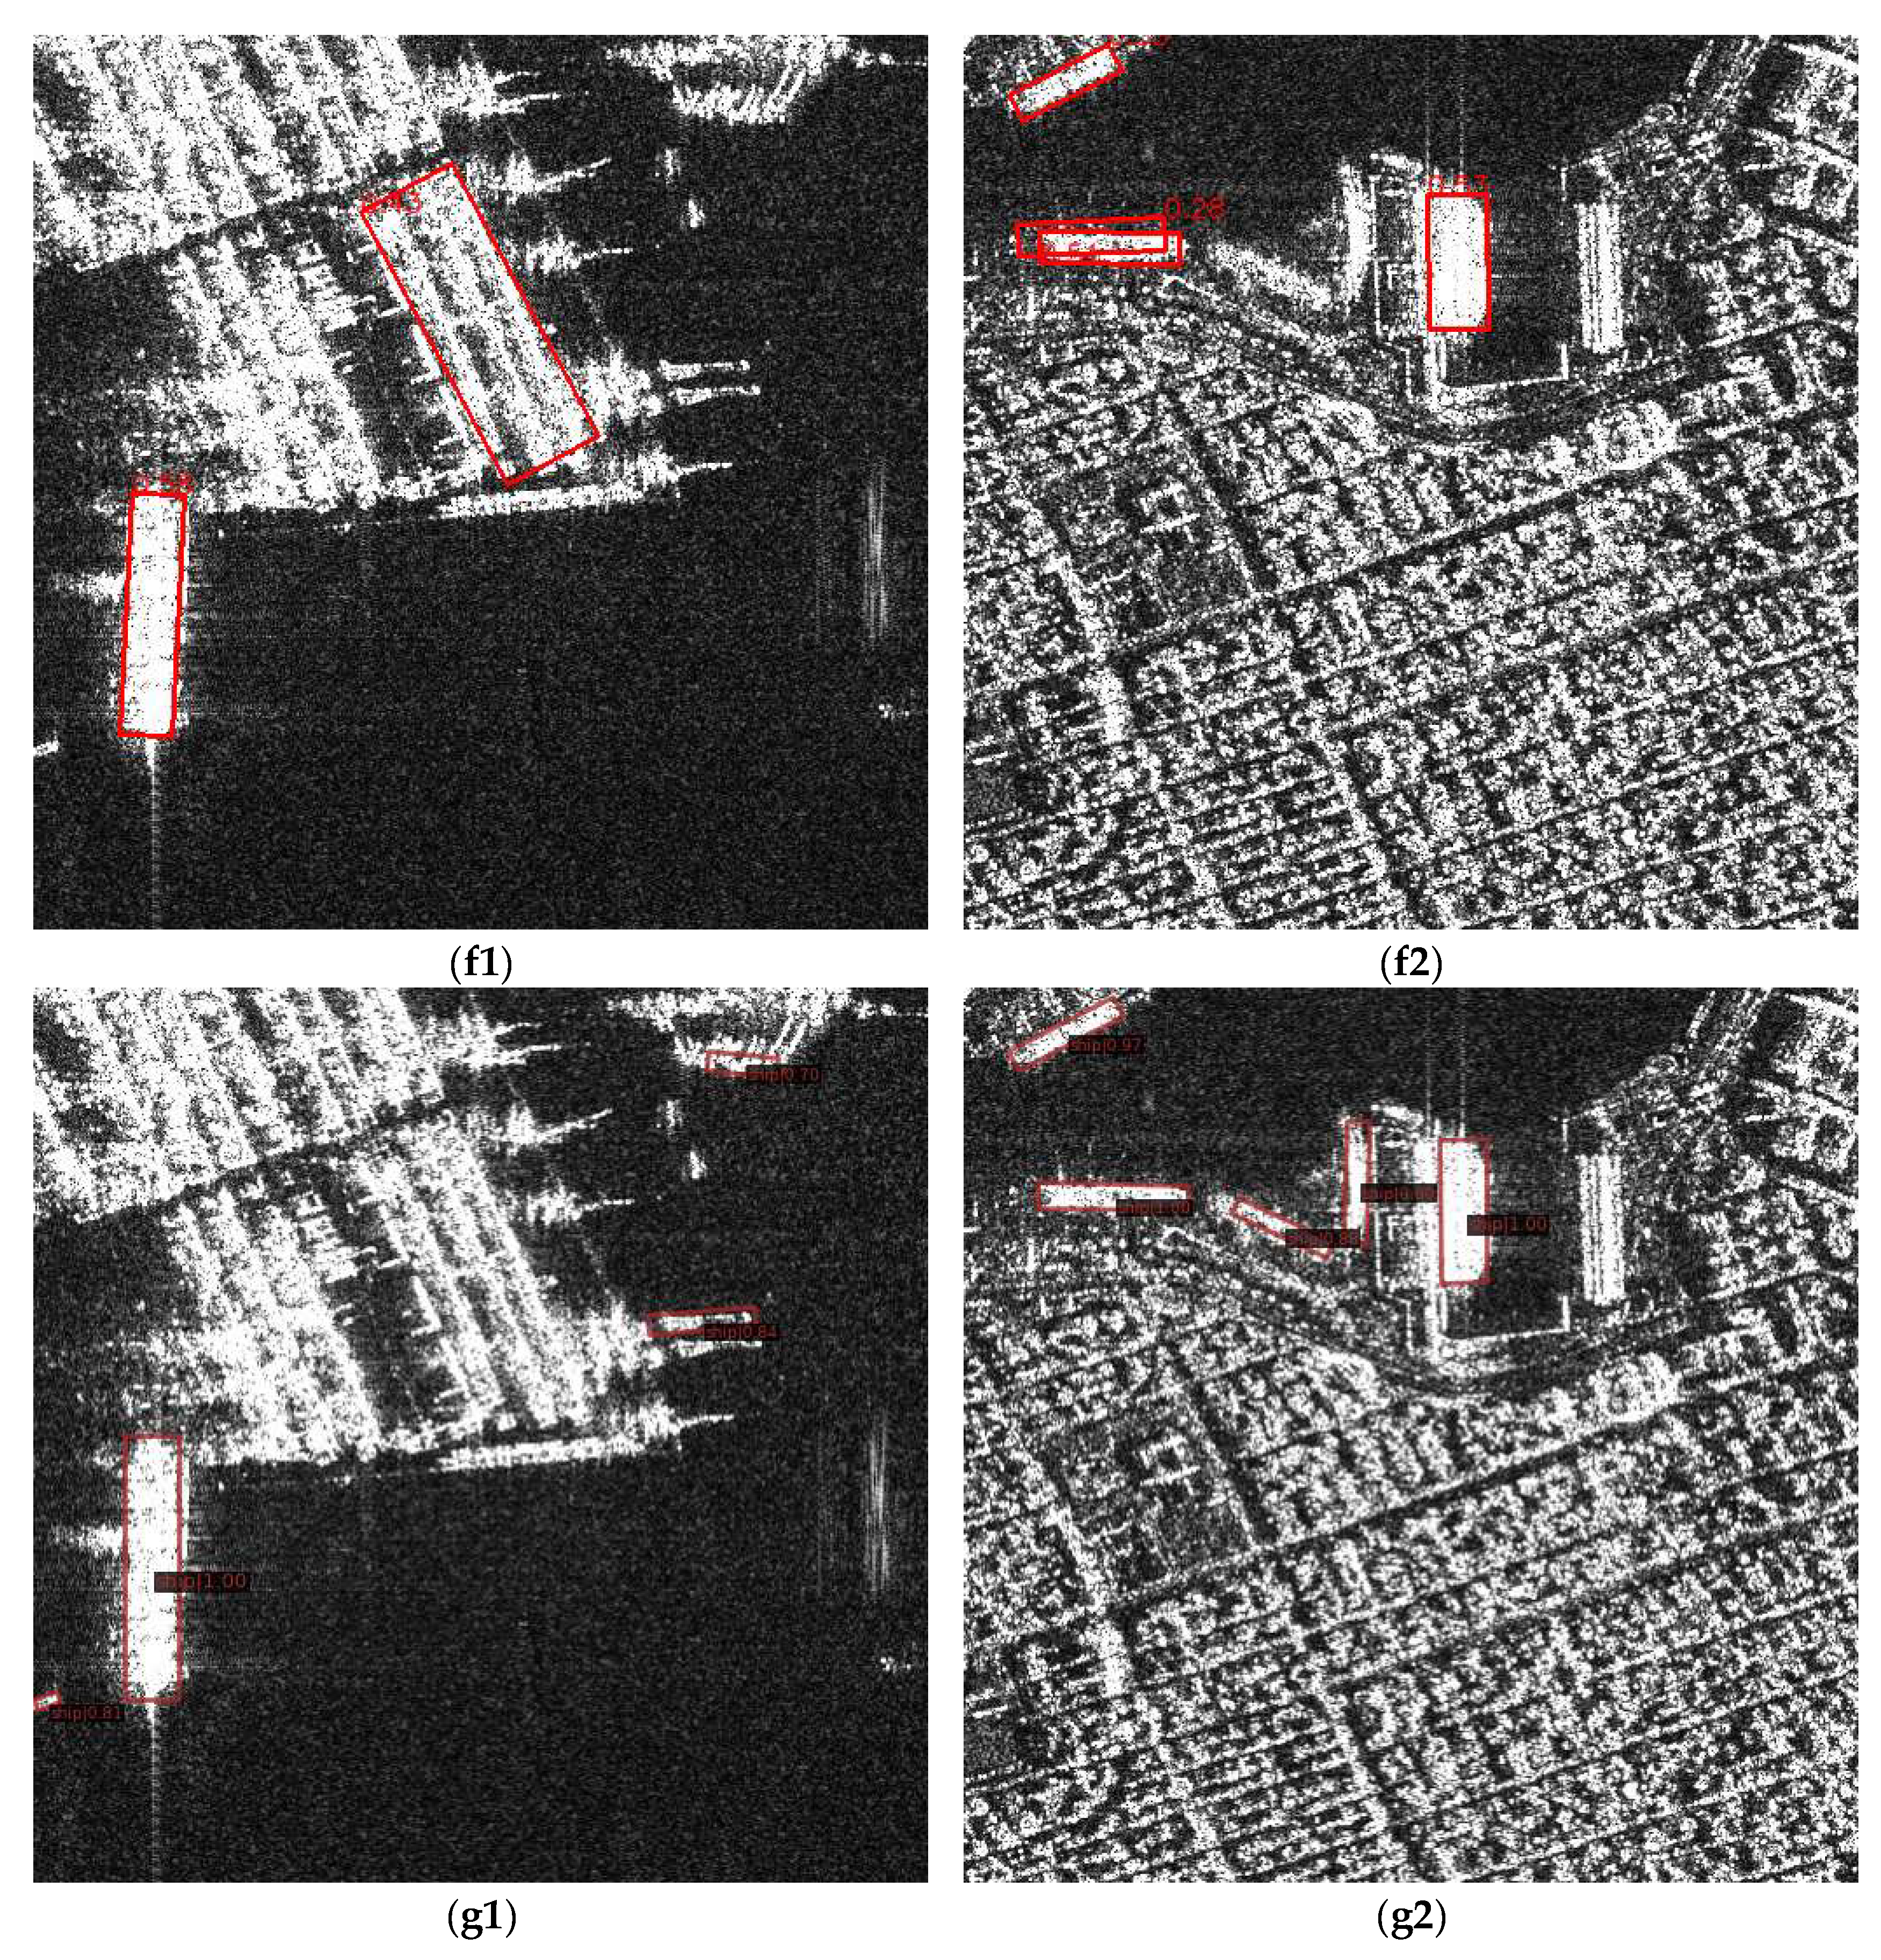

Table 1.
Statistics of the datasets used in the experiments.
| Dataset | Images | Ship Instances |
| RSDD-SAR | 7,000 | 10,263 |
| SSDD+ | 1,160 | 2,456 |
| HRSID | 5,604 | 16,951 |
Table 2.
Experimental settings of DN-AnchorNet.
| Category | Specific Setting |
| Baseline model | Oriented R-CNN |
| Backbone network | ResNet-50 (ImageNet pretrained) |
| Improved modules | Denoising module, Adaptive Anchors and Adaptive Smooth L1 |
| Input size | 512 × 512 |
| Data augmentation | Random flipping, random rotation |
| Optimizer | SGD |
| Training hyperparameters | Initial learning rate 0.0025, momentum 0.9, weight decay 1×10⁻⁴ |
| Training scale | 20 epochs, batch size = 2 |
| Learning rate scheduling | Decay at the 8th and 11th epochs |
| Evaluation metrics | Recall, Precision, AP50, F1-score, FPR, FPPI |
Table 3.
RSDD-SAR Test Set: Individual Module Validation.
| Recall | Precision | AP₅₀ | F1-score | FPR | FPPI | |
| baseline | 0.723 | 0.612 | 0.647 | 0.663 | 38.77 | 1.71 |
| +Denoising module | 0.787 | 0.689 | 0.686 | 0.735 | 31.13 | 1.33 |
| +Adaptive Anchors | 0.752 | 0.635 | 0.653 | 0.688 | 36.54 | 1.62 |
| +Adaptive Smooth L1 | 0.730 | 0.630 | 0.649 | 0.676 | 37.04 | 1.61 |
Table 4.
SSDD+ Test Set: Individual Module Validation.
| Recall | Precision | AP₅₀ | F1-score | FPR | FPPI | |
| baseline | 0.640 | 0.582 | 0.579 | 0.609 | 41.8 | 1.72 |
| +Denoising module | 0.622 | 0.713 | 0.590 | 0.665 | 28.67 | 0.93 |
| +Adaptive Anchors | 0.622 | 0.637 | 0.591 | 0.629 | 36.30 | 1.32 |
| +Adaptive Smooth L1 | 0.622 | 0.615 | 0.588 | 0.618 | 38.51 | 1.46 |
Table 5.
RSDD-SAR Test Set: Combined Module Validation.
| Recall | Precision | AP₅₀ | F1-score | FPR | FPPI | |
| Denoising module + Adaptive Anchor | 0.799 | 0.707 | 0.690 | 0.750 | 29.27 | 1.24 |
| Denoising module + Adaptive Smooth L1 | 0.770 | 0.731 | 0.684 | 0.750 | 26.91 | 1.06 |
| Adaptive Anchor + Adaptive Smooth L1 | 0.738 | 0.658 | 0.654 | 0.691 | 34.24 | 1.42 |
| Denoising module + Adaptive Anchor + Adaptive Smooth L1 | 0.762 | 0.752 | 0.699 | 0.757 | 24.83 | 0.94 |
Table 6.
SSDD+ Test Set: Combined Module Validation.
| Recall | Precision | AP₅₀ | F1-score | FPR | FPPI | |
| Denoising module + Adaptive Anchor | 0.605 | 0.743 | 0.580 | 0.667 | 26.17 | 0.85 |
| Denoising module + Adaptive Smooth L1 | 0.651 | 0.651 | 0.590 | 0.651 | 26.91 | 0.89 |
| Adaptive Anchor + Adaptive Smooth L1 | 0.645 | 0.665 | 0.602 | 0.655 | 33.53 | 1.22 |
| Denoising module + Adaptive Anchor + Adaptive Smooth L1 | 0.685 | 0.726 | 0.610 | 0.689 | 25.39 | 0.80 |
Table 7.
Comparative Performance Evaluation on the RSDD-SAR Test Set.
| Recall | Precision | AP₅₀ | F1-score | FPR | FPPI | |
| Faster R-CNN | 0.765±0.012 | 0.429±0.011 | 0.616±0.006 | 0.549±0.011 | 57.14±2.14 | 3.82±0.31 |
| RoI Transformer | 0.768±0.008 | 0.550±0.005 | 0.648±0.005 | 0.641±0.006 | 45.01±1.58 | 2.36±0.22 |
| Gliding Vertex | 0.762±0.007 | 0.485±0.009 | 0.617±0.007 | 0.592±0.008 | 51.54±1.32 | 3.03±0.19 |
| YOLOv8-OBB | 0.370±0.014 | 0.743±0.012 | 0.507±0.009 | 0.594±0.013 | 23.10±1.88 | 0.85±0.28 |
| H2RBOX-URC | 0.512±0.018 | 0.790±0.011 | 0.493±0.011 | 0.621±0.015 | 18.08±1.92 | 0.51±0.30 |
| DN-AnchorNet | 0.762±0.007 | 0.752±0.006 | 0.699±0.007 | 0.757±0.006 | 24.83±0.99 | 0.94±0.16 |
Table 8.
Comparative Performance Evaluation on the SSDD+ Test Set.
| Recall | Precision | AP₅₀ | F1-score | FPR | FPPI | |
| Faster R-CNN | 0.581±0.007 | 0.490±0.008 | 0.474±0.005 | 0.532±0.009 | 50.98±1.12 | 2.26±0.41 |
| RoI Transformer | 0.674±0.006 | 0.671±0.010 | 0.576±0.008 | 0.672±0.008 | 32.95±0.96 | 1.24±0.37 |
| Gliding Vertex | 0.593±0.011 | 0.567±0.006 | 0.508±0.007 | 0.580±0.008 | 43.33±1.41 | 1.70±0.56 |
| YOLOv8-OBB | 0.344±0.017 | 0.712±0.012 | 0.450±0.012 | 0.454±0.015 | 27.69±1.27 | 0.90±0.49 |
| H2RBOX-URC | 0.493±0.014 | 0.810±0.008 | 0.430±0.021 | 0.613±0.011 | 15.89±1.66 | 0.46±0.65 |
| DN-AnchorNet | 0.685±0.007 | 0.726±0.010 | 0.610±0.009 | 0.689±0.009 | 25.39±0.88 | 0.80±0.32 |
Table 9.
Cross-dataset generalization results on the full official HRSID test set. All models are trained on RSDD-SAR and directly tested on 1,962 HRSID test images without fine-tuning.
Table 9.
Cross-dataset generalization results on the full official HRSID test set. All models are trained on RSDD-SAR and directly tested on 1,962 HRSID test images without fine-tuning.
| Recall | Precision | AP₅₀ | F1-score | FPR | FPPI | |
| Oriented R-CNN(baseline) | 0.651 | 0.685 | 0.594 | 0.668 | 18.93 | 0.51 |
| Faster R-CNN | 0.636 | 0.651 | 0.590 | 0.644 | 34.85 | 1.00 |
| RoI Transformer | 0.612 | 0.701 | 0.603 | 0.662 | 22.94 | 0.55 |
| Gliding Vertex | 0.630 | 0.707 | 0.601 | 0.666 | 29.32 | 0.77 |
| DN-AnchorNet | 0.668 | 0.716 | 0.619 | 0.689 | 17.94 | 0.42 |
Disclaimer/Publisher’s Note: The statements, opinions and data contained in all publications are solely those of the individual author(s) and contributor(s) and not of MDPI and/or the editor(s). MDPI and/or the editor(s) disclaim responsibility for any injury to people or property resulting from any ideas, methods, instructions or products referred to in the content. |
© 2026 by the authors. Licensee MDPI, Basel, Switzerland. This article is an open access article distributed under the terms and conditions of the Creative Commons Attribution (CC BY) license (http://creativecommons.org/licenses/by/4.0/).
Copyright: This open access article is published under a Creative Commons CC BY 4.0 license, which permit the free download, distribution, and reuse, provided that the author and preprint are cited in any reuse.


