

Submitted:
25 May 2026
Posted:
26 May 2026
You are already at the latest version
Abstract
Gastrointestinal (GI) cancers account for a quarter of all cancer cases worldwide and are responsible for a third of cancer deaths. One of the characteristic features of GI tissue is its multilayered structure, which in addition to multiple scattering, complicates optical-spectral analysis. The risk of lymph node metastasis in GI cancer is primarily related to the depth of tumor invasion. The use of spectroscopic diagnostics and photodynamic therapy for the detection and treatment of GI cancer is a rapidly developing field. The method proposed in this paper for layer-by-layer optical properties assessment, suitable for real-time clinical application to the walls of hollow organs, allows for both determining the depth of tumor invasion into the GI organ wall and calculating the absorbed dose layer-by-layer. This paper proposes a method for recording spectral data in two geometries, diffuse reflectance and transmission, using light delivery from both the external and internal surfaces of the gastrointestinal tract wall. Layer-by-layer assessment of optical properties was performed using a developed algorithm based on the inverse adding-doubling method with initial optical properties values determined using the modified two-stream Kubelka-Munk model with the accuracy equal to 86±13%. The method was approbated in clinical conditions. Based on the results of the work, the developed method for assessing the optical properties of multilayered biological tissues exhibited sufficient speed and accuracy for in vivo application to personalize laser-induced therapy by correction of the laser dose.
Keywords:
optical properties
; adding-doubling method
; diffuse reflectance spectroscopy
; diffuse transmittance
; gastrointestinal tract
; laser dose
1. Introduction
Malignant neoplasms of the gastrointestinal tract (GIT) are a common pathology, accounting for 25% of all oncological diagnoses and approximately 33% of cancer deaths worldwide [1,2,3]. Currently, one of the widespread methods for the treatment and palliative care of malignant neoplasms of the gastrointestinal tract is photodynamic therapy (PDT) [4,5,6]. One of the main components of PDT is laser radiation, the interaction characteristics of which with biological tissues and the photosensitizer molecules accumulated within them determine the effectiveness of the medical procedure. However, despite advances in preclinical research on photodynamic therapy, clinical practice often relies on outdated fixed prescriptions (photosensitizer dose, interval between drug administration and radiation, and radiation intensity), ignoring the variability of the patient and tumor condition, leading to inconsistent treatment results and a suboptimal dose [7,8]. Gastrointestinal tissues consist of several layers, including the mucosa, submucosa, and muscularis propria, which must be taken into account when studying light propagation in these organs. The need to consider the layer-by-layer interaction of optical radiation with gastrointestinal tissue is due, among other things, to the relationship between the depth of tumor invasion, i.e., the proliferation of the malignant tumor into deeper layers, and the risk of lymph node metastasis in esophageal, gastric, and colon cancer [9,10,11,12]. In addition, most biological tissues are optically turbid, that is, highly scattering media [13,14], which, coupled with their multilayer structure, complicates their optical-spectral analysis. There are ways to reduce scattering in biological tissues, one of which is optical clearing, but this approach alters the optical properties of the sample [15].
The nature of the interaction of optical radiation with biological tissues is determined by their optical properties: the absorption coefficient μa, the scattering coefficient μs and the anisotropy factor g [16]. There is also a reduced scattering coefficient , allowing the medium to be considered isotropic when studying the scattering process. The optical properties of biological tissues influence the effect of laser radiation on them, and information on them allows determining the absorbed dose of laser radiation and predicting the site of cell death in tumor tissue [17]. Direct measurement of the optical properties of biological tissues is extremely difficult and is only possible on thin sections. Most often, the propagation of optical radiation in biological tissues is described using radiative transfer theory (RTT), the fundamental equation of which (the radiative transfer equation, RTE) contains the absorption and scattering coefficients. RTE is extremely difficult to be directly solved analytically in inhomogeneous media with complex geometries, such as gastrointestinal tissue. To simplify RTE, a diffusion approximation is often used. This approximation is applicable when scattering is many times greater than absorption and allows the transport equation to be reduced to a simpler one by assuming that the angular distribution of photons becomes nearly isotropic under conditions of multiple scattering after a large number of collisions.
Various approximations are used to solve the equations of radiative transfer theory. One of the standard approach to numerical solution is the Monte Carlo (MC) method [18,19], which is highly accurate and allows for the consideration of layers with different optical properties, but requires significant computational resources and, consequently, time, which limits its use in solving the inverse problem of reconstructing optical properties from optical-spectral measurements for clinical application. The adding-doubling (AD) method, which offers high computational speed, can also be used to account for the multilayer nature of biological tissues. Its limitation is the inability to account for heterogeneities within each layer [20,21].
Modern investigations on the application of the inverse adding-doubling (IAD) method for restoring the optical properties of biological tissues are aimed at transferring it from laboratory conditions to clinical practice. Article [22] is dedicated to one of the challenges in biophotonics — the high computational complexity of real-time hyperspectral data analysis. The authors applied the inverse adding-doubling algorithm to reconstruct the optical properties of skin from hyperspectral data. The work is based on transferring resource-intensive iterative IAD calculations to graphics processing units, which significantly reduces the processing time for hyperspectral cubes, enabling in vivo data analysis. The method was successfully tested on hyperspectral images of the human forearm. Another study by the same research group [23] demonstrates that using literature data as initial values for optical properties in the IAD algorithm reduces the validity of the analysis and substantiates the need for preliminary individual model calibration to obtain reliable diagnostic results. According to the results of the study, specifying initial parameters from literature data yields a smaller scatter of results when working with ideal (simulated) data. However, during in vivo measurements, if the literature value is far from the patient's actual values, the algorithm produces a systematic error, rendering the diagnosis incorrect. The authors proposed conducting a preliminary assessment of optical properties by averaging spectral data and determining the optical properties for the averaged spectrum with various random initial parameter values.
Currently, various optical-spectral measurement methods are used to reconstruct optical properties. The standard method for this purpose is measurements using an integrating sphere, which provides high accuracy (>90%) but requires up to 30 s per wavelength and is limited for in vivo use. For example, in the paper [24] measurements of colon tissues separated into mucosal and submucosal layers were made using a spectrophotometer in diffuse reflectance, total transmission, and collimated transmission modes, followed by determination of the optical properties of these tissues in the 350–2500 nm range using the inverse adding-doubling method to obtain an initial approximation and the inverse Monte Carlo method to refine the absorption coefficients, scattering, and anisotropy factor. Another research group investigated the optical properties of normal and adenomatous human colon tissues for four tissue types (mucosa/submucosa and muscularis/chorion) in vitro using two integrating spheres and laser sources at wavelengths from 476.5 to 532 nm with the application of the inverse adding-doubling method [25], and at wavelengths of 630, 680, 720, 780, 850 and 890 nm using a titanium-sapphire laser and the inverse Monte Carlo method [26]. There is a study on adapting measurements on integrating spheres for application to finger tissues by moving from a flat sample to a cylindrical one [27].
Time-of-flight spectroscopy method uses picosecond pulsed lasers and measures the distribution of photon flight times [28,29]. One of its main drawbacks is the need for expensive equipment, the presence of motion artifacts, and its low speed (approximately 10 seconds per spectrum). In one study, time-resolved spectroscopy was used to reconstruct the optical properties of skin in vivo [30]. Spatial-frequency domain imaging uses sinusoidally modulated light to detect phase shift/amplitude changes. High-frequency components are weakly absorbed, allowing for the estimation of the reduced scattering coefficient, while both scattering and absorption contribute to the attenuation of low-frequency components [31]. A peculiarity of this method is the high probability of motion artifacts, which can be critical for measurements on living tissue. For in vivo measurements spatially resolved diffuse reflectance spectroscopy with data approximation using theoretical or empirical models is the most commonly used method [32,33]. This is an inexpensive and non-invasive method, but it is limited in diagnostic probing and is sensitive to boundary conditions.
One of the problems in determining optical properties is the lack of standards for this procedure. There is a multi-laboratory work which is devoted to investigating this problem [34], which presents the results of a study of light propagation in the human head, conducted jointly by several collaborating groups. The aim of the work is to locally determine optical properties at a specific location on the head. Various experimental methods were used, including continuous-wave and time-domain diffuse reflectance spectroscopy, modeling methods (e.g., Monte Carlo), and frequency-domain imaging. Each method was applied to the same subjects. The data were analyzed by comparing the experimental results with an analytical solution for a semi-infinite homogeneous medium, calculated using the diffusion approximation of the RTE. The measurements reveal large intersubject variations in both absorption and scattering.
In our study, we propose performing spectral measurements in diffuse reflectance (Rd) and transmission (Td) geometries to reconstruct optical properties, and processing the data using a modified adding-doubling (AD) method, which was obtained by converting the integrating sphere algorithm to an algorithm suitable for use with optical fibers. For spectroscopic measurements of hollow organs, it is possible to implement an illumination scheme from both sides of the organ wall: inside the lumen using a diffuser in a balloon catheter with a scattering liquid, and from the outside using flat end fiber, thus recording light both diffusely transmitted through the tissue and diffusely reflected from it. The distance between the illuminating and receiving fibers allows adjustment of the light penetration depth in diffusely reflectance regime. There is an insufficiency of the investigations dedicated to the methods for assessing the optical properties of multilayer biological tissues that can be used in vivo, their relevance is determined by the demand for personalized physical interventions in medicine, taking into account patient-specific values rather than average parameters for a given tissue type. Based on publicly available data, the use of proposed geometries of spectral measurements with a double-side lighting scheme using optical fiber as a receiver and subsequent reconstruction of optical properties has not been previously performed. The advantages of our method over spatially resolved diffuse reflectance spectroscopy include the consideration of light propagation throughout the entire thickness of the object being studied (assuming Td ≠ 0) and the ability to reconstruct a set of optical properties separately for each layer.
2. Materials and Methods
2.1. Spectral Measurements
There are two main parameters that characterize the optical properties of biological tissues: the absorption coefficient µa and the reduced scattering coefficient µs’, which is the scattering coefficient translated from anisotropic conditions to isotropic by taking into account the scattering anisotropy factor. To unambiguously determine two optical properties, it is necessary to register spectral data in two geometries. In our work, measurements were carried out in the geometry of diffuse reflection Td and diffuse transmission Rd. Spectral measurements were carried out on two spectroscopic setups, in one of which data was recorded using an integrating sphere, and in the other one using optical fibers.
Data collection using an integrating sphere was used as a common and sufficiently accurate method for determining optical properties, which can be considered the gold standard, and was carried out with the aim of subsequent verification of the developed algorithm for restoring optical properties. The diffuse reflection and transmission spectra were recorded on a Hitachi U-3400 spectrophotometer with the integrating sphere in the spectral range of 350-850 nm.
Fiber-optic measurements, suitable for intraoperative conditions in the future, were performed on a spectroscopic setup consisting of an optical radiation source (broadband or laser), optical fibers, a LESA-01-BIOSPEC spectrometer and a PC with the UnoMomento program. The diffuse reflection spectra were recorded using either a single Y-shaped optical probe or separately with an illuminating optical fiber and receiving optical probe. The Y-shaped probe had a diameter of 1.8 mm on the distal end and contained 7 fibers: one fiber for transmitting light to biological tissue in the center and six fibers for registration around it. The diameter of each fiber was 250 microns. At the entrance to the spectrometer, six receiving fibers were arranged in the form of a vertical line forming the slit of the spectrometer. The diameter of the separate flat end illumination fiber was 600 microns. For diffuse reflection measurements this separate illuminating fiber and receiving optical probe were mounted in contact with each other, providing a distance of 1.6 mm between the centers of the illuminating fiber and the receiving six-fiber probe. To obtain the values of diffuse reflection and transmission, the spectra from the studied samples were normalized to those recorded from barium sulfate, the reflection value of which in the spectral range between ultraviolet and near infrared is close to 100% [35].
At the stage of the development of the algorithm for restoring optical properties, a broadband radiation source (a halogen lamp with adjustable power) was used for the possibility of elaboration of the algorithm in a wide range of wavelengths. To verify the possibility of using the developed method in intraoperative conditions during photodynamic therapy, measurements were performed with laser sources such as a solid-state (Nd:YAG) diode-pumped laser (532 nm, up to 20 MW) and therapeutic diode laser (635 nm). The choice of a therapeutic diode laser with a wavelength of 635 nm as a laser source was conditioned by the fact that this wavelength, along with 630 nm, is one of the most common in photodynamic therapy of malignant neoplasms of the gastrointestinal tract using photosensitizers such as Photophrine and 5-ALA-induced protoporphyrin IX [8]. The laser considered was intended to be used for intraluminal delivery of light to the wall of the gastrointestinal tract through a fiber-optic diffuser inside a balloon catheter in order to register a diffuse transmission signal. Sodium thalaporfin is also often used for this nosology with laser radiation in the vicinity of 660 nm. Since this wavelength is also located in the window of biological transparency, the basic patterns of radiation propagation taken into account for the development of the algorithm are also valid for this case, which can be seen below from the results of measurements with a broadband radiation source. It can be assumed that data analysis in the range of 600-700 nm makes it possible to evaluate the scattering properties of the studied objects, since the absorption of the main tissue chromophore, hemoglobin, in this range is significantly lower than in the shorter wavelength region. The choice of an Nd:YAG laser with a wavelength of 532 nm as a laser source is conditioned by the fact that its wavelength falls into the spectral range of 500-600 nm, in which the predominant contribution to the spectrum is due to hemoglobin absorption, which affects the ratio of Rd and Td signals when using laser radiation for PDT in this area.
The peculiarity of the developed method is accounting for the specific geometry of the digestive tract organs, which allows for the registration of diffuse transmission to illuminate the wall of a hollow organ from the inside by inserting a Foley catheter filled with a light scattering medium into its lumen, with a fiber-optic diffuser inside, and for the registration of the diffuse reflection spectrum with the end-mounted optical probe from the outside of the organ wall as a lighting probe (Figure 1). The receiving probe is always located on the outside of the organ wall in contact with it at a predetermined distance from the end of the lighting probe, providing sufficient probing depth of wall, and in the position corresponding approximately to the center of the scattering spot from the intraluminal light source. Intraoperative measurements can be performed with the use of the broadband radiation source to carry out registration of the Rd and laser source at a wavelength of 635 nm for Td measurements. This configuration of the measurement set up is justified when the broadband light source is used for the assessment of the oxygen saturation level to avoid the additional spectral acquisition. In the absence of the oxygen saturation evaluation the registration of the both diffuse reflection and transmission signals can be detected with the use of laser source which is used for photodynamic procedure.
2.2. The Algorithm for Restoring Optical Properties
The developed algorithm for restoring optical properties is a two-stage process for analyzing the diffuse transmission and reflection spectra of samples or biological tissues. At the first stage, the modified Kubelka-Munk (KM) two-stream model is used to estimate the optical parameters averaged over the entire thickness of the sample, the results of the elaboration of this method presented in one of the previous works [36]. The Kubelka–Munk two—stream model applied to biological tissues describes the transfer of light through a turbid medium as a combination of two oppositely directed diffuse streams - one propagating into the depths of the tissue, and the second reflected from deep layers and returning to the surface. The model reduces the complex problem of multiple scattering to a one-dimensional system where the intensities of incident and reflected diffuse fluxes are described by linear differential equations; the parameters of the medium are set by the total absorption and scattering coefficients. It is possible to associate the absorption (K) and scattering (S) parameters of the Kubelka-Munk model with the absorption coefficient (µa) and the reduced scattering coefficient (µs) used in the theory of radiation transfer, however, the dependencies used for this purpose, which can be found in the literature [37],
may not meet the specific measurement conditions. Dependencies (1) and (2) will henceforth be abbreviated as KM from literature (KMlit.). In our work, alternative conversion formulas are proposed based on the results of numerical modeling of light propagation in a medium with optical parameters corresponding to those of the intestinal wall. In the same way as it was previously implemented in our work [36], to determine the dependences of optical properties on Kubelka-Munk parameters, numerical modeling of light propagation in mathematical models of the studied tissues was performed using the Monte Carlo method in order to obtain values of diffuse reflection and transmission of samples according to the specified µa and µs’. After that, using the known dependencies between Td and Rd and Kubelka-Munk parameters, the values of K and S were calculated and empirical relationships between Kubelka-Munk parameters and the absorption coefficient and the reduced scattering coefficient were derived.
The second stage of the developed algorithm consists in applying the inverse adding-doubling method with the initial values of optical properties (OP) determined in the first step. The algorithm of the inverse AD method (Figure 2) consists in the iterative implementation of the direct AD method, which performs the determination of diffuse reflection and transmission according to specified optical properties until the identification of the values of OP at which the difference between the determined and experimental values of Rd and Td will be minimized. To accomplish this, the thickness of the test sample is virtually divided into layers in accordance with the anatomical features of the organ. Each layer has its own set of optical properties. The first iteration of the direct AD method is performed with the values of optical properties determined in the first step using modified formulas of the Kubelka-Munk two-stream model. After its realization, determined values of diffuse reflection and transmission (RAD, TAD) are compared with experimental ones (Rexp., Texp.) and the desired accuracy achievement in their correspondence is checked. If the desired accuracy is accomplished, the values of the optical properties are considered reliable. In the opposite case, iterations of the direct method are performed for other values of optical properties in a given range and the difference between determined and experimental values is minimized by the Nelder-Mead method, which is widely used in this field [38,39].
The algorithm of the developed method for restoring optical properties, including modified dependencies for the parameters of the Kubelka-Munk two-stream model and the inverse adding-doubling method, is implemented in the Python programming language using the math, numpy, iadpython, and scipy libraries. The code fragment dedicated to the modified KM method is a simple calculation using the derived formulas which determines the average values of optical properties for all layers of the sample. The vast majority of the code for the algorithm of the direct AD method is reproduced from the materials of Scott Prahl [39,40]. The algorithm of the inverse AD method is an iterative execution of the direct AD method with specified initial and boundary conditions of optical properties for each layer of the sample until optimal parameter values are found by minimizing the discrepancy between experimental and direct AD Td and Rd obtained using the Nelder-Mead method. The initial values of the optical properties are set based on the values obtained during the application of the modified Kubelka-Munk method, adapted for each of the layers by determining the expected proportions of the OP between the layers of the sample according to data from literary sources [24,25,26,41,42,43], and dividing by these proportions so that the average thickness values of µa and µs’ corresponded to those obtained in the first step. The formula used to calculate the proportions:
where OPi is the required optical property (µa or µs’) of layer i, OPKMmod. is the optical property (µa or µs’) generalized for the entire thickness of the sample, determined by performing the modified Kubelka-Munk method, OPi lit. is the optical property (µa or µs’) of layer i from the literature data, d is the thickness of the entire sample, di is the thickness of layer i, n is the number of layers. The boundary conditions were set based on adequate values for gastrointestinal tissues. For µa, the boundary conditions were established in the range from 0 to 20 cm-1, for µs - from 0 to 1000 cm-1, for g - from 0.6 to 1, for the thickness of a separate layer - from 0 to 3 mm.
In the described algorithm for restoring optical properties, it is assumed that the values of diffuse reflection and transmission were obtained using an integrating sphere. While registering data using optical fibers requires taking into account the numerical aperture value, which in our case is 0.37. The results of taking this aspect into account are given in the Results section.
2.3. Investigated Objects
2.3.1. Optical Phantom
In order to develop the algorithm for determining optical properties using optical fibers with an aperture of 0.37, optical phantoms with different OP values were made. Whole human blood was used to simulate the absorbing properties of gastrointestinal tissues, and fat emulsion solution (Intralipid 20%) was used to simulate the scattering properties. An optical phantom matrix was made with variations of the scattering medium and blood in a range of physiologically relevant concentrations. Four optical phantoms with paired concentrations of blood and fat emulsion of 1 and 5% were studied. Optical properties of the optical phantoms with the value of hemoglobin oxygen saturation equal to 85% presented in the Table 1. A 0.9% NaCl solution was chosen as the solvent to preserve the oxygen-binding function of hemoglobin, because with distilled water blood cells are lysed and heme is separated from the hemoglobin molecule [44]. To record spectral data, the phantoms were placed in a quartz cuvette with a thickness of 1 mm. For this set of phantoms, data was collected at both spectroscopic setups: using an integrating sphere and using optical fibers to determine the coefficient that takes into account the translation of the algorithm from measurements at full angle using an integrating sphere to measurements using aperture-limited optical fibers.
A gelatin-based intestinal phantom was manufactured to verify the developed method for evaluating optical properties with the equipment configuration designed for the possibility of conducting research in a clinical setting. The concentration of intralipid (IL) and blood was selected in accordance with the literature data on the optical properties of the wall of a large intestine at a wavelength of 635 nm. The absorption coefficient in this case is 0.3 cm-1, which corresponds to 5% of human whole blood. The scattering coefficient is 185 cm-1, which corresponds to 5% fat emulsion. The solid-state base was provided using gelatin. In the visible wavelength range, the absorbing and scattering properties of gelatin are insignificant [45]. 0.9% NaCl solution was used as the solvent. The diffuse reflection and transmission spectra were recorded at three points of the optical phantom.
2.3.2. Resected Samples
The developed method for restoring optical properties was tested on two resected stomach samples divided into mucosal-submucosal and muscular layers. Spectral data was recorded using both an integrating sphere and optical fibers. The measurements were carried out alternately with the location of the source on different sides of the two-layer samples. The study was conducted within 12 hours after resection. After excision and before the start of the experiment, the samples were stored in 0.9% NaCl solution. For the possibility of measurements on the integrating sphere, the samples were placed between slide glasses. The thickness of the samples was measured after they were fixed between the slides using a caliper and amounted to 1.2±0.1 mm. The Td and Rd spectra were recorded using laser source with radiation wavelength of 635 nm to record diffuse reflection and transmission.
To set the initial values of optical properties in the implementation of the IAD method, two approaches were used: literature data and an initial assessment using the modified Kubelka-Munk method, which is described above.
2.3.3. Intraoperative Measurements
The in vivo measurements of Rd and Td spectra were performed on the large intestine during the resection of the malignant neoplasm of the sigmoid colon. The patient was a 60 year old woman. Registration of diffuse transmission was performed with the laser source on a wavelength 635 nm through the developed configuration of the set up implying the use of Foley catheter. The diffuse reflection was performed both with laser and broadband sources.
3. Results
3.1. Comparison of Different Approaches to Setting Initial Values of Optical Properties
The results of restoring the optical properties from Rd and Td using the inverse AD method strongly depend on the initial values, which necessitates the determination of the optimal approach for their assignment. In our work, two methods are proposed for setting the initial values of optical properties: according to literature data and using a modified version of the KM model. The literature values of optical properties for optical phantoms and the three-layer representation of the intestine wall are given in Table 1 and Table 2, respectively. The modified dependences of the absorption coefficient and the reduced scattering coefficient on the absorption and scattering parameters of the Kubelka-Munk two-stream model for wavelengths of 532 and 635 nm were determined by analogy with the approach described in the article [36]. For wavelength 532 nm:
For wavelength 635 nm:
In the following text of the article, formulas (4)-(7) will be referred to as KM modified (KMmod.).
Using a modified version of the KM model, μa and μs′ were determined for the entire thickness of the studied sample based on the diffuse reflectance and transmittance values. To determine the initial values layer by layer, coefficients were calculated for each layer of the intestine wall based on the literature data of the optical properties for this organ using the formula (3). Multiplying the OP values determined using the modified KM model by these coefficients yields the initial μa and μs′ values for each layer. The thickness-averaged OP values remain equal to μaKMmod. and μs’KMmod. Table 3 presents the determined proportions for the three-layer intestinal wall model.
The data obtained during Rd and Td registration using an integrating sphere were used to compare different methods for setting the initial values of optical properties using the IAD method. A comparison was made between the correspondence of the reconstructed values of optical properties with expected ones based on the concentrations of optical phantom components for four cases: when setting the initial OP values based on literary data (IADinit.) and using a modified version of the KM model (KMmod.+IAD), as well as when applying the literary dependencies of the KM model (KMlit.) and when applying modified KM dependencies (KMmod.). When setting the expected values of the absorption coefficient for blood concentrations in optical phantoms, the hemoglobin oxygen saturation level was assumed to be 70% in accordance with the value obtained by processing spectral data (68±7%) using the method presented in previous studies [46,47].
Table 4 shows the results of comparing four methods for restoring optical properties from Rd and Td data of phantoms at a wavelength of 635 nm. It can be seen that the worst correspondence with the expected values of optical properties was obtained using the literary dependencies of the Kubelka-Munk model (77±6%). The best result was obtained using the method proposed in this paper: a combination of modified dependencies of the KM model and the IAD. Performing OP calculations with only modified KM showed a result close to the combined KM and reverse AD. However, KM dependencies do not allow to restore the optical properties of multilayer models and can only work in the range of optical properties for which they were derived (µa = 2-10 cm-1, µs’ = 10-60 cm-1). There is a lower percentage of correspondence between the calculated concentrations based on the phantom components and the results of using IAD with the initial values corresponding to the expected values than with the initial values determined using KMmod.. This indicates that the real values of the optical properties of the phantoms differed from those assumed, which were conditioned, among other things, by the uniqueness of the optical properties of whole blood.
To verify the applicability of the developed method for restoring optical properties on multilayer samples, the algorithm was verified using a three-layer model of the intestinal wall (Table 2). The Rd and Td values were obtained by numerical Monte Carlo simulation with the geometry of an incident radiation beam from a fiber with a radius of 0.125 mm and a numerical aperture of 0.37 [40]. In this case, a comparison of two approaches to setting the initial values of optical properties was also carried out.
Since the values expected during the restoration of optical properties are reliably known in this case, it can be assumed that Table 5 shows the accuracy of the developed method for a three-layer model of hollow organs of the gastrointestinal tract. It is predictable to have a greater significance when setting the initial values of the OP according to the literature data, since these values were used in modeling Rd and Td using the Monte Carlo method. When setting the initial values of optical properties with the modified version of the KM model, the accuracy of the developed OP recovery method is 88±18%.
3.2. The Transition from Measurements with an Integrating Sphere to Measurements with Optical Fibers with a Limited Aperture
The differences between the numerical aperture at the reception of optical fiber and the registration condition by integrating sphere require the development of an original method for interpreting the recorded data. The method of restoring optical properties was translated from measurements with an integrating sphere to measurements with optical fibers with a limited aperture based on data obtained from a matrix of phantoms with blood and Intralipid concentrations of 1 and 5%. In the spectroscopic setup with optical fibers, the diffuse reflection and transmission spectra were recorded using a broadband source. Figure 3 shows a comparison of the obtained Rd and Td in the case with the integrating sphere (Rdsphere and Tdsphere) and with optical fibers (Rdfiber and Tdfiber).
When comparing spectral measurement data depending on the phantom component concentrations, it is evident that in the 500-600 nm range, where attenuation is primarily due to hemoglobin absorption, the diffuse reflectance and transmittance intensities are lower for both the sphere and fiber in cases with higher blood concentrations. Meanwhile, at the same blood concentration, the Rd and Td values in this spectral range are similar. When examining the 630-700 nm range, it is noticeable that more similar Rd and Td intensities are observed for phantoms with the same Intralipid concentration. This is due to the fact that the contribution of hemoglobin to attenuation becomes minimal, and attenuation is primarily due to scattering. In general, based on the comparison results, we can conclude that at low scatterer concentrations (1% Intralipid solution), the spectra recorded using the integrating sphere and optical fibers are quite close, but at high scatterer concentrations (5% Intralipid solution), the diffuse reflection signal collected by the integrating sphere is significantly higher than that in the fiber optic probe.
The direct spectral data were compared to determine the correction factor for measurements with optical fibers to account for its numerical aperture. The diffuse transmission values obtained with the sphere and fiber turned out to be similar in intensity. It can be seen that the intensity of diffuse reflection at 630-700 nm significantly depends on the concentration of the fat emulsion. Since it is impossible to pre-determine the concentration of scattering components in intraoperative conditions, averaging the quotient of Rdshere/Rdfiber and Tdshere/Tdfiber for all concentrations of phantom components at specific wavelengths was proposed as the first approach to determining the coefficient for translating measurements with a sphere to measurements with optical fibers. For a wavelength of 532 nm, Rd with a sphere is 3.4±1.9 times greater than Rd with fibers, and Td values with a sphere are 0.95±0.15 times greater than Td with fibers. For a wavelength of 635 nm, the Rd values with a sphere are 1.4±0.3 times greater than the Rd with fibers. Accordingly, to use the developed OP recovery method, it is necessary to pre-multiply the values of the diffuse reflection of the fiber by a correction factor of 1.4. For a wavelength of 635 nm, Td with the integrating sphere greater than Td with optical fibers by a factor of 1.00±0.07, which makes it possible not to alter the values of diffuse transmission when using it as input data to restore the optical properties of the sample. As a second approach for determining the coefficient during the transition from spherical measurements to optical fibers measurements, it was proposed to average Rdshere/Rdfiber and Tdshere/Tdfiber at fixed values of the fat emulsion concentration at a wavelength of 635 nm. At a fat emulsion concentration of 1%, Rd with a sphere is 1.8±1.1 times greater than Rd with fibers, and Td values with a sphere are 1.00±0.16 times greater than Td with fibers. At a fat emulsion concentration of 5%, Rd with a sphere greater than Rd with fibers is 3.0±1.9 times, Td values with a sphere greater than Td with fibers are 0.97±0.08 times. When solving the inverse problem, we do not know in advance which scattering coefficient we will get, which makes it difficult to use the correction coefficients determined using the second approach when translating the algorithm from the integrating sphere to the fiber-optic spectrometer. However, it is possible to introduce a progressive correction factor based on the intensity of the diffuse reflection signal itself in the range of 630-700 nm: the higher it is, the higher the coefficient that “corrects” the spectrum, bringing it to the conditions of full reception aperture in the integrating sphere. Figure 4 shows a graph of the dependence of the adjustment coefficient (AC) on the Rd value recorded with optical fibers at a wavelength of 635 nm. When approximating the experimental data with a linear relationship, it turns out that
3.3. Determination of the Accuracy of the Developed Method for Restoring Optical Properties
To determine the accuracy of the developed method based on experimental data, a comparison was made of the results of optical property restoration based on spectral data obtained using the integrating sphere and using the optical fibers. The accuracy of the two approaches for determining correction factors during the transition from measurements with sphere to measurements with optical fibers was compared. The results of the first approach, which consists in averaging AC regardless of the concentration of the fat emulsion at specific wavelengths, are shown in Figure 5 and Figure 6.
The accuracy of the developed method at a wavelength of 532 nm was determined to be 70±20%.
When comparing the results of OS reconstruction from spectral data at a wavelength of 653 nm obtained using measurements with the integrating sphere and with the optical fibers, it turned out that the correspondence between μa is 60±20%, µs is 71±4%, g is 99±2%, d is 98.1±0.9%. This allows us to estimate the overall accuracy, which is 80±20%.
Figure 7 and Figure 8 show the results of applying the second approach of switching from measurements with an integrating sphere to measurements with optical fibers, which consists in averaging AC at a wavelength of 635 nm at fixed values of the fat emulsion concentration, which determines the value of Rd in the spectral range of 630-700 nm.
When comparing the results of OP reconstruction from spectral data on optical phantoms with a fat emulsion concentration of 1% obtained using measurements with the integrating sphere and with the optical fibers, it turned out that the correspondence between μa is 80±30%, µs is 90±30%, g is 97±4%, d is 92±17%. This allows us to estimate the overall accuracy, which is 88±9%.
When comparing the results of OP reconstruction from spectral data on optical phantoms with a fat emulsion concentration of 5% obtained using measurements with the integrating sphere and with the optical fibers, it turned out that the correspondence between μa is 70±30%, µs is 70±30%, g is 98±3%, d is 99.0±1.1%. This allows us to estimate the overall accuracy, which is 84±17%.
According to the results obtained, the accuracy of the first approach of translating measurements with a sphere to measurements with optical fibers was estimated to be 80±20%, and the second approach - 86±13%. Thus, the second approach makes it possible to more reliably restore optical properties from spectral data. All of the following results, unless otherwise indicated, are presented using the second approach for translating measurements with integrating sphere to measurements with optical fibers.
3.4. Validation of the Developed Method on Optical Phantoms and Samples of Gastrointestinal Tissues
The approbation of the developed OP recovery method was carried out on a gelatin-based phantom of the intestinal wall with the configuration of the spectroscopic setup designed for measurements in intraoperative conditions. The reconstructed values when applying the first approach of transition from measurements with integrating sphere to measurements with optical fibers: µa=0.98±0.06 cm-1, =139±8 cm-1, g=0.66±0.04, d=2.85±0.16 mm, which corresponds by 80±20% to the expected values determined according to the concentrations of the optical phantom components. When applying the second approach of switching from measurements with integrating sphere to measurements with optical fibers, the following values of optical properties were obtained: µa= 0.53±0.02 cm-1, µs=228±9 cm-1, g=0.66±0.03, d=2.82±0.11 mm, which corresponds to the expected values by 90±9% to the values based on the concentrations of blood and fat emulsion of the optical phantom. These results confirm the expediency of choosing the second approach of translating measurements with integrating sphere to measurements with optical fibers in the developed method for restoring optical properties.
Verification of the developed method was carried out on resected stomach samples. Two two-layered mucosal-submucosal layer samples and two single-layered muscle layer samples were examined. The Rd and Td spectra were recorded using both the integrating sphere and optical fibers. Figure 9 shows the results of restoring the absorption and scattering coefficients for the wavelength of laser exposure during photodynamic therapy (635 nm), averaged over the samples. The results of the restoration of the OP layers of the stomach during measurements with an integrating sphere and with optical fibers converge by 82±18% and correspond to the literature data [42].
3.5. Clinical Approbation
In the result of the implementation of the developed method on the spectra, which were registered in the intraoperative conditions the optical parameters for each of three layers of the large intestine were derived. The input values of diffuse transmission were obtained with the use of laser source (635 nm) and the configuration of the measurement set up developed for the clinical conditions. The input values of diffuse reflection were received with both laser and broadband sources. For the case when Rd was detected with the broadband source the optical properties of the mucosal layer: µa=0.92±0.10 cm-1, µs=790±90 cm-1, g=0.60±0.07, d=0.55±0.06 mm, of the submucosal layer: µa=0.90±0.09 cm-1, µs=115±12 cm-1, g=0.88±0.10, d=0.46±0.05 mm, of the muscle: µa=0.121 ±0.013 cm-1, µs=270±30 cm-1, g=0.82±0.09, d=2.2±0.2 mm. For the case when Rd was detected with the laser source (635 nm) the optical properties of the mucosal layer: µa=1.502±0.002 cm-1, µs=515.7±0.5 cm-1, g=0.607±0.005, d=0.53±0.04 mm, of the submucosal layer: µa=1.359±0.012 cm-1, µs=83.27±0.08 cm-1, g=0.910±0.009, d=0.503±0.005 mm, of the muscle: µa=0.207±0.019 cm-1, µs=202.4±0.2 cm-1, g=0.821±0.008, d=2.46±0.02 mm. The values of the optical properties correspond to the data from literature sources. A larger range of values (greater margin of error) is conditioned by higher divergence of the spectra for the broadband source. The variation in values can be explained by the change in measurement conditions during changeover of the sources.
4. Discussion
4.1. Accuracy
The Results section of this paper presents several values indicated as accuracy: 88±18% for the three-layer intestinal model using Rd and Td values obtained by numerical Monte Carlo simulation as input, 80±20% for the first approach of determining the adjustment coefficient when switching from measurements with an integrating sphere to measurements with optical fibers according to the experiment on optical phantoms, 86± 13% for the second approach of determining AC by diffuse reflection and transmission recorded from the phantoms. The greatest value in the first case is due to the absence of errors, which are inevitably introduced during the experimental nature of obtaining the input values Rd and Td both in the manufacture of optical phantoms and during the registration of spectral data. A comparison of the accuracy of the first and second AC determination approaches was carried out in order to select the best of the studied concepts. The final algorithm for restoring optical properties includes a second approach for determining AC, taking into account the intensity of diffuse reflection in the spectral range of 630-700 nm. Thus, it is appropriate to assume that the accuracy of the developed OP recovery method is 86±13%.
4.2. Assessment of Absorbed Laser Dose
In most clinical practice cases, when planning photodynamic therapy, the dose of laser radiation on the tissue surface is calculated, which is measured in J/cm2 and defined as the laser radiation power in the output from the optical fiber multiplied by the exposure time and divided by the area of neoplasm. The value of this dose is usually based on protocol-defined values from previous studies or regulatory instructions for this photosensitizer, wavelength and localization of the disease, thereby, it is fixed regardless of the optical parameters of the biological tissues of a particular patient. However, the same dose on the surface of biological tissues does not guarantee an identical photochemical effect in the target volume, since tissue optics, blood perfusion, oxygen saturation, and photosensitizer distribution strongly alter the actual dose inside the tissue [48]. To monitor the processes in the depth of the tissue, it is necessary to evaluate the absorbed dose of laser radiation.
Spectral data recorded in order to restore optical properties during laser-induced therapy of the gastrointestinal tract can also be used to determine the absorbed dose of laser radiation. The absorbed dose can be estimated both directly from spectral measurement data by subtracting the values of diffuse reflection and diffuse transmission from the unit, and by using methods for modeling the propagation of optical radiation in biological tissues, such as the direct AD method and the Monte Carlo method, based on certain values of the absorption coefficient, scattering coefficient and anisotropy factor. The first approach makes it possible to determine the absorbed dose only in the entire thickness of the gastrointestinal tissue, while using the direct AD method, it is possible to estimate the absorbed dose separately for each layer by obtaining Rd and Td values according to the OP values determined using the developed method for the restoration of the optical properties. The accuracy of the absorbed dose estimation by the AD method was evaluated in previous work [40] and can be considered to be equal to 95±3%.
Since the therapeutic effect is determined not only by the fact of light delivery, but also by the exact depth of the wall that received the threshold photochemically active dose, a layered assessment of the absorbed dose makes it possible to more accurately predict the zone of cell death and reduce the risk of insufficient treatment of deeply located pathological foci. This is especially important for the digestive tract, since the mucosa, submucosa and muscle membranes can differ markedly in absorption and scattering properties, and therefore in the depth of penetration of therapeutic radiation. Thus, the developed method can be used not only to select the radiation parameters, but also to assess whether the light reaches the desired layer of the organ wall during PDT. In addition, the amount of the laser dose affects the mechanism of cell death (necrosis or apoptosis) [49], thus, a layered assessment of the absorbed dose makes it possible to more accurately predict the cell death zone and limit excessive damage to intact tissues. Determining the effective radiation dose for a specific tumor is a crucial factor in achieving a positive treatment outcome [50]. In addition, layered dosimetry makes it possible to take into account the heterogeneity of tumor growth in the organ wall and use changes in optical parameters as an indirect marker of the depth of invasion of the malignant process. Thus, the assessment of the absorbed dose by layers is not only a tool for planning and controlling photodynamic therapy, but also an important element of a personalized analysis of the prevalence of gastrointestinal wall damage.
4.3. Applicability of the Developed Method in Clinical Conditions
The developed method of OP restoration from diffuse reflection and diffuse transmission is completely prepared and approbated for intraoperative conditions for the walls of hollow organs of the GIT. The method can be used to analyze biological tissues with varying degrees of optical density, as well as to study the spectral dependence of parameters in a wide range of wavelengths (450-700 nm). The developed method can be used to monitor dynamic tissue changes, assess the degree of vascularization, the content of chromophores, and the effects of external influences such as heating, photodynamic processes, or the effects of medications.
The possibility of applying the developed method on multilayer models is important for biological objects, since the surface and deep layers of tissue often have different structures, water content, and cell density. The restoration of parameters by layers allows not only to obtain an integral characteristic of the tissue, but also to identify the contribution of each anatomical component to the formation of the measured signal. This expands the possibilities of the method in solving diagnostic problems and in interpreting spectroscopic data.
One of the advantages of the developed method is its non-invasiveness. An additional advantage of the method in cases of gastrointestinal malignancies is the ability to evaluate the layered lesion of the organ wall by a tumor using a multilayer model and comparing the reconstructed optical parameters for individual anatomical layers. Since tumor infiltration changes the hemoglobin content, cell density, degree of scattering and, often, anisotropy, its presence can manifest itself as a shift in the restored optical characteristics relative to the intact tissues. This creates the basis for an indirect assessment of the depth of tumor proliferation in the layers of the gastrointestinal wall, which is especially valuable in the initial stages of cancer and in monitoring the local response to PDT.
The limitations of the method are primarily related to the sensitivity to the quality of the initial measurements and the correctness of the selected model (the number of layers and their initial thickness values). The accuracy of reconstruction significantly depends on information about the thickness of the layers and the degree of uniformity of the sample, which necessitates the intraoperative use of additional methods for assessing these parameters, for example, ultrasound. In addition, with strong scattering anisotropy, very high absorption capacity, or sharp spatial heterogeneity of the medium, ambiguities may arise in estimating the parameters. It should be considered that, in accordance with formula (8), the Rd values obtained during recalculation should fall into the range from 0 to 1, which limits the applicability of this adjustment coefficient formula to the range from 0.227 to 0.443 of the initial values of diffuse reflection recorded with optical fibers in the spectral range of 630-700 nm. Also, in the case of using a monochromatic source in the high absorption region, in order to be able to apply the developed method, it is necessary to supplement the system with the additional light source in the window of biological transparency for independent determination of the Rd adjustment coefficient.
5. Conclusions
The configuration of the spectroscopic setup developed for the possibility of intraoperative measurements and the method of simultaneous recording of diffuse reflection and transmission of optical radiation by multilayer hollow organs using a fiber-optic spectrometer make it possible to analyze spectra in two geometries by analogy with the method of two integrating spheres. The developed method for restoring μa, μs and g from Rd and Td values, which is a combination of determining the adjustment coefficient to account for the presence of a numerical aperture of an optical fiber, applying modified dependencies of the Kubelka-Munk two-stream model and implementing the algorithm of the inverse adding-doubling method, allows estimating optical properties with an accuracy of 86±13%, which can be used for personalization of laser-induced, including photodynamic, therapy of the gastrointestinal tract by layer-by-layer control of the absorbed dose of laser radiation.
Author Contributions
Conceptualization, T.S.; methodology, T.S., A.K. and D.K.; software, A.K., T.S. and K.L.; validation, A.K., T.S., D.K. and V.L. (Vladimir Levkin); formal analysis, A.K. and T.S.; investigation, A.K., T.S., D.K., I.R. and V.L. (Vladimir Levkin); resources, V.L. (Vladimir Levkin), S.K., K.E. and V.L. (Victor Loschenov); data curation, A.K.; writing—original draft preparation, A.K.; writing—review and editing, T.S. and V.M.; visualization, A.K.; supervision, T.S. and V.L. (Vladimir Levkin); project administration, T.S.; funding acquisition, T.S., V.L. (Victor Loschenov), K.E., V.M. and V.L. (Vladimir Levkin). All authors have read and agreed to the published version of the manuscript.
Funding
This research was funded by the Russian Science Foundation, grant No. 25-25-00516.
Institutional Review Board Statement
The study was conducted in accordance with the Declaration of Helsinki, and approved by the Institutional Review Board of I.M. Sechenov First Moscow State Medical University.
Informed Consent Statement
Informed consent was obtained from all subjects involved in the study.
Data Availability Statement
The raw data supporting the conclusions of this article will be made available by the authors on request.
Conflicts of Interest
The authors declare no conflicts of interest.
Abbreviations
The following abbreviations are used in this manuscript:
| MDPI | Multidisciplinary Digital Publishing Institute |
| DOAJ | Directory of open access journals |
| TLA | Three letter acronym |
| LD | Linear dichroism |
| GIT | Gastrointestinal tract |
| PDT | Photodynamic therapy |
| RTT | Radiative transfer theory |
| RTE | Radiative transfer equation |
| MC | Monte Carlo |
| AD | Adding-doubling |
| IAD | Inverse adding-doubling |
| Rd | Diffuse reflection |
| Td | Diffuse transmission |
| KM | Kubelka-Munk |
| IL | Intralipid |
References
- Zhan, T.; Betge, J.; Schulte, N.; Dreikhausen, L.; Hirth, M.; Li, M.; et al. Digestive cancers: mechanisms, therapeutics and management. Sig Transduct Target Ther. 2025, 10, 24. [CrossRef]
- Wang, S.; Zheng, R.; Li, J.; Zeng, H.; Li, L.; Chen, R.; et al. Global, regional, and national lifetime risks of developing and dying from gastrointestinal cancers in 185 countries: A population-based systematic analysis of GLOBOCAN. Lancet Gastroenterol. Hepatol. 2024, 9, 229–237. [CrossRef]
- Danpanichkul, P.; Pang, Y.; Tothanarungroj, P.; et al. Gastrointestinal cancer statistics in 2022 and projection to 2050: GLOBOCAN estimates across 185 countries. Cancer 2026, e70245. [CrossRef]
- Yano, T.; Wang, K.K. Photodynamic therapy for gastrointestinal cancer. Photochem. Photobiol. 2020, 96, 517–523. [CrossRef]
- Choi, M.G. Application of photodynamic therapy in gastrointestinal disorders. Photodiagnosis Photodyn. Ther. 2024, 46, 104172. [CrossRef]
- Aebisher, D.; Woźnicki, P.; Dynarowicz, K.; Kawczyk-Krupka, A.; Cieślar, G.; Bartusik-Aebisher, D. Photodynamic therapy and immunological view in gastrointestinal tumors. Cancers 2024, 16, 66. [CrossRef]
- Wilson, B.C.; Lilge, L.; Weersink, R.A.; Pires, L. Photodynamic therapy dosimetry: Current status and the emerging challenge of immune stimulation. J. Biomed. Opt. 2025, 30, S34118. [CrossRef]
- Krivetskaya, A.A.; Savelieva, T.A.; Kustov, D.M.; Levkin, V.V.; Kharnas, S.S.; Loschenov, V.B. Automatization of planning and control of photodynamic therapy of gastrointestinal organs. Biomed. Photonics 2025, 14, 40–54. [CrossRef]
- Xiang, Y.; Yao, L.D. Risk factors for lymph node metastasis and invasion depth in early gastric cancer: Analysis of 210 cases. World J. Gastrointest. Surg. 2024, 16, 3720–3728. [CrossRef]
- Xu, J.; Yin, F.; Ren, L.; Xu, Y.; Min, C.; Zhang, P.; et al. The risk factors of lymph node metastasis in early colorectal cancer: A predictive nomogram and risk assessment. Int. J. Colorectal Dis. 2024, 39, 191. [CrossRef]
- Yu, Y.B. Risk factors for lymph node metastasis in superficial esophageal squamous cell carcinoma. World J. Gastroenterol. 2024, 30, 1810–1814. [CrossRef]
- Li, Z.; Li, Z.; Jia, S.; Bu, Z.; Zhang, L.; Wu, X.; et al. Depth of tumor invasion and tumor-occupied portions of stomach are predictive factors of intra-abdominal metastasis. Chin. J. Cancer Res. 2017, 29, 109–117. [CrossRef]
- Tuchin, V. Tissue optics and photonics: Light-tissue interaction. J. Biomed. Photonics Eng. 2015, 1, 98–134. [CrossRef]
- Bazylev, N.B.; Lavinskaya, E.I.; Fomin, N.A. Influence of multiple-scattering processes on the laser probing of biological tissues. J. Eng. Phys. Thermophys. 2003, 76, 969–979. [CrossRef]
- Ziaee, S.; Ansari, M.A.; Khatami, S.S.; Shariati, B.K.; Ghotbi Maleki, V.; Nejad Ebrahimi, S.; et al. Variation of optical properties of mouse brain using an optical clearing agent: Experimental and simulation approaches. Biomed. Opt. Express 2025, 16, 1423–1438. [CrossRef]
- Jacques, S.L. Optical properties of biological tissues: A review. Phys. Med. Biol. 2013, 58, R37. [CrossRef]
- Filatova, S.A.; Shcherbakov, I.A.; Tsvetkov, V.B. Optical properties of animal tissues in the wavelength range from 350 to 2600 nm. J. Biomed. Opt. 2017, 22, 035009. [CrossRef]
- Vinckenbosch, L.; Lacaux, C.; Tindel, S.; Thomassin, M.; Obara, T. Monte Carlo methods for light propagation in biological tissues. Math. Biosci. 2015, 269, 48–60. [CrossRef]
- Dumont, A.P.; Fang, Q.; Patil, C.A. A computationally efficient Monte-Carlo model for biomedical Raman spectroscopy. J. Biophotonics 2021, 14, e202000377. [CrossRef]
- Prahl, S.A.; van Gemert, M.J.C.; Welch, A.J. Determining the optical properties of turbid media by using the adding–doubling method. Appl. Opt. 1993, 32, 559–568.
- Prahl, S.A. The adding-doubling method. In Optical-Thermal Response of Laser-Irradiated Tissue; Welch, A.J.; Van Gemert, M.J.C., Eds.; Springer: Boston, MA, USA, 1995. [CrossRef]
- Tomanic, T.; Rogelj, L.; Milanic, M. GPU-accelerated inverse adding-doubling method for analysis of skin hyperspectral images. Proc. SPIE 2021, 86. [CrossRef]
- Tomanič, T.; Rogelj, L.; Milanič, M. Robustness of diffuse reflectance spectra analysis by inverse adding doubling algorithm. Biomed. Opt. Express 2022, 13, 921–949. [CrossRef]
- Bashkatov, A.; Genina, E.; Kochubey, V.; Rubtsov, V.; Kolesnikova, E.; Tuchin, V. Optical properties of human colon tissues in the 350–2500 nm spectral range. Quantum Electron. 2014, 44, 77. [CrossRef]
- Wei, H.J.; Xing, D.; Lu, J.J.; Gu, H.M.; Wu, G.Y.; Jin, Y. Determination of optical properties of normal and adenomatous human colon tissues in vitro using integrating sphere techniques. World J. Gastroenterol. 2005, 11, 2413–2419. [CrossRef]
- Wei, H.; Xing, D.; Wu, G.; Gu, H.; Lu, J.; Jin, Y.; et al. Differences in optical properties between healthy and pathological human colon tissues using a Ti:sapphire laser: An in vitro study using the Monte Carlo inversion technique. J. Biomed. Opt. 2005, 10, 044022. [CrossRef]
- Wagner, M.; Beutel, B.; Naglic, P.; Fugger, O.; Foschum, F.; Kienle, A. Determination of finger optical properties using an integrating sphere. Sensors 2026, 26, 2173. [CrossRef]
- Liebert, A.; Wabnitz, H.; Grosenick, D.; Möller, M.; Macdonald, R.; Rinneberg, H. Evaluation of optical properties of highly scattering media by moments of distributions of times of flight of photons. Appl. Opt. 2003, 42, 5785–5792. [CrossRef]
- Plucinski, J. Estimation of optical parameters of highly scattering materials by time-of-flight spectroscopy. Proc. SPIE 2004, 5505. [CrossRef]
- Damagatla, V.; Karremans, S.; Bossi, A.; et al. In-vivo optical properties spectra across five body locations on ten subjects using time-domain diffuse optics. Sci. Data 2026, 13, 261. [CrossRef]
- Sweer, J.A.; Chen, M.T.; Salimian, K.J.; Battafarano, R.J.; Durr, N.J. Wide-field optical property mapping and structured light imaging of the esophagus with spatial frequency domain imaging. J. Biophotonics 2019, 12, e201900005. [CrossRef]
- Bridger, K.G.; Roccabruna, J.R.; Baran, T.M. Optical property recovery with spatially-resolved diffuse reflectance at short source-detector separations using a compact fiber-optic probe. Biomed. Opt. Express 2021, 12, 7388–7404. [CrossRef]
- Kholodtsova, M.N.; Daul, C.; Loschenov, V.B.; Blondel, W.C.P.M. Spatially and spectrally resolved particle swarm optimization for precise optical property estimation using diffuse-reflectance spectroscopy. Opt. Express 2016, 24, 12682–12700. [CrossRef]
- Farina, A.; Torricelli, A.; Bargigia, I.; Spinelli, L.; Cubeddu, R.; Foschum, F.; et al. In-vivo multilaboratory investigation of the optical properties of the human head. Biomed. Opt. Express 2015, 6, 2609–2623. [CrossRef]
- Knighton, N.; Bugbee, B. A mixture of barium sulfate and white paint is a low-cost substitute reflectance standard for Spectralon®. Tech. Instrum. 2005, 11.
- Savelieva, T.A.; Krivetskaya, A.A.; Kustov, D.M.; Klobukov, M.I.; Romanishkin, I.D.; Linkov, K.G.; et al. Application of the Kubelka-Munk model for fast intraoperative analysis of intestinal optical properties using a fiber optic spectrometer. Biomed. Photonics 2025, 14, 30–38. [CrossRef]
- Molenaar, R.; ten Bosch, J.J.; Zijp, J.R.C. Determination of Kubelka-Munk scattering and absorption coefficients by diffuse illumination. Appl. Opt. 1999, 38, 2068–2077.
- Galiakhmetova, D.; et al. Ultra-short laser pulses propagation through mouse head tissues: Experimental and computational study. IEEE J. Sel. Top. Quantum Electron. 2023, 29, 7200311. [CrossRef]
- Prahl, S. Iadpython: A Python module implementation of adding-doubling. Version 0.5.3 [Computer software]. Available online: https://github.com/scottprahl/iadpython (accessed on 23.05.2026). [CrossRef]
- Krivetskaya, A.A.; Savelieva, T.A.; Kustov, D.M.; Levkin, V.V.; Kharnas, S.S.; Loschenov, V.B. Investigation of methods for modeling light propagation in multilayer biological tissues for calculating the absorbed dose of laser radiation. Biomed. Photonics 2026, 15, 19–29. [CrossRef]
- Hohmann, M.; Lengenfelder, B.; Kanawade, R.; Klämpfl, F.; Douplik, A.; Albrecht, H. Measurement of optical properties of pig esophagus by using a modified spectrometer set-up. J. Biophotonics 2017, 11. [CrossRef]
- Bashkatov, A.; Genina, E.; Kochubey, V.; Gavrilova, A.; Kapralov, S.; Grishaev, V.; Tuchin, V. Optical properties of human stomach mucosa in the spectral range from 400 to 2000 nm: Prognosis for gastroenterology. Med. Laser Appl. 2007, 22, 95–104.
- Carvalho, S.; Gueiral, N.; Nogueira, E.; Henrique, R.; Oliveira, L.; Tuchin, V.V. Comparative study of the optical properties of colon mucosa and colon precancerous polyps between 400 and 1000 nm. Proc. SPIE 2017, 10063, 100631L. [CrossRef]
- Pogue, B.; Patterson, M. Review of tissue simulating phantoms for optical spectroscopy, imaging and dosimetry. J. Biomed. Opt. 2006, 11, 041102. [CrossRef]
- Saiko, G.; Zheng, X.; Betlen, A.; Douplik, A. Fabrication and optical characterization of gelatin-based phantoms for tissue oximetry. Adv. Exp. Med. Biol. 2020, 1232, 369–374. [CrossRef]
- Kustov, D.M.; Savelieva, T.A.; Mironov, T.A.; Kharnas, S.S.; Levkin, V.V.; Gorbunov, A.S.; et al. Intraoperative control of hemoglobin oxygen saturation in the intestinal wall during anastomosis surgery. Photonics 2021, 8, 427. [CrossRef]
- Kustov, D.M.; Krivetskaya, A.A.; Savelieva, T.A.; Gorbunov, A.S.; Kashirina, E.P.; Kharnas, S.S.; et al. Optical spectral approach to breast tissue oxygen saturation analysis for mastectomy perioperative control. Photonics 2022, 9, 821. [CrossRef]
- Lisenko, S.A.; Kugeiko, M.M. Method for estimating optimal spectral and energy parameters of laser irradiation in photodynamic therapy of biological tissue. Quantum Electron. 2015, 45, 358–365. [CrossRef]
- Li, H.; Shen, J.; Zheng, C.; Zhu, P.; Yang, H.; Huang, Y.; et al. Cell death: The underlying mechanisms of photodynamic therapy for skin diseases. Interdiscip. Med. 2025, 3, e20240057. [CrossRef]
- Alekseeva, P.M.; Makarov, V.I.; Efendiev, K.; Shiryaev, A.; Reshetov, I.; Loschenov, V. Devices and methods for dosimetry of personalized photodynamic therapy of tumors: A review on recent trends. Cancers 2024, 16, 2484. [CrossRef]
Figure 1.
The scheme of the spectroscopic set up. The equipment includes: 1 - a source of broadband radiation, 2 - source of continuous laser radiation, 3 - a Y-shaped optical probe, 4 - a fiber-optic diffuser, 5 - a Foley catheter, 6 - the tissue under study (the wall of the hollow organ of the gastrointestinal tract), 7 - the LESA-01-BIOSPEC spectrometer, 8 - PC with the "UnoMomento" program. The dotted line highlights the area related to the patient's gastrointestinal tract.
Figure 1.
The scheme of the spectroscopic set up. The equipment includes: 1 - a source of broadband radiation, 2 - source of continuous laser radiation, 3 - a Y-shaped optical probe, 4 - a fiber-optic diffuser, 5 - a Foley catheter, 6 - the tissue under study (the wall of the hollow organ of the gastrointestinal tract), 7 - the LESA-01-BIOSPEC spectrometer, 8 - PC with the "UnoMomento" program. The dotted line highlights the area related to the patient's gastrointestinal tract.
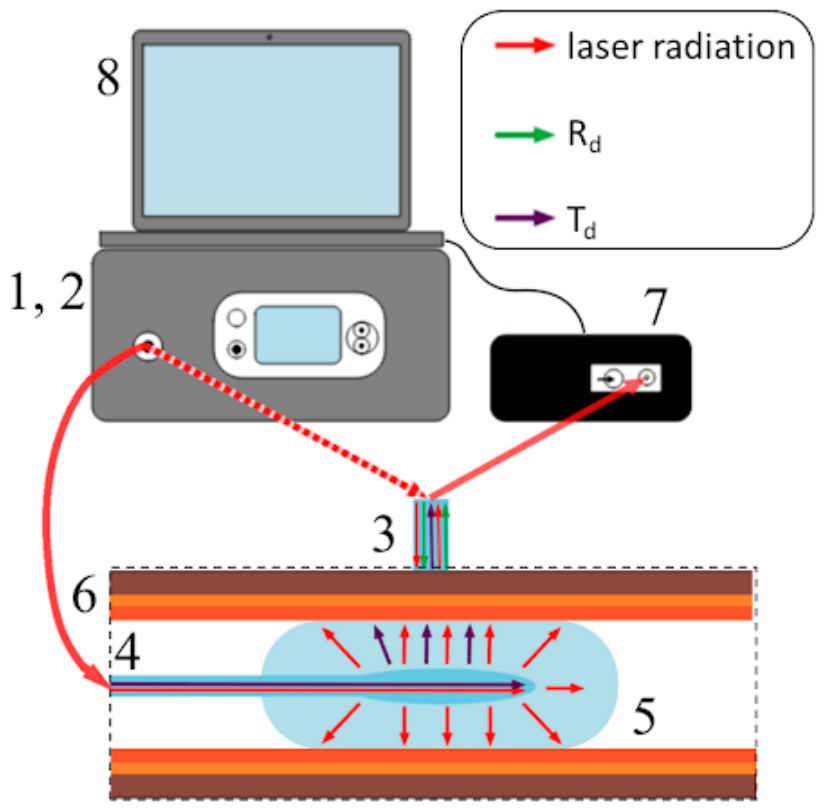
Figure 2.
Scheme of the restoration of optical properties by the inverse adding-doubling method.
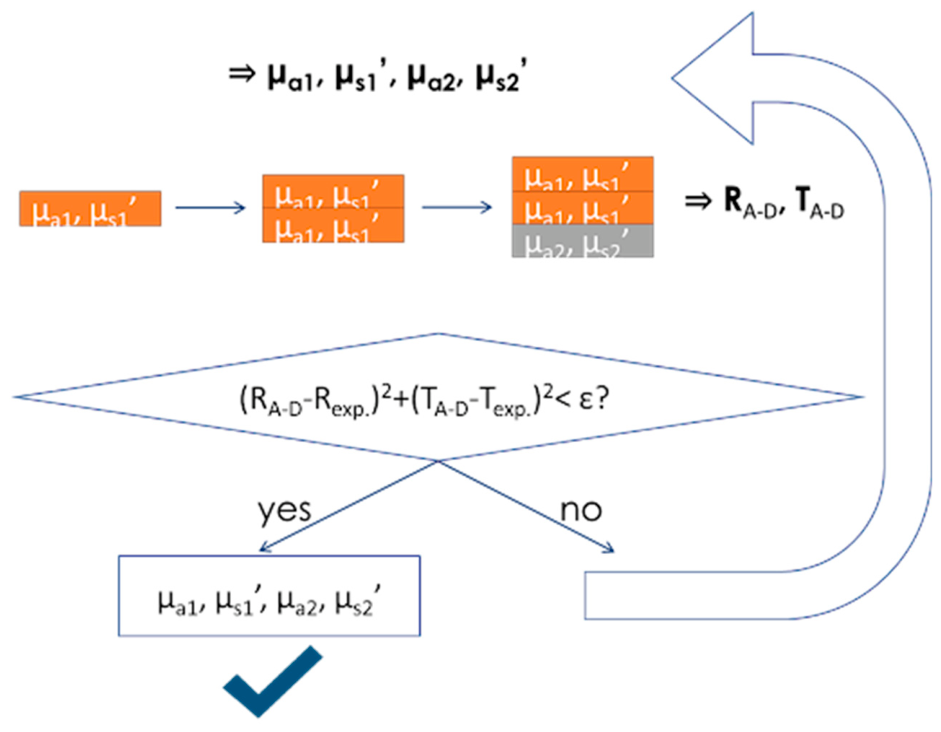
Figure 3.
Comparison of experimental diffuse reflection and transmission data recorded using an integrating sphere and optical fibers for phantoms with different concentrations of blood and Intralipid: (a) 1% blood 1% IL; (b) 1% blood 5% IL; (c) 5% blood 1% IL; (d) 5% blood 5% IL.
Figure 3.
Comparison of experimental diffuse reflection and transmission data recorded using an integrating sphere and optical fibers for phantoms with different concentrations of blood and Intralipid: (a) 1% blood 1% IL; (b) 1% blood 5% IL; (c) 5% blood 1% IL; (d) 5% blood 5% IL.
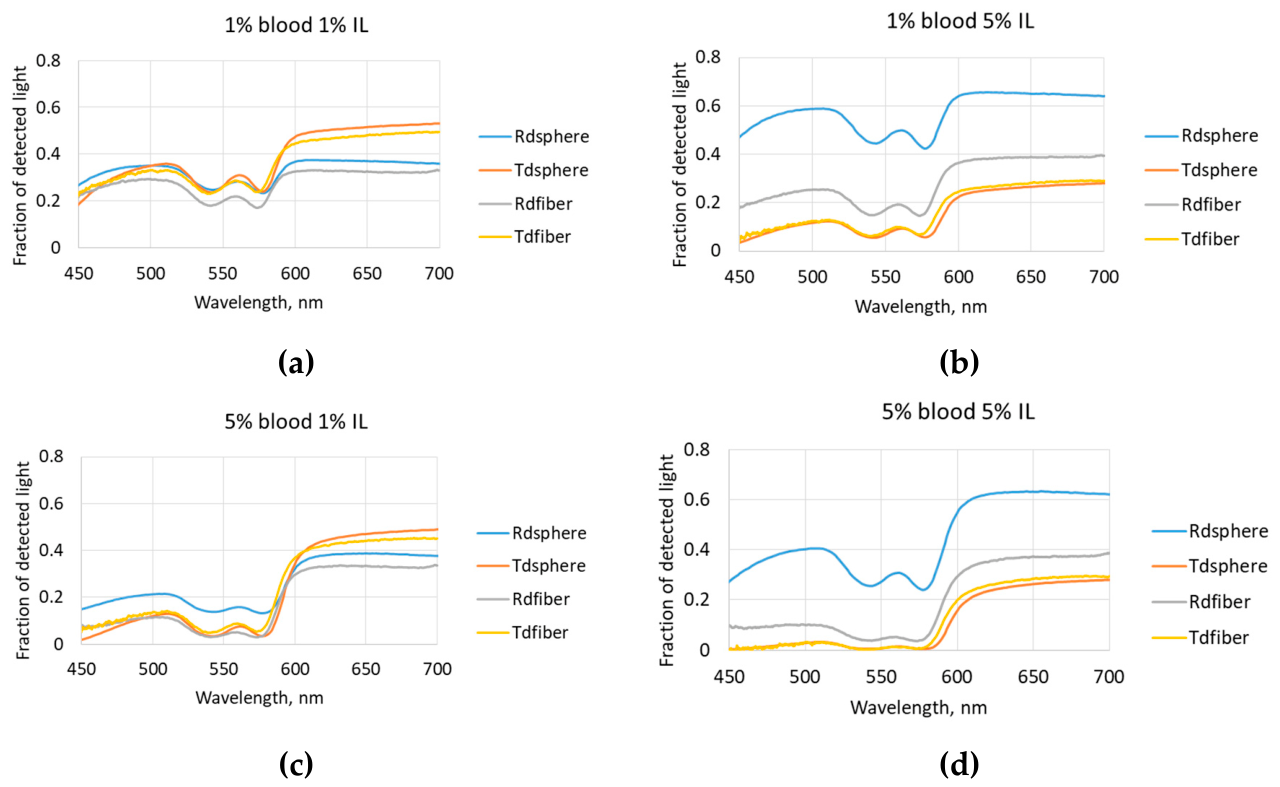
Figure 4.
Graph of the dependence of the adjustment coefficient when translating measurements with optical fibers to measurements with integrating sphere on the amount of diffuse reflection at a wavelength of 635 nm obtained when measuring with optical fibers.
Figure 4.
Graph of the dependence of the adjustment coefficient when translating measurements with optical fibers to measurements with integrating sphere on the amount of diffuse reflection at a wavelength of 635 nm obtained when measuring with optical fibers.
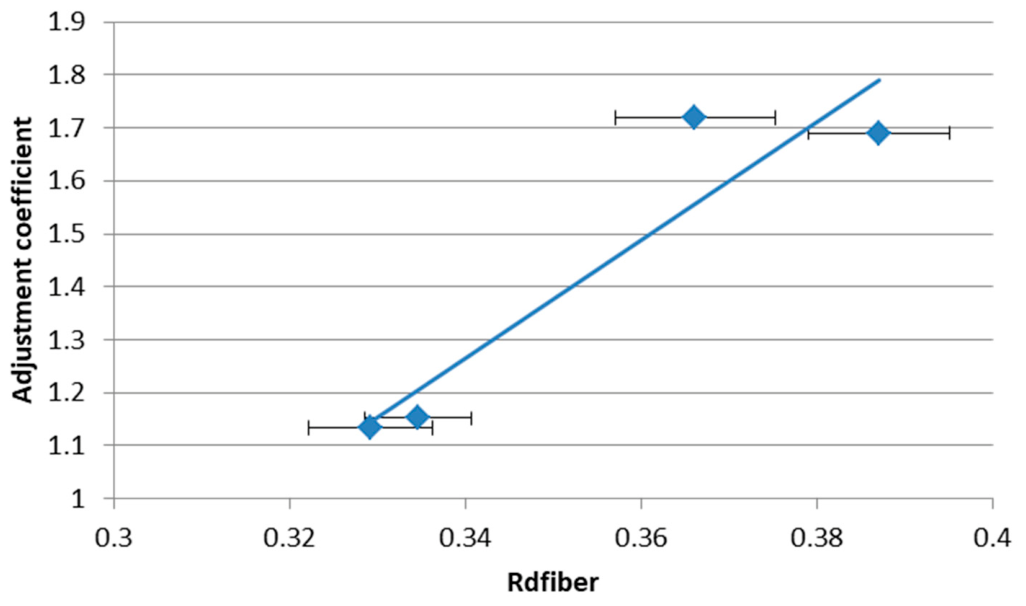
Figure 5.
Comparison of the results of optical properties restoration for a sphere and an optical fiber at a wavelength of 532 nm: (a) Absorption coefficient; (b) Scattering coefficient; (c) Anisotropy factor; (d) Thickness.
Figure 5.
Comparison of the results of optical properties restoration for a sphere and an optical fiber at a wavelength of 532 nm: (a) Absorption coefficient; (b) Scattering coefficient; (c) Anisotropy factor; (d) Thickness.
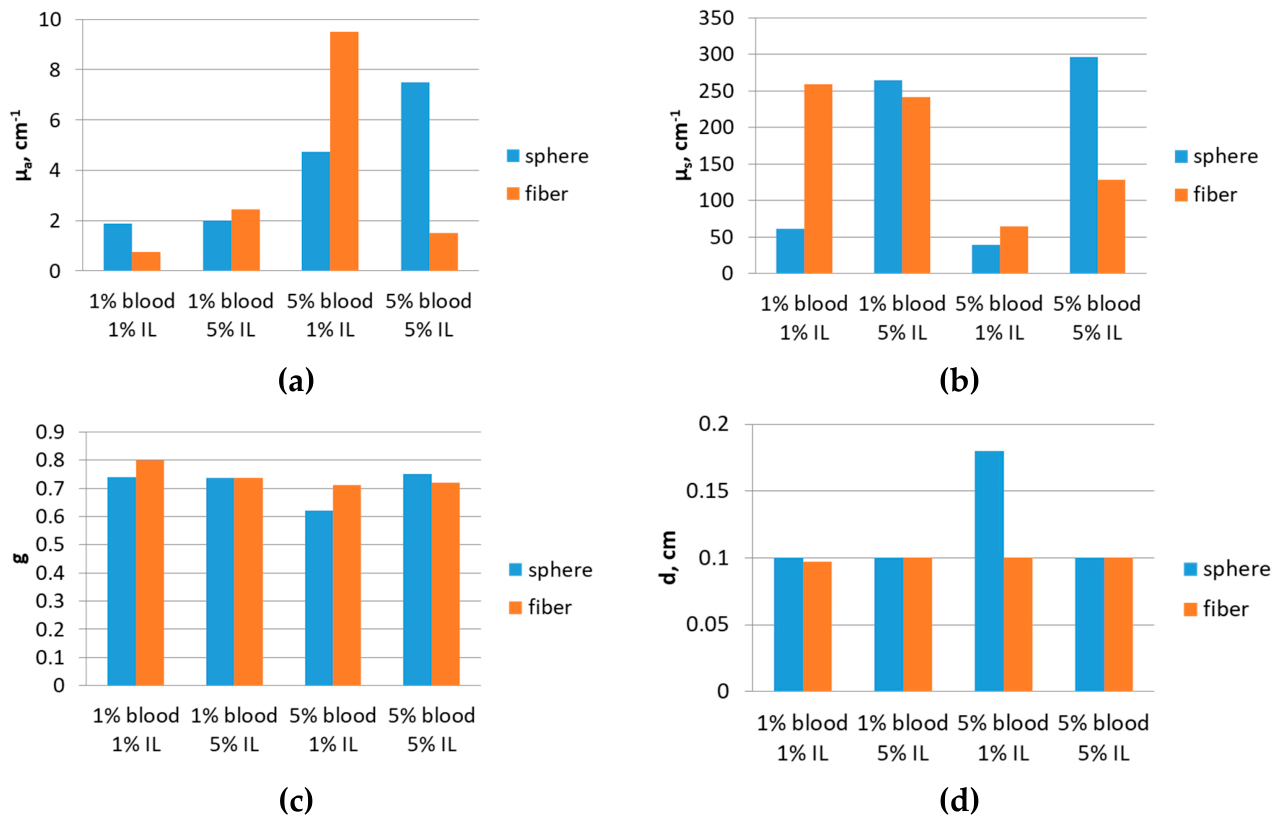
Figure 6.
Comparison of the results of optical properties restoration for the integrating sphere and the optical fibers at a wavelength of 635 nm: (a) Absorption coefficient; (b) Scattering coefficient; (c) Anisotropy factor; (d) Thickness.
Figure 6.
Comparison of the results of optical properties restoration for the integrating sphere and the optical fibers at a wavelength of 635 nm: (a) Absorption coefficient; (b) Scattering coefficient; (c) Anisotropy factor; (d) Thickness.
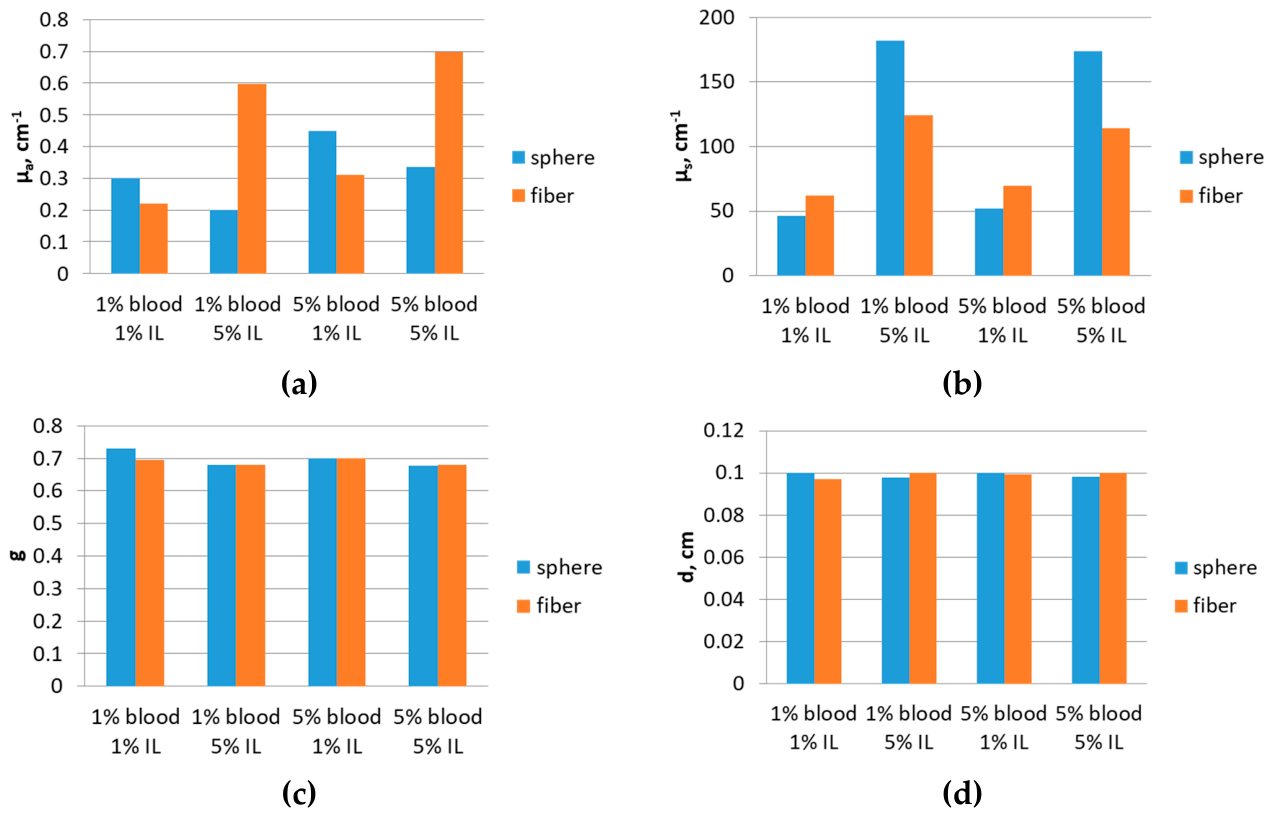
Figure 7.
Comparison of the results of optical properties restoration for the integrating sphere and the optical fibers at an IL concentration of 1%: (a) Absorption coefficient; (b) Scattering coefficient; (c) Anisotropy factor; (d) Thickness.
Figure 7.
Comparison of the results of optical properties restoration for the integrating sphere and the optical fibers at an IL concentration of 1%: (a) Absorption coefficient; (b) Scattering coefficient; (c) Anisotropy factor; (d) Thickness.
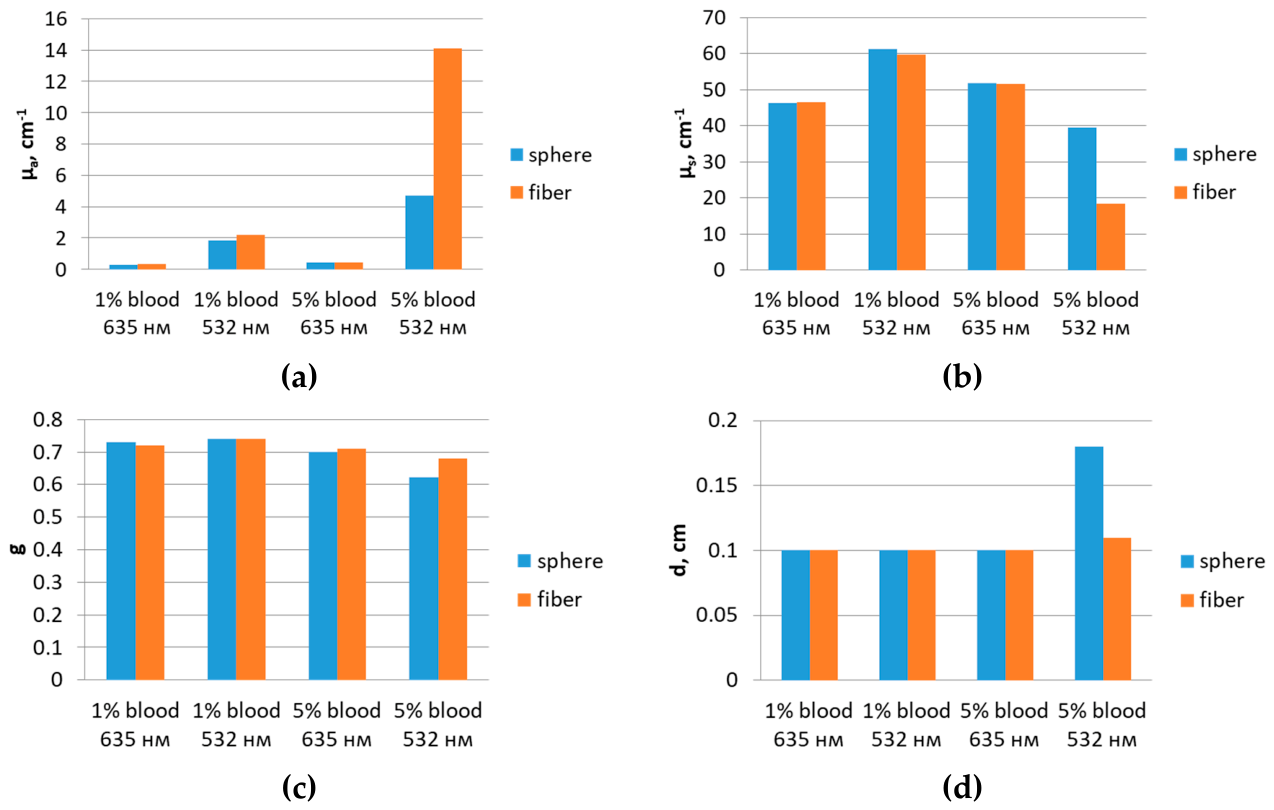
Figure 8.
Comparison of the results of optical properties restoration for the integrating sphere and the optical fibers at an IL concentration of 5%: (a) Absorption coefficient; (b) Scattering coefficient; (c) Anisotropy factor; (d) Thickness.
Figure 8.
Comparison of the results of optical properties restoration for the integrating sphere and the optical fibers at an IL concentration of 5%: (a) Absorption coefficient; (b) Scattering coefficient; (c) Anisotropy factor; (d) Thickness.
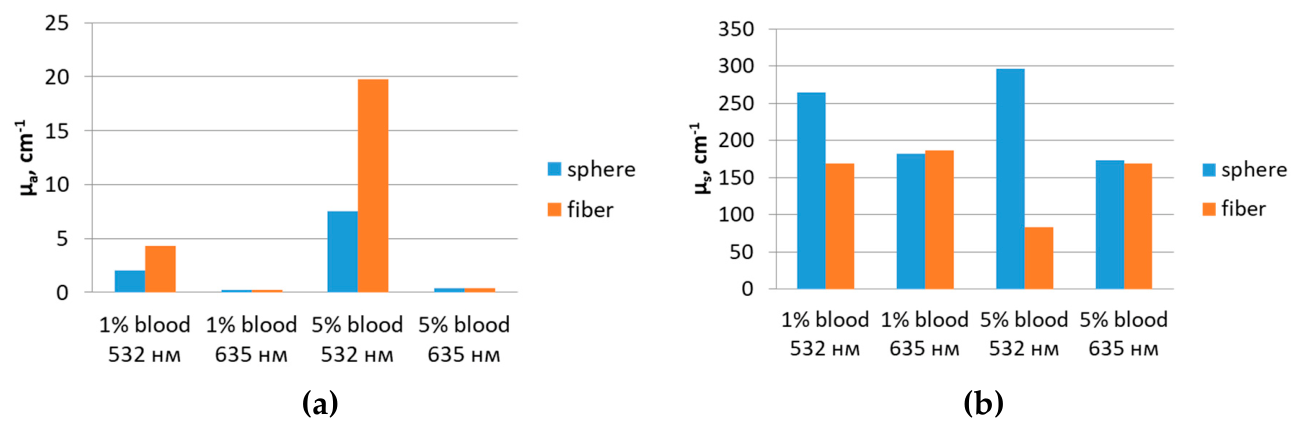
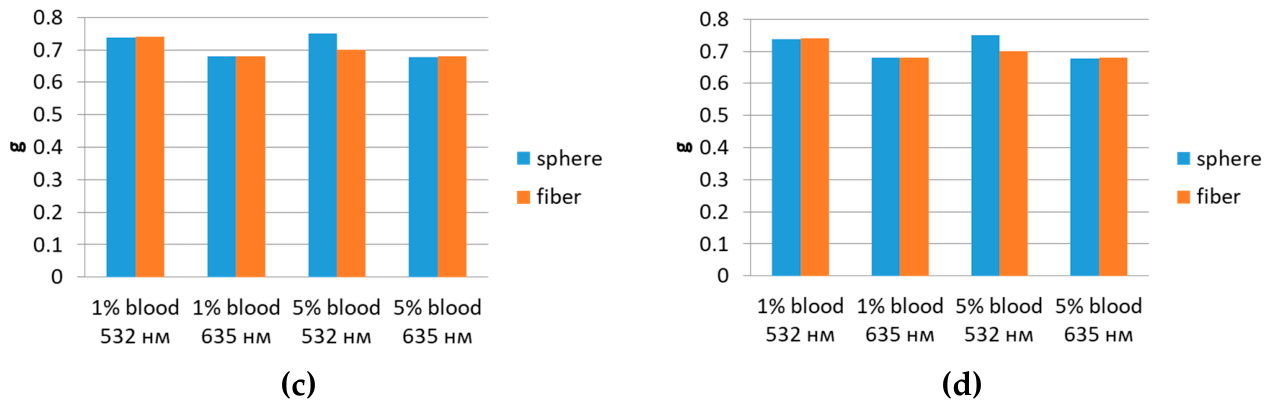
Figure 9.
Restored optical properties of a sample of resected gastric tissues: (a) Absorption coefficient; (b) Scattering coefficient; (c) Anisotropy factor; (d) Thickness.
Figure 9.
Restored optical properties of a sample of resected gastric tissues: (a) Absorption coefficient; (b) Scattering coefficient; (c) Anisotropy factor; (d) Thickness.
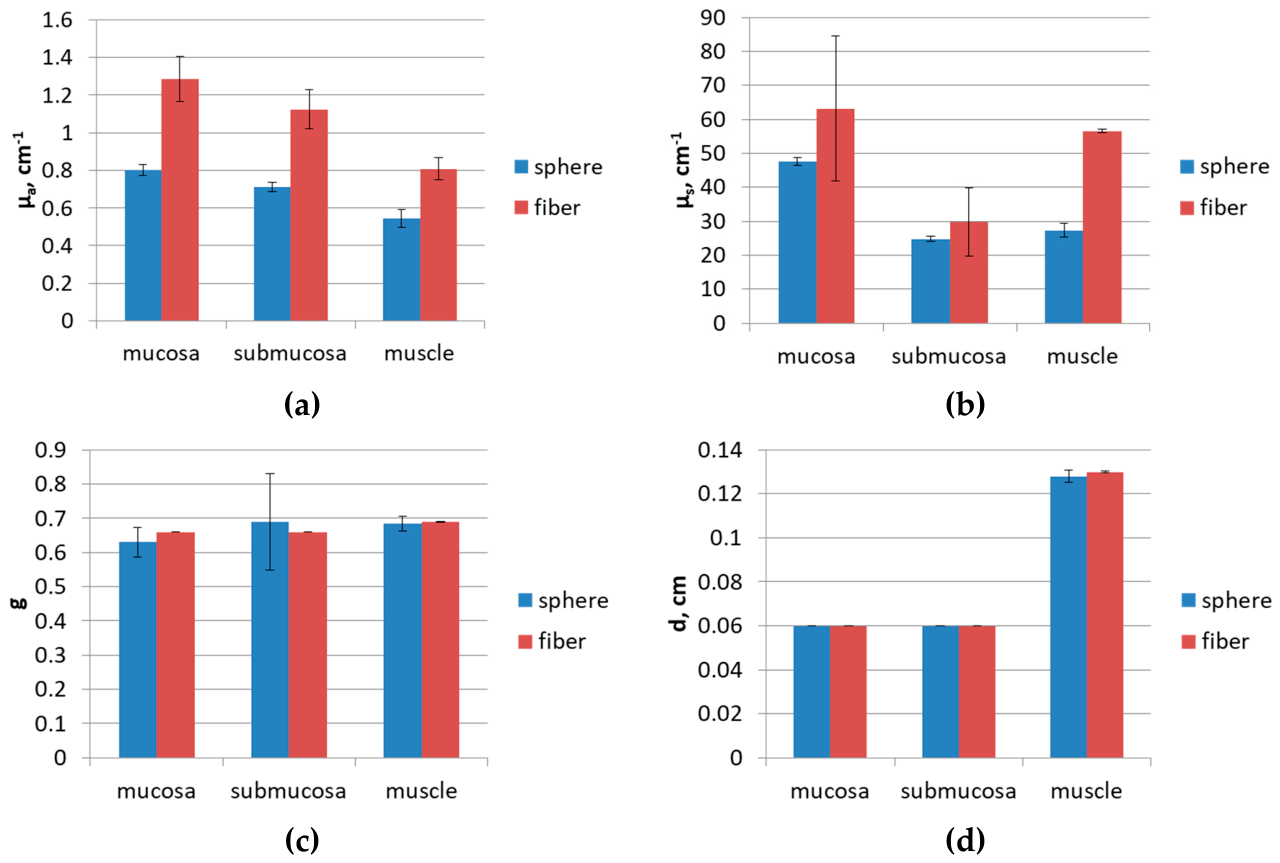

Table 1.
Optical parameters of optical phantoms for setting the initial conditions during their restoration.
Table 1.
Optical parameters of optical phantoms for setting the initial conditions during their restoration.
| Phantom | 532 nm μa; μs, cm-1 |
635 nm μa; μs, cm-1 |
|---|---|---|
| 1% blood 1% IL | 2.3; 56.6 | 0.1; 37.1 |
| 1% blood 5% IL | 2.3; 283.1 | 0.1; 185.2 |
| 5% blood 1% IL | 11.6; 56.6 | 0.3; 37.1 |
| 5% blood 5% IL | 11.6; 283.1 | 0.3; 185.2 |
Table 2.
Optical parameters of a three-layer model of normal intestinal wall tissues for setting the initial conditions during their restoration.
Table 2.
Optical parameters of a three-layer model of normal intestinal wall tissues for setting the initial conditions during their restoration.
| Layers | di, mm | cm-1 | 532 nm | 635 nm |
|---|---|---|---|---|
| mucosa | 0.4 | μa | 2.78 | 0.80 |
| μs | 204.52 | 197.60 | ||
| g | 0.88 | 0.90 | ||
| n | 1.38 | 1.38 | ||
| submucosa | 0.4 | μa | 1 | 0.7 |
| μs | 99 | 93 | ||
| g | 0.96 | 0.96 | ||
| n | 1.36 | 1.36 | ||
| muscle | 2 | μa | 1.53 | 0.1 |
| μs | 193 | 203 | ||
| g | 0.941 | 0.945 | ||
| n | 1.36 | 1.36 |
Table 3.
Coefficients for determining the layer-by-layer initial values of optical properties according to OP generalized over the entire thickness of the sample determined by modified dependencies of the KM model for wavelengths of 532 and 635 nm.
Table 3.
Coefficients for determining the layer-by-layer initial values of optical properties according to OP generalized over the entire thickness of the sample determined by modified dependencies of the KM model for wavelengths of 532 and 635 nm.
| Layers | di, mm | cm-1 | 532 nm | 635 nm |
|---|---|---|---|---|
| mucosa | 0.4 | μa1/μaKMmod. | 1.70 | 2.80 |
| μs'1/μs’KMmod. | 2.01 | 1.74 | ||
| submucosa | 0.4 | μa2/μaKMmod. | 0.61 | 2.45 |
| μs'2/μs’KMmod. | 0.32 | 0.33 | ||
| muscle | 2 | μa3/μaKMmod. | 0.94 | 0.35 |
| μs'3/μs’KMmod. | 0.93 | 0.99 |
Table 4.
Evaluation of the accuracy of restoration of optical properties by the proposed methods from results of the measurements using the integrating sphere.
Table 4.
Evaluation of the accuracy of restoration of optical properties by the proposed methods from results of the measurements using the integrating sphere.
| Phantom | 1% blood 1% IL | 1% blood 5% IL | 5% blood 1% IL | 5% blood 5% IL | Average |
|---|---|---|---|---|---|
| IADinit. | 70% | 69% | 96% | 88% | 81±13% |
| KMlit. | 75% | 70% | 85% | 80% | 77±6% |
| KMmod. | 80% | 89% | 89% | 91% | 87±5% |
| KMmod.+IAD | 79% | 91% | 90% | 90% | 88±6% |
Table 5.
The correspondence between the optical properties obtained by various approaches to setting initial values and the literary values of optical properties for numerical model of a three-layered intestinal wall.
Table 5.
The correspondence between the optical properties obtained by various approaches to setting initial values and the literary values of optical properties for numerical model of a three-layered intestinal wall.
| 532 nm | 635 nm | General | |
|---|---|---|---|
| IADinit. | 97±5% | 94±8% | 95±7% |
| KMmod.+IAD | 90±20% | 87±16% | 88±18% |
Disclaimer/Publisher’s Note: The statements, opinions and data contained in all publications are solely those of the individual author(s) and contributor(s) and not of MDPI and/or the editor(s). MDPI and/or the editor(s) disclaim responsibility for any injury to people or property resulting from any ideas, methods, instructions or products referred to in the content. |
© 2026 by the authors. Licensee MDPI, Basel, Switzerland. This article is an open access article distributed under the terms and conditions of the Creative Commons Attribution (CC BY) license (http://creativecommons.org/licenses/by/4.0/).
Copyright: This open access article is published under a Creative Commons CC BY 4.0 license, which permit the free download, distribution, and reuse, provided that the author and preprint are cited in any reuse.