

Submitted:
25 May 2026
Posted:
26 May 2026
You are already at the latest version
Abstract
Sustainable transportation systems can remain operational while becoming functionally vulnerable when access to them deteriorates. We distinguish two dimensions of transport resilience—operational resilience, the continued running of the main transport services, and functional accessibility resilience, users’ capacity to reach them—and locate weather-induced vulnerability in the latter. We focus on weather-induced last-mile vulnerability and examine how adverse weather alters mode choice. Drawing on a discrete choice experiment with 760 respondents in Portland, we estimate a mixed logit model capturing the effects of rain. The results reveal that rain significantly increases the disutility of travel time, intensifies the burden of last-mile walking, and strongly discourages bicycle use. In contrast, no statistically significant additional average disutility is found for transit itself. Marginal willingness to pay for travel time reduction increases from $1.53 per minute in sunny weather to $2.54 in rainy weather, while the average predicted probability of choosing car rises from 34.9% to 54.4%. These findings suggest that weather sensitivity is driven less by main transit services than by the surrounding access conditions and active travel links. The study contributes to transportation resilience research by showing that strengthening last-mile access under adverse weather is essential for sustaining low-carbon mobility choices.
Keywords:
sustainable transportation
; last-mile vulnerability
; adverse weather
; travel behavior
; mode choice
; transportation resilience
; accessibility
1. Introduction
Achieving sustainable urban transport systems requires increasing the substitutability of car use and encouraging shifts toward low-carbon modes, including public transport [1,2]. However, the usability of these modes is not determined solely by the supply of rail and bus services. Whether people can actually use public transport also depends on first- and last-mile conditions, including walking and cycling access to stations and stops. Therefore, to understand the vulnerability of sustainable transport systems, it is necessary to examine not only the operating conditions of major modes but also the access conditions and waiting environments that connect people to those modes [3,4].
A substantial body of research has already demonstrated the importance of first- and last-mile connections in mode choice. Focusing on the Seoul metropolitan area, Ha et al. [3] showed that public transport use is encouraged when first- and last-mile burdens are shorter and the walking environment is more favorable. De Vos et al. [5] further demonstrated that part of the effect of the residential environment on mode choice operates through travel distance and car ownership. He et al. [6] also reported that travel distance is a key determinant of mode choice and that its effect is nonlinear and threshold-based. These findings indicate that access distance and access environments are important conditions shaping travel behavior. However, the extent to which adverse weather amplifies the burden associated with such access conditions remains insufficiently examined.
The effects of adverse weather on travel behavior have also been widely reported. Review studies have shown that rainfall, high and low temperatures, and strong winds can affect travel behavior and transport demand [4]. Empirical studies provide similar evidence. Wu and Liao [7] found that buses and bikes tend to be avoided during adverse weather in Beijing, whereas the subway and cars become relatively more preferred. Lepage and Morency [8] reported that rainfall reduces demand for bike sharing, the metro, and buses in Montreal, while increasing taxi demand. Ngo and Bashar [9], using data from 48 U.S. cities, showed that extreme heat, extreme cold, and heavy precipitation reduce public transport ridership. Jang et al. [10] further demonstrated that a rainfall-induced shift from public transport to private cars can increase per capita transport-related CO₂ emissions. Together, these studies suggest that adverse weather can trigger a shift away from sustainable transport modes toward car use.
However, although many existing studies show that adverse weather reduces public transport demand, they do not explicitly distinguish whether this effect arises from aversion to public transport services themselves or from the deterioration of access conditions and waiting environments at stations and stops. Wei [11] and Jiang and Cai [12] provide detailed analyses of the relationship between weather and public transport demand, but their primary focus is on estimating the weather–ridership relationship. By contrast, Miao et al. [13] show that bus stop shelters can partially mitigate demand reductions during adverse weather, suggesting the importance of waiting environments. Nevertheless, studies that separate the effects of access conditions from those of the public transport service itself within a single analytical framework remain limited.
In addition, studies evaluating sustainable transport systems tend to focus on the operation and service conditions of major transport modes. Mishra and Singh [14] show that key performance indicators used in public transport performance evaluation have typically been organized around safety, customer satisfaction, traffic, financial, and environmental dimensions. Sogbe et al. [15] also show that the literature on promoting bus transport use has mainly focused on service quality, satisfaction, and attitudes. These studies are important, but they do not directly address first- and last-mile conditions connecting users to major modes from the perspective of vulnerability under adverse weather. Thus, whether the weather-induced vulnerability of sustainable transport systems resides in the main transport service itself or in the access environment surrounding it has rarely been examined directly.
This study evaluates the resilience of sustainable transport systems along two dimensions: operational resilience, the continued provision and functioning of the main transport services such as rail and bus; and functional accessibility resilience, the capacity of users to reach and make use of those services under adverse conditions. Against this background, the study formulates and tests three hypotheses regarding changes in travel behavior under adverse weather. Hypothesis 1 (H1) is that the effects of adverse weather appear more strongly in last-mile access by walking and cycling than in public transport services themselves. Hypothesis 2 (H2) is that, as a result, adverse weather induces a shift from sustainable transport modes toward car use. Hypothesis 3 (H3) is that these effects are not uniform but become stronger as last-mile distance increases.
To examine these hypotheses, a research design is needed that explicitly incorporates weather conditions, the attributes of major transport modes, and last-mile conditions within a single analytical framework, thereby allowing their respective effects to be identified. Existing studies based on observational data are useful for capturing mode choice and demand changes under actual weather conditions. However, in observational data, weather, service conditions, and access conditions vary simultaneously in real-world settings, which limits the ability to rigorously disentangle their effects. In this respect, a discrete choice experiment (DCE) is well suited to systematically manipulate these conditions within hypothetical choice situations and to examine where vulnerability under adverse weather emerges [16].
For such a DCE to function effectively, however, the combinations of transport modes and access conditions presented to respondents must be perceived as realistic alternatives. In other words, the study area must be a city in which public transport, walking, cycling, and cars all function as feasible travel options and where residents can realistically choose among them. Based on this requirement, the present study focuses on Portland, Oregon, USA. In the U.S. context, where cars remain the dominant mode of travel, Portland has sought to develop a sustainable urban transport system by combining public transport, including light rail transit and buses, with policies promoting cycling [17]. It is therefore an appropriate case for examining what kinds of mode shifts occur when last-mile conditions deteriorate under adverse weather.
Based on this problem framing and research design, this study examines the interrelationships among adverse weather, major transport mode attributes, and last-mile conditions using a discrete choice experiment with Portland residents and mixed logit analysis. In particular, by analytically distinguishing the effects on public transport itself from the effects on walking and cycling access conditions, the study clarifies where the vulnerability of sustainable transport systems emerges. Furthermore, by linking weather-induced shifts toward cars to the length of last-mile distance, the study advances the central argument that the weather-induced vulnerability of sustainable transport systems lies less in the supply of the main transport service than in the access environment that surrounds it. By design, first-mile access is held within walking distance, so that the analysis isolates the last-mile (egress) segment. The three hypotheses (H1–H3) set out above are then assessed against the empirical results reported in Section 4.
2. Materials and Methods
2.1. Study Context and Research Design
In the Portland metropolitan area in Oregon, which is the focus of this study, Metro has managed the Urban Growth Boundary to conserve farmland and forestland, promote more efficient land use, curb urban sprawl, and foster a compact regional structure [18,19]. The 2040 Growth Concept also identifies compact development, efficient land use, and a balanced transportation system that supports the movement of people and goods as core principles for regional growth [19]. Similarly, the Portland 2035 Transportation System Plan emphasizes directing growth to the Central City, centers, corridors, and transit station areas, while promoting low-carbon complete communities supported by robust multimodal transportation connections [20]. Portland’s transport policy can therefore be understood not as a set of stand-alone transport measures, but as part of an integrated urban policy framework linked to growth management.
Figure 1.
Study area and multimodal transportation context in the Portland metropolitan area. Base map generated using spatial data (urban growth boundary, bike routes, rivers, rail transit, and county boundaries) sourced from Oregon Metro, TriMet, and the Bureau of Land Management.
Figure 1.
Study area and multimodal transportation context in the Portland metropolitan area. Base map generated using spatial data (urban growth boundary, bike routes, rivers, rail transit, and county boundaries) sourced from Oregon Metro, TriMet, and the Bureau of Land Management.
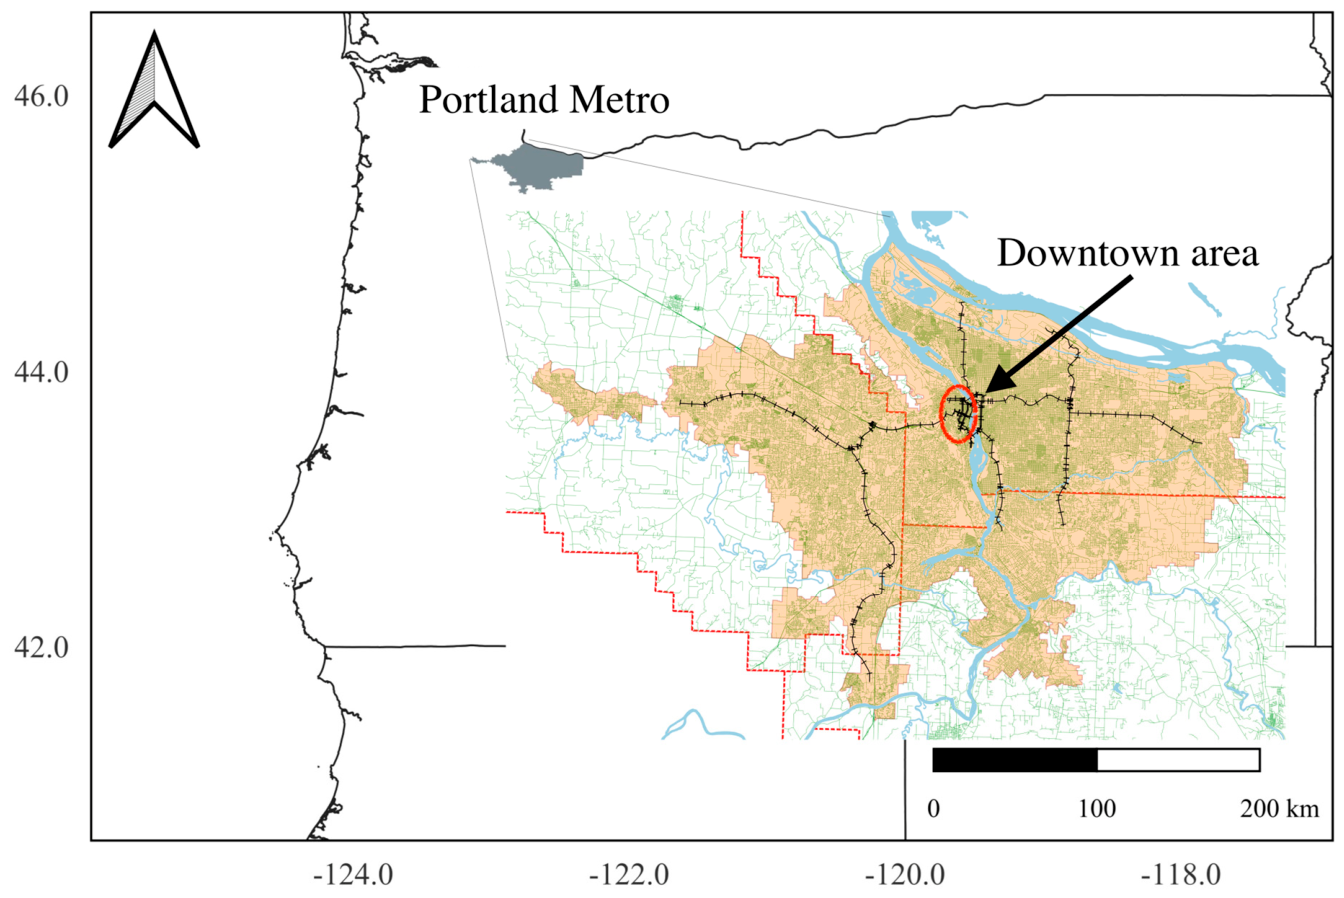
Within this urban structure, TriMet serves as the primary public transport operator in the Portland region, providing bus, light rail, and commuter rail services [21]. In particular, the MAX light rail functions as a backbone network connecting Portland City Center with Beaverton, Clackamas, Gresham, Hillsboro, Milwaukie, North/Northeast Portland, and Portland International Airport [22]. In this respect, non-car modes in Portland are supported both institutionally and operationally, creating relatively favorable conditions for examining choices across multiple transport modes. In addition, a series of studies on transit-oriented development (TOD) in the Portland metropolitan area has continuously examined the travel behavior of TOD residents, with recent evidence indicating that TOD is associated with reductions in car trips [23,24].
In terms of street-space improvements, the Portland Bureau of Transportation (PBOT) has advanced qualitative improvements to protected bike lanes. As of 2024, the city had more than 50 miles of protected bike lanes, and some facilities had been upgraded from plastic delineators to concrete separators and concrete islands [25]. The Rose Lane Project also aims to provide on-street priority for buses and streetcars in congested corridors, thereby supporting faster and more reliable transit service [26]. In addition, Pricing Options for Equitable Mobility (POEM) considers demand management measures, including pricing, within an equitable mobility framework. This indicates that Portland’s urban transport policy is conceived not only in terms of public transport provision and bike infrastructure development, but also as a broader policy package that includes demand management [27].
Nevertheless, even with such institutional and spatial improvements, the use of sustainable transport systems is not necessarily stable under all conditions. Across the United States, public transport demand has not fully recovered to pre-pandemic levels; as of September 2023, ridership remained at approximately 74% of the level recorded in the same month in 2019 [28]. In this sense, Portland can be positioned both as an advanced case of sustainable urban transport policy linked to growth management and as a suitable city for examining the effectiveness and vulnerability of such a system.
2.2. Questionnaire and Discrete Choice Experiment Design
In the discrete choice experiment (DCE) conducted in this study, the alternatives were designed by combining the transport modes that are available in Portland: private car, light rail transit (LRT), bus, and bike. Portland has long emphasized an urban structure based on the concept of the “20-minute neighborhood,” in which residents can meet their daily non-work needs by walking or by bike [29]. In addition, the city’s transport policy positions walking not only as a primary mode for short-distance trips, but also as a means of accessing transit [30,31]. Therefore, to simplify the common scenario and ensure comparability across alternatives, this study assumed that first-mile access was within walking distance. By contrast, because Portland has long promoted bike infrastructure and bike use, the bike was specified as a direct travel mode to the destination [17].
The bike option was further divided into conventional bikes and electric-assist bikes. This distinction reflects the operating conditions of Portland’s bike-share system at the time of the survey, when electric-assist bikes were being introduced alongside conventional bike-share bikes. According to official PBOT records, BIKETOWN introduced an e-bike fleet in September 2020 and subsequently transitioned to a 100% electric-assist system in September 2021 [32,33]. Given that the survey was conducted during this transition period, both conventional and electric-assist bikes were retained as bike options in the analysis.
Based on these considerations, this study specified the following six mode alternatives: (1) private car, (2) LRT and Walking, (3) LRT plus Bike, (4) Bus and Walking, (5) Bus and Bike, and (6) Bike. These alternatives were defined to reflect Portland’s modal composition and intermodal connectivity. Combinations that were unlikely in the context of this study, such as bus plus private car, were excluded. The basic structure of the alternatives draws on previous labeled stated choice studies that explicitly represent access, line-haul, and egress components, while the specific alternative configuration was adjusted to fit the study area and research objectives [34].
Figure 2.
Common scenario and transport alternatives in the discrete choice experiment. This diagram explains the characteristics of the six alternative transportation modes included in each scenario. Icons sourced from Icons8 (https://icons8.com/).
Figure 2.
Common scenario and transport alternatives in the discrete choice experiment. This diagram explains the characteristics of the six alternative transportation modes included in each scenario. Icons sourced from Icons8 (https://icons8.com/).
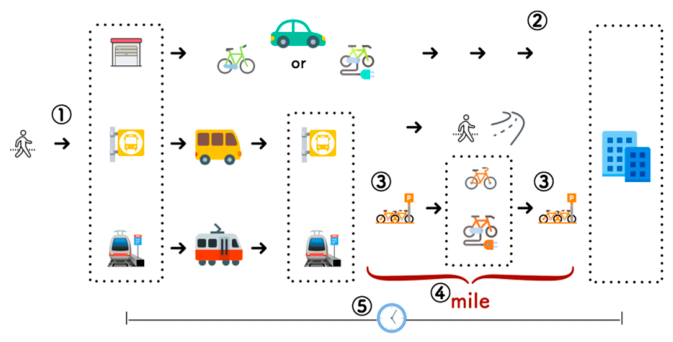
In the DCE, respondents were presented with a common travel situation before answering the choice tasks so that they could compare each mode under the same conditions. Specifically, they were asked to imagine a routine commute to a workplace or educational institution located in central Portland. The following five conditions were common to all respondents.
- (1)
- The bus stop and LRT station were assumed to be located near the respondent’s home, and neither required a substantial access time.
- (2)
- When using a private car or bike, respondents were assumed to be able to travel directly to the destination.
- (3)
- The experiment assumed that shared bikes were available at the bus stop, LRT station, and destination.
- (4)
- For the bus and LRT alternatives, the last-mile distance from the alighting point to the destination was assumed to be identical.
- (5)
- Travel time represented the total door-to-door travel time from departure at home to arrival at the destination.
These assumptions were intended to make the differences between major transport modes and last-mile conditions as explicit and comparable as possible.
The attribute and level structure was designed based on stated choice studies that integrate access, line-haul travel, and egress from the alighting point to the destination [34]. The attributes and levels used in the DCE are summarized in Table 1. The private car alternative served as the reference case. One-way travel time was set at 20, 30, or 40 minutes, while the cost, including fuel and parking charges, was set at USD 11, 13, or 15. For all other alternatives, travel time, cost, and CO₂ emissions were presented as relative deviations from the private car alternative. Travel time was defined as the total door-to-door time from home departure to arrival at the destination, including the effe such as traffic congestion, accidents, roadworks, and service delays. Weather conditions were presented separately as sunny and rainy scenarios. CO₂ emissions were also included as an attribute, with emissions for the private car alternative set at 2.5, 4.0, or 4.5 kg. For the bike options, the experiment distinguished not only between conventional and electric-assist bikes, but also between personal bikes and shared bikes. This specification reflects the situation in Portland at the time of the survey, when electric-assist bikes were being introduced alongside conventional bike-share services.
This study began with the theoretical full combination of attribute levels and generated an initial set of candidate profiles using an orthogonal fractional factorial design. Choice tasks consisting of six alternatives were then constructed, and tasks containing unrealistic combinations were removed. In the final design, 14 choice tasks were used in the experiment. Thus, the questionnaire should not be understood as a fully mechanical orthogonal design. Rather, it is a DCE that used an orthogonal fractional factorial design as a starting point and was then adjusted by considering design efficiency, realism, and respondent feasibility. Recent discussions of DCE design also emphasize the importance of managing respondent burden by avoiding dominant alternatives and excessively complex tasks, in addition to improving the statistical efficiency of choice sets [35,36,37].
Each respondent was randomly assigned four tasks under sunny conditions and another four tasks under rainy conditions from the set of 14 tasks, resulting in a total of eight choice tasks per respondent. The order of both the choice tasks and the alternatives was randomized to reduce ordering effects. This design was adopted to secure a sufficient number of observations for comparing weather conditions while limiting the response burden placed on each respondent. In stated choice surveys, an increase in the number of tasks does not necessarily lead to a linear decline in data quality. However, task complexity and the number of choice tasks are known to affect response consistency and cognitive burden. For this reason, this study limited each respondent to eight tasks in order to balance comparability and respondent feasibility [36,37,38].
An example of a choice task is shown in Figure 3. For instance, if “bus plus walking” was selected, this indicated that the respondent would use the bus to reach an area near the destination and then complete the specified last-mile segment on foot. Because cost and CO₂ emissions were presented as relative increases or decreases compared with the private car alternative, respondents were able to compare trade-offs among time, cost, environmental burden, and last-mile conditions on the same screen. This design reflects the central concern of this study: to understand changes in travel behavior under adverse weather not simply in terms of major transport modes alone, but as combinations of major modes and last-mile connections.
The response results showed no evidence of substantial confusion among respondents, and the open-ended comments did not include negative remarks about the experimental design. During data cleaning, no response patterns were identified that suggested serious problems in understanding the choice tasks. Based on these checks, the choice experiment was judged to be a valid design for comparing behavioral changes across weather conditions while maintaining realistic assumptions about transport choices in Portland.
2.3. Econometric Model and Additional Analyses
Because each respondent answered multiple choice tasks, and because preferences for travel conditions and transport modes may vary across individuals, this study applied a mixed logit model within the framework of random utility maximization (RUM) [39,40,41]. The utility that respondent n derives from alternative j in choice task t is expressed as follows:
where denotes the cost associated with each alternative, is a vector of non-monetary attributes, is the cost coefficient, is an individual-specific vector of preference coefficients, and is the error term. The error term was assumed to follow an independently and identically distributed Type I extreme value distribution. In the mixed logit model, is assumed to be a random parameter following a specified distribution, which allows the model to explicitly capture preference heterogeneity in responses to travel time, last-mile distance, transport mode, and adverse weather [39,40].
The utility function included cost, total travel time, walking last-mile distance, bike access distance, and transport mode dummies for LRT, bus, and bike, with private car specified as the reference alternative. Although CO₂ emissions and bicycle-type attributes were presented in the choice tasks, preliminary models showed that they were not statistically significant and did not substantively affect the main coefficients. Therefore, CO₂ emissions were excluded, and bicycle-type attributes were represented by a single bike dummy in the final model. Alternatives involving walking access were assigned a walking last-mile distance, whereas alternatives involving bike access were assigned a bike access distance; for other alternatives, these variables were set to zero.
To identify the effects of adverse weather, interaction terms were introduced to represent the additional burden under rainy conditions. These included interactions between rain and total travel time, transit, bike, and walking last-mile distance. Here, transit is a dummy variable combining LRT and bus and was used to capture the additional change in utility associated with public transport use under rainy conditions. The rain dummy itself could not be identified independently because weather conditions were common to all alternatives within each choice task; therefore, rain was included only through interactions with alternative-specific attributes.
In the coefficient specification, the cost coefficient was treated as fixed, while the main non-monetary attribute coefficients were treated as random. Specifically, total travel time, walking last-mile distance, bike access distance, the LRT, bus, and bike dummies, and the rain interaction terms—rain_time, rain_transit, rain_bike, and rain_dist_walk—were estimated as random coefficients. This specification allowed the disutility of travel time, sensitivity to last-mile distance, baseline utility for each transport mode, and additional burden under rainy conditions to vary across individuals. The cost coefficient was fixed to ensure the sign and stability of the denominator in the calculation of marginal willingness to pay and to obtain economically interpretable estimates [40].
The unconditional probability that respondent n chooses alternative i in choice task t is expressed as the logit probability integrated over the distribution of random coefficients:
where is the deterministic component of utility, and is the density function of the random coefficients defined by the mean and variance parameters . The model was estimated by maximum simulated likelihood using 500 Halton draws [41].
After estimation, marginal willingness to pay (MWTP) was calculated for each attribute using the cost coefficient as the reference. At the aggregate level, the nlcom command was used to estimate MWTP for total travel time, walking last-mile distance, bike access distance, transport mode dummies, and additional burdens under rainy conditions, and to compare preference differences between sunny and rainy conditions. In addition, individual-specific posterior parameters were estimated using the mixlbeta command, and individual-level MWTP values were calculated. This enabled the analysis to examine not only average preference structures, but also the extent to which additional burdens under adverse weather and stronger car orientation varied across individuals. All analyses were conducted using Stata 19.
2.4. Survey Administration and Sample Characteristics
The survey was conducted online in March 2021 using the Qualtrics platform in collaboration with the panel provider Symmetric. Eligibility was limited to adult residents of the Portland metropolitan area. Residence in Multnomah County, Washington County, or Clackamas County was verified through ZIP-code screening. Because of budgetary and operational constraints, quota sampling was not applied; however, the geographic boundary of the study area was strictly enforced. Respondents were informed in advance that the survey would take approximately 15 minutes and that participation would be anonymous. Because the survey was fielded in March 2021, data collection took place during the COVID-19 pandemic. Pandemic-era conditions may have lowered baseline preferences for shared and public transport modes; however, because the experiment uses a within-respondent design that contrasts sunny and rainy choice tasks, any such time-invariant, weather-independent shift is absorbed by the alternative-specific constants and is less likely to bias the estimated weather effects, which are the focus of this study. The implications of the survey timing are discussed further in Section 5.3.
A total of 952 responses were collected. To ensure data reliability, the following quality control procedures were applied: (1) completion of all choice tasks and demographic items, (2) checks for internal consistency and exclusion of contradictory responses, and (3) identification of protest responses. Protest respondents were identified using objective criteria established in the stated preference literature and applied uniformly to all respondents. Specifically, respondents were classified as protest or non-trading respondents when they did not exhibit meaningful trade-offs across the choice tasks—for example, by selecting the same alternative regardless of the attribute levels presented (non-trading or lexicographic response patterns). Such responses are widely treated as invalid in stated preference research because they are not consistent with the behavioral assumptions of the random utility framework. Following recommended practice in stated preference research, these protest responses were excluded from the analytical sample [40,42]. After applying these criteria, 760 valid responses remained for analysis.
Because the survey did not employ demographic quotas, representativeness was assessed by comparing the final sample with the 2021 American Community Survey (ACS) [43]. The results are shown in Table 2.
Sample representativeness was assessed by comparing the sample composition with the population composition for each attribute. Compared with the population, the sample overrepresented residents of Multnomah County (48.6% vs. 44.0%), women (61.6% vs. 50.6%), individuals aged 18–34 years (36.7% vs. 28.9%), and respondents with a bachelor’s degree or higher (49.1% vs. 39.1%). By contrast, residents of Clackamas County (20.4% vs. 23.1%), individuals aged 65 years or older (16.6% vs. 20.0%), respondents with a high school education or less (13.8% vs. 28.8%), homeowners (51.7% vs. 62.0%), residents of detached single-family houses (55.1% vs. 67.1%), and high-income households, particularly those with annual household incomes of USD 100,000 or more (22.9% vs. 41.7%), were underrepresented.
Correspondingly, renters (42.4% vs. 38.0%), residents of housing types other than detached single-family houses (43.9% vs. 32.9%), and households with annual incomes below USD 50,000 (38.8% vs. 28.8%) were more prevalent in the sample than in the population. Overall, the sample is skewed toward women, younger adults, highly educated individuals, residents of non-detached housing, and low- to middle-income households, while older adults, less-educated individuals, homeowners, residents of detached single-family houses, and high-income households are insufficiently represented. However, these deviations, particularly the overrepresentation of women, younger adults, and highly educated respondents, are consistent with patterns often observed in online surveys [44,45,46].
3. Results
3.1. Weather and Last-Mile Effects in the Mixed Logit Model
The mixed logit estimates indicate that mode choice was strongly shaped not only by the attributes of the main transport modes themselves, but also by last-mile conditions and weather conditions. The estimation used 34,956 observations obtained from 760 respondents. This total is slightly below the nominal maximum implied by eight choice tasks per respondent because a small number of respondents did not complete all of their assigned tasks; only completed choice tasks were retained for estimation. The results are presented in Table 3.
First, the mean coefficients show that Time, which represents travel time; dist_walk, which represents walking last-mile distance; and dist_acc_bike, which represents bike access distance, were all significantly negative. This indicates that the utility of an alternative decreases as travel time increases and as access distance becomes longer. Among the mode-specific constants, the coefficients for Bus and Bike were significantly negative, with the negative coefficient for Bike being particularly large. By contrast, although the coefficient for LRT was negative, it was not statistically significant at the 5% level.
Second, the interaction terms capturing the additional effects of rainy conditions show that rain_time, the interaction between travel time and rain; rain_Bike, the interaction between the bike alternative and rain; and rain_dist_walk, the interaction between walking last-mile distance and rain, were all significantly negative. These results indicate that, under rainy conditions, the disutility of travel time increases, the burden of walking last-mile travel becomes greater, and the likelihood of choosing the bike alternative is further reduced. In contrast, rain_Transit, the interaction between public transport use and rain, was not statistically significant. This suggests that rain did not have an additional average effect on public transport use itself.
The estimated standard deviations show that those for Time, dist_walk, dist_acc_bike, LRT, Bus, Bike, rain_Transit, rain_Bike, and rain_dist_walk were all statistically significant. By contrast, the standard deviation of rain_time was not significant. In a mixed logit model, a significant standard deviation for a random coefficient indicates that the magnitude of the coefficient varies across respondents. Thus, the results confirm substantial inter-individual heterogeneity not only in responses to travel time, last-mile distance, and mode-specific constants, but also in the effects of rain on public transport, bike use, and walking last-mile distance. The sign of a standard deviation parameter itself has no substantive interpretation and should be interpreted in terms of its absolute magnitude.
3.2. Monetary Valuation of Weather and Last-Mile Effects Using Marginal Willingness-to-Pay
This section presents the results in which the effects of each attribute were converted into marginal willingness to pay (MWTP) using the cost coefficient as the reference. MWTP is a monetary measure of the effect of changes in each attribute. In this study, it primarily represents the magnitude of disutility associated with increases in travel time and last-mile distance, as well as with the selection of specific modes. Accordingly, negative values indicate disutility, and larger absolute values indicate a greater burden. Aggregate-level MWTP values were calculated using nlcom, while individual-level MWTP values were computed from respondent-specific coefficients obtained using mixlbeta. The aggregate-level MWTP estimates are presented in Table 4.
For travel time, three measures were calculated: the effect under sunny conditions (VOT_sunny), the additional effect under rainy conditions (VOT_rain_add), and the total effect under rainy conditions obtained by summing the two components (VOT_rainy). Similarly, the effects of walking last-mile distance were decomposed into Walk_sunny, Walk_rain_add, and Walk_rainy, while those for the bike alternative were decomposed into Bike_sunny, Bike_rain_add, and Bike_rainy. For public transport, the MWTP values for the LRT and Bus alternative-specific constants and the additional effect under rainy conditions (Transit_rain) were estimated. For bike access distance, Bike_acc was calculated.
The MWTP for travel time shows that VOT_sunny was USD -1.53 per minute, whereas VOT_rainy was USD -2.54 per minute. This indicates that the disutility associated with a one-minute increase in travel time becomes larger under rainy conditions. VOT_rain_add was USD -1.00 per minute, suggesting that rain imposes an additional time-related burden.
A similar pattern is observed for walking last-mile distance. Walk_sunny was USD -34.24 per mile, whereas Walk_rainy was USD -113.35 per mile, and Walk_rain_add was also negative. Thus, the disutility associated with an increase in walking access distance is substantially amplified under rainy conditions. This result suggests that public transport use relying on walking last-mile access becomes particularly disadvantaged in rainy weather.
For the bike alternative, Bike_sunny was -107.66, while Bike_rainy was -217.39, indicating a larger disutility under rainy conditions. Bike_rain_add was also significantly negative, showing that the disutility associated with choosing the bike alternative increases markedly when it rains.
By contrast, the MWTP values related to public transport were relatively small and statistically less clear. The MWTP for LRT was -10.27, and Transit_rain was -8.77; neither was statistically significant. The MWTP for Bus was -23.68, but it was only marginally significant at the 10% level. These results suggest that rain does not impose a uniform additional disutility on public transport itself. Rather, the effect of rain appears more strongly through walking last-mile conditions and the bike alternative. Bike_acc was also not statistically significant, indicating that the average effect of bike access distance was uncertain. It should be noted that the statistical significance of an MWTP estimate depends jointly on the precision of the underlying attribute coefficient and that of the cost coefficient, because each MWTP is a ratio of the two and its delta-method variance reflects both. This is why dist_acc_bike is statistically significant as a utility coefficient (Table 3), whereas the corresponding monetary measure, Bike_acc, is not (Table 4).
The distribution of individual-level MWTP values confirms patterns consistent with the aggregate-level results. Table 5 presents the distribution of MWTP values based on individual-specific posterior parameters.
For travel time, the mean and median of vot_sunny were -1.53 and -1.56, respectively, whereas the mean and median of vot_rainy were -2.54 and -2.59. These values show greater disutility under rainy conditions. For walking last-mile distance, the mean and median of walk_wtp_sunny were -36.01 and -42.23, whereas those of walk_wtp_rainy were -115.48 and -123.69. This indicates a substantial increase in disutility under rainy conditions. For the bike alternative, the mean and median of bike_wtp_sunny were -108.64 and -138.75, compared with -215.19 and -241.88 for bike_wtp_rainy, again indicating a greater burden under rainy conditions.
In contrast, public transport-related MWTP values show considerable heterogeneity. Although the mean values of mwtp_LRT and mwtp_Bus were negative, their 75th percentiles were positive, indicating that some respondents evaluated these modes positively. Thus, preferences for public transport varied substantially across respondents.
3.3. Predicted Modal Shifts Under Weather and Last-Mile Scenarios
To examine how the coefficients and MWTP estimates reported in the previous sections translate into final mode choice outcomes, this section presents the average predicted choice probabilities for each alternative. The alternatives considered are Car, LRT_walk, which accesses LRT by walking; LRT_bike, which accesses LRT by bike; Bus_walk, which accesses bus by walking; Bus_bike, which accesses bus by bike; and Bike. These predicted probabilities were calculated based on the estimated mixed logit model and respondent-specific coefficients. They therefore represent average choice probabilities implied by the estimated preference structure, rather than observed market shares.
Table 6 compares the observed choice shares and model-based predicted probabilities under sunny and rainy conditions. The predicted choice probability for Car increased substantially, from 34.9% under sunny conditions to 54.4% under rainy conditions. By contrast, the predicted probabilities of all non-car alternatives declined: LRT_walk decreased from 21.7% to 17.0%, LRT_bike from 10.2% to 6.0%, Bus_walk from 18.2% to 15.1%, Bus_bike from 8.1% to 5.2%, and Bike from 6.9% to 2.3%. These results indicate that, on average, rainy conditions reduce the choice probabilities of non-car alternatives and strengthen the shift toward car use. Overall, the model-based predicted probabilities were broadly consistent with the observed choice shares under both weather conditions—for example, the observed Car share rose from 30.5% to 51.6% while the predicted probability rose from 34.9% to 54.4%—indicating that the estimated mixed logit model reproduces the observed modal pattern well. For readers less familiar with discrete choice models, a predicted probability can be understood as the modal share that the estimated preference structure would generate on average, whereas an observed share is simply the proportion of choices actually made in the experiment.
Figure 4 shows that an increase in last-mile distance raised the predicted probability of choosing Car under both sunny and rainy conditions, but the effect was more pronounced under rainy conditions. The predicted probability of Car was 31.4% under sunny conditions and 45.7% under rainy conditions at a distance of 0 miles, increasing to 37.4% and 60.6%, respectively, at 1.0 mile. Moreover, the difference between sunny and rainy conditions widened as distance increased. This indicates that car dependence under rainy conditions becomes stronger as last-mile distance increases.
A similar pattern was observed for public transport alternatives involving walking access. The predicted probabilities of LRT_walk and Bus_walk decreased as distance increased, and the magnitude of this decline was larger under rainy conditions. In other words, public transport alternatives that depend on walking last-mile access become less competitive as distance increases, and this disadvantage becomes more pronounced when it rains. This finding is consistent with the estimation result showing that rain_dist_walk was significantly negative.
The behavior of bike-related alternatives, however, was not uniform. In the results based on the observed conditions, all bike-related alternatives declined under rainy conditions. In the distance scenario, however, a monotonic decline was not necessarily observed. For example, the predicted probabilities of LRT_bike, Bus_bike, and Bike under rainy conditions increased in some cases as distance became longer. This suggests that an increase in last-mile distance does not uniformly amplify the disadvantage of bike-related alternatives under rainy conditions. Rather, through the relative disadvantage imposed on public transport alternatives with walking access, some demand appears to be redistributed toward Car and bike-access alternatives.
4. Discussion
In evaluating sustainable transport systems, it is necessary to consider not only whether major transport modes such as rail and bus are provided, but also whether people can actually reach and use them under practical travel conditions. The central concern of this study is to distinguish whether vulnerability under adverse weather lies in the major transport modes themselves or in last-mile access, and to clarify how this distinction is associated with sustainable mode choice. Based on the empirical results presented in Section 3, this section discusses the location of vulnerability under adverse weather, mode shifts, and the amplifying effect of last-mile distance in relation to the hypotheses and existing literature. It is helpful to frame this discussion in terms of two distinct forms of resilience in sustainable transport systems. Operational resilience refers to whether the main transport services themselves continue to be provided and to function—whether rail and bus services keep running. Functional accessibility resilience, by contrast, refers to whether users can still reach and make use of those services under adverse conditions. A transport system can retain full operational resilience while losing functional accessibility resilience: even when trains and buses continue to operate on schedule, the sustainable transport system becomes functionally vulnerable if deteriorating walking and cycling access prevents people from reaching them. The central argument developed below is that weather-induced vulnerability is located primarily in this second form of resilience.
4.1. Hypothesis 1: Weather-Related Vulnerability Is Concentrated in Last-Mile Access Rather Than in Transit Itself
The first hypothesis, namely that vulnerability under adverse weather is concentrated more in last-mile access than in public transport itself, was broadly supported.
The mixed logit estimates showed that the rainy-weather effect on travel time (rain_time), the rainy-weather interaction for Bike as a main mode (rain_Bike), and the rainy-weather effect on walking last-mile distance (rain_dist_walk) were all significantly negative. By contrast, the additional rainy-weather effect on public transport (rain_Transit) was not statistically significant. In the mixed logit model, these results indicate that the additional disutility under adverse weather appeared primarily in time burden, walking access, and bike use.
The MWTP results showed a similar pattern. The monetary value of a one-minute increase in travel time increased from USD -1.53 under sunny conditions to USD -2.54 under rainy conditions. The disutility of walking last-mile distance increased substantially from USD -34.24 per mile under sunny conditions to USD -113.35 per mile under rainy conditions. For the Bike alternative, disutility also increased from USD -107.66 under sunny conditions to USD -217.39 under rainy conditions. By contrast, the MWTP for the additional rainy-weather effect on public transport (Transit_rain) was not statistically significant. These results suggest that, on average, the increased burden under adverse weather was more strongly associated with access segments required to reach public transport than with the public transport service itself.
This finding reinforces previous studies showing that adverse weather affects public transport use and non-car travel [7,8,9]. However, previous research has not always clearly distinguished whether this effect reflects aversion to public transport services themselves or deterioration in access conditions to stations and stops [11,12,13]. In this study, no average additional rainy-weather effect was identified for public transport itself, whereas clear rainy-weather effects were found for walking last-mile access and bike use. This indicates that the impact of adverse weather appears more strongly in the access segments to stations and stops than in public transport services themselves.
Therefore, when assessing the resilience of sustainable transport systems, it is necessary to include not only the supply conditions of major transport modes, but also the conditions of last-mile access connecting users to those modes.
4.2. Hypothesis 2: Adverse Weather Shifts Mode Choice Toward Car Use
The second hypothesis, namely that adverse weather induces a shift toward car use, was also supported by the results of this study.
The average predicted probabilities based on the mixed logit model showed that the choice probability of Car increased substantially from 34.9% under sunny conditions to 54.4% under rainy conditions. By contrast, the probabilities of non-car alternatives declined: LRT_walk decreased from 21.7% to 17.0%, LRT_bike from 10.2% to 6.0%, Bus_walk from 18.2% to 15.1%, Bus_bike from 8.1% to 5.2%, and Bike, where bike is used as the main mode, from 6.9% to 2.3%. Thus, the model-based predictions confirm that rainy conditions induced a shift from non-car alternatives toward Car.
The observed average choice share of Car also increased, from 30.5% under sunny conditions to 51.6% under rainy conditions. Therefore, both the observed choices and the model-based predictions show a consistent pattern: car choice increases under adverse weather. This result is consistent with previous studies showing that adverse weather increases car dependence and reduces the use of public transport and non-car modes [4,7,8,10,47]. However, the distinctive contribution of this study is that it links this shift toward car use not merely to a general weather response, but to last-mile conditions.
The DCE in this study explicitly incorporated travel time, walking access distance, bike access distance, and weather conditions. The results indicate that the shift toward Car under rainy conditions was driven less by an average decline in the evaluation of public transport itself than by increased burdens associated with walking last-mile access and bike use. Therefore, weather-induced shifts toward car use can constrain opportunities to choose sustainable transport modes and, in turn, may affect the sustainability of transport systems built around public transport.
4.3. Hypothesis 3: The Effect of Adverse Weather Is Amplified by Longer Last-Mile Distance
The third hypothesis, namely that the effect of adverse weather on mode choice is amplified as last-mile distance increases, was partially supported by the results of this study. The key issue here is how the magnitude of the adverse-weather effect changes with last-mile distance.
The scenario analysis showed that an increase in last-mile distance amplified the effect of adverse weather, particularly for Car and public transport alternatives involving walking access. The average predicted probability of Car was 31.4% under sunny conditions and 45.7% under rainy conditions at a distance of 0 miles, increasing to 37.4% and 60.6%, respectively, at 1.0 mile. Moreover, the gap between sunny and rainy conditions widened from 14.4 percentage points at 0 miles to 23.2 percentage points at 1.0 mile. This confirms that car dependence under rainy conditions becomes stronger as last-mile distance increases.
A similar pattern was observed for public transport alternatives involving walking access. The predicted probabilities of LRT_walk and Bus_walk declined as last-mile distance increased, and the magnitude of this decline was larger under rainy conditions. In particular, when the distance was short, the difference between sunny and rainy conditions was relatively small, whereas the decline under rainy conditions became larger as distance increased.
This finding extends previous research showing that access distance affects mode choice to the context of adverse weather. Travel distance and last-mile distance have traditionally been treated as general determinants of mode choice and public transport use [3,5,6]. The results of this study show that, under adverse weather, last-mile distance also acts as a condition that amplifies changes in mode choice. Thus, last-mile distance should not be understood merely as an access condition, but also as a factor that shapes the magnitude of weather-related impacts.
By contrast, the behavior of bike-related alternatives was not uniform. Although their choice probabilities declined under rainy conditions in the observed-condition results, the distance scenario did not show a consistently monotonic decline. For example, the rainy-condition probabilities of LRT_bike, Bus_bike, and Bike increased in some cases as distance became longer. This suggests that an increase in last-mile distance does not uniformly amplify the disadvantage of bike-related alternatives under rainy conditions. Rather, through the relative disadvantage imposed on public transport alternatives involving walking access, some demand may be redistributed toward Car and bike-access alternatives.
It has also been noted more generally that some users continue to use bikes even under adverse weather conditions. The results of this study are consistent with this view, as substantial heterogeneity was found in evaluations of bike-related alternatives. Therefore, although the average effect of adverse weather on bike-related alternatives is negative, both the magnitude and direction of this effect vary considerably across individuals.
4.4. Implications for Sustainable Transportation Research and Planning
The results of this study suggest that research on sustainable transport needs to explicitly incorporate not only the supply conditions of major transport modes, but also the last-mile access conditions that enable users to reach those modes. Evaluations of sustainable transport systems have traditionally tended to emphasize conditions on the main-mode side, such as the level of rail and bus operations, service frequency, and network structure [14,15]. However, this study found that the additional effect of rain was not statistically significant for public transport itself on average, whereas clear effects were observed for travel time, walking last-mile access, and bike use. The results also showed that the increase in car choice became larger as last-mile distance increased. Therefore, the sustainability of urban transport should be evaluated not only in terms of the supply conditions of major modes, but also in terms of the access environments that allow users to connect to those modes without excessive burden.
From a planning perspective, improving walking and bike access environments is essential for reducing weather-induced shifts toward car use. Specific targets include the continuity of pedestrian routes to stations and stops, shelters under rainy conditions, drainage, sidewalk safety, intersection design, and the quality of bike access environments. In particular, the scenario analysis showed that, for public transport alternatives involving walking access, the decline under rainy conditions became larger as last-mile distance increased. Changes under adverse weather also appeared as shifts from trips involving walking, bike use, and connections to public transport toward car use. Although these results do not directly estimate CO₂ emissions, they suggest travel patterns that may be unfavorable from a sustainability perspective.
At the same time, when improving the last-mile environment is difficult in the short term, shared car-based access modes may serve as complementary measures. For example, ride-hailing and carpooling—ideally provided by electric or other low-emission vehicles—could serve as feeder connections to rail and bus services when the burden of walking or bike access increases under rainy conditions, rather than as substitutes for public transport. Framed as electrified feeder services rather than door-to-door car trips, such shared mobility options can act as a safety net that sustains connections to major transport modes and helps prevent a full shift to single-occupancy private car use.
However, this study did not directly estimate preferences for, or willingness to use, these services themselves. Therefore, these implications should be interpreted as complementary and exploratory. In practice, improving last-mile access environments should remain the primary strategy, while shared car-based access modes may be positioned as supplementary measures under conditions where such improvements are difficult to implement.
5. Conclusions
5.1. Main Findings
The main findings of this study can be summarized in three points: vulnerability under adverse weather appears primarily in last-mile access conditions, this vulnerability induces a shift toward car use, and the effect is amplified by last-mile distance.
First, the increased burden under adverse weather appeared more strongly in the travel conditions required to reach public transport than in public transport itself. Specifically, under rainy conditions, the disutility associated with travel time, walking last-mile travel, and bike use all increased. By contrast, the average additional effect on public transport itself was not clearly identified. Thus, the problem under adverse weather does not primarily appear as a disruption in the supply of major transport modes, but rather as a deterioration in the access conditions connecting users to those modes.
Second, through this deterioration in access conditions, a shift occurred from sustainable transport modes toward car use. Under rainy conditions, car choice increased, while the overall choice probabilities of non-car alternatives, including public transport and bike-related options, declined.
Third, these effects became stronger as last-mile distance increased. The shift toward car use under adverse weather did not occur uniformly; it became larger under conditions involving longer access segments. This indicates that last-mile distance is not merely a background condition, but a factor that amplifies the effect of adverse weather.
Overall, this study demonstrates the need to understand the vulnerability of sustainable transport systems by jointly considering adverse weather, last-mile access, and mode choice.
5.2. Contribution and Implications
The first contribution of this study is that it conceptualizes the vulnerability of sustainable transport systems not only in terms of the supply conditions of major transport modes, but also from the perspective of last-mile access conditions connecting users to those modes. Previous discussions of sustainability and transport resilience have often focused on maintaining rail and bus operations. In contrast, this study shows that even when major modes remain available, sustainable mode choice can be undermined if access conditions deteriorate. This implies that evaluations of sustainable transport systems need to explicitly include both major modes and access conditions. Framed in the terms introduced in Section 4, this study reconceptualizes the resilience of sustainable transport systems as comprising not only operational resilience—the continued running of rail and bus services—but also functional accessibility resilience, the capacity of users to reach those services under adverse conditions. The core theoretical contribution is the proposition that the weather-induced vulnerability of sustainable transport systems lies not in the supply of the main transport service but in the access environment that surrounds it.
The second contribution is that this study identifies changes in mode choice under adverse weather not simply as a weather response, but as a change mediated by access conditions. The effects of adverse weather appeared more strongly in travel time, walking last-mile access, and bike use than in public transport itself. In addition, the changes under adverse weather appeared as shifts from trips involving walking, bike use, and connections to public transport toward car use. Although this study did not directly estimate CO₂ emissions, these results suggest travel patterns that may be unfavorable from a sustainability perspective.
From a planning perspective, improving last-mile access environments should be the primary strategy, while shared car-based access modes may be positioned as complementary measures where necessary. Specific areas for intervention include the continuity of pedestrian routes to stations and stops, shelters and drainage under rainy conditions, sidewalk safety, and improvements to bike access environments. At the same time, where such environmental improvements are difficult to implement in the short term, electrified ride-hailing and carpooling may serve as feeder connections that complement access to major transport modes without encouraging a shift to single-occupancy car travel. However, because this study did not directly estimate preferences for these services, this implication should be interpreted as supplementary.
5.3. Limitations
This study has several limitations.
First, there are limitations related to external validity. This study is based on a discrete choice experiment conducted in Portland, Oregon, and caution is therefore required when generalizing the findings. In addition, because the sample reflects a specific geographic area and survey conditions, it may not fully represent the behavior or preferences of the broader population. Moreover, the adverse-weather condition in this study was specified mainly as rain; it did not include snow, extreme heat, strong winds, or events involving actual service disruptions.
Second, there are limitations related to data and measurement. This study used stated preference data from a discrete choice experiment, and actual travel behavior may differ from stated choices. In particular, behavior under adverse weather may be affected by uncertainty, risk aversion, and time constraints, which may lead to different decisions in real-world settings. The choice tasks used in this study were also simplified to ensure analytical tractability and therefore do not fully reproduce the complex conditions of real transport environments. In addition, the results depend on self-reported preferences, and differences in individual experiences and perceptions may have influenced the findings.
Third, there are limitations in the analytical scope. This study directly examined the relationships among adverse weather, last-mile access, and mode choice. It did not empirically evaluate the effectiveness of complementary measures such as ride-hailing or carpooling. Relatedly, the choice scenarios held the waiting environment at stations and stops (for example, the provision of shelter) constant, so its independent role under adverse weather was not evaluated and remains a question for future research.
Fourth, the timing of the survey requires comment. Data were collected in March 2021, during the COVID-19 pandemic, when public transport ridership in the United States was substantially depressed and pandemic-related risk perceptions may have shifted baseline preferences away from shared modes. This timing should be borne in mind when interpreting the absolute level of the predicted car share. It is important to note, however, that the weather effects in this study are identified from within-respondent contrasts between sunny and rainy choice tasks through the rain interaction terms. Any time-invariant, weather-independent shift in mode preferences, including a general pandemic-era aversion to public transport, is absorbed by the alternative-specific constants and is therefore less likely to bias the estimated rain interactions. The central finding that weather sensitivity is concentrated in last-mile access (H1) is therefore relatively insensitive to such a level shift, whereas the absolute magnitude of the car-oriented shift (H2) should be interpreted with corresponding caution. It should also be acknowledged that pandemic-era risk perceptions may not have operated purely as a time-invariant shift; the possibility that they interacted with the perception of adverse weather cannot be entirely ruled out, and the weather-related estimates should be read with this caveat in mind. In addition, the cost attribute spanned a relatively narrow range, which limits the precision of the cost coefficient; because the MWTP estimates are obtained as ratios to this coefficient, they are best interpreted as relative comparisons across attributes and weather conditions rather than as precise absolute valuations.
Despite these limitations, the findings provide an empirical basis for understanding the vulnerability of sustainable transport systems. Future research should further test and refine these findings through comparative analyses across cities, the use of revealed preference data incorporating location and temporal variation, and analyses that incorporate a broader range of weather conditions and transport service conditions.
Author Contributions
Conceptualization, N.K.; methodology, N.K.; software, N.K.; validation, N.K. and K.T.; formal analysis, N.K.; investigation, N.K. and K.T.; resources, N.K. and K.T.; data curation, N.K.; writing—original draft preparation, N.K.; writing—review and editing, K.T.; visualization, N.K.; supervision, K.T.; project administration, K.T.; funding acquisition, N.K. and K.T. All authors have read and agreed to the published version of the manuscript.
Funding
This research was funded by the Priority Area Research Grant from Shiga University and the Telecommunications Advancement Foundation Research Grant, Japan.
Institutional Review Board Statement
Ethical review and approval were not required for this study under the authors’ institutional guidelines because the research used completely anonymous survey data collected through a third-party commercial online panel.
Informed Consent Statement
Informed consent was obtained from all participants involved in the study. The survey was conducted using a third-party online panel, and participants’ voluntary completion of the survey constituted their consent.
Data Availability Statement
The data presented in this study are available from the corresponding author upon reasonable request. The data are not publicly available due to restrictions associated with the third-party online panel and privacy considerations.
Acknowledgments
This study was supported by a Priority Area Research Grant from Shiga University, Japan.
Conflicts of Interest
The authors declare no conflict of interest.
References
- Leroutier, M.; Quirion, P. Tackling car emissions in urban areas: Shift, avoid, improve. Ecol. Econ. 2023, 213, 107951. [CrossRef]
- Wimbadi, R.W.; Djalante, R.; Mori, A. Urban experiments with public transport for low carbon mobility transitions in cities: A systematic literature review (1990–2020). Sustain. Cities Soc. 2021, 72, 103023. [CrossRef]
- Ha, J.; Ki, D.; Lee, S.; Ko, J. Mode choice and the first-/last-mile burden: The moderating effect of street-level walkability. Transp. Res. Part D Transp. Environ. 2023, 116, 103646. [CrossRef]
- Gössling, S.; Neger, C.; Steiger, R.; Bell, R. Weather, climate change, and transport: A review. Nat. Hazards 2023, 118, 1341–1360. [CrossRef]
- De Vos, J.; Cheng, L.; Kamruzzaman, M.; Witlox, F. The indirect effect of the built environment on travel mode choice: A focus on recent movers. J. Transp. Geogr. 2021, 91, 102983. [CrossRef]
- He, M.; Li, J.; Shi, Z.; Liu, Y.; Shuai, C.; Liu, J. Exploring the nonlinear and threshold effects of travel distance on the travel mode choice across different groups: An empirical study of Guiyang, China. Int. J. Environ. Res. Public Health 2022, 19, 16045. [CrossRef]
- Wu, J.; Liao, H. Weather, travel mode choice, and impacts on subway ridership in Beijing. Transp. Res. Part A Policy Pract. 2020, 135, 264–279. [CrossRef]
- Lepage, S.; Morency, C. Impact of weather, activities, and service disruptions on transportation demand. Transp. Res. Rec. 2021, 2675, 294–304. [CrossRef]
- Ngo, N.S.; Bashar, S. The impacts of extreme weather events on U.S. public transit ridership. Transp. Res. Part D Transp. Environ. 2024, 137, 104504. [CrossRef]
- Jang, J.; Sung, M.; Hwang, J. When less travel means more carbon: How rainfall-induced shifts from public transit to cars increase urban transport emissions. Sci. Total Environ. 2026, 1013, 181269. [CrossRef]
- Wei, M. How does the weather affect public transit ridership? A model with weather-passenger variations. J. Transp. Geogr. 2022, 98, 103242. [CrossRef]
- Jiang, S.; Cai, C. The impacts of weather conditions on metro ridership: An empirical study from three mega cities in China. Travel Behav. Soc. 2023, 31, 166–177. [CrossRef]
- Miao, Q.; Welch, E.W.; Sriraj, P.S. Extreme weather, public transport ridership and moderating effect of bus stop shelters. J. Transp. Geogr. 2019, 74, 125–133. [CrossRef]
- Mishra, A.; Singh, V. A comprehensive and systematic review of performance evaluation of public transit. Period. Polytech. Transp. Eng. 2026, OnlineFirst. [CrossRef]
- Sogbe, E.; Susilawati, S.; Tan, C.P. Scaling up public transport usage: A systematic literature review of service quality, satisfaction and attitude towards bus transport systems in developing countries. Public Transp. 2025, 17, 1–44. [CrossRef]
- Hensher, D.A.; Rose, J.M.; Collins, A.T. Identifying commuter preferences for existing modes and a proposed Metro in Sydney, Australia with special reference to crowding. Public Transp. 2011, 3, 109–147. [CrossRef]
- Portland Bureau of Transportation. Portland Bicycle Plan for 2030. Available online: https://www.portland.gov/policies/transportation/transportation-options/trn-607-portland-bicycle-plan-2030 (accessed on 26 April 2026).
- Metro. Urban Growth Report. Available online: https://www.oregonmetro.gov/urban-growth-report (accessed on 26 April 2026).
- Metro. 2040 Growth Concept. Available online: https://www.oregonmetro.gov/2040-growth-concept (accessed on 26 April 2026).
- Portland Bureau of Transportation. Transportation System Plan (TSP). Available online: https://www.portland.gov/transportation/planning/transportation-system-plan-tsp (accessed on 26 April 2026).
- TriMet. About TriMet. Available online: https://trimet.org/about/ (accessed on 26 April 2026).
- TriMet. MAX Light Rail Service. Available online: https://trimet.org/max/index.htm (accessed on 26 April 2026).
- McNeil, N.; Dill, J. Revisiting TODs: How Subsequent Development Affects the Travel Behavior of Residents in Existing Transit-Oriented Developments; Transportation Research and Education Center: Portland, OR, USA, 2020. Available online: https://pdxscholar.library.pdx.edu/trec_reports/212/ (accessed on 26 April 2026).
- McNeil, N.; Kim, K.; Dill, J. Portland Metro Transit-Oriented Developments (TODs): 2024 Resident Survey Findings; Transportation Research and Education Center, Portland State University: Portland, OR, USA, 2025. Available online: https://trid.trb.org/View/2601529 (accessed on 26 April 2026).
- Portland Bureau of Transportation. Bike Lane Upgrades: Concrete Separators. Available online: https://www.portland.gov/transportation/pbot-projects/concrete-sep (accessed on 26 April 2026).
- Portland Bureau of Transportation. About the Rose Lane Project. Available online: https://www.portland.gov/transportation/rose-lanes/about-rose-lanes (accessed on 26 April 2026).
- Portland Bureau of Transportation. Pricing Options for Equitable Mobility (POEM). Available online: https://www.portland.gov/transportation/planning/pricing-options-equitable-mobility-poem (accessed on 26 April 2026).
- Federal Transit Administration. Effects of the COVID-19 Pandemic on Transit Ridership and Accessibility, Report 0268; Federal Transit Administration, U.S. Department of Transportation: Washington, DC, USA, 2024. Available online: https://www.transit.dot.gov/research-innovation/effects-covid-19-pandemic-transit-ridership-and-accessibility-report-0268 (accessed on 26 April 2026).
- City of Portland. 20-Minute Neighborhoods Analysis: Background Report. Available online: https://efiles.portlandoregon.gov/webdrawer.dll/webdrawer/rec/4376218/view/PP%2020-min%20neighborhood%20analysis.PDF (accessed on 26 April 2026).
- Portland Bureau of Transportation. PedPDX: Portland's Citywide Pedestrian Plan. Available online: https://www.portland.gov/transportation/planning/pedpdx (accessed on 26 April 2026).
- Portland Bureau of Transportation. Portland 2035 Transportation System Plan: Chapter 2—Goals and Policies. Available online: https://www.portland.gov/transportation/planning/documents/chapter-2-goals-and-policies/download (accessed on 26 April 2026).
- Portland Bureau of Transportation. News Release: PBOT and Lyft Launch BIKETOWN E-Bike Fleet and East Portland Expansion Today. Available online: https://www.portland.gov/transportation/news/2020/9/9/news-release-pbot-and-lyft-launch-biketown-e-bike-fleet-and-east (accessed on 26 April 2026).
- Portland Bureau of Transportation. About BIKETOWN. Available online: https://www.portland.gov/transportation/bike-share/about-biketown (accessed on 26 April 2026).
- Hensher, D.A.; Rose, J.M. Development of commuter and non-commuter mode choice models for the assessment of new public transport infrastructure projects: A case study. Transp. Res. Part A Policy Pract. 2007, 41, 428–443. [CrossRef]
- Alamri, A.S.; Georgiou, S.; Stylianou, S. Discrete choice experiments: An overview on constructing D-optimal and near-optimal choice sets. Heliyon 2023, 9, e18256. [CrossRef]
- Caussade, S.; de Dios Ortúzar, J.; Rizzi, L.I.; Hensher, D.A. Assessing the influence of design dimensions on stated choice experiment estimates. Transp. Res. Part B Methodol. 2005, 39, 621–640. [CrossRef]
- Stopher, P.R.; Hensher, D.A. Are more profiles better than fewer? Searching for parsimony and relevance in stated choice experiments. Transp. Res. Rec. 2000, 1719, 165–174. [CrossRef]
- Hess, S.; Hensher, D.A.; Daly, A. Not bored yet: Revisiting respondent fatigue in stated choice experiments. Transp. Res. Part A Policy Pract. 2012, 46, 626–644. [CrossRef]
- Revelt, D.; Train, K. Mixed logit with repeated choices: Households’ choices of appliance efficiency level. Rev. Econ. Stat. 1998, 80, 647–657. [CrossRef]
- Train, K.E. Discrete Choice Methods with Simulation, 2nd ed.; Cambridge University Press: Cambridge, UK, 2009.
- Hole, A.R. Fitting mixed logit models by using maximum simulated likelihood. Stata J. 2007, 7, 388–401. [CrossRef]
- Jorgensen, B.S.; Syme, G.J. Protest responses and willingness to pay: Attitude toward paying for stormwater pollution abatement. Ecol. Econ. 2000, 33, 251–265. [CrossRef]
- U.S. Census Bureau. American Community Survey 2021 1-Year Data. Available online: https://www.census.gov/data/developers/data-sets/acs-1year/2021.html (accessed on 26 April 2026).
- Bethlehem, J. Selection bias in web surveys. Int. Stat. Rev. 2010, 78, 161–188. [CrossRef]
- Legleye, S.; Chauvet, G.; Merly-Alpa, T.; Soullier, N. Who are the online panelists and why they cannot represent the general population. Surv. Methods Insights Field 2025. [CrossRef]
- Stein, A.; Gummer, T.; Naumann, E.; Rohr, B.; Silber, H.; Auriga, R.; Bergmann, M.; Bethmann, A.; Blohm, M.; Cornesse, C.; et al. Education bias in probability-based surveys in Germany: Evidence and possible solutions. Int. J. Soc. Res. Methodol. 2026, 29, 197–214. [CrossRef]
- Belloc, I.; Gimenez-Nadal, J.I.; Molina, J.A. Weather conditions and daily commuting. J. Reg. Sci. 2025, 65, 818–842. [CrossRef]
Figure 3.
Example of a choice task presented to respondents. While all scenarios are hypothetical, the "car" scenario serves as the baseline for comparing other options. The example shown in this chart—the "Bus + Walking" route—involves taking a bus partway to your destination and then walking the remaining mile. This option costs 20% less than driving a car and reduces CO2 emissions by 80%. Icons sourced from Icons8 (https://icons8.com/).
Figure 3.
Example of a choice task presented to respondents. While all scenarios are hypothetical, the "car" scenario serves as the baseline for comparing other options. The example shown in this chart—the "Bus + Walking" route—involves taking a bus partway to your destination and then walking the remaining mile. This option costs 20% less than driving a car and reduces CO2 emissions by 80%. Icons sourced from Icons8 (https://icons8.com/).
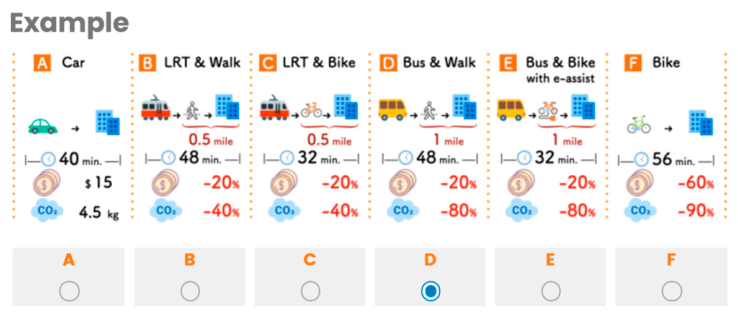
Figure 4.
Predicted modal choice probabilities under last-mile distance scenarios. (a) Probabilities by transportation mode under clear weather conditions. (b) Probabilities under rainy weather conditions.
Figure 4.
Predicted modal choice probabilities under last-mile distance scenarios. (a) Probabilities by transportation mode under clear weather conditions. (b) Probabilities under rainy weather conditions.
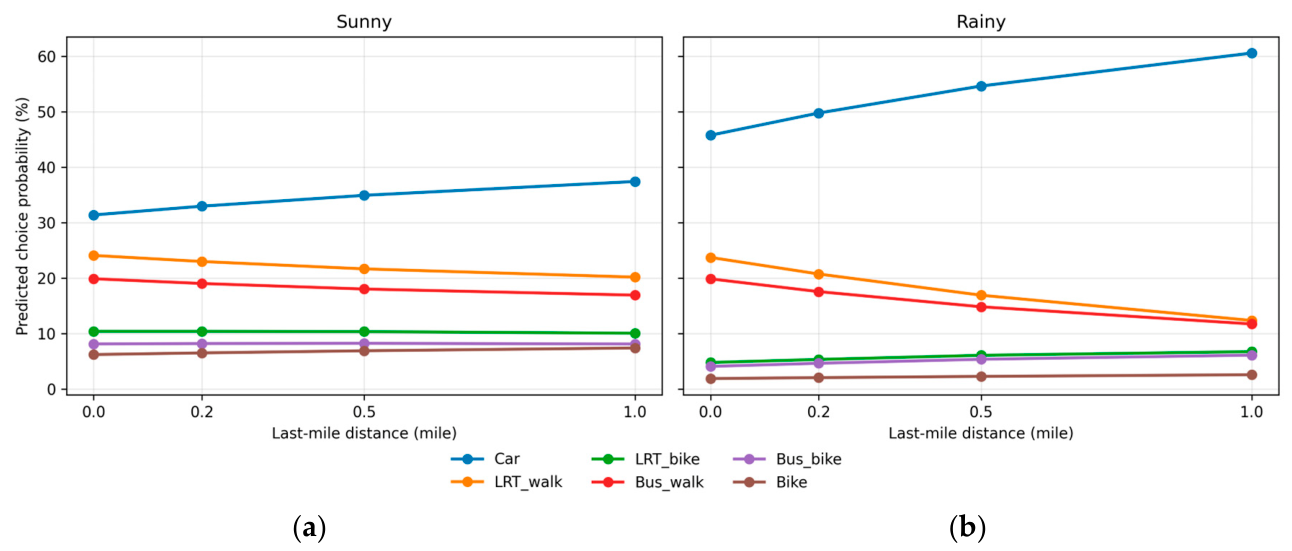

Table 1.
Attributes and levels used in the discrete choice experiment.
| Attributes | Description | Levels |
|---|---|---|
| Travel time | Total door-to-door travel time from home departure to destination arrival. For non-car alternatives, levels are expressed as deviations from the private car baseline. | Private car: 20, 30, and 40 min; other modes: ±20%, ±40%, ±50% |
| Cost | Total monetary cost, including fare, fuel, and parking. For non-car alternatives, levels are expressed as deviations from the private car baseline. | Private car: USD 11, 13, and 15; other modes: -10%, -20%, and -50% |
| Co2 emissions | Amount of CO₂ emitted for the trip. For non-car alternatives, levels are expressed as deviations from the private car baseline. | Private car: 2.5, 4.0, and 4.5 kg; other modes: -20%, -40%, and -80% |
| Last mile Distance | Distance from the bus stop or LRT station to the destination, traveled either on foot or by bicycle. | 0.2, 0.5, and 1.0 miles |
| Bike types | Type and ownership condition of the bicycle option. | 4 types of bikes; Conventional, electric-assist, private, and shared |
Table 2.
Demographic characteristics of the sample and 2021 ACS population benchmarks.
| Category | Subcategory | Sample | ACS population | ||
|---|---|---|---|---|---|
| n | % | n | % | ||
| County | Multnomah | 369 | 48.60 | 803,377 | 44.00 |
| Washington | 236 | 31.10 | 600,811 | 32.90 | |
| Clackamas | 155 | 20.40 | 423,173 | 23.10 | |
| Gender | Female | 468 | 61.60 | 1,007,677 | 50.60 |
| Male | 276 | 36.30 | 985,319 | 49.40 | |
| Age | 18-34 | 279 | 36.70 | 576,211 | 28.90 |
| 35-64 | 355 | 46.70 | 1,018,622 | 51.10 | |
| 65+ | 126 | 16.60 | 398,163 | 20.00 | |
| Education | High school or less | 105 | 13.80 | 573,579 | 28.80 |
| Some college or AA | 274 | 36.10 | 639,739 | 32.10 | |
| Bachelor's degree | 228 | 30.00 | 490,921 | 24.60 | |
| Graduate / Advanced | 145 | 19.10 | 288,757 | 14.50 | |
|
Tenure by household type |
Owner-occupied | 393 | 51.70 | 621,448 | 62.00 |
| Rent-occupied | 322 | 42.40 | 380,536 | 38.00 | |
| Residence type | Single-Family | 419 | 55.10 | 705,659 | 67.10 |
| Other | 334 | 43.90 | 345,440 | 32.90 | |
| Household income | < $10,000 | 53 | 7.00 | 47,442 | 4.70 |
| $10,000–49,999 | 241 | 31.80 | 240,970 | 24.10 | |
| $50,000–99,999 | 243 | 32.00 | 296,188 | 29.60 | |
| $100,000–149,999 | 104 | 13.70 | 195,894 | 19.60 | |
| > $150,000 | 70 | 9.20 | 221,490 | 22.10 | |
Note: Sample percentages are calculated using the full analytical sample (N = 760) as the denominator. Category totals may not sum to 760 because of missing or nonresponse values. Population benchmarks are calculated from the 2021 American Community Survey 1-Year Estimates for the Portland-Vancouver-Hillsboro, OR-WA Metro Area. The base population for household income, residence type, and tenure is 1,001,984 households. Demographic categories for gender, age, race/ethnicity, and education are based on the adult population aged 18 years and older. County-level totals are used to isolate the tri-county population because the official Portland MSA includes outlying counties not covered in this study.
Table 3.
Estimation results of the mixed logit model.
| Model component | Variable | Coefficient | Standard error | |
|---|---|---|---|---|
| Mean parameters | Cost | -0.023 | ** | 0.01 |
| Time | -0.035 | *** | 0.005 | |
| dist_walk | -0.785 | *** | 0.218 | |
| dist_acc_bike | -0.427 | ** | 0.189 | |
| LRT | -0.235 | * | 0.126 | |
| Bus | -0.543 | *** | 0.14 | |
| Bike | -2.467 | *** | 0.192 | |
| rain_time | -0.023 | *** | 0.006 | |
| rain_Transit | -0.201 | 0.155 | ||
| rain_Bike | -2.514 | *** | 0.184 | |
| rain_dist_walk | -1.813 | *** | 0.265 | |
| SD parameters # | Time | 0.049 | *** | 0.005 |
| dist_walk | 2.001 | *** | 0.288 | |
| dist_acc_bike | 0.924 | *** | 0.244 | |
| LRT | 2.223 | *** | 0.141 | |
| Bus | 2.418 | *** | 0.189 | |
| Bike | 3.238 | *** | 0.166 | |
| rain_time | 0.016 | 0.01 | ||
| rain_Transit | 2.358 | *** | 0.191 | |
| rain_Bike | 1.862 | *** | 0.19 | |
| rain_dist_walk | 1.229 | *** | 0.376 | |
| # of observations | 34,956 | |||
| # of cases | 760 | |||
| Log-likelihood | -6,577.52 | |||
| AIC | 13,197.05 | |||
Note: * p < 0.10, ** p < 0.05, *** p < 0.01. # SD parameters are reported as absolute values.
Table 4.
Marginal willingness-to-pay (MWTP) estimates derived from the mixed logit model.
| Variable | description | unit | Mean MWTP | SE | 95% CI | |
|---|---|---|---|---|---|---|
| VOT_sunny | Monetary equivalent of a 1-minute increase in travel time in sunny conditions | USD/min | -1.53 | ** | 0.68 | [-2.87, -0.20] |
| VOT_rain_add | Additional rain-related monetary penalty for a 1-minute increase in travel time | -1.00 | * | 0.53 | [-2.05, 0.05] | |
| VOT_rainy | Monetary equivalent of a 1-minute increase in travel time in rainy conditions | -2.54 | ** | 1.14 | [-4.76, -0.31] | |
| Walk_sunny | Monetary equivalent of a 1-mile increase in walking last-mile distance in sunny conditions | USD/mile | -34.24 | ** | 15.93 | [-65.46, -3.03] |
| Walk_rain_add | Additional rain-related monetary penalty for a 1-mile increase in walking last-mile distance | -79.11 | ** | 37.43 | [-152.47, -5.75] | |
| Walk_rainy | Monetary equivalent of a 1-mile increase in walking last-mile distance in rainy conditions | -113.35 | ** | 49.99 | [-211.32, -15.37] | |
| Bike_sunny | Monetary equivalent of the bicycle alternative-specific constant in sunny conditions | USD | -107.66 | ** | 46.90 | [-199.59, -15.74] |
| Bike_rain_add | Additional rain-related monetary penalty for the bicycle alternative | -109.73 | ** | 49.61 | [-206.96, -12.50] | |
| Bike_rainy | Monetary equivalent of the bicycle alternative-specific constant in rainy conditions | -217.39 | ** | 95.75 | [-405.06, -29.72] | |
| LRT | Monetary equivalent of the LRT alternative-specific constant | USD | -10.27 | 7.17 | [-24.33, 3.78] | |
| Bus | Monetary equivalent of the bus alternative-specific constant | -23.68 | * | 12.38 | [-47.95, 0.58] | |
| Transit_rain | Additional rain-related monetary effect for transit alternatives | -8.77 | 7.60 | [-23.65, 6.12] | ||
| Bike_acc | Monetary equivalent of a 1-mile increase in bicycle access distance | USD/mile | -18.64 | 12.58 | [-43.29, 6.01] |
Note: Aggregate-level MWTP estimates were computed using nlcom based on the mixed logit model. Non-car modes use Car as the reference alternative. USD/min indicates U.S. dollars per minute, and USD/mile indicates U.S. dollars per mile. * p < 0.10, ** p < 0.05, *** p < 0.01.
Table 5.
Distribution of individual-level Marginal willingness-to-pay (MWTP) estimates.
| Variable | Description | Unit | Mean | Median | p25 | p75 |
|---|---|---|---|---|---|---|
| vot_sunny | Travel time MWTP (sunny) | USD/min | -1.53 | -1.56 | -2.25 | -0.79 |
| vot_rainy | Travel time MWTP (rainy) | USD/min | -2.54 | -2.59 | -3.36 | -1.76 |
| walk_wtp_sunny | Walk last-mile MWTP (sunny) | USD/mile | -36.01 | -42.23 | -82.02 | 9.73 |
| walk_wtp_rainy | Walk last-mile MWTP (rainy) | USD/mile | -115.48 | -123.69 | -166.98 | -63.05 |
| bike_wtp_sunny | Bike alternative MWTP (sunny) | USD | -108.64 | -138.75 | -200.06 | -21.38 |
| bike_wtp_rainy | Bike alternative MWTP (rainy) | USD | -215.19 | -241.88 | -312.52 | -120.68 |
| mwtp_LRT | LRT alternative MWTP | USD | -10.96 | -8.72 | -81.2 | 48.85 |
| mwtp_Bus | Bus alternative MWTP | USD | -26.13 | -34.19 | -98.13 | 34.16 |
Note: Individual-level MWTP estimates were computed from respondent-specific posterior parameters obtained using mixlbeta. USD/min indicates U.S. dollars per minute, and USD/mile indicates U.S. dollars per mile. Values represent monetary-equivalent effects. Substantial heterogeneity is indicated by differences between the mean and median and by wide interquartile ranges.
Table 6.
Observed and predicted modal choice shares by weather condition.
| Mode | Sunny | Rainy | ||
|---|---|---|---|---|
| Observed (%) | Predicted (%) | Observed (%) | Predicted (%) | |
| Car | 30.51 | 34.90 | 51.55 | 54.40 |
| LRT_walk | 21.57 | 21.70 | 16.94 | 17.00 |
| LRT_bike | 11.63 | 10.20 | 7.76 | 6.00 |
| Bus_walk | 19.49 | 18.20 | 15.49 | 15.10 |
| Bus_bike | 7.65 | 8.10 | 6.18 | 5.20 |
| Bike | 9.15 | 6.90 | 2.07 | 2.30 |
Note: Observed shares were calculated from chosen alternatives in the stated choice data. Predicted shares are average model-based choice probabilities from the mixed logit model using respondent-specific parameters.
Disclaimer/Publisher’s Note: The statements, opinions and data contained in all publications are solely those of the individual author(s) and contributor(s) and not of MDPI and/or the editor(s). MDPI and/or the editor(s) disclaim responsibility for any injury to people or property resulting from any ideas, methods, instructions or products referred to in the content. |
© 2026 by the authors. Licensee MDPI, Basel, Switzerland. This article is an open access article distributed under the terms and conditions of the Creative Commons Attribution (CC BY) license (http://creativecommons.org/licenses/by/4.0/).
Copyright: This open access article is published under a Creative Commons CC BY 4.0 license, which permit the free download, distribution, and reuse, provided that the author and preprint are cited in any reuse.


