

Submitted:
23 May 2026
Posted:
25 May 2026
You are already at the latest version
Abstract
Objectives: Sarcopenia impairs physical function and increases healthcare burden among older adults with chronic musculoskeletal disorders. This study described the prevalence of sarcopenia and explored factors associated with sarcopenia among Vietnamese elderly outpatients. Methods: A hospital-based cross-sectional study was conducted among 88 consecutively recruited outpatients aged 60 years or older (mean age 70.5 ± 6.7 years; 69 women, 78.4%) with knee osteoarthritis and/or chronic spinal pain at a tertiary hospital in Northern Vietnam from May 2024 to October 2025. Sarcopenia and severe sarcopenia were defined according to the Asian Working Group for Sarcopenia 2019 criteria. Muscle mass, muscle strength, and physical performance were assessed using standardized bioelectrical impedance analysis, handgrip dynamometry, and usual gait-speed procedures, respectively. The primary analysis was descriptive and exploratory. Multivariable logistic regression was interpreted cautiously because only 36 sarcopenia events were available, and the exploratory CHAID tree was used only as a within-sample descriptive display rather than as a validated prediction model. Results: The prevalence of sarcopenia was 40.9%, including 23.9% with sarcopenia and 17.0% with severe sarcopenia. Age >70 years (adjusted odds ratio [AOR] 9.00, 95% confidence interval [CI] 2.40-33.60), history of falls (AOR 6.33, 95% CI 2.77-14.45), low educational attainment (AOR 2.86, 95% CI 1.46-5.61), and higher PSQI score (AOR 1.16, 95% CI 1.02-1.32) were independently associated with sarcopenia. The wide confidence intervals and low events-per-variable ratio indicate important statistical imprecision. Conclusions: Sarcopenia was common in this outpatient population, although the estimate should be interpreted in light of the modest single-center sample. Simple clinical indicators, particularly age >70 years, fall history, low educational attainment, and poorer sleep quality, may help prioritize further sarcopenia assessment in musculoskeletal outpatient settings. However, because of the modest sample size, residual confounding from unmeasured physical activity and nutrition-related factors, and lack of model validation, these findings should not be used as a formal risk-stratification or prediction algorithm.
Keywords:
Asian working group for sarcopenia 2019
; geriatric assessment
; fall history
; sleep quality
; outpatient rehabilitation
; Vietnam
1. Introduction
The global population is aging at an unprecedented rate, leading to an increased prevalence of geriatric syndromes [1]. Among these, sarcopenia, characterised by the progressive and generalised loss of skeletal muscle mass and strength, has emerged as a major public health concern [2,3]. Sarcopenia is associated with various potential adverse outcomes, including functional decline, increased risk of falls, frailty, and higher mortality rates among the elderly [3,4]. In rapidly aging health systems, including Vietnam, early recognition of sarcopenia is relevant not only for individual clinical management but also for public health planning, because preventable disability and fall-related complications may increase outpatient visits, rehabilitation needs, caregiver burden, and healthcare expenditure.
In patients with chronic musculoskeletal disorders, such as knee osteoarthritis (KOA) and chronic spinal pain, the risk of sarcopenia appears to be significantly higher [5]. The interplay between chronic pain and reduced physical activity creates a “vicious cycle”: pain leads to kinesiophobia and immobilisation, which in turn, accelerates muscle atrophy and weakness [6]. In Vietnam, while several studies have addressed sarcopenia in the general community [7], recent evidence has highlighted that related geriatric issues, such as a high risk of falls, are becoming increasingly prevalent among elderly outpatients in local clinical settings [8]. From a service-delivery perspective, musculoskeletal outpatient clinics represent a practical point of contact for identifying older adults who may otherwise remain undiagnosed until disability, falls, or frailty become clinically apparent.
Traditional statistical methods, such as logistic regression, are commonly used to examine factors associated with health outcomes. However, these methods may not fully capture complex, nonlinear relationships and higher-order interactions among variables [9]. Decision tree models can provide an intuitive exploratory approach for subgroup identification and risk stratification [10]. By partitioning the study population into smaller, more homogeneous subgroups, decision trees may help visualize clinically relevant patterns; however, in modest single-center datasets, they should be interpreted cautiously and regarded as hypothesis-generating rather than definitive predictive models [9,10]. However, tree-based models are particularly prone to instability and overfitting when sample sizes are modest; therefore, in this study, the CHAID analysis was treated only as a descriptive, hypothesis-generating display and not as a validated prediction model.
Therefore, this study was conducted to describe the prevalence of sarcopenia and explore factors associated with sarcopenia among elderly outpatients with chronic musculoskeletal disorders at Thai Binh University of Medicine and Pharmacy Hospital. We hypothesized that, within this local outpatient setting, sarcopenia would be relatively frequent and would be associated with readily identifiable clinical and social factors, including older age, fall history, lower educational attainment, poorer sleep quality, and pain-related characteristics. Given the small, single-center sample, all inferential and subgroup analyses were planned and interpreted as exploratory and were intended to inform future, adequately powered studies rather than to provide definitive evidence for clinical prediction.
2. Materials and Methods
The study was conducted in accordance with the Declaration of Helsinki and was approved by the Ethics Council of Thai Binh University of Medicine and Pharmacy (Decision No. 855, dated 2 May 2024). Written informed consent was obtained from all participants before data collection.
2.1. Study Design and Setting
A hospital-based cross-sectional descriptive study with analysis was conducted from May 2024 to October 2025. The study was conducted in the Musculoskeletal Department at Thai Binh University of Medicine and Pharmacy Hospital, Vietnam. The design and reporting of the manuscript were reviewed against the STROBE recommendations for cross-sectional observational studies to improve transparency in participant selection, measurement procedures, bias control, and reporting of limitations. Because the study was performed in a selected outpatient musculoskeletal clinic, its findings are not intended to represent community-dwelling older adults or broader geriatric populations.
2.2. Participants and Sampling
The study included elderly outpatients who met the following criteria: (1) aged 60 years or older; (2) diagnosed with knee osteoarthritis according to the American College of Rheumatology criteria and/or chronic spinal pain; and (3) agreed to participate in the study. Patients were excluded if they had severe cognitive impairment, acute illness, severe functional limitations preventing physical performance testing, Parkinson’s disease or other neurological disorders likely to substantially affect gait or handgrip testing, maintenance dialysis treatment, implanted electrical devices, limb amputation, marked fluid retention, or other contraindications to body-composition assessment. Cognitive eligibility was screened by medical-record review, direct clinical interview, orientation questions, and the ability to understand the study information and provide informed consent; however, a formal Mini-Mental State Examination or Montreal Cognitive Assessment was not administered. Eligible participants were recruited consecutively during routine outpatient visits within the study period in order to reduce investigator-driven selection. The final analytical sample comprised 88 participants who completed all required assessments (mean age 70.5 ± 6.7 years; 69 women, 78.4%). Age was categorized as 60-65, 66-70, and >70 years for descriptive and exploratory analyses. Given the modest sample size and single-center design, the findings should be interpreted with caution, particularly with regard to multivariable modelling and the exploratory decision-tree analysis.
The minimum sample size was estimated using the single-population proportion formula:
n = Z2(1-α/2)
where Z = 1.96 for a two-sided 95% confidence level, p is the expected prevalence of sarcopenia, and d is the desired absolute precision.We used p = 0.648 based on the prevalence reported by Tran et al. among older adults in Vietnam [2], because this provided a recent local estimate from a Vietnamese older adult population. With d = 0.10, the minimum sample size was 88 participants. We acknowledge that this assumed prevalence may be higher than that expected in some outpatient or community settings and may not perfectly reflect elderly outpatients with chronic musculoskeletal disorders. Therefore, the sample-size calculation was used as a pragmatic reference for this exploratory single-center study. This calculation was designed for prevalence description only and did not provide sufficient power justification for multivariable inference or predictive modelling. In the final logistic model, there were 36 sarcopenia events and eight regression coefficients, corresponding to approximately 4.5 events per coefficient; this is below commonly recommended thresholds and increases the risk of sparse-data bias, unstable estimates, and wide confidence intervals.
2.3. Data Collection and Measurements
Data were collected through structured interviews and standardized clinical assessments by trained study staff using a pre-specified data collection form.
Demographic and clinical variables included age, sex, education level, occupation, living situation, body mass index, smoking, alcohol use, history of falls in the previous 12 months, sleep quality assessed using the Pittsburgh Sleep Quality Index (PSQI; range 0-21, with higher scores indicating poorer sleep quality), comorbidities, severity of knee osteoarthritis, chronic spinal pain severity, number of medications used, and frailty status assessed using the Fried phenotype criteria. Participants meeting three or more Fried criteria were classified as frail. Frailty was summarized descriptively and by coexistence with sarcopenia. It was not included in the primary multivariable model because only eight participants were frail, and the Fried phenotype includes components that overlap with sarcopenia assessment, particularly weakness and slowness. Including frailty in the same small regression model could therefore introduce sparse-data problems and potential overadjustment. Nevertheless, frailty was recognized as an overlapping but distinct geriatric construct that may act as a confounder, mediator, or coexisting syndrome.
Habitual physical activity, dietary intake, protein consumption, malnutrition risk, rehabilitation exposure, and inflammatory biomarkers were not measured because these items were not included in the original outpatient data-collection form. This omission was considered a major source of residual confounding when interpreting the adjusted associations.
Sarcopenia assessment: Sarcopenia was defined according to the Asian Working Group for Sarcopenia (AWGS 2019) criteria. Low muscle mass was defined as an appendicular skeletal muscle mass index <7.0 kg/m2 for men and <5.7 kg/m2 for women. Low muscle strength was defined as handgrip strength <28 kg for men and <18 kg for women. Low physical performance was defined as usual gait speed <1.0 m/s. Sarcopenia was diagnosed when low muscle mass coexisted with low muscle strength and/or low physical performance. Severe sarcopenia was defined as the concomitant presence of low muscle mass, low muscle strength, and low physical performance [3].
Muscle mass: Muscle mass was measured using bioelectrical impedance analysis with a multi-frequency device (InBody 770, InBody Co., Ltd., South Korea). Measurements were performed according to the manufacturer’s instructions under a standardized protocol. Participants wore light clothing, removed shoes, socks, and metallic accessories, and stood barefoot on the device electrodes. To reduce measurement variability, participants were assessed after resting briefly, were asked to avoid vigorous physical activity before the measurement, and were assessed without obvious acute illness or clinically apparent fluid imbalance. Participants with implanted electrical devices, limb amputation, or marked fluid retention were excluded from this assessment because these conditions could substantially affect BIA validity. Low muscle mass was defined as an appendicular skeletal muscle mass index <7.0 kg/m2 for men and <5.7 kg/m2 for women.
Muscle strength: Grip strength was assessed using a hydraulic hand dynamometer (Jamar Hydraulic Hand Dynamometer, Model J00105, USA). The device was checked and calibrated according to the manufacturer’s recommendations before data collection. Measurements were obtained in the standard seated position with the shoulder adducted, elbow flexed at approximately 90 degrees, forearm in a neutral position, and wrist in a comfortable neutral-to-slightly extended position. The dominant hand was selected according to the participant’s self-reported hand used for writing or eating. Each participant performed two maximal voluntary contractions with the dominant hand. Each contraction was sustained for approximately 3-5 seconds, with a rest interval of at least 30-60 seconds between trials to reduce fatigue. When pain, deformity, or recent injury prevented valid testing of the dominant hand, the contralateral hand was used and this was recorded by the assessor. The highest valid value from the repeated trials was used for analysis. Low muscle strength was defined as handgrip strength <28 kg for men and <18 kg for women.
Physical performance: Physical performance was evaluated by usual gait speed using a marked walkway and a handheld stopwatch. Participants were instructed to walk at their usual comfortable pace, and the same walkway and timing procedure were used throughout data collection. Gait speed was calculated in meters per second. Low physical performance was defined as usual gait speed <1.0 m/s.
Chronic spinal pain: Severity of chronic spinal pain was assessed using the Visual Analogue Scale (VAS, 0–10 points). For analysis, pain severity was categorized as mild/moderate (VAS < 7) and severe (VAS 7–10), consistent with the categories reported in the Results section [8]. This dichotomization was prespecified for clinical interpretability and to maintain adequate cell sizes in the small sample. VAS was not modeled as a continuous predictor because the analysis was exploratory and the available sample was insufficient to assess nonlinear pain-response relationships reliably.
Body mass index: BMI was initially coded as underweight (<18.5 kg/m2) versus non-underweight (≥18.5 kg/m2). The available analytic dataset did not retain separate overweight and obesity categories; therefore, sarcopenic obesity could not be evaluated. To avoid misclassification in reporting, the former label “normal BMI” was corrected to “non-underweight BMI,” and this limitation was explicitly acknowledged.
2.4. Bias Control
Several procedures were applied to reduce potential sources of bias. To limit selection bias, participants were recruited consecutively from eligible outpatient visits during the study period using predefined inclusion and exclusion criteria. To reduce measurement bias, sarcopenia components were assessed according to AWGS 2019 thresholds, using the same BIA device, handgrip dynamometer, and gait-speed procedure throughout data collection. Interview-based variables were collected using a structured questionnaire and predefined recall periods, particularly for history of falls in the previous 12 months. Potential confounding was addressed analytically by multivariable logistic regression including clinically relevant variables and variables showing potential bivariable associations. However, residual confounding is likely because physical activity, nutrition-related variables, rehabilitation exposure, inflammatory burden, pain duration, and detailed body-composition phenotypes were not comprehensively measured.
2.5. Statistical Analysis
All data were double-entered using EpiData 3.1 and analyzed using IBM SPSS Statistics for Windows, version 27.0.
Descriptive statistics were used to summarize participant characteristics according to sarcopenia status. Categorical variables are presented as frequencies and percentages, whereas continuous variables are presented as mean ± standard deviation (SD) for normally distributed data and median (range) for non-normally distributed data.
Bivariable analyses were first performed to assess factors associated with sarcopenia. Variables considered clinically relevant and those showing potential associations in bivariable analyses were then entered into a multivariable logistic regression model to estimate adjusted odds ratios (AORs) and 95% confidence intervals (CIs). Age group was coded as 60–65, 66–70, and >70 years, with 60–65 years as the reference category. Low education was coded as under primary school versus primary school or higher. Living situation (living with family versus living alone), occupation (other occupation versus farmer), history of falls (no versus yes), and chronic spinal pain severity (VAS < 7 versus 7–10) were entered as categorical variables. PSQI score was entered as a continuous variable, so the odds ratio represents the change in odds per 1-point increase in score. Because only 36 outcome events were available for eight model coefficients, the regression was considered exploratory. The term “independent predictor” was avoided; instead, findings are described as adjusted associations that may be affected by imprecision, residual confounding, and model instability. Formal resampling-based model stability assessment was not performed.
A chi-square automatic interaction detection (CHAID) decision tree was additionally constructed as an exploratory classification tool to identify hierarchical subgroups with different sarcopenia rates within the study sample. Because the tree was developed and evaluated in the same dataset, without cross-validation, bootstrap resampling, pruning validation, or external validation, apparent classification accuracy was removed from the manuscript and is not interpreted as predictive performance. The CHAID analysis is presented only as a descriptive, hypothesis-generating visualization. A p-value < 0.05 was considered statistically significant. No missing data were identified for variables included in the final analysis.
2.6. Ethical Considerations
Written informed consent was obtained from all participants prior to data collection. Participant confidentiality was protected by using study codes instead of personal identifiers, restricting access to the dataset to the research team, and reporting only aggregate findings.
3. Results
3.1. Participant Characteristics and Prevalence of Sarcopenia
The final sample included 88 participants with a mean age of 70.5 ± 6.7 years; 69 participants were women (78.4%). The results showed that 9.1% of the elderly patients were classified as frail according to the Fried criteria. Regarding sarcopenia status, the overall prevalence of sarcopenia was 40.9%, including 23.9% with sarcopenia and 17.0% with severe sarcopenia. In the binary sarcopenia category used for the primary analysis, women accounted for 28 of 36 participants with sarcopenia (77.8%) and 41 of 52 participants without sarcopenia (78.8%). The coexistence of frailty and sarcopenia was observed in 7.9% of the study population. Because only eight participants were frail, frailty was not entered into the primary regression model; instead, it was interpreted descriptively as a coexisting geriatric syndrome.

Table 1.
Frailty and binary sarcopenia status among participants, with female distribution (n = 88).
Table 1.
Frailty and binary sarcopenia status among participants, with female distribution (n = 88).
| Characteristics | n | % |
| Frailty status (Fried criteria) | ||
| Frail | 8 | 9.1 |
| Non-frail | 80 | 90.9 |
| Sarcopenia status(AWGS 2019) | ||
| No sarcopenia | 52 | 59.1 |
| Sarcopenia | 21 | 23.9 |
| Severe sarcopenia | 15 | 17.0 |
| Coexistence of frailty and sarcopenia | 7 | 7.9 |
3.2. Factors Associated with Sarcopenia
Table 2 presents age-group and sex distribution in relation to binary sarcopenia status. Women accounted for 20/28 participants aged 60-65 years (71.4%), 26/30 participants aged 66-70 years (86.7%), and 23/30 participants aged >70 years (76.7%). The proportion of women was similar in the sarcopenia and no-sarcopenia groups (77.8% vs. 78.8%). Sarcopenia became more frequent across increasing age groups, from 17.9% in the 60-65-year group to 66.7% in the >70-year group.
Table 3 presents additional demographic, lifestyle, and BMI characteristics according to sarcopenia status. A higher proportion of farmers was observed in the sarcopenia group than in the non-sarcopenia group (83.3% vs. 61.5%, p < 0.05). Other variables, including living situation, BMI category, smoking, and alcohol consumption, were not significantly associated with sarcopenia in the bivariable analysis.
With respect to clinical and pathological characteristics (Table 4), a history of falls was associated with sarcopenia. Among participants with sarcopenia, 36.1% reported a history of falls, compared with 11.5% among those without sarcopenia (p < 0.001). The severity of knee osteoarthritis and chronic spinal pain did not differ significantly between the two groups in the bivariable comparison.
The model included 36 sarcopenia events and eight regression coefficients (approximately 4.5 events per coefficient); therefore, estimates should be interpreted as exploratory adjusted associations rather than stable independent predictors. Multivariable logistic regression analysis identified four variables independently associated with sarcopenia. Age >70 years was the strongest associated factor, with a 9.0-fold higher odds of sarcopenia compared with the 60–65-year age group (AOR = 9.00; 95% CI: 2.40–33.60; p < 0.01). History of falls (AOR = 6.33; 95% CI: 2.77–14.45; p < 0.001), low education level (AOR = 2.86; 95% CI: 1.46–5.61; p < 0.01), and higher PSQI score (AOR = 1.16; 95% CI: 1.02–1.32; p = 0.03) were also independently associated with sarcopenia. The wide confidence intervals, particularly for age and fall history, indicate imprecision and possible coefficient instability. Other variables, including occupation, living situation, and chronic spinal pain severity, did not remain statistically significant after adjustment.
Table 5.
Multivariable logistic regression analysis of factors associated with sarcopenia (n = 88).
| Independent variables | Category | AOR | 95%CI | p-value |
| Age group | 60–65 years (Ref.) | 1.00 | - | - |
| 66–70 years | 2.4 | 0.7–8.4 | >0.05 | |
| > 70 years | 9.00 | 2.40–33.60 | <0.01 | |
| History of Falls | No (Ref.) | 1.00 | - | - |
| Yes | 6.33 | 2.77–14.45 | <0.001 | |
|
Low education (under primary school) |
No (Ref.) | 1.00 | - | - |
| Yes | 2.86 | 1.46–5.61 | <0.01 | |
| PSQI score | ||||
| Per 1-point increase | 1.16 | 1.02–1.32 | 0.03 | |
| Living Situation | With Family (Ref.) | 1.00 | - | - |
| Living alone | 0.4 | 0.1–1.9 | >0.05 | |
| Occupation | Other occupation (Ref.) | 1.00 | - | - |
| Farmer | 0.4 | 0.1–1.2 | >0.05 | |
| Chronic spinal pain | None/Mild (Ref.) | 1.00 | - | - |
| Severe pain | 0.4 | 0.1–2.1 | >0.05 |
AOR: adjusted odds ratio; CI: confidence interval; PSQI: Pittsburgh Sleep Quality Index.
Figure 1.
Forest plot of adjusted odds ratios for factors associated with sarcopenia in the exploratory multivariable logistic regression model.
Figure 1.
Forest plot of adjusted odds ratios for factors associated with sarcopenia in the exploratory multivariable logistic regression model.
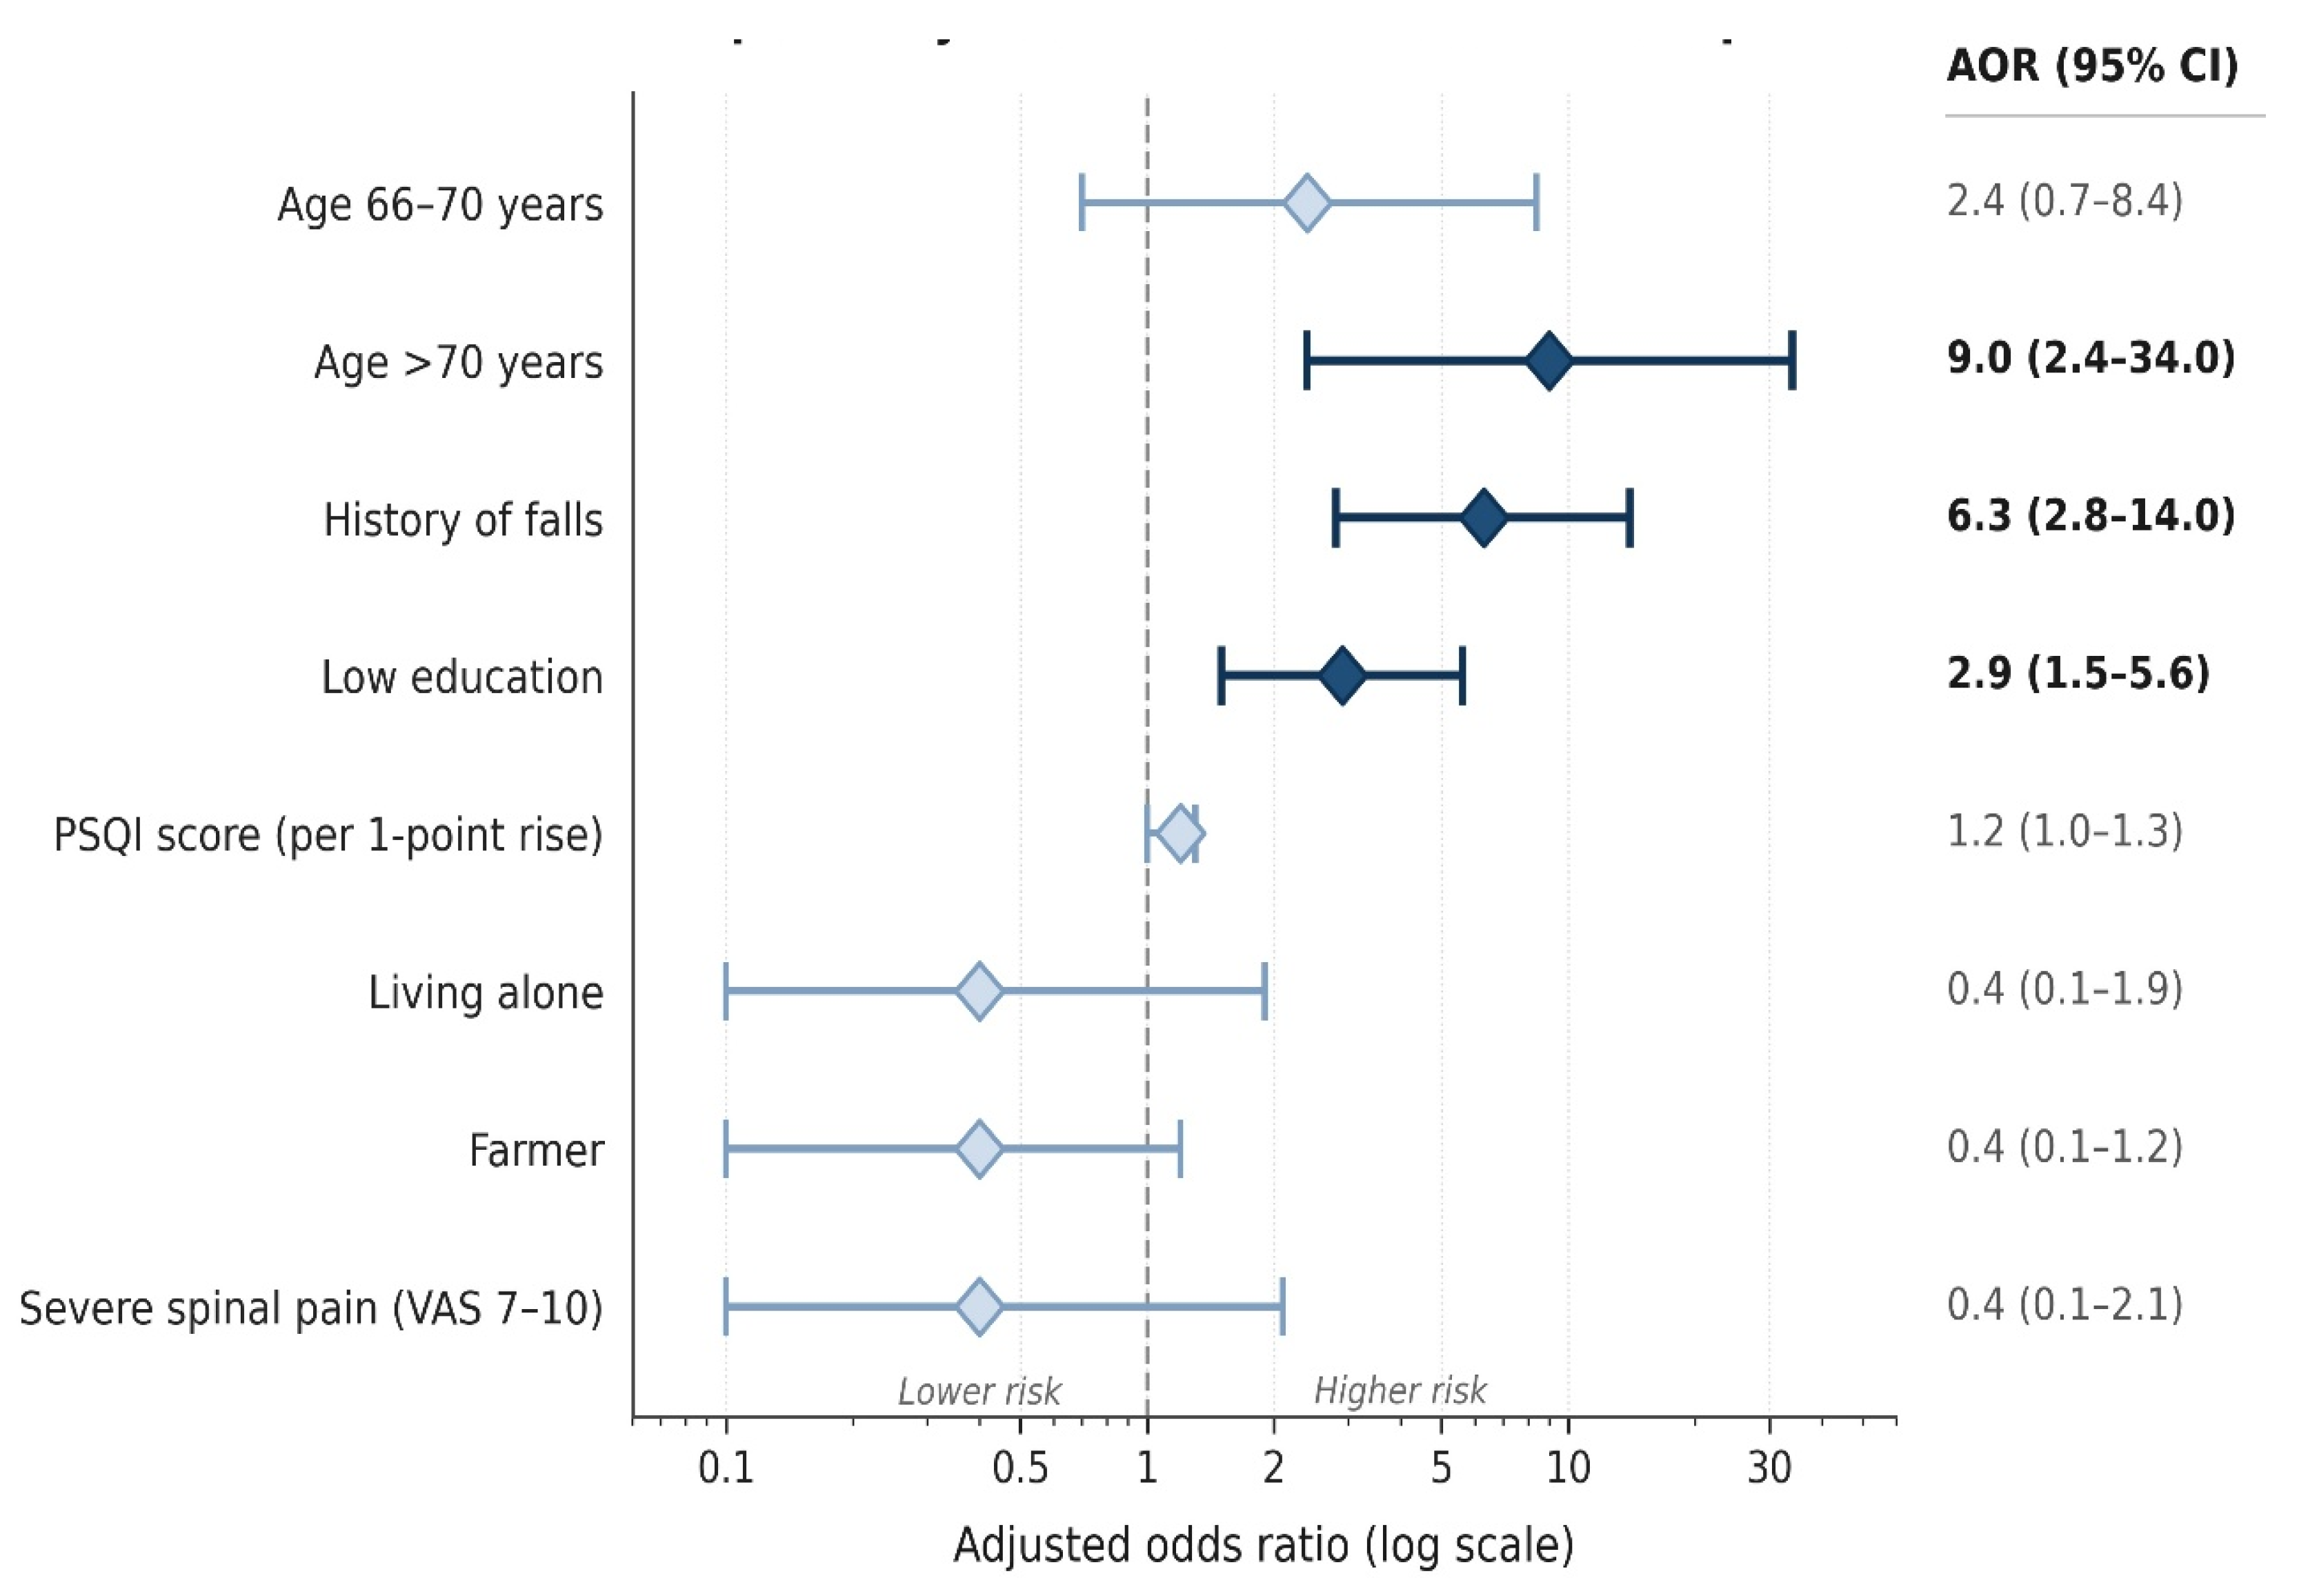
Figure 2.
Exploratory CHAID decision tree for sarcopenia status among elderly participants.
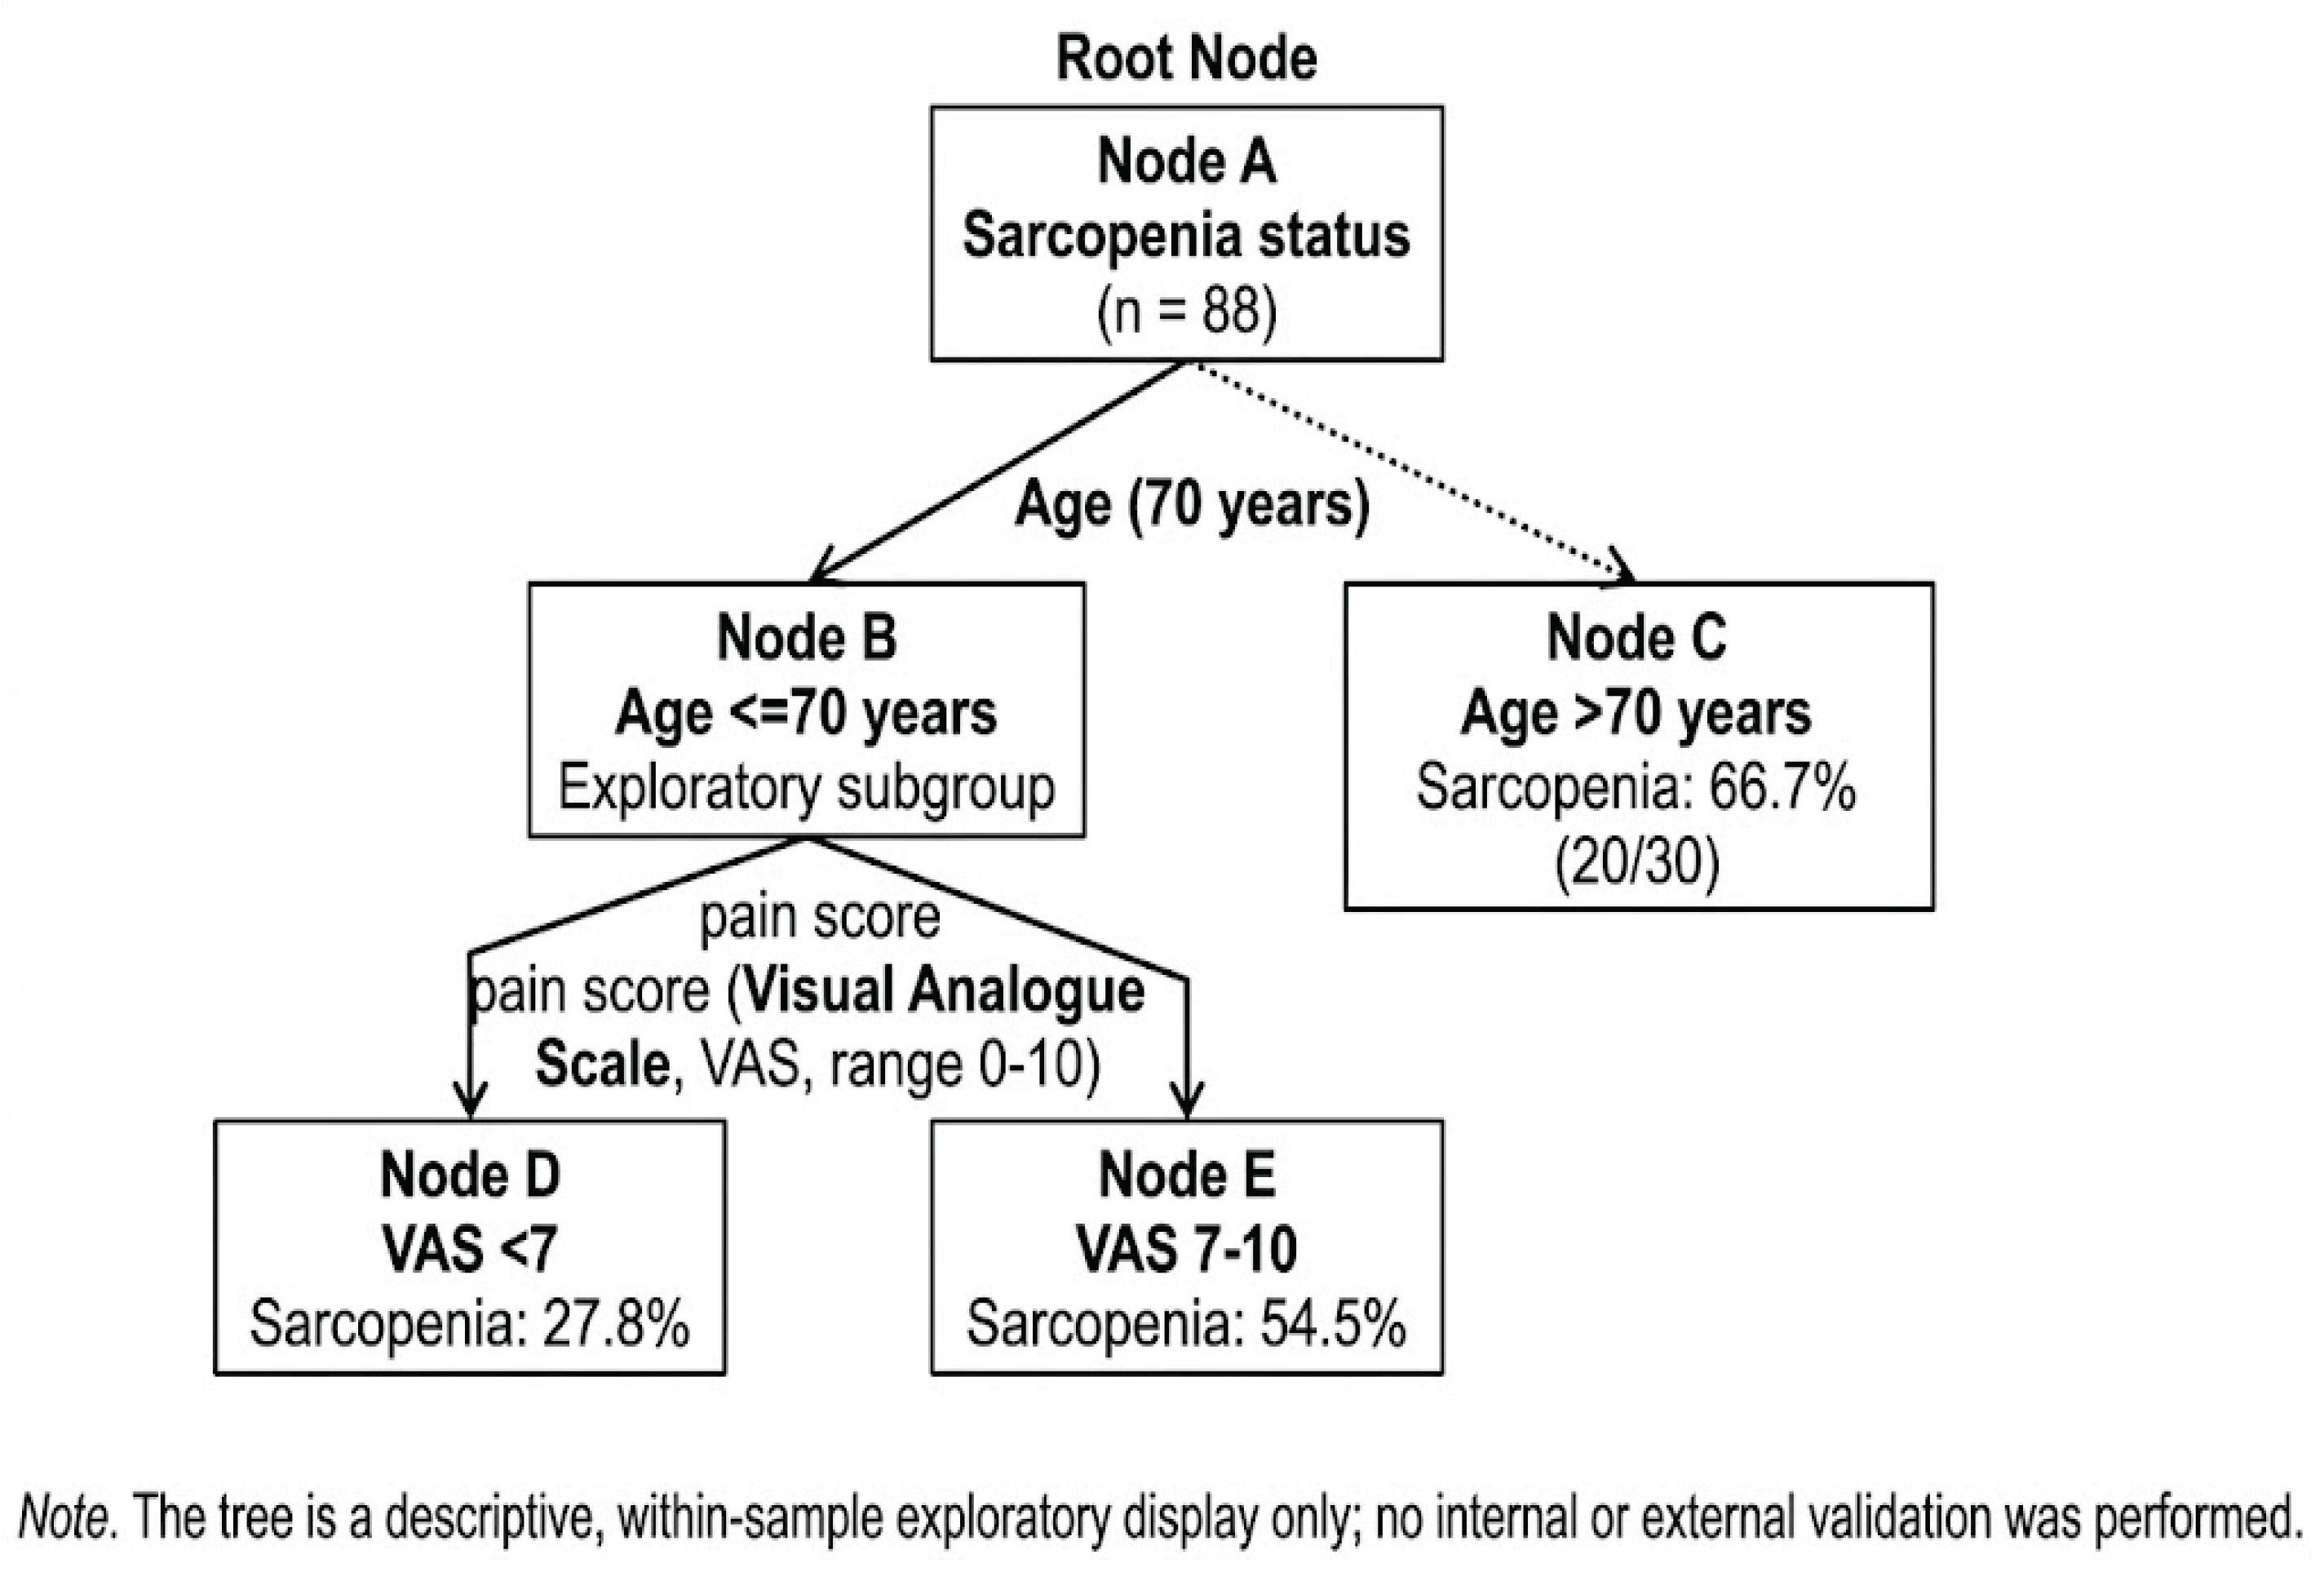
The CHAID decision tree identified age group as the primary splitter. Among participants aged ≤70 years, chronic spinal pain severity further classified subgroups with different sarcopenia prevalence. In this subgroup, severe pain was associated with a higher proportion of sarcopenia than mild/moderate pain (54.5% vs. 27.8%). Because the model was developed and assessed in the same dataset without cross-validation, bootstrap resampling, pruning validation, or an external validation sample, the CHAID findings should be interpreted only as descriptive subgroup patterns rather than predictive performance or clinical decision rules.
4. Discussion
In this hospital-based cross-sectional study, 40.9% of elderly outpatients with chronic musculoskeletal disorders met the AWGS 2019 criteria for sarcopenia, including 17.0% with severe sarcopenia. This finding should be interpreted as a single-center descriptive estimate rather than a population prevalence. Nevertheless, it highlights a clinically important burden of low muscle mass and function among symptomatic musculoskeletal outpatients. The frailty prevalence in our sample (9.1%) was lower than that reported among elderly Vietnamese inpatients [11], although direct comparison should be interpreted cautiously because of differences in clinical setting and case mix. Our observed sarcopenia prevalence was lower than the 54.7% reported among older patients attending geriatric clinics in Vietnam using the AWGS 2019 criteria [12], but substantially higher than the 10.0% observed in Thai community-dwelling elderly outpatients [13]. It was broadly comparable to the 35.5% prevalence reported in Asian women awaiting primary total knee arthroplasty for advanced knee osteoarthritis, another selected musculoskeletal population [14]. In addition, a recent systematic review and meta-analysis applying the AWGS 2019 criteria estimated an overall prevalence of 16.5% among community-dwelling Asian adults aged 60 years and older [15]. Taken together, these comparisons suggest that sarcopenia may cluster in clinical groups characterized by pain, mobility limitation, and functional vulnerability rather than being determined by chronological age alone.
Age >70 years was the strongest factor associated with sarcopenia in the multivariable model. This finding is clinically plausible because advancing age is accompanied by progressive declines in muscle mass, neuromuscular reserve, anabolic responsiveness, and physical function [3,4]. However, the magnitude of the association should not be overinterpreted because the confidence interval was wide and the model had a low events-per-coefficient ratio. In an outpatient musculoskeletal clinic, older age may also interact with pain-related activity restriction, comorbidities, and reduced reserve after acute illness or falls.
History of falls was also strongly associated with sarcopenia. This association may be bidirectional. Reduced muscle strength and impaired physical performance can increase instability and fall risk, whereas falls may lead to fear of movement, reduced activity, and subsequent deconditioning [4]. Clinically, this finding is important because fall history is easy to ascertain during routine consultation and may identify patients who require both sarcopenia assessment and fall-risk management. Nevertheless, this study cannot determine whether falls preceded sarcopenia or occurred as a consequence of muscle dysfunction. In addition, physical activity, rehabilitation exposure, and environmental fall-risk factors were not measured and could confound this association.
Low educational attainment and poorer sleep quality also retained associations in the exploratory model. These findings may reflect broader social and behavioral pathways, including health literacy, access to preventive exercise and nutrition counselling, recognition of functional decline, pain perception, and rehabilitation adherence. Because nutritional intake, protein consumption, malnutrition risk, and physical activity were not measured, these associations should be considered adjusted correlations rather than evidence of independent causal relationships.
Although chronic spinal pain severity did not remain statistically significant in the adjusted logistic regression model, it emerged as a second-level classifier in the exploratory CHAID tree among participants aged <=70 years. This pattern suggests that pain may still be relevant within specific age-defined subgroups, even if it is not an overall adjusted correlate in the regression model. The mechanistic interpretation should remain cautious. Pain-related activity avoidance and disuse are plausible background mechanisms, but this study did not measure physical activity, kinesiophobia, inflammatory biomarkers, or pain duration. Therefore, explanations involving inflammation or pain-related muscle catabolism are presented only as hypothetical context and not as study-supported evidence. Previous studies have discussed links between chronic musculoskeletal pain, kinesiophobia, and muscle changes [16,17].
The coexistence of frailty and sarcopenia observed in our sample is also clinically plausible, as previous studies have shown that these two geriatric syndromes frequently overlap in older medical patients [18]. Frailty was not included in the primary regression model because only eight participants were frail and because the Fried phenotype includes weakness and slowness, which overlap directly with sarcopenia components. This analytic decision reduces the risk of sparse-data bias and overadjustment, but it also limits the ability to distinguish whether frailty acts as a confounder, mediator, or coexisting syndrome. Future studies should measure frailty, sarcopenia, disability, and physical activity using a prespecified conceptual framework and larger samples.
The practical implication of the present findings is therefore limited but still relevant. Musculoskeletal outpatient clinics may represent a feasible place to consider simple sarcopenia case-finding, particularly when older patients report falls or functional decline. However, the present results should not be used to create a formal prediction algorithm, scoring system, or clinical decision rule. Any targeted case-finding strategy should be validated in larger, multicenter samples and should incorporate physical activity, nutritional status, rehabilitation history, and broader geriatric assessment.
External validity is limited. The study was conducted in a single musculoskeletal outpatient department in Northern Vietnam, with a predominantly female sample, a high proportion of farmers, and a high burden of severe chronic musculoskeletal disease. Therefore, the findings cannot be generalized to community-dwelling older adults, broader geriatric populations, or other healthcare settings without further confirmation.
This study also has important limitations. First, the cross-sectional design precludes causal inference, and the observed associations should not be interpreted as evidence of temporal or causal relationships. Second, the sample size was relatively modest, especially for multivariable analysis and exploratory model development, and the model may therefore be unstable or overfitted. Only 36 sarcopenia events were available for eight regression coefficients, yielding approximately 4.5 events per coefficient; this increases the possibility of model overfitting, unstable coefficients, and inflated odds ratios. Third, the study was conducted at a single center using outpatient recruitment, which limits generalizability. For this reason, apparent CHAID classification accuracy was removed and the tree is reported only as a descriptive visualization. Fourth, residual confounding is a major concern because habitual physical activity, dietary intake, protein consumption, malnutrition risk, rehabilitation status, inflammatory biomarkers, pain duration, and detailed body-composition phenotypes were not measured. The absence of physical activity assessment is particularly important because physical inactivity may mediate or confound relationships among chronic pain, falls, sleep quality, gait speed, frailty, and sarcopenia. Fifth, BMI was available only as underweight versus non-underweight, so overweight, obesity, and sarcopenic obesity could not be examined separately. Sixth, sex-specific differences in sarcopenia prevalence and factors associated with sarcopenia were not analyzed because the number of male participants was small (n = 19, 21.6%). Although sex distribution was described, stratified regression or interaction analyses by sex would have produced statistically unstable and imprecise estimates. Finally, no external validation dataset was available, and the CHAID model was evaluated only within the same sample used for development. Future multicenter longitudinal studies with larger and more sex-balanced samples, fuller measurement of potential confounders including physical activity and nutritional status, and formal internal/external validation are needed before such models can be considered for broader clinical application.
Despite these limitations, the study provides local clinical data on sarcopenia among elderly Vietnamese outpatients with chronic musculoskeletal disorders using AWGS 2019 criteria. Its main value is descriptive and hypothesis-generating. Future multicenter longitudinal studies with larger samples, fuller measurement of potential confounders including physical activity and nutrition, and formal internal/external validation are needed before such models can be considered for broader clinical application.
5. Conclusions
Sarcopenia was common among elderly outpatients with chronic musculoskeletal disorders in this single-center study. Older age, history of falls, low educational attainment, and higher PSQI score were independently associated with sarcopenia. These findings suggest that musculoskeletal outpatient clinics may provide a practical setting in which patients at higher likelihood of sarcopenia can be prioritized for further assessment, particularly those aged >70 years, those reporting falls, and those with poorer sleep or social vulnerability. However, because of the cross-sectional design, modest sample size, low events-per-coefficient ratio, unmeasured physical activity and nutrition-related confounding, limited frailty integration, and lack of model validation, the results should be interpreted cautiously and should not be translated into a formal risk-stratification algorithm without confirmation in larger prospective studies. The exploratory CHAID analysis additionally suggested that chronic spinal pain severity may help stratify sarcopenia prevalence among participants aged <=70 years. However, because of the cross-sectional design, modest sample size, absence of physical-activity assessment, underrepresentation of men, and lack of external validation, the results should be interpreted cautiously and confirmed in larger prospective studies before being translated into a formal prediction algorithm.
Author Contributions
Conceptualization, Nguyen The Diep and Tien Van Nguyen; methodology, Nguyen The Diep and Tien Van Nguyen; investigation, formal analysis, data curation, Nguyen Trong Duynh; writing—original draft preparation, Nguyen The Diep and Tien Van Nguyen; writing—review and editing, Tien Van Nguyen and Nguyen Trong Duynh. All authors have read and agreed to the published version of the manuscript.
Funding
This research received no external funding.
Institutional Review Board Statement
The study was conducted in accordance with the Declaration of Helsinki and approved by the Ethics Council of Thai Binh University of Medicine and Pharmacy (Decision No. 855, 2 May 2024).
Informed Consent Statement
Informed consent was obtained from all subjects involved in the study.
Data Availability Statement
The datasets used and/or analyzed during the current study are available from the corresponding author on reasonable request.
Acknowledgments
The authors thank all study participants and the clinical staff of Thai Binh University of Medicine and Pharmacy Hospital for their support during data collection.
Conflicts of Interest
The authors declare no conflicts of interest.
Abbreviations
The following abbreviations are used in this manuscript:
| AOR | Adjusted odds ratio |
| AWGS | Asian Working Group for Sarcopenia |
| BIA | Bioelectrical impedance analysis |
| BMI | Body mass index |
| CHAID | Chi-square Automatic Interaction Detection |
| CI | Confidence interval |
| KOA | Knee osteoarthritis |
| PSQI | Pittsburgh Sleep Quality Index |
| SD | Standard deviation |
| SE | Standard error |
| VAS | Visual Analogue Scale |
References
- United Nations Population Fund (UNFPA) Viet Nam; General Statistics Office of Viet Nam. The 2019 Viet Nam Population and Housing Census: Completed Results; Statistical Publishing House: Hanoi, 2021. [Google Scholar]
- Tran, G.H.; Ngo, L.P.; Do, A.T.; et al. Prevalence of sarcopenia and associated factors among older adults in Phong Dien district, Can Tho city, Vietnam, 2024. Can. Tho J. Med. Pharm. 2025, (83), 184–190. [Google Scholar] [CrossRef]
- Chen, L.K.; Woo, J.; Assantachai, P.; et al. Asian Working Group for Sarcopenia: 2019 Consensus Update on Sarcopenia Diagnosis and Treatment. J. Am. Med. Dir. Assoc. 2020, 21(3), 300–307.e2. [Google Scholar] [CrossRef]
- Laskou, F.; Fuggle, N.R.; Patel, H.P.; et al. Associations of osteoporosis and sarcopenia with frailty and multimorbidity among participants of the Hertfordshire Cohort Study. J. Cachexia Sarcopenia Muscle 2022, 13, 220–229. [Google Scholar] [CrossRef]
- Sakai, Y.; Matsui, H.; Ito, S.; et al. Sarcopenia in elderly patients with chronic low back pain. Osteoporos. Sarcopenia 2017, 3, 195–200. [Google Scholar] [CrossRef] [PubMed]
- Liu, S.; Du, Z.; Song, L.; et al. Factors, characteristics and influences of the changes of muscle activation patterns for patients with knee osteoarthritis: a review. J. Orthop. Surg. Res. 2025, 20, 112. [Google Scholar] [CrossRef] [PubMed]
- Nguyen, A.T.; Nguyen, L.H.; Nguyen, T.X.; et al. Frailty Prevalence and Association with Health-Related Quality of Life Impairment among Rural Community-Dwelling Older Adults in Vietnam. Int. J. Env. Res. Public Health 2019, 16(20), 3834. [Google Scholar] [CrossRef]
- Nguyen, T.D.; Nguyen, T.V.; Nguyen, T.D.; et al. Risk of falls in the older adult at Thai Binh Medical University Hospital and its related factors in 2024. Front Public Health 2025, 13, 1609745. [Google Scholar] [CrossRef]
- Song, Y.Y.; Lu, Y. Decision tree methods: applications for classification and prediction. Shanghai Arch. Psychiatry 2015, 27(2), 130–135. [Google Scholar] [CrossRef] [PubMed]
- Loh, W.Y. Classification and regression trees. Wiley Interdiscip. Rev. Data Min. Knowl. Discov. 2011, 1(1), 14–23. [Google Scholar] [CrossRef]
- Ngo, H.L.; Huynh, T.H.; Nguyen, T.H.; Pham, H.L.; Lam, P.T.; Pham, H.K. Study of the rate of frailty and some related factors in elderly inpatients at Can Tho University of Medicine and Pharmacy Hospital. CTJUMP 2023, (67), 56–63. [Google Scholar] [CrossRef]
- Nguyen, T.N.; Nguyen, T.N.; Nguyen, A.T.; Nguyen, T.X.; Nguyen, H.T.T.; Nguyen, T.T.H.; et al. Prevalence of sarcopenia and its associated factors in patients attending geriatric clinics in Vietnam: a cross-sectional study. BMJ Open. 2020, 10(9), e037630. [Google Scholar] [CrossRef] [PubMed]
- Therakomen, V.; Petchlorlian, A.; Lakananurak, N. Prevalence and risk factors of primary sarcopenia in community-dwelling outpatient elderly: a cross-sectional study. Sci. Rep. 2020, 10, 19551. [Google Scholar] [CrossRef] [PubMed]
- Park, D.; Park, C.J.; Jung, M.G.; Choi, Y.H.; Park, K.S.; Koh, H.S. High prevalence of sarcopenia in Asian female patients awaiting primary total knee arthroplasty: Application of updated diagnostic tools from the Asian Working Group for Sarcopenia. J. Orthop. Surg. 2022, 30(2), 10225536221113034. [Google Scholar] [CrossRef] [PubMed]
- Weng, S.E.; Huang, Y.W.; Tseng, Y.C.; Peng, H.R.; Lai, H.Y.; Akishita, M.; et al. The Evolving Landscape of Sarcopenia in Asia: A systematic review and meta-analysis following the 2019 Asian Working Group for Sarcopenia (AWGS) diagnostic criteria. Arch. Gerontol. Geriatr. 2025, 128, 105596. [Google Scholar] [CrossRef] [PubMed]
- Tandon, S.; et al. Kinesiophobia and its association with muscle atrophy in patients with chronic musculoskeletal pain: A systematic review. J. Rehabil. Med. 2020, 52(4), jrm00045. [Google Scholar] [CrossRef]
- Visser, M.; et al. Relationship of Interleukin-6 and Tumor Necrosis Factor-alpha with Muscle Mass and Muscle Strength in Elderly Men and Women: The Health ABC Study. J. Gerontol. A Biol. Sci. Med. Sci. 2002, 57(5), M326–M332. [Google Scholar] [CrossRef] [PubMed]
- Nygaard, H.; Kamper, R.S.; Ekmann, A.; et al. Co-Occurrence of Sarcopenia and Frailty in Acutely Admitted Older Medical Patients: Results from the Copenhagen PROTECT Study. J. Frailty Aging 2024, 13, 91–97. [Google Scholar] [CrossRef] [PubMed]
Table 2.
Age-group and sex distribution according to binary sarcopenia status (n = 88).
| Characteristic | Total, n (%) | Female, n (% within row) | Male, n (% within row) | Sarcopenia, n (% within row) | No sarcopenia, n (% within row) |
| Age group | |||||
| 60-65 years | 28 (31.8) | 20 (71.4) | 8 (28.6) | 5 (17.9) | 23 (82.1) |
| 66-70 years | 30 (34.1) | 26 (86.7) | 4 (13.3) | 11 (36.7) | 19 (63.3) |
| >70 years | 30 (34.1) | 23 (76.7) | 7 (23.3) | 20 (66.7) | 10 (33.3) |
| Sarcopenia status | |||||
| No sarcopenia | 52 (59.1) | 41 (78.8) | 11 (21.2) | - | - |
| Sarcopenia, including severe sarcopenia | 36 (40.9) | 28 (77.8) | 8 (22.2) | - | - |
| Total | 88 (100.0) | 69 (78.4) | 19 (21.6) | 36 (40.9) | 52 (59.1) |
Note. Percentages in the female and male columns were calculated within each age group or sarcopenia-status row. Percentages in the sarcopenia and no-sarcopenia columns were calculated within each age group.
Table 3.
Additional demographic, lifestyle, and BMI characteristics according to sarcopenia status (n = 88).
Table 3.
Additional demographic, lifestyle, and BMI characteristics according to sarcopenia status (n = 88).
| Characteristics | Sarcopenia (n = 36) | No sarcopenia (n = 52) | p-value |
| n (%) | n (%) | ||
| Occupation | <0.05 | ||
| Farmer | 30 (83.3) | 32 (61.5) | |
| Others (civil servant, freelance, etc.) | 6 (16.7) | 20 (38.5) | |
| Living situation | >0.05 | ||
| Living alone | 6 (16.7) | 5 (9.6) | |
| Living with relatives | 30 (83.3) | 47 (90.4) | |
| Body mass index | >0.05 | ||
| Underweight (<18.5 kg/m2) | 8 (22.2) | 13 (25.0) | |
| Non-underweight (≥18.5 kg/m2)* | 28 (77.8) | 39 (75.0) | |
| Lifestyle habits | |||
| Smoking (yes) | 3 (8.3) | 4 (7.7) | >0.05 |
| Alcohol consumption (yes) | 7 (19.4) | 9 (17.3) | >0.05 |
*The BMI category was corrected from “normal” to “non-underweight” because the available analytic dataset did not retain separate overweight and obesity categories.
Table 4.
Clinical and pathological characteristics according to sarcopenia status (n = 88).
| Clinical and pathological characteristics | Sarcopenia (n = 36) | No sarcopenia (n = 52) | p-value |
| n (%) | n (%) | ||
| Hypertension | >0.05 | ||
| Yes | 9 (25.0) | 17 (32.7) | |
| No | 27 (75.0) | 35 (67.3) | |
| Diabetes mellitus | >0.05 | ||
| Yes | 3 (8.3) | 8 (15.4) | |
| No | 33 (91.7) | 44 (84.6) | |
| Chronic kidney disease | >0.05 | ||
| Yes | 3 (8.3) | 8 (15.4) | |
| No | 33 (91.7) | 44 (84.6) | |
| Severity of knee osteoarthritis | >0.05 | ||
| Grade 3-4 (severe) | 28 (77.8) | 38 (73.1) | |
| Grade 1-2 (mild/moderate) | 8 (22.2) | 14 (26.9) | |
| Chronic spinal pain severity | >0.05 | ||
| Severe pain (VAS 7-10) | 27 (75.0) | 39 (75.0) | |
| Mild/moderate pain (VAS <7) | 9 (25.0) | 13 (25.0) | |
| History of falls | <0.001 | ||
| Yes | 13 (36.1) | 6 (11.5) | |
| No | 23 (63.9) | 46 (88.5) |
Disclaimer/Publisher’s Note: The statements, opinions and data contained in all publications are solely those of the individual author(s) and contributor(s) and not of MDPI and/or the editor(s). MDPI and/or the editor(s) disclaim responsibility for any injury to people or property resulting from any ideas, methods, instructions or products referred to in the content. |
© 2026 by the authors. Licensee MDPI, Basel, Switzerland. This article is an open access article distributed under the terms and conditions of the Creative Commons Attribution (CC BY) license.
Copyright: This open access article is published under a Creative Commons CC BY 4.0 license, which permit the free download, distribution, and reuse, provided that the author and preprint are cited in any reuse.


