
Submitted:
22 May 2026
Posted:
25 May 2026
You are already at the latest version
Abstract
Complete neighbourhoods — places where residents can meet most daily needs on foot — have become a cornerstone of healthy and sustainable urban planning. Yet most assess-ment frameworks were calibrated for dense metropolitan environments, leaving rural and peri-urban municipalities without operational tools suited to their territorial realities. This article presents MilieuxVie, an open-source, browser-based interactive mapping applica-tion developed for the Laurentides health region of Québec (76 municipalities, 11 land-based unorganised territories, 2 indigenous territories and 4 aquatic administrative units; 93 territorial units in total; ~680,000 inhabitants). The tool evaluates the spatial ac-cessibility of 12 service categories drawn from the Vivre en Ville (2026) com-plete-neighbourhood framework and OpenStreetMap data, using residential parcels from the provincial property assessment roll (MAMH 2026) as origin points and weighting re-sults by number of dwelling units. Three adaptive radius tiers (urban, intermediate, rural) based on municipal area correct for the systematic under-performance of standard thresholds in low-density settings. A dedicated Urban Perimeter mode further disaggre-gates analysis to sub-municipal built-up zones, aligning the tool with Québec's provincial planning orientations (OGAT). Gap analysis outputs identify which service types fall be-low the 70 % coverage target, enabling evidence-based prioritization for elected officials and planners. Results illustrate the scope of accessibility deficits across the region and highlight the analytical limits of uniform distance thresholds when applied beyond met-ropolitan contexts. The tool is freely available and requires no software installation, mak-ing it directly deployable by local planning offices.
Keywords:
complete neighbourhoods
; accessibility
; rural planning
; WebGIS
; OpenStreetMap
; public health
; Québec
; territorial planning
; Vivre en Ville
1. Introduction
The spatial organisation of daily life — whether residents can reach food, healthcare, schools, parks and transit by walking — has become a central concern in public health, urban planning and climate policy [1,2]. Under the umbrella of the "complete neighbourhood" concept [3], a growing body of research links service proximity to physical activity levels [4,5,6], reduced automobile dependence [7], social cohesion [6,8,9] and health equity [10]. In parallel, the popularisation of the 15-minute city concept [11] has renewed political interest in proximity-based planning and catalysed the adoption of measurable neighbourhood targets in cities around the world.
Most of the available methodological frameworks for assessing complete neighbourhoods, however, were developed in, and calibrated for, dense metropolitan environments [12,13,14]. When applied to rural or peri-urban contexts, standard walking-distance thresholds — typically 400 to 800 m for daily services — systematically underestimate actual accessibility, producing uniformly poor scores that fail to differentiate meaningfully between territories and offer little guidance for local planning decisions [15,16,17,18,19,20]. This methodological gap is particularly consequential in Québec, where the Orientations gouvernementales en aménagement du territoire (OGAT) [21] frame provincial land-use policy around the consolidation of urban perimeters (périmètres d'urbanisation, PU) in municipalities of all size classes, yet operational tools for measuring the completeness of those perimeters remain scarce outside major urban centres.
Several open-source tools exist for related purposes. The Walk Score API [22] provides point-level walkability estimates but does not disclose its methodology, requires payment for bulk use, and does not distinguish rural contexts. Existing isochrone/walkshed tools in research routinely intersect reachability polygons with points (services) and lines or grids (population), then aggregate these to various spatial units. Several workflows already summarize results by districts, towns, or hexagonal tiles, and tool architectures (e.g., ISOGA, CityChrone, CTA) are explicitly built to join isochrones with external socio-spatial datasets. While out-of-the-box APIs like OpenRouteService or Valhalla focus on geometry, the literature shows clear, replicable patterns for aggregating service coverage up to municipal or sub-municipal units using GIS operations on top of those isochrones [23]. Tools specifically designed for Québec's institutional context — cross-referencing provincial property assessment data with planning unit boundaries — are largely absent from the literature.
This paper describes MilieuxVie, an interactive web mapping application developed at the Direction de santé publique of the CISSS des Laurentides as part of knowledge-transfer activities targeting elected municipal officials and land-use planners in the Laurentides health region. The tool operationalises the 15-parameter complete-neighbourhood framework of Vivre en Ville [3] using freely available spatial data (OpenStreetMap via the Overpass API) and the provincial residential property roll (MAMH 2026), offers adaptive radius thresholds calibrated to three territorial types, and generates interpretable gap analyses at both the municipal and urban-perimeter levels. The application is distributed as a single self-contained HTML file requiring no installation, no server infrastructure, and no proprietary data.
The remainder of the article is structured as follows. Section 2 reviews the conceptual and methodological background. Section 3 describes the study area, data and technical architecture. Section 4 presents the accessibility assessment methodology in detail. Section 5 illustrates the tool's outputs for the Laurentides region. Section 6 discusses the results in the context of existing frameworks and outlines directions for future development. Section 7 concludes.
2. Background
2.1. Complete Neighbourhoods and the 15-Minute City
The concept of a complete neighbourhood refers to a residential environment in which residents can satisfy their fundamental daily needs within a short distance of their home, regardless of their income or mobility status [3,24,25]. While precursors can be found in early-twentieth-century new urbanism and the Transit-Oriented Development literature [26], the concept gained mainstream policy visibility through Moreno et al.'s formalisation of the 15-minute city [11,27,28], subsequently adopted as a planning objective in Paris, Melbourne, and a growing number of C40 member cities.
In the North American context, Boisjoly et al. [28] proposed a "30-minute city" adaptation acknowledging lower residential densities and greater transit travel times, arguing that polycentric metropolitan structures require a larger spatial envelope. Vivre en Ville [3] translated this concept into an operational 15-parameter framework for Québec municipalities, distinguishing three categories of attributes: housing diversity, proximity destinations, and mobility infrastructure. For each destination type, the framework specifies a target walking radius calibrated to an assumed urban density of 25–30 households per hectare.
2.2. Accessibility Measurement: Methods and Limitations
Spatial accessibility to services can be measured along a spectrum from simple straight-line (Euclidean) buffers to network-based travel-time isochrones and gravity-model catchment areas [29]. While network-based approaches are methodologically superior, their computational demands and reliance on complete street-network data limit their applicability at the scale of a health region with 93 territorial units (76 municipalities and 17 non-municipal entities), several of which lack complete OSM road coverage [30]. Moreover, the difference between Euclidean and network distances tends to diminish in grid-like street layouts common in Québec's small urban centres [31].
A fundamental methodological choice concerns the origin point of accessibility calculations. Many studies use evenly spaced population grids or census dissemination area centroids, which may misrepresent the actual spatial distribution of residents — particularly in municipalities with concentrated settlement patterns surrounded by large agricultural or forested areas [28]. Using geocoded residential parcels as origins, weighted by dwelling unit count, provides a more accurate representation of the population actually exposed to (or deprived of) service proximity.
The applicability of urban accessibility thresholds to rural settings has received increasing attention. Apparicio et al. [32] documented systematic under-performance of proximity indicators in low-density suburbs. Authors such as Lister [33] have argued for context-sensitive threshold adaptation as a prerequisite for meaningful rural–urban comparison. No consensus has emerged on the appropriate scaling factors, however, and most operational tools continue to apply uniform thresholds.
2.3. Volunteered Geographic Information and OpenStreetMap in Planning Contexts
OpenStreetMap (OSM) has become a primary data source for service-proximity research, particularly where authoritative point-of-interest datasets are unavailable or commercially restricted [34]. Studies have generally found that OSM completeness is sufficient for most amenity categories in urban areas but declines substantially in rural and peri-urban municipalities [35,36]. This unevenness constitutes a significant limitation for cross-territorial comparisons, as a low accessibility score may reflect genuine service deficits or simply incomplete OSM coverage.
The Overpass API provides programmatic query access to the full OSM database, enabling targeted extraction of service features within user-defined geographic areas [37]. Recent work has demonstrated the feasibility of regional-scale Overpass queries encompassing hundreds of square kilometres in sub-minute query times, making real-time browser-based accessibility calculation technically viable [38].
3. Study Area, Data and Technical Architecture
3.1. Study Area
The study area is the health region of the Laurentides (Québec, Canada), comprising 93 local territorial units organised into 8 regional county municipalities (MRCs) and covering approximately 21,559 km2. Following the MELCCFP territorial classification (field MUS_DE_IND), the 93 units comprise 76 municipalities, 15 unorganised territories (territoires non organisés, TNOs — of which 4 are purely aquatic administrative units with no land area, and 11 are land-based TNOs), and 2 indigenous territories (Kanesatake Mohawk Territory and Doncaster Reserve). The population of approximately 680,000 is distributed very unevenly: the southern tier (MRCs of Deux-Montagnes and Thérèse-De Blainville) contains dense peri-urban municipalities of the greater Montréal metropolitan area, while the northern tier (Antoine-Labelle) contains municipalities exceeding 1,000 km2 with settlement clusters separated by forests and lakes. This gradient of density and urbanisation makes the region an appropriate test case for a methodology that must perform well across the full rural–urban continuum.
3.2. Data Sources
Four primary data sources were integrated (Table 1). The provincial residential property assessment roll (MAMH 2026) provides the location and unit count of all residential buildings (CUBF codes 1000–1590) in the province. For the study region, this yielded 234,466 residential parcels representing 305,827 dwelling units. OpenStreetMap data were retrieved via the Overpass API using a bounding-box query covering the entire region (~258 × 180 km) at analysis time. Municipal boundaries and areas were obtained from the Ministère de l'Environnement, de la Lutte contre les changements climatiques, de la Faune et des Parcs (MELCCFP). Urban perimeter polygons were supplied by the regional planning authority under the MAMH OGAT 2024 framework. Supplementary data on housing typology (bedroom distribution, tenure proportions) were derived from the 2021 Statistics Canada census, and an inventory of subsidised housing providers was obtained from the Société d'habitation du Québec (SHQ).
3.3. Technical Architecture
MilieuxVie is implemented as a single self-contained HTML file (~11 MB). No web server, database, or external authentication is required: the file can be opened directly in any modern browser. This deployment model was chosen to maximise accessibility within municipal planning offices, which frequently operate under restrictive IT policies that preclude the installation of GIS software or the use of externally hosted platforms.
The front-end stack consists of Leaflet.js 1.9.4 for cartographic rendering (CARTO Positron basemap), vanilla JavaScript for computation and UI, and the Overpass API for on-demand OSM queries. Pre-computed datasets (residential parcel centroids, urban perimeters, housing typology, affordable housing providers) are embedded as compressed JSON objects within the file itself, eliminating external data dependencies for the residential origin and housing dimensions. OSM service-facility data are retrieved at analysis time via Overpass, enabling queries to reflect the current state of the OSM database.
A key optimisation is the use of a single regional bounding-box query (covering the full Laurentides extent, ~258 × 180 km, with a 90-second server timeout) rather than 93 individual per-local territories queries. This regional cache approach reduces total analysis time for all 93 territorial units from an estimated 10–15 minutes (sequential per-municipality queries) to approximately 1–2 minutes. Subsequent per-municipality or per-urban-perimeter calculations are performed entirely in the browser by filtering the cached feature set to the relevant polygon using a ray-casting point-in-polygon algorithm.
4. Methodology
4.1. Service Categories and Distance Thresholds
Twelve service categories drawn from the Vivre en Ville (2026) framework are assessed via OSM (Table 2). The four housing-dimension parameters (dwelling-size diversity, rental proportion, vacancy rate, long-term affordability) require census and SCHL data and are handled separately; the tool currently reports the census-derived parameters descriptively rather than integrating them into the composite score. Each OSM category is matched to one or more tag combinations using a rule-based classifier applied to element tags returned by the Overpass query.
4.2. Milieu-Type Classification
Three milieu types are distinguished based on residential dwelling-unit density (logements km⁻²), computed by dividing the number of dwelling units from the MAMH 2026 property roll by the official municipal area (field MUS_VA_SUP, MELCCFP boundary dataset). This metric is a more direct proxy for settlement intensity than total municipal area, which is confounded by large uninhabited territories common in the Laurentides region. Dense municipalities (≥ 100 dwelling km², n = 30) receive the standard Vivre en Ville thresholds. Intermediate municipalities (10–100 dwelling km², n = 32) receive thresholds scaled approximately 1.5–2×. Rural municipalities (≤ 10 dwelling km², n = 17) receive thresholds scaled approximately 3–6×. These scaling factors were informed by the rural accessibility literature [29,39,40] and by consultation with regional planners. The density-based approach correctly reclassifies municipalities such as Saint-Jérôme (444 dwellings km⁻², dense) and Mont-Laurier (37 dwelling km², intermediate) that were misclassified under an area-only criterion. Sensitivity to the choice of thresholds is discussed in Section 6.
4.3. Residential-Parcel Accessibility Score
For each municipality and each service category, the parameter score is computed as the proportion of dwelling units whose nearest facility of that type lies within the threshold distance:
where ui is the number of dwelling units in parcel i, di,p is the Haversine distance from parcel i to the nearest OSM feature of type p, and rp is the adaptive threshold for parameter p given the municipality's milieu type. The composite MVC score for a municipality is the arithmetic mean of all 12 parameter scores. Municipalities are classified as complete / promising (score ≥ 70 %), developing (40–69 %) or incomplete (< 40 %).
Scorep = ∑ ui · I(di,p ≤ rp] / ∑ ui
4.4. Urban Perimeter Analysis
For municipalities with delineated urban perimeters (n = 53, 92 PU polygons), a sub-municipal analysis mode restricts the origin set to parcels within the PU boundary. This corrects a systematic dilution effect: a municipality with one concentrated village core surrounded by a large forested area will receive a low composite score if all parcels are included, even if the village core itself has good service proximity. The PU-level score uses the same formula (Equation 1) but with the summation restricted to parcels i ∈ PU. Service features are retrieved within a buffer equal to the maximum parameter threshold around the PU bounding box to ensure that facilities immediately outside the polygon boundary are not excluded. Both at the municipal and perimeter scale, services in neighbouring municipalities are included whenever they lie within the adaptive radius of a residential parcel, since the regional Overpass query retrieves all features within the full Laurentides bounding box irrespective of administrative boundaries.
4.5. Gap Analysis
For each municipality or urban perimeter, the gap analysis identifies service categories with a parameter score below the 70 % target. Parameters are ranked by the size of the gap (target − score) in descending order, providing a prioritised action list. For MRC-level reporting, the gap analysis aggregates across all computed urban perimeters within the MRC and reports the number and proportion of perimeters below the target for each service type, enabling regional health authorities to identify systemic territorial deficits that transcend individual municipalities.
5. Results
5.1. Tool Interface and User Modes
MilieuxVie is accessed as a single HTML file opened in a web browser. The interface is divided into two zones: a 400-pixel sidebar containing all controls, parameters and results panels, and an interactive Leaflet map occupying the remainder of the screen. The 93 territorial units of the Laurentides region are displayed on load as light green polygons against a CARTO Positron basemap. Four analysis modes are accessible from a persistent toolbar at the top of the sidebar (Figure 1).
The By-click mode (‘Par clic’) launches a per-municipality analysis triggered by clicking a polygon on the map. An Overpass API query is sent for the selected municipality’s bounding polygon and the result is returned in 10–30 seconds depending on network conditions. Once the regional cache has been populated (see below), subsequent by-click analyses are instantaneous. The Regional mode (‘Tout afficher’) dispatches a single bounding-box query over the full Laurentides extent (~258 × 180 km) and computes scores for all 93 territorial units in the browser without further server requests. Estimated completion time is 1–2 minutes. The Load mode (‘Charger’) imports a previously exported GeoJSON file and restores all scores on the map instantaneously, enabling offline use and presentation without requerying Overpass. The Urban Perimeter mode (‘Périmètres’) activates a dedicated panel displaying the 92 urban perimeter polygons as a separate cartographic layer; municipal boundaries fade to near-transparent so that the perimeters become the primary visual unit. A single button triggers scoring for all 92 perimeters using the regional Overpass cache if already populated.
For each analysed unit — whether a municipality or an urban perimeter — the results panel reports: the composite MVC score (0–100 %); a classification label (complete/promising ≥ 70 %; developing 40–69 %; incomplete < 40 %); the detected milieu type and adaptive radius tier; a comparative bar against the MRC median; individual scores for each of the 12 OSM parameters; a housing dimension summary drawn from census data; and a gap analysis listing all parameters below the 70 % target in descending order of deficit, with contextual action guidance. Two export formats are available after a regional analysis: a GeoJSON file retaining full polygon geometry with one attribute per parameter (suitable for GIS import into QGIS or ArcGIS Pro), and a JSON tabular file suitable for Excel.
5.2. Regional Overview: Municipal-Level Scores
The regional analysis was completed on 7 May 2026 and yielded MVC scores for 79 of the 93 territorial units (84.9 %). The 14 units without a score are 4 aquatic unorganised territories (territoires non organisés aquatiques, TNO) with no residential land parcels, 9 land-based TNOs (named lake territories such as Lac-de-la-Pomme and Lac-Ernest), and Doncaster Reserve. Two land-based TNOs (Lac-Bazinet and Lac-Oscar) are scored at 0 %. These units are displayed in grey on the map and excluded from all subsequent calculations.
Among the 79 scored territorial units, the composite MVC score ranged from 0 to 60 %, with a median of 15 % and a mean of 20.1 % (SD = 16.4). No municipality reached the 70 % completeness threshold. Fifteen territorial units (19.0 %) were classified as ‘developing’ (40–69 %), and 64 (81.0 %) as ‘incomplete’ (< 40 %). The highest score was 60 %, recorded for a municipality in the MRC of Thérèse-De Blainville. Kanesatake Mohawk Territory scored 10 % and is classified as dense (36 logements km⁻²). Table 3 presents the score distribution by milieu type.
Scores were broadly consistent across milieu types: mean scores ranged from 9.8 % in rural municipalities to 26.7 % in dense sectors, with no statistically significant difference. This result suggests that the adaptive radius tiers partially compensate for the lower density of destinations in rural contexts, but do not fully eliminate the structural gap between rural and urban service provision. MRC-level medians revealed a marked north–south gradient (Table 4): the two southernmost MRCs (Thérèse-De Blainville, Mirabel) recorded the highest median scores (44 % and 32 %, respectively), while the northern MRCs of La Rivière-du-Nord and Argenteuil recorded the lowest (10 % and 5 %).
5.3. Parameter-Level Patterns
At the parameter level, the analysis revealed a clear hierarchy of accessibility across the 12 service categories (Table 5). Food retail was the best-performing dimension at the municipal scale, with a mean score of 42.5 % and 17 of 76 municipalities (22.4 %) reaching the target. The cycling network ranked second (mean 31.1 %), reflecting the relatively dense trail infrastructure in many Laurentides municipalities and the generous 400 m radius applied in dense zones. Primary school access achieved a mean score of 30.7 % and natural/green spaces 37.1 %.
At the opposite end of the spectrum, shared mobility (car-sharing and bicycle rental) returned the lowest mean score (3.2 %), followed by childcare (5.6 %) and pharmacy (9.7 %). Notably, childcare and pharmacy scored zero in a majority of municipalities: 76 of 76 (100 %) had no municipality reaching the 70 % threshold. These results reflect two distinct phenomena: shared mobility infrastructure is genuinely sparse throughout the region, while pharmacies and childcare facilities exist but are typically isolated single points that serve only the immediate surroundings of their location, insufficient to cover a meaningful proportion of a municipality’s residential area within the short target radii (400 m in dense settings). Public transit showed the highest inter-municipal variance (0–100 %), reflecting the contrast between well-served peri-urban municipalities adjacent to other networks and rural municipalities with no scheduled transit service.
5.4. Urban Perimeter Analysis
Of the 92 urban perimeters, 89 (96.7 %) were successfully scored; three returned no residential parcels within their boundaries and were excluded. The 89 scored perimeters cover 161,544 residential dwelling units. Composite PU scores ranged from 0 to 79 %, with a median of 26 % and a mean of 28.8 % (SD = 18.9). Two perimeters (2.2 %) reached the 70 % completeness threshold: Mont-Tremblant (Les Laurentides, 74 %) and Sainte-Adèle (Les Pays-d’en-Haut, 74 %). Twenty perimeters (22.5 %) were classified as developing (40–69 %) and 67 (75.3 %) as incomplete (< 40 %).
Compared to the municipal-level analysis, urban perimeter scores were systematically higher (median 26 % vs. 15 %; mean 28.8 % vs. 20.1 %), confirming the expected dilution effect of large uninhabited municipal territories on municipal-scale scores. The two municipalities attaining the completeness threshold at the perimeter level all had their urban core sufficiently densified and well-served that a majority of residential parcels within the PU boundary could reach most service categories within the adaptive target radii. Notably, Sainte-Adèle achieved a PU score of 74 % while its municipal score was 42 %, illustrating the analytical gain of the sub-municipal disaggregation.
At the parameter level across urban perimeters, food retail remained the best-performing category (median 96 % across PUs), followed by natural/green space (76 %) and primary school (62 %). Childcare was the most universally deficient category, with all 89 scored perimeters falling below the 70 % threshold (median 0 %), followed by shared mobility (87/89 PUs below target) and pharmacy (83/89). These three dimensions constitute the most consistent regional gaps irrespective of municipality size or milieu type.
MRC-level gap summaries in the Urban Perimeter mode sidebar (Figure 2) reveal systematic territorial patterns: in the MRC of Antoine-Labelle, childcare, secondary schooling, and shared mobility were identified as priority gaps in all 22 scored perimeters. In the MRC of Thérèse-De Blainville, the patterns were more heterogeneous, reflecting the mix of dense suburban municipalities with good pharmacy and transit access alongside newer peri-urban developments with deficient cycling and shared mobility infrastructure.
5.5. Illustrative Case Studies: Two Urban Perimeters at the Completeness Threshold
To illustrate the analytical depth available at the urban perimeter scale, this section presents two municipalities whose urban cores achieved the 70 % completeness threshold: Sainte-Adèle (MRC des Pays-d’en-Haut, périmètre #80, 74 %) and Mont-Tremblant (MRC des Laurentides, périmètre #60, 74 %). Both cases illustrate how the same composite score can arise from different gap profiles.
5.5.1. Sainte-Adèle — A Mixed-Use Mountain Town in Les Pays-d’en-Haut
Sainte-Adèle is classified as intermediate (77 logements km⁻², area 132 km²). Its main urban perimeter (#80) covers 2,294 residential buildings and 3,445 dwelling units. At the municipal scale, Sainte-Adèle scored 42 %; at the perimeter scale, this rises to 74 %, a 32-point improvement illustrating the dilution effect of large rural lots on the municipal score (Figure 3).
Eight of the twelve parameters reached the 70 % target: secondary school (98 %), recreation and sport (93 %), primary school (91 %), food retail (90 %), public transit (90 %), cultural facilities (87 %), natural/green spaces (80 %), and primary healthcare (78 %). This broad-spectrum provision reflects Sainte-Adèle’s role as a regional service centre in Les Pays-d’en-Haut.
Four parameters fell below the threshold. Shared mobility scored 34 % (gap: 36 points), the cycling network 39 % (gap: 31 points), pharmacy 53 % (gap: 17 points), and childcare 56 % (gap: 14 points). The childcare gap suggests that targeted facility siting could push this parameter across the threshold.
5.5.2. Mont-Tremblant — A Tourist Municipality with a Compact Urban Core
Mont-Tremblant (MRC des Laurentides) covers 130 km², intermediate (37 logements km⁻²). Its main urban core (#60, 2,283 buildings, 3,774 units) scored 74 % (Figure 4), while four secondary perimeters scored 6–53 %.
Seven parameters achieved the target: food retail (100 %), secondary school (100 %), public transit (100 %), cycling network (100 %), natural/green spaces (99 %), recreation and sport (93 %), and primary healthcare (92 %).
Five parameters fell below the threshold. Shared mobility scored 0 % (OSM under-mapping). Pharmacy scored 30 % (gap: 40 points). Cultural facilities 53 %, childcare 55 %, primary school 62 %. Childcare and school gaps are actionable through zoning.
Comparing both cases: shared mobility and childcare are common priority gaps. Pharmacy is more acute in Mont-Tremblant (30 %) than Sainte-Adèle (53 %). The cycling gap in Sainte-Adèle (39 %) contrasts with Mont-Tremblant’s perfect score (100 %), illustrating how the same 74 % composite score translates into different planning priorities.
6. Discussion
6.1. Analytical Contributions and Strengths
6.1.1. Methodological Contributions
MilieuxVie addresses three methodological gaps identified in the background review. First, it operationalises a Québec-specific complete-neighbourhood framework (Vivre en Ville 2026) with residential-parcel origin points and dwelling-unit weighting, improving on grid- or centroid-based approaches that dilute signals in municipalities with concentrated settlement patterns. Second, the adaptive radius tiers provide a context-sensitive correction that allows meaningful inter-municipal comparisons across the rural–urban continuum without requiring municipality-specific calibration data. Third, the urban-perimeter analysis mode aligns the tool directly with Québec's provincial planning framework, making outputs directly usable in OGAT-mandated planning processes.
From a practical standpoint, the tool's single-file, browser-based architecture is a deliberate design choice aimed at knowledge transfer in resource-constrained institutional contexts. Municipal planners and elected officials in the Laurentides region generally do not have access to GIS software, data servers, or dedicated spatial analysis capacity. A tool that can be distributed by email and opens in a standard web browser substantially lowers the barrier to evidence-based planning at the local scale.
6.1.2. Methodological and Practical Strengths
A distinctive strength of MilieuxVie relative to tools that rely on proprietary or static point-of-interest databases is the co-productive nature of its underlying data source. Because service locations are drawn from OpenStreetMap in real time, any errors or omissions identified during an analysis session can be corrected directly in the OSM platform by the user — whether a municipal planner, a public health professional, or an engaged citizen. These corrections are immediately reflected in subsequent analyses, creating a feedback loop between the assessment tool and the geospatial commons. This dynamic is particularly valuable in low-density municipalities where OSM coverage is uneven: the identification of a missing pharmacy or bus stop in the gap analysis output provides a concrete, actionable reason for local stakeholders to contribute to OSM, thereby improving both the local knowledge base and the reliability of future assessments. The tool thus functions not only as an analytical instrument but also as a potential driver of data quality improvement in the communities it serves.
The adoption of urban perimeters (périmètres d’urbanisation, PU) as the primary sub-municipal analysis unit constitutes a second important strength. Under Québec’s provincial planning framework (OGAT) [21], urban perimeters represent the designated planning canvas within which municipalities are expected to concentrate new development, densification and service provision. They are, in a sense, the sand-box of planners and urbanists: the bounded territory within which zoning regulations, mixed-use designations, density bonusing, and service infrastructure investments are calibrated. By grounding the completeness assessment in these perimeters rather than in full municipal boundaries, MilieuxVie produces gap analysis outputs that map directly onto the planning levers available to local decision-makers. A municipality that learns its urban perimeter scores poorly on healthcare proximity or cycling infrastructure can translate that finding immediately into zoning amendments, land acquisition priorities, or capital infrastructure submissions, without needing to reconcile the result with the performance of its vast uninhabited hinterland.
The use of straight-line (Euclidean) distances, while a methodological approximation discussed below among the tool’s limitations, confers a significant computational performance advantage that has direct implications for user experience and adoption. Network-based routing calculations require server infrastructure, pre-processed routing graphs, and substantially longer computation times at regional scale. The Haversine distance approach, by contrast, enables the scoring of all 93 territorial units or 92 urban perimeters entirely within the user’s browser, in approximately one to two minutes following the initial regional Overpass query. This matters because research on web application usability consistently finds that user abandonment rates increase sharply with page load and computation times: Nielsen [41] established that attention and engagement begin to erode after approximately ten seconds of wait time, a threshold corroborated by subsequent studies on interactive mapping applications [42]. A tool that delivers regional-scale accessibility results within a two-minute window is far more likely to be used in practice — particularly in time-constrained contexts such as council meetings or planning consultations — than one requiring five to fifteen minutes of computation. The computational efficiency of the straight-line approach is therefore not merely a technical convenience but a deliberate design trade-off in favour of accessibility and usability.
6.2. Limitations
Several limitations should be noted. First, the use of Euclidean (straight-line) distances rather than network distances may overestimate accessibility in municipalities where water bodies, rail lines or expressways create barriers between parcels and nearby services. The direction and magnitude of this bias will vary by municipality and service type. As discussed in Section 6.1.2, however, the straight-line approximation is a deliberate design trade-off that enables near-real-time browser-based computation across the full study region, and its practical consequences are attenuated in Québec’s small urban centres where street layouts are relatively grid-like.
Second, OSM completeness varies substantially across the study area. Service facilities that exist physically but are absent from OSM are counted as absent in the analysis, producing artificially low scores for poorly mapped territories. This is particularly likely for small-scale local food retailers, informal childcare arrangements, and community centres in small northern municipalities. Future versions of the tool should incorporate a completeness indicator (e.g., OSM building-footprint density as a proxy for mapping effort) to contextualise scores.
Third, the use of municipal area as a milieu-type proxy is an approximation. A municipality with a large forested territory but a dense village core would be classified as intermediate or rural, receiving inflated distance thresholds relative to its actual urban character. Integration of population density from the 2021 census dissemination areas would provide a more direct measure, at the cost of additional data processing and a more complex user experience.
Fourth, a significant but often overlooked source of measurement error in northern municipalities is the prevalence of secondary and seasonal dwellings. In many Laurentides municipalities north of the Laurentian Mountains, a substantial proportion of residential parcels are used as seasonal cottages whose occupants are not permanent residents. Including these parcels in the accessibility calculation inflates the apparent deficit for services such as childcare and pharmacy, producing scores that underestimate the level of service proximity available to full-time residents. Future versions should distinguish permanent from seasonal residential use using additional occupancy data. Fifth, the tool’s reliance on OSM for green and natural space detection systematically underestimates access to nature in northern municipalities, where vast forests, lakes and natural terrain surround residential parcels but are not labelled in OSM as parks or leisure areas. A complementary raster-based approach using satellite-derived greenness indices (NDVI) could address this in a future version. Sixth, the four housing-dimension parameters (dwelling-size diversity, rental proportion, vacancy rate, long-term affordability) are not yet integrated into the composite score. These dimensions are central to Vivre en Ville's complete-neighbourhood concept and their exclusion means the composite score captures only service proximity and mobility. Incorporating tenure and typology data from the 2021 census, and vacancy rates from the SCHL rental market survey, is a priority for future development.
6.3. Generalisability and Future Directions
The methodological framework presented here is specific to the Laurentides region in its data inputs (provincial property roll, Québec urban perimeter layer, Vivre en Ville thresholds) but is generalisable to other Québec health regions with minimal adaptation. Extension to other Canadian provinces or other countries would require substituting equivalent residential parcel datasets and adapting the service-category definitions to local planning frameworks.
The gap analysis module, which identifies priority service deficits at the municipal and urban-perimeter levels, has practical potential as a planning support tool for OGAT implementation reviews, municipal master-plan (SADR/SAD) updates, and health-impact assessment (ÉIS) scoping exercises. Future development priorities include: (1) integration of network-distance calculation via the OSRM or Valhalla routing engines; (2) automatic OSM completeness flagging; (3) full integration of census housing parameters into the composite score; and (4) automated report generation in CISSS institutional format for direct use in public health knowledge-transfer communications.
7. Conclusions
This paper presented MilieuxVie, a browser-based open-source tool for assessing complete-neighbourhood accessibility across the Laurentides health region of Québec. By combining the Vivre en Ville (2026) 15-parameter framework with real-time OpenStreetMap queries via the Overpass API, provincial residential parcel data from the MAMH property roll, adaptive distance thresholds calibrated to three territorial types, and sub-municipal urban-perimeter analysis, the tool provides a level of methodological rigour and territorial sensitivity that is absent from generic walkability platforms, while remaining deployable in planning offices without GIS infrastructure.
The application of the tool to the 93 territorial units of the Laurentides region (76 municipalities, 11 land-based TNOs, 2 indigenous territories and 4 aquatic units) produced three main empirical findings. First, the overall level of complete-neighbourhood accessibility is low throughout the region: the median composite MVC score was 15 % across 79 scored territorial units (mean 20.1 %; Kanesatake Mohawk Territory, the single scored indigenous territory, scored 10 % and is excluded from the municipal statistics), and no municipality reached the 70 % completeness threshold. Scores were broadly similar across the three milieu types (dense, intermediate, rural), confirming that the adaptive radius tiers partially compensate for low-density service patterns but do not eliminate structural accessibility deficits in rural settings. A marked north–south gradient was observed: the southernmost MRC (Thérèse-De Blainville) recorded a median score of 44 %, while Mirabel scored 32 %, while the northern MRCs of Rivière-du-Nord and Argenteuil recorded medians of 10 % and 5 %.
Second, the parameter-level analysis reveals a consistent hierarchy of accessibility gaps. Food retail and the cycling network were the best-performing dimensions, while childcare, shared mobility, and pharmacy showed near-universal deficits (all 79 scored units below the 70 % target for childcare and pharmacy). These findings have direct policy implications: childcare and pharmacy access are provincial health-equity priorities in Québec, and their systematic absence from walkable distances across the Laurentides region provides evidence-based support for provincial investment strategies and OGAT-aligned planning amendments.
Third, the urban perimeter analysis substantially improved on the municipal-scale picture. Among 89 scored perimeters (covering 161,544 dwelling units), two reached the 70 % threshold (Sainte-Adèle and Mont-Tremblant, both at 74 %) and the regional median rose from 15 % (municipal) to 26 % (perimeter). The case studies of Sainte-Adèle (74 %, 4 gaps) and Mont-Tremblant (74 %, 5 gaps) illustrate how sub-municipal disaggregation transforms an intermediate-level municipal score into an actionable planning brief: for each perimeter, the gap analysis identifies the specific service types falling below target, ranks them by deficit magnitude, and implicitly points to the planning instruments (zoning, facility siting, transit investment) most likely to close each gap.
Beyond its regional application, MilieuxVie illustrates a broader principle: that open data (OpenStreetMap), open government data (provincial property rolls, planning boundaries), and open-source web mapping can be combined into planning-support tools that serve knowledge transfer to non-specialist audiences at virtually no infrastructure cost. A distinctive feature of the OSM-based approach is that errors or omissions identified during an analysis session become direct contributions to the geospatial commons: a planner who notices a missing pharmacy in the gap analysis output can add it to OSM, improving the tool’s reliability for the entire community. The tool’s co-productive data model thus creates a virtuous cycle between territorial assessment and crowd-sourced data quality improvement.
Future development priorities include: (1) integration of network-distance routing via OSRM or Valhalla to replace straight-line distance approximations; (2) full integration of the four housing-dimension parameters (diversity, tenure, vacancy, affordability) from Statistics Canada and the SCHL; (3) automatic OSM completeness flagging to contextualise low scores in poorly mapped municipalities; and (4) automated report generation in institutional format for direct use in public health communications. As Québec municipalities undertake OGAT-mandated planning revisions over the next decade, tools of this kind may play a growing role in anchoring land-use and infrastructure decisions in population-level accessibility evidence.
Author Contributions
Conceptualisation, É.R.; methodology, É.R.; software, É.R.; formal analysis, É.R.; writing — original draft preparation, É.R.; writing — review and editing, É.R. ; supervision, É.R.
Funding
This research received no external funding. Tool development was carried out as part of knowledge-transfer activities at the Direction de santé publique, CISSS des Laurentides.
Data Availability Statement
The MilieuxVie tool (HTML file) is available at https://github.com/eranlorob-dotcom/MVC. OpenStreetMap data are available under the Open Database Licence (ODbL) at openstreetmap.org. Provincial property assessment data and urban perimeter polygons are accessible through the Données Québec open-data portal.
Acknowledgments
The authors thank Camille Brun and Pierre-Yves Chopin (Vivre en Ville) for fruitful discussions on the methodological adaptation of the complete-neighbourhood framework to low-density contexts. The authors also thank their partners at the Direction de santé publique du CISSS des Laurentides for their support and collegial engagement throughout the development of this project. .
Conflicts of Interest
The authors declare no conflicts of interest.
AI Assistance Disclosure
Claude (Anthropic) was used to assist with HTML code generation for the MilieuxVie application and for translating (French to English) and editing portions of this manuscript. All scientific content, methodological decisions and interpretations are the sole responsibility of the authors.
Abbreviations
The following abbreviations are used in this manuscript:
| API | Application Programming Interface |
| CARES | Centre d’analyse et de recherche en environnement et santé (INRS) |
| CISSS | Centre intégré de santé et de services sociaux |
| CReSP | Centre de recherche en santé publique |
| CSV | Comma-Separated Values |
| GIS | Geographic Information System |
| HTML | HyperText Markup Language |
| INRS | Institut national de la recherche scientifique |
| JSON | JavaScript Object Notation |
| MAMH | Ministère des Affaires municipales et de l’Habitation |
| MELCCFP | Ministère de l’Environnement, de la Lutte contre les changements climatiques, de la Faune et des Parcs |
| MRC | Municipalité régionale de comté |
| MVC | Milieux de vie complets |
| NDVI | Normalized Difference Vegetation Index |
| OGAT | Orientations gouvernementales en aménagement du territoire |
| OSM | OpenStreetMap |
| OSRM | Open Source Routing Machine |
| PU | Périmètre d’urbanisation |
| QGIS | Quantum Geographic Information System (open-source GIS software) |
| SCHL | Société canadienne d’hypothèques et de logement |
| SD | Standard deviation |
| SHQ | Société d’habitation du Québec |
| TNO | Territoire non organisé |
| UX | User Experience |
| VeV | Vivre en Ville |
References
- Frank, L.D.; Sallis, J.F.; Saelens, B.E.; Leary, L.; Cain, K.; Conway, T.L.; Hess, P.M. The Development of a Walkability Index: Application to the Neighborhood Quality of Life Study. Br. J. Sports Med. 2010, 44, 924–933. [Google Scholar] [CrossRef]
- World Health Organization Urban Green Spaces and Health: A Review of Evidence; WHO Regional Office for Europe: Copenhagen, Denmark, 2016.
- Vivre en Ville Milieux de Vie Complets : Évaluer, Planifier et Agir Localement; Guide Pratique; Vivre en Ville: Québec, QC, Canada, 2026.
- Smith, M.; Hosking, J.; Woodward, A.; Witten, K.; MacMillan, A.; Field, A.; Baas, P.; Mackie, H. Systematic Literature Review of Built Environment Effects on Physical Activity and Active Transport – an Update and New Findings on Health Equity. Int. J. Behav. Nutr. Phys. Act. 2017, 14, 158. [Google Scholar] [CrossRef]
- McCormack, G.R.; Giles-Corti, B.; Bulsara, M. The Relationship between Destination Proximity, Destination Mix and Physical Activity Behaviors. Prev. Med. 2008, 46, 33–40. [Google Scholar] [CrossRef]
- Ali, M.; Dharmowijoyo, D.B.E.; de Azevedo, A.R.G.; Fediuk, R.; Ahmad, H.; Salah, B. Time-Use and Spatio-Temporal Variables Influence on Physical Activity Intensity, Physical and Social Health of Travelers. Sustainability 2021, 13. [Google Scholar] [CrossRef]
- Ewing, R.; Cervero, R. Travel and the Built Environment: A Synthesis. Transp. Res. Rec. 2001, 1780, 87–114. [Google Scholar] [CrossRef]
- Mouratidis, K.; Poortinga, W. Built Environment, Urban Vitality and Social Cohesion: Do Vibrant Neighborhoods Foster Strong Communities? Landsc. Urban Plan. 2020, 204, 103951. [Google Scholar] [CrossRef]
- Lund, H. Pedestrian Environments and Sense of Community. J. Plan Educ. Res. 2002, 21, 301–312. [Google Scholar] [CrossRef]
- Conigliani, C.; Addis, M.; Spinesi, L. Assessing the Impact of Essential Service Locations on Social Hardship: Evidence from Rome. Cities 2025, 167, 106349. [Google Scholar] [CrossRef]
- Moreno, C.; Allam, Z.; Chabaud, D.; Gall, C.; Pratlong, F. Introducing the 15-Minute City: Sustainability, Resilience and Place Identity in Future Post-Pandemic Cities. Smart Cities 2021, 4, 93–111. [Google Scholar] [CrossRef]
- Dawodu, A.; Cheshmehzangi, A.; Sharifi, A.; Oladejo, J. Neighborhood Sustainability Assessment Tools: Research Trends and Forecast for the Built Environment. Sustain. Futur. 2022, 4, 100064. [Google Scholar] [CrossRef]
- Sharifi, A.; Dawodu, A.; Cheshmehzangi, A. Limitations in Assessment Methodologies of Neighborhood Sustainability Assessment Tools: A Literature Review. Sustain. Cities Soc. 2021, 67, 102739. [Google Scholar] [CrossRef]
- Ferrari, S.; Zoghi, M.; Blázquez, T.; Dall’O’, G. Towards Worldwide Application of Neighborhood Sustainability Assessments: A Systematic Review on Realized Case Studies. Renew. Sustain. Energy Rev. 2022, 158, 112171. [Google Scholar] [CrossRef]
- Pot, F.J.; Piesch, L. How Far Is Too Far? Urban versus Rural Acceptable Travel Distances. Transp. Res. Part Transp. Environ. 2024, 137, 104474. [Google Scholar] [CrossRef]
- Silva, C.; Büttner, B.; Seisenberger, S.; Rauli, A. Proximity-Centred Accessibility—A Conceptual Debate Involving Experts and Planning Practitioners. J. Urban Mobil. 2023, 4, 100060. [Google Scholar] [CrossRef]
- Logan, T.; Williams, T.; Nisbet, A.; Liberman, K.; Zuo, C.; Guikema, S. Evaluating Urban Accessibility: Leveraging Open-Source Data and Analytics to Overcome Existing Limitations. Environ. Plan. B Urban Anal. City Sci. 2019, 46, 897–913. [Google Scholar] [CrossRef]
- Li, H.; Li, M.; Peng, P.; Ao, Y.; Liu, Y.; Martek, I.; Bahmani, H. Rural Residential Choices: Unravelling the Nexus of Accessibility and Preferences. J. Asian Archit. Build. Eng. 2025, 24, 5588–5600. [Google Scholar] [CrossRef]
- Silva, C.; Büttner, B.; Seisenberger, S.; Rauli, A. Proximity-Centred Accessibility—A Conceptual Debate Involving Experts and Planning Practitioners. J. Urban Mobil. 2023, 4, 100060. [Google Scholar] [CrossRef]
- Pot, F.J.; Koster, S.; Tillema, T. Perceived Accessibility in Dutch Rural Areas: Bridging the Gap with Accessibility Based on Spatial Data. Transp. Policy 2023, 138, 170–184. [Google Scholar] [CrossRef]
- Ministère des Affaires municipales et de l’Habitation (MAMH) Orientations Gouvernementales En Aménagement Du Territoire (OGAT); Gouvernement du Québec: Québec, QC, Canada, 2024.
- Walk Score Walk Score Methodology. 2023.
- Baig, H.; Abdullah, M.; Dias, C.; Basheer, M. Examining Access to Daily Functions through the Lens of the 15-Minute City Concept in a Highly Populated City. Geocarto Int. 2025, 40. [Google Scholar] [CrossRef]
- Sallis, J.F.; Cerin, E.; Conway, T.L.; Adams, M.A.; Frank, L.D.; Pratt, M. Physical Activity in Relation to Urban Environments in 14 Cities Worldwide. Lancet 2016, 387, 2207–2217. [Google Scholar] [CrossRef]
- Westenhöfer, J.; Nouri, E.; Reschke, M.L.; Seebach, F.; Buchcik, J. Walkability and Urban Built Environments—a Systematic Review of Health Impact Assessments (HIA). BMC Public Health 2023, 23. [Google Scholar] [CrossRef]
- Calthorpe, P. The Next American Metropolis: Ecology, Community, and the American Dream; Princeton Architectural Press: New York, NY, USA, 1993. [Google Scholar]
- Caselli, B. From Urban Planning Techniques to 15-Minute Neighbourhoods. A Theoretical Framework and GIS-Based Analysis of Pedestrian Accessibility to Public Services. Eur. Transp. Eur. 2021. [Google Scholar] [CrossRef]
- Boisjoly, G.; El-Geneidy, A. Daily Fluctuations in Transit and Job Availability: A Comparative Assessment of Time of Day Periods. J. Transp. Geogr. 2016, 52, 73–81. [Google Scholar] [CrossRef]
- Neutens, T. Accessibility, Equity and Health Care: Review and Research Directions for Transport Geographers. J. Transp. Geogr. 2015, 43, 14–27. [Google Scholar] [CrossRef]
- Neis, P.; Zielstra, D.; Zipf, A. The Street Network Evolution of Crowdsourced Maps: OpenStreetMap in Germany 2007–2011. Future Internet 2012, 4, 1–21. [Google Scholar] [CrossRef]
- Iacono, M.; Krizek, K.J.; El-Geneidy, A. Measuring Non-Motorized Accessibility: Issues, Alternatives, and Execution. J. Transp. Geogr. 2010, 18, 133–140. [Google Scholar] [CrossRef]
- Apparicio, P.; Cloutier, M.-S.; Shearmur, R. The Case of Montréal’s Missing Food Deserts: Evaluation of Accessibility to Food Supermarkets. Int. J. Health Geogr. 2007, 6. [Google Scholar] [CrossRef]
- Lister, N.-M. Placing Food: Toronto’s Edible Landscape. In Foodscapes, Foodfields, and Identities in the Yucatán; Berghahn Books: New York, NY, USA, 2007. [Google Scholar]
- Haklay, M. How Good Is Volunteered Geographical Information? A Comparative Study of OpenStreetMap and Ordnance Survey Datasets. Env. Plan B Plan Des. 2010, 37, 682–703. [Google Scholar] [CrossRef]
- Zhou, Q.; Zhang, Y.; Chang, K.; Brovelli, M.A. Assessing OSM Building Completeness for Almost 13,000 Cities Globally. Int. J. Digit. Earth 2022, 15, 2400–2421. [Google Scholar] [CrossRef]
- Barrington-Leigh, C.; Millard-Ball, A. The World’s User-Generated Road Map Is More than 80% Complete. PLoS ONE 2017, 12. [Google Scholar] [CrossRef]
- OpenStreetMap Wiki Overpass API. 2024.
- Chapman, K.; Engelsted, K.; Iliffe, M. OpenStreetMap–Kollaborative Bearbeitung von Onlinekarten in Der Entwicklungs-Und Katastrophenhilfe. Soz. Bewegungen 2013, 26, 144. [Google Scholar] [CrossRef]
- Guo, C.; Zhou, W.; Jing, C.; Zhaxi, D. Mapping and Measuring Urban-Rural Inequalities in Accessibility to Social Infrastructures. Geogr. Sustain. 2024, 5, 41–51. [Google Scholar] [CrossRef]
- Robitaille, E.; Durette, G.; Dubé, M.; Arbour, O.; Paquette, M.C. Measuring the Potential and Realized (or Revealed) Spatial Access from Places of Residence and Work to Food Outlets in Rural Communities of Québec, Canada. ISPRS Int. J. Geo-Inf. 2024, 13, 43. [Google Scholar] [CrossRef]
- Nielsen, J. Response Times: The 3 Important Limits; 1993. [Google Scholar]
- Google Find out How You Stack up to New Industry Benchmarks for Mobile Page Speed. 2018.
Figure 1.
MilieuxVie user interface showing (a) the Regional mode sidebar after completing the analysis of all 93 Laurentides municipalities, with the composite MVC scores displayed as choropleth on the map (green: ≥70 %; orange: 40–69 %; red: <40 %; white/grey: no data); and (b) the Urban Perimeter mode showing scores for all 92 périmètres d’urbanisation, with MRC-level gap summaries in the sidebar list. Analysis date: 7 May 2026.
Figure 1.
MilieuxVie user interface showing (a) the Regional mode sidebar after completing the analysis of all 93 Laurentides municipalities, with the composite MVC scores displayed as choropleth on the map (green: ≥70 %; orange: 40–69 %; red: <40 %; white/grey: no data); and (b) the Urban Perimeter mode showing scores for all 92 périmètres d’urbanisation, with MRC-level gap summaries in the sidebar list. Analysis date: 7 May 2026.
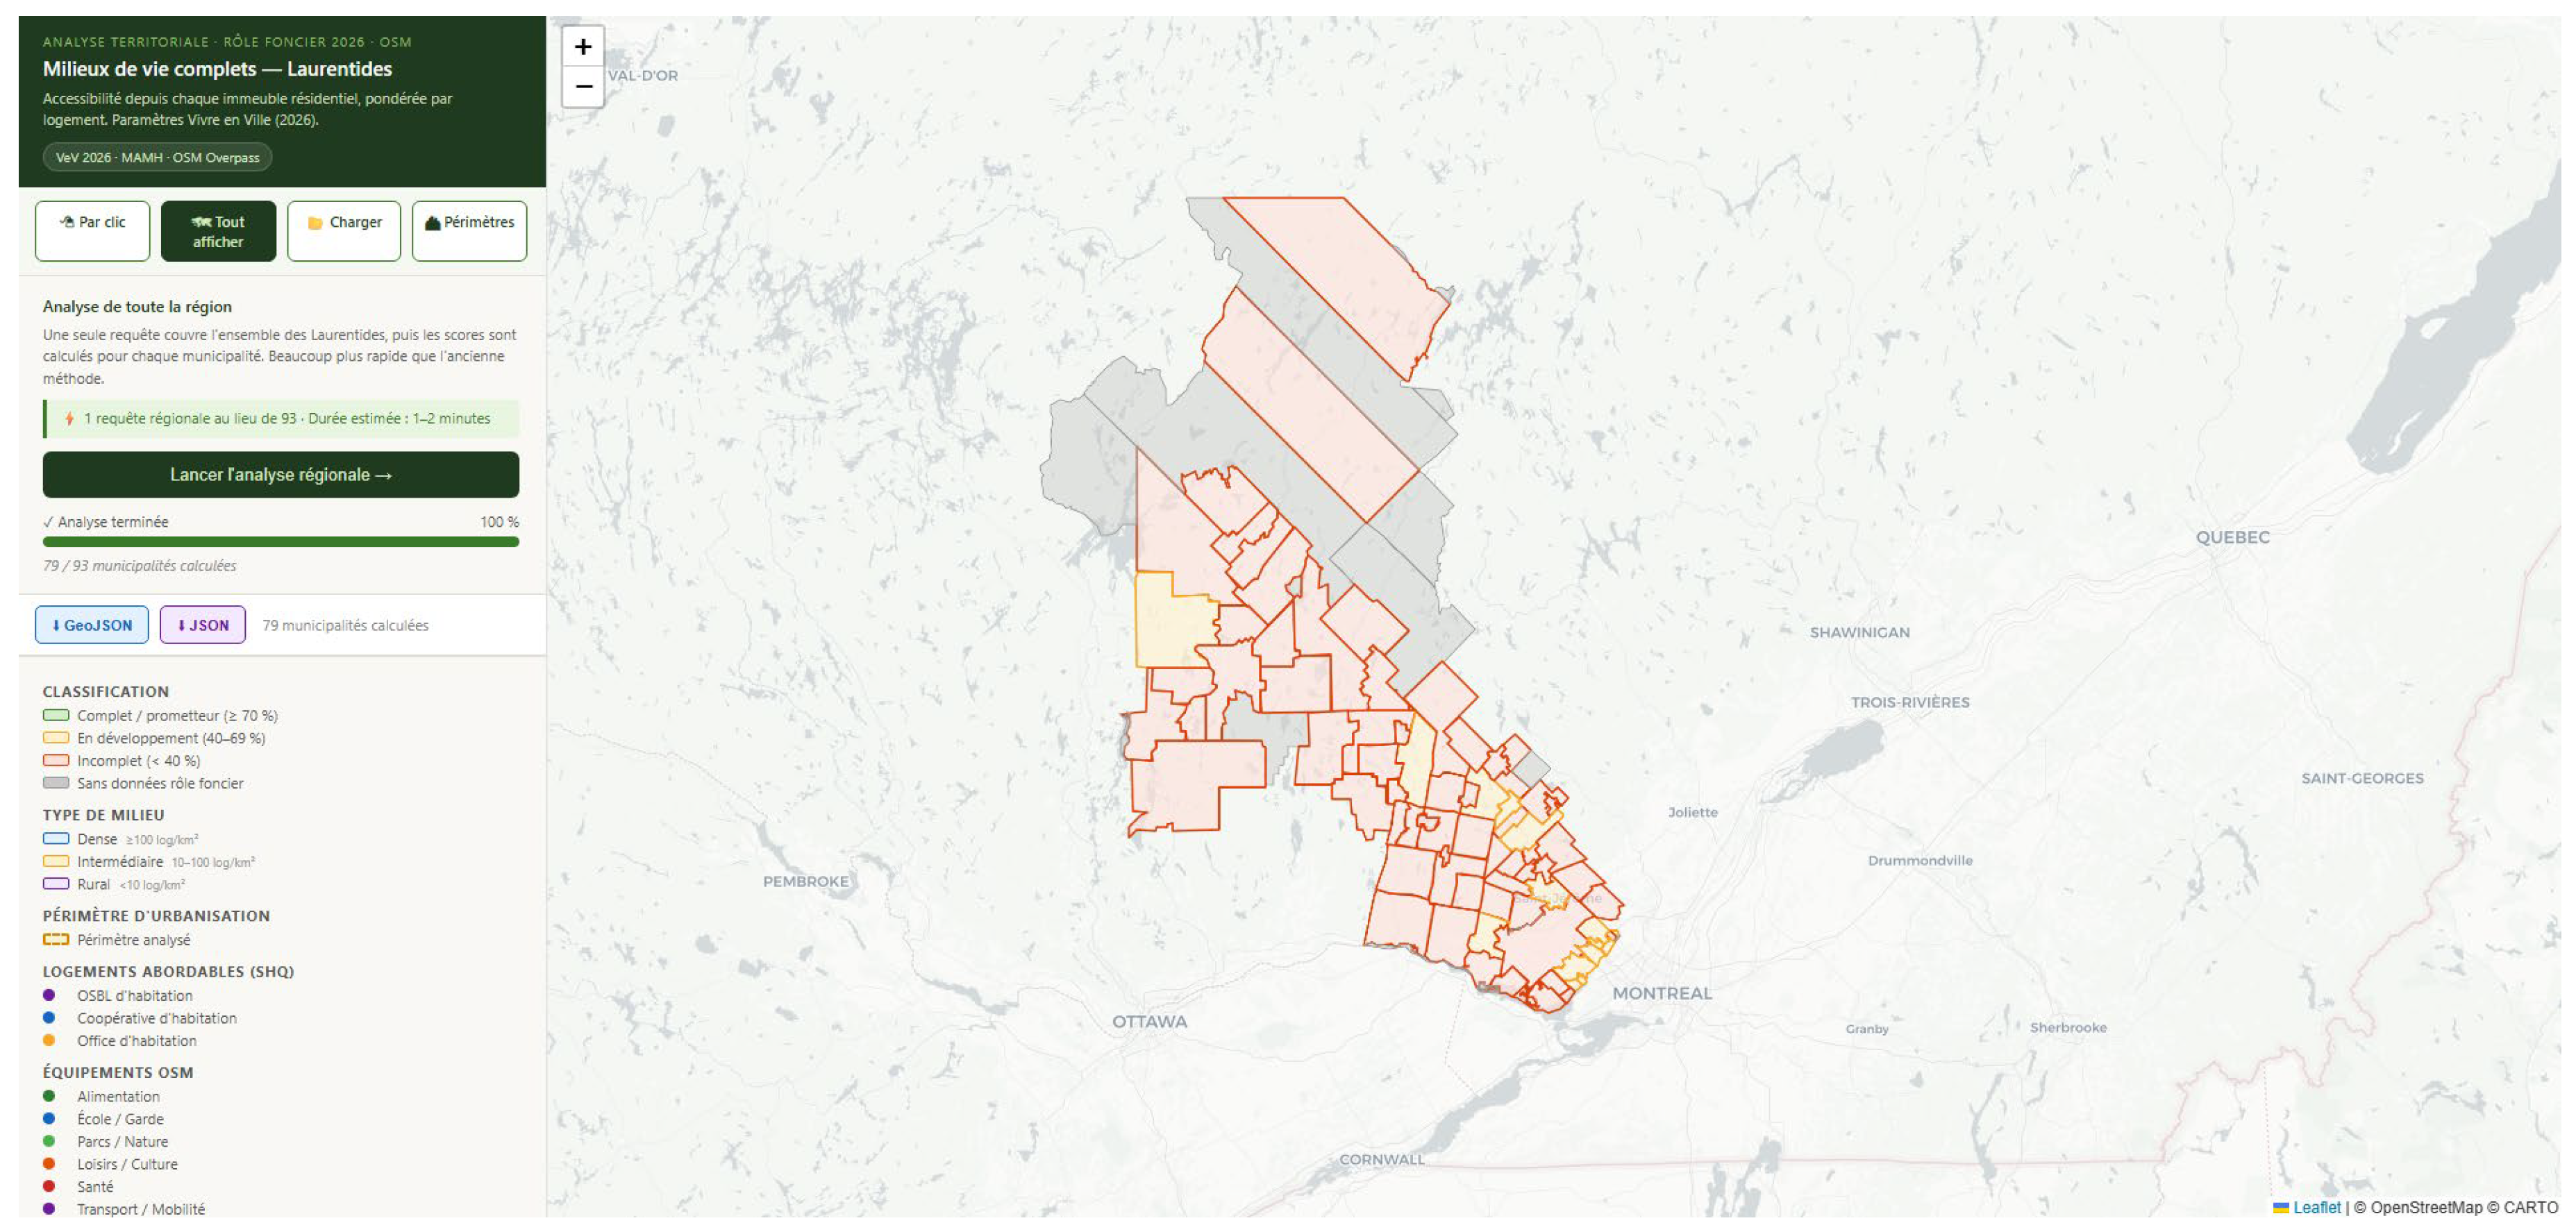
Figure 2.
Detailed results for the Urban Perimeter mode (MRC Antoine-Labelle detail). The sidebar shows the MRC-level gap summary and the beginning of the per-perimeter list. Perimeters are colour-coded by composite score (green ≥70 %; orange 40–69 %; red <40 %). Note the contrast between the warm-toned northern perimeters and the handful of green perimeters visible in the southern portion of the map. Analysis date: 7 May 2026.
Figure 2.
Detailed results for the Urban Perimeter mode (MRC Antoine-Labelle detail). The sidebar shows the MRC-level gap summary and the beginning of the per-perimeter list. Perimeters are colour-coded by composite score (green ≥70 %; orange 40–69 %; red <40 %). Note the contrast between the warm-toned northern perimeters and the handful of green perimeters visible in the southern portion of the map. Analysis date: 7 May 2026.
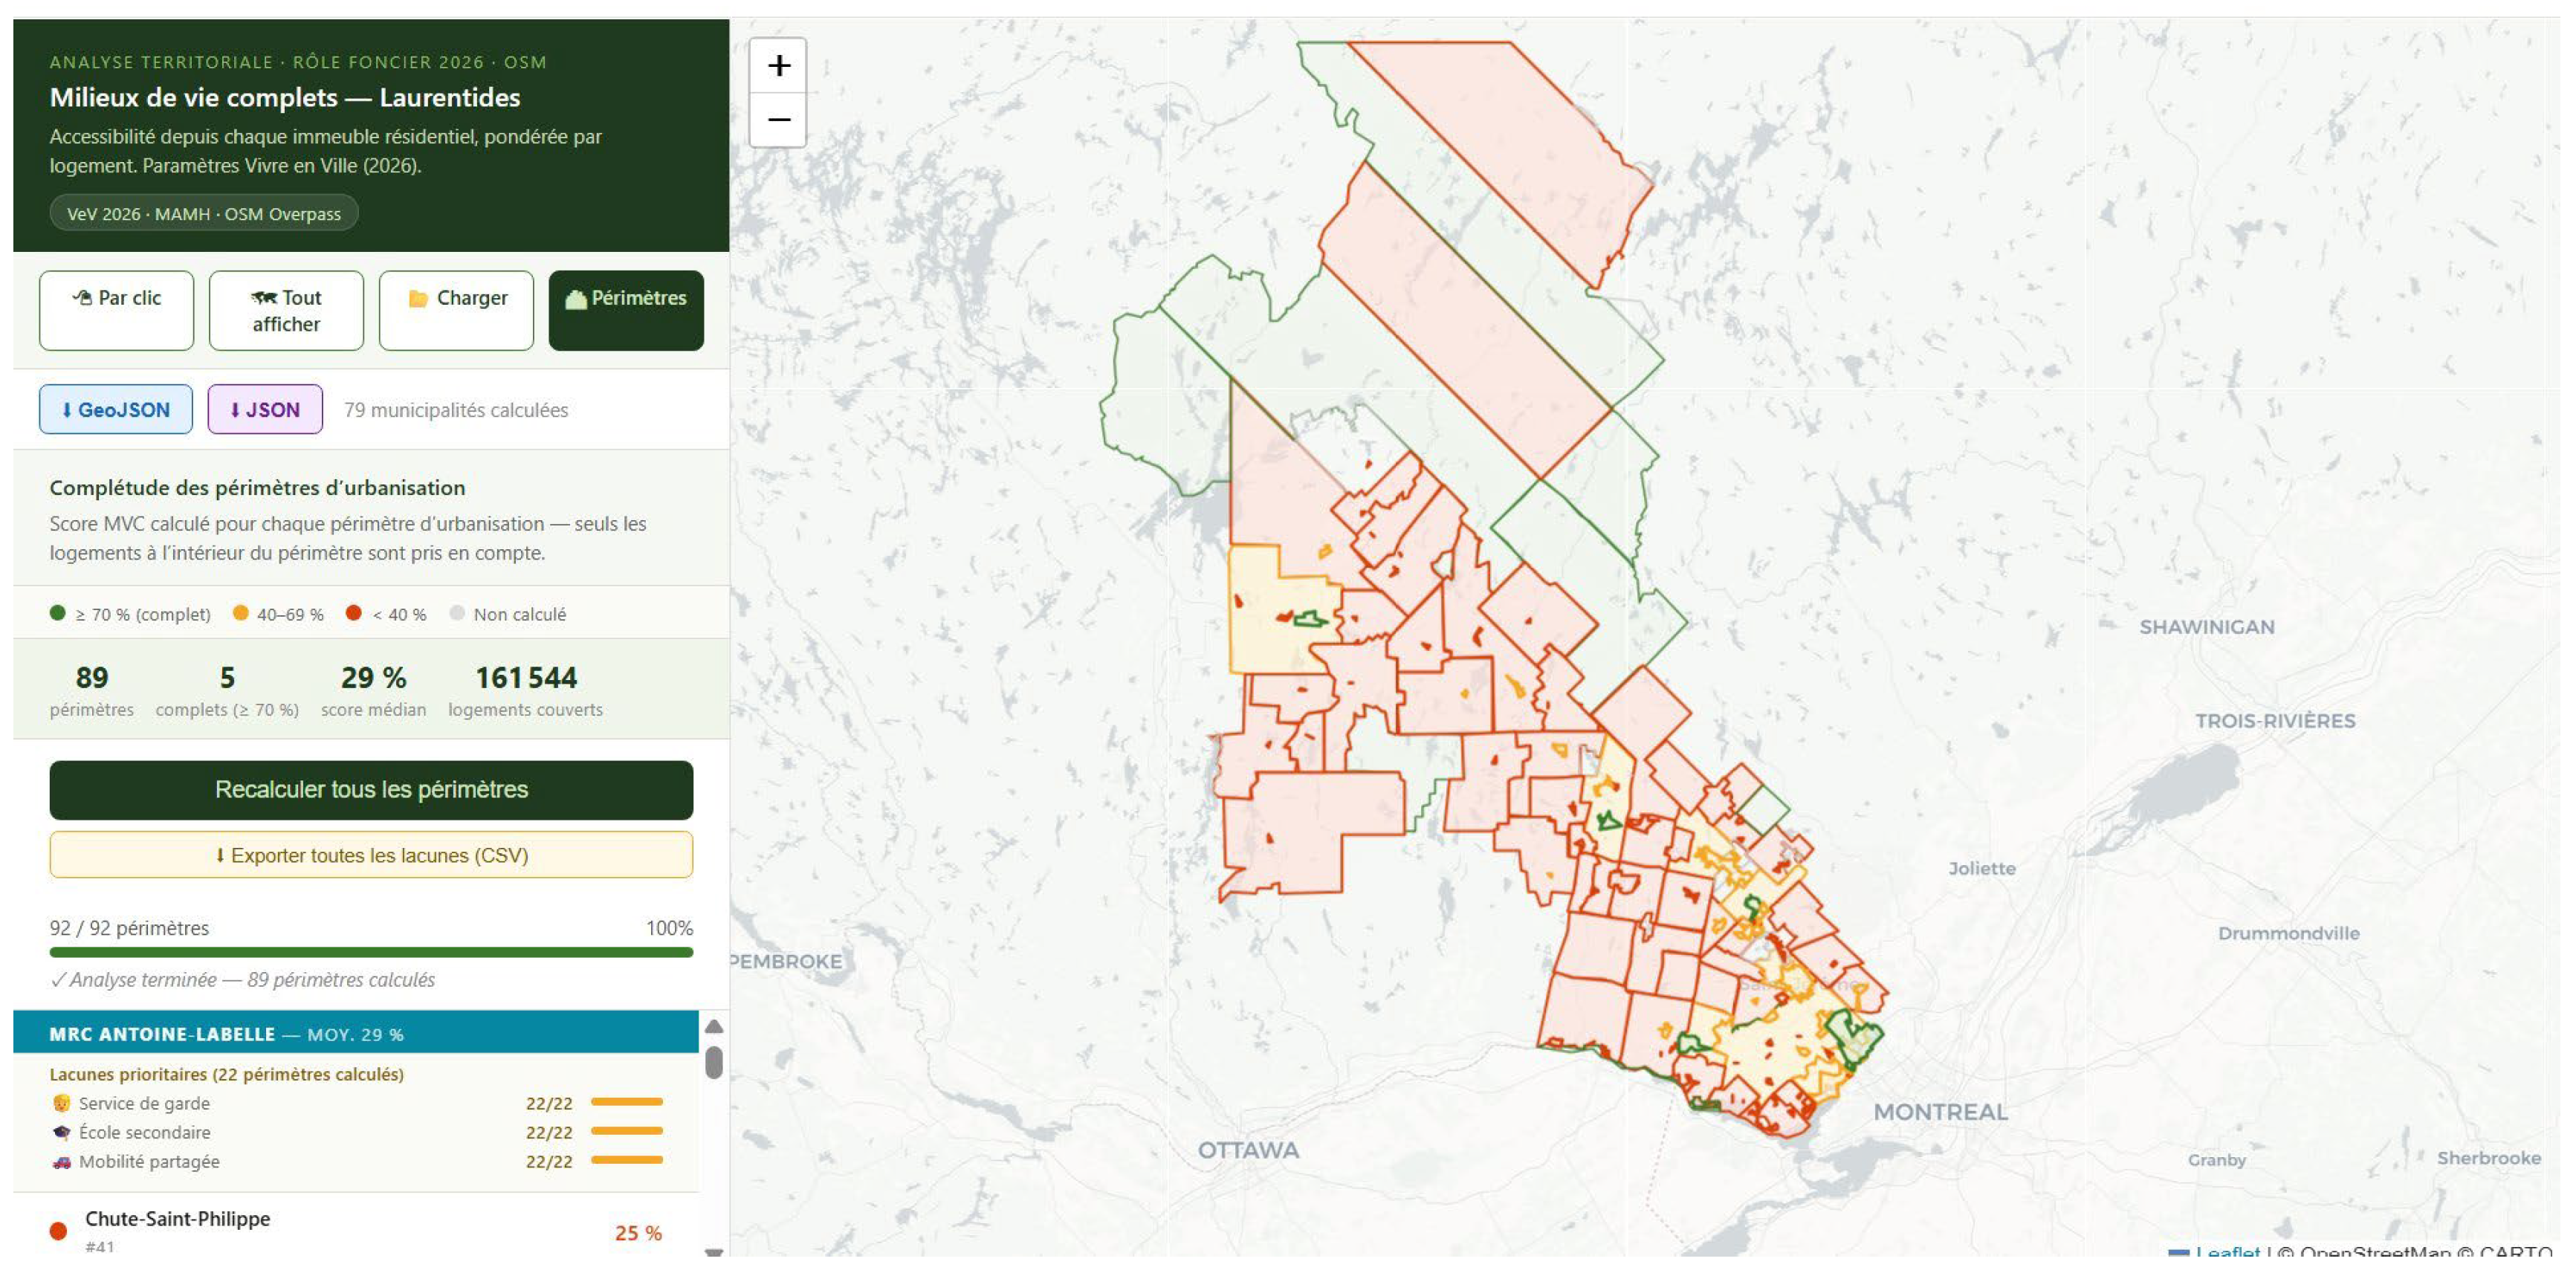
Figure 3.
Urban perimeter analysis for Sainte-Adèle (Périmètre #80, MRC des Pays-d’en-Haut). Score: 74 % (4 parameters below target: shared mobility 34 %, cycling network 39 %, pharmacy 53 %, service de garde 56 %). Buildings: 2,294; dwelling units: 3,445. Analysis: 11 May 2026.
Figure 3.
Urban perimeter analysis for Sainte-Adèle (Périmètre #80, MRC des Pays-d’en-Haut). Score: 74 % (4 parameters below target: shared mobility 34 %, cycling network 39 %, pharmacy 53 %, service de garde 56 %). Buildings: 2,294; dwelling units: 3,445. Analysis: 11 May 2026.
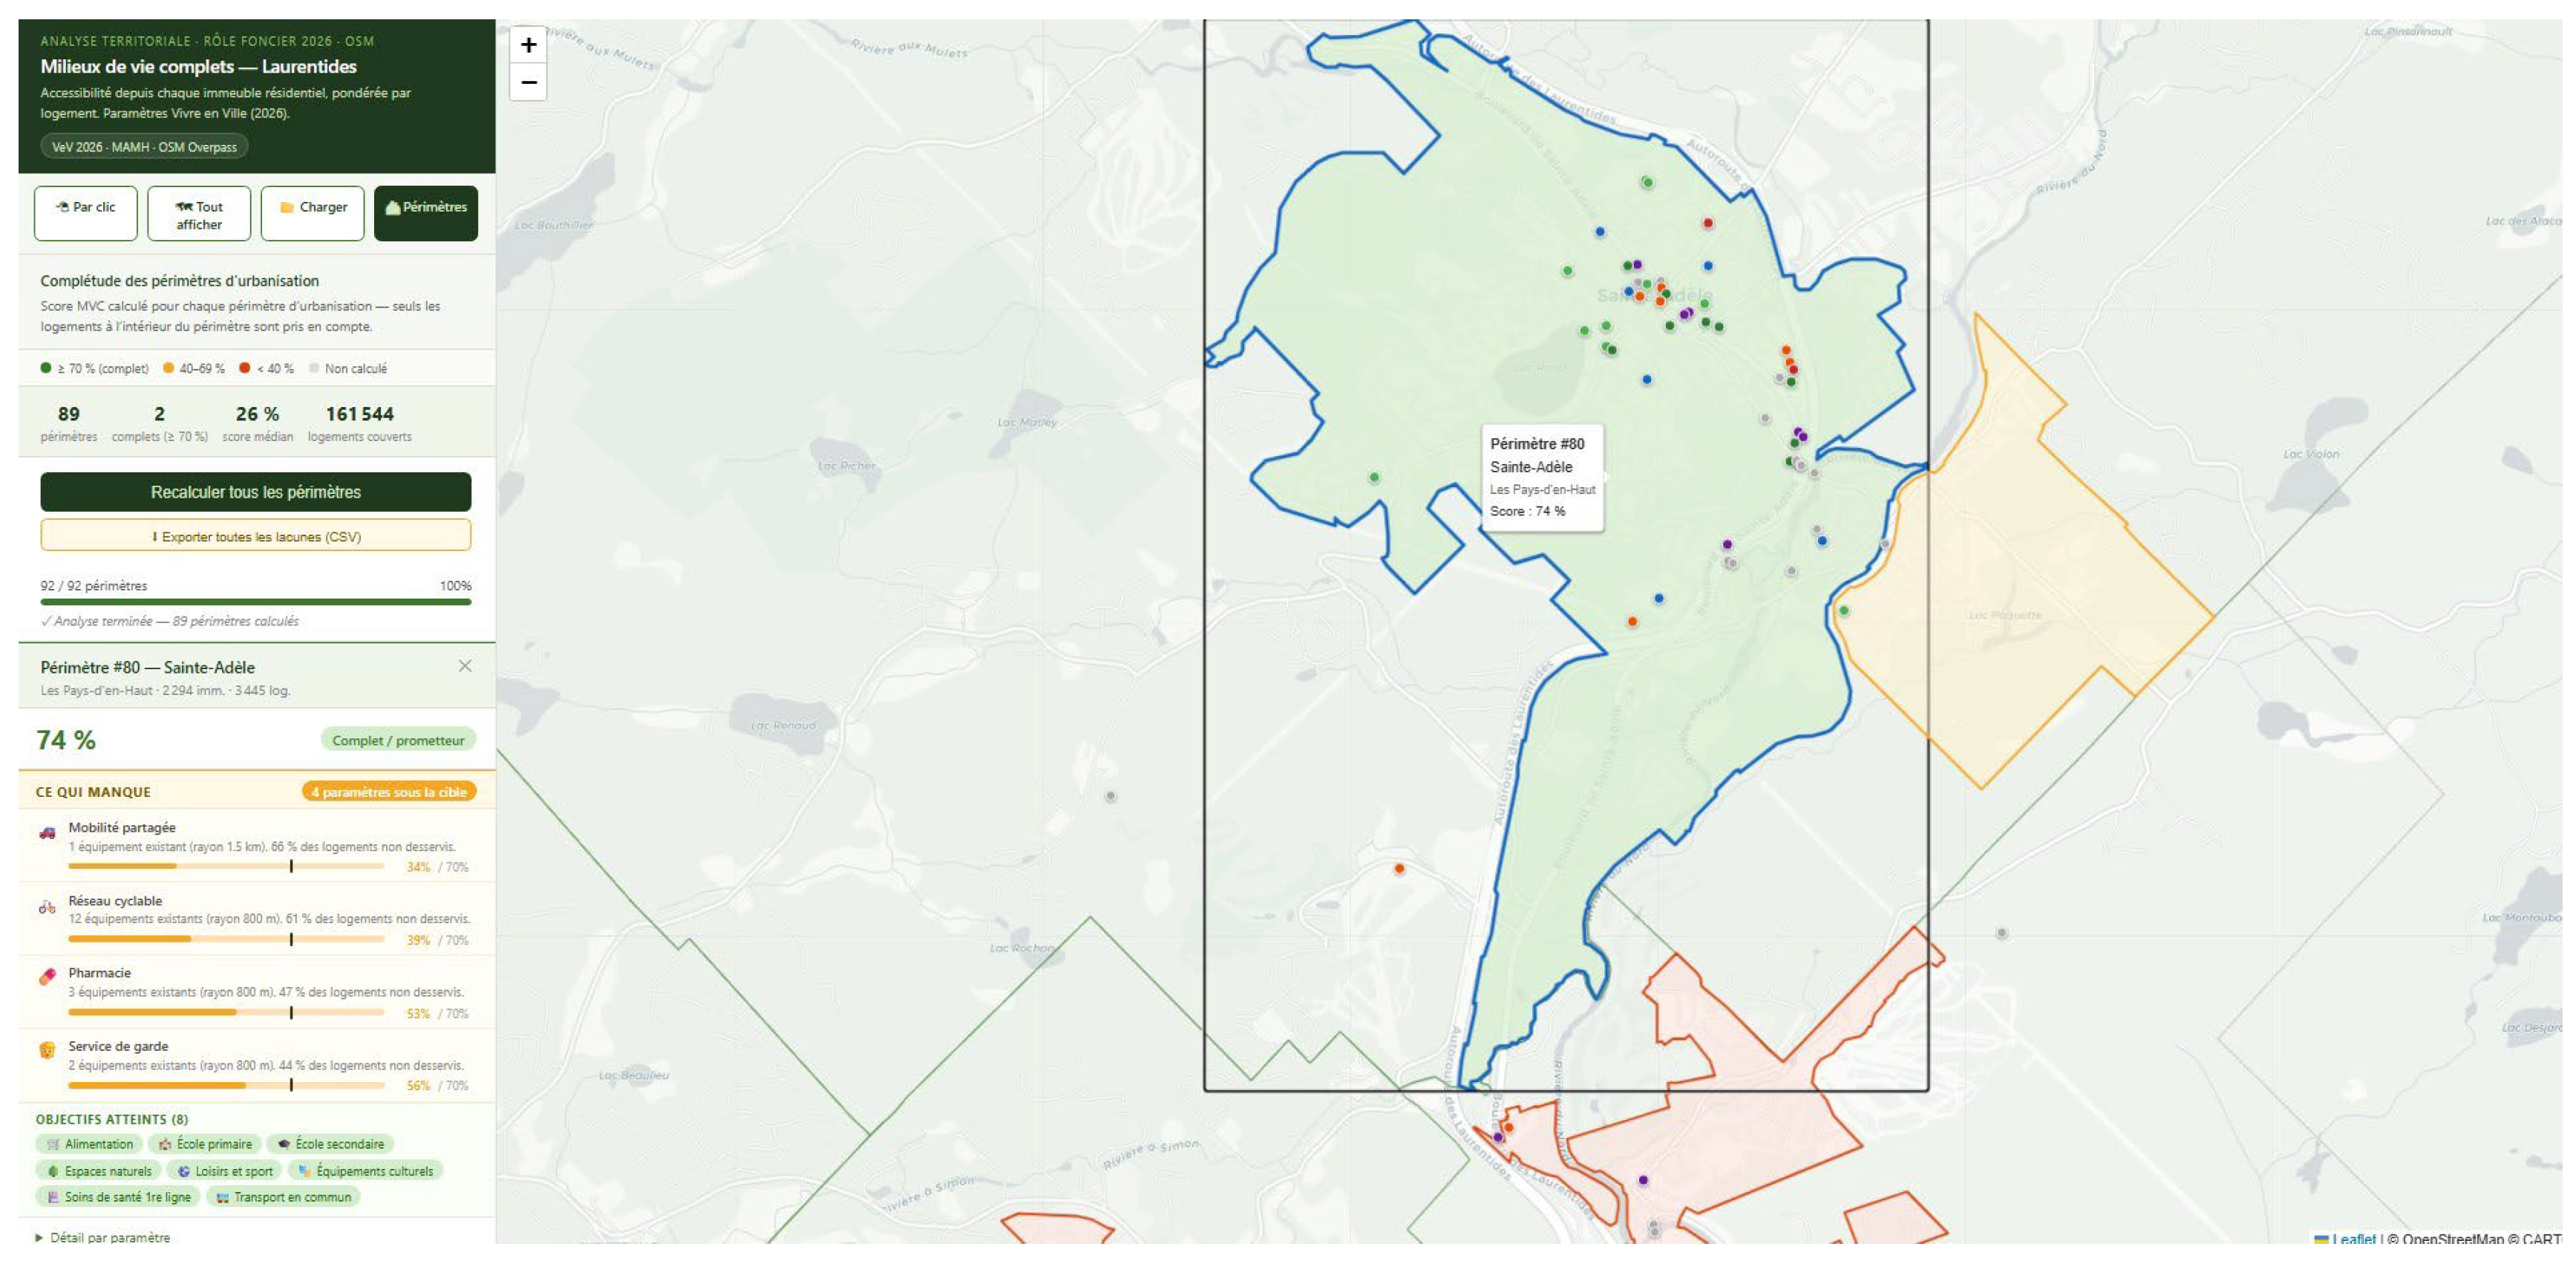
Figure 4.
Urban perimeter analysis for Mont-Tremblant urban core (Périmètre #60, MRC des Laurentides). Score: 74 % (5 parameters below target: shared mobility 0 %, pharmacy 30 %, cultural facilities 53 %, childcare 55 %, primary school 62 %). Buildings: 2,283; units: 3,774. Analysis: 11 May 2026.
Figure 4.
Urban perimeter analysis for Mont-Tremblant urban core (Périmètre #60, MRC des Laurentides). Score: 74 % (5 parameters below target: shared mobility 0 %, pharmacy 30 %, cultural facilities 53 %, childcare 55 %, primary school 62 %). Buildings: 2,283; units: 3,774. Analysis: 11 May 2026.
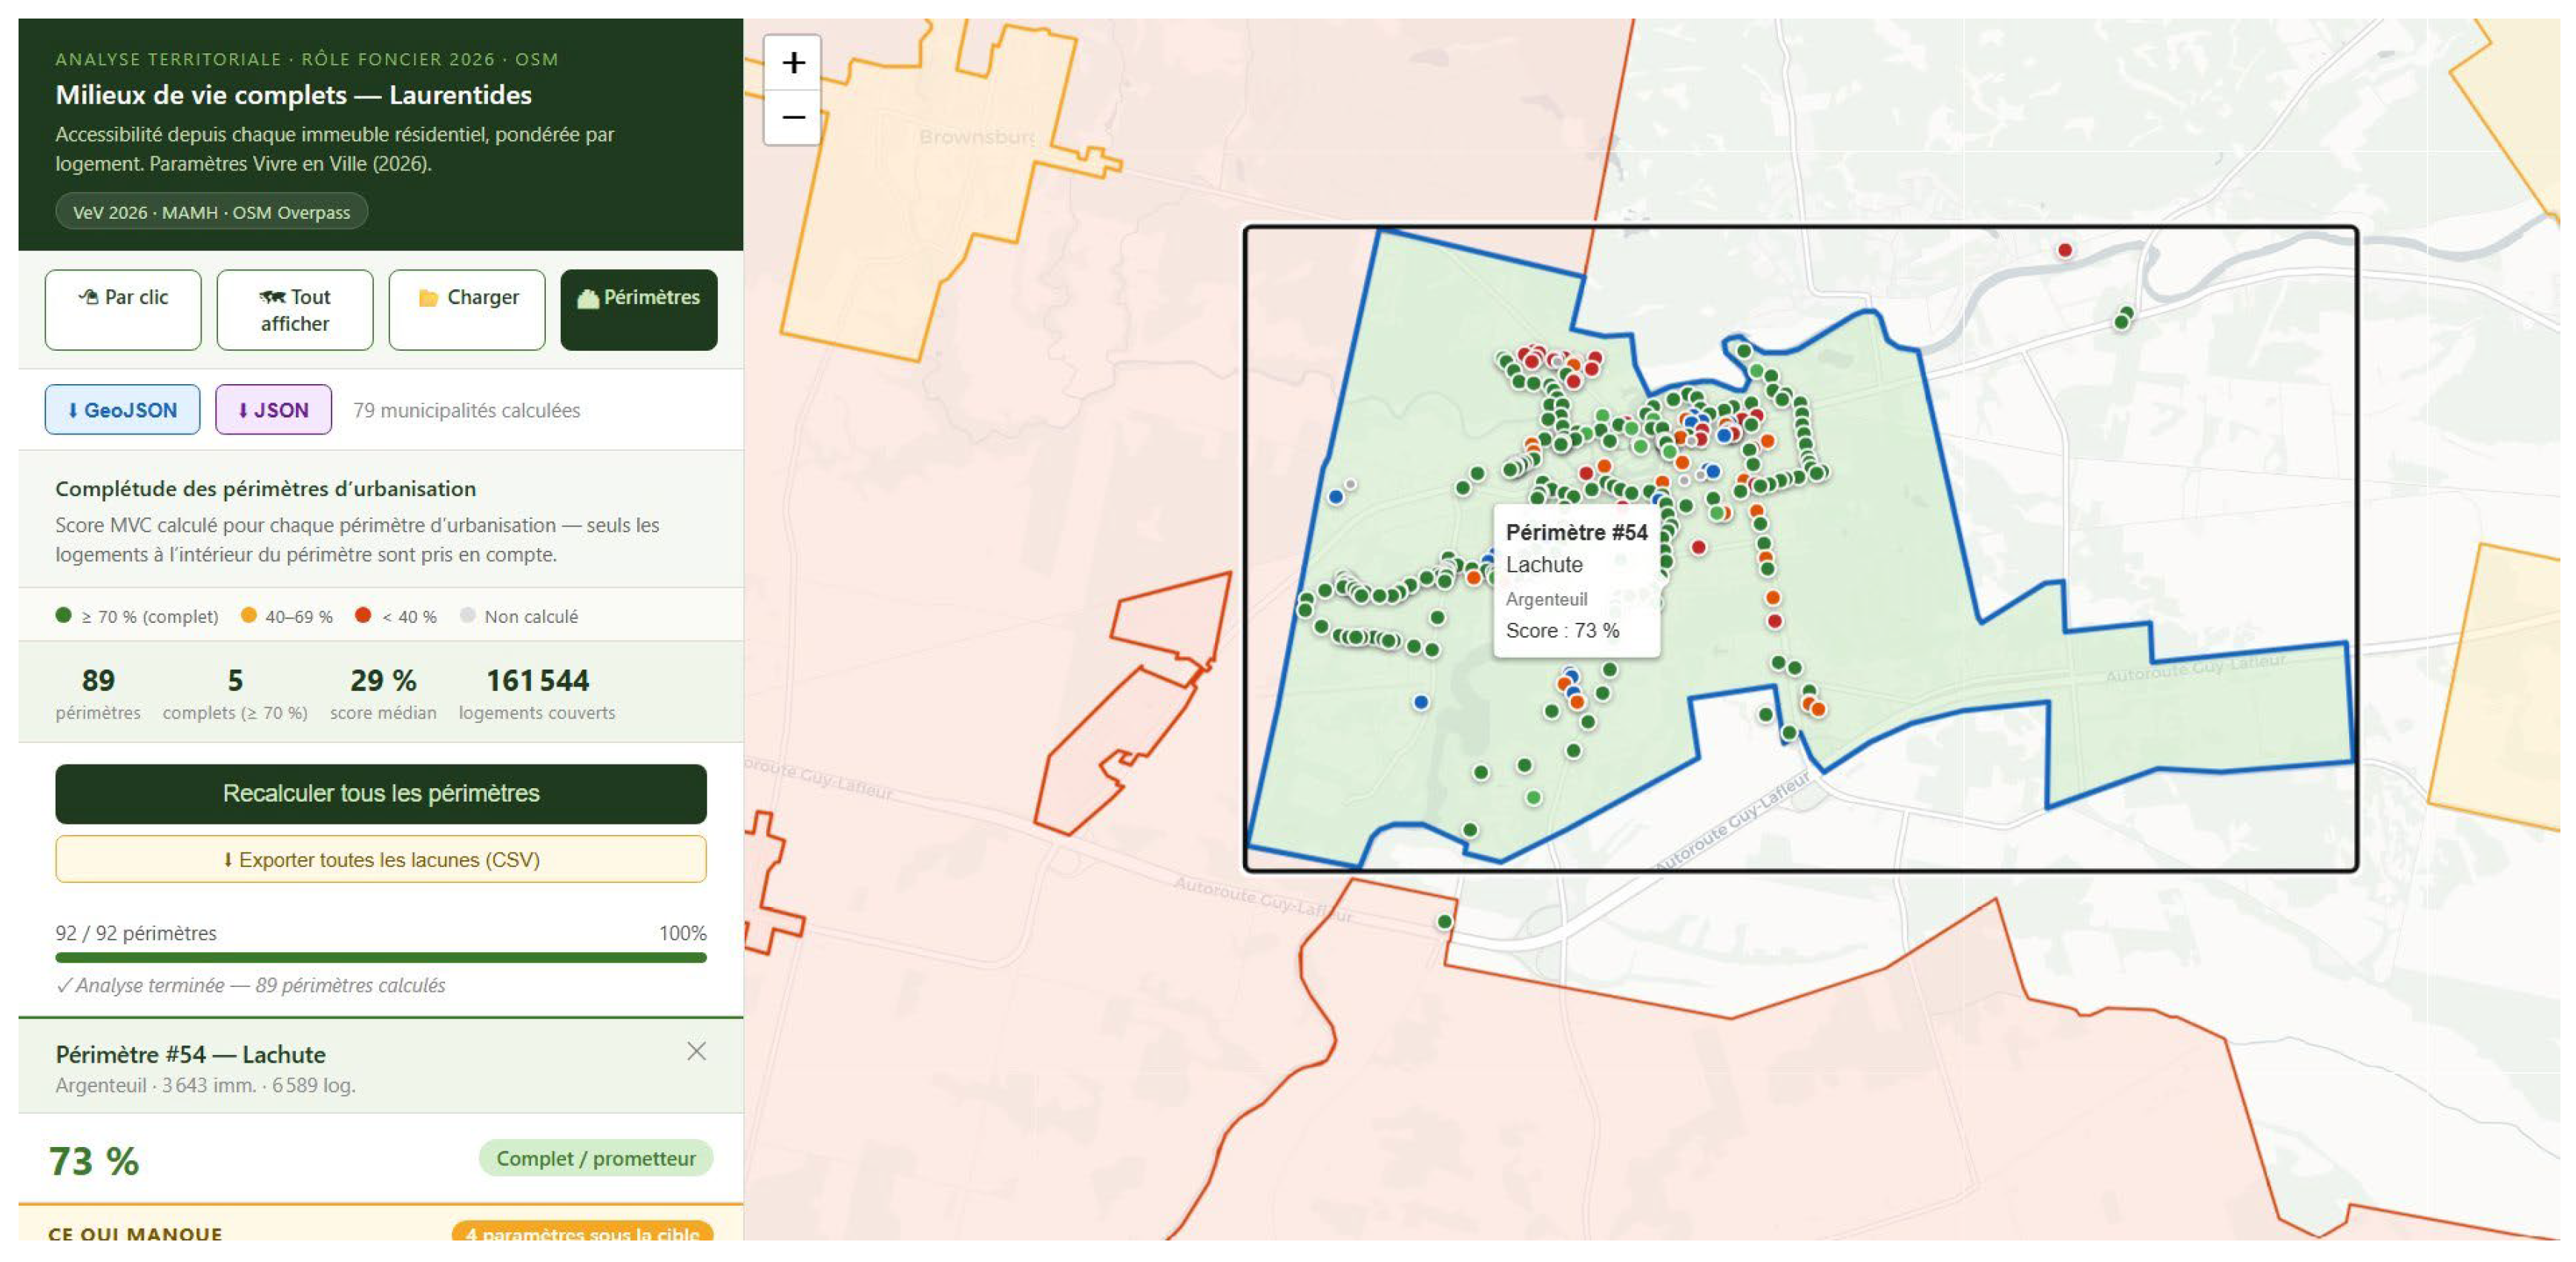

Table 1.
Data sources integrated in MilieuxVie.
| Source | Data type | Year | Use in MilieuxVie |
|---|---|---|---|
| MAMH property roll | Residential parcels (pts, n=234,466; 305,827 units) | 2026 | Origin points; dwelling-unit weighting |
| OpenStreetMap / Overpass API | Points of interest (12 service categories) | Real-time | Destination locations |
| MELCCFP / MAMH | Local territorial unit boundaries and areas (93 polygons: 76 municipalities, 15 TNOs, 2 indigenous territories) | 2024 | Spatial units; milieu-type classification |
| MAMH (OGAT) | Urban perimeter polygons (92 features, 53 munis) | 2024 | Sub-municipal analysis unit |
| Statistics Canada | Census housing typology (tenure, bedroom distribution) | 2021 | Housing dimension (4 parameters) |
| SHQ | Subsidised housing provider locations (41 organisations) | 2026 | Affordability cartographic layer |
Table 2.
OSM service categories, Overpass tag matching rules, and adaptive distance thresholds by milieu type.
Table 2.
OSM service categories, Overpass tag matching rules, and adaptive distance thresholds by milieu type.
| Service category | Overpass tags (OSM) | Dense (≥100 log/km²) | Intermediate (10–100 log/km²) | Rural (<10 log/km²) |
|---|---|---|---|---|
| Food retail | shop=supermarket|convenience|grocery… | 800 m | 1 500 m | 3 000 m |
| Childcare | amenity=kindergarten|childcare | 400 m | 800 m | 1 500 m |
| Primary school | amenity=school (non-secondary) | 800 m | 1 500 m | 3 000 m |
| Secondary school | amenity=school|college (secondary) | 1 600 m | 3 000 m | 5 000 m |
| Green/natural space | leisure=park|garden; landuse=forest | 400 m | 800 m | 1 500 m |
| Recreation & sport | leisure=sports_centre|pool|pitch… | 800 m | 1 500 m | 3 000 m |
| Cultural facilities | amenity=library|theatre|cinema… | 800 m | 1 500 m | 3 000 m |
| Pharmacy | amenity=pharmacy | 400 m | 800 m | 2 000 m |
| Primary healthcare | amenity=clinic|hospital|doctors… | 800 m | 1 500 m | 5 000 m |
| Public transit | highway=bus_stop; railway=station… | 800 m | 1 500 m | 3 000 m |
| Shared mobility | amenity=car_sharing|bicycle_rental | 800 m | 1 500 m | 3 000 m |
| Cycling network | highway=cycleway; bicycle=designated | 400 m | 800 m | 1 500 m |
Table 3.
Distribution of composite MVC scores by milieu type, Laurentides region, 2026.
| Milieu type (density criterion) | n | Mean (%) | Median (%) | Min–Max (%) | Developing/Incomplete |
|---|---|---|---|---|---|
| Dense (≥100 log/km²) | 30 | 26.7 | 26 | 1–60 | 10 / 20 |
| Intermediate (10–100 log/km²) | 32 | 19.3 | 16.5 | 2–49 | 5 / 27 |
| Rural (<10 log/km²) | 17 | 9.8 | 10 | 0–31 | 0 / 17 |
| All scored municipalities (79) | 79 | 20.1 | 15 | 0–60 | 15 / 64 |
Table 4.
Median and mean composite MVC scores by MRC, Laurentides region, 2026.
| MRC | n | Mean (%) | Median (%) | Range (%) |
|---|---|---|---|---|
| Mirabel | 1 | 32.0 | 32 | 32–32 |
| Thérèse-De Blainville | 7 | 46.1 | 44 | 37–60 |
| Deux-Montagnes | 8 | 31.5 | 28 | 9–55 |
| Les Pays-d’en-Haut | 10 | 15.1 | 14.5 | 0-42 |
| La Rivière-du-Nord | 5 | 15.8 | 10 | 4–41 |
| Les Laurentides | 20 | 18.2 | 13,5 | 0–49 |
| Antoine-Labelle | 19 | 13.7 | 12 | 0–43 |
| Argenteuil | 9 | 13.6 | 5 | 1-47 |
Table 5.
Mean and median scores (% dwelling units within target radius) for 12 OSM service parameters across 79 scored territorial units (excluding Kanesatake; see text) and 89 scored urban perimeters, Laurentides 2026. Parameters ranked by municipal median score (descending).
Table 5.
Mean and median scores (% dwelling units within target radius) for 12 OSM service parameters across 79 scored territorial units (excluding Kanesatake; see text) and 89 scored urban perimeters, Laurentides 2026. Parameters ranked by municipal median score (descending).
| Parameter | Muni mean % | Muni median % | Munis ≥70% (n/79) | PU median % | PUs ≥70% (n/89) | Rank (gap) |
|---|---|---|---|---|---|---|
| Food retail | 42.5 | 40 | 17/76 | 96 | 23/89 | 12 |
| Natural / green space | 38.0 | 36 | 8/76 | 75 | 54/89 | 11 |
| Primary school | 30.7 | 26 | 11/76 | 62 | 46/89 | 9 |
| Cycling network | 31.1 | 27 | 16/76 | - | 64/89 | 10 |
| Secondary school | 12.4 | 0 | 8/76 | 0 | 77/89 | 7 |
| Public transit | 24.9 | 0 | 15/76 | 0 | 63/89 | 8 |
| Cultural facilities | 23.7 | 22 | 3/76 | 0 | 57/89 | 6 |
| Healthcare (primary) | 11.6 | 0 | 3/76 | 0 | 79/89 | 4 |
| Recreation & sport | 13.6 | 0 | 3/76 | 0 | 71/89 | 5 |
| Pharmacy | 9.7 | 0 | 0/76 | 0 | 83/89 | 3 |
| Childcare | 5.6 | 0 | 0/76 | 0 | 89/89 | 2 |
| Shared mobility | 3.2 | 0 | 1/76 | 0 | 87/89 | 1 |
Disclaimer/Publisher’s Note: The statements, opinions and data contained in all publications are solely those of the individual author(s) and contributor(s) and not of MDPI and/or the editor(s). MDPI and/or the editor(s) disclaim responsibility for any injury to people or property resulting from any ideas, methods, instructions or products referred to in the content. |
© 2026 by the authors. Licensee MDPI, Basel, Switzerland. This article is an open access article distributed under the terms and conditions of the Creative Commons Attribution (CC BY) license (http://creativecommons.org/licenses/by/4.0/).
Copyright: This open access article is published under a Creative Commons CC BY 4.0 license, which permit the free download, distribution, and reuse, provided that the author and preprint are cited in any reuse.