

Submitted:
23 May 2026
Posted:
25 May 2026
You are already at the latest version
Abstract
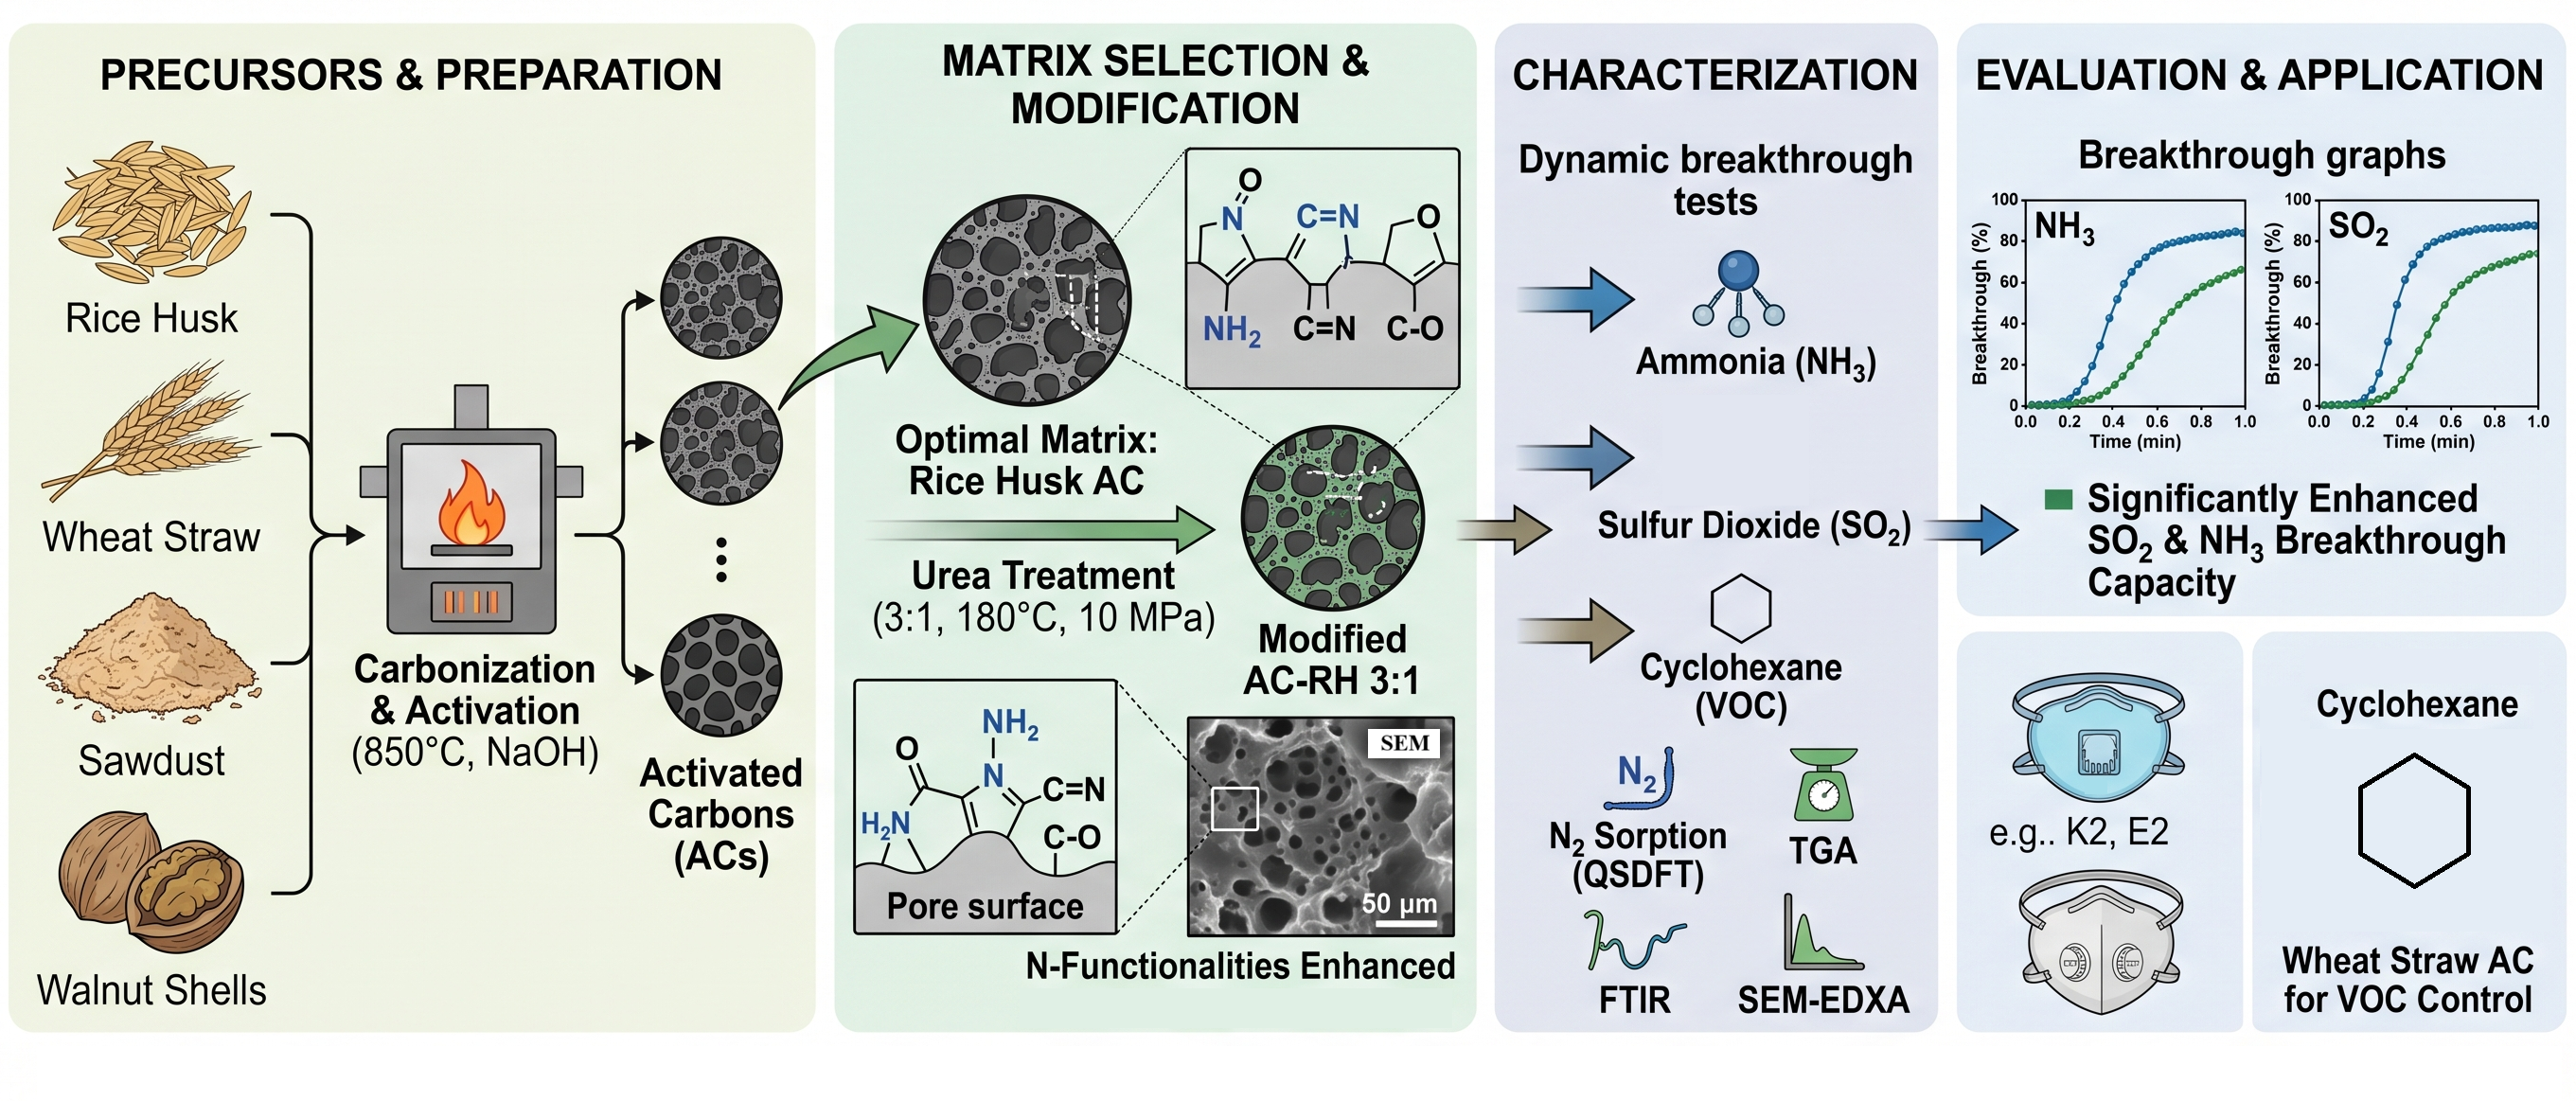
The growing demand for efficient and sustainable materials for air purification has stimulated interest in activated carbons derived from renewable biomass resources. In this study, activated carbons were prepared from rice husk, wheat straw, sawdust, and walnut shells and systematically investigated as sorbents for toxic gases and volatile organic compounds. The materials were characterized using nitrogen and water vapour sorption isotherms, scanning electron microscopy, thermogravimetric analysis, Fourier-transform infrared spectroscopy, and energy-dispersive X-ray analysis to evaluate their textural properties, morphology, thermal stability, and surface chemistry.
The results showed that the precursor type strongly influences the pore structure and functional group composition of the activated carbons. Wheat straw and Rice husk–derived activated carbons exhibited the highest total pore volume and a well-developed porous structure, together with a high content of oxygen- and silicon-containing elements.
Gas breakthrough experiments with different probes showed that wheat straw–derived activated carbon excels in VOC removal due to its highly microporous structure. In contrast, rice husk–derived activated carbon displays strong affinity toward inorganic gases such as NH₃ and, after urea modification, achieves enhanced performance for SO₂. These results underscore the versatility and practical applicability of carbon materials obtained from plant residues.
Keywords:
activated carbon
; plant residues
; urea
; sorption
; toxic gases
1. Introduction
Toxic gases and volatile substances pose serious risks to both the environment and human health. The content of toxic substances increases due to production factors in industry, as well as a result of geological shifts and natural phenomena. Natural pollution processes include volcanic eruptions, wildfires, reactions initiated by lightning discharges [1,2]. Anthropogenic sources can be divided into the following groups: energy production (fuel combustion) [3,4] , transport (land, water and air) [5,6], technological processes (oil refineries, chemical industry, metallurgy, coal industry) [7,8] and households (methane emissions from livestock breeding, VOCs (volatile organic compounds) formation by veterinary drugs degradation) [9,10,11].
The main pollutants are nitrogen and sulfur compounds (NOx, SOx, H₂S), carbon dioxide, carbon monoxide, hydrocarbons (methane, propane, cyclohexane), and other volatile organic compounds (chlorinated hydrocarbons CHxCly, formaldehyde and HCN).
Adsorption is becoming increasingly valuable among other well-known methods for cleaning industrial emissions, as it allows for the removal of almost all pollutants from gas streams. Solid materials with an enlarged surface, made in the form of granules or fine-grained materials, are usually used as adsorbents. Carbon materials are one of the main sources of sorbents used to purify industrial emissions from toxic and volatile compounds. Any organic compounds with a high carbon content can be sources of activated carbons. The growing industrial demand for carbon-containing sorption materials, along with the depletion of fossil resources and stricter environmental requirements, prompted the search for new precursors for the production of activated carbons. Plant waste such as rice husks, wheat straw, walnut shells, and others can be considered very promising, economically profitable, and permanently renewable sources [12,13,14].
While the retention of organic compounds on carbon sorbents is mainly governed by physisorption, the removal of inorganic species often benefits from the presence of reactive surface sites. These can be introduced through impregnation with suitable compounds—such as transition—especially for gases like NOx, SOx and H₂S, although for others, including NH₃, milder surface treatments that adjust the surface chemistry are sufficient.
In this work, activated carbons obtained from rice husk, wheat straw, sawdust and walnut shells were evaluated for the removal of VOCs and inorganic gases. Some of these materials were further modified to enhance their performance, and several of them showed promising results for potential use in gas-filter applications. The discussion of the results is grounded in their porosity, surface chemistry and composition, as revealed by the thorough characterization performed.
2. Materials and Methods
2.1. Raw Materials
Wheat straw, coniferous Sawdust, Rice husks collected in the Almaty region, and Walnut shells collected in the Medeu district Almaty city were used as the main raw materials for the development of porous sorbents.
2.2. Carbonization of Raw Materials
The carbonization process of the raw materials was conducted in a steel reactor, which was placed inside a vertical furnace equipped with a thermocouple. Before the starting heating process, nitrogen was allowed to flow for 30 min to remove the air in the tube, after which the temperature was increased. The samples were heated to 850 °C for 120 minutes with controlling heating rate 3 °C/min, after which the temperature was lowered to 650 °C and maintained for an additional 90 minutes. Once the heating stage was complete, the samples were gradually cooled to room temperature. This method facilitated the formation of a porous structure in the carbon material and helped in the removal of volatile compounds.
After carbonization, the samples were boiled in distilled water to eliminate any residual impurities. This boiling process was performed at a temperature of 95-100 °C on a laboratory stove with constant stirring, which enhanced the effective removal of undesirable water-soluble compounds. Following this, the samples were dried in a drying cabinet at a temperature of 100-105 °C until all moisture was completely removed. This stage ensured the stabilization of the material’s structure prior to further use.
2.3. Activation of Carbonized Raw Material Samples
Carbonized samples were activated with the addition of NaOH in a 1:2 mass ratio (alkali/sorbent). Pre-mixed samples of carbonized material and alkali were left overnight in a drying cabinet at a temperature of 70 °C. Activation is carried out at a temperature of 850 °C for 120 minutes and then the temperature is gradually reduced to room temperature. The activation process takes place in a vertical steel furnace under an inert gas-argon blanket, which was constantly fed at a flow rate of 50 cm3/min. The activated carbon obtained from plant wastes was washed with deionized water three times to remove the soluble ash content, including sodium salts doped in the activated carbon, which can block pores [15].
2.4. Modification of Activated Carbon Samples
The activated carbon is then mixed with a 30% urea solution in a 3:1 and 2:1 (urea/carbon) mass ratio and loaded into a mini-reactor with mechanical stirring YZPR-250M (BOYN, China). The process takes place at a temperature of 180 °C in an inert nitrogen environment and under a pressure of up to 10 MPa to modify carbon samples by urea.
After the modification was completed and pressure was reduced to normal, samples were heated at the vertical furnace to the 600 °C to release non-bounded urea and water from carbon pores. Modified activated carbon was then washed with 10% hydrochloric acid to remove the impurities generated during the modification process, and then washed by deionized water several times [16].
2.5. Characterization of Activated Carbon
The chemical composition of the samples of activated and modified carbons was studied using scanning electron microscopy (SEM) «QUANTA 3D 200i» (FEI, USA), in combination with an EDAX spectrometer and a semiconductor detector with an energy tolerance of 128 eV (polymer material, sensitive area d = 0.3 mm).
The infrared spectra of the samples were recorded using a Spectrum 65, Perkin & Elmer 1100 FTIR spectrometer in the range of 4000-400 cm-1 using KBr granules with a resolution of 1 cm⁻1. A pellet for infrared studies was obtained by mixing this sample with KBr crystals and pressing into a pellet.
Thermogravimetric analysis was conducted using a Mettler Toledo TGA–DSC 3+ instrument with a heating rate of 10 °C/min up to 900 °C.
The water isotherms were measured at a temperature of 20 °C using a gravimetric water sorption analyzer (Aquadyne DVS, Quantachrome Instruments). Each point of the gravimetric isotherm was obtained after reaching an equilibrium time corresponding to a 0.0008% change in mass per minute at a given relative humidity.
2.6. Gas Sorption Experiments
The experimental gas (NH₃ or SO₂) sorption unit was performed in accordance with the ISO 10121-1 standard “Test method for assessing the performance of gas-phase air cleaning media and devices for general ventilation” [17]. The installation scheme is shown in Figure 1 as it was described in [18].
The conditions for conducting experiments on gas sorption are a temperature of 23 °C and a relative humidity of no more than 50%. The 4.5.0 l/min airflow was divided into two, while the 4 l/min airflow passed through a water bath and then mixed with the 0.495 l/min airflow containing the toxic gas (NH₃ or SO₂). The total humidity of the air and analyzed gas mixture was 50%, and the concentration of polluting gas was 90 ppm.
The resulting gas mixture is directed at a rate of 130 ml/s to an adsorption chamber, into which 3 g of carbon sorbent is placed, the current concentration is determined using an analyzer that outputs the results directly to a PC. The experiment is stopped when the gas concentration reaches 30-35 ppm for NH₃ and 6-8 ppm for SO₂. All samples were analyzed in at least three repetitions. The GT-FGA1000L (Allred, Qingdao China) analyzer was used for controlling gas concentrations.
3. Results and Discussion
3.1. Characterization of Activated Carbons Prepared from Plants Residues
The objective of this study was to analyze the porosity of the carbons obtained from plant wastes and determine their adsorption capacity for organic contaminants. Before the analysis, the materials were outgassed for 17 hours at 120 °C and then nitrogen adsorption-desorption isotherms at -196 °C were recorded. Results of nitrogen sorption analysis are presented in Figure 2.
The isotherms of the activated Wheat Straw, Sawdust, and Greek walnut carbon samples have a similar profile and do not intersect, showing a decrease in the adsorption capacity, respectively. These isotherms are typical of microporous materials. However, the shape of the isotherm of the activated carbon from Rice Husk sample indicates a micro-mesoporous nature, achieving the highest total pore volume. On the other hand,the non-activated carbonized samples display a non-developed porosity. Moreover, the analysis was extremely slow, indicating a constricted access of the nitrogen.
In order to confirm the assumptions regarding the porous structure of the samples, the QSDFT model with slit pore geometry for carbon materials was applied, allowing the determination of the pore size distribution. The results of the analysis are shown in Figure 3.
In Figure 3, it is clearly observed that the sample with the highest presence of mesopores (pore width between 2 and 50 nm) is the Rice Husk activated sample. In this regard, it is worth noting that these are narrow mesopores, with a size smaller than 6 nm. It is also important to note that the other three samples exhibit very similar pore size distributions, although with different peak intensities. Similar characteristics of the distribution of meso- and micropores in carbonized plant samples with other methods of carbon activation are noted in the works of other authors [19,20,21].
Table 1 presents the textural parameters of the activated carbons prepared from various plant sources. The N₂ adsorption isotherms were used to determine the BET specific surface area (SBET), the micropore volume (calculated using the Dubinin–Radushkevich equation), and the mesopore volume (obtained as the difference between the total pore volume and the micropore volume). The QSDFT results are presented to illustrate the micropore size distribution, distinguishing between ultramicropores (µmicro, with pore widths lower than 0.7 nm) and total microporosity.
Wheat Straw is the precursor that generates the highest microporosity (0.317 cm3/g), together with the largest SBET (859 m2/g), whereas the Walnut-derived sample exhibits the lowest overall pore development, both in the micro- and mesopore ranges. Sawdust shows an intermediate behaviour between these two extremes. In contrast, rice husks developed the largest total pore volume and the highest mesopore contribution (0.183 cm3/g). Interestingly, despite the nearly identical micropore volumes of the Sawdust- and Rice Husk-derived carbons, the logarithmic isotherm plot and the QSDFT analysis reveal a higher proportion of ultramicropores in the former: 0,193 vs 0,150 cm3/g, respectively. This means that the Sawdust precursor enables a narrower microporosity than Rice Husk. (Figure 3 and Table 1). The close agreement between micropore volumes calculated by DR and QSDFT confirms the consistency of the analysis.
Based on these results, activated Straw would be the optimal material for the adsorption of organic contaminants such as cyclohexane because highly microporous carbons favor VOC adsorption due to strong confinement and enhanced adsorption potentials. On the other hand, rice husk can be a good candidate for the retention of inorganic gases because micro–mesoporous carbons typically provide improved diffusion and accessibility. This will be further evaluated and discussed below.
The capacity values towards cyclohexane retention obtained after integrating the breakthrough time curves measured with an automatic DVS instrument (MixSorb S, 3P Instruments) operated under dry conditions are recorded in Table 2. As expected, the values follow the same trend as the one obtained for the BRT specific surface area, being activated Straw the material with the highest capacity. This is due to the fact that cyclohexane is preferentially adsorbed in the micropores. It is worth noting that the capacity calculated for the walnut-based material is lower than what could be potentially expected. This behavior may be attributed to a less interconnected pore structure, which hinders cyclohexane accessibility, and/or to a significant fraction of very narrow ultramicropores that are not accessible to the target compound. Similarly, the sorption performance of the activated Rice Husk towards cyclohexane appears to be enhanced compared to Sawdust, likely due to the presence of a mesoporous network that improves the accessibility of the organic molecule to preferential adsorption sites, as well as a lower fraction of such inaccessible ultramicropores.
Figure 4 presents scanning electron microscopy (SEM) images of activated carbon samples produced from various plant materials. Figure 4a shows the sample form of straw, which has a more fibrous and less macroporous structure than rice husk carbon. This fibrous nature is likely due to the retention of the original plant cell structure during the carbonization process, contributing to the mechanical strength of the activated carbon.
The structure of this material makes it suitable for use as a mechanically stable material, especially in applications where preserving structural integrity is essential for effective gas filtration while avoiding damage to the filter medium.
Figure 4b illustrates activated carbon derived from sawdust. The activated carbon exhibits a more elongated and layered structure, with visible grooves and channels on its surface. This suggests that the original fibrous structure of the sawdust has been partially preserved during the heating process. This layered structure could potentially serve as pathways for water and nutrient transportation, making the activated carbon beneficial for agricultural purposes.
In contrast, Figure 4c presents activated carbon produced from rice husks. This activated carbon displays a highly porous structure, characterized by numerous macropores as observed in the SEM images, as well as smaller cavities and interconnected networks inferred from nitrogen adsorption isothermsThis porosity is a result of the thermal decomposition of organic matter during the carbonization process. Due to its high overall porosity and the presence of an interconnected porous structure, rice husk-derived activated carbon is lightweight and suitable for applications requiring high levels of adsorption, such as the removal of pollutants from air.
Figure 4d illustrates a walnut shell-derived activated carbon, which also exhibits a fibrous structure, although with larger visible pores and cavities compared to rice husk-based biochar. These features suggest that walnut biochar may be well-suited for the adsorption of high molecular weight organic substances due to its porosity. Despite this, the structure remains intact, indicating that this biochar could still offer benefits in terms of soil aeration and water retention [22].
In industry, the process of filtering gases and volatile substances with sorbents often occurs at high temperatures, and therefore, the materials used for sorption must be temperature-stable. The following graphs show the thermogravimetric results, illustrating the evolution of the sample weights with temperature in an inert atmosphere (Ar). The samples were heated up to 900 °C, with a heating ramp of 10 °C/min (Figure 5).
The first observation is that, as expected, activated samples lose more mass than carbonized samples as temperature increases, which can be attributed to a higher number of surface groups in activated samples. Among these, the activated walnut sample shows the greatest mass loss. When comparing Figure 5a and Figure 5b, it is evident that curves generally follow a similar trend, except for the walnut activated sample, which shows a noticeably steeper slope and drops below other curves at an earlier stage. Walnut shells usually contain a significantly higher lignin content (≈45–55%) than sawdust or rice husk (≈20–30%), as reported in Fengel & Wegener and Demirbas [23,24]. Since lignin produces highly aromatic and defect-rich chars, these precursors develop a greater density of reactive sites during KOH activation, which favors the incorporation and stabilization of oxygen surface groups [25,26]. Lignin produces a highly aromatic, cross linked char with more edge sites, more vacancies and more disordered carbon.
These are exactly the sites where KOH reacts most aggressively, forming oxygenated surface groups. The decomposition temperatures of these functionalities (carboxylic, phenols, lactones, and carbonyls) match well with the thermal profile.).
In order to study the nature of the lateral functional groups, we performed an IR analysis of all activated carbon samples (Figure 6).
As expected, all four samples have characteristic peaks of hydroxyl groups (-OH) in the region of 3300-3500 cm-1, as well as carboxyl and carbonyl groups (-С=O) in the region of 1650 cm-1. Carboxyl and carbonyl groups in activated carbon samples appear during the thermal treatment of plant samples - in the process of high-temperature pyrolysis. The above mentioned functional groups may be responsible for the chemical interaction of activated carbon with positively charged groups of the sorbed samples, for example with ammonia, ammonium containing compounds, as well as with metal cations.
However, there are also minor differences in the IR spectra of the analyzed samples. Thus, the carboxyl/carbonyl peak in the Wheat Straw sample is wide and shifted to the long-wavelength side, and the peak is located at a wavenumber of 1500-1600 cm-1. Additionally, the band at 2860-2920 cm⁻1 corresponds to C-H stretching, further indicating the presence of aliphatic hydrocarbons in Sawdust and Rice husk.
Activated carbon from Rice Husks and Wheat Straws also has a slight peak in the range of 1250-1300 cm-1, which is typical for functional groups of -C-O-C- - valence vibrations in esters.
An important and significant difference of activated carbon sample from the Rice Husks is a wide peak at a wave number of 1000-1100 cm-1, which is a parameter indicating the manifestation of silica (Si–O–Si) structures. A similar, but not distinct broad peak is observed in the spectrum of Wheat Straw and Walnut shell samples at 1200-1050 cm-1, which may also indicate the presence of silicon-related groups [28].
These changes confirm that activation promotes the introduction of oxygen-containing functional groups and improves the structural organization of the material, including the porosity of the surface.
In order to study the effect of oxygen groups on the surface properties of activated carbon samples, we studied their ability to adsorb water vapor at different ambient humidity levels (Figure 7).
Figure 7 clearly shows that Greek walnut is the most hydrophilic material, as it exhibits the highest sorption capacity at low relative humidity, where surface chemistry governs water vapor adsorption. This behavior is consistent with the TG profiles (Figure 5b), which show the most intense drop around 150 °C for the activated Walnut, indicating a higher amount of strongly adsorbed water compared to the other samples.
Moreover, it displays a total water uptake comparable to that of activated Straw, despite the latter having a more developed porosity (Table 1). At higher relative humidity, porosity becomes the dominant factor controlling water uptake, as observed for the rice husk and straw samples, which reach values of about 32–34% at relative humidities above 90%. In contrast, the sawdust sample shows the lowest water vapor adsorption at high relative humidity.In order to confirm the presence of silicon, oxygen and other compounds in activated carbon samples, EDAX analysis were performed (Figure 8).
The results of the EDAX analysis confirmed the results of the FTIR spectra regarding the presence of silicon compounds in activated carbon samples in Rice Husk (Figure 8a) and Wheat Straw (Figure 8b). Thus, the content of silicon atoms in Rice Husks is up to 17%, and in Wheat Straw 5%, respectively. It should be noted that Se compounds (up to 1%) are also present in Rice Husks and Wheat Straw. As it is known, selenium compounds play an important role as trace elements that increase the stress resistance of agricultural crops [29].
A very important fact is that the oxygen content in the Rice Husk sample is up to 37%, which may be directly related to the increased bonding of silicon atoms and compounds such as Si–O–Si (silica, silicates), Si–O–C at the carbon–silica interface, aromatic C–O–C (ethers), conjugated C=O in a highly stabilized carbon matrix. These oxygen containing groups did not act valuably on hydrophilic properties of Rice Husk sample surface. Otherwise, a higher mass loss during the thermogravimetric analysis and a higher water uptake should be observed.
The content of silicon compounds is also confirmed in the Sawdust and Walnut shell samples and reaches up to 3% (Figure 8c and Figure 8d). Also, in activated carbon samples from Wheat straw and Walnut the presence of Mg atoms in 1% ratio was found. Magnesium (Mg) is an essential macronutrient for plant growth, serving as the central atom in the chlorophyll molecule, which enables photosynthesis [30,31].
Summarizing the results of nitrogen and water adsorption, SEM, TG, FTIR and EDAX, activated straw and rice husks samples are the most interesting. Straw, displaying the largest micropore volume, is certainly the best material for VOC adsorption, since microporosity largely determines the overall adsorption capacity, and promotes strong physical interactions with the adsorbed molecules. This was further confirmed by breakthrough experiments with cyclohexane. On the other hand, rice husk, which has the largest total pore volume and the lowest hydrophilicity, is an interesting material, especially when conducting experiments in conditions of high humidity. [33,34,35]
3.2. Sorption of NH₃ on Various Carbon Samples
The sorption of ammonia was studied to evaluate the applicability of the activated carbon samples for the removal of inorganic gases. Ammonia sorption results are shown in Figure 9, and the corresponding breakthrough times are listed in Table 3.
As can be seen from Figure 9 and Table 3, the Rice Husk act sample has the maximum ammonia breakthrough time and ranges from 36 (2 ppm NH3) to 40 min (25 ppm NH3). Breakthrough time is a characteristic parameter of the sorbent that reflects its ability to retain the sorbed gas. The longer the breakthrough time, the higher the sorption capacity of the material, in this case for ammonia.Walnut shell and sawdust samples exhibit the lowest breakthrough times at both 2 and 25 ppm, which can be attributed to their less developed porosity, limiting ammonia adsorption that is largely governed by physisorption. However, surface chemistry also plays a role in ammonia sorption.
In this regard, Rice Husk act is an excellent sorbent for ammonia sorption due to the following reasons: i) it has a well-developed and interconnected porous structure, with the highest total pore volume and ii) according to TG analysis and water sorption isotherms, it is the most hydrophobic material, which is particularly advantageous under the humid conditions used in these experiments, as it minimizes competition between water and ammonia for the available adsorption sites. Based on these results and according to the classification in [36], gas masks using rice husk activated carbon can be classified as K2-type sorbents for ammonia.
3.3. Urea Modified Rice Husk Activated Carbon Properties
As the activated rice husk sample shows higher breakthrough time values for ammonia, it appears particularly promising as a more universal sorbent for inorganic gases. In this context, its surface was further modified using urea to enhance its affinity toward acidic gases such as SO₂, while aiming at preserving a hierarchical pore structure composed of macropores, mesopores, and micropores, which facilitates the diffusion of target molecules toward the adsorption sites [16]. Nitrogen sorption isotherms of Rice Husk before and after modification with urea are presented in Figure 10.
It can be clearly seen that the impregnation with urea negatively affects the textural properties of the initial material. However, the isotherm profiles remain very similar, still indicating the presence of both micropores and mesopores, albeit to a lesser extent.
The pore size distributions (Figure 11) further support this observation, showing nearly identical qualitative profiles, though with slight quantitative differences.
Textural parameters calculated from the nitrogen isotherms of urea-modified samples are presented at the Table 4.
As can be seen from Table 4, after urea-modification the value of the specific surface area of activated carbon samples decreases, as well as the volume of micropores and mesopores. Moreover, the more urea is used in the modification, the lower the values of the mentioned above parameters. Thus, in the case of the Rice Husk/urea 2:1 modification variant, the specific surface area is reduced by 35%, and the total pore volume by 34%. This indicates that the pores of activated carbon may be physically blocked by nitrogen-species formed after the treatment of urea.
In order to confirm the chemical modification of the oxygen groups by urea, we performed an FTIR analysis of the samples, the results of which are shown in Figure 12.
Comparison of FTIR spectra of activated rice husk and urea-modified samples Rice Husk Urea 2:1 and Rice Husk Urea 3:1 revealed characteristic changes. In both urea samples, a negligible enhancement of the bands in the region of 3400 cm⁻¹ is observed, which is associated with the introduction of amino groups (N–H) from urea. A pronounced peak in the region of 1634 cm⁻¹ indicates the formation of carbonyl and/or amide structures, especially at a ratio of 3:1, where C–N vibrations are also enhanced (~1450 cm⁻¹). This confirms a positive nitrogen modification of the carbon surface. The presence of Si–O–Si bands (~1000–1100 cm⁻¹) is preserved in all samples, but their intensity is lower than that of activated Rice Husk, indicating possible partial leaching or chemical interaction with urea thermolysis products.
EDAX analysis results of urea-modified activated carbon from Rice Husk also confirm of presence of nitrogen containing compounds (Figure 13).
EDAX analysis of urea-modified carbon samples shows that increasing urea ratio from 25 (for 3:1) to 33% (for 2:1) by mass causes slight increasing (only 2% difference) of nitrogen atoms content in samples. The filling of pores with urea molecules is also confirmed by the analysis of urea adsorption isotherms on activated carbon – the SBET of activated carbon decreases from 738 to 486 m2/g in sample with 2:1 carbon/urea mass ratio (Table 3). Thus, from EDAX, SBET results and FTIR spectra the chemical modification of the surface chemistryduring urea-modification process is confirmed.
3.4. Analysis of Sorption of SO2
In order to study the effect of urea modification on the sorption of negatively charged toxic gases, we studied the sorption of SO2 on activated and modified samples. The breakthrough curves are shown in Figure 14 and the breakthrough times presented in Table 5.
The breakthrough time curves for urea-modified rice husk samples showed that the modification increases the SO₂ breakthrough time by an average of 4 minutes. This indicates that, in addition to the physisorption of gas molecules on the sorbent, chemical modification with urea provides an additional contribution to increasing the breakthrough time. This effect is particularly relevant for SO₂, whose adsorption is known to involve not only physisorption but also chemisorption processes, especially through interactions with surface functional groups and nitrogen species introduced by modification [36]
At the same time, an increase in the urea content during sorbent modification does not lead to significant changes in this indicator. Apparently, the ratio of sorbent and urea 3:1 is sufficient to modify the surface of the sorbent and at the same time the pores of the sorbent are not clogged with urea-derived molecules and are suitable for sorption of other substances and gases. According to the classification in [37], gas masks based on urea-modified carbon from Rice husks can be classified as class and type E2.
Thus, breakthrough experiments show that the activated and urea-modified sorbents could be effective materials for gas masks production. The experimental results served as the basis for submitting an application and obtaining a patent for the invention of the Republic of Kazakhstan “Method for producing carbon sorbent” [38].
4. Conclusions
Among the different waste biomass precursors investigated, this study demonstrated that rice husk–based activated carbon exhibited the highest total pore volume and a well-developed interconnected porous structure (composed of macro, meso and micropores), together with a suitable composition and surface chemistry. These features resulted in superior sorption performance toward polar and positively charged gases, particularly ammonia, enabling classification of rice husk–based sorbents as K2-type materials according to EN standards. Chemical modification of rice husk activated carbon with urea further enhanced SO₂ breakthrough times, confirming that surface functionalization contributes significantly to chemisorption in addition to physical adsorption. Importantly, increasing the urea content beyond a 3:1 sorbent-to-urea ratio did not yield substantial additional benefits, indicating an optimal modification level that preserves pore accessibility. For the two gases studied, the hydrophobicity of this material contributed to improved performance under humid conditions, which are more representative of real operating environments. In particular, it reduces the competitive adsorption of water molecules, allowing the target gases to more effectively access and occupy the available sorption sites.
Additionally, wheat straw proved to be an effective precursor for the preparation of nanoporous carbons, whose highly developed microporous structure makes them particularly suitable for the removal of organic vapours such as cyclohexane. Overall, the results confirm that agricultural waste–derived activated carbons are promising, sustainable materials for gas purification and air filtration applications. The ability to tailor adsorption selectivity through precursor choice and surface modification highlights their strong potential for use in respirators, gas masks, and industrial emission control systems. Furthermore, the conversion of agricultural residues into activated carbons contributes to the recycling and valorization of biowaste streams, offering a cost-effective and environmentally sustainable approach to sorbent production. Future work should focus on long-term stability, regeneration efficiency, and performance under real operating conditions to support large-scale practical implementation.
5. Patents
Some of the results from the analysis of carbon samples from rice husks and walnuts formed the basis for the application and subsequent patenting of the invention “Method for Producing Carbon Sorbent” in the Republic of Kazakhstan. The patent number is 45454 and was granted on May 19, 2026.
Author Contributions
Conceptualization A.K. and A.S.; methodology Ye.Ye., L.F.V. and A.Zh.; validation G.N., V.Ye., O.D.; formal analysis Z.M., V.Ye. and M.A.; investigation Ye.Ye., N.A., A.Zh., A.Ku. and A.K.; writing—original draft preparation A.S. and A.K.; writing—review and editing A.S., L.F.V. and A.K. visualization L.F.V. and M.A.; supervision A.S. and L.F.V.; project administration A.K. All authors have read and agreed to the published version of the manuscript. All the submitted authors participated in the implementation of the AP22786556 grant as executors, either as full-time employees or as part of an agreement.
Funding
This work was supported by the Ministry of Science and Higher Education of the Republic of Kazakhstan grant (AP22786556).
Institutional Review Board Statement
Not applicable.
Informed Consent Statement
Not applicable.
Data Availability Statement
The original contributions presented in this study are included in the article/supplementary material. Further inquiries can be directed to the corresponding author.
Conflicts of Interest
The authors declare no conflicts of interest.
Abbreviations
The following abbreviations are used in this manuscript:
| EDAX | Energy-dispersive X-ray spectroscopy |
| FTIR | Fourier Transform Infrared Spectroscopy |
| MFC | Mass Flow Rate Controller |
| VOCs | Volatile Organic Compounds |
| QSDFT | Quenched solid density functional theory |
References
- Mather, T.A. Volcanoes and the environment: Lessons for understanding Earth’s past and future from studies of present-day volcanic emissions. J. Volcanol. Geotherm. Res. 2015, 304, 160–179. [Google Scholar] [CrossRef]
- Yue, X.-L.; Gao, Q.-X. Contributions of natural systems and human activity to greenhouse gas emissions. Adv. Clim. Chang. Res. CrossRef. 2018, 9, 243–252. [Google Scholar] [CrossRef]
- Perera, F. Pollution from fossil-fuel combustion is the leading environmental threat to global pediatric health and equity: Solutions exist. Int. J. Environ. Res. Public Health PubMed. 2017, 15, 16, CrossRef. [Google Scholar] [CrossRef] [PubMed]
- Gaffney, J.S.; Marley, N.A. The impacts of combustion emissions on air quality and climate – From coal to biofuels and beyond. Atmos. Environ. CrossRef. 2009, 43, 23–36. [Google Scholar] [CrossRef]
- Hänninen, O.; Lehtomäki, H.; Korhonen, A.; Kokkola, T.; Hartikainen, A.; Sippula, O.; Haverinen-Shaughnessy, U.; Leviäkangas, P.; Rumrich, I.K. Health risks related to air pollution by transport categories and vehicle types: Comparison by mortality indicators. Environ. Int. PubMed. 2025, 202, 109657, CrossRef. [Google Scholar] [CrossRef]
- Badyelgajy, Y.; Doszhanov, Y.; Kapsalyamov, B.; Onerkhan, G.; Sabitov, A.; Zhumazhanov, A.; Doszhanov, O. Calculation of greenhouse gas emissions from tourist vehicles using mathematical methods: A case study in Altai Tavan Bogd National Park. Sustainability CrossRef. 2025, 17, 6702. [Google Scholar] [CrossRef]
- Lizarazo Salcedo, C.G.; Whitehead, L.; Perkins, J.L.; Upegui-Rincón, S.; Guarguati-Ariza, J.; Quinchía, R.; Espinosa-Guerra, C.J. Management of acute exposure to toxic gases in the oil & gas industry—A practical approach. Arch. Environ. Occup. Health PubMed. 2021, 76, 385–392. [Google Scholar] [CrossRef] [PubMed]
- Tan, T.; Xu, X.; Gu, H.; Cao, L.; Liu, T.; Zhang, Y.; Wang, J.; Chen, M.; Li, H.; Ge, X. The characteristics, sources, and health risks of volatile organic compounds in an industrial area of Nanjing. Toxics PubMed. 2024, 12, 868, CrossRef. [Google Scholar] [CrossRef]
- Manono, B.O. Methane emissions from livestock operations: Sources, sinks, and mitigation strategies. Methane CrossRef. 2026, 5, 7. [Google Scholar] [CrossRef]
- Sabitov, A.; Ibragimova, N.; Lyu, M.; Bolatova, D. About the need for developing risk management for ensuring safety from antibiotic and veterinary drug residues in Kazakhstan. J. Sustain. Sci. Manag. CrossRef. 2021, 16, 303–315. [Google Scholar] [CrossRef]
- Amin, M.S.R. A critical review of pharmaceutical pollutants in soil and air: Ecotoxicological impacts on animal, plant and microbial communities—Health hazards and waste management. Environ. Pollut. Manag. CrossRef. 2026, 3, 70–87. [Google Scholar] [CrossRef]
- Stegenta-Dąbrowska, S.; Galik, M.; Bednik-Dudek, M.; Syguła, E.; Kosiorowska, K.E. Applying compost biochar for gas adsorption—Effects of pyrolysis conditions. Molecules PubMed. 2025, 30, 3365, CrossRef. [Google Scholar] [CrossRef] [PubMed]
- Zhumanov, M.A.; Baizhumanov, K.D.; Doszhanov, O.M. Mobile device for cleaning harmful emissions in atmospheric air. Patent for Invention of Republic of Kazakhstan №34869, 12 February 2021. [Google Scholar]
- Ringsby, A.J.; Ross, C.M.; Maher, K. Sorption of soil carbon dioxide by biochar and engineered porous carbons. Environ. Sci. Technol. PubMed. 2024, 58, 8313–8325, CrossRef. [Google Scholar] [CrossRef]
- Jandosov, J.; Chenchik, D.; Baimenov, A.; Silvestre-Albero, J.; Bernardo, M.; Azat, S.; Doszhanov, Y.; Sabitov, A.; Busquets, R.; Howell, C.; et al. Assessment of phenolic and indolic compounds removal from aqueous media using lignocellulose-derived surface-modified nanoporous carbon adsorbents: A comparative study. Int. J. Mol. Sci. PubMed. 2026, 27, 804, CrossRef. [Google Scholar] [CrossRef]
- Zhan, M.-X.; Liu, Y.-W.; Ye, W.-W.; Chen, T.; Jiao, W.-T. Modification of activated carbon using urea to enhance the adsorption of dioxins. Environ. Res. PubMed. 2022, 204, 112035, CrossRef. [Google Scholar] [CrossRef]
- ISO 10121-1:2014; Test Method for Assessing the Performance of Gas-Phase Air Cleaning Media and Devices for General Ventilation—Part 1: Gas-Phase Air Cleaning Media. International Organization for Standardization: Geneva, Switzerland, 2014. Available online: https://www.iso.org/standard/51372.html (accessed on 3 November 2025).
- Zeng, G.; Guo, S.; Zhai, X. Experimental study on adsorption of SO2 and NH3 by activated carbon with monometallic active sites at low concentration under room temperature. ACS Omega PubMed. 2024, 9, 5523–5533, CrossRef. [Google Scholar] [CrossRef]
- Jandosov, J.M.; Mansurov, Z.A.; Bijsenbayev, M.A.; Tulepov, M.I.; Ismagilov, Z.R.; et al. Synthesis of microporous-mesoporous carbons from rice husk via H3PO4-activation. Adv. Mater. Res. CrossRef. 2013, 602, 85–89. [Google Scholar] [CrossRef]
- Teo, C.Y.; Jong, J.S.J.; Chan, Y.Q.; Oueslati, W. Carbon-based materials as effective adsorbents for the removal of pharmaceutical compounds from aqueous solution. Adsorpt. Sci. Technol. 2022, 2022, 3079663. [Google Scholar] [CrossRef]
- Ioni, Y.; Ibragimova, V. Study of sorption activity of carbon nanomaterials for capture of chlorine-containing gases. Clean. Technol. CrossRef. 2025, 7, 39. [Google Scholar] [CrossRef]
- Akhmetzhanova, D.; Sabitov, A.; Doszhanov, Y.; Atamanov, M.; Saurykova, K.; Zhumazhanov, A.; Atamanova, T.; Kerimkulova, A.; Velasco, L.F.; Zhumagalieva, A.; et al. Zeolites and activated carbons in hydroponics: A systematic review of mechanisms, performance metrics, techno-economic analysis and life-cycle assessment. Sustainability 2025, 17, 10977. [Google Scholar] [CrossRef]
- Fengel, D.; Wegener, G. Wood: Chemistry, Ultrastructure, Reactions; Walter de Gruyter: New York, NY, USA, 1989. [Google Scholar]
- Demirbas, A. Combustion characteristics of different biomass fuels. Prog. Energy Combust. Sci. CrossRef. 2004, 30, 219–230. [Google Scholar] [CrossRef]
- Rodriguez-Reinoso, F. The role of carbon materials in heterogeneous catalysis. Carbon CrossRef. 1998, 36, 159–175. [Google Scholar] [CrossRef]
- Wang, J.C.; Kaskel, S. KOH activation of carbon-based materials for energy storage. J. Mater. Chem. CrossRef. 2012, 22, 23710–23725. [Google Scholar] [CrossRef]
- Rocha, R.P.; Pereira, M.F.R.; Figueiredo, J.L. Characterisation of the surface chemistry of carbon materials by temperature-programmed desorption: An assessment. Catal. Today CrossRef. 2023, 418, 114136. [Google Scholar] [CrossRef]
- Kouadri, I.; Ben Seghir, B.; Hemmami, H.; Zeghoud, S.; Allag, N.; Rebiai, A.; Ben Amor, I.; Chala, A.; Belkhalfa, H. Extraction of silica from different sources of agricultural waste. Asian J. Res. Chem. 2023, 16, 97–101. [Google Scholar] [CrossRef]
- Doszhanov, Y.; Atamanov, M.; Jandosov, J.; Saurykova, K.; Bassygarayev, Z.; Orazbayev, A.; Turganbay, S.; Sabitov, A. Preparation of granular organic iodine and selenium complex fertilizer based on biochar for biofortification of parsley. Scientifica PubMed. 2024, 2024, 6601899, CrossRef. [Google Scholar] [CrossRef] [PubMed]
- Verbruggen, N.; Hermans, C. Physiological and molecular responses to magnesium nutritional imbalance in plants. Plant Soil. PubMed. 2013, 368, 87–99, CrossRef. [Google Scholar] [CrossRef]
- Cakmak, I.; Kirkby, E.A. Role of magnesium in carbon partitioning and alleviating photooxidative damage. Physiol. Plant. PubMed. 2008, 133, 692–704, CrossRef. [Google Scholar] [CrossRef] [PubMed]
- Ćwieląg-Piasecka, I.; Jamroz, E.; Medyńska-Juraszek, A.; Bednik, M.; Kosyk, B.; Polláková, N. Deashed wheat-straw biochar as a potential superabsorbent for pesticides. Materials PubMed. 2023, 16, 2185, CrossRef. [Google Scholar] [CrossRef]
- Bakdash, R.S.; Aljundi, I.H.; Basheer, C.; Abdulazeez, I. Rice husk derived aminated silica for the efficient adsorption of different gases. Sci. Rep. PubMed. 2020, 10, 19526, CrossRef. [Google Scholar] [CrossRef]
- Bazan-Wozniak, A.; Nowicki, P.; Wolski, R.; Pietrzak, R. Activated bio-carbons prepared from the residue of supercritical extraction of raw plants and their application for removal of nitrogen dioxide and hydrogen sulfide from the gas phase. Materials PubMed. 2021, 14, 3192, CrossRef. [Google Scholar] [CrossRef] [PubMed]
- Ramirez-de-Arellano, J.M.; Canales, M.; Magaña, L.F. Carbon nanostructures doped with transition metals for pollutant gas adsorption systems. Molecules PubMed. 2021, 26, 5346, CrossRef. [Google Scholar] [CrossRef] [PubMed]
- Bagreev, A.; Bashkova, S.; Bandosz, T.J. Adsorption of SO2 on Activated Carbons: The Effect of Nitrogen Functionality and Pore Sizes. Langmuir 2002, 18(4), 1257–1264. [Google Scholar] [CrossRef]
- EN 14387:2004+A1:2008; Respiratory Protective Devices—Gas Filters and Combined Filters—Requirements, Testing, Marking. European Committee for Standardization: Brussels, Belgium, 2008.
- Kerimkulova, A.R.; Mansurov, Z.A.; Ermoldanov, E.Zh; Asanbek, N.M.; Aidarbek, A.E.; Sabitov, A.N. Method for producing carbon sorbent. Patent for Invention of Republic of Kazakhstan №45454, 19 May 2026. [Google Scholar]
Figure 1.
Scheme of the gas sorption experiments.
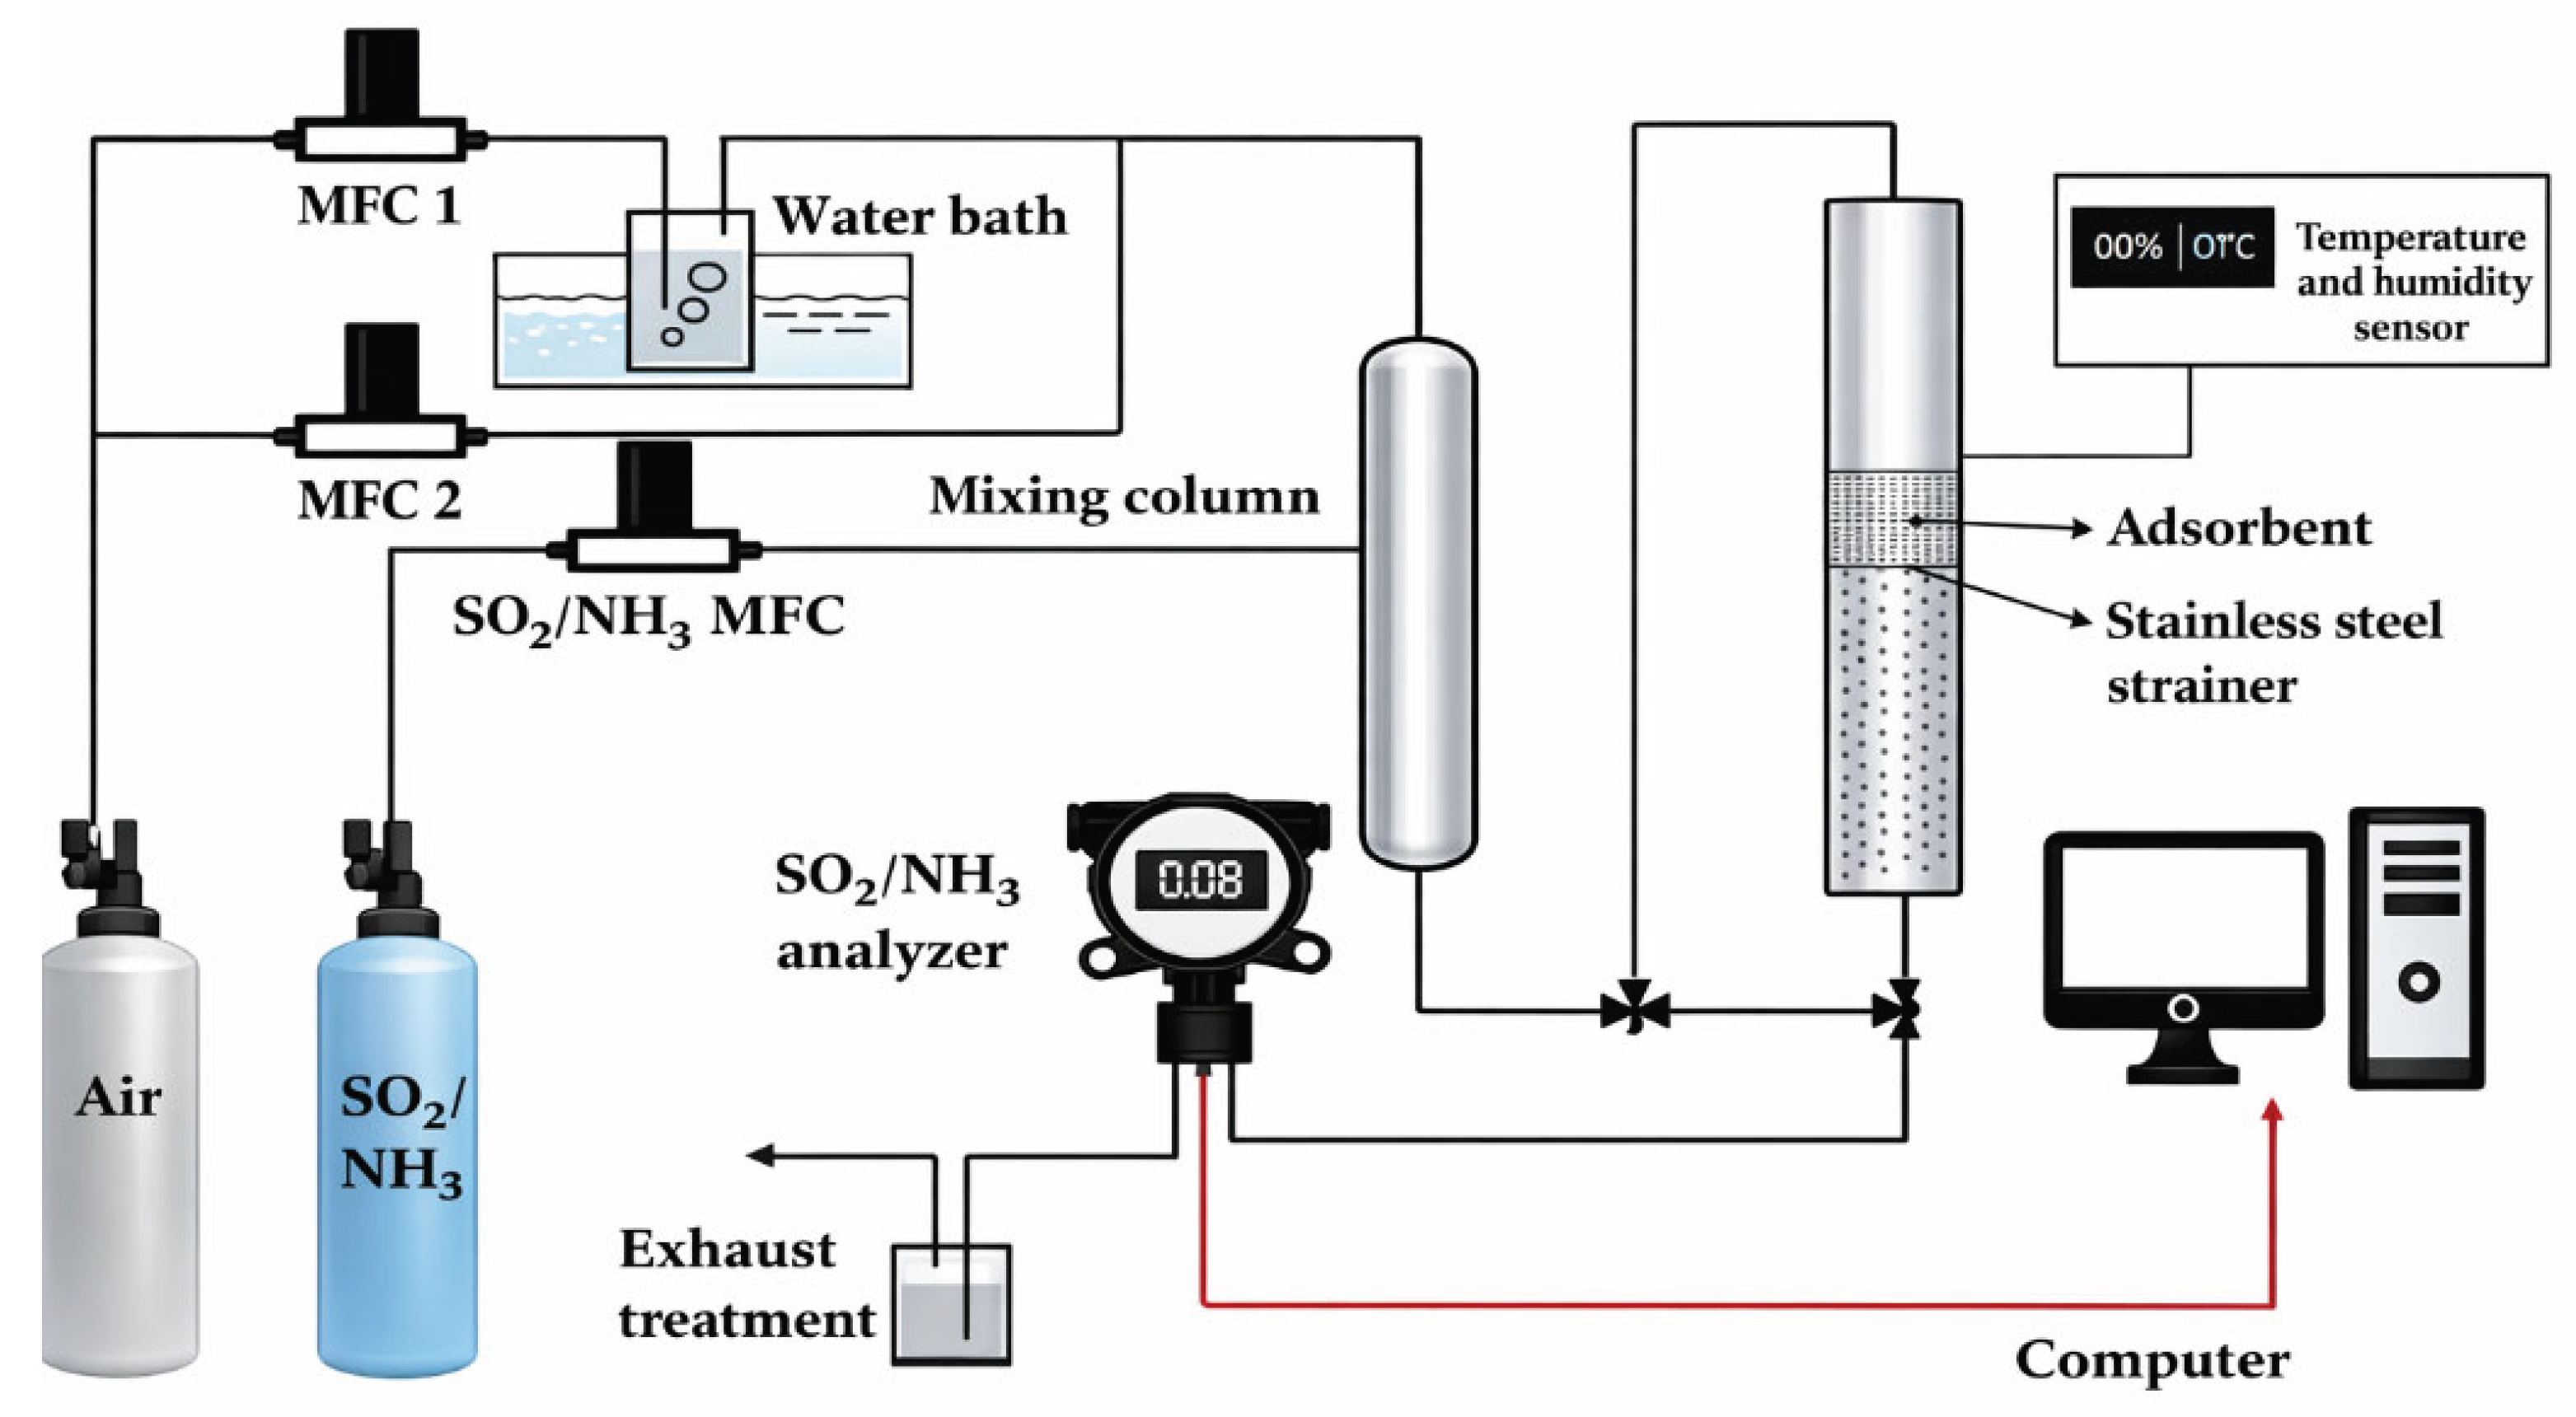
Figure 2.
N₂ adsorption-desorption isotherms at -196 °C for the activated samples.
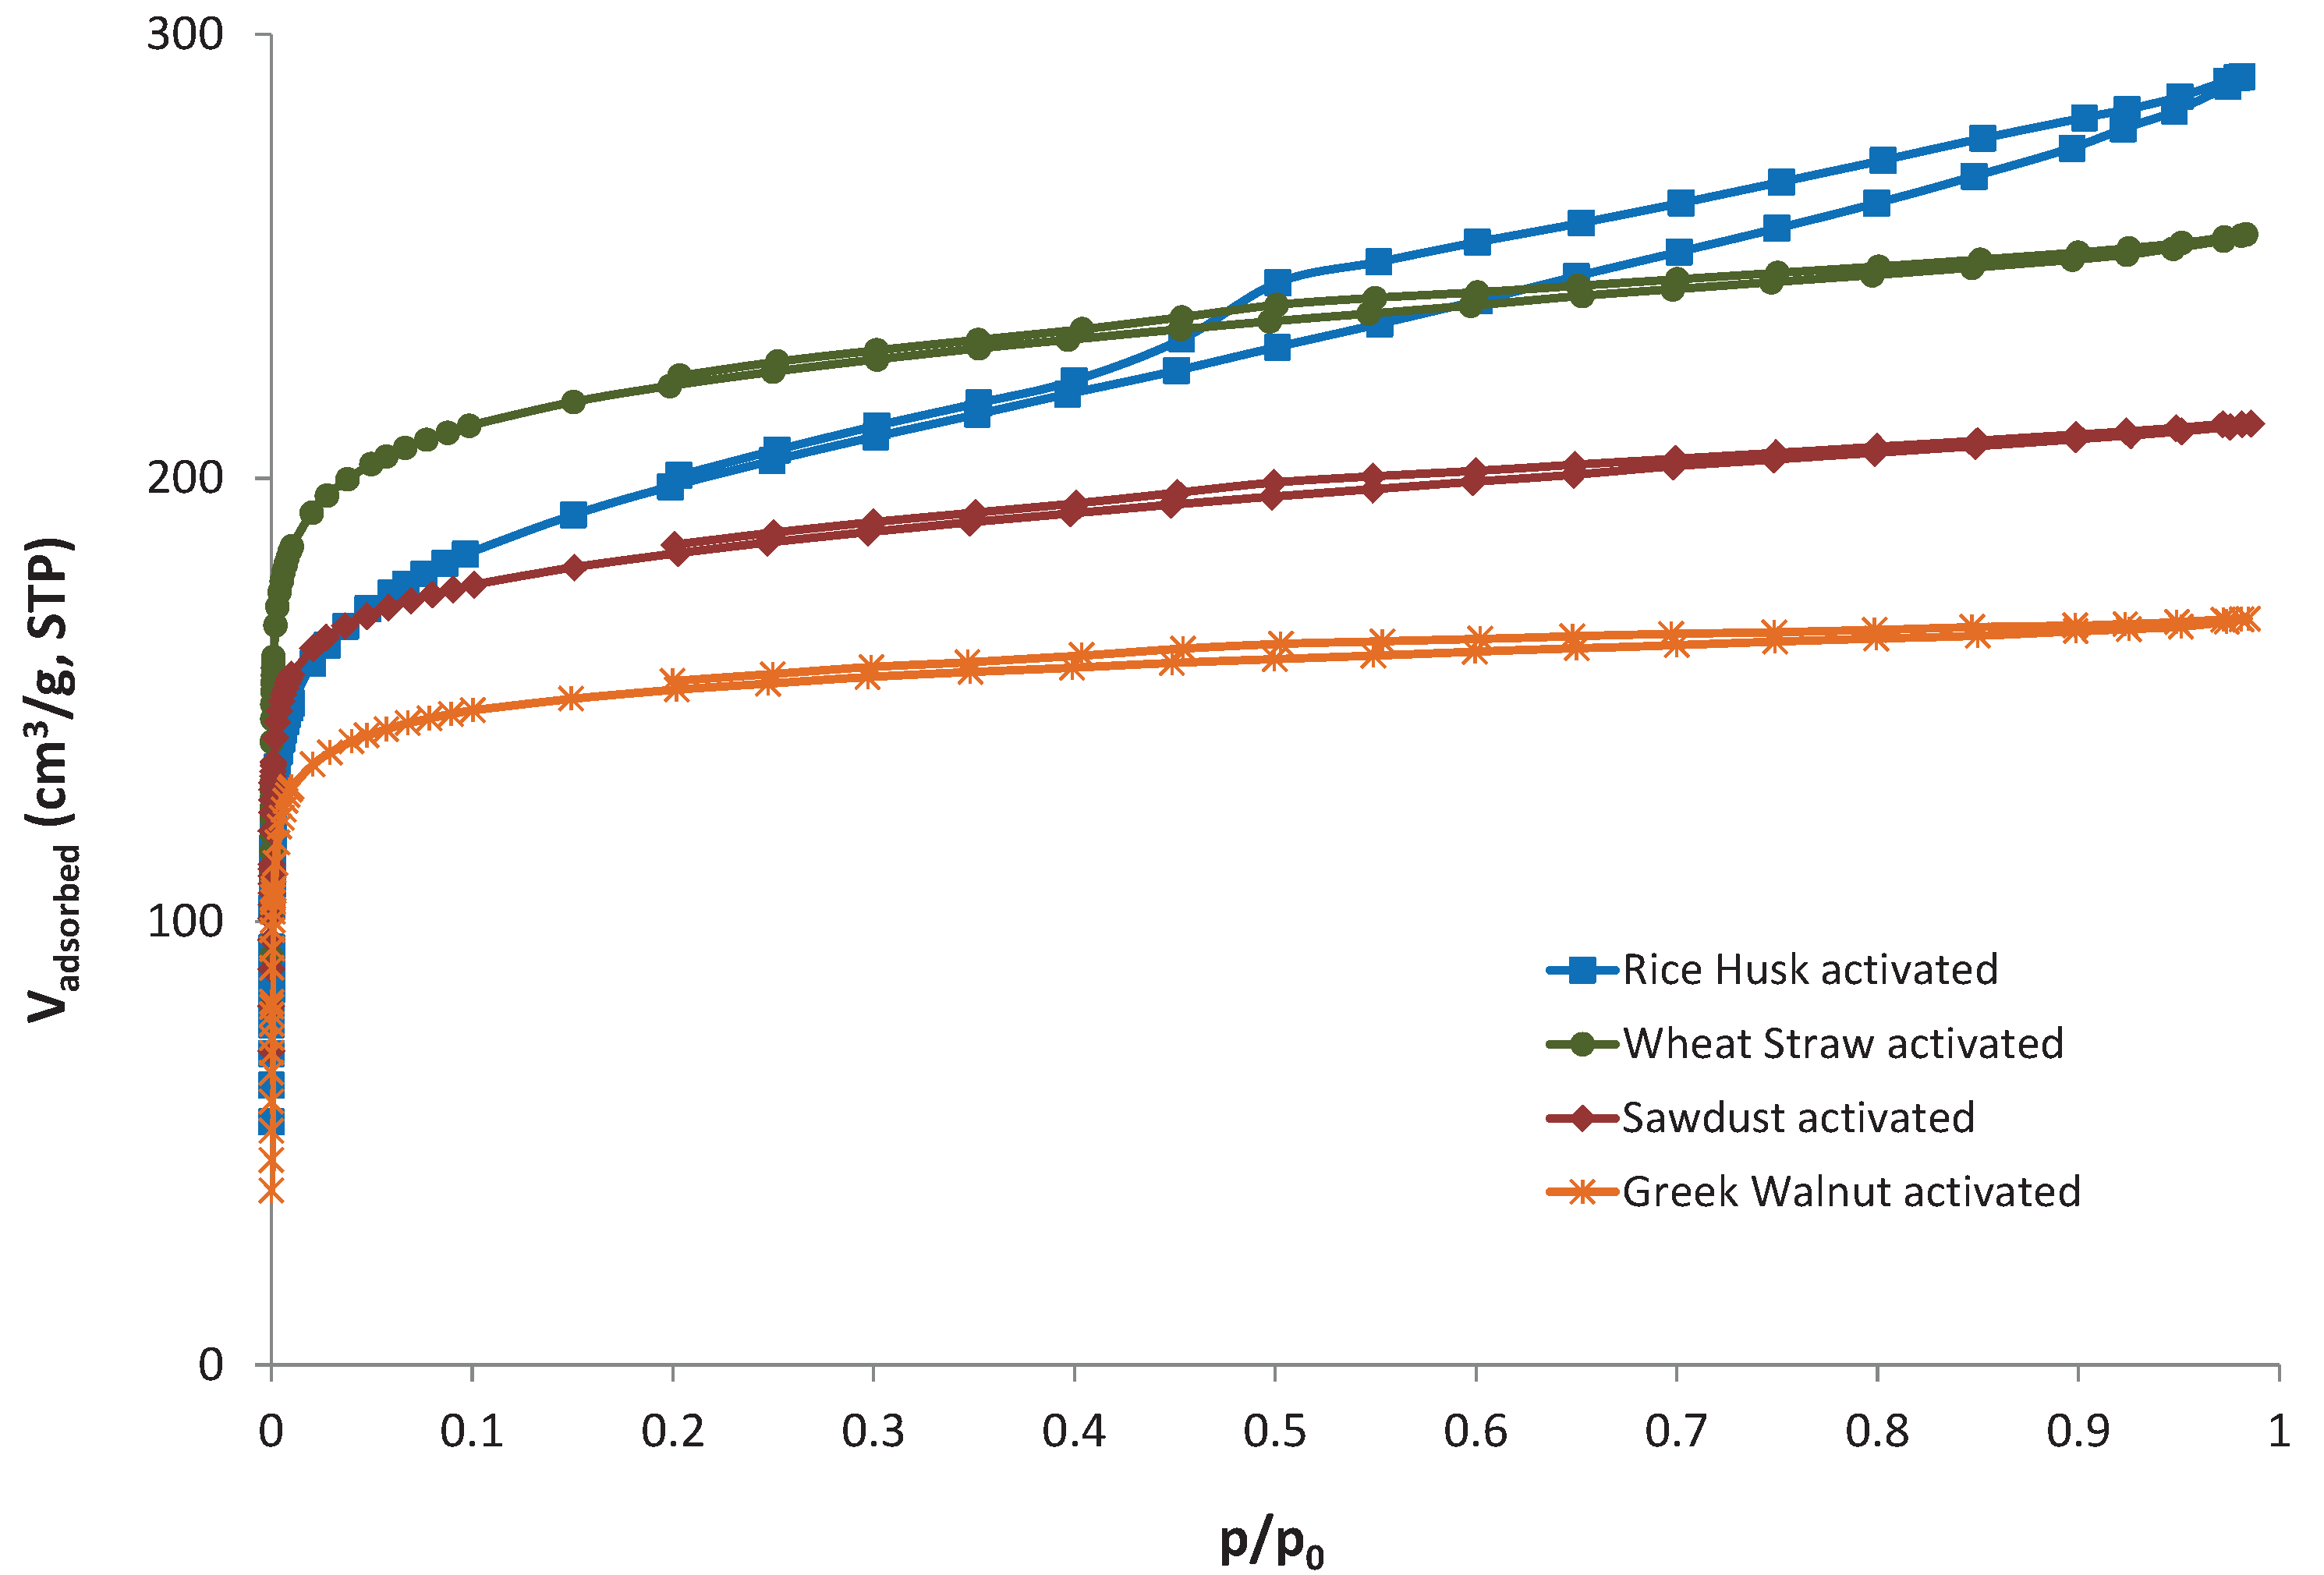
Figure 3.
Pore size distribution of the activated samples obtained using the QSDFT slit pore equilibrium model for carbons.
Figure 3.
Pore size distribution of the activated samples obtained using the QSDFT slit pore equilibrium model for carbons.
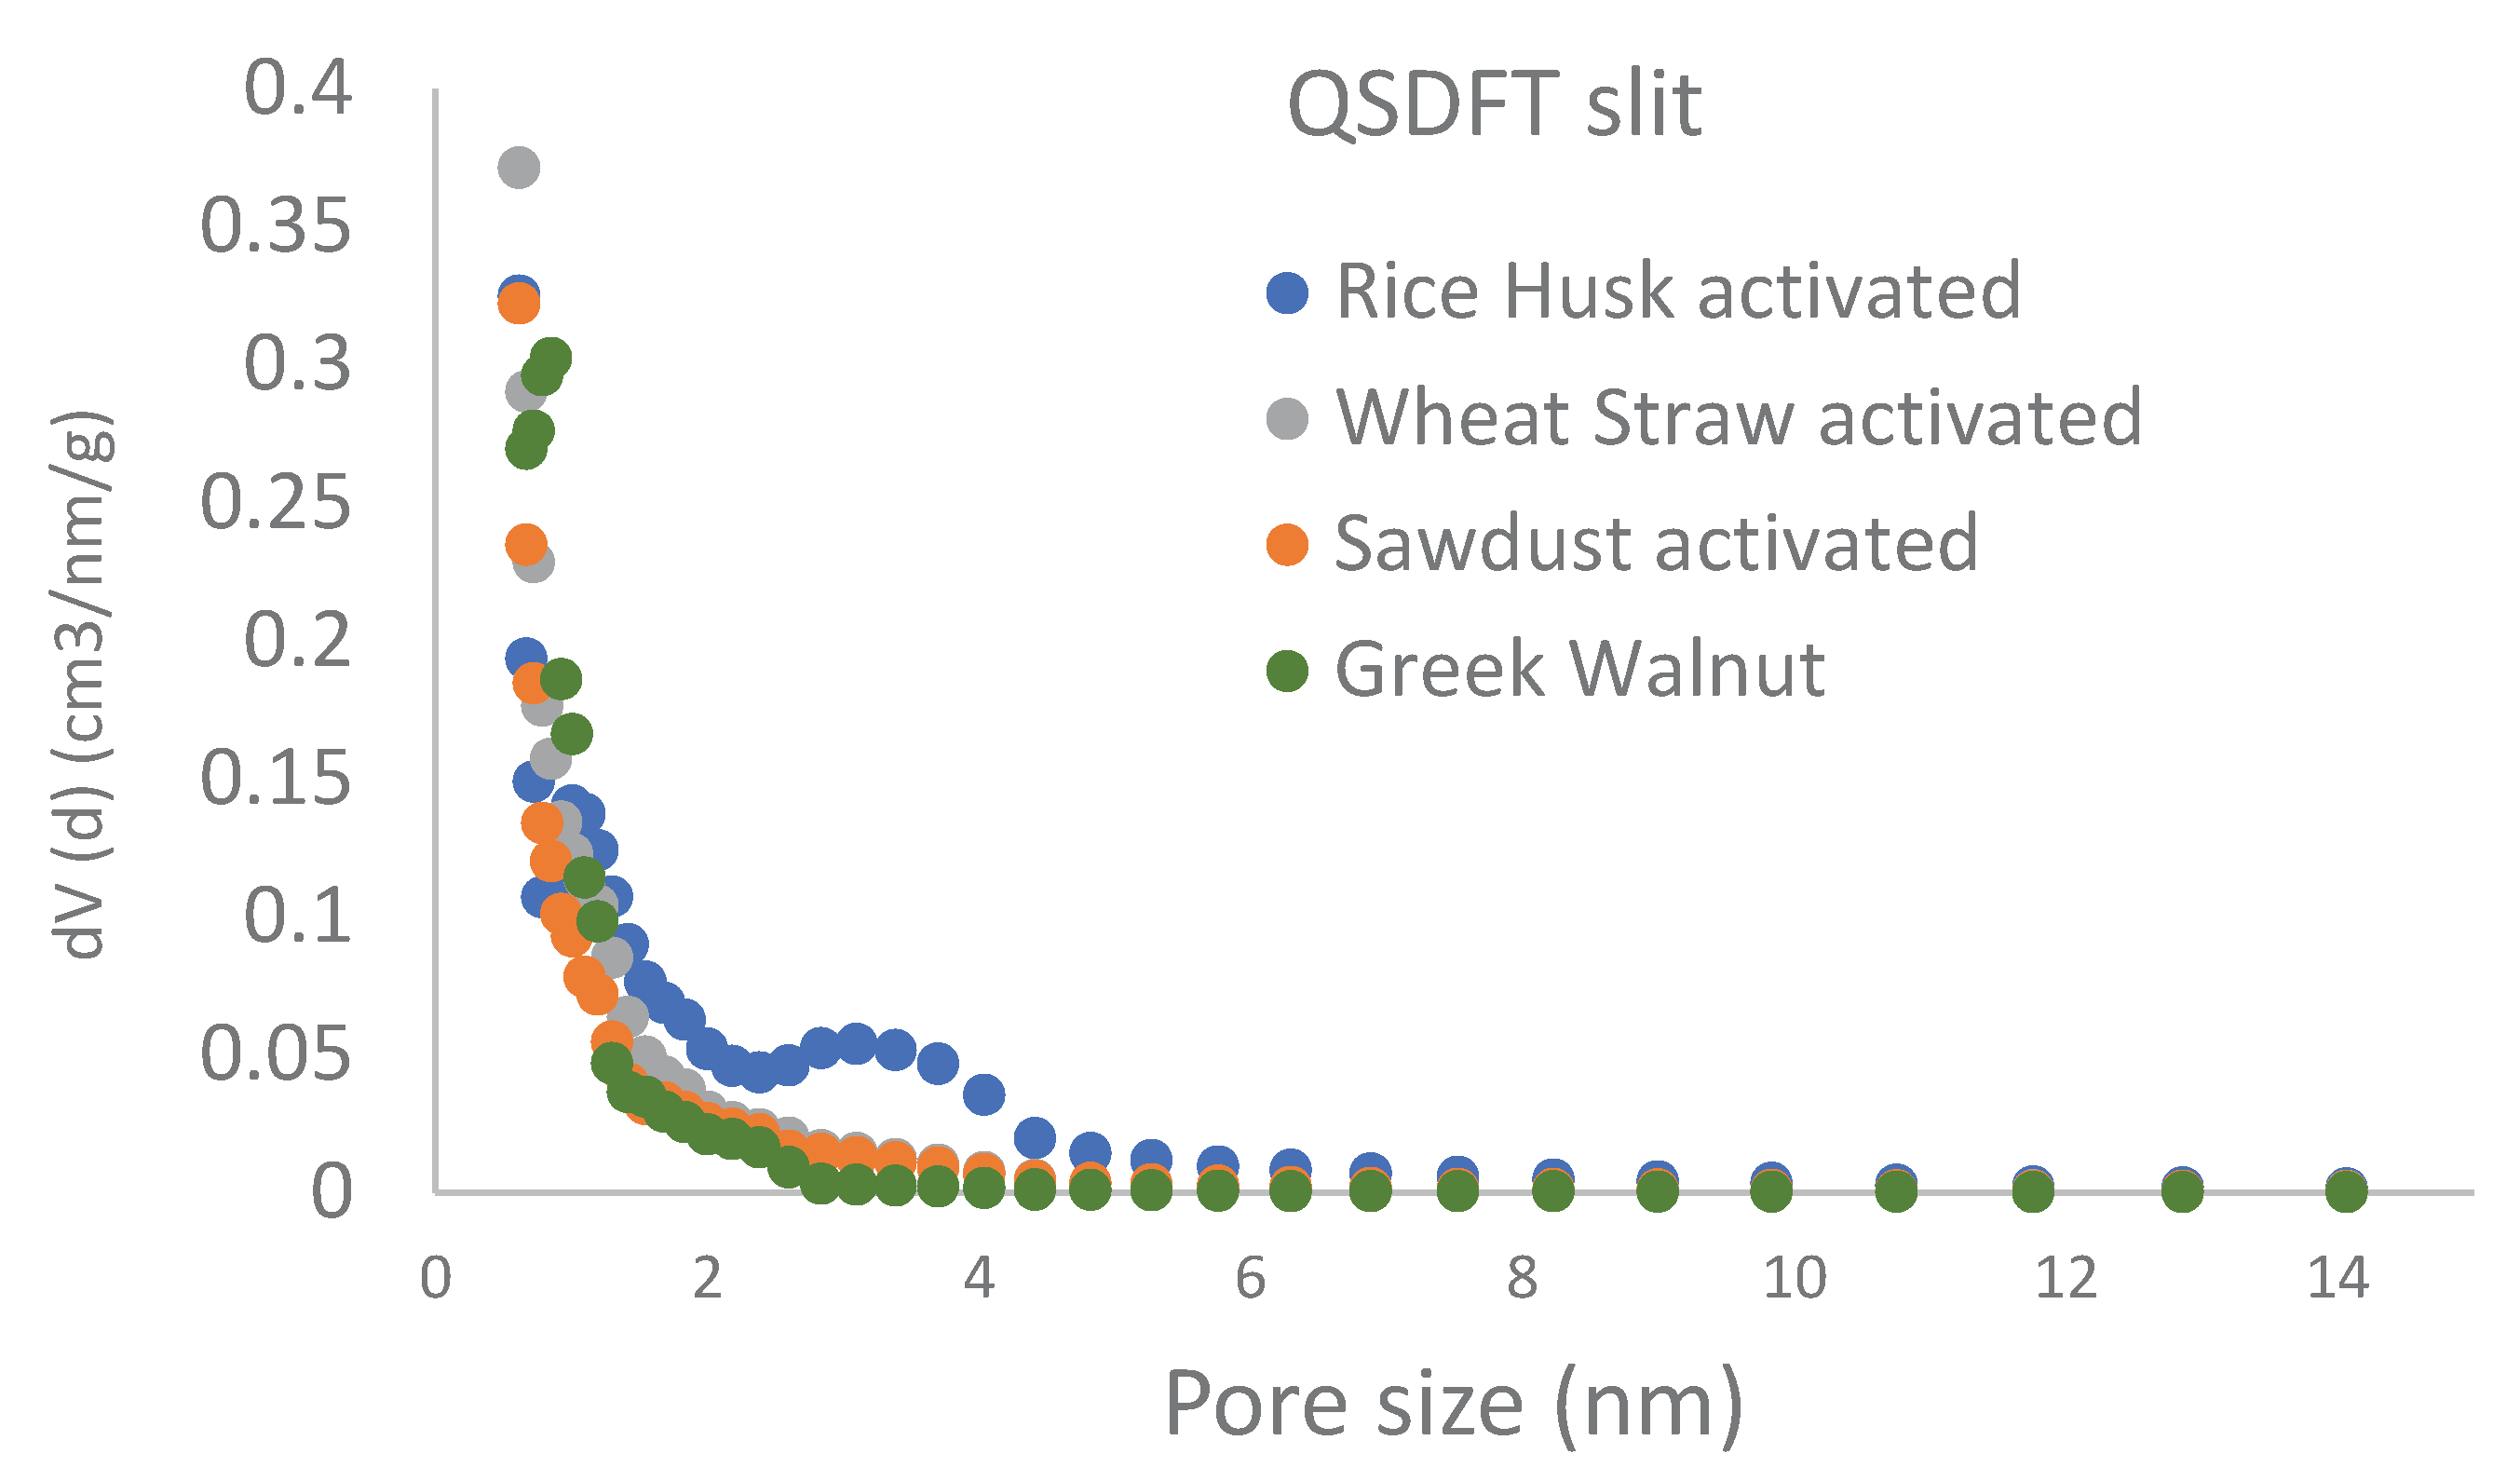
Figure 4.
SEM images of activated carbon samples: (a) Wheat Straw; (b) Sawdust; (c) Rice Husk; (d) Walnut.
Figure 4.
SEM images of activated carbon samples: (a) Wheat Straw; (b) Sawdust; (c) Rice Husk; (d) Walnut.
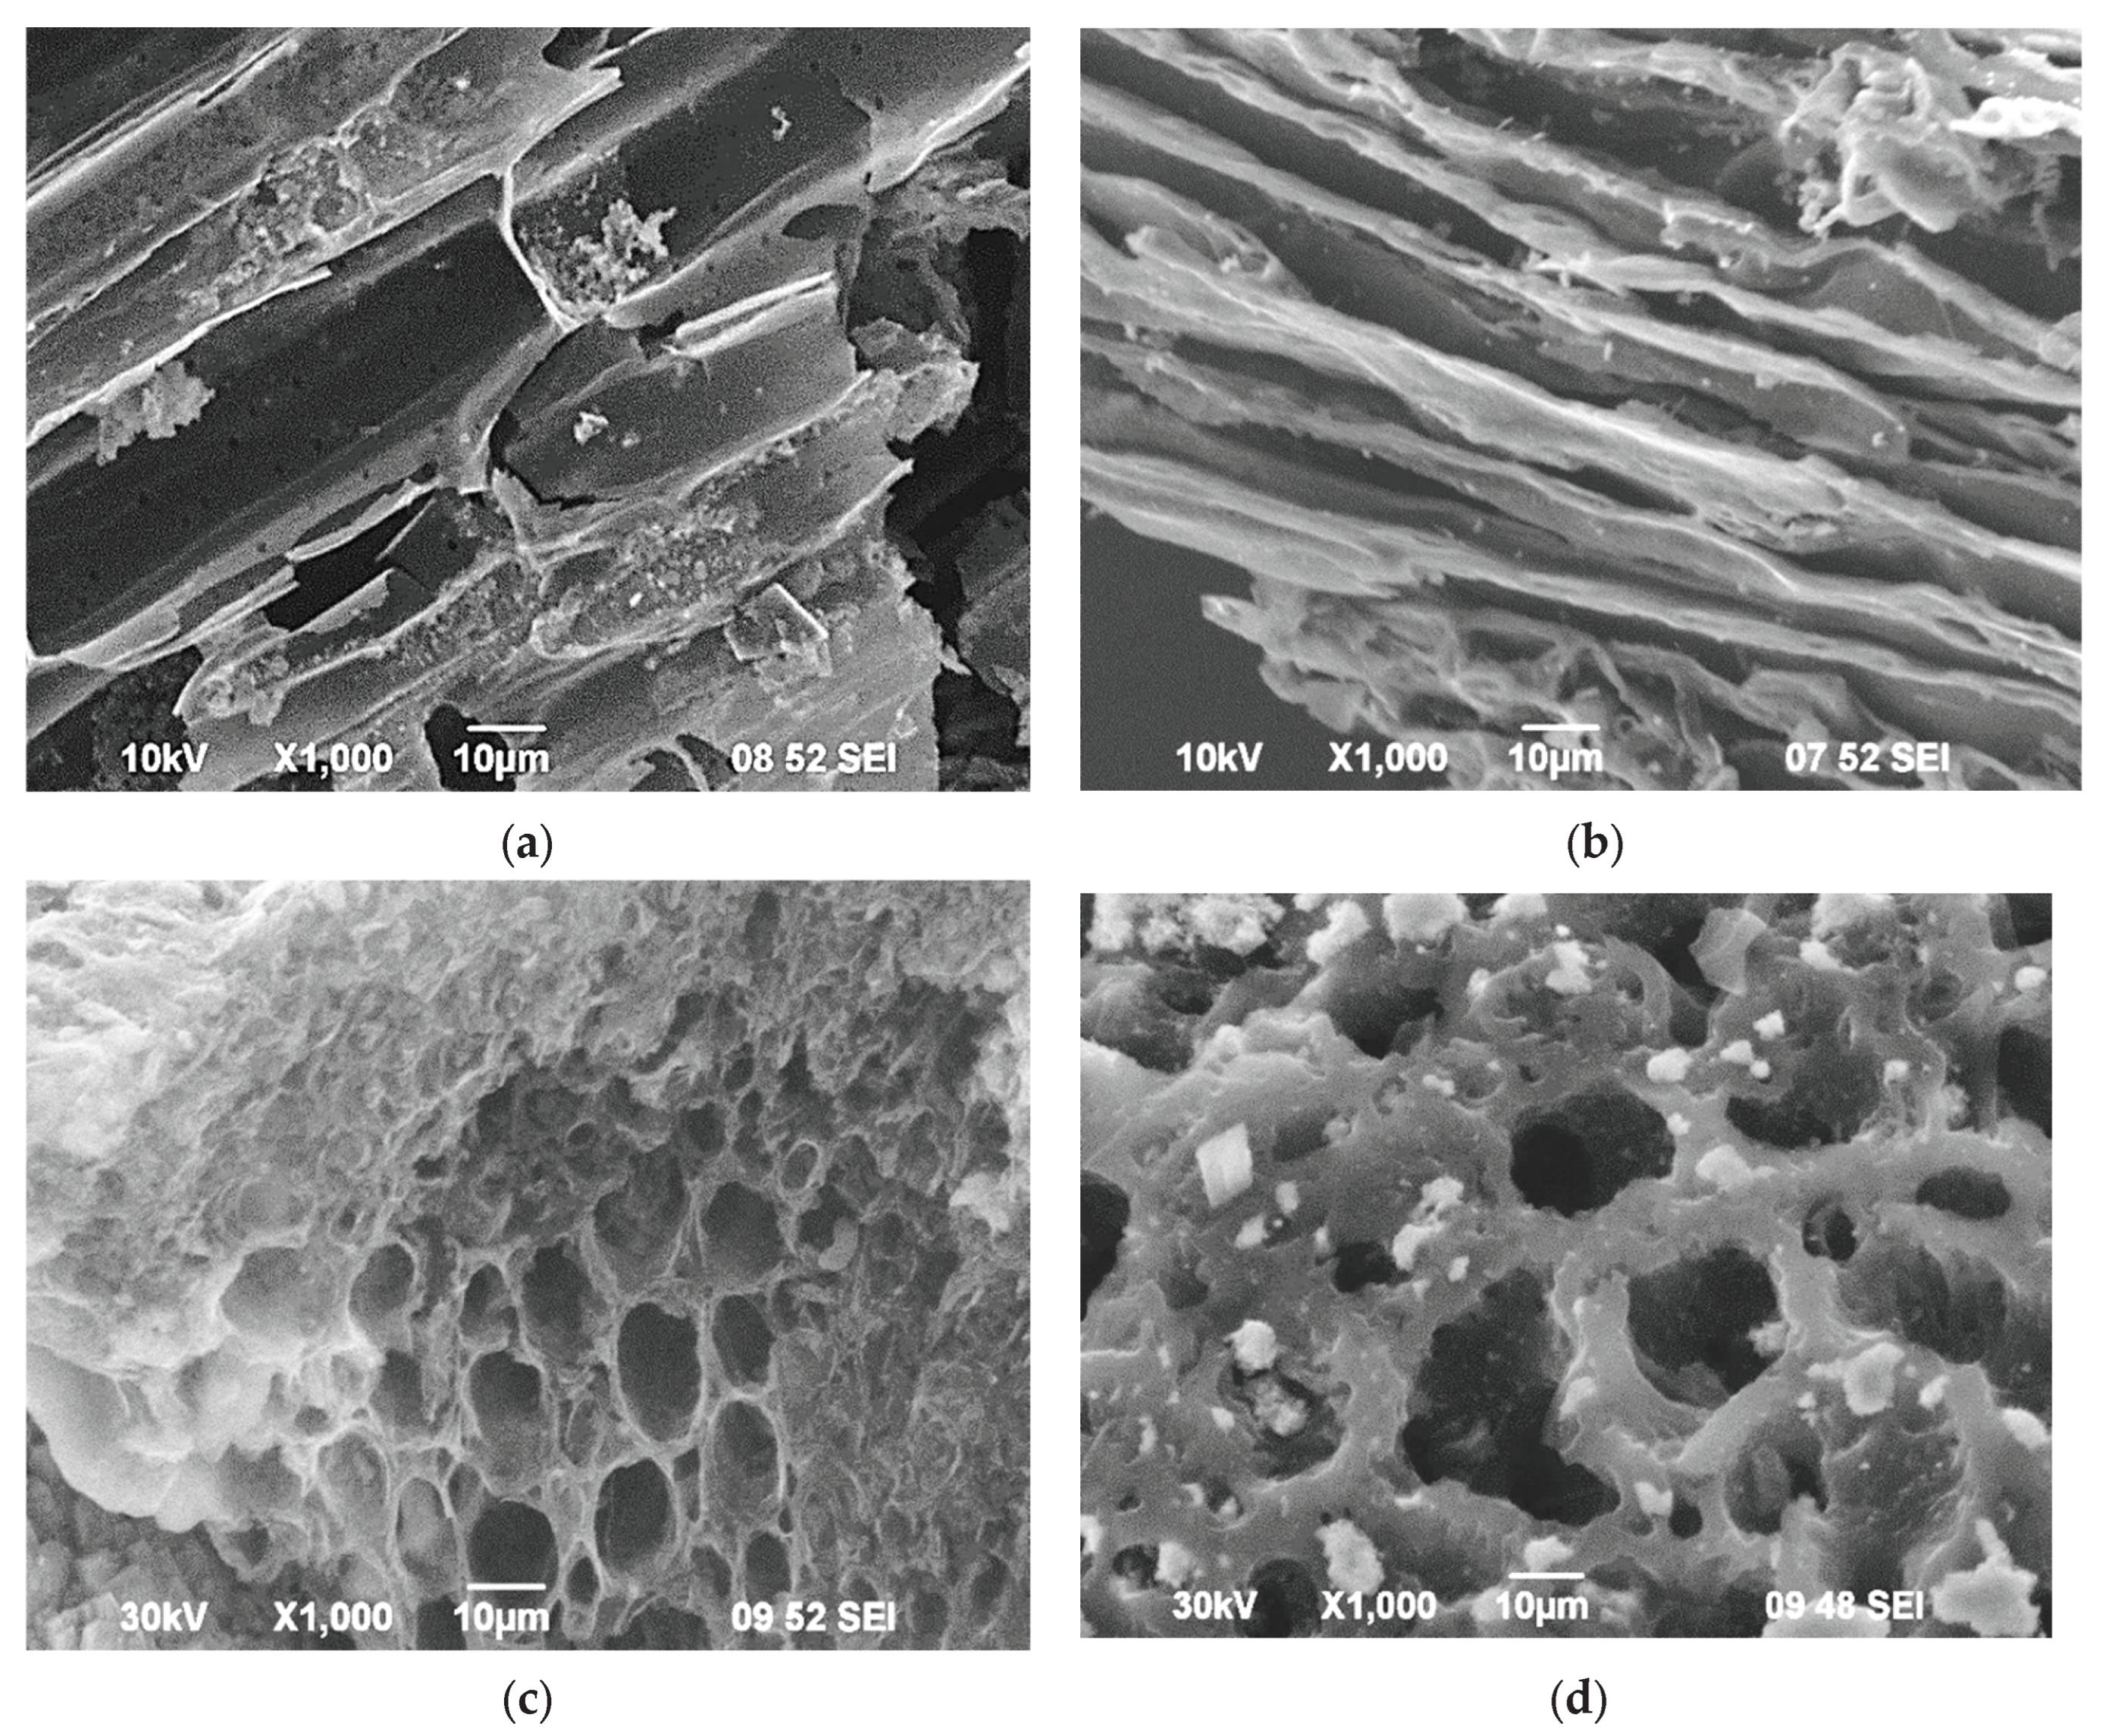
Figure 5.
TG profiles of the carbonized (a); activated (b) carbon samples.
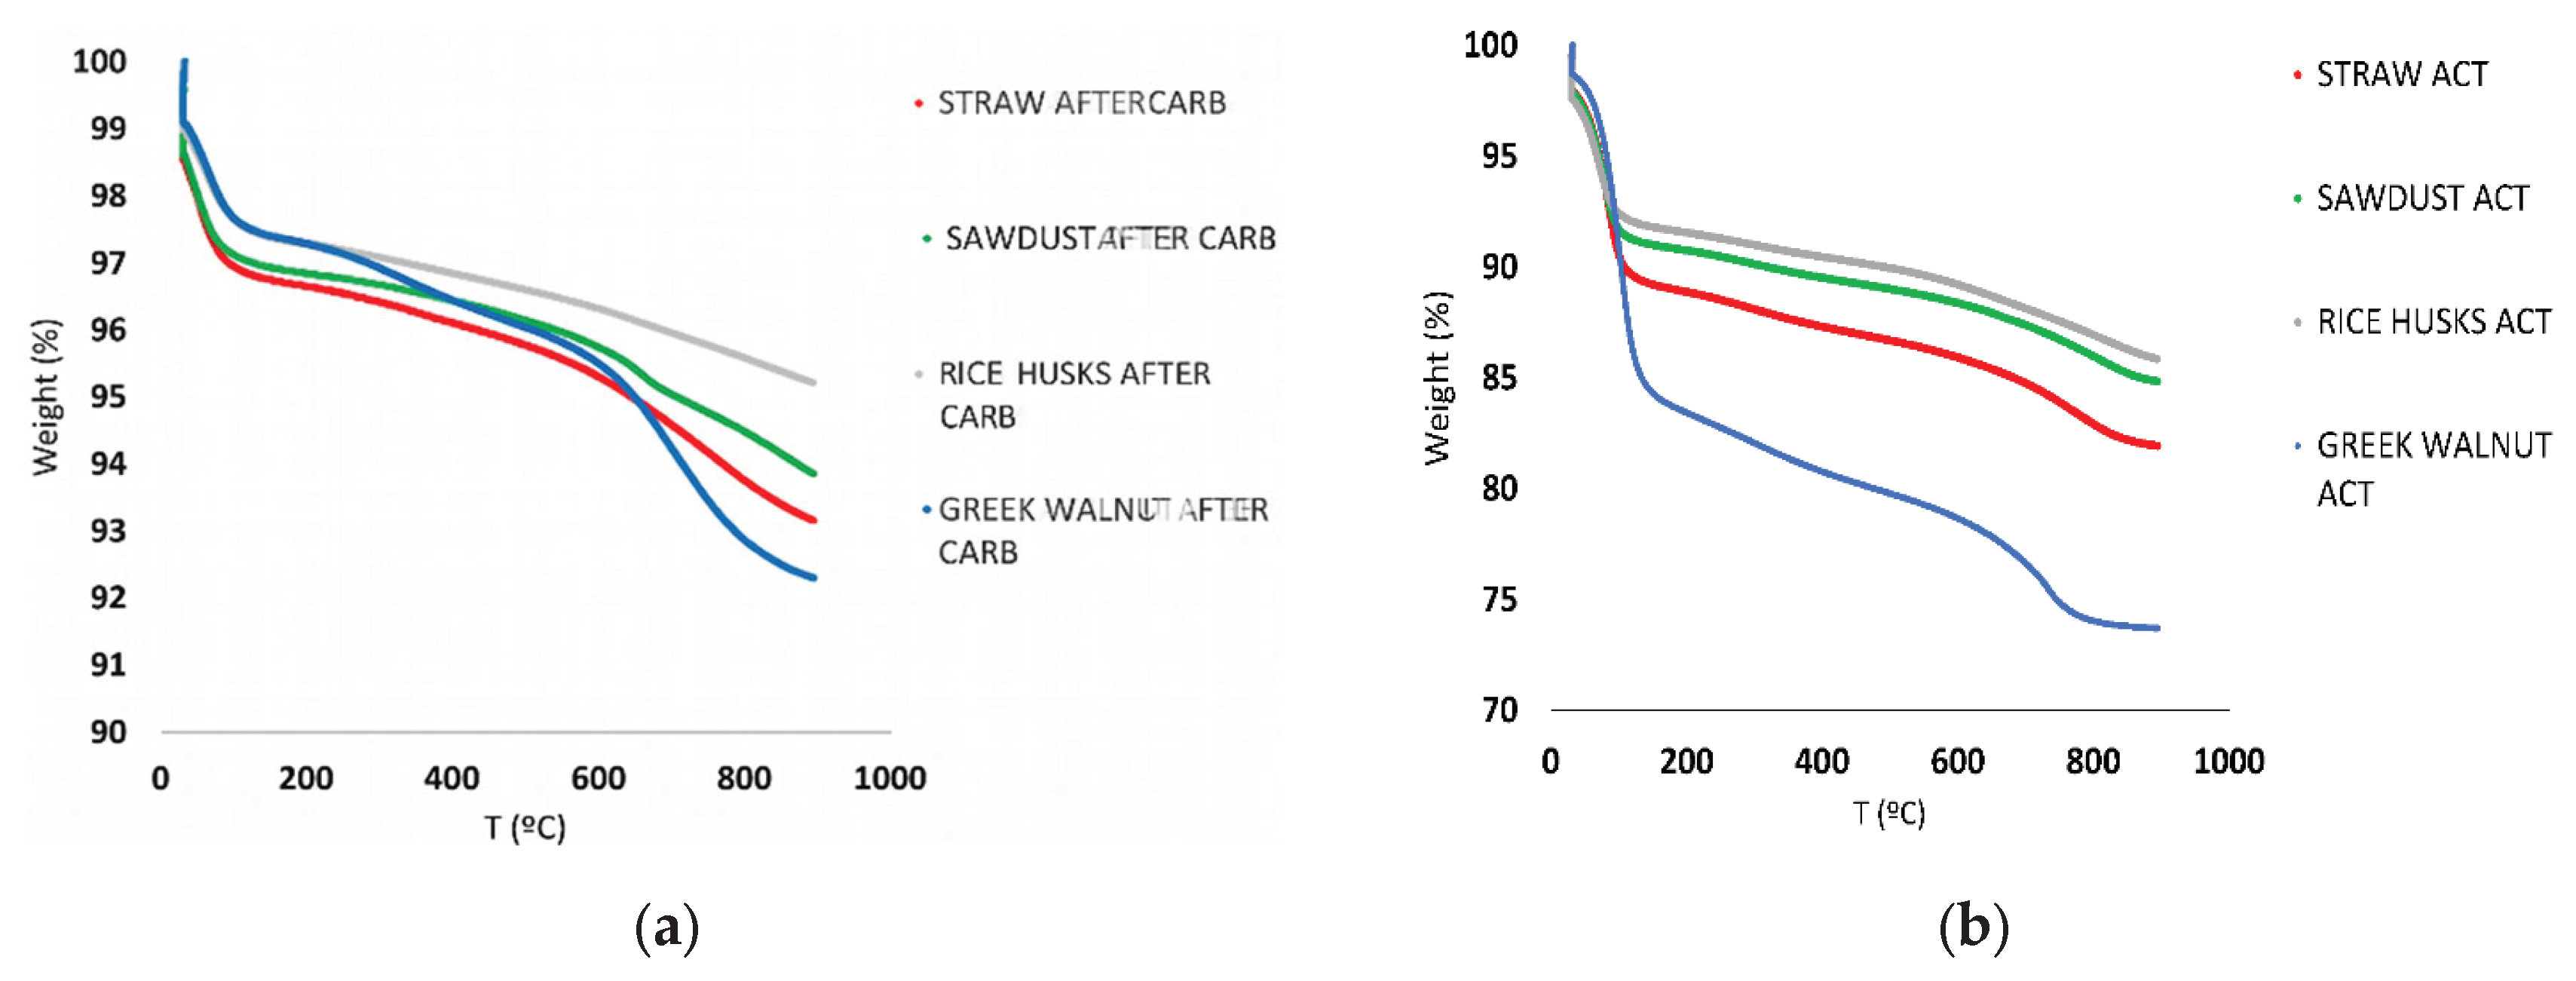
Figure 6.
FTIR – spectra of the activated carbon samples.
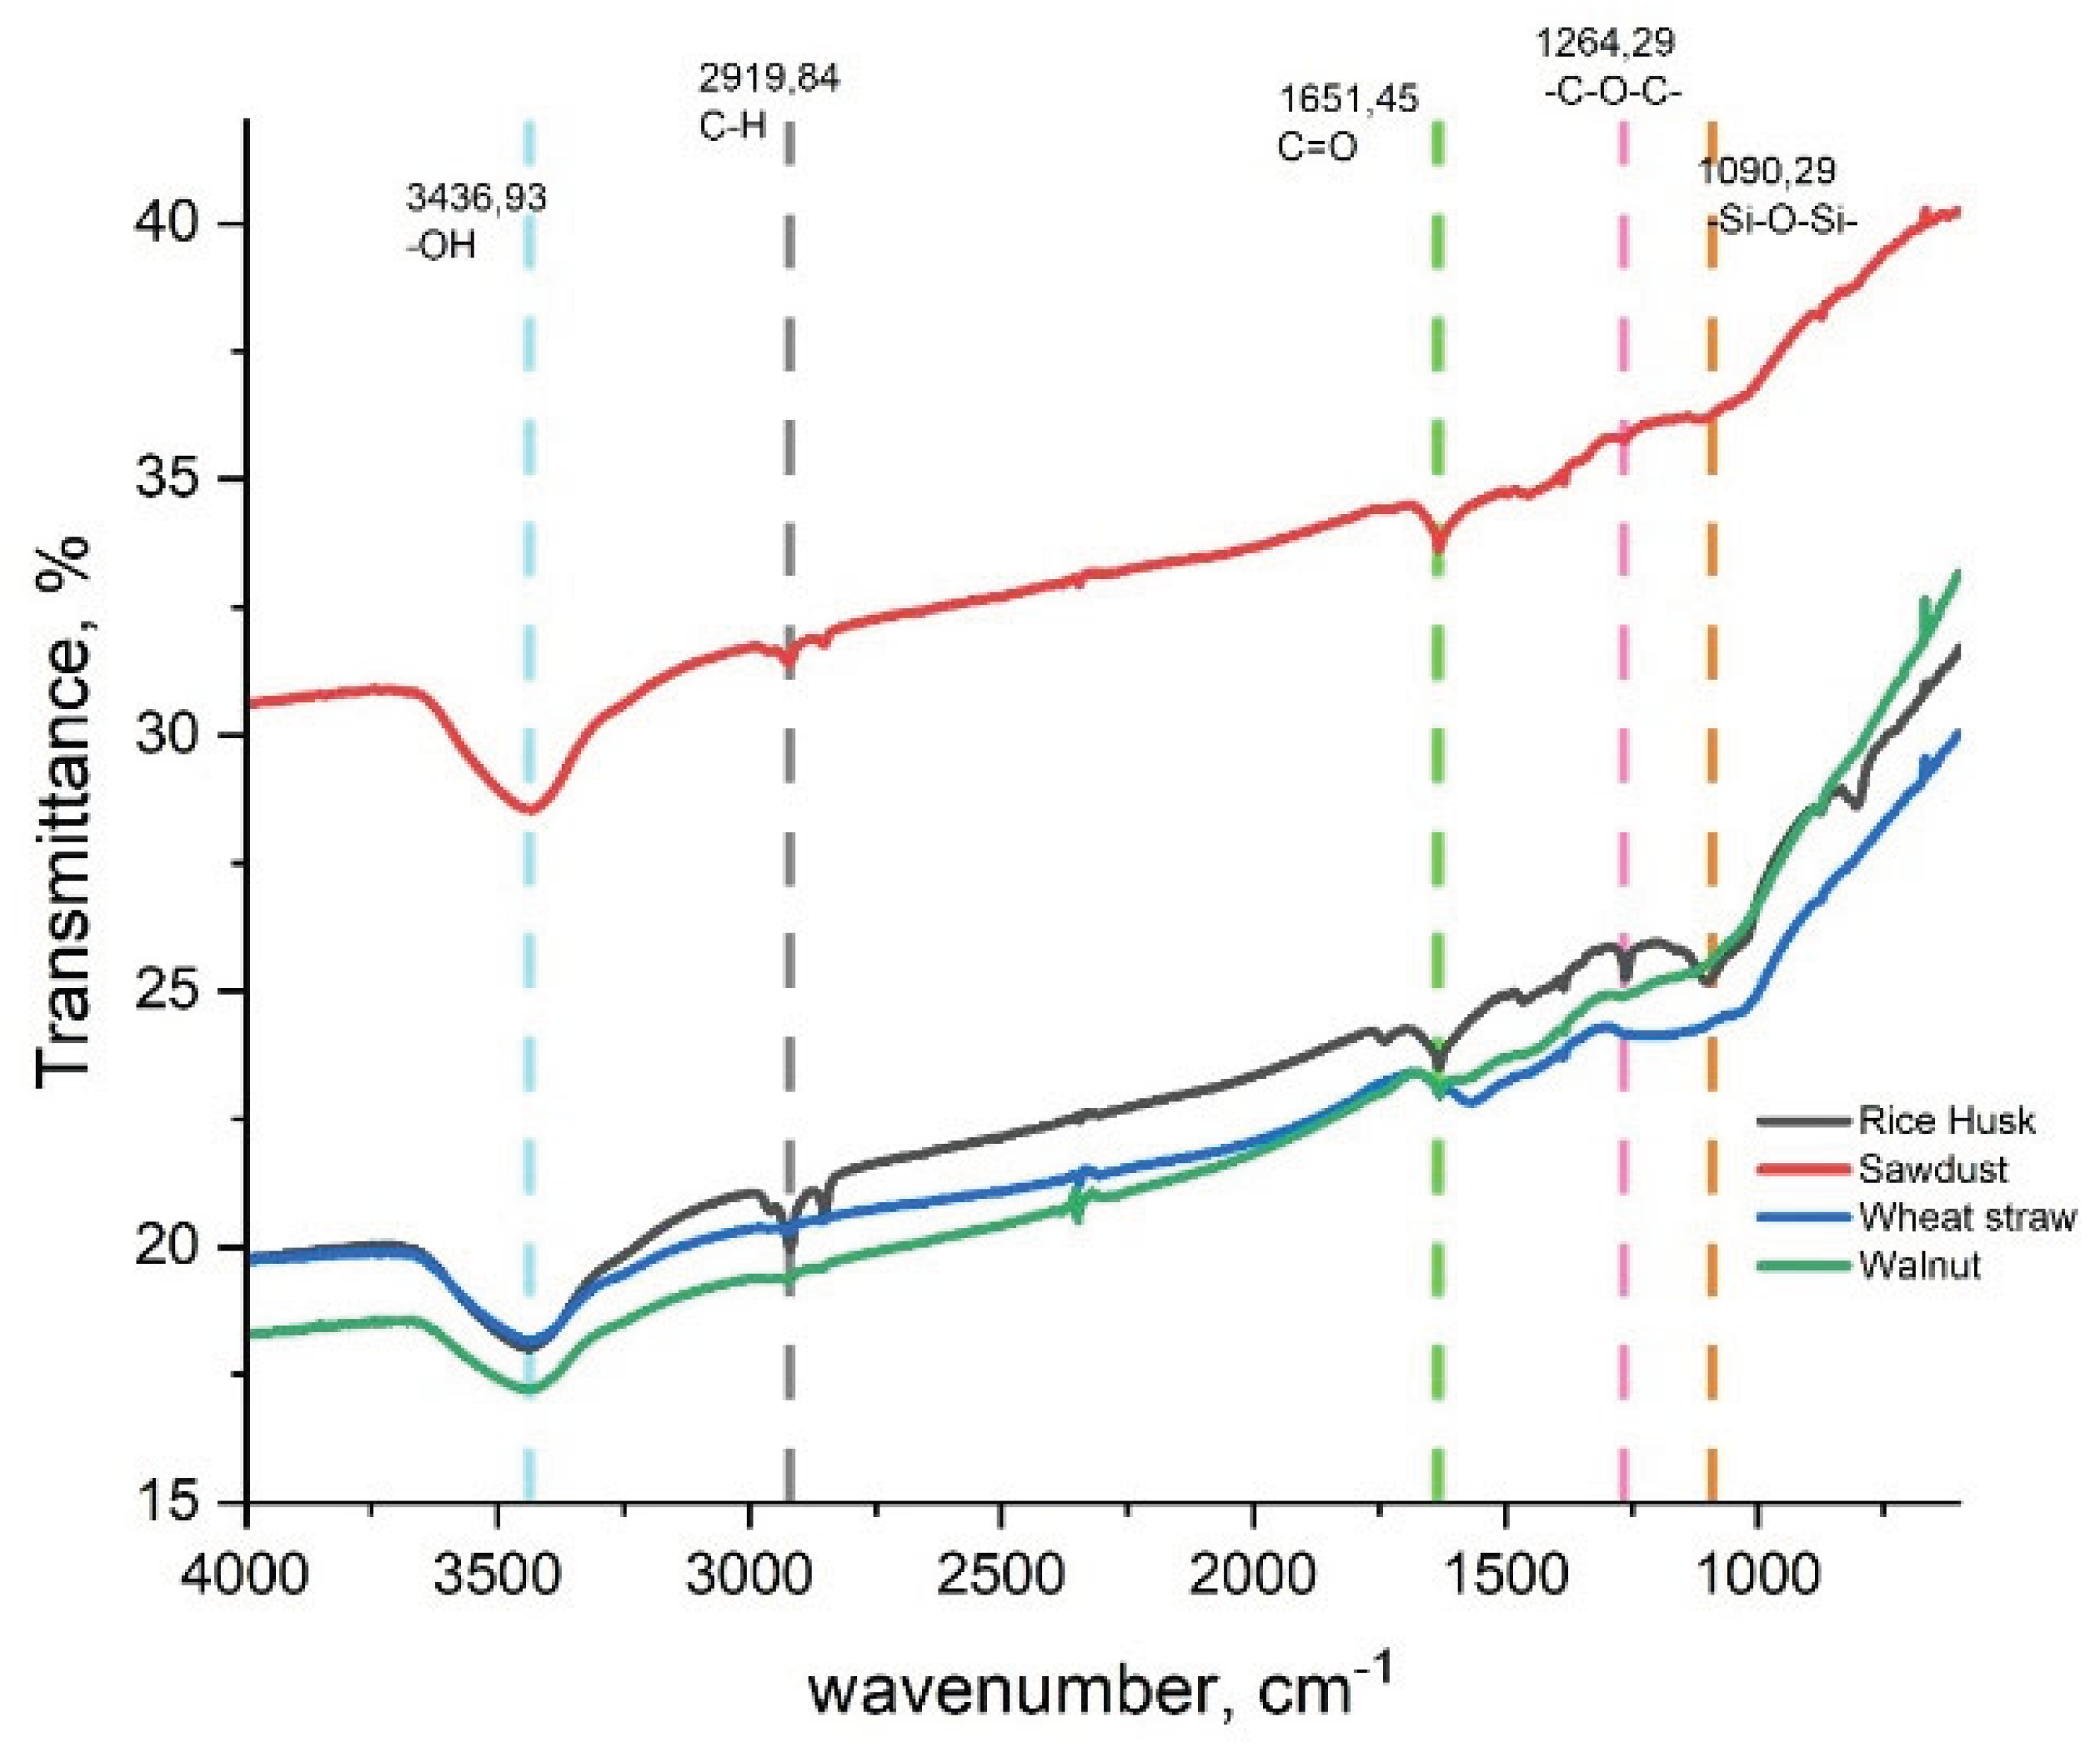
Figure 7.
Water vapour sorption isotherms at 20 °C of the activated carbon samples: (blue line) Rice Husk act; (grey line) Straw act; (red line) Sawdust and (green line) Walnut shells.
Figure 7.
Water vapour sorption isotherms at 20 °C of the activated carbon samples: (blue line) Rice Husk act; (grey line) Straw act; (red line) Sawdust and (green line) Walnut shells.
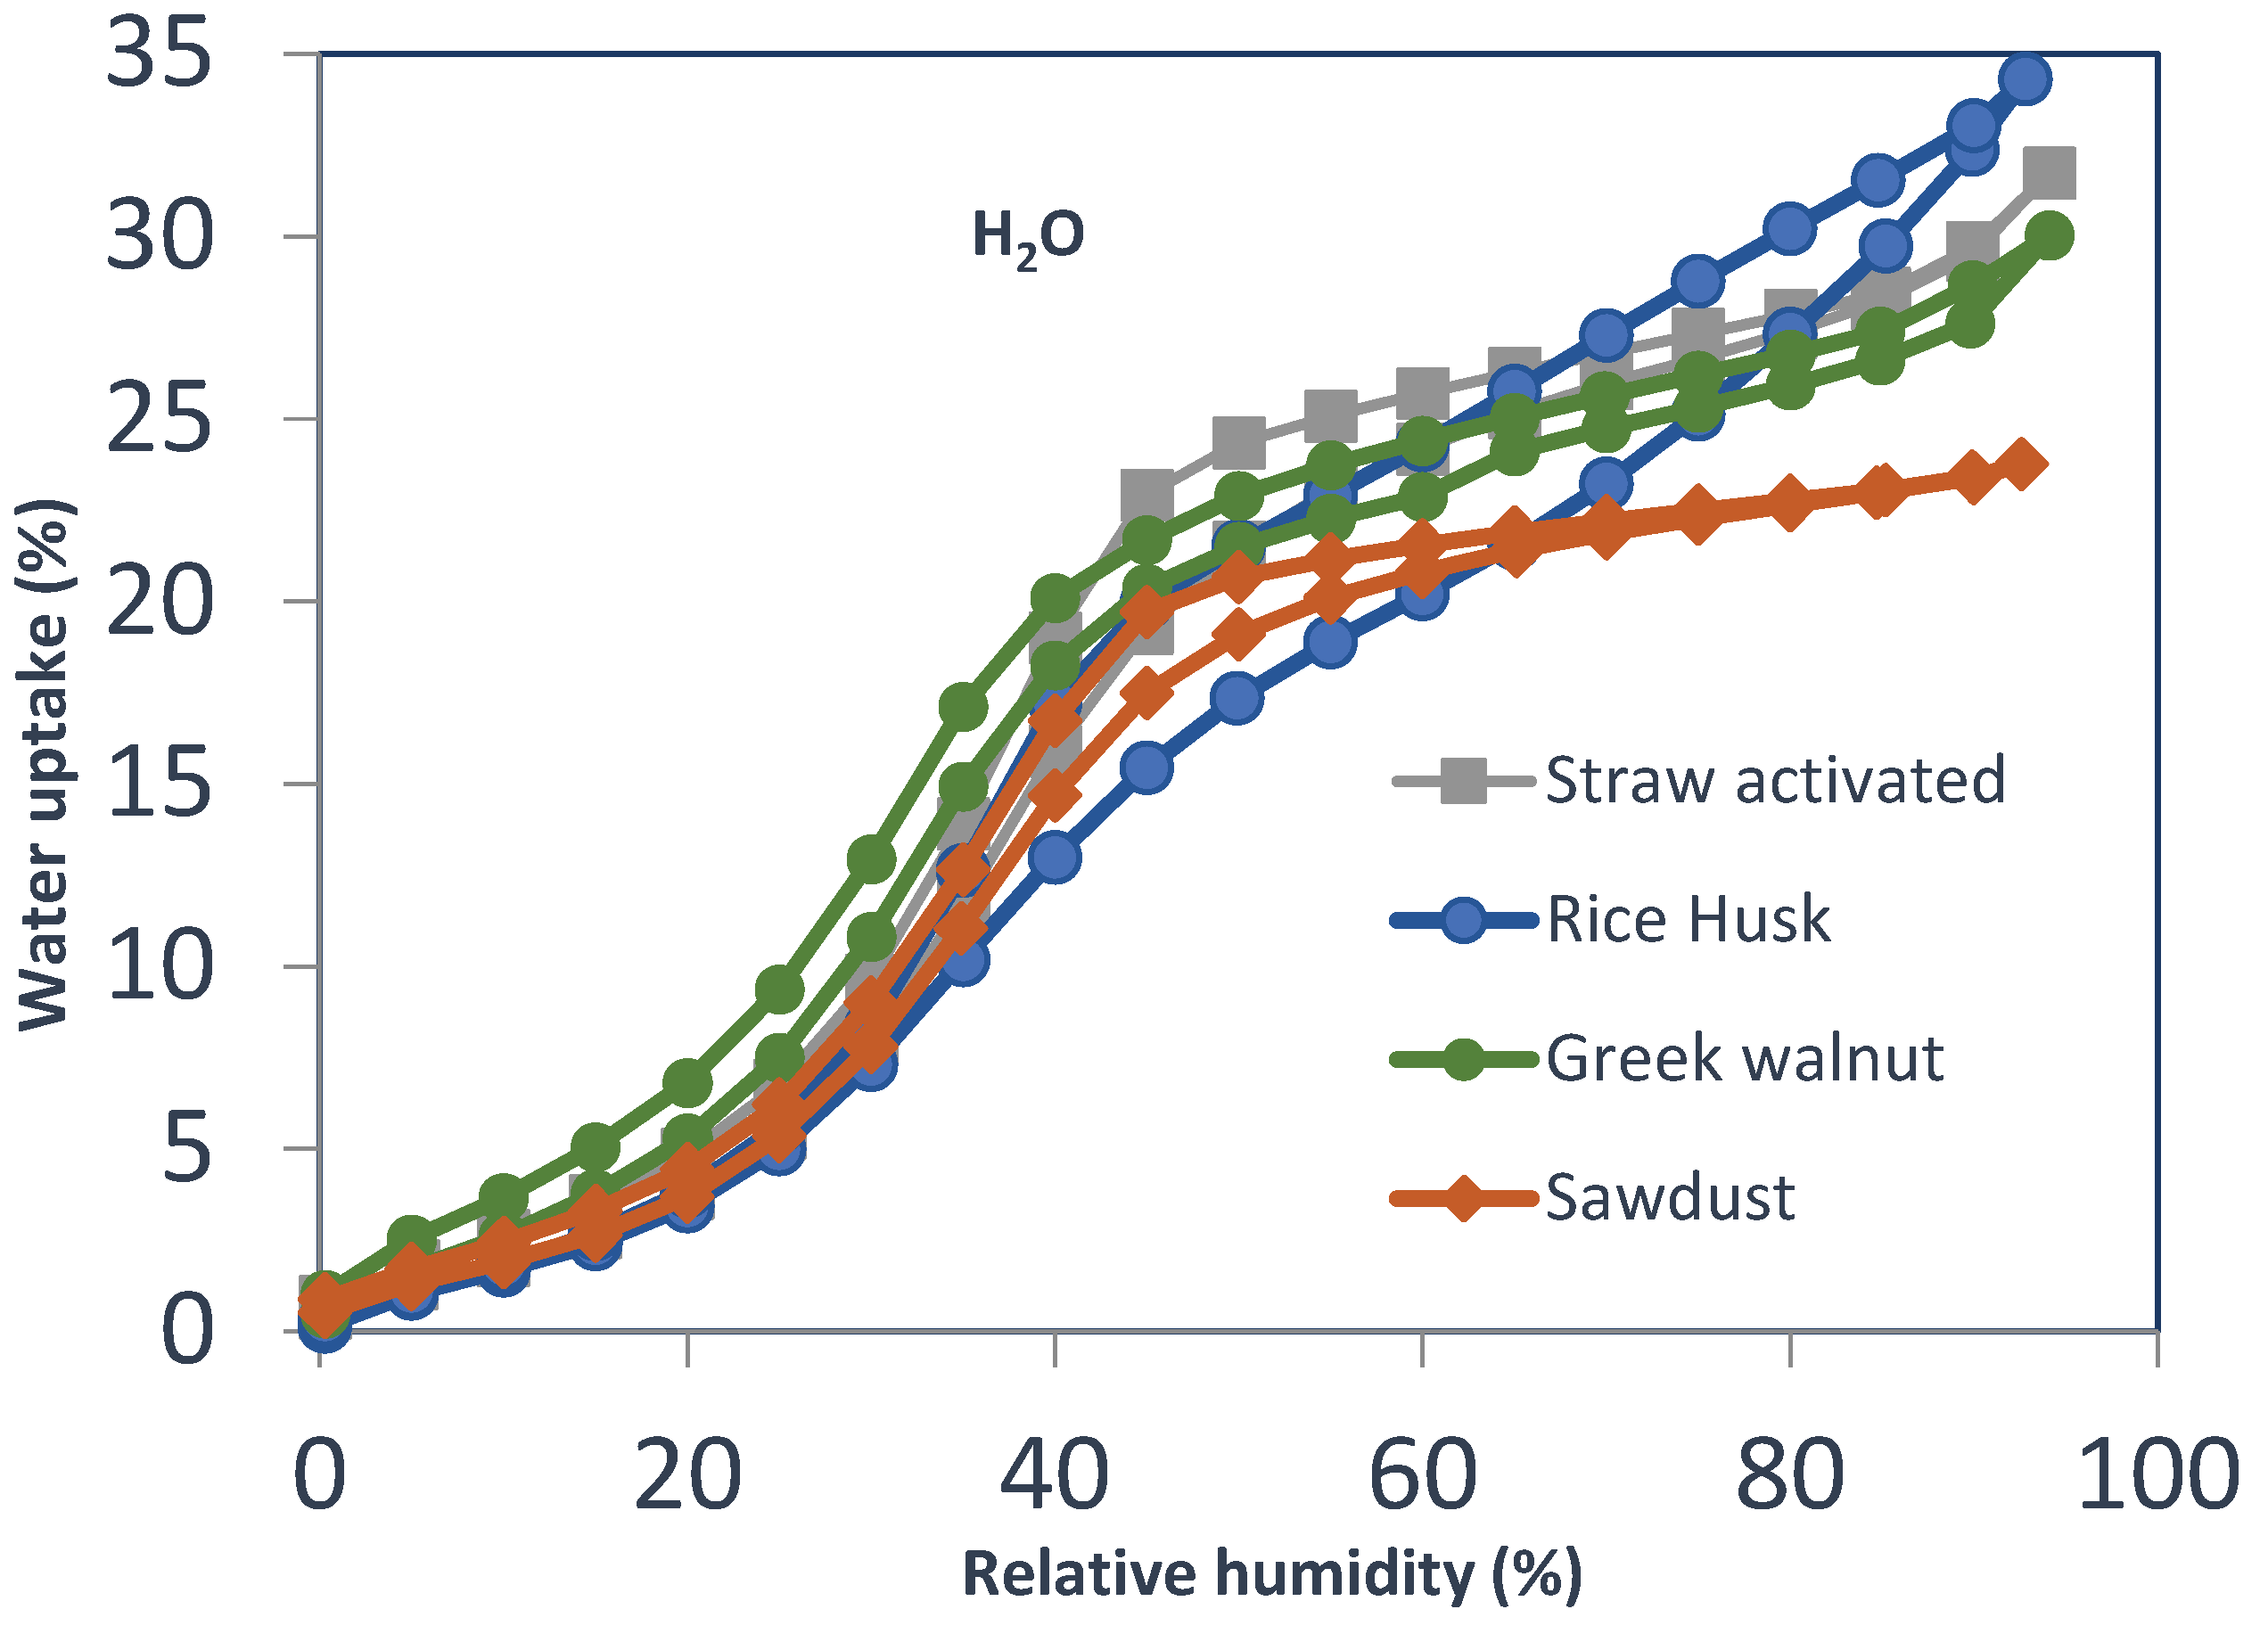
Figure 8.
EDAX analysis results of the activated carbon samples: (a) Rice Husk act; (b) Straw act; (c) Sawdust and (d) Walnut shells.
Figure 8.
EDAX analysis results of the activated carbon samples: (a) Rice Husk act; (b) Straw act; (c) Sawdust and (d) Walnut shells.
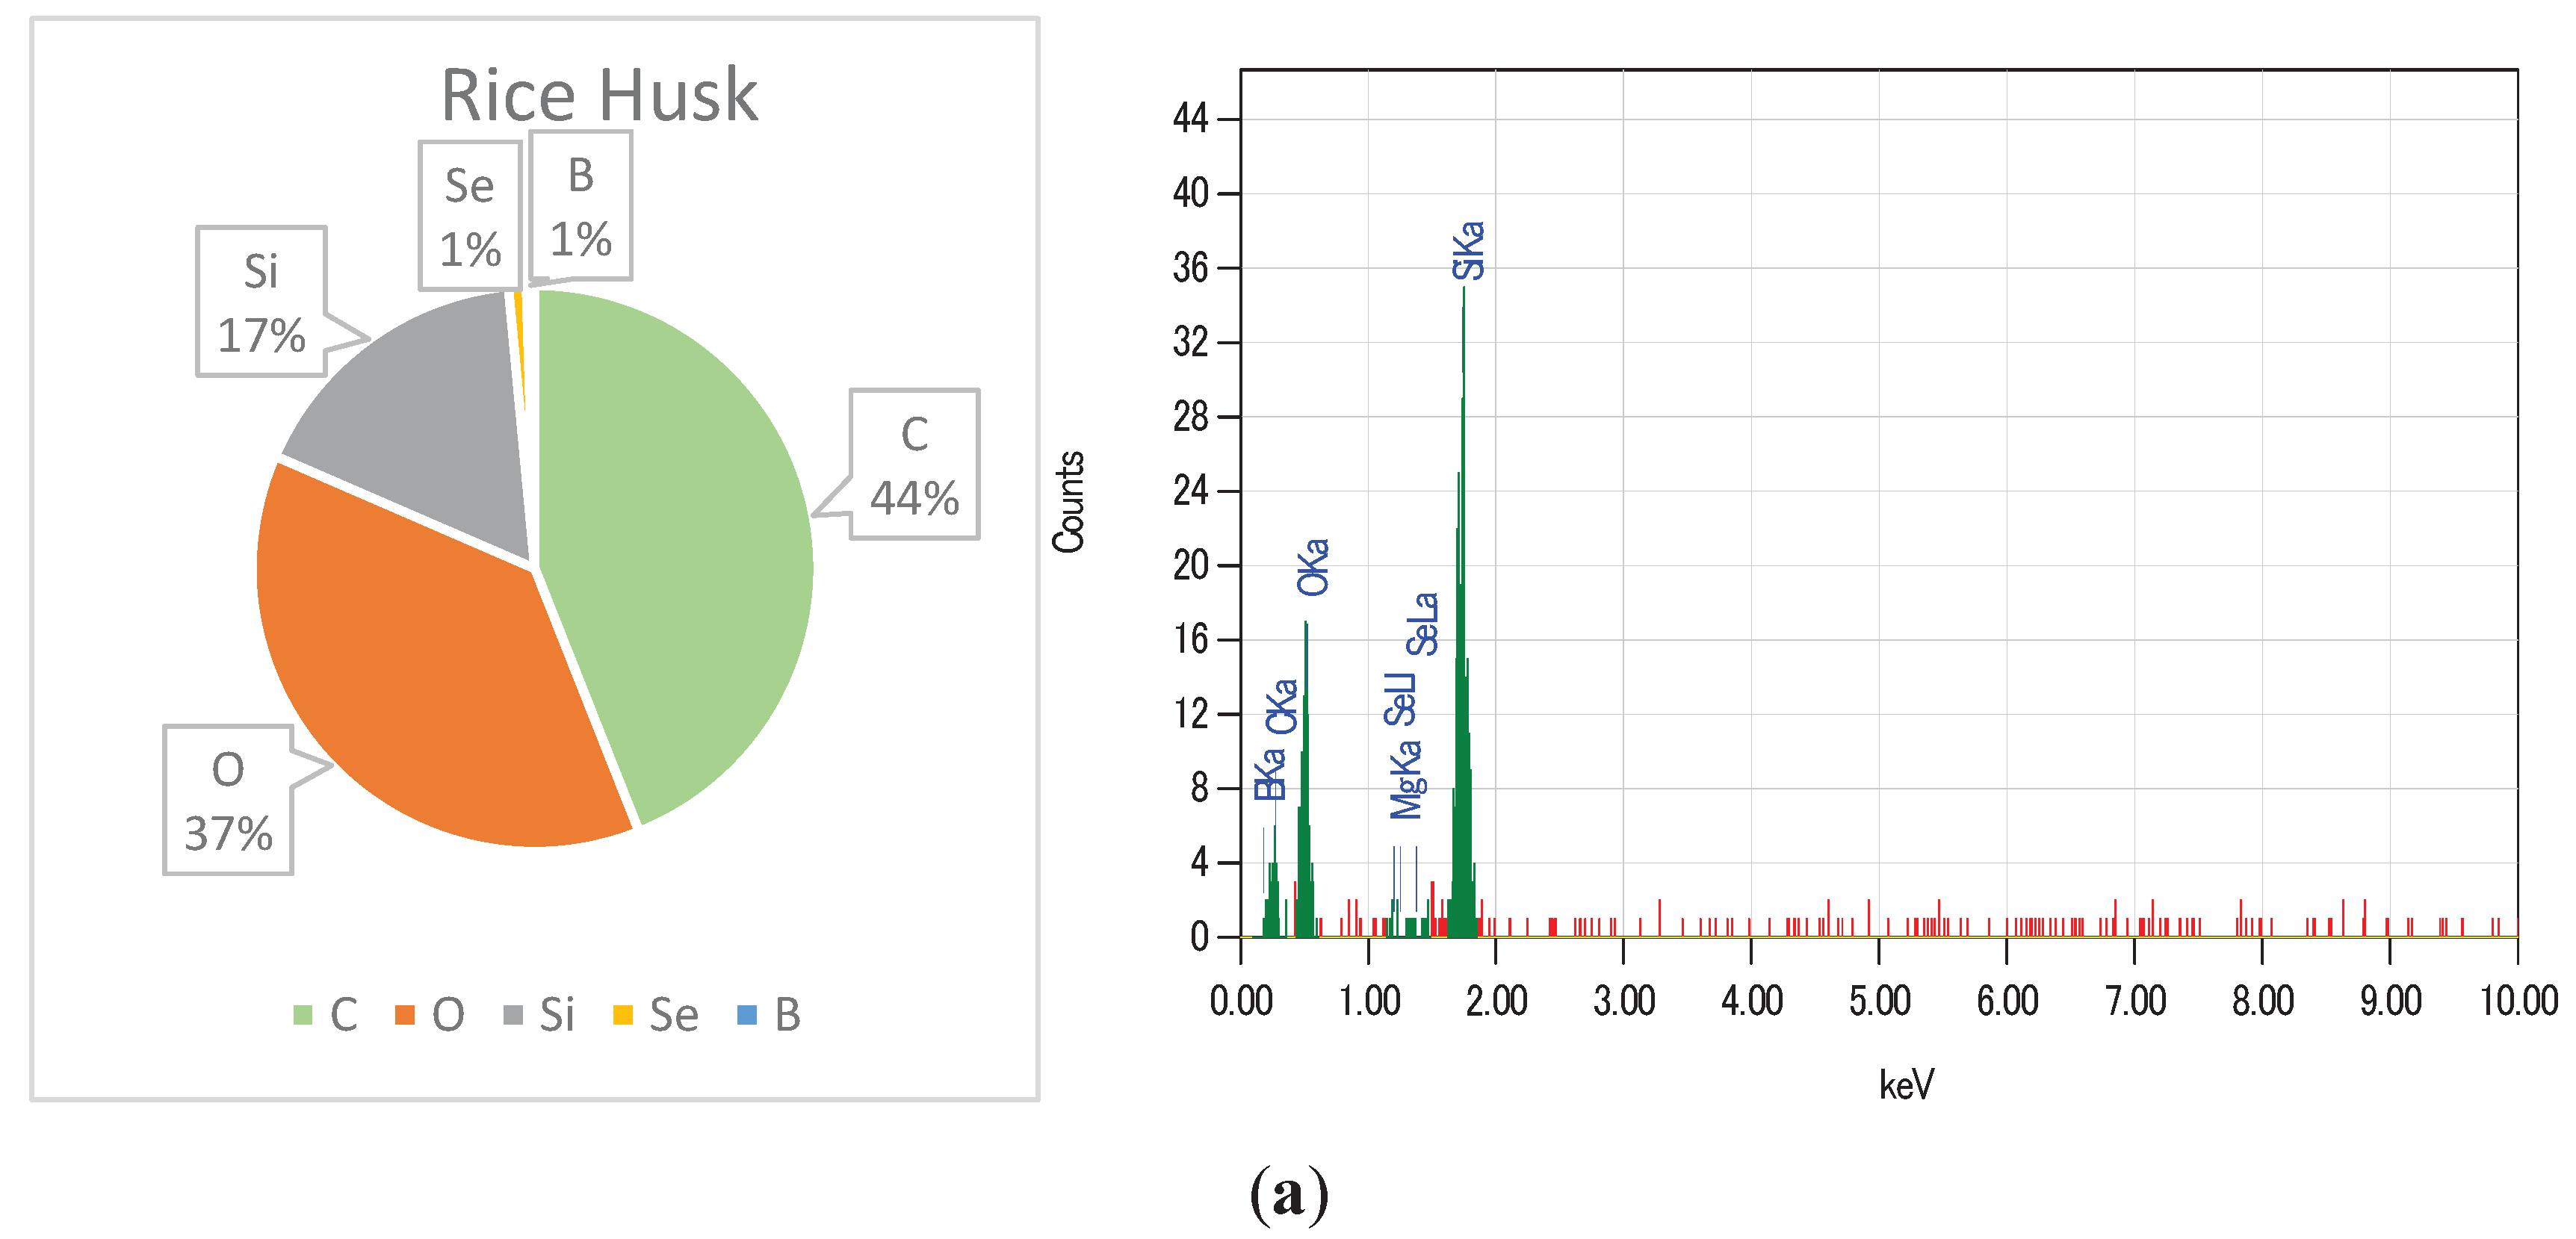
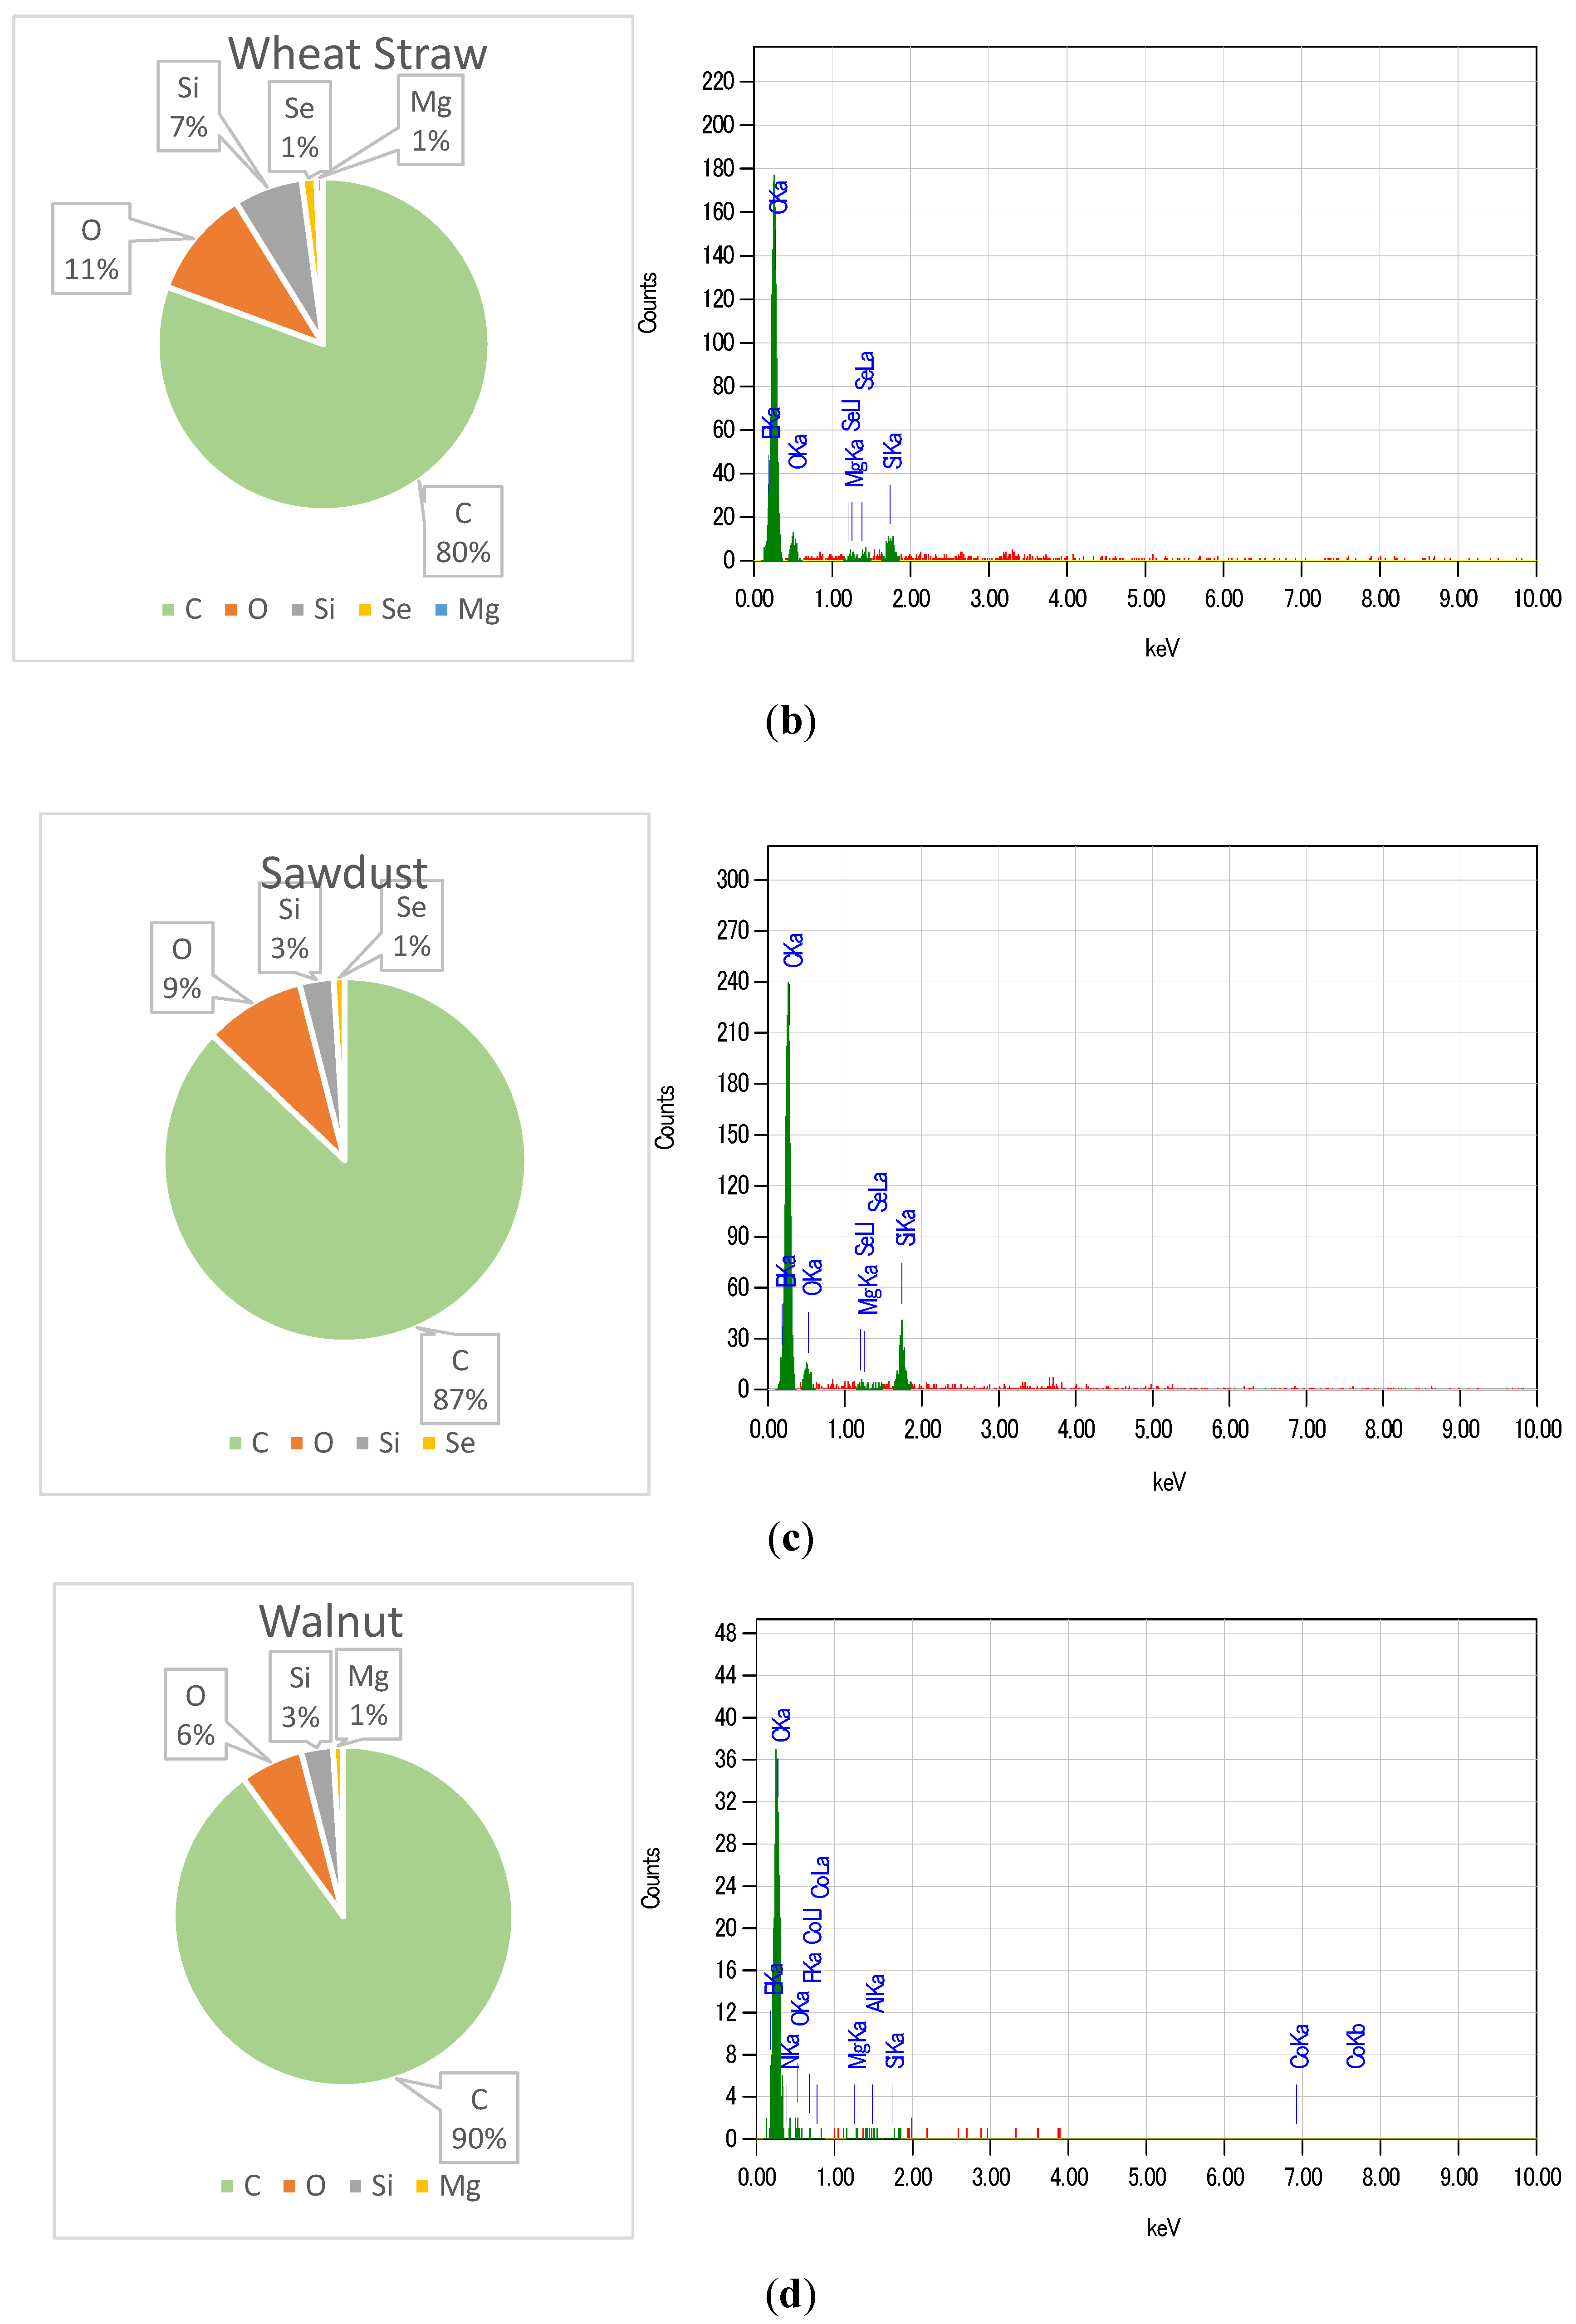
Figure 9.
NH₃ breakthrough time curves of activated carbon samples.
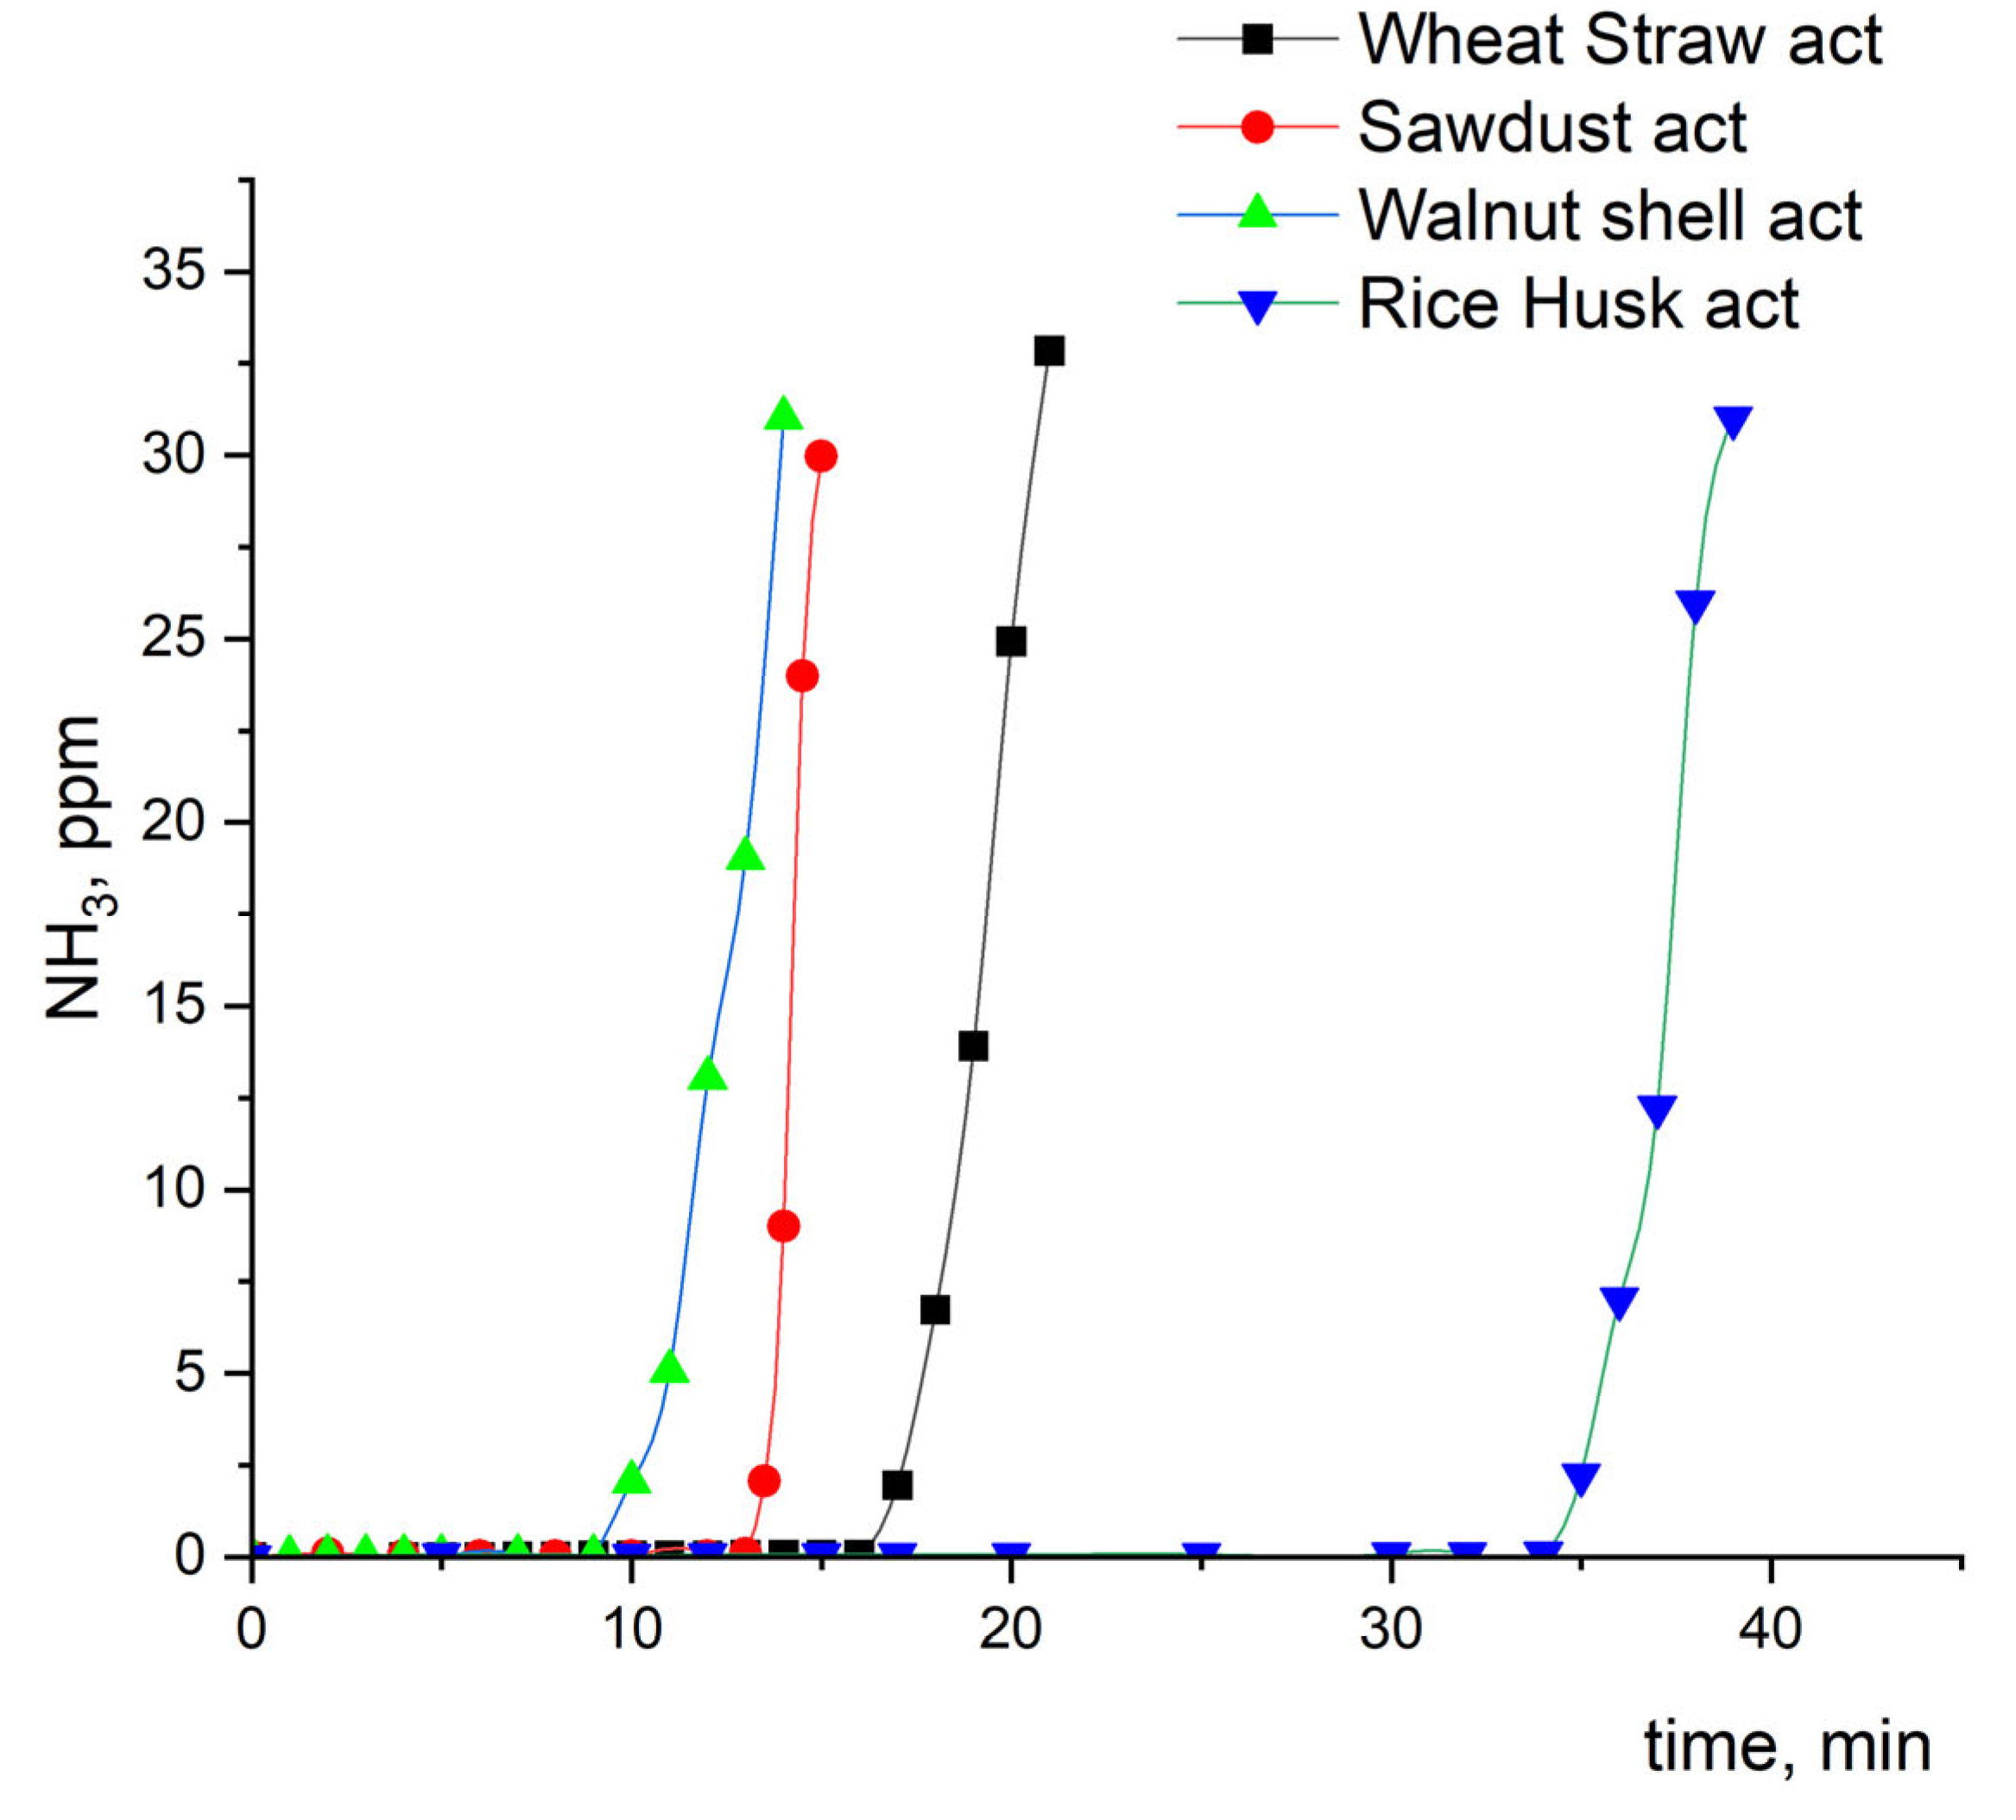
Figure 10.
Nitrogen sorption isotherms of the Rice Husk based activated carbons by Urea at the 2:1 and 3:1 carbon/urea mass ratio.
Figure 10.
Nitrogen sorption isotherms of the Rice Husk based activated carbons by Urea at the 2:1 and 3:1 carbon/urea mass ratio.
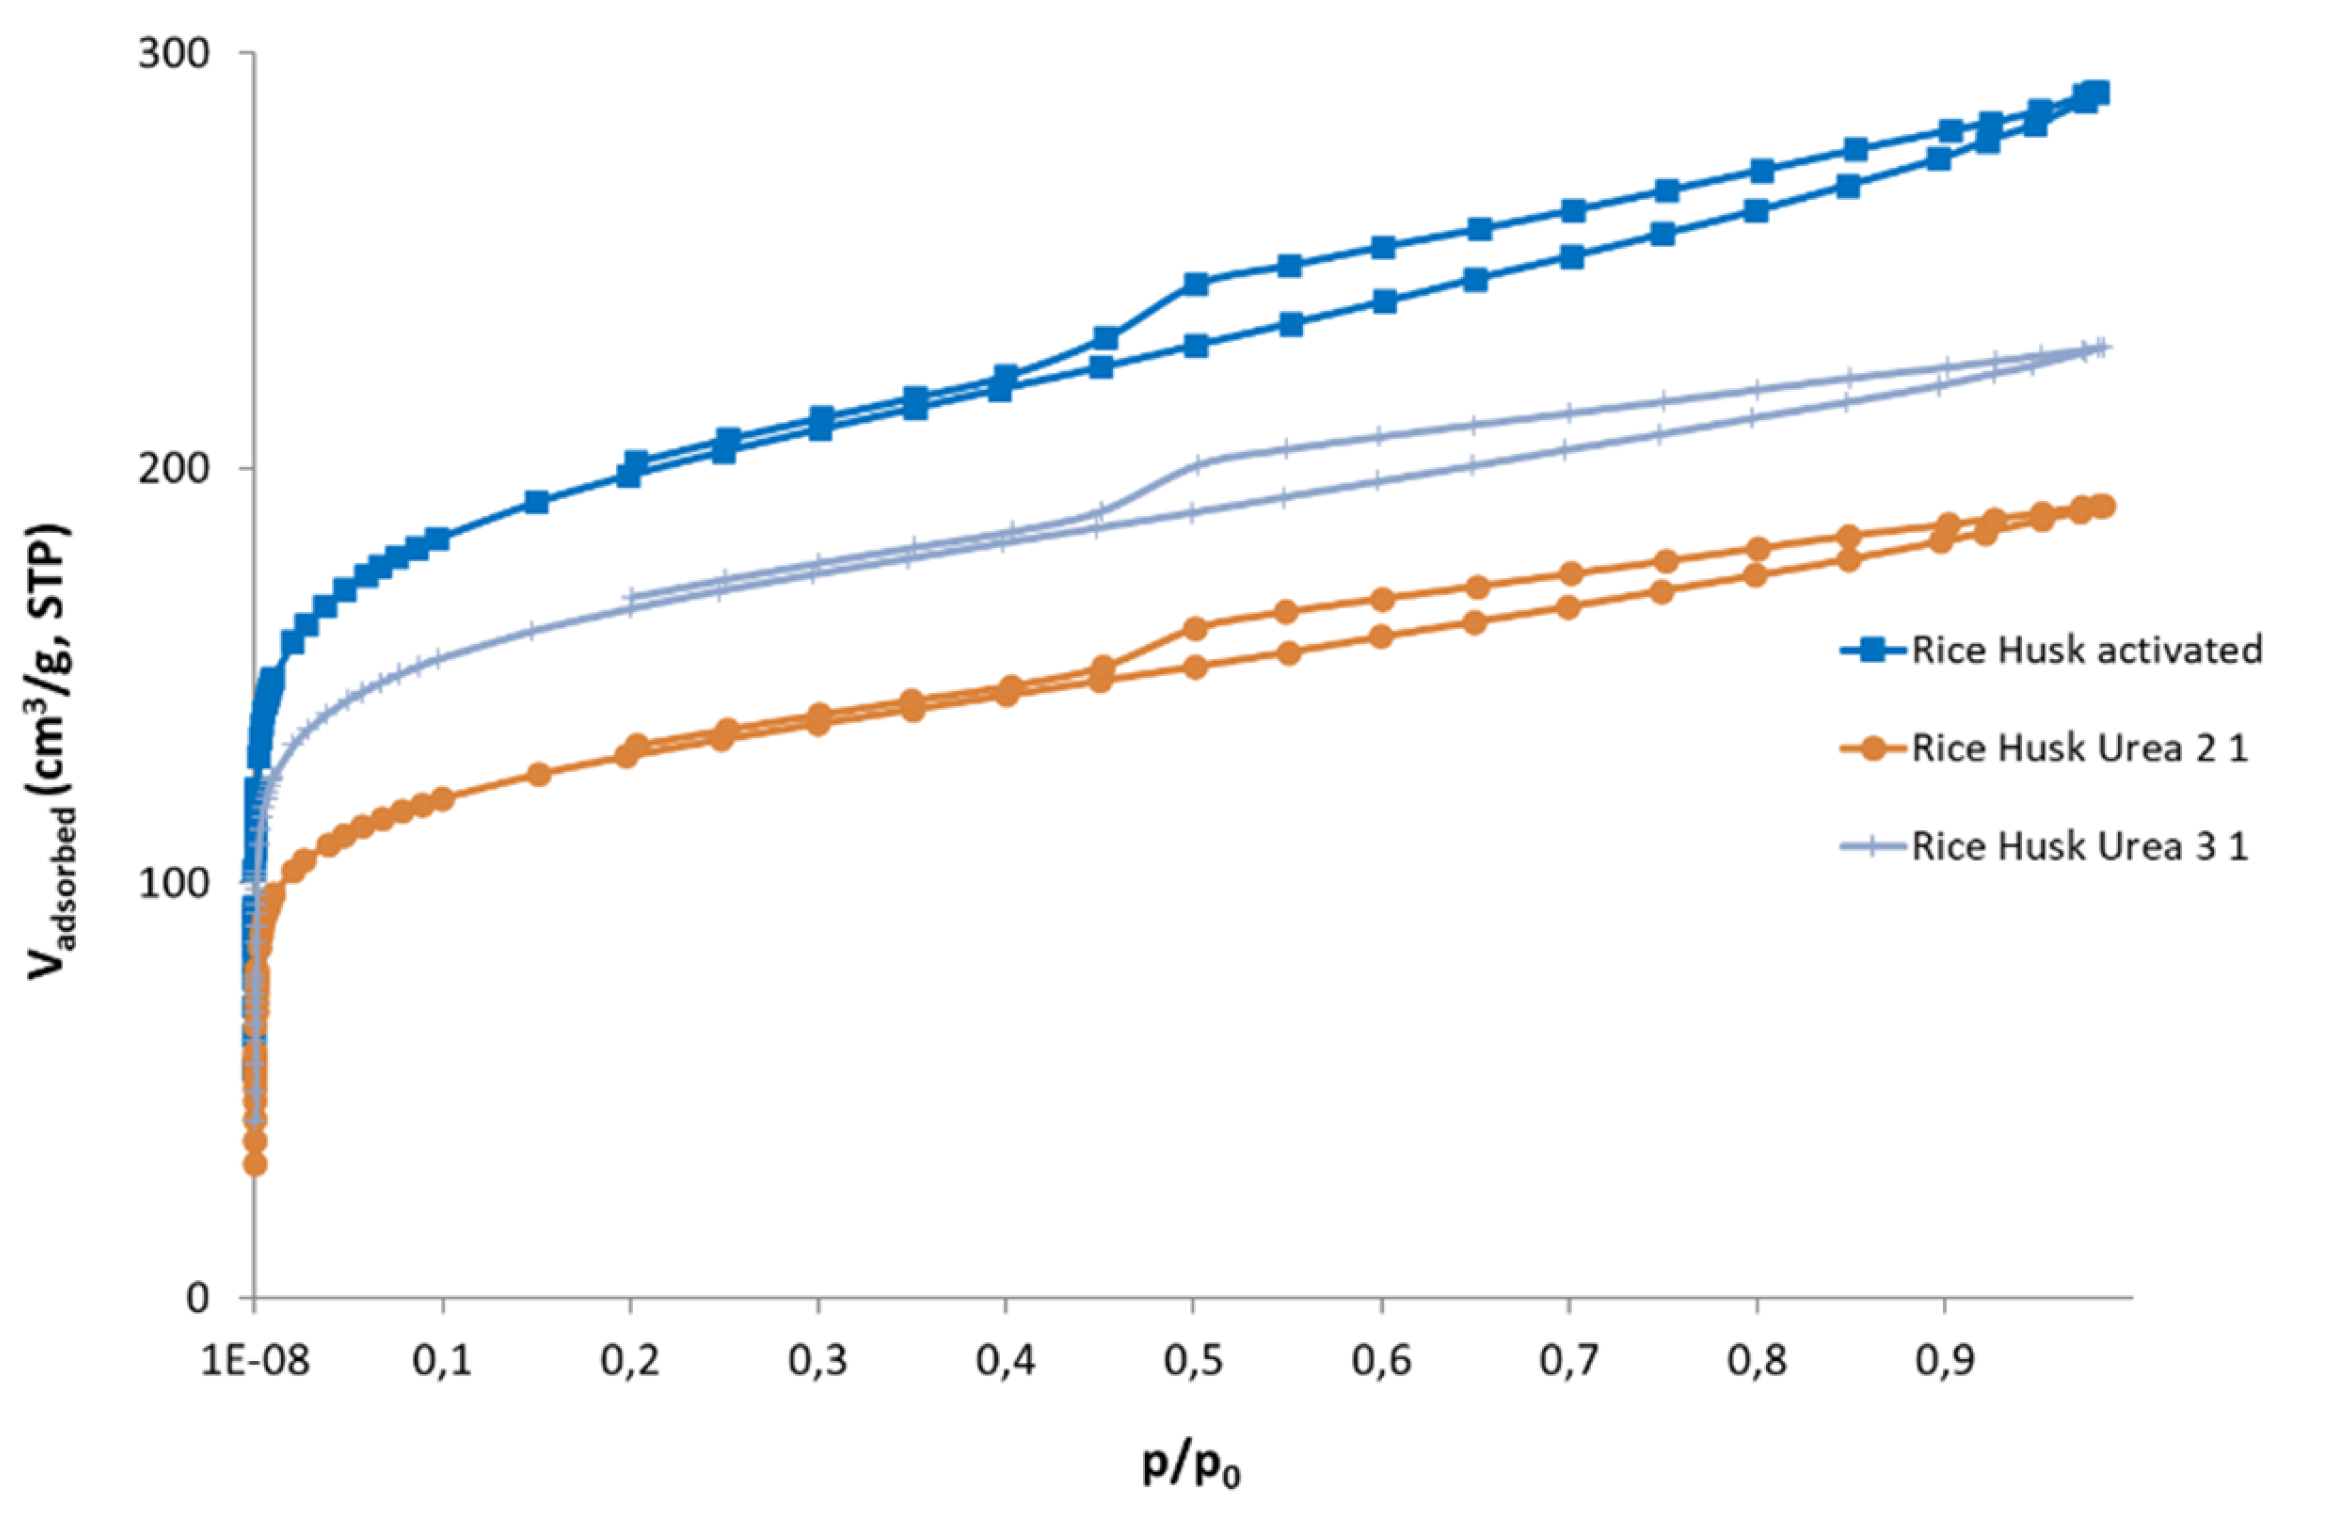
Figure 11.
QSDFT slit equilibrium model analysis of Rice Husk based activated carbons by Urea at the 2:1 and 3:1 carbon/urea mass ratio.
Figure 11.
QSDFT slit equilibrium model analysis of Rice Husk based activated carbons by Urea at the 2:1 and 3:1 carbon/urea mass ratio.
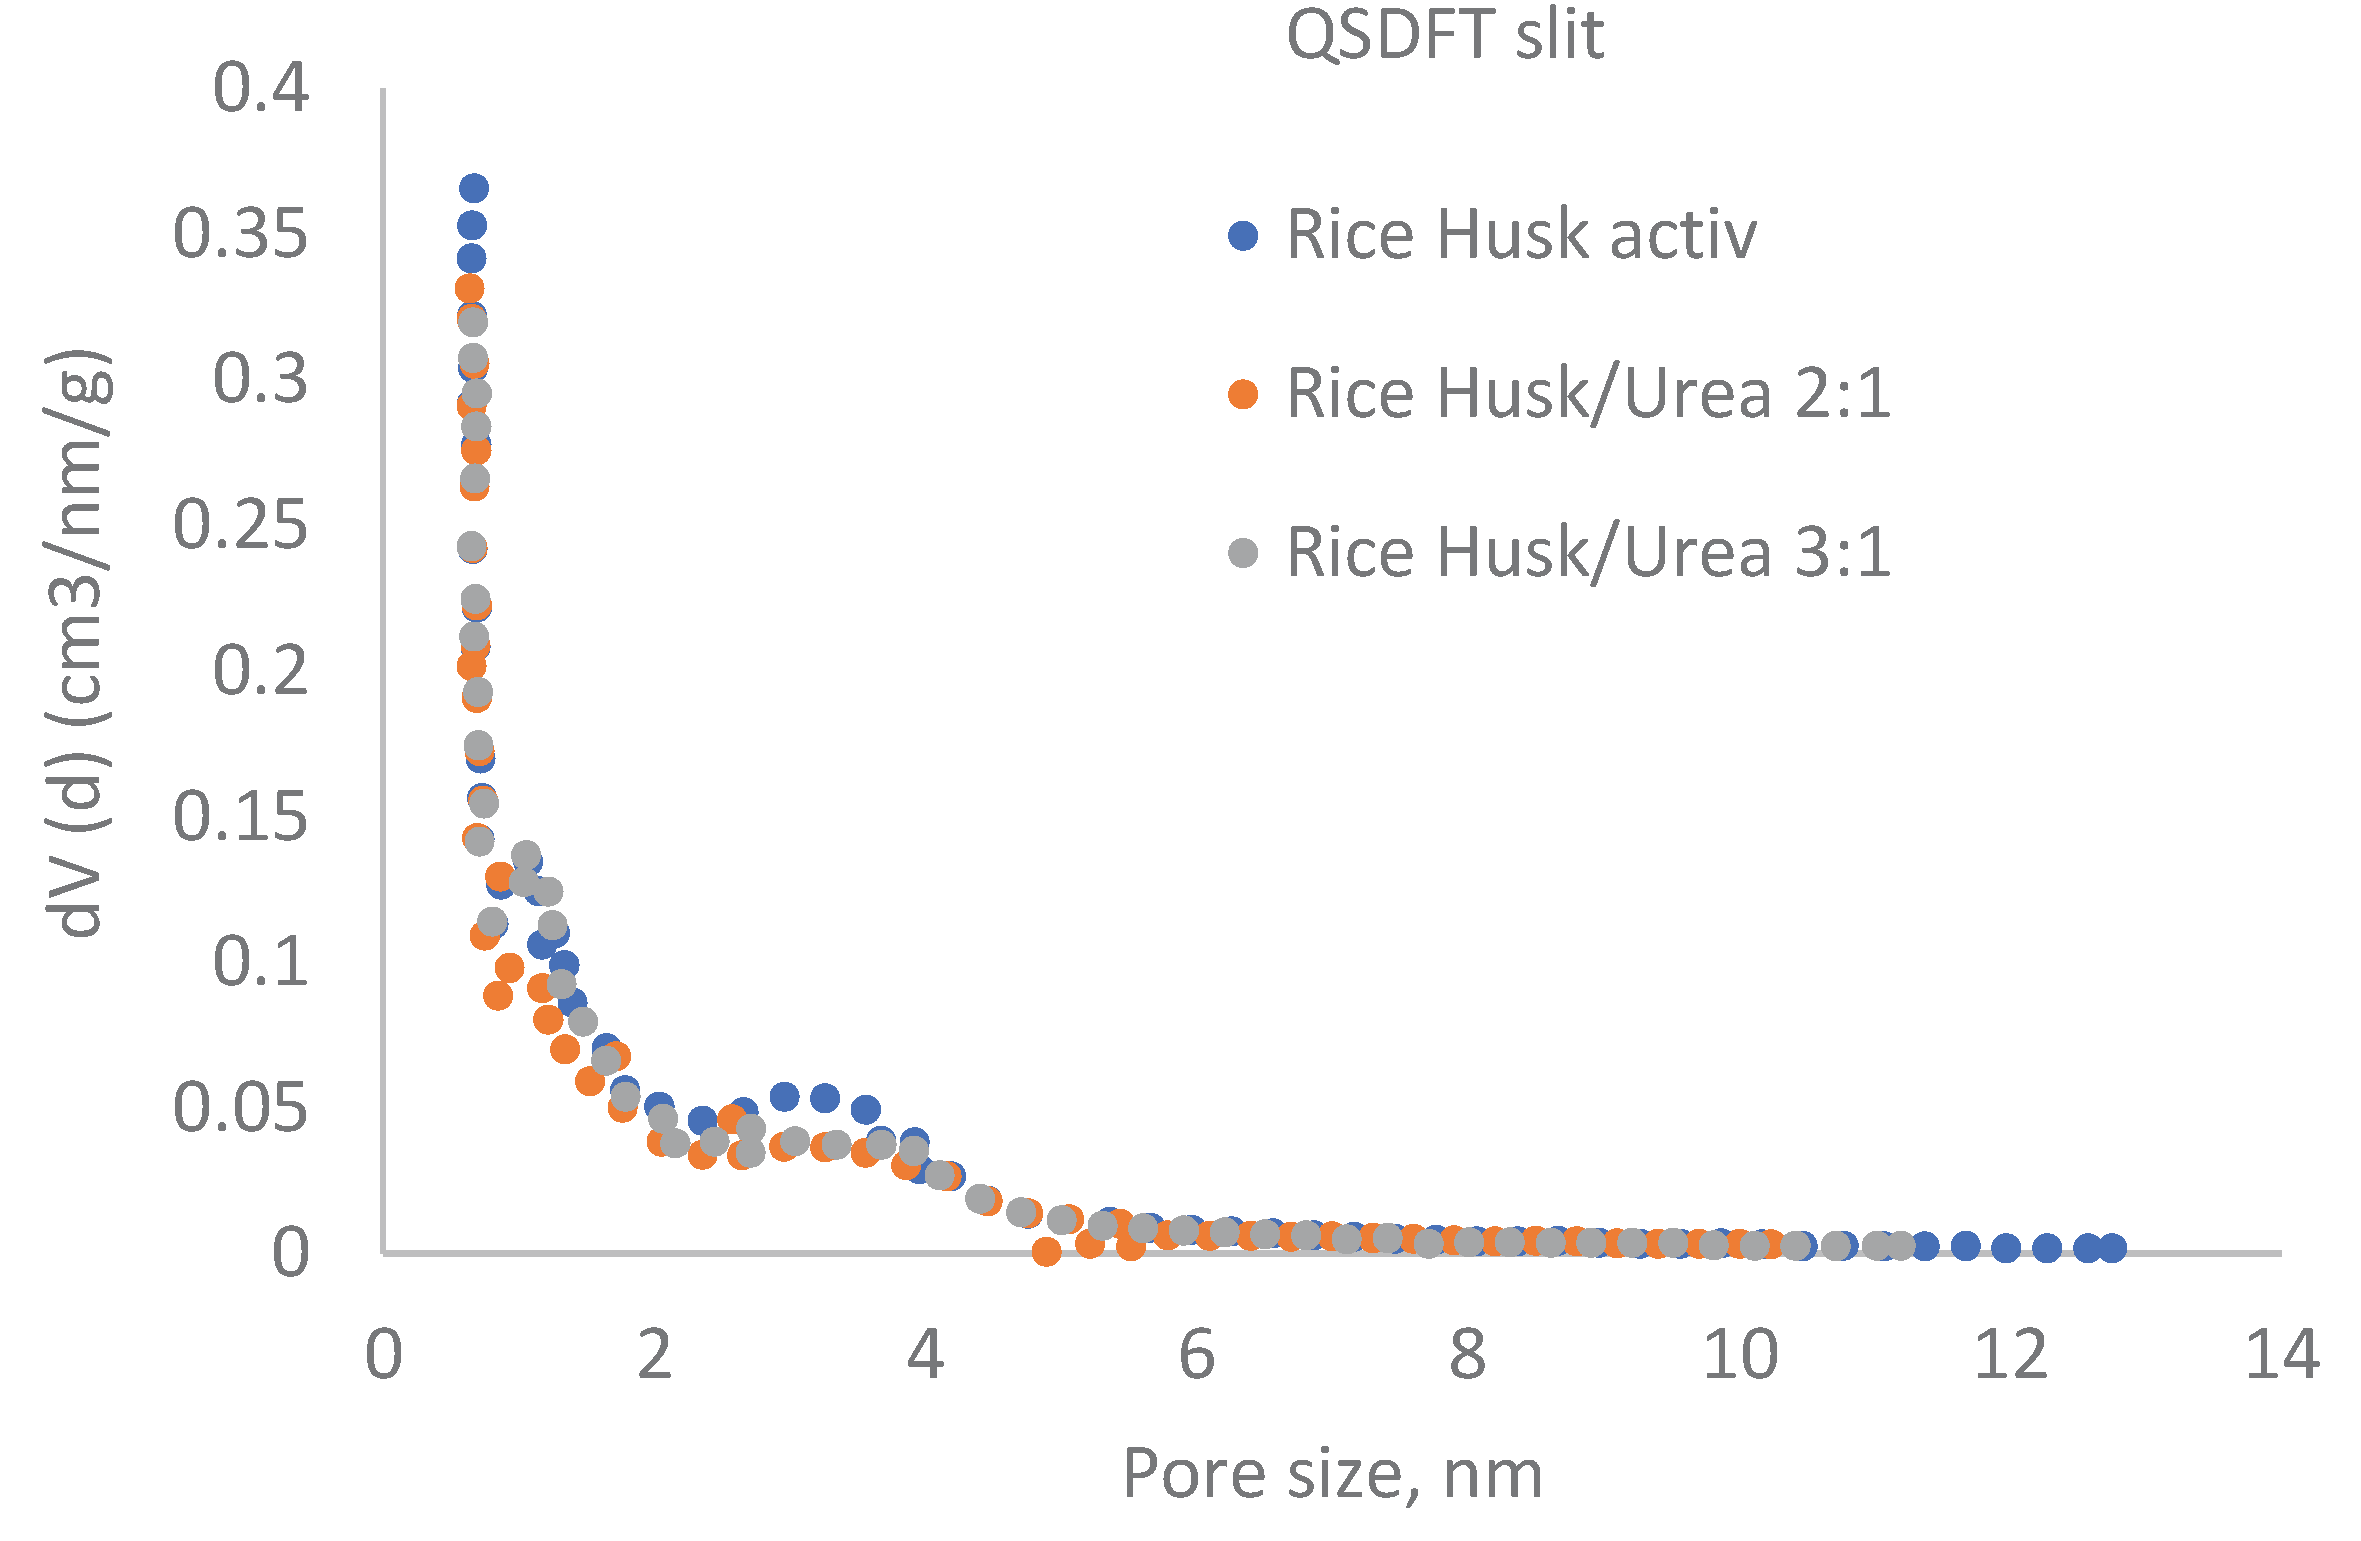
Figure 12.
FTIR – spectra of the urea-modified activated carbon samples from Rice Husk.
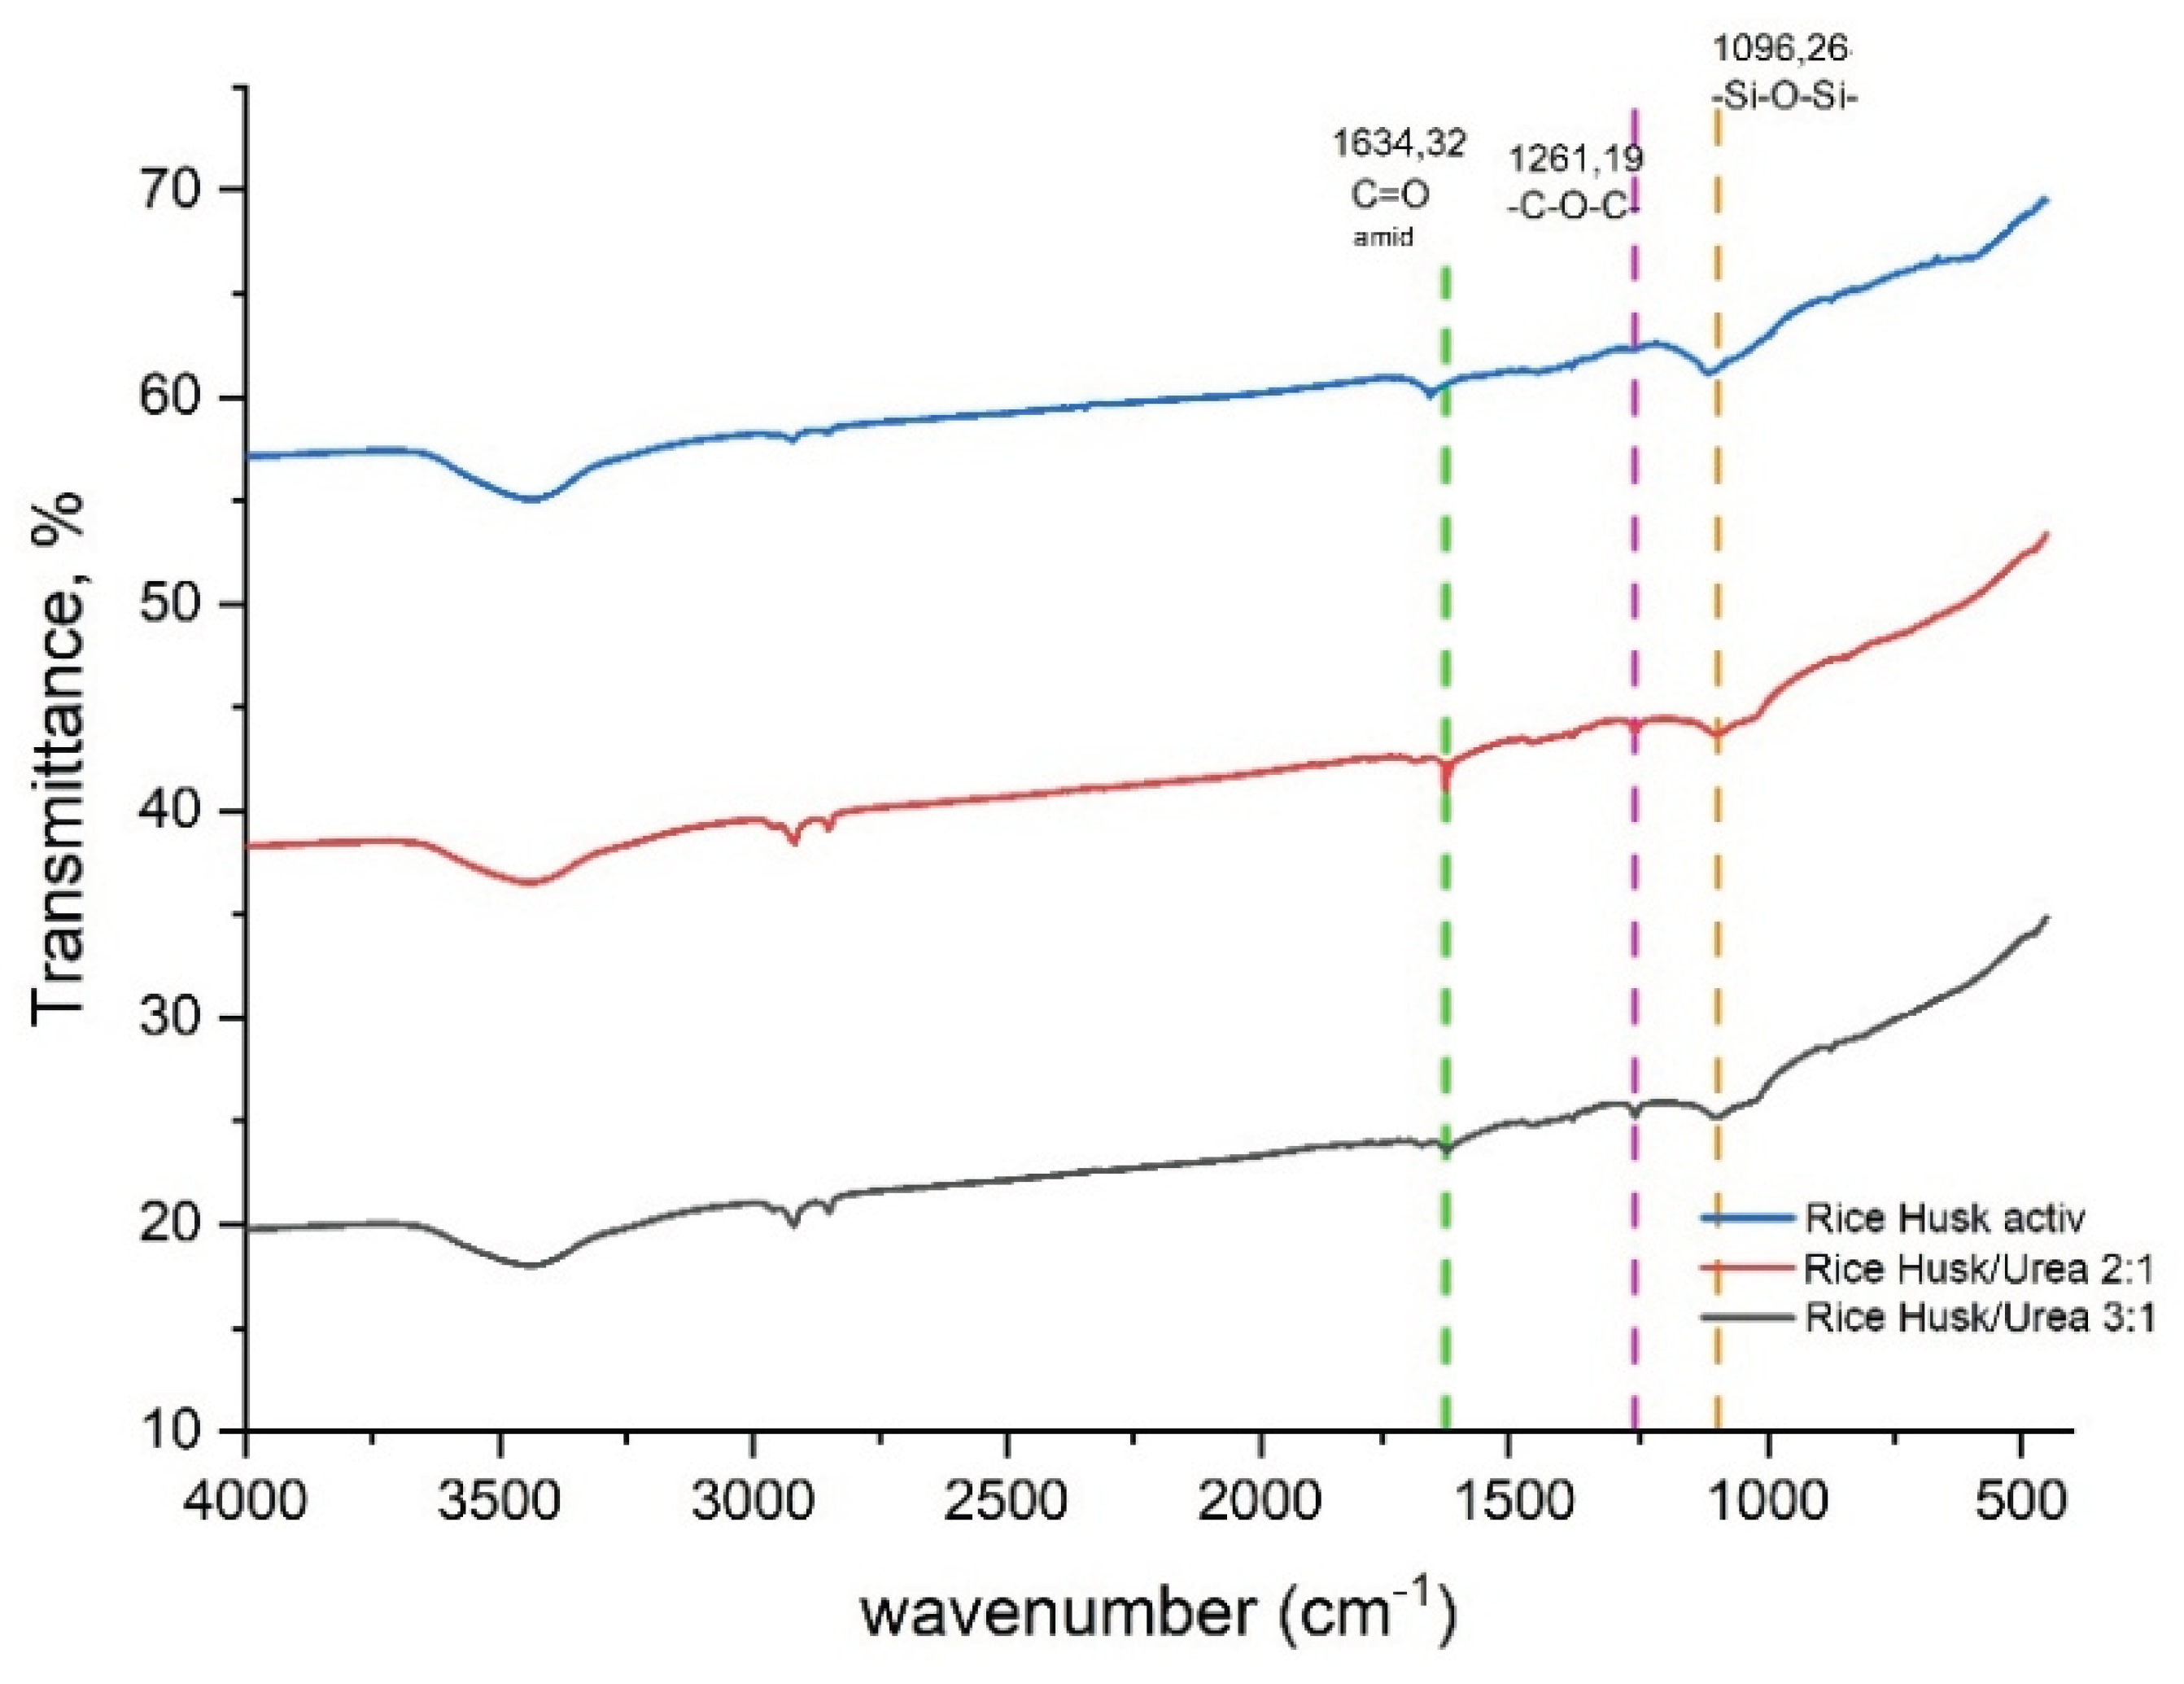
Figure 13.
EDAX analysis results of the Rice Husk activated carbon samples modified by urea at ratio: (a) 3:1; (b) 2:1.
Figure 13.
EDAX analysis results of the Rice Husk activated carbon samples modified by urea at ratio: (a) 3:1; (b) 2:1.
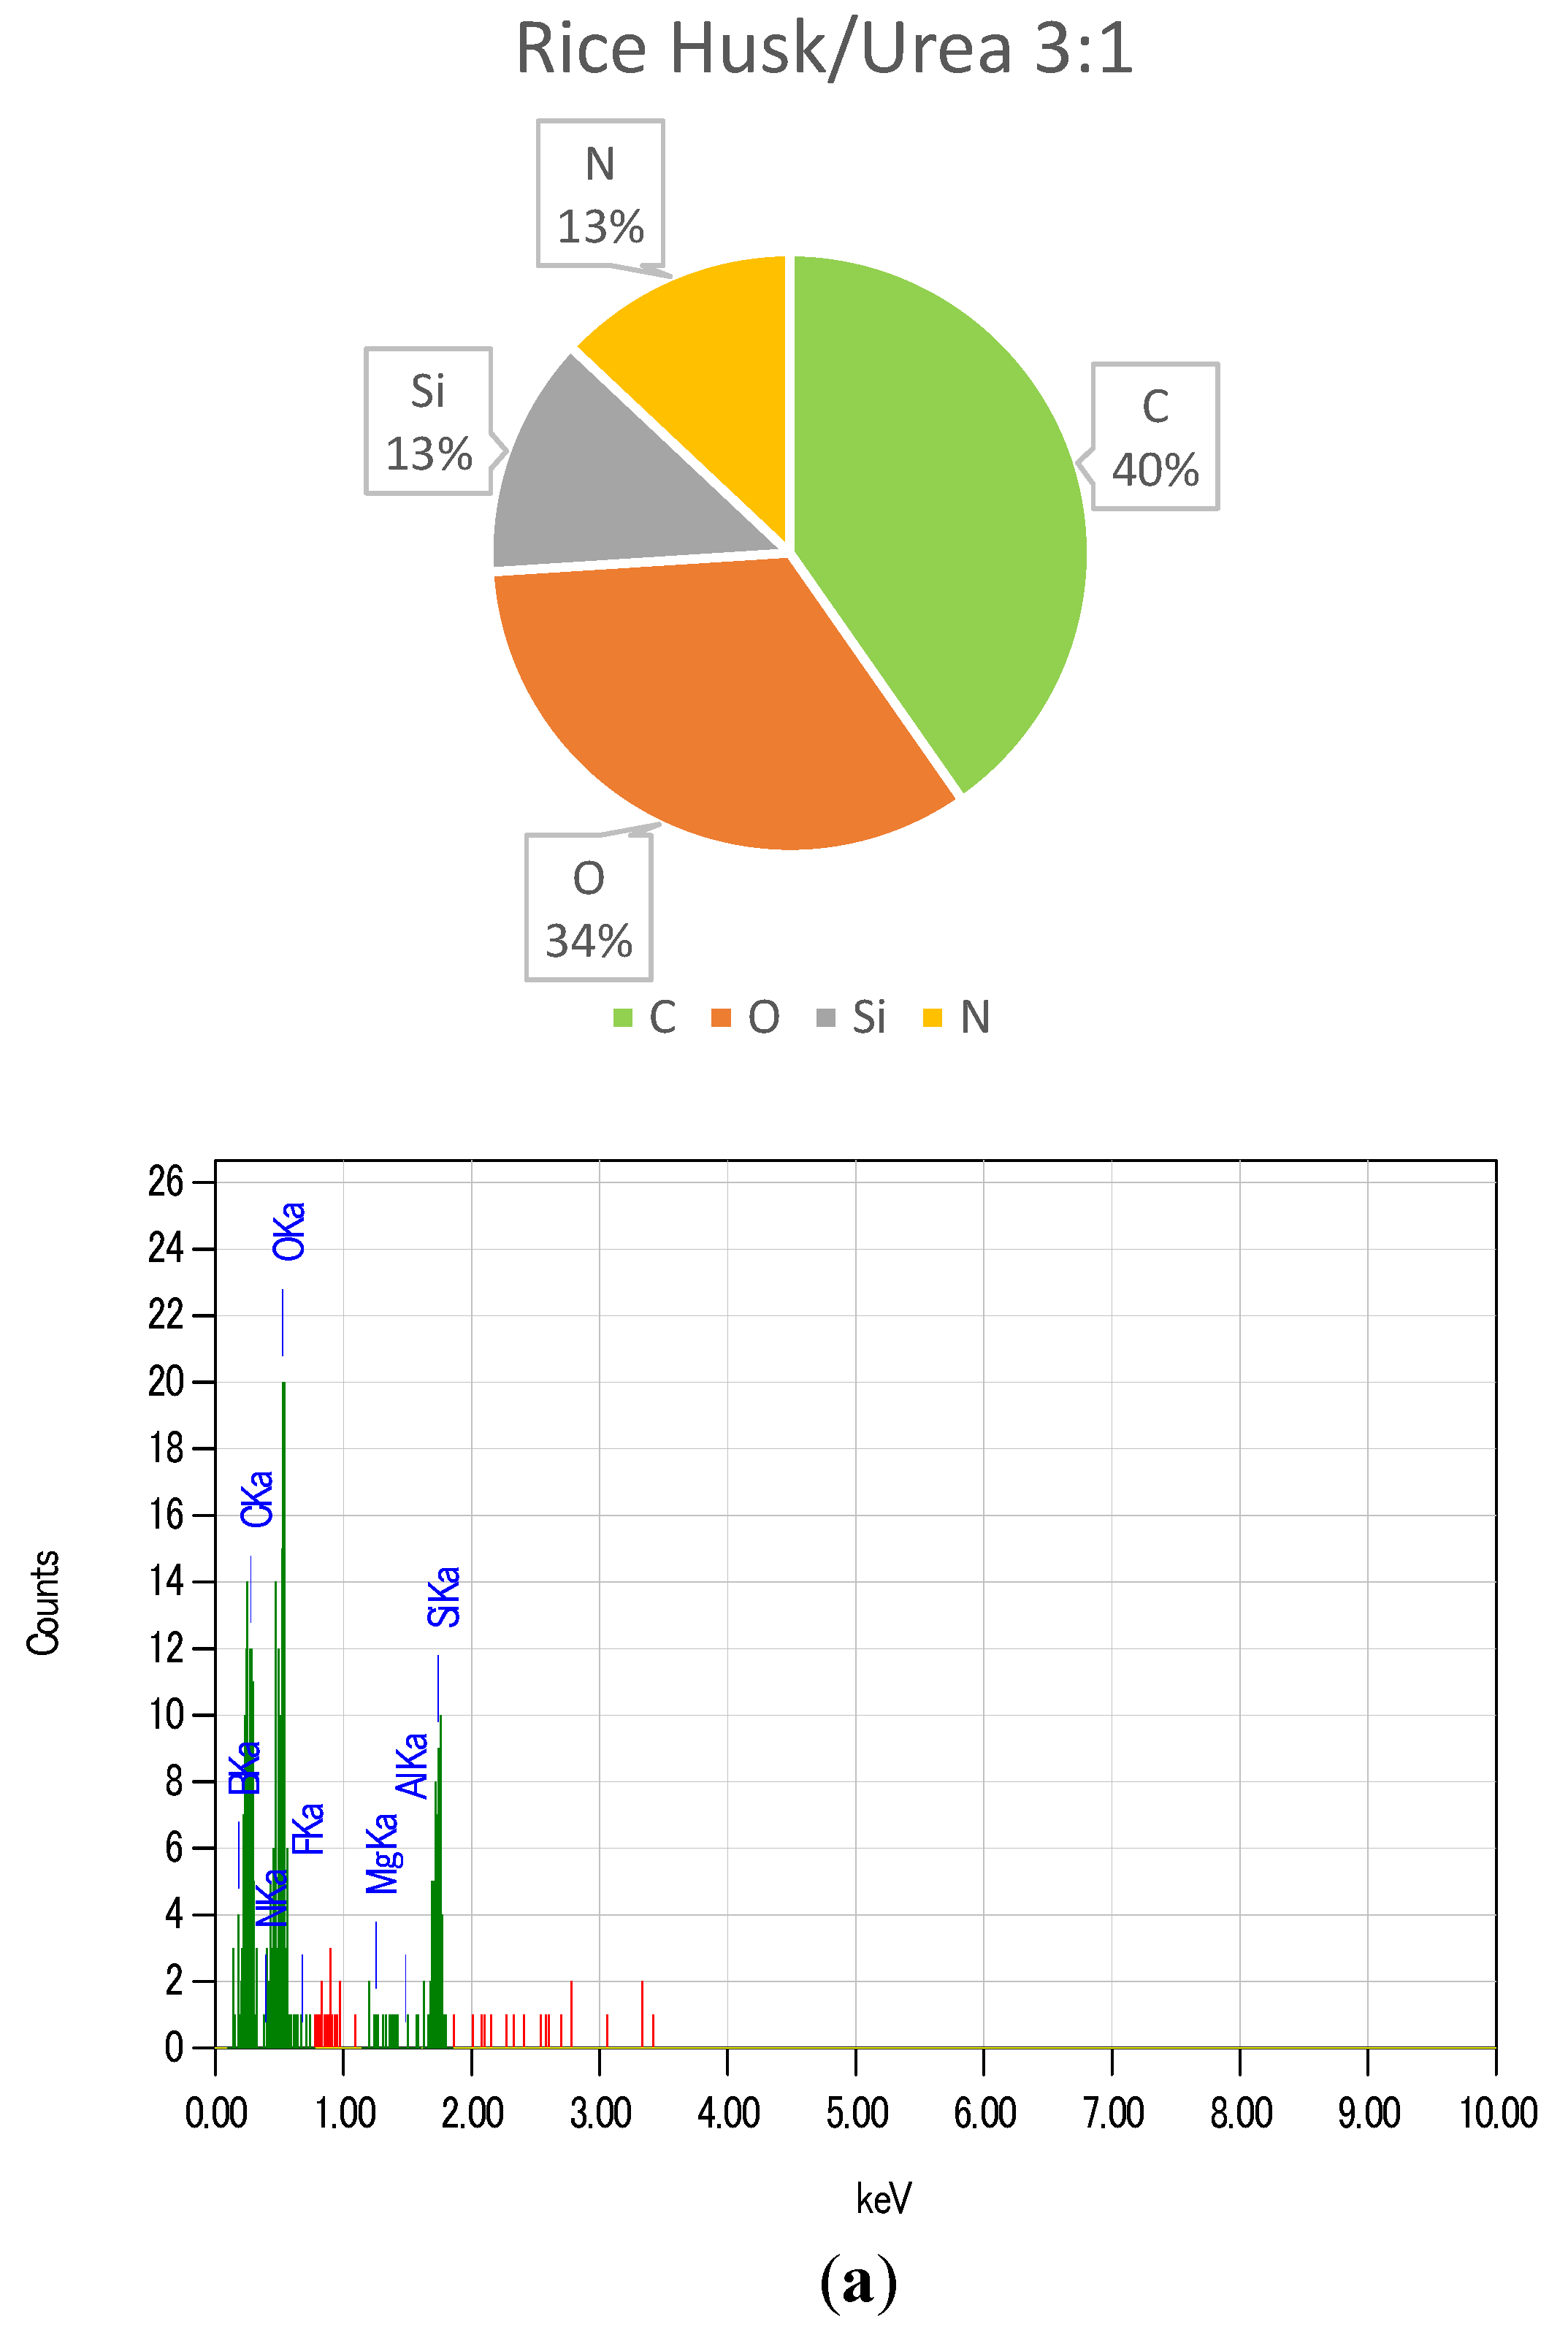
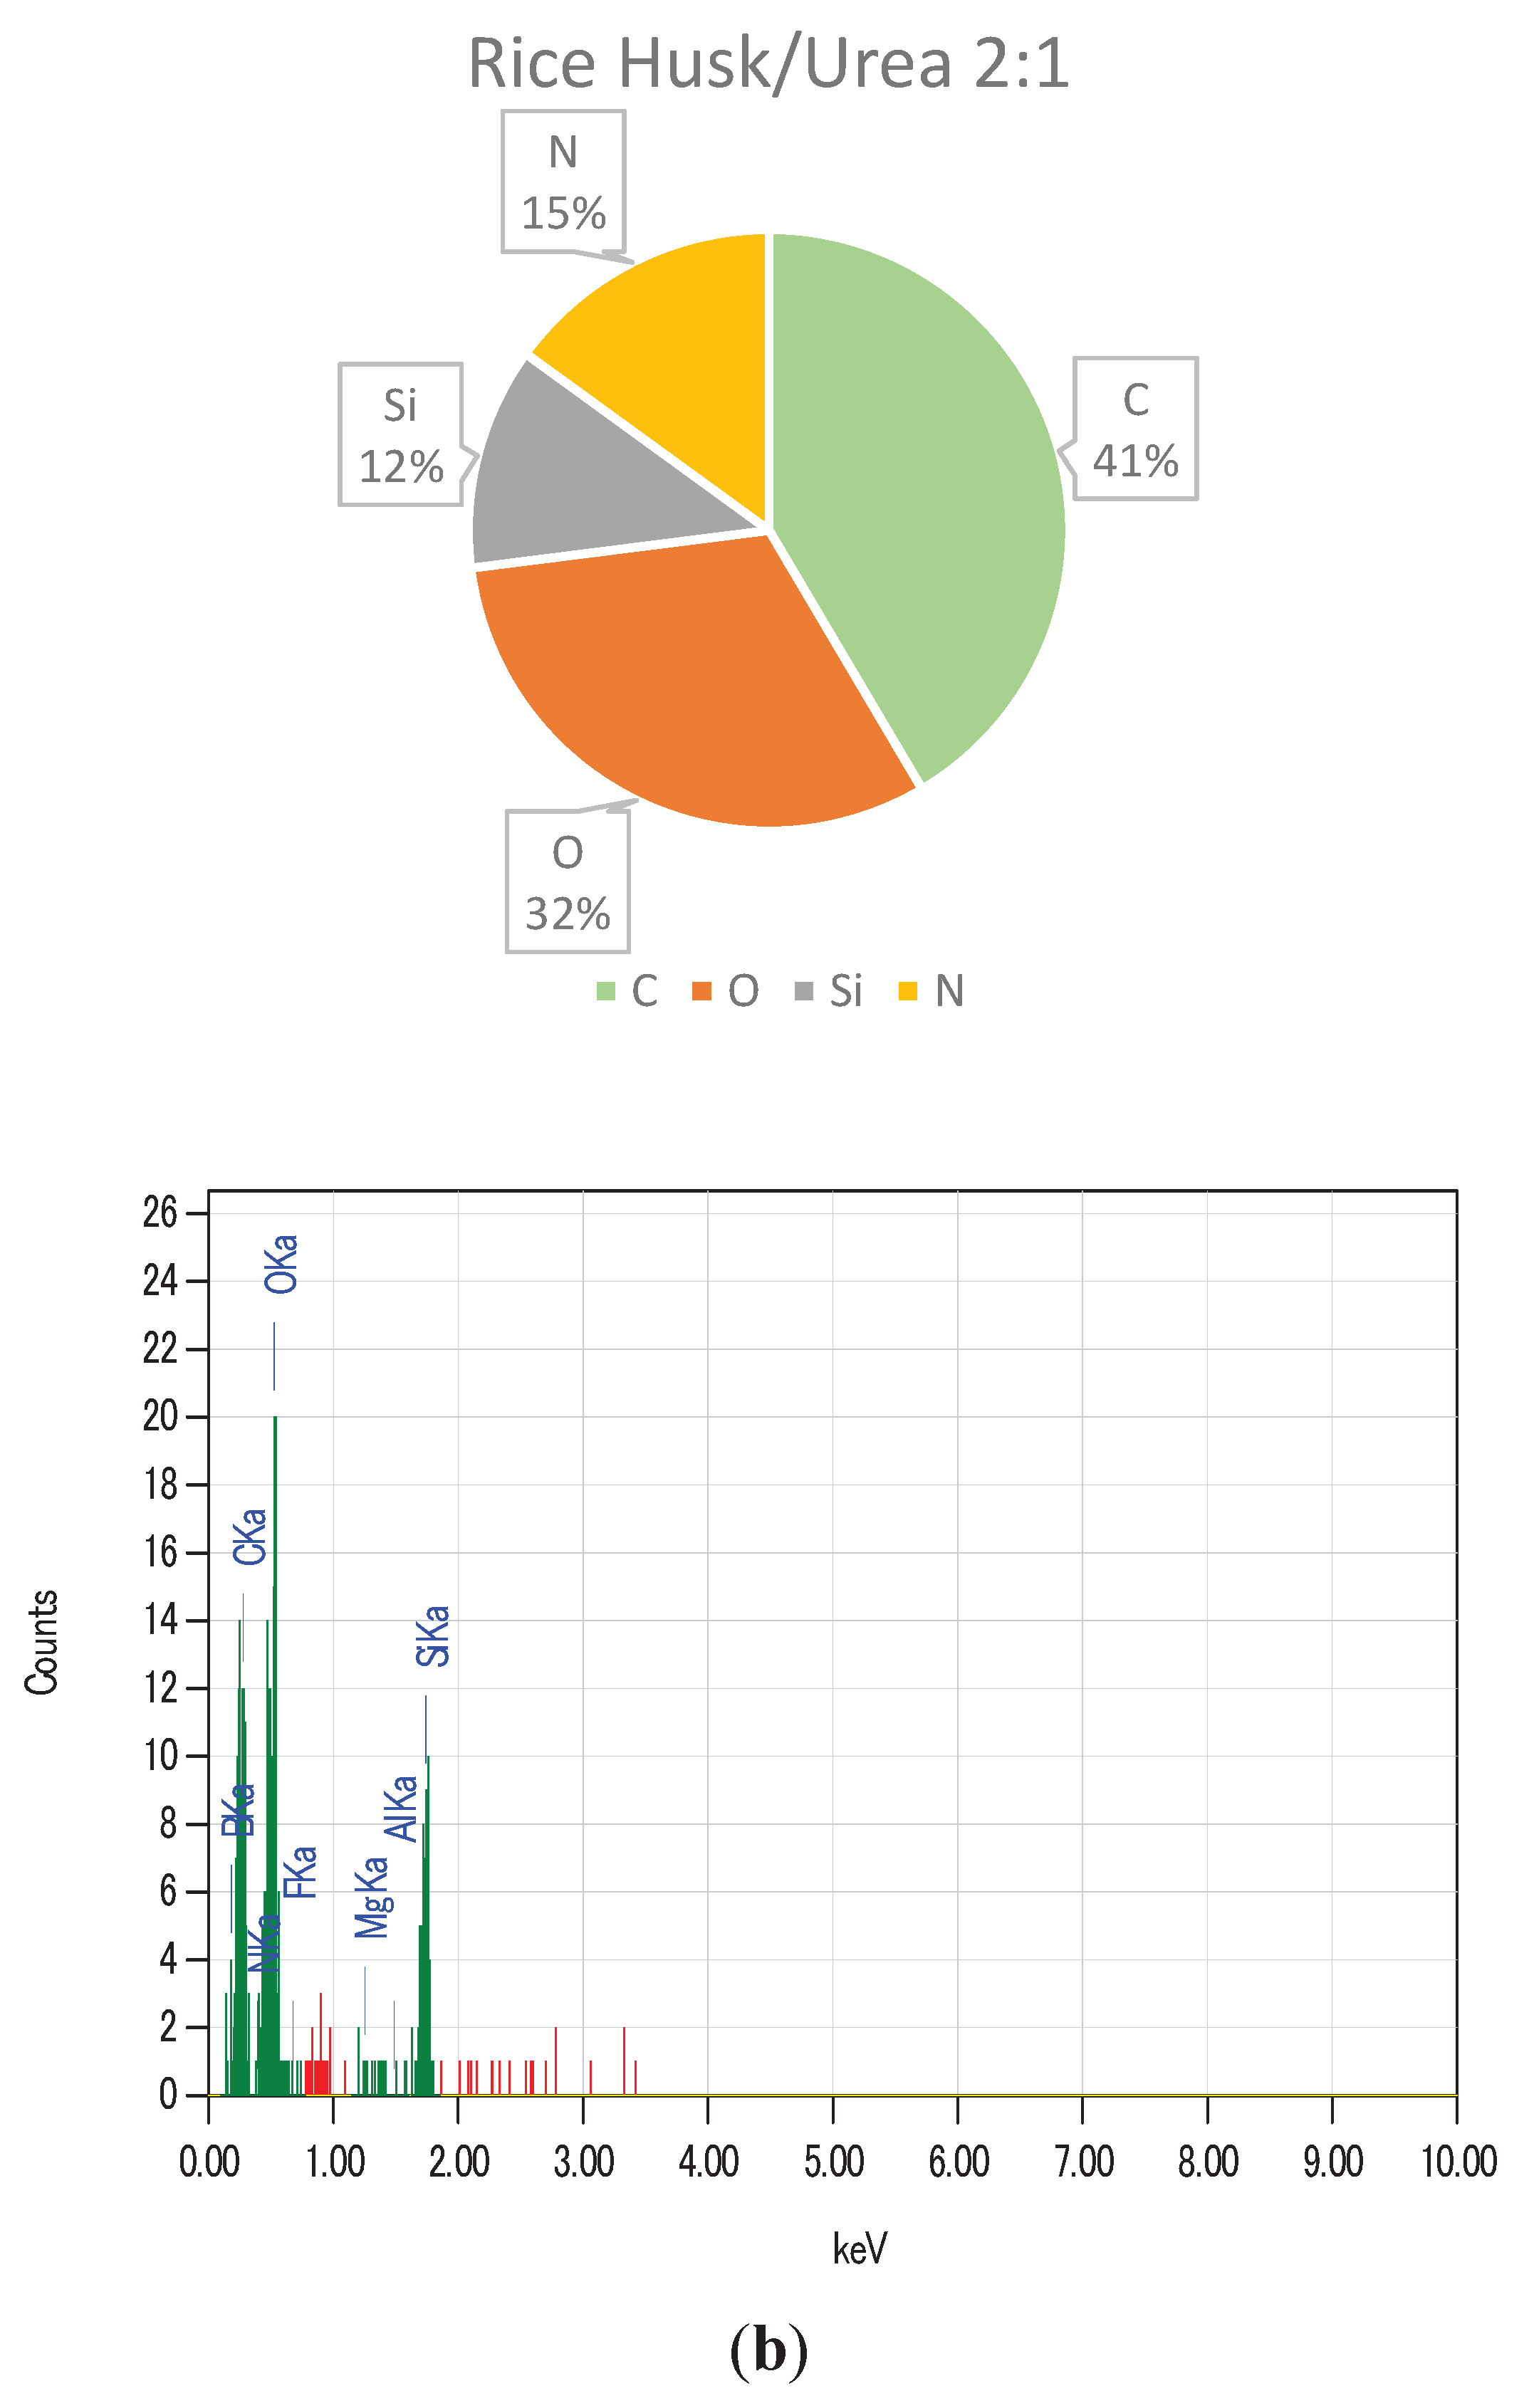
Figure 14.
SO₂ breakthrough time curves of urea-modified carbon samples.
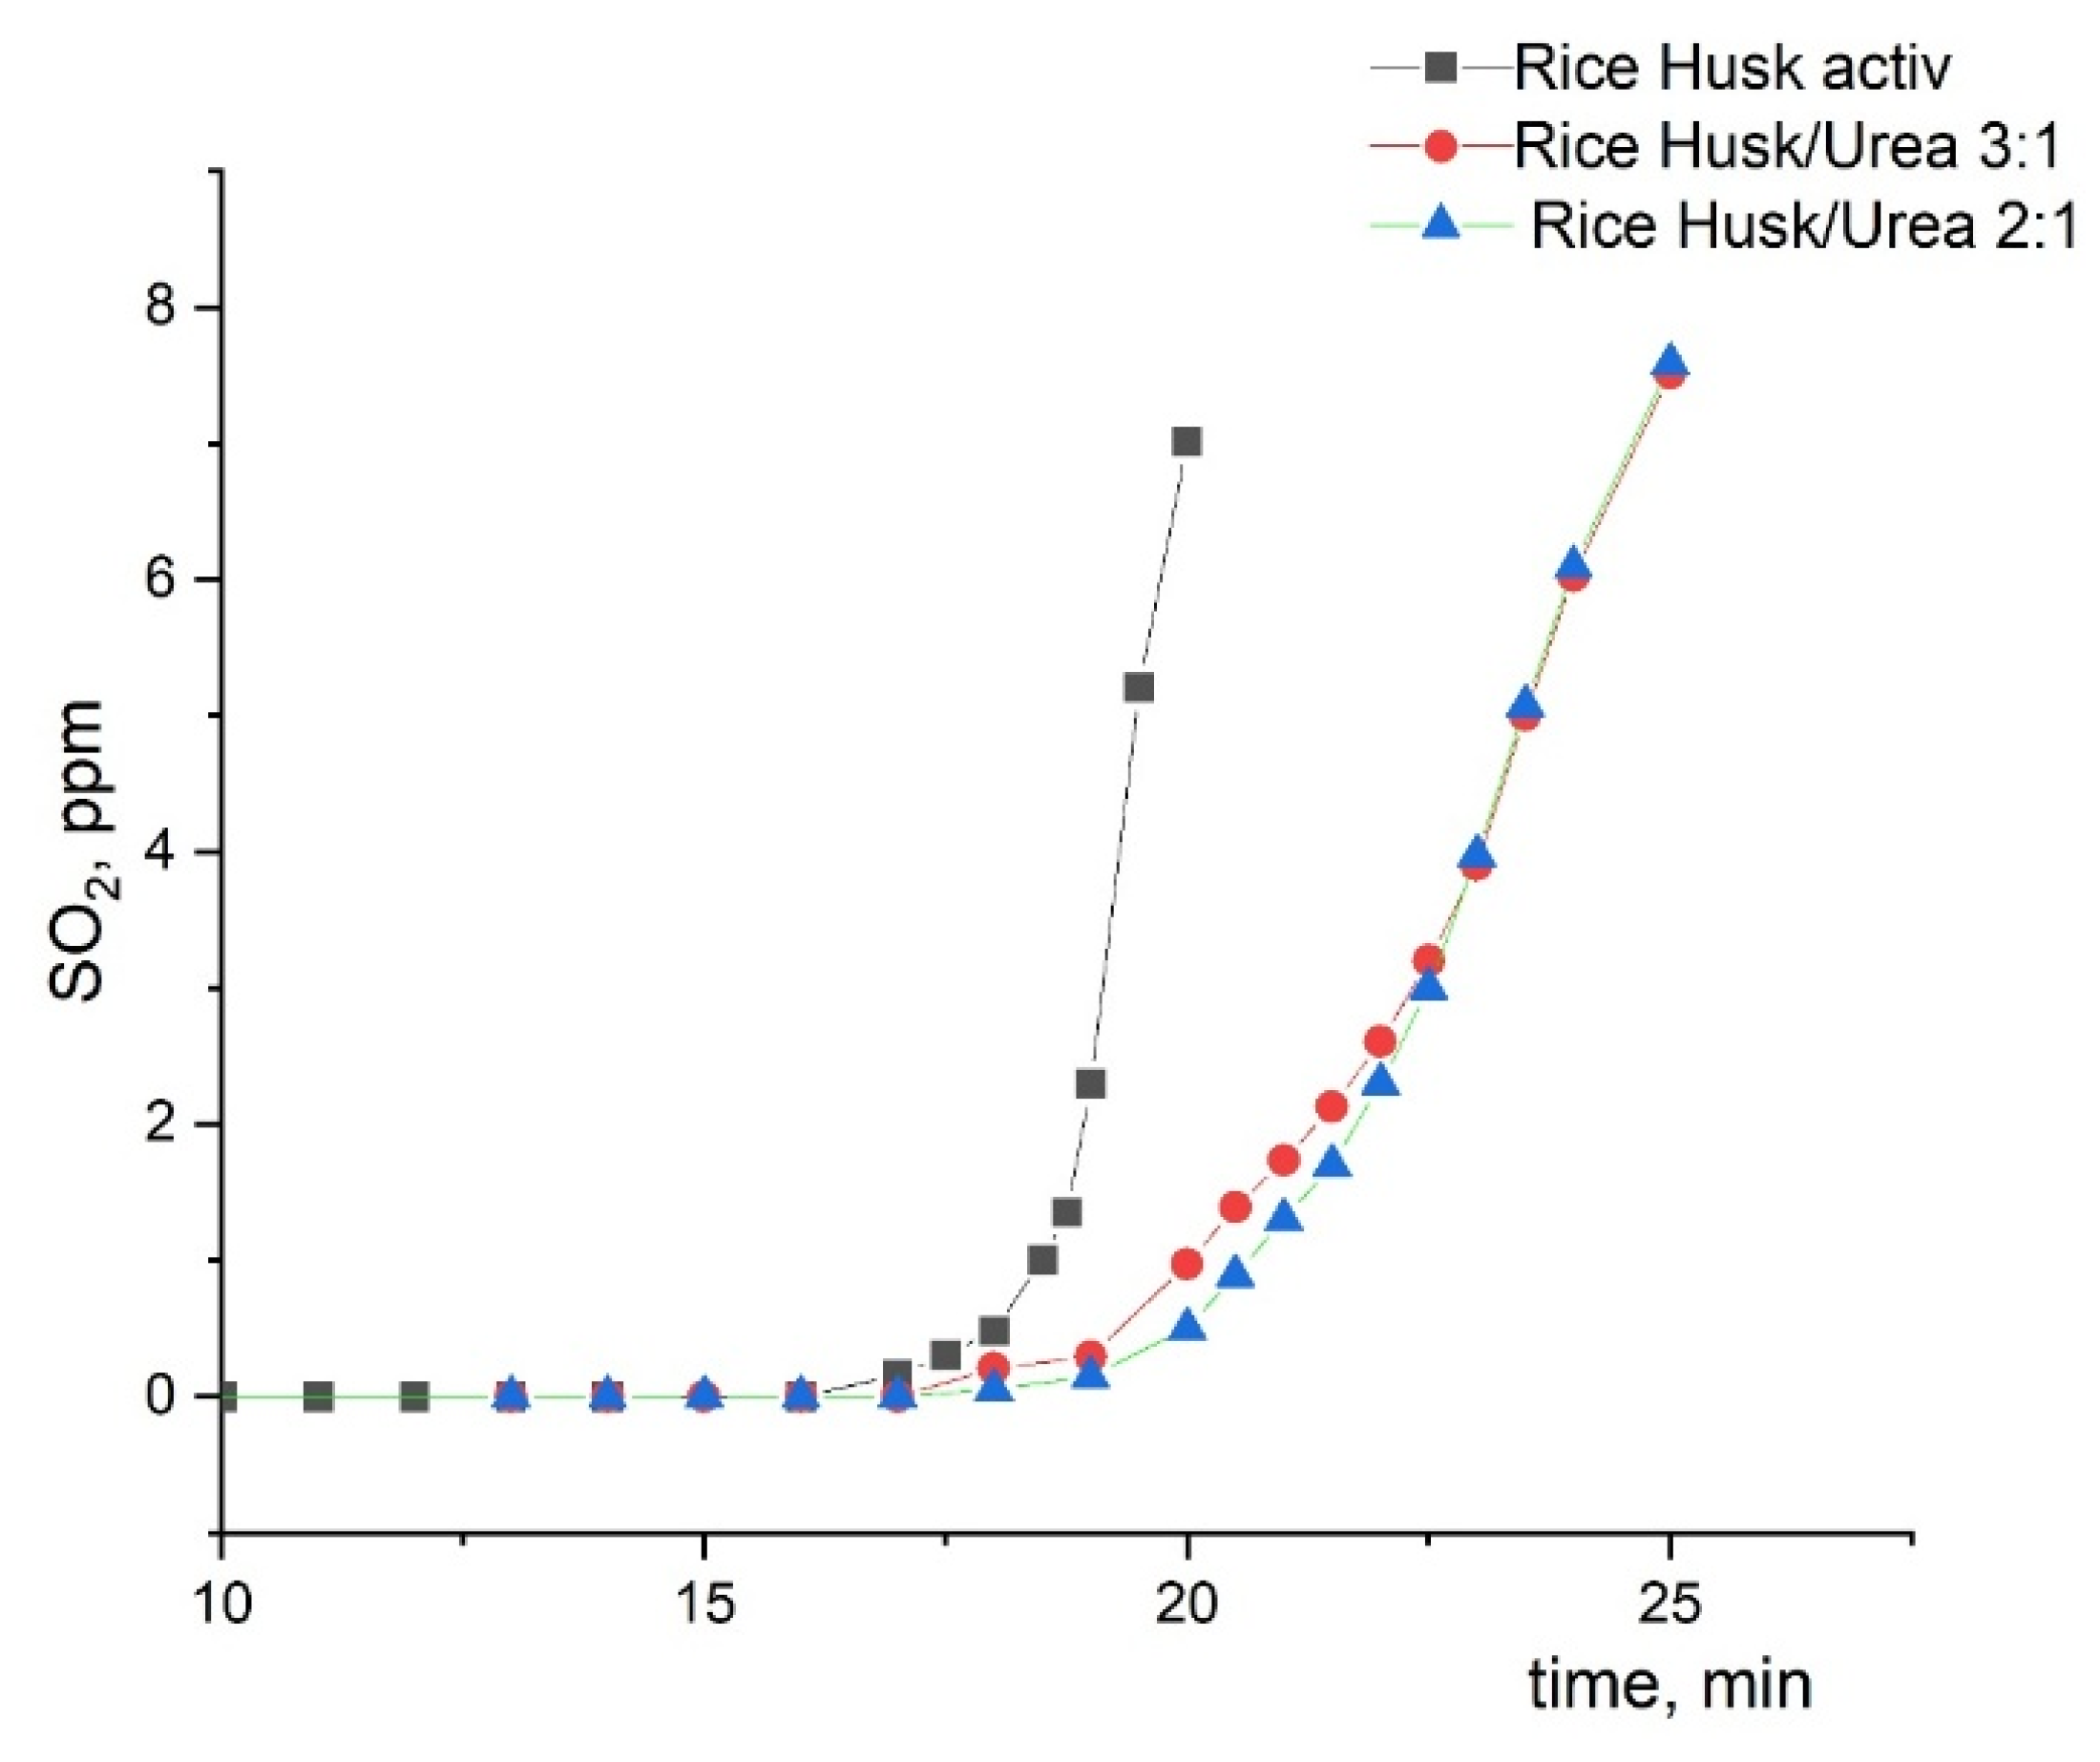

Table 1.
Textural parameters of the activated carbons calculated from the nitrogen isotherms.
| Sample |
SBET (m2/g) |
Total pore volume (cm3/g) | Micropore volume (cm3/g) | Mesopore volume (cm3/g) | QSDFT Slit | |
|
Vµmicro DFT, cm3/g |
Vmicro DFT, cm3/g |
|||||
| Wheat Straw Act | 859 | 0.394 | 0.317 | 0.077 | 0.220 | 0.325 |
| Sawdust Act | 711 | 0.328 | 0.266 | 0.062 | 0.193 | 0.270 |
| Rice Husk Act | 738 | 0.449 | 0.266 | 0.183 | 0.150 | 0.271 |
| Walnut Act | 597 | 0.260 | 0.234 | 0.026 | 0.116 | 0.226 |
Table 2.
Sorption capacities of the activated carbons towards cyclohexane.
| Sample | Capacity (mmol ciclohex/g carbon) |
| Wheat Straw Act | 1.829 |
| Sawdust Act | 1.381 |
| Rice Husk Act | 1.500 |
| Walnut Act | 0.727 |
Table 3.
NH₃ breakthrough times of activated carbon samples.
| Samples | Breakthrough time, min (NH3 -2 ppm) | Time (conc. NH3 - 25 ppm) |
| Walnut Shell act | 10 min 25 sec | 13 min 54 sec |
| Rice Husk act | 35 min 45 sec | 39 min 40 sec |
| Wheat Straw act | 17 min 12 sec | 20 min 9 sec |
| Sawdust act | 13 min 40 sec | 14 min 25 sec |
Table 4.
Textural parameters of urea-modified carbon samples calculated from the nitrogen isotherms.
Table 4.
Textural parameters of urea-modified carbon samples calculated from the nitrogen isotherms.
| Sample | SBET (m2/g) | Total pore volume (cm3/g) | Micropore volume (cm3/g) | Mesopore volume (cm3/g) |
| Rice Husk act | 738 | 0,449 | 0,266 | 0,183 |
| Rice Husk/urea 2:1 (33%) | 486 | 0,295 | 0,177 | 0,117 |
| Rice Husk/urea 3:1 (25%) |
622 | 0,354 | 0,228 | 0,125 |
Table 5.
SO₂ breakthrough times of activated carbon samples.
| Samples | Breakthrough time, min (SO₂ -2 ppm) | Time (conc. SO₂ - 6 ppm) |
| Rice Husk activ | 17 min 45 sec | 20 min 40 s |
| Rice Husk/urea 2:1 | 21 min 30 sec | 25 min 10 sec |
| Rice Husk/urea 3:1 | 22 min 32 sec | 25 min 14 sec |
Disclaimer/Publisher’s Note: The statements, opinions and data contained in all publications are solely those of the individual author(s) and contributor(s) and not of MDPI and/or the editor(s). MDPI and/or the editor(s) disclaim responsibility for any injury to people or property resulting from any ideas, methods, instructions or products referred to in the content. |
© 2026 by the authors. Licensee MDPI, Basel, Switzerland. This article is an open access article distributed under the terms and conditions of the Creative Commons Attribution (CC BY) license (http://creativecommons.org/licenses/by/4.0/).
Copyright: This open access article is published under a Creative Commons CC BY 4.0 license, which permit the free download, distribution, and reuse, provided that the author and preprint are cited in any reuse.