

Submitted:
24 May 2026
Posted:
25 May 2026
You are already at the latest version
Abstract
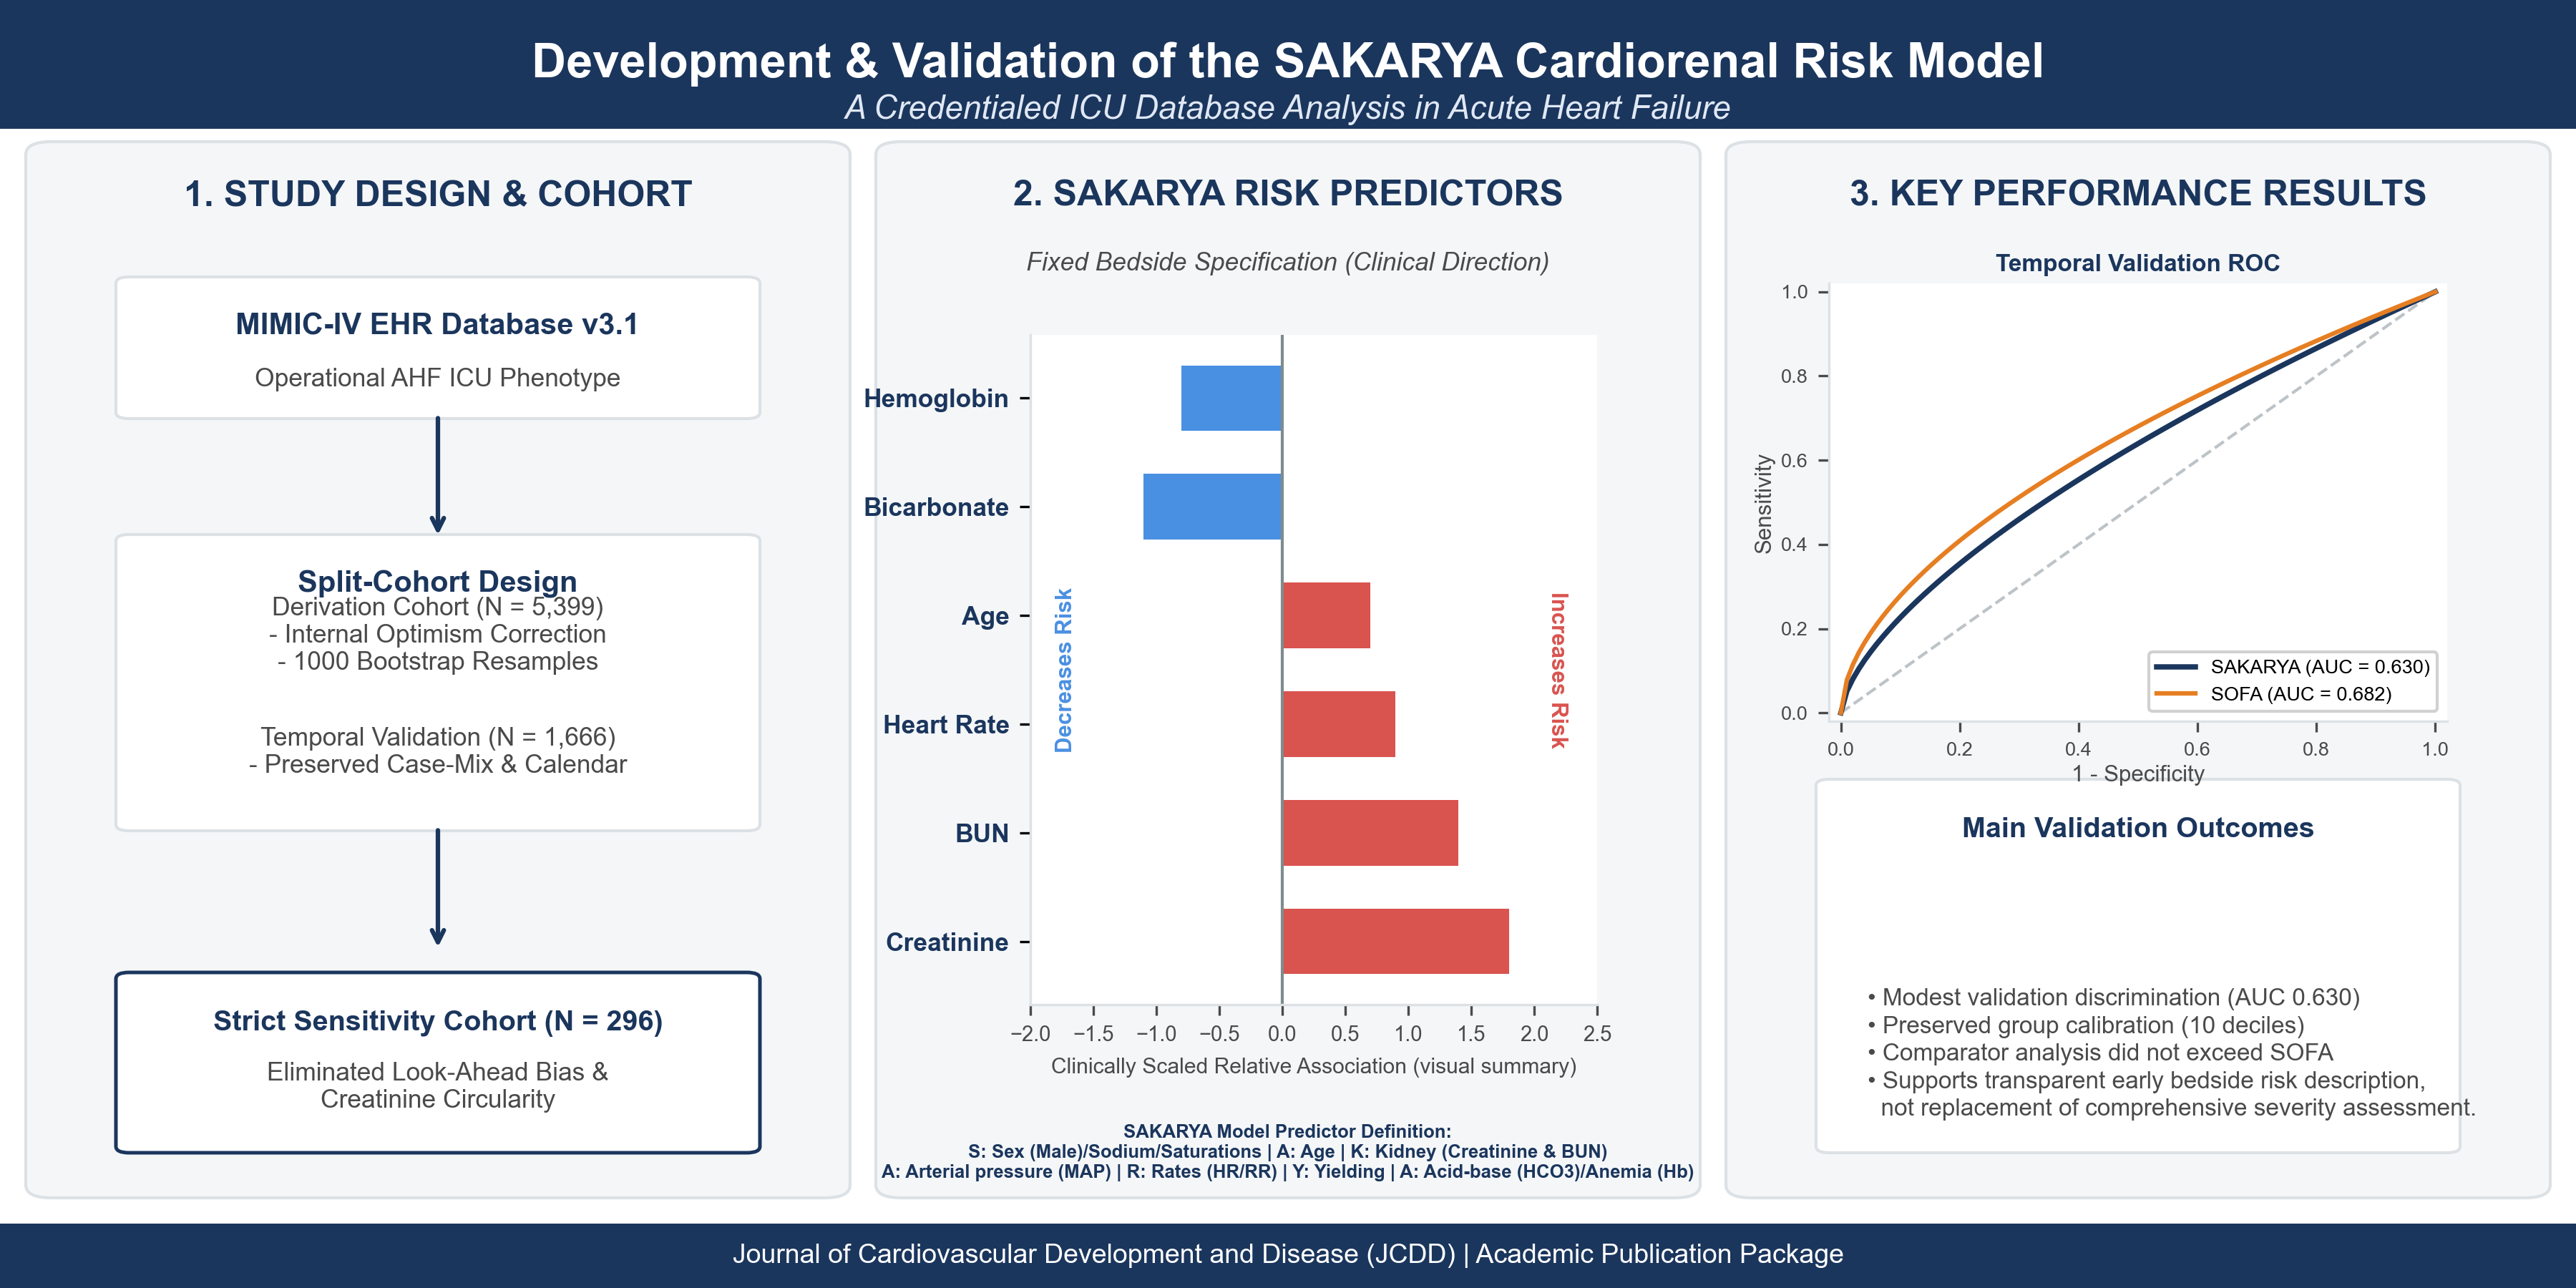
Acute heart failure in the intensive care unit has a high early cardiorenal burden, whereas most existing risk tools were derived outside critical care. This retrospective cohort study used MIMIC-IV version 3.1. Adults with a first intensive care unit admission, a heart failure diagnosis, and enrichment by early intravenous loop diuretic treatment or BNP/NT-proBNP testing were included. Core predictors were measured within 6 hours of admission. The primary outcome was 28-day death or incident creatinine-defined acute kidney injury. Derivation used admissions from 2009-2018 and temporal validation used admissions from 2019-2023. Bootstrap internal validation, spline screening, strict sensitivity analyses, and strict comparator analyses against SOFA and BUN+SBP were performed. The broad clean core cohort included 7065 patients, with 5399 in derivation and 1666 in temporal validation. The primary outcome occurred in 2289 derivation patients and 810 validation patients. The 11-variable SAKARYA model included age, sex, heart rate, mean arterial pressure, respiratory rate, oxygen saturation, creatinine, blood urea nitrogen, sodium, bicarbonate, and hemoglobin. Area under the receiver operating characteristic curve for the primary outcome was 0.636 in derivation and 0.648 in temporal validation; Brier scores were 0.231 and 0.238. Validation calibration intercept and slope were 0.26 and 0.99. Bootstrap optimism-corrected area under the curve was 0.631. A strict sensitivity cohort included 737 derivation and 296 validation patients. In strict temporal validation, area under the curve was 0.630 for SAKARYA, 0.682 for SOFA, and 0.607 for BUN+SBP. The broad primary model showed modest discrimination with preserved temporal calibration. After tightening phenotype timing and separating creatinine windows, performance remained modest and did not exceed SOFA. External multicenter validation and phenotype refinement are needed before clinical use.
Keywords:
acute heart failure
; critical care
; acute kidney injury
; risk stratification
; MIMIC-IV
1. Introduction
Acute heart failure remains a frequent cause of urgent hospitalization, short-term deterioration, and early death across cardiovascular care settings [1,2]. Contemporary European and North American guidance emphasizes rapid syndrome recognition, natriuretic peptide testing, congestion-directed treatment, and early identification of organ dysfunction during the first treatment hours [3,4]. Risk estimation during that interval remains uneven after intensive care unit triage.
Available acute heart failure risk tools were largely derived in emergency department or hospital-wide cohorts, and their outcome definitions, predictor windows, and intended use differ substantially [5,6]. Prospective validation has improved confidence in some models, including EHMRG, but those instruments were not built in critically ill populations and do not directly address early cardiorenal deterioration after intensive care unit admission [7,8].
Cardiorenal interaction is central to acute heart failure. Acute kidney injury is common, worsens short-term prognosis, and reflects the combined effects of venous congestion, impaired perfusion, neurohormonal activation, and treatment intensity [9,10]. An early model that integrates mortality and kidney injury may therefore be more informative than a mortality-only model in the intensive care environment.
Large deidentified electronic health record resources now allow transparent model development in critical care cohorts. The broader PhysioNet framework supports reproducible secondary analyses of physiologic and electronic health record data. The present study developed and temporally validated a parsimonious early model for critically ill adults with an operational acute heart failure phenotype. The objective was to derive the SAKARYA model (representing Sex/Sodium/Saturations, Age, Kidney markers [Creatinine/BUN], Arterial pressure [MAP], Rates [Heart/Respiratory], Yielding early Acid-base/Anemia markers) from variables available within the first 6 hours of intensive care unit admission and to evaluate discrimination, calibration, robustness, and strict comparator performance.
2. Materials and Methods
2.1. Study Design and Data Source
This retrospective cohort study used MIMIC-IV version 3.1, a deidentified critical care database derived from Beth Israel Deaconess Medical Center [11,12]. The source platform is maintained through PhysioNet [13]. Adults were eligible if they were 18 years of age or older, had a first intensive care unit admission, and had a hospital diagnosis code consistent with heart failure. Heart failure coding included ICD-9 code 428* and ICD-10 codes I50*, I110, I130, and I132. Data extraction and cohort assembly were performed programmatically using Structured Query Language (SQL) by a credentialed investigator (H.B.I.) who has completed the required training in human subjects research on the Collaborative Institutional Training Initiative (CITI) platform.
2.2. Cohort Definition
The broad primary cohort required at least one early acute heart failure enrichment feature in addition to heart failure coding. Enrichment was defined by intravenous loop diuretic treatment or BNP/NT-proBNP testing from 6 hours before to 24 hours after intensive care unit admission. This prespecified broad phenotype yielded 8477 patients. After application of the clean core complete-case rules for the 11-variable primary model, 7065 patients remained for modeling, including 5399 in derivation and 1666 in temporal validation. The temporal split used approximate actual year, with 2009-2018 assigned to derivation and 2019-2023 assigned to temporal validation. Figure 1 shows cohort assembly.
A strict sensitivity cohort was defined to address major design concerns. This cohort narrowed phenotype enrichment to the interval from 6 hours before to 6 hours after intensive care unit admission, restricted baseline creatinine to the interval from 24 hours before to 6 hours before intensive care unit admission, and restricted predictor creatinine to the interval from admission to 6 hours after admission. The strict clean core complete-case cohort included 737 derivation patients and 296 temporal validation patients.
2.3. Predictor Definition
Baseline predictors were defined from the window extending from 6 hours before to 6 hours after intensive care unit admission. Candidate variables were selected before model fitting on the basis of clinical availability, physiologic interpretability, and bedside transportability. The final core model included age, sex, heart rate, mean arterial pressure, respiratory rate, oxygen saturation, creatinine, blood urea nitrogen, sodium, bicarbonate, and hemoglobin. Physiologically implausible values were excluded with prespecified cleaning ranges: heart rate 20-250 beats/min, mean arterial pressure 20-200 mmHg, respiratory rate 4-80 breaths/min, oxygen saturation 50-100%, creatinine 0.1-25 mg/dL, blood urea nitrogen 1-250 mg/dL, sodium 95-180 mmol/L, bicarbonate 3-60 mmol/L, and hemoglobin 2-25 g/dL.
Comparator analyses in the strict sensitivity cohort used the same 11 SAKARYA predictors, the first-day SOFA score, and a simple renal-hemodynamic comparator that included blood urea nitrogen and systolic blood pressure.
2.4. Outcome Definition
The primary outcome was a composite cardiorenal endpoint defined as 28-day death or incident creatinine-based acute kidney injury. Acute kidney injury was defined with KDIGO serum creatinine criteria, using a baseline creatinine obtained from 24 hours before to 6 hours after intensive care unit admission and follow-up creatinine values through day 7 [14]. Urine output was not incorporated into the primary endpoint. Secondary outcomes were 28-day death and incident creatinine-based acute kidney injury. In the strict sensitivity cohort, baseline and predictor creatinine windows were separated as described above to reduce circularity.
2.5. Reporting Framework
2.6. Statistical Analysis
Continuous variables are reported as median [interquartile range] and categorical variables as number (percentage). Between-group comparisons used the Mann-Whitney U test or the chi-square test, as appropriate. Logistic regression was used for the primary model and for secondary outcome models. Discrimination was summarized with the area under the receiver operating characteristic curve, calibration with calibration intercept and slope, and global prediction accuracy with the Brier score.
Collinearity was assessed with variance inflation factors, with prespecified concern at values of 3.0 or higher. Restricted cubic spline screening with 4 degrees of freedom was used to test each continuous predictor for nonlinearity in the derivation cohort. The primary specification retained prespecified linear terms because the intended model was an interpretable early bedside model. Internal optimism was evaluated with 1000 bootstrap resamples. Additional sensitivity analyses included an extended complete-case model, multiple imputation by chained equations with five imputations, and prespecified subgroup interaction analyses.
Comparator analyses were performed only in the strict sensitivity cohort with complete availability of SAKARYA, SOFA, and BUN+SBP variables. SAKARYA, SOFA, and BUN+SBP models were refit in strict derivation and tested in strict temporal validation. Comparator performance included area under the receiver operating characteristic curve, Brier score, Brier skill score, calibration intercept, and calibration slope. Validation risk quartiles were created from the strict temporal SAKARYA predictions. Decision curve analysis was examined across threshold probabilities from 0.05 to 0.50. Bootstrap differences in validation area under the curve between SAKARYA and each comparator were estimated with 2000 resamples. All statistical analyses were performed using SPSS version 26.0 (IBM Corp., Armonk, NY, USA) and R software version 4.3.1 (R Foundation for Statistical Computing, Vienna, Austria). Specifically, decision curve analysis and bootstrap validation procedures were implemented using the ‘dca’ and ‘rms’ packages in R.
3. Results
Figure 1 summarizes cohort assembly. Among 94,458 adult intensive care unit stays, 16,641 first admissions carried a heart failure diagnosis. The broad acute heart failure enrichment strategy yielded 8477 patients, and the final clean core complete-case modeling cohort included 7065 patients. The derivation cohort comprised 5399 patients and the temporal validation cohort 1666 patients. The primary composite endpoint occurred in 2289 derivation patients and 810 temporal validation patients. A narrow phenotype cohort included 5618 patients, and the downstream strict sensitivity cohort with narrowed phenotype timing and separated creatinine windows included 737 derivation patients and 296 temporal validation patients.
Baseline characteristics of the broad clean core cohort are shown in Table 1. The temporal validation cohort was younger than the derivation cohort and had higher mean arterial pressure, higher respiratory rate, lower bicarbonate, more frequent early BNP/NT-proBNP testing, and less frequent early intravenous loop diuretic treatment. Sex distribution, heart rate, blood urea nitrogen, and hemoglobin were similar across the two time periods.
Primary model performance is shown in Table 2, with receiver operating characteristic curves in Figure 2 and calibration plots in Figure 3. For the primary composite outcome, the area under the receiver operating characteristic curve was 0.636 in derivation and 0.648 in temporal validation. The corresponding Brier scores were 0.231 and 0.238. Temporal validation calibration intercept and slope were 0.26 and 0.99. Bootstrap internal validation with 1000 resamples yielded an optimism-corrected area under the curve of 0.631 and an optimism-corrected calibration slope of 0.96. Secondary outcome performance is summarized in Table 2 and detailed in Supplementary Tables S6A and S6B.
Primary model coefficients rescaled to clinically interpretable units are shown in Table 3. Older age, higher heart rate, higher respiratory rate, higher creatinine, higher blood urea nitrogen, and higher sodium were associated with higher odds of the composite outcome, whereas higher mean arterial pressure, higher bicarbonate, and higher hemoglobin were associated with lower odds. The full one-unit model specification for direct probability calculation is provided in Supplementary Table S6C.
Outcome-stratified baseline characteristics are summarized in Supplementary Table S1. Collinearity was limited, with all variance inflation factors below 2.0 (Supplementary Table S2A). Restricted cubic spline screening showed departures from linearity in seven of ten continuous predictors, with the strongest evidence for creatinine and bicarbonate (Supplementary Table S2B). An RCS-augmented sensitivity model that applied spline terms to creatinine and bicarbonate produced only a small change in validation performance, with area under the curve rising from 0.648 to 0.653 and validation Brier score changing from 0.238 to 0.236 (Supplementary Table S2C).
Extended complete-case sensitivity results are shown in Supplementary Tables S3A and S3B. Compared with the core model, the extended model changed validation discrimination only slightly. Multiple-imputation sensitivity results are provided in Supplementary Tables S4A and S4B. Prespecified subgroup interaction analyses are shown in Supplementary Table S5 and indicated a lower creatinine-associated odds gradient in patients with higher baseline creatinine, whereas other interactions were small.
In the strict sensitivity cohort, derivation discrimination was 0.653 for SAKARYA, 0.690 for SOFA, and 0.616 for BUN+SBP. In strict temporal validation, SAKARYA achieved an area under the curve of 0.630, compared with 0.682 for SOFA and 0.607 for BUN+SBP (Table 4; Supplementary Table S7A). Validation Brier skill score was 0.006 for SAKARYA, 0.073 for SOFA, and -0.018 for BUN+SBP. Bootstrap differences in validation area under the curve were -0.052 (95% CI -0.129 to 0.023) for SAKARYA minus SOFA and 0.024 (95% CI -0.030 to 0.075) for SAKARYA minus BUN+SBP (Supplementary Table S7B). Supplementary Figure S1 shows the strict-cohort validation receiver operating characteristic curves.
In strict temporal validation, SAKARYA quartile event rates were 36.5% in Q1, 66.2% in Q2, 60.8% in Q3, and 71.6% in Q4 (Supplementary Table S7C). The Q2 and Q3 confidence intervals overlapped substantially, at 54.9-76.0% and 49.4-71.1%, respectively. Supplementary Figure S2 shows decision curve analysis. Net benefit curves overlapped at low thresholds, SOFA was numerically higher between thresholds of 0.20 and 0.30, and SAKARYA was numerically higher between thresholds of 0.35 and 0.40 without consistent dominance across the full threshold range. This minor non-monotonicity reflects the restricted sample size of the strict sensitivity validation subset (n=74 per quartile), with overlapping 95% confidence intervals demonstrating statistical equivalence in the intermediate risk range.
The primary composite outcome was 28-day death or incident creatinine-based acute kidney injury. Bootstrap optimism-corrected AUC for the primary model was 0.631 based on 1000 resamples, and the optimism-corrected calibration slope was 0.96.
Odds ratios are scaled for clinical interpretability. The full one-unit regression specification is provided in Supplementary Table S6C.
The strict comparator cohort included 296 temporal validation patients with 174 composite cardiorenal events. Full derivation and validation results are shown in Supplementary Table S7A.
4. Discussion
The present study developed and temporally validated an early cardiorenal risk model for critically ill adults with an operational acute heart failure phenotype. The broad primary model showed modest discrimination and preserved temporal calibration. The strict sensitivity analyses addressed the main design concerns, but performance remained modest and did not exceed SOFA. The data therefore support a transparent bedside description of early risk rather than a stand-alone replacement for established severity assessment.
Most established acute heart failure risk tools were not built in intensive care populations and were generally designed for short-term mortality rather than combined cardiorenal deterioration. External prospective work on EHMRG improved confidence in emergency-department risk estimation, but its transportability to an intensive care unit phenotype remains limited. The present results fit that gap. The model was derived in a cohort with higher physiologic severity, broader organ dysfunction, and a more heterogeneous clinical trajectory than the populations used for conventional acute heart failure scores.
Recent electronic health record and machine-learning studies in critically ill heart failure cohorts reported higher discrimination for mortality prediction than the composite performance observed here [18,19]. Another intensive care unit heart failure model also reported stronger mortality discrimination than the present composite endpoint [20]. Several differences likely explain this contrast. The present target was a mixed cardiorenal endpoint rather than mortality alone, the phenotype was operational rather than adjudicated, and the derivation strategy favored a fixed bedside variable set and transportable linear specification over algorithmic complexity.
The biological direction of the retained predictors was coherent. Older age, higher heart rate, higher blood urea nitrogen, and higher creatinine marked higher risk, whereas higher bicarbonate and hemoglobin marked lower risk. Those patterns agree with prior work linking renal dysfunction, metabolic derangement, and systemic illness severity to adverse acute heart failure outcomes [21,22]. The coefficients were therefore clinically plausible even though discriminative performance remained limited.
Two revision targets were especially informative. First, the strict cohort narrowed the phenotype window and separated baseline from predictor creatinine. That analysis reduced the main look-ahead and circularity concerns, but it also reduced sample size and left wide uncertainty around comparator differences. Second, restricted cubic spline screening confirmed nonlinearity in multiple predictors, especially creatinine and bicarbonate. An RCS-augmented sensitivity model produced only a small gain in validation discrimination and a small change in Brier score, so the linear model was retained for bedside interpretability. This tradeoff differs from work that pursued more flexible algorithms or artificial-intelligence-based prediction strategies for heart failure outcomes [23,24].
The comparator analyses clarified the clinical position of the model. In the strict cohort, SOFA showed higher validation discrimination and better Brier skill than SAKARYA, while BUN+SBP performed slightly worse. Decision curves showed threshold-dependent overlap rather than consistent superiority by any model. The risk quartiles also reflected limited separation in the middle range, because Q2 and Q3 had overlapping confidence intervals and reversed observed event order. These findings are consistent with broader reviews showing that many heart failure prognostic models lose separation when case mix, endpoint definition, and care setting change [25,26]. Importantly, the higher discrimination achieved by the SOFA score (AUC 0.682) must be interpreted in light of its temporal definition. SOFA represents a cumulative 24-hour assessment of multi-organ failure, incorporating parameters such as the Glasgow Coma Scale, platelet counts, and bilirubin levels, which are frequently unavailable or delayed during the initial hours of critical care. In contrast, the SAKARYA model operates entirely on a 6-hour horizon using readily transportable bedside parameters, offering an early triage window that SOFA cannot address. Furthermore, the overlapping event rates between intermediate risk quartiles in the strict temporal validation cohort highlight the model’s limitations in distinguishing mid-range risk within small sample sizes, pointing to the necessity of larger validation registries to verify calibration across all deciles.
The study has limitations. Acute heart failure status was operationalized rather than clinically adjudicated because structured bedside adjudication is not available in MIMIC-IV. The broad primary phenotype still used a 24-hour enrichment window, so the strict cohort is essential for interpretation rather than optional. The strict comparator analysis was small, with only 296 validation patients and 74 patients per quartile. SOFA was derived from first-day data rather than the same 6-hour horizon, which may have favored SOFA in head-to-head comparison. The database came from a single center, and temporal validation remained internal to that center. The strengths were prespecified variable selection, transparent coefficient reporting, temporal validation, explicit sensitivity analyses for look-ahead bias and creatinine circularity, bootstrap correction, and direct comparison with clinically familiar benchmarks. The next step is external multicenter validation in cohorts that define the phenotype at admission and preserve complete separation between baseline renal function and predictor creatinine.
5. Conclusions
The SAKARYA model was derived and temporally validated as a parsimonious bedside tool for early cardiorenal risk stratification in critically ill adults with an acute heart failure phenotype. The model demonstrated modest discrimination with preserved temporal calibration across both broad and strict validation cohorts. In head-to-head validation, its performance was comparable to established clinical benchmarks but did not exceed the cumulative 24-hour SOFA score. The findings suggest that early cardiorenal risk can be estimated using readily transportable clinical variables from the first 6 hours of ICU admission, providing a useful bedside description of early risk rather than a replacement for comprehensive organ failure assessments. Future external multicenter validation and clinical phenotype refinement are necessary to confirm these results and optimize risk stratification before clinical implementation.
Supplementary Materials
The following supporting information can be downloaded at: Preprints.org.
Author Contributions
Conceptualization, H.B.I.; methodology, H.B.I. and S.B.; formal analysis, H.B.I.; data curation, H.B.I.; investigation, E.D.; resources, E.D.; writing—original draft preparation, H.B.I.; writing—review and editing, H.B.I., S.B., S.T.Y., and E.D. All authors have read and agreed to the published version of the manuscript.
Funding
This research received no external funding.
Institutional Review Board Statement
The study was conducted in accordance with the Declaration of Helsinki, and approved by the Institutional Review Board of Bezmialem Vakif University (protocol code Meeting 5, Decision 1 on 31 March 2026).
Informed Consent Statement
Patient consent was waived because all protected health information had been removed from the de-identified MIMIC-IV database.
Data Availability Statement
The de-identified raw clinical data analyzed during the current study were obtained from the Medical Information Mart for Intensive Care IV (MIMIC-IV, version 3.1) database, available through PhysioNet (https://doi.org/10.13026/kpb9-mt58) to credentialed users. Data extraction and cohort selection were performed by a credentialed author (H.B.I.) using Structured Query Language (SQL). The complete replication dataset (including ROC coordinates, calibration deciles, and decision curve net benefits) along with the reproduction code has been archived on Zenodo (https://doi.org/10.5281/zenodo.20357925) and is publicly accessible via GitHub (https://github.com/drman44/sakarya-model-reproduction).
Acknowledgments
The authors acknowledge the contributors to MIMIC-IV and PhysioNet for maintaining the source database.
Conflicts of Interest
The authors declare no conflict of interest.
Clinical Trial
Not Applicable.
Abbreviations
AHF: acute heart failure
AUC: area under the receiver operating characteristic curve
BNP: B-type natriuretic peptide
BUN: blood urea nitrogen
ICU: intensive care unit
KDIGO: Kidney Disease: Improving Global Outcomes
MICE: multiple imputation by chained equations
MIMIC-IV: Medical Information Mart for Intensive Care IV
RCS: restricted cubic spline
RECORD: REporting of studies Conducted using Observational Routinely-collected health Data
SOFA: Sequential Organ Failure Assessment
STROBE: Strengthening the Reporting of Observational Studies in Epidemiology
TRIPOD: Transparent Reporting of a multivariable prediction model for Individual Prognosis Or Diagnosis
VIF: variance inflation factor
References
- Arrigo, M.; Jessup, M.; Mullens, W.; Reza, N.; Shah, A.M.; Sliwa, K.; Mebazaa, A. Acute heart failure. Nat. Rev. Dis. Prim. 2020, 6, 16. [Google Scholar] [CrossRef]
- McDonagh, T.A.; Metra, M.; Adamo, M.; Gardner, R.S.; Baumbach, A.; Böhm, M.; Burri, H.; Butler, J.; Čelutkienė, J.; Chioncel, O.; et al. 2021 ESC Guidelines for the diagnosis and treatment of acute and chronic heart failure. Eur. Heart J. 2021, 42, 3599–3726. [Google Scholar] [CrossRef]
- McDonagh, T.A.; Metra, M.; Adamo, M.; Gardner, R.S.; Baumbach, A.; Böhm, M.; Burri, H.; Butler, J.; Čelutkienė, J.; Chioncel, O.; et al. 2023 Focused update of the 2021 ESC Guidelines for the diagnosis and treatment of acute and chronic heart failure. Eur. Heart J. 2023, 44, 3627–3639. [Google Scholar] [CrossRef]
- Heidenreich, P.A.; Bozkurt, B.; Aguilar, D.; Allen, L.A.; Byun, J.J.; Colvin, M.M.; Deswal, A.; Drazner, M.H.; Dunlay, S.M.; Evers, L.R.; et al. 2022 AHA/ACC/HFSA guideline for the management of heart failure. Circulation 2022, 145, e895–e1032. [Google Scholar]
- Miró, Ö.; Rossello, X.; Platz, E.; Masip, J.; Gualandro, D.M.; Peacock, W.F.; Price, S.; Cullen, L.; DiSomma, S.; Tavares de Oliveira, M., Jr.; et al. Risk stratification scores for patients with acute heart failure in the emergency department: a systematic review. Eur. Heart J. Acute Cardiovasc. Care 2020, 9, 375–398. [Google Scholar] [CrossRef] [PubMed]
- Garcia-Gutierrez, S.; Quintana, J.M.; Antón-Ladislao, A.; Gallardo, M.S.; Pulido, E.; Rilo, I.; Zubillaga, E.; Morillas, M.; Onaindia, J.J.; Murga, N.; et al. Creation and validation of the acute heart failure risk score: AHFRS. Intern. Emerg. Med. 2017, 12, 1197–1206. [Google Scholar] [CrossRef] [PubMed]
- Lee, D.S.; Lee, J.S.; Schull, M.J.; Borgundvaag, B.; Edmonds, M.L.; Ivankovic, M.; McLeod, S.L.; Dreyer, J.F.; Sabbah, S.; Levy, P.D.; et al. Prospective validation of the Emergency Heart Failure Mortality Risk Grade for acute heart failure. Circulation 2019, 139, 1146–1156. [Google Scholar] [CrossRef]
- Zhao, H.L.; Gao, X.L.; Liu, Y.H.; Zhang, X.X.; Li, Z.Q.; Wang, Y.L.; Chen, J.; Zhou, Y.Q. Validation and derivation of short-term prognostic risk score in acute decompensated heart failure in China. BMC Cardiovasc. Disord. 2022, 22, 307. [Google Scholar] [CrossRef]
- Mitsas, A.C.; Elzawawi, M.; Mavrogeni, S.; Boekels, M.; Khan, A.; Eldawy, M.; Stamatakis, I.; Kouris, D.; Daboul, B.; Noutsias, M. Heart failure and cardiorenal syndrome: a narrative review on pathophysiology, diagnostic and therapeutic regimens from a cardiologist’s view. J. Clin. Med. 2022, 11, 7041. [Google Scholar] [CrossRef] [PubMed]
- Ru, S.C.; Lv, S.B.; Li, Z.J. Incidence, mortality, and predictors of acute kidney injury in patients with heart failure: a systematic review. ESC. Heart Fail. 2023, 10, 3237–3249. [Google Scholar] [CrossRef]
- Johnson, A.; Bulgarelli, L.; Pollard, T.; Gow, B.; Moody, B.; Horng, S.; Celi, L.A.; Mark, R. MIMIC-IV (version 3.1). PhysioNet 2024. [Google Scholar]
- Johnson, A.E.W.; Bulgarelli, L.; Shen, L.; Gayles, A.; Shammout, A.; Horng, S.; Pollard, T.J.; Hao, S.; Moody, B.; Gow, B.; et al. MIMIC-IV, a freely accessible electronic health record dataset. Sci. Data 2023, 10, 1. [Google Scholar] [CrossRef]
- Goldberger, A.L.; Amaral, L.A.N.; Glass, L.; Hausdorff, J.M.; Ivanov, P.C.; Mark, R.G.; Mietus, J.E.; Moody, G.B.; Peng, C.K.; Stanley, H.E. PhysioBank, PhysioToolkit, and PhysioNet. Circulation 2000, 101, e215–e220. [Google Scholar] [CrossRef]
- Khwaja, A. KDIGO clinical practice guidelines for acute kidney injury. Nephron Clin. Pract. 2012, 120, c179–c184. [Google Scholar] [CrossRef]
- von Elm, E.; Altman, D.G.; Egger, M.; Pocock, S.J.; Götzsche, P.C.; Vandenbroucke, J.P.; et al. The Strengthening the Reporting of Observational Studies in Epidemiology (STROBE) statement: guidelines for reporting observational studies. BMJ 2007, 335, 806–808. [Google Scholar] [CrossRef] [PubMed]
- Benchimol, E.I.; Smeeth, L.; Guttmann, A.; Harron, K.; Moher, D.; Petersen, I.; Sørensen, H.T.; von Elm, E.; Langan, S.M.; et al. The REporting of studies Conducted using Observational Routinely-collected health Data (RECORD) statement. PLoS Med. 2015, 12, e1001885. [Google Scholar] [CrossRef] [PubMed]
- Collins, G.S.; Reitsma, J.B.; Altman, D.G.; Moons, K.G.M. Transparent Reporting of a multivariable prediction model for Individual Prognosis Or Diagnosis (TRIPOD): the TRIPOD statement. Ann. Intern. Med. 2015, 162, 55–63. [Google Scholar] [CrossRef]
- Li, J.; Liu, S.; Hu, Y.; Zhu, L.; Mao, Y.; Liu, J. Predicting mortality in intensive care unit patients with heart failure using an interpretable machine learning model: retrospective cohort study. J. Med. Internet Res. 2022, 24, e38082. [Google Scholar] [CrossRef]
- Luo, C.; Zhu, Y.; Zhu, Z.; Li, R.; Chen, G.; Wang, Z. A machine learning-based risk stratification tool for in-hospital mortality of intensive care unit patients with heart failure. J. Transl. Med. 2022, 20, 136. [Google Scholar] [CrossRef]
- Chen, Z.; Li, T.; Guo, S.; Zeng, D.; Wang, K. Machine learning-based in-hospital mortality risk prediction tool for intensive care unit patients with heart failure. Front. Cardiovasc. Med. 2023, 10, 1119699. [Google Scholar] [CrossRef] [PubMed]
- Biegus, J.; Zymlinski, R.; Sokolski, M.; Siwolowski, P.; Gajewski, P.; Nawrocka-Millward, S.; Poniewierka, E.; Jankowska, E.A.; Banasiak, W.; Ponikowski, P. Impaired hepato-renal function defined by the MELD-XI score as prognosticator in acute heart failure. Eur. J. Heart Fail. 2016, 18, 1518–1521. [Google Scholar] [CrossRef]
- Ren, X.; Qu, W.; Zhang, L.; Liu, M.; Gao, X.; Gao, Y.; Wang, X.; Zhao, J. Role of blood urea nitrogen in predicting the post-discharge prognosis in elderly patients with acute decompensated heart failure. Sci. Rep. 2018, 8, 13507. [Google Scholar] [CrossRef]
- Ansar, F.; Waheed, M.A.; Zafar, U.; Kolapo, A.; Sarfaraz, W.; Rashid, K. Revolutionizing heart failure management with artificial intelligence: a narrative review of diagnostic, prognostic, and therapeutic innovations. J. Cardiovasc. Dev. Dis. 2023, 10, 175. [Google Scholar] [CrossRef] [PubMed]
- Kerexeta, J.; Larburu, N.; Escolar, V.; Lozano-Bahamonde, A.; Macía, I.; Beristain Iraola, A.; Graña, M. Prediction and Analysis of Heart Failure Decompensation Events Based on Telemonitored Data and Artificial Intelligence Methods. J. Cardiovasc. Dev. Dis. 2023, 10, 48. [Google Scholar] [CrossRef] [PubMed]
- Jia, Y.Y.; Cui, N.Q.; Jia, T.T.; Song, J.P. Prognostic models for patients suffering a heart failure with a preserved ejection fraction: a systematic review. ESC. Heart Fail. 2024, 11, 1341–1351. [Google Scholar] [CrossRef]
- Fonarow, G.C.; Adams, K.F., Jr.; Abraham, W.T.; Yancy, C.W.; Boscardin, W.J.; et al. Risk stratification for in-hospital mortality in acutely decompensated heart failure: classification and regression tree analysis. JAMA 2005, 293, 572–580. [Google Scholar] [CrossRef] [PubMed]
Figure 1.
Flow diagram of cohort assembly. The figure shows stepwise restriction from all adult intensive care unit stays to the broad clean core modeling cohort and the strict sensitivity cohort with narrowed phenotype timing and separated creatinine windows.
Figure 1.
Flow diagram of cohort assembly. The figure shows stepwise restriction from all adult intensive care unit stays to the broad clean core modeling cohort and the strict sensitivity cohort with narrowed phenotype timing and separated creatinine windows.
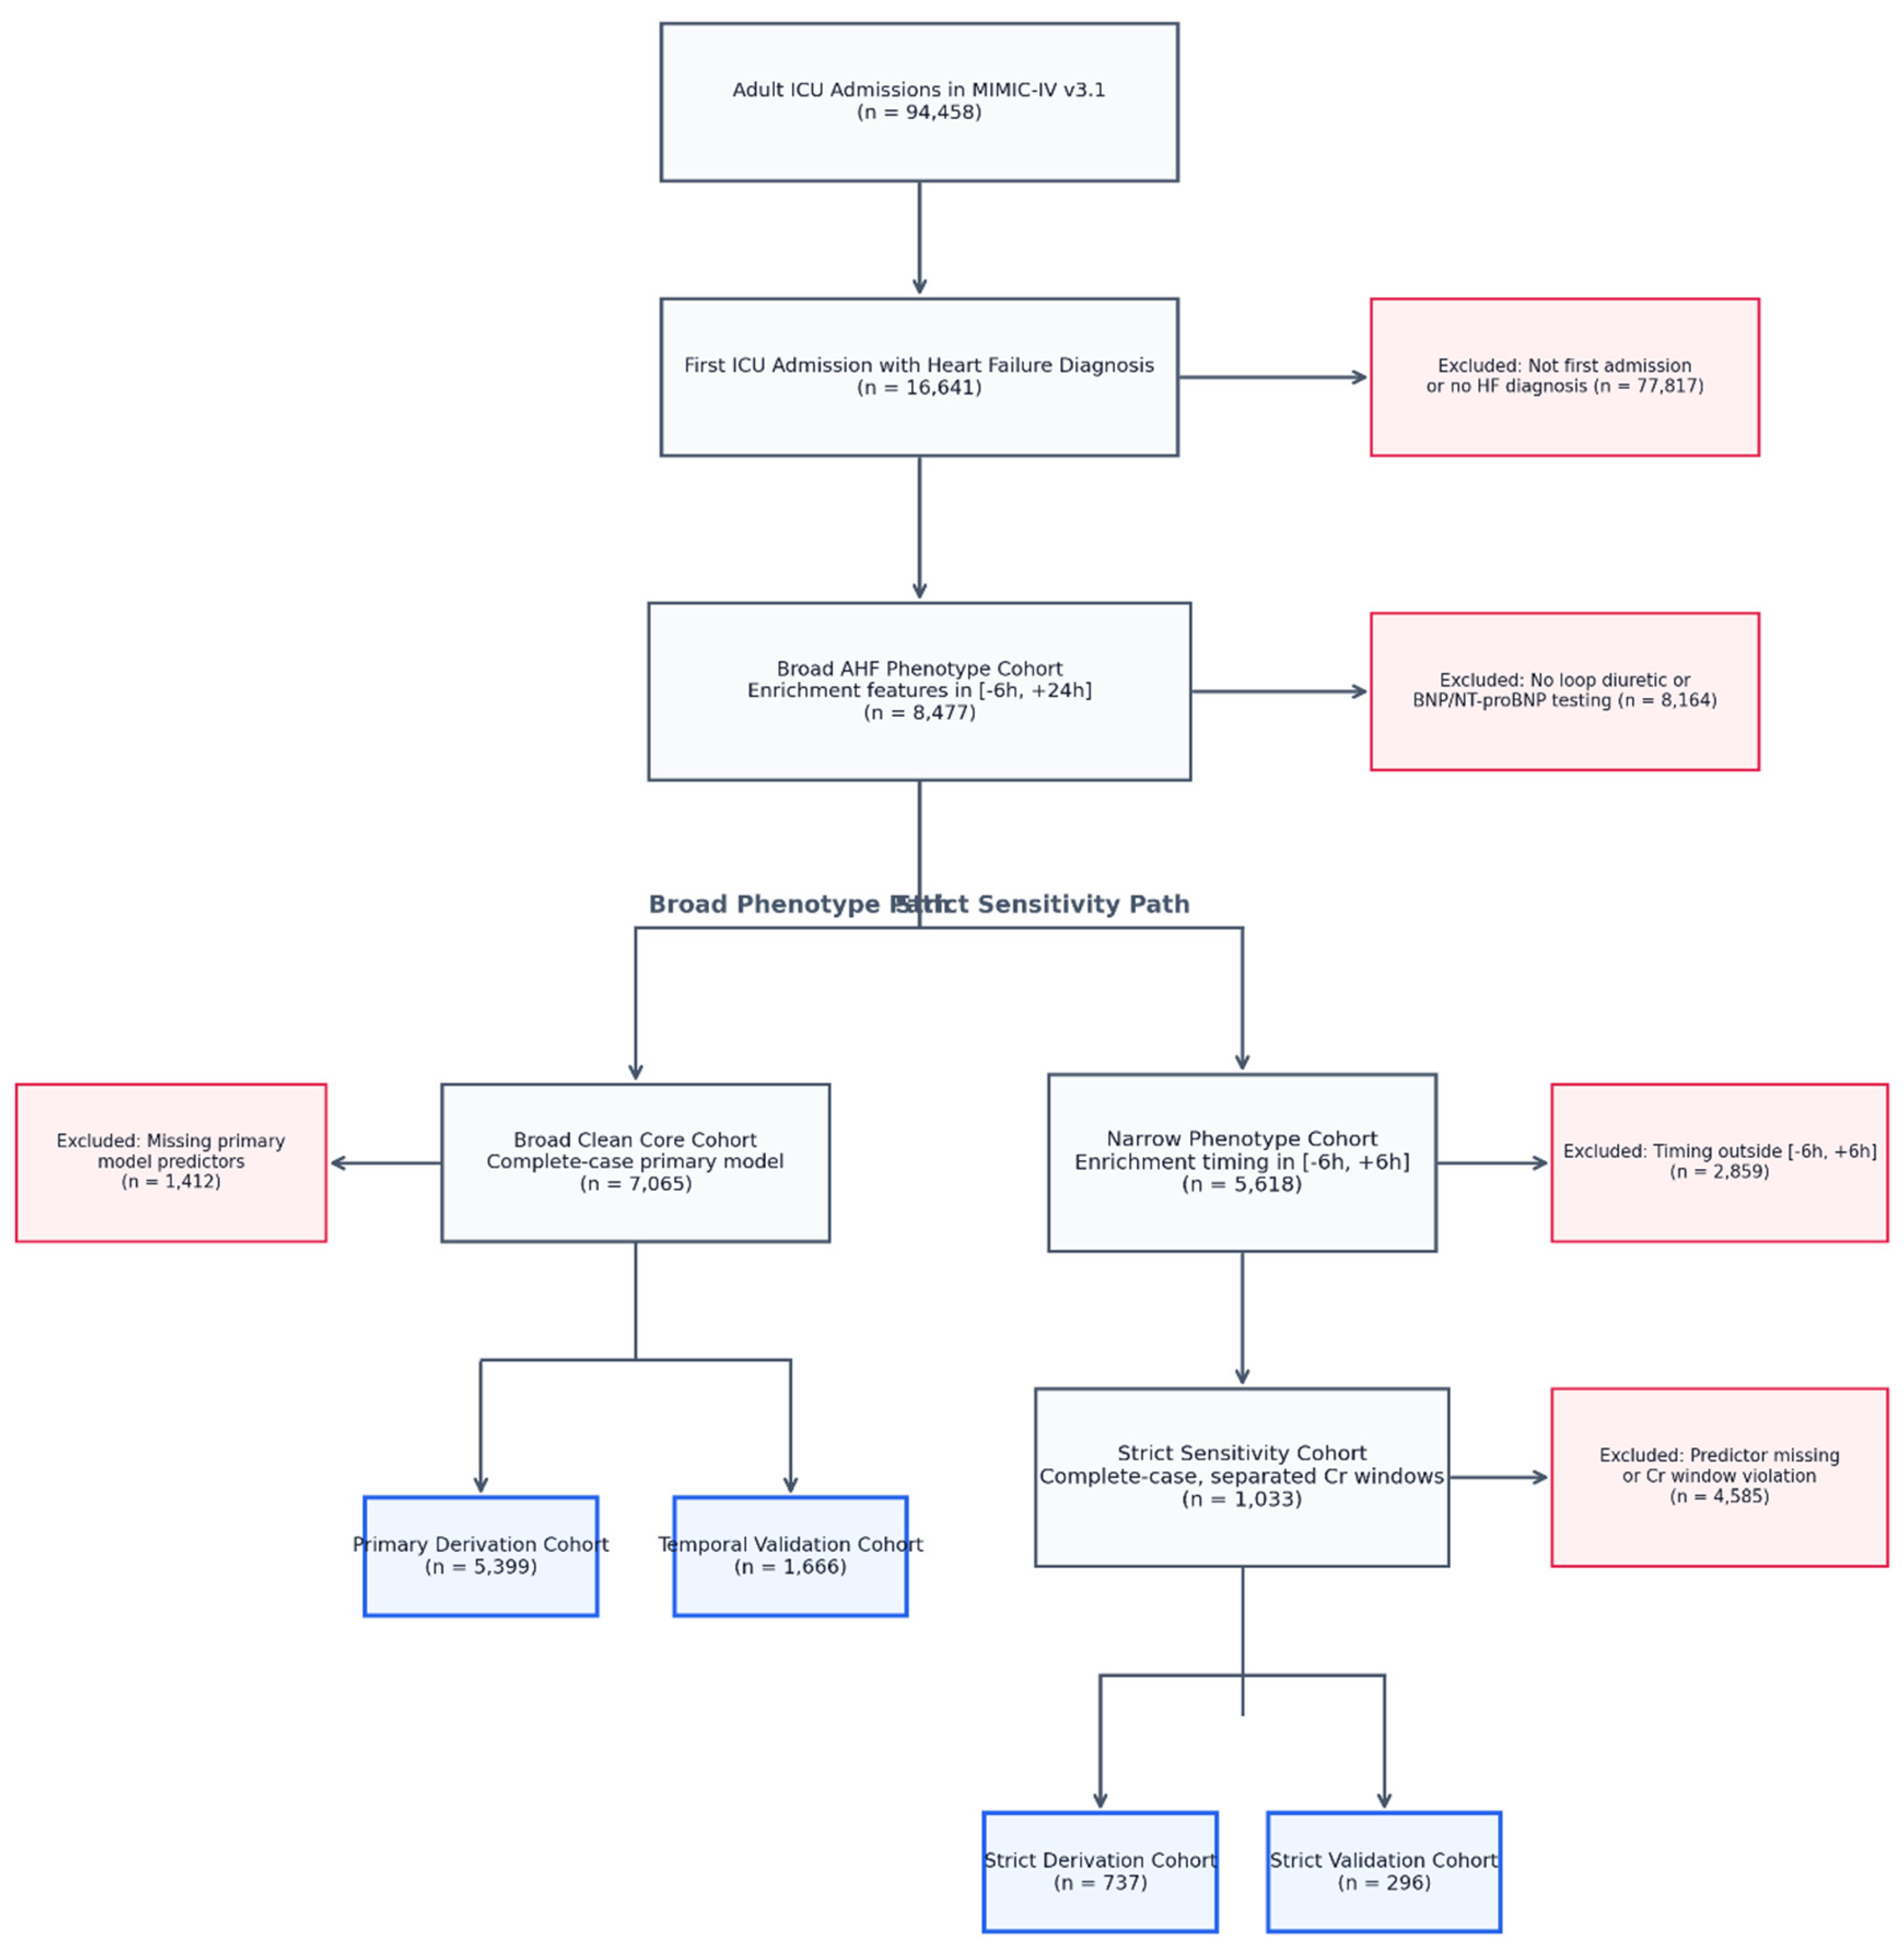
Figure 2.
Receiver operating characteristic curves for the primary composite cardiorenal outcome in the derivation and temporal validation cohorts.
Figure 2.
Receiver operating characteristic curves for the primary composite cardiorenal outcome in the derivation and temporal validation cohorts.
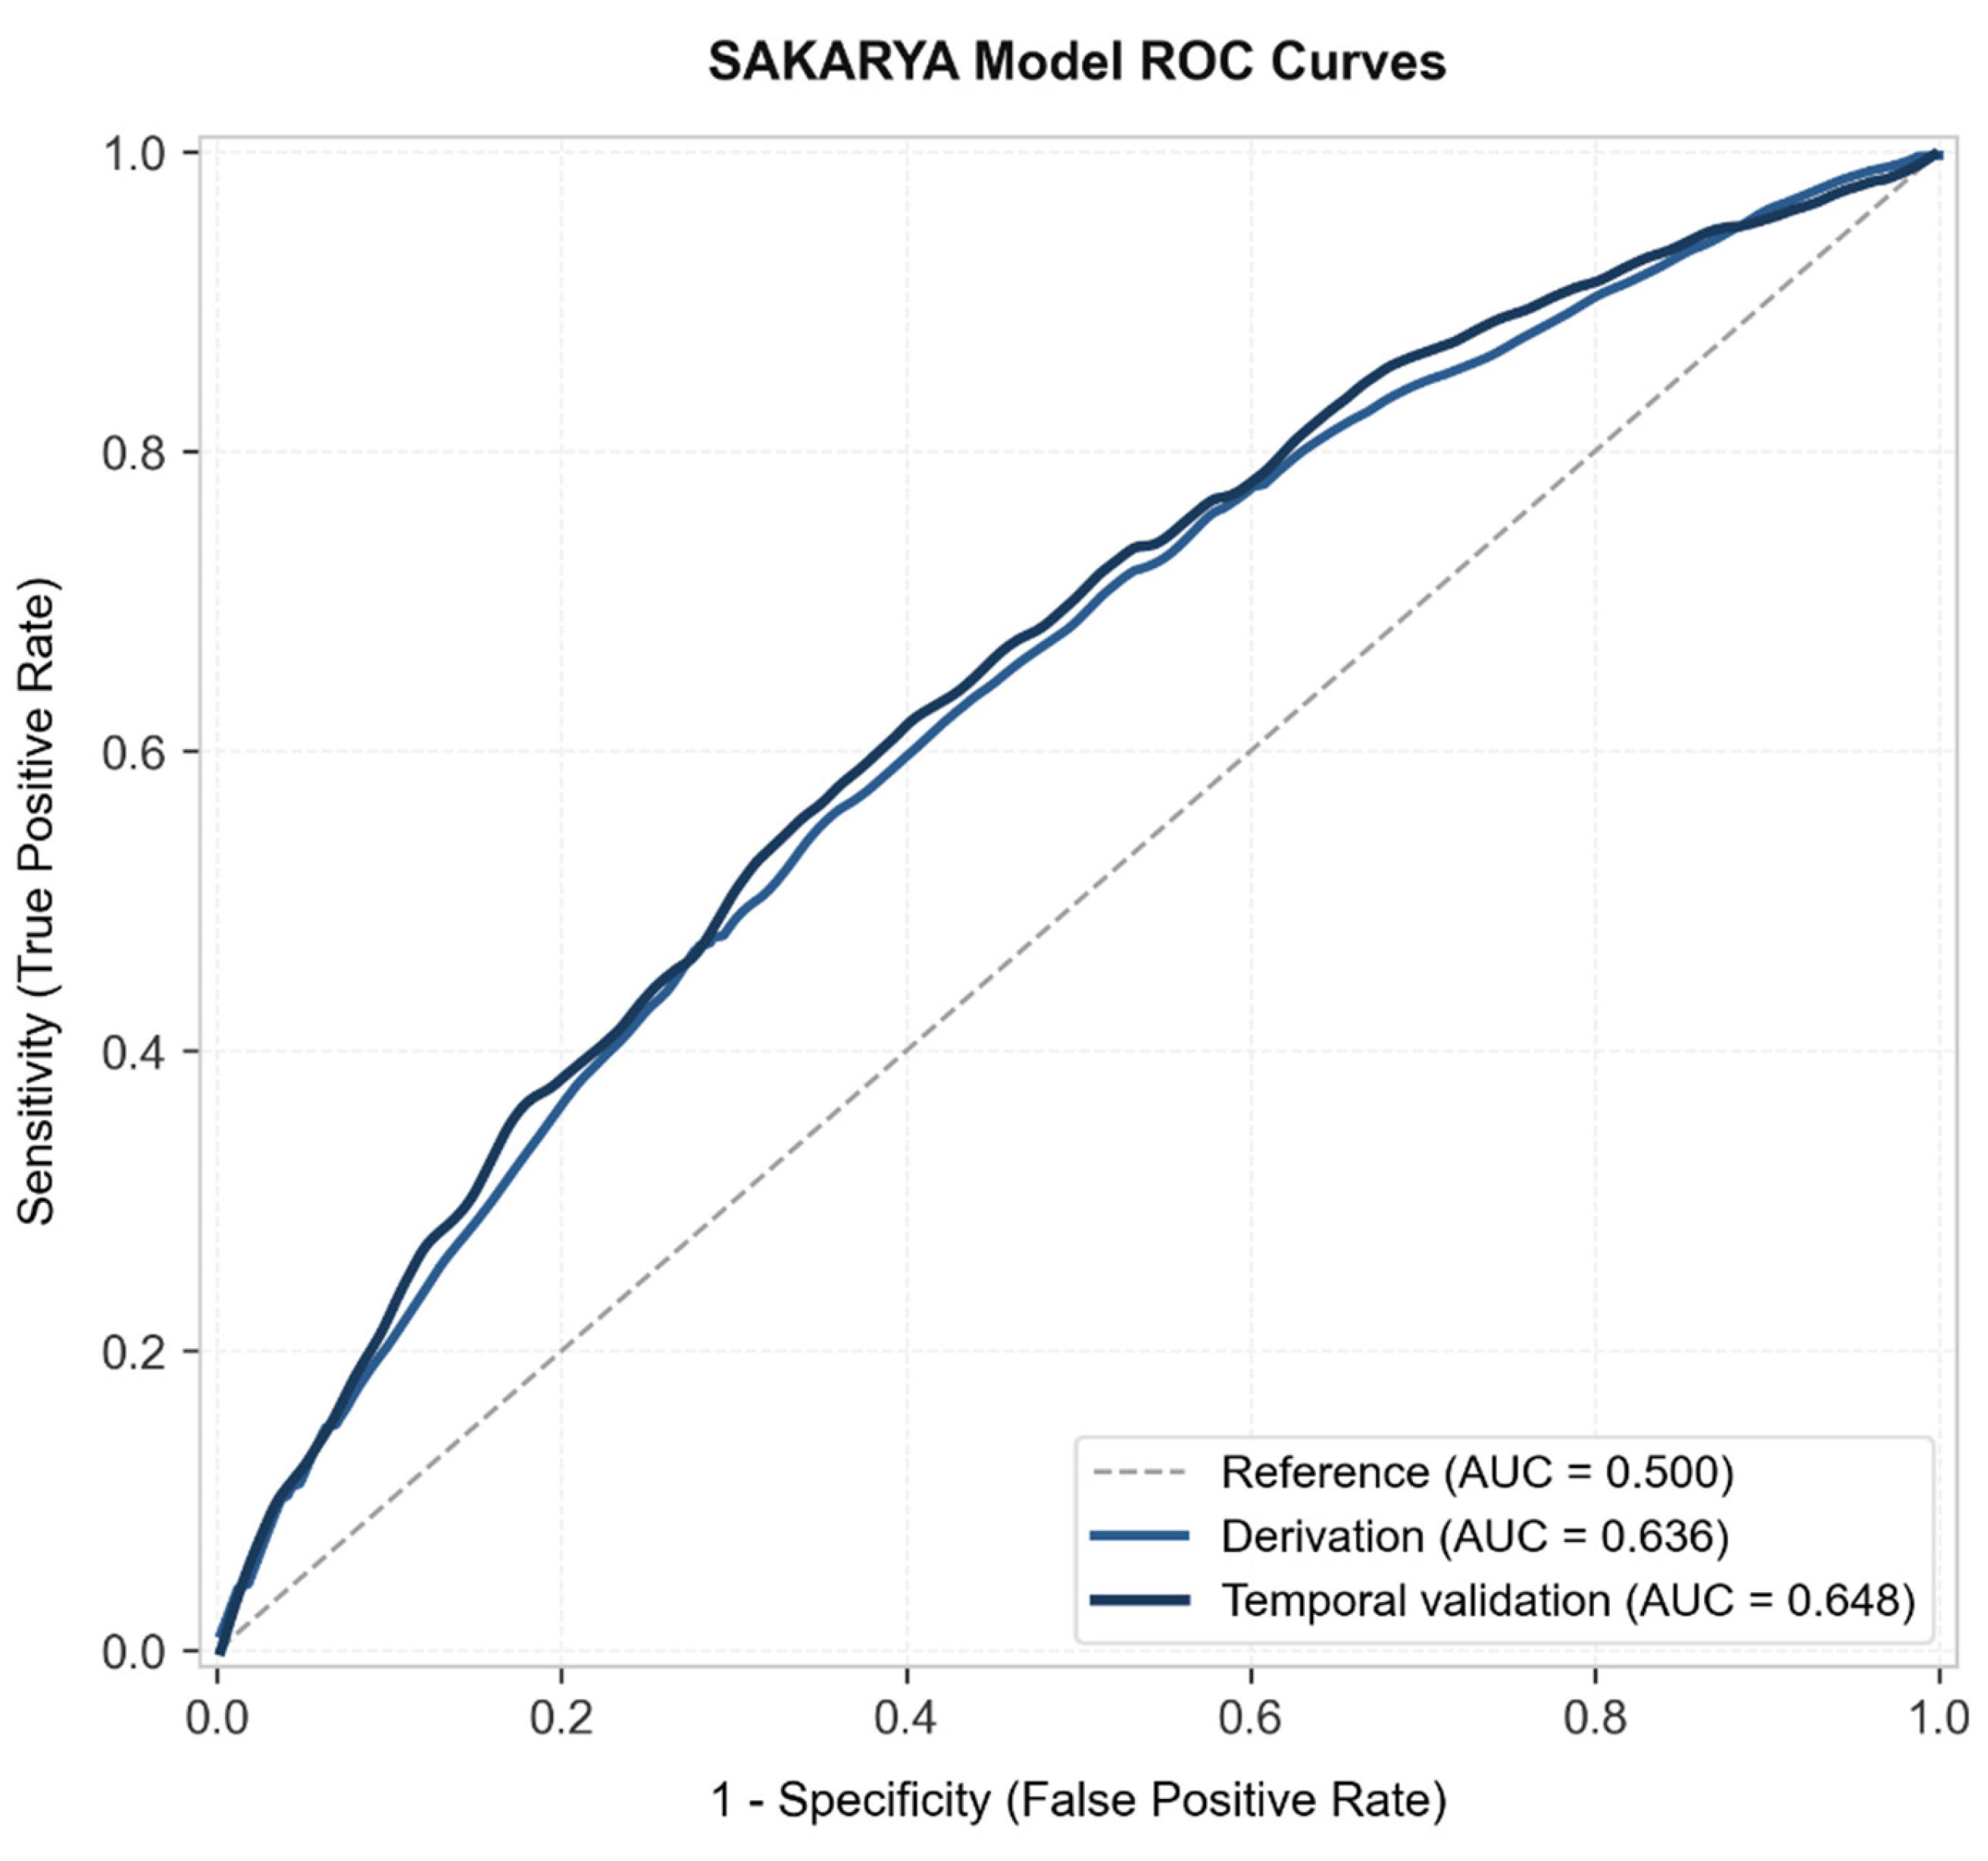
Figure 3.
Calibration plot for the primary composite cardiorenal outcome in the temporal validation cohort.
Figure 3.
Calibration plot for the primary composite cardiorenal outcome in the temporal validation cohort.
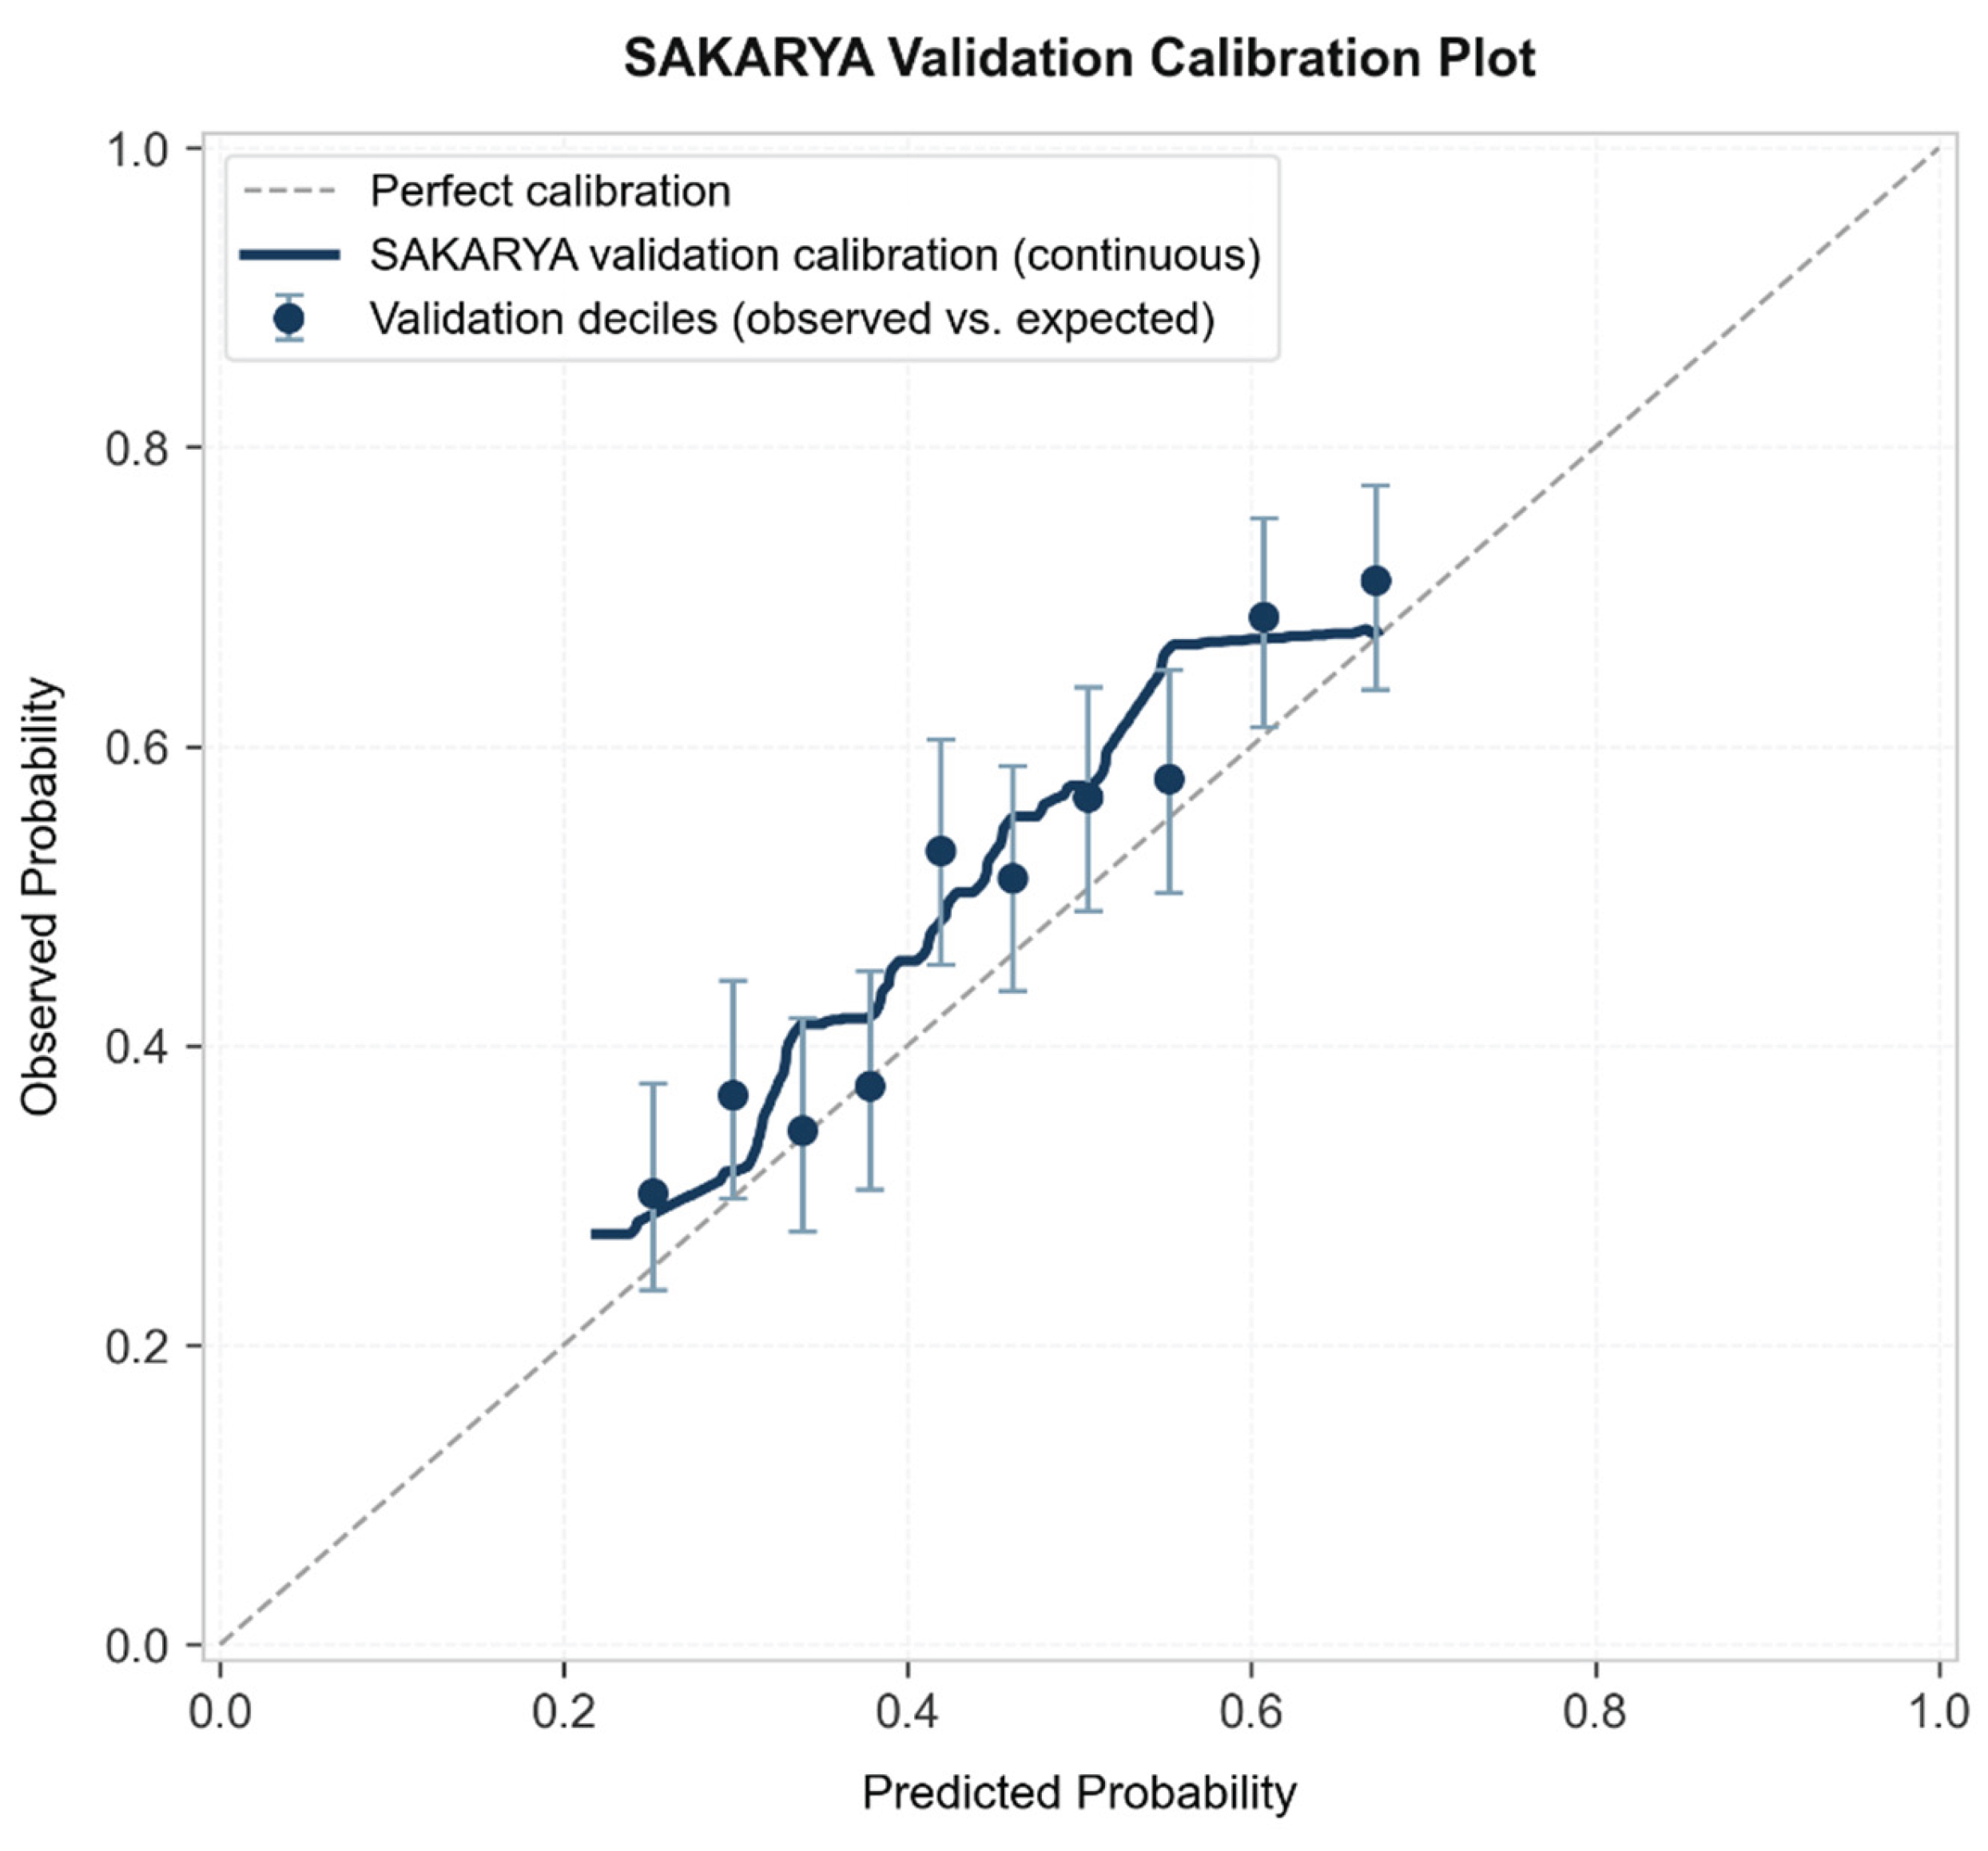

Table 1.
Baseline characteristics of the broad clean core modeling cohort by temporal split.
| Characteristic | Derivation (n=5399) | Temporal validation (n=1666) | P value |
| Age, years | 74.0 [64.0, 83.0] | 70.0 [60.0, 79.0] | <0.001 |
| Male sex | 2904 (53.8%) | 941 (56.5%) | 0.057 |
| Heart rate, beats/min | 88.0 [76.0, 103.0] | 89.0 [76.0, 105.0] | 0.129 |
| Mean arterial pressure, mmHg | 81.0 [70.0, 93.0] | 86.0 [75.0, 98.0] | <0.001 |
| Respiratory rate, breaths/min | 20.0 [16.0, 24.0] | 21.0 [17.0, 25.0] | <0.001 |
| Oxygen saturation, % | 97.0 [94.0, 100.0] | 97.0 [94.0, 99.0] | <0.001 |
| Creatinine, mg/dL | 1.3 [0.9, 1.9] | 1.3 [1.0, 2.1] | 0.003 |
| Blood urea nitrogen, mg/dL | 28.0 [19.0, 46.0] | 29.0 [18.0, 48.0] | 0.713 |
| Sodium, mmol/L | 138.0 [135.0, 141.0] | 138.0 [135.0, 141.0] | <0.001 |
| Bicarbonate, mmol/L | 23.0 [20.0, 27.0] | 22.0 [19.0, 26.0] | <0.001 |
| Hemoglobin, g/dL | 10.7 [9.0, 12.4] | 10.7 [8.9, 12.6] | 0.727 |
| Early intravenous loop diuretic | 4411 (81.7%) | 1281 (76.9%) | <0.001 |
| Early BNP/NT-proBNP positivity | 2499 (46.3%) | 917 (55.0%) | <0.001 |
Data are shown as median [interquartile range] or number (percentage).
Table 2.
Broad-cohort performance of the primary and secondary outcome models.
| Outcome | Derivation AUC | Validation AUC | Derivation Brier | Validation Brier | Validation intercept | Validation slope |
| Primary composite | 0.636 | 0.648 | 0.231 | 0.238 | 0.26 | 0.99 |
| 28-day death | 0.723 | 0.712 | 0.135 | 0.179 | 0.58 | 0.88 |
| Incident AKI | 0.616 | 0.588 | 0.213 | 0.223 | 0.02 | 0.62 |
Table 3.
Multivariable logistic regression results for the primary composite cardiorenal outcome using clinically scaled units.
Table 3.
Multivariable logistic regression results for the primary composite cardiorenal outcome using clinically scaled units.
| Predictor | OR (95% CI) | P value |
| Age, per 10 years | 1.15 (1.10-1.20) | <0.001 |
| Male sex | 1.09 (0.98-1.23) | 0.123 |
| Heart rate, per 10 beats/min | 1.06 (1.03-1.10) | <0.001 |
| Mean arterial pressure, per 10 mmHg | 0.95 (0.92-0.98) | 0.002 |
| Respiratory rate, per 5 breaths/min | 1.05 (1.00-1.10) | 0.035 |
| Oxygen saturation, per 5% | 0.97 (0.90-1.03) | 0.318 |
| Creatinine, per mg/dL | 1.06 (1.00-1.11) | 0.031 |
| Blood urea nitrogen, per 10 mg/dL | 1.04 (1.01-1.07) | 0.009 |
| Sodium, per 5 mmol/L | 1.06 (1.00-1.11) | 0.043 |
| Bicarbonate, per 5 mmol/L | 0.80 (0.75-0.84) | <0.001 |
| Hemoglobin, per g/dL | 0.91 (0.89-0.94) | <0.001 |
Table 4.
Temporal validation head-to-head comparator analysis in the strict sensitivity cohort.
| Model | Validation AUC | Validation Brier | Validation Brier skill | Validation intercept | Validation slope |
| SAKARYA | 0.630 | 0.241 | 0.006 | 0.39 | 0.77 |
| SOFA | 0.682 | 0.225 | 0.073 | 0.37 | 0.95 |
| BUN+SBP | 0.607 | 0.247 | -0.018 | 0.32 | 0.56 |
Disclaimer/Publisher’s Note: The statements, opinions and data contained in all publications are solely those of the individual author(s) and contributor(s) and not of MDPI and/or the editor(s). MDPI and/or the editor(s) disclaim responsibility for any injury to people or property resulting from any ideas, methods, instructions or products referred to in the content. |
© 2026 by the authors. Licensee MDPI, Basel, Switzerland. This article is an open access article distributed under the terms and conditions of the Creative Commons Attribution (CC BY) license (http://creativecommons.org/licenses/by/4.0/).
Copyright: This open access article is published under a Creative Commons CC BY 4.0 license, which permit the free download, distribution, and reuse, provided that the author and preprint are cited in any reuse.


