
Submitted:
21 May 2026
Posted:
22 May 2026
You are already at the latest version
Abstract
As the supply network for community-based elderly care services expands, the research focus shifts from mere service availability to computationally modeling who can access and utilize services effectively. Existing studies often consider accessibility as spatial distance or economic cost and equity as simple resource allocation, limiting insights into cumulative disadvantages faced by older adults with low income, digital barriers, or limited family support. Based on data from 3,800 community elder care sites across 20 U.S. metropolitan areas, individual survey data from 6,240 older adults, and community socioeconomic indicators, this study constructs a computational five-stage accessibility chain model: “Information Accessibility—Eligibility Determination—Process Accessibility—Service Availability—Outcome Attainability.”The study integrates heterogeneous data encoding, adaptive spatial accessibility computation, stage-aware vulnerability representation, and hierarchical modeling. Two-Step Floating Contour Analysis (2SFCA), stage-coupled logit modeling, and deep embedded clustering are applied to stratify risk and optimize service access prediction. A cross-vulnerability index, combining six factors—age, income, cognition, language proficiency, family support, and digital access—is incorporated into the model to quantify cumulative impacts across stages.Preliminary results indicate that inequalities do not primarily arise from geographic proximity but accumulate during intermediate phases of information identification, eligibility determination, and process navigation. Digital vulnerability and lack of family support remain major limiting factors even after controlling for spatial accessibility, demonstrating the effectiveness of stage-aware, computationally optimized modeling. This paper proposes an integrated “accessibility chain–intersectional vulnerability” computational framework, advancing service equity from outcome equity to process and transformational equity, and providing a technology-driven foundation for targeted service allocation, navigation system optimization, and identification of high-risk groups in community-based elderly care.
Keywords:
community‐based elderly care services
; accessibility
; equity
; intersectional vulnerability
; 2SFCA
; latent class analysis
1. Introduction
City-based elderly care systems play an important role in supporting aging populations and delaying hospitalization [1]. However, service expansion does not necessarily lead to effective individual-level access, because service use depends on heterogeneous spatial, personal, and community features [2]. Existing studies mainly rely on spatial distance or resource allocation indicators, making it difficult to model the sequential stages of information identification, eligibility judgment, process navigation, service matching, and outcome conversion [3]. To address this computational problem, this study constructs a stage-coupled accessibility prediction framework. The framework integrates heterogeneous data encoding, road-network graph computing, stage-aware vulnerability embedding, gradient boosting prediction, and deep embedded clustering to estimate multi-stage service access probabilities and identify high-risk groups.
2. Data Framework and Computational Representation
2.1. Data Feature Encoding
Based on 20 U.S. metropolitan areas, this study integrates 3,800 community elder care sites, survey records from 6,240 older adults, and community socioeconomic indicators. As shown in Figure 1, the heterogeneous data first enter a unified encoding module and are then coupled with road-network accessibility computation, vulnerability representation, and stage-aware prediction. Service-site records provide coordinates, capacity, and type; individual records cover demographic and capability variables; community indicators include income, health resources, and broadband access. Spatial records were projected into WGS84, and service locations and residences were mapped onto a road-network graph to calculate weighted travel distance. Age and income were standardized by z-scores, while cognition, language proficiency, and digital access were coded within 0–1; quantile binning enhanced robustness [4].
After preprocessing, the encoded vector is expressed as:
where: ` ` represents the composite feature vector of the ` `th elderly individual; ` ` is the spatial feature subvector (including distance to service points, supply density, etc.); ` ` is the individual attribute vector (six variables: age, income, cognitive status, language proficiency, family support, and digital access); ` represents the community environmental feature vector (community income level, medical resources, digital infrastructure, etc.) [5]. This encoding converts multi-source heterogeneous data into a unified computational input for subsequent accessibility modeling and probability prediction.
2.2. Vulnerability Representation of the Accessibility Chain
Based on the unified coding of multi-source data, each risk factor is embedded into a five-step access chain — “information-awareness — eligibility decision — process accessibility — service availability — outcome realization” — to construct a computable, stage-based vulnerability representation (see Figure 2).
Six variables — age, income, cognition, language proficiency, family support, and digital accessibility — were chosen. Based on the distribution features of 6, 240 elderly people in the sample, the data were normalized to form a hazard vector. A weighted aggregation method was then used to construct an individual intersectional vulnerability index:
where: ` ` represents the comprehensive vulnerability index of the ` `th individual; ` ` denotes the standardized value of the ` `th risk factor (e.g., age or digital access) for the ` `th individual; ` ` is the corresponding risk weight, determined based on prior research and the contribution of variable variance and normalized accordingly [6]. Furthermore, the overall vulnerability is mapped to each stage of the chain to characterize differences in stage sensitivity:
where: represents the vulnerability level of an individual at stage ; is the stage vulnerability amplification coefficient; is the stage-specific adjustment parameter; is the stage-related feature subset (e.g., digital access and language proficiency for the information stage).
3. Hierarchical Identification Methods and Algorithm Implementation
3.1. Spatial Accessibility Calculation
Based on spatial matching between older adults and service sites, a supply–demand network was constructed using 3,800 community senior care centers and corresponding residential units. To strengthen road-network graph computing, the road system was represented as a weighted graph ,where denotes road intersections, residential units, and service centers after map matching; denotes road segments; and records travel distance weights. The shortest network distance or was computed through batch shortest-path search rather than straight-line distance. An adaptive threshold radius was then assigned to each service center according to local service density and observed travel patterns [7]. In the first step, the service supply-demand ratio of service point is calculated as:
where: represents the supply-demand ratio for the th service point ( ); is the service capacity of that service point (measured in average daily service capacity); is the number of elderly residents in the th residential unit ( ) within the service radius; is the network distance from residential unit to service point . In the second step, centered on each individual, the accessible service supply is aggregated:
where: represents the spatial accessibility of individual ; is the distance from individual to service point ; is the distance decay parameter (set to 2 km); the exponential term represents the Gaussian decay function [8]. The computation was vectorized and parallelized to support large-scale accessibility aggregation.
3.2. Modeling Service Access Probability
After obtaining individual spatial accessibility and stage-based vulnerability representation ,a stage-aware gradient boosting prediction model is constructed to estimate service access probability. The model takes the individual featurer vector , spatial accessibility , stage-specific vulnerability feature ,community environmental vector ,and stage embedding as joint inputs. Compared with classical linear probability models, this structure can capture nonlinear interactions among spatial accessibility, digital access, family support, income level, and community resources. Cross-validation and hyperparameter optimization are used to determine tree depth, learning rate, and the number of estimators, while feature importance is retained for interpretability [9]. The prediction function is expressed as:
In the equation: ` ` represents the probability that individual ` ` passes stage sss and enters the corresponding service process; ` ` is the sigmoid activation function; ` ` enotes the m-th weak learner in the gradient boosting ensemble; ` ` is its learning weight; is the total number of learners; and s the stage-aware input feature vector. Parallelized training is adopted to accelerate large-scale community-level computation.
3.3. Latent Class Group Identification
After obtaining the individual feature vectors , spatial reachability , and cross-vulnerability indices , a deep embedded clustering framework is employedto replace the classical LCA procedure with representation-learning-based group identification. Continuous and categorical variables are first encoded into a shared latent space through an embedding network, so that nonlinear relationships among age, income, cognition, language, family support, and digital access can be captured before clustering. The latent class identification is performed on the 6,240 older adults, aiming to group individuals with similar risk profiles and service-access behaviors.
In particular, 6 discrete variables — age stratification (≥65, ≥75), income class, cognition (normal/moderate), linguistic competence (binary), family support (family/single), and digital access (YES/NO) — were chosen as observed indicators. Continuous variables are normalized and projected into dense vectors, while categorical variables are converted into learnable embeddings. The embedded features are then optimized through iterative representation learning, and the number of clusters is searched within 2–6. Instead of using the BIC criterion, the optimal cluster structure is selected according to clustering compactness and separation indicators, including the silhouette coefficient and Davies–Bouldin index [10].
The latent category probability is calculated as follows:
where: denotes the posterior probability that individual belongs to class ; is the prior probability of class ; is the value of individual for the th observed variable; is the number of variables. Individuals are assigned to the risk group with the highest soft probability, and the resulting clusters are further used for stage-wise prediction and group-level comparison (see Figure 3).
3.4. Coupling of Chain Stages
In this paper, we explicitly model the state transition of individuals in the following five phases: “Information Accessibility — Eligibility Determination — Process Accessibility — Service Availability — Outcome Implementation.” Specifically, 6 240 old people are used as observation units, and the state of each phase is defined as a binary variable (whether the phase has been passed), and conditional dependencies between phases are established.The probability of passing Stage is influenced not only by individual characteristics , spatial accessibility , and frailty , but also depends on the status of the previous stage , thereby forming a chain-like propagation structure. Stage coupling is characterized using conditional probability recursion:
where: denotes the probability that an individual passes through stage ; is the sigmoid function; is the state of the previous stage (0 or 1); represents the stage transition coefficient; denotes the community environmental feature vector; denotes the corresponding parameter. In order to ensure the stability of the model, the parameters are estimated separately for each phase, and the training is carried out separately within the latent group to capture the pathway differences between the different risk groups. This coupled architecture facilitates the transition from single-phase analysis to end-to-end modeling, which allows the description of service entry and continued use processes in a uniform probabilistic framework, thus providing a computational basis for identifying stage-specific inequalities.
4. Experimental Analysis and Model Validation
4.1. Dataset Construction and Experimental Setup
On the basis of the data coding and chain representation described above, we used spatial matching of 3, 800 community care centers in 20 US metropolitan areas with the personal data of 6, 240 elderly adults to build a sample for individual analysis.Each sample record includes spatial accessibility indicators ( ), the Cross-Fragility Index and its stage representation ( ), an individual feature vector (age, income, cognition, language, family support, digital access), and community-level environmental variables (median income, density of medical resources, broadband coverage).On the basis of the service use records and the survey questionnaire, the samples were labeled as “Service Users” or “Non Service Users”, and then the stage status tags were generated according to the Chain Phase Variables.
In the experimental setup, the data were classified into a 7: 2: 1 ratio of training, validation, and test sets to ensure the same sample proportions across metropolitan areas.Model training employed a batch gradient optimization strategy with a batch size of 128 and a maximum of 100 iterations. Additionally, subsets were constructed based on latent category groupings to evaluate the model’s adaptability across different vulnerable groups. All experiments were carried out using a standardized data preprocessing workflow to ensure that the data input was consistent and the results were comparable.
4.2. Results of Phased Identification Using the Accessibility Chain Model
Based on the chain-coupled model, the probabilities of passing through the five phases were computed for 6,240 older adults, and phase transition distributions were analyzed. The spatial availability phase shows a high overall pass rate of 78.6%, indicating sufficient geographic coverage. Pass rates decline progressively in intermediate stages: 61.3% at “Information Accessible”, 47.2% at “Eligibility Determined”, 42.5% at “Service Availability”, and 35.9% at outcome conversion (>6 months). The largest losses occur between “Information Consciousness” and “Eligibility Determination” (6.5%) and “Process Accessibility” (7.6%).These results highlight that service inequalities primarily arise from intermediate process barriers rather than spatial proximity, providing quantitative evidence for stage-aware model optimization. Figure 4 visually presents the stage-wise pass rates and cumulative dropout pattern, supporting subsequent computational analyses.
4.3. Analysis of the Cumulative Effects of Cross-Vulnerability
After controlling for spatial accessibility, group regressions and marginal effects were calculated for different vulnerability combinations. The results show that a single risk factor has a limited effect on service access, whereas overlapping risks significantly intensify inequality. Compared with the baseline group, low income alone reduces access probability by about 6.2 percentage points; “low income + lack of digital access” reduces it by 13.7 percentage points; and adding living alone further reduces it by 18.9 percentage points. In the outcome conversion stage, digital vulnerability combined with insufficient family support lowers continued use probability by about 21.4 percentage points. These results indicate that cross-vulnerability mainly amplifies intermediate process barriers, with digital disadvantage and lack of family support as the key limiting factors. Figure 5 shows the overlapping effects of cross-vulnerability on service entry and continued use.
4.4. Model Comparison and Robustness Testing
To verify the effectiveness of the stage-coupled model, three model variants were compared under the same data partition, preprocessing procedure, and evaluation metrics. Model A uses only spatial accessibility features; Model B adds individual attributes; Model C integrates road-network accessibility, vulnerability embedding, and chain-stage transition features. Ablation models were also designed to test the contribution of key modules. As shown in Table 1, Model C performs best, with an AUC of 0.811, F1-score of 0.768, accuracy of 0.782, and log-loss of 0.497. Compared with Model A, its AUC increases by 0.130 and log-loss decreases by 0.115. Removing road-network graph computing, vulnerability embedding, or stage coupling all reduces performance, with stage coupling showing the largest impact. Five-fold resampling and parameter perturbation show metric fluctuations within ±0.01, indicating stable robustness.
5. Conclusions
This study developed a stage-coupled computational framework for predicting community elderly care service accessibility. By integrating road-network graph computing, heterogeneous feature encoding, vulnerability embedding, stage-aware gradient boosting, and deep embedded clustering, the model transforms service access analysis into a multi-stage prediction task. Experimental results show that the full model outperforms spatial-only and feature-augmented baselines, while ablation tests confirm the contribution of graph accessibility, vulnerability representation, and stage coupling to prediction accuracy and robustness.
References
- Wadhwa, S.; Krishnan, A.; Wang, R.; Wallace, B. C.; Kong, C. Learning from natural language explanations for generalizable entity matching. arXiv 2024, arXiv:2406.09330. [Google Scholar] [CrossRef]
- Qinqin, Z. Construction and Exploration of a Green Cognitive-Friendly Community Elderly Care Service Model in an Aging Society [J]. Int. J. Healthc. Inf. Syst. Inform. (IJHISI) 2026, 21(1), 1–23. [Google Scholar]
- Chen, Y.; Abdullah, B. F. M.; Abidin, Z. E. N.; et al. Breaking boundaries: integration of sports and medicine in the community elderly service model. [J]. BMC Public Health 2025, 26(1), 366–366. [Google Scholar] [CrossRef] [PubMed]
- Chen, Y.; Li, N.; Bai, X.; et al. Dilemmas in the use of community-based home care and smart home care services for older adults among family caregivers of older adults with mild cognitive impairment (MCI): a qualitative study [J]. Front. Public Health 2025, 13, 1694462–1694462. [Google Scholar] [CrossRef] [PubMed]
- Fernández, R. A.; Irazusta, J.; Pardo, R. C.; et al. Multicomponent physical exercise program among community-dwelling older adults who are users of home care services: a quasi-experimental pilot study. Disabil. Rehabil. 2025, 1–16. [Google Scholar] [CrossRef] [PubMed]
- Jiang, H.; Huang, Y. Inequality in opportunities for utilizing community-based care services among the elderly in China—an analysis based on the “circumstance-effort” perspective [J]. BMC Health Serv. Res. 2025, 25(1), 1028–1028. [Google Scholar] [CrossRef] [PubMed]
- Aotegensubude, Hasieerdeni. TOPSIS Framework for Fuzzy Multiple-Attribute Decision-Making with Probabilistic Simplified Neutrosophic Sets and Applications to Community Home-Based Elderly Care Services Quality Evaluation for Disabled Elderly People [J]. Int. J. Fuzzy Syst. 2025, 28(1), 1–15. [Google Scholar] [CrossRef]
- Meulenbroeks, I.; Raban, Z. M.; Seaman, K.; et al. Community Preferences for Allied Health Services in Residential Aged Care. [J]. Health Expectations: An International Journal of Public Participation in Health Care and Health Policy 2024, 27(6), e70081. [Google Scholar] [CrossRef] [PubMed]
- Toson, B.; Edney, C. L.; Afzali, A. H. H.; et al. Economic burden of frailty in older adults accessing community-based aged care services in Australia. [J]. Geriatr. Gerontol. Int. 2024, 24(9), 939–947. [Google Scholar] [CrossRef] [PubMed]
- Wei, M.; Junfeng, W.; Lihong, L.; et al. Factors influencing satisfaction with community senior care services in China: an analysis based on an extended Anderson model. [J]. Front. Public Health 2023, 11, 1138711–1138711. [Google Scholar]
Figure 1.
Module Coupling and Algorithm Workflow of the Proposed Framework.
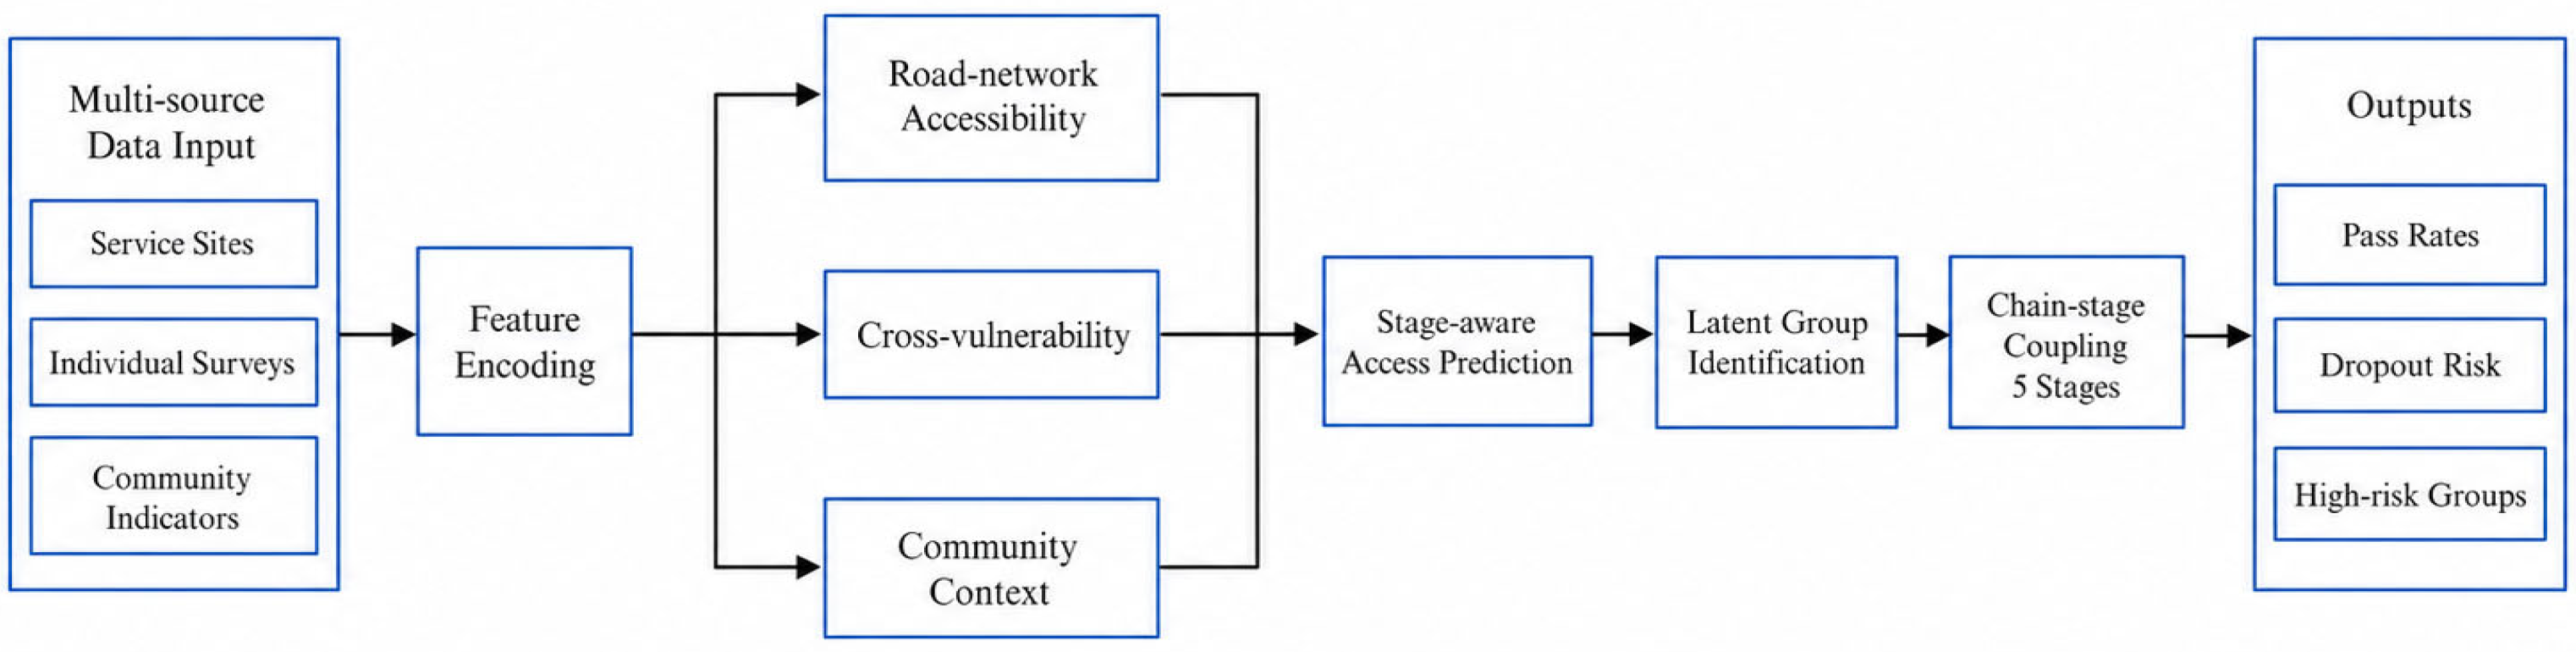
Figure 2.
Mapping Relationship Between the Accessibility Chain and Vulnerability.
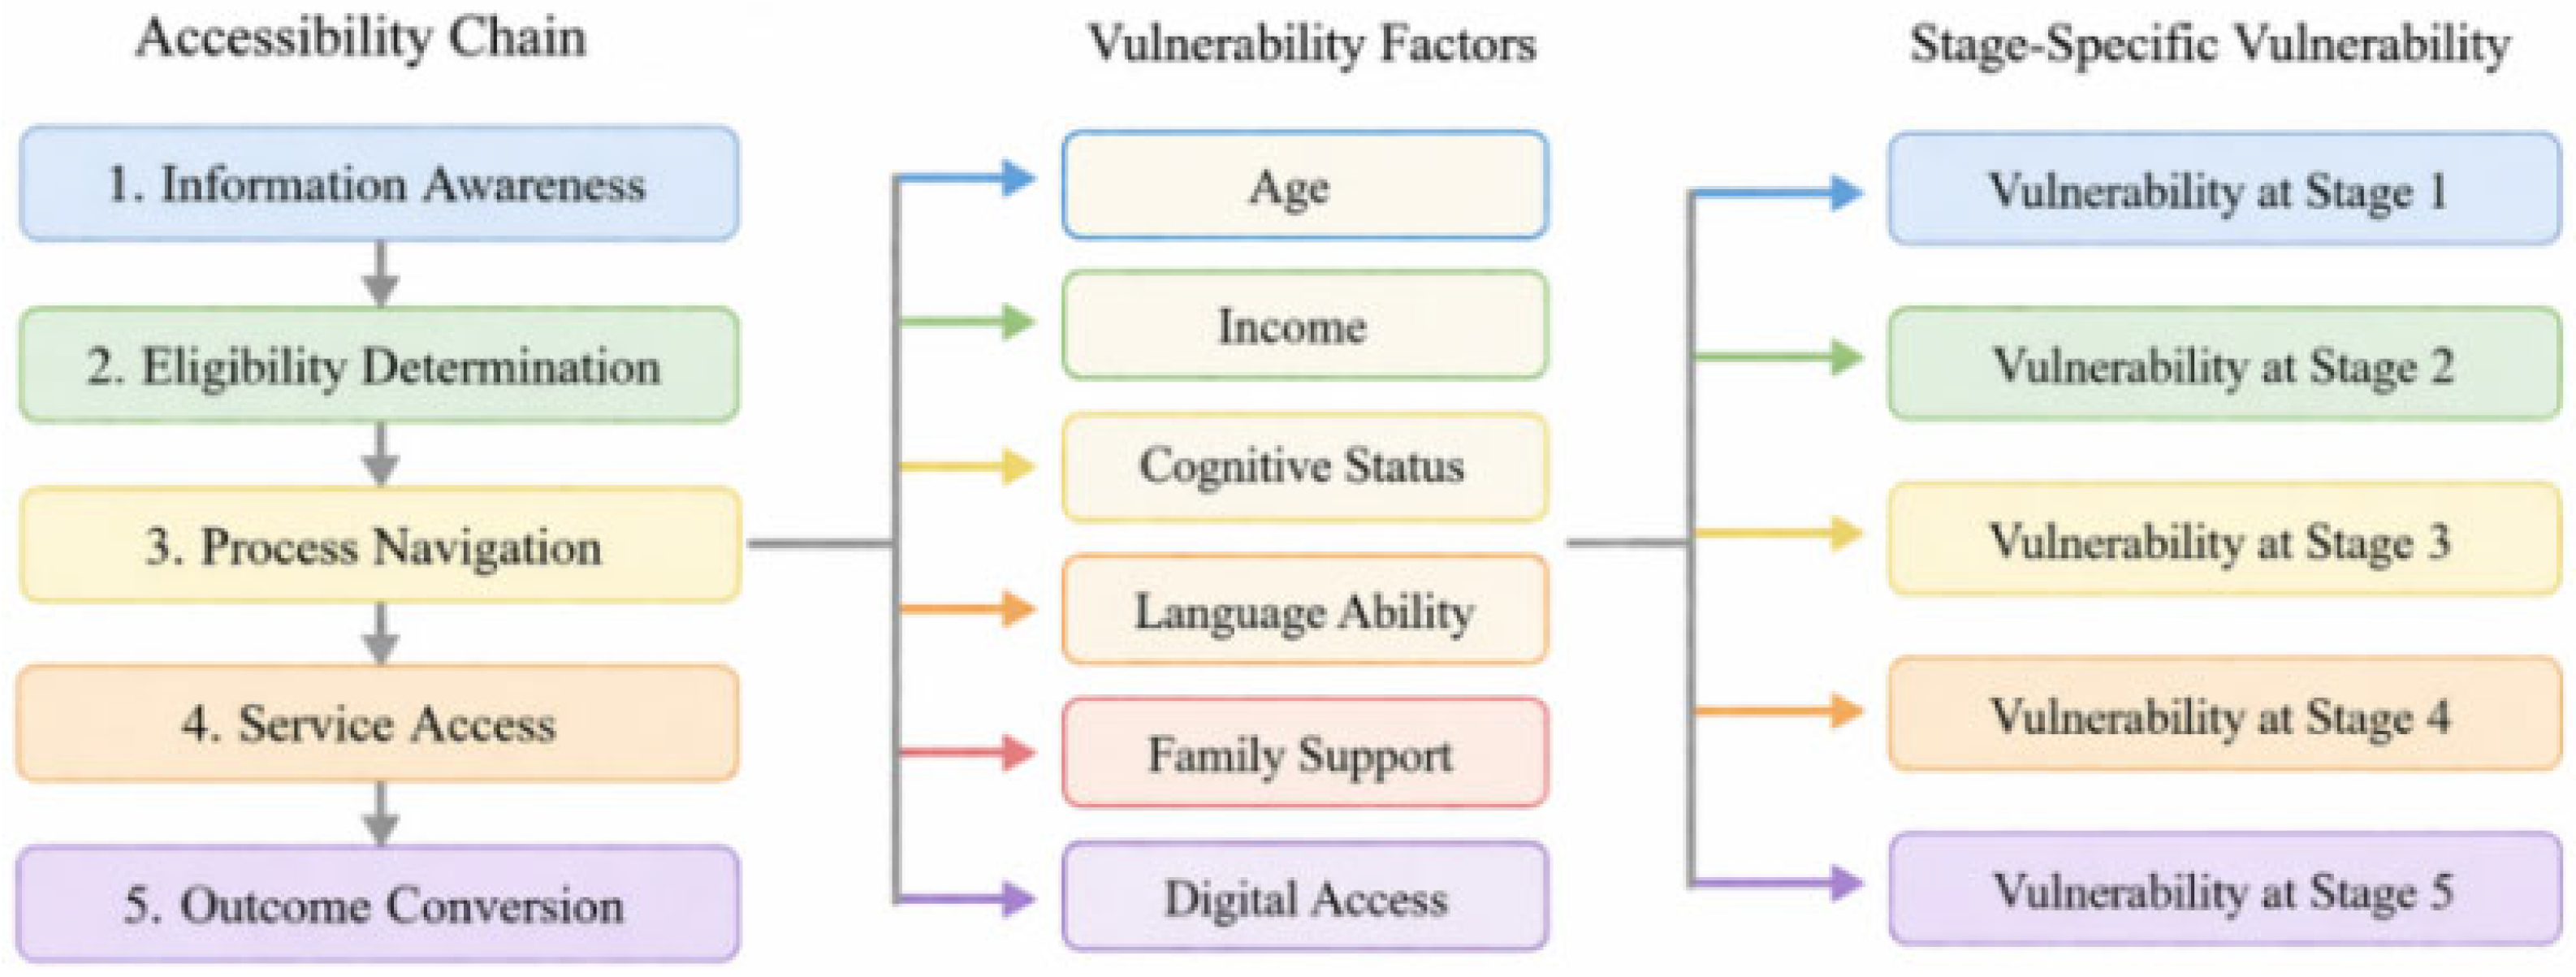
Figure 3.
Probability Distribution of Latent Categories.
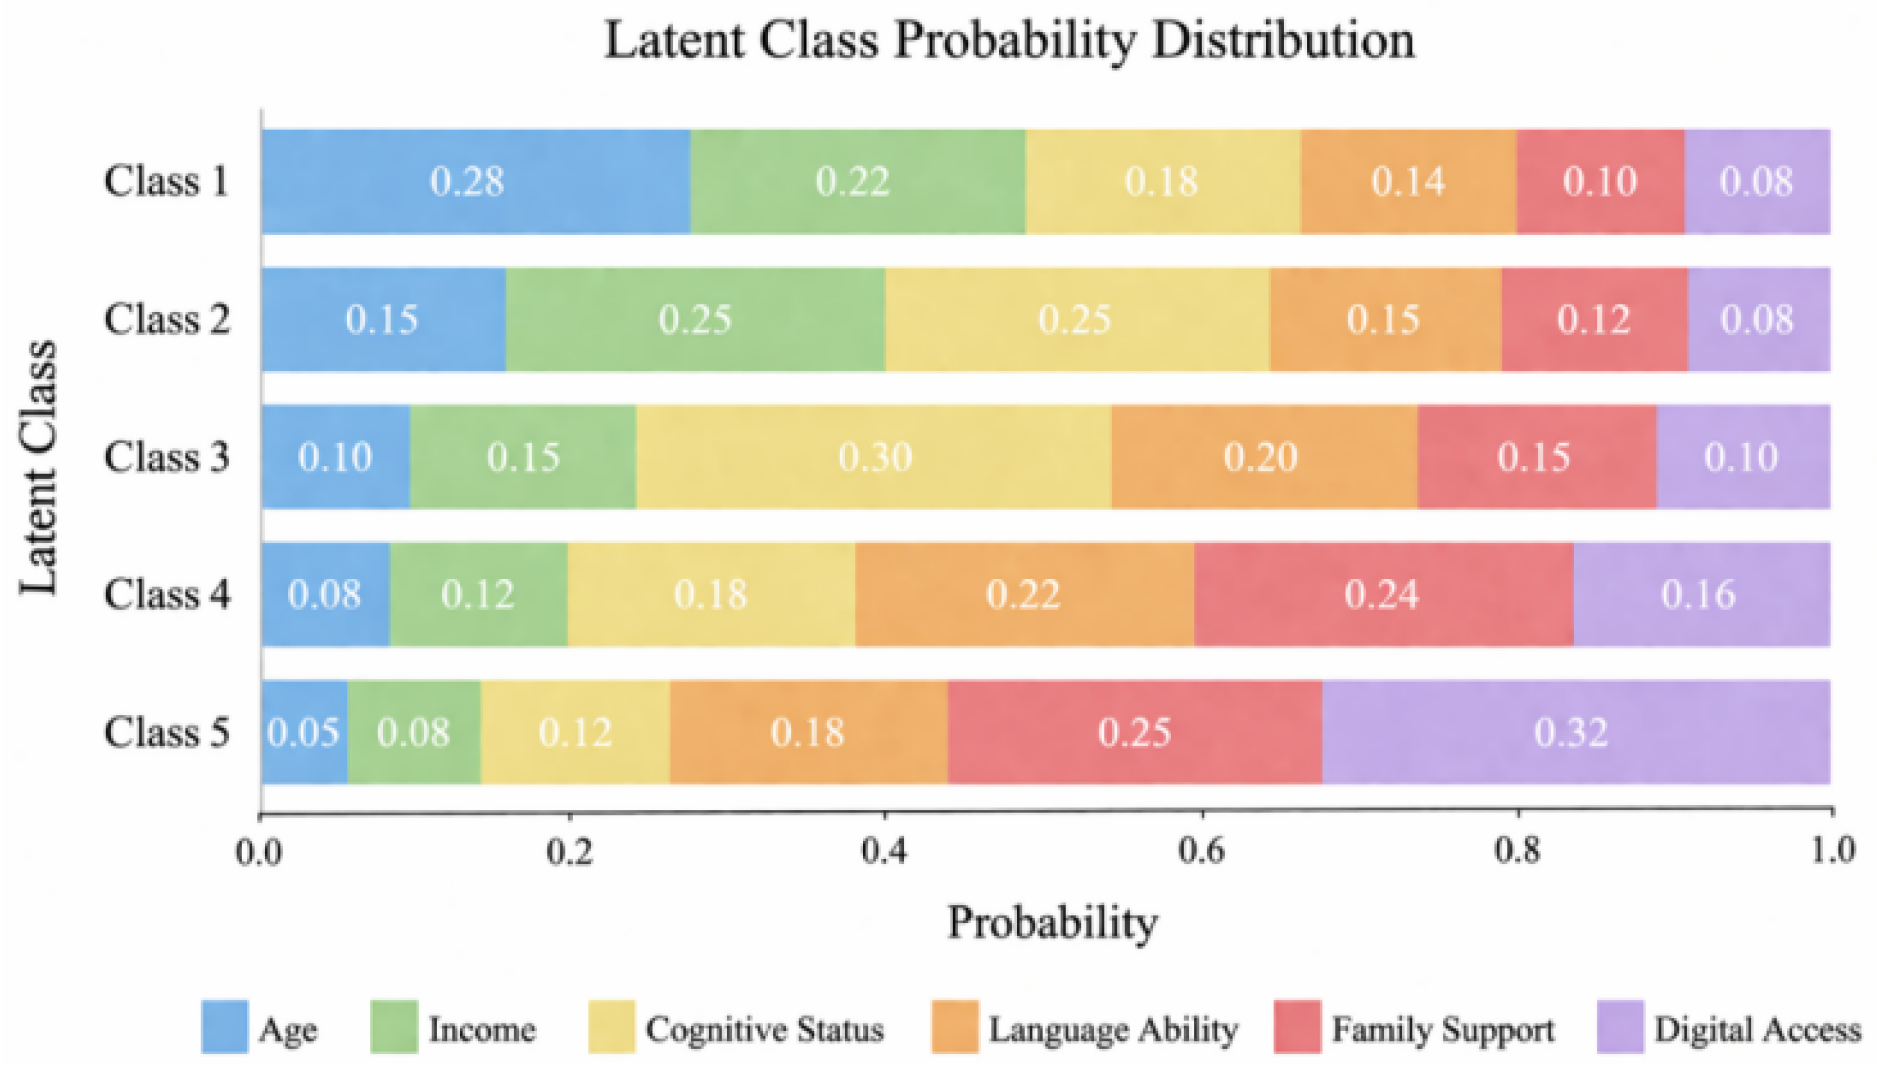
Figure 4.
Stage-wise Accessibility Dropout.
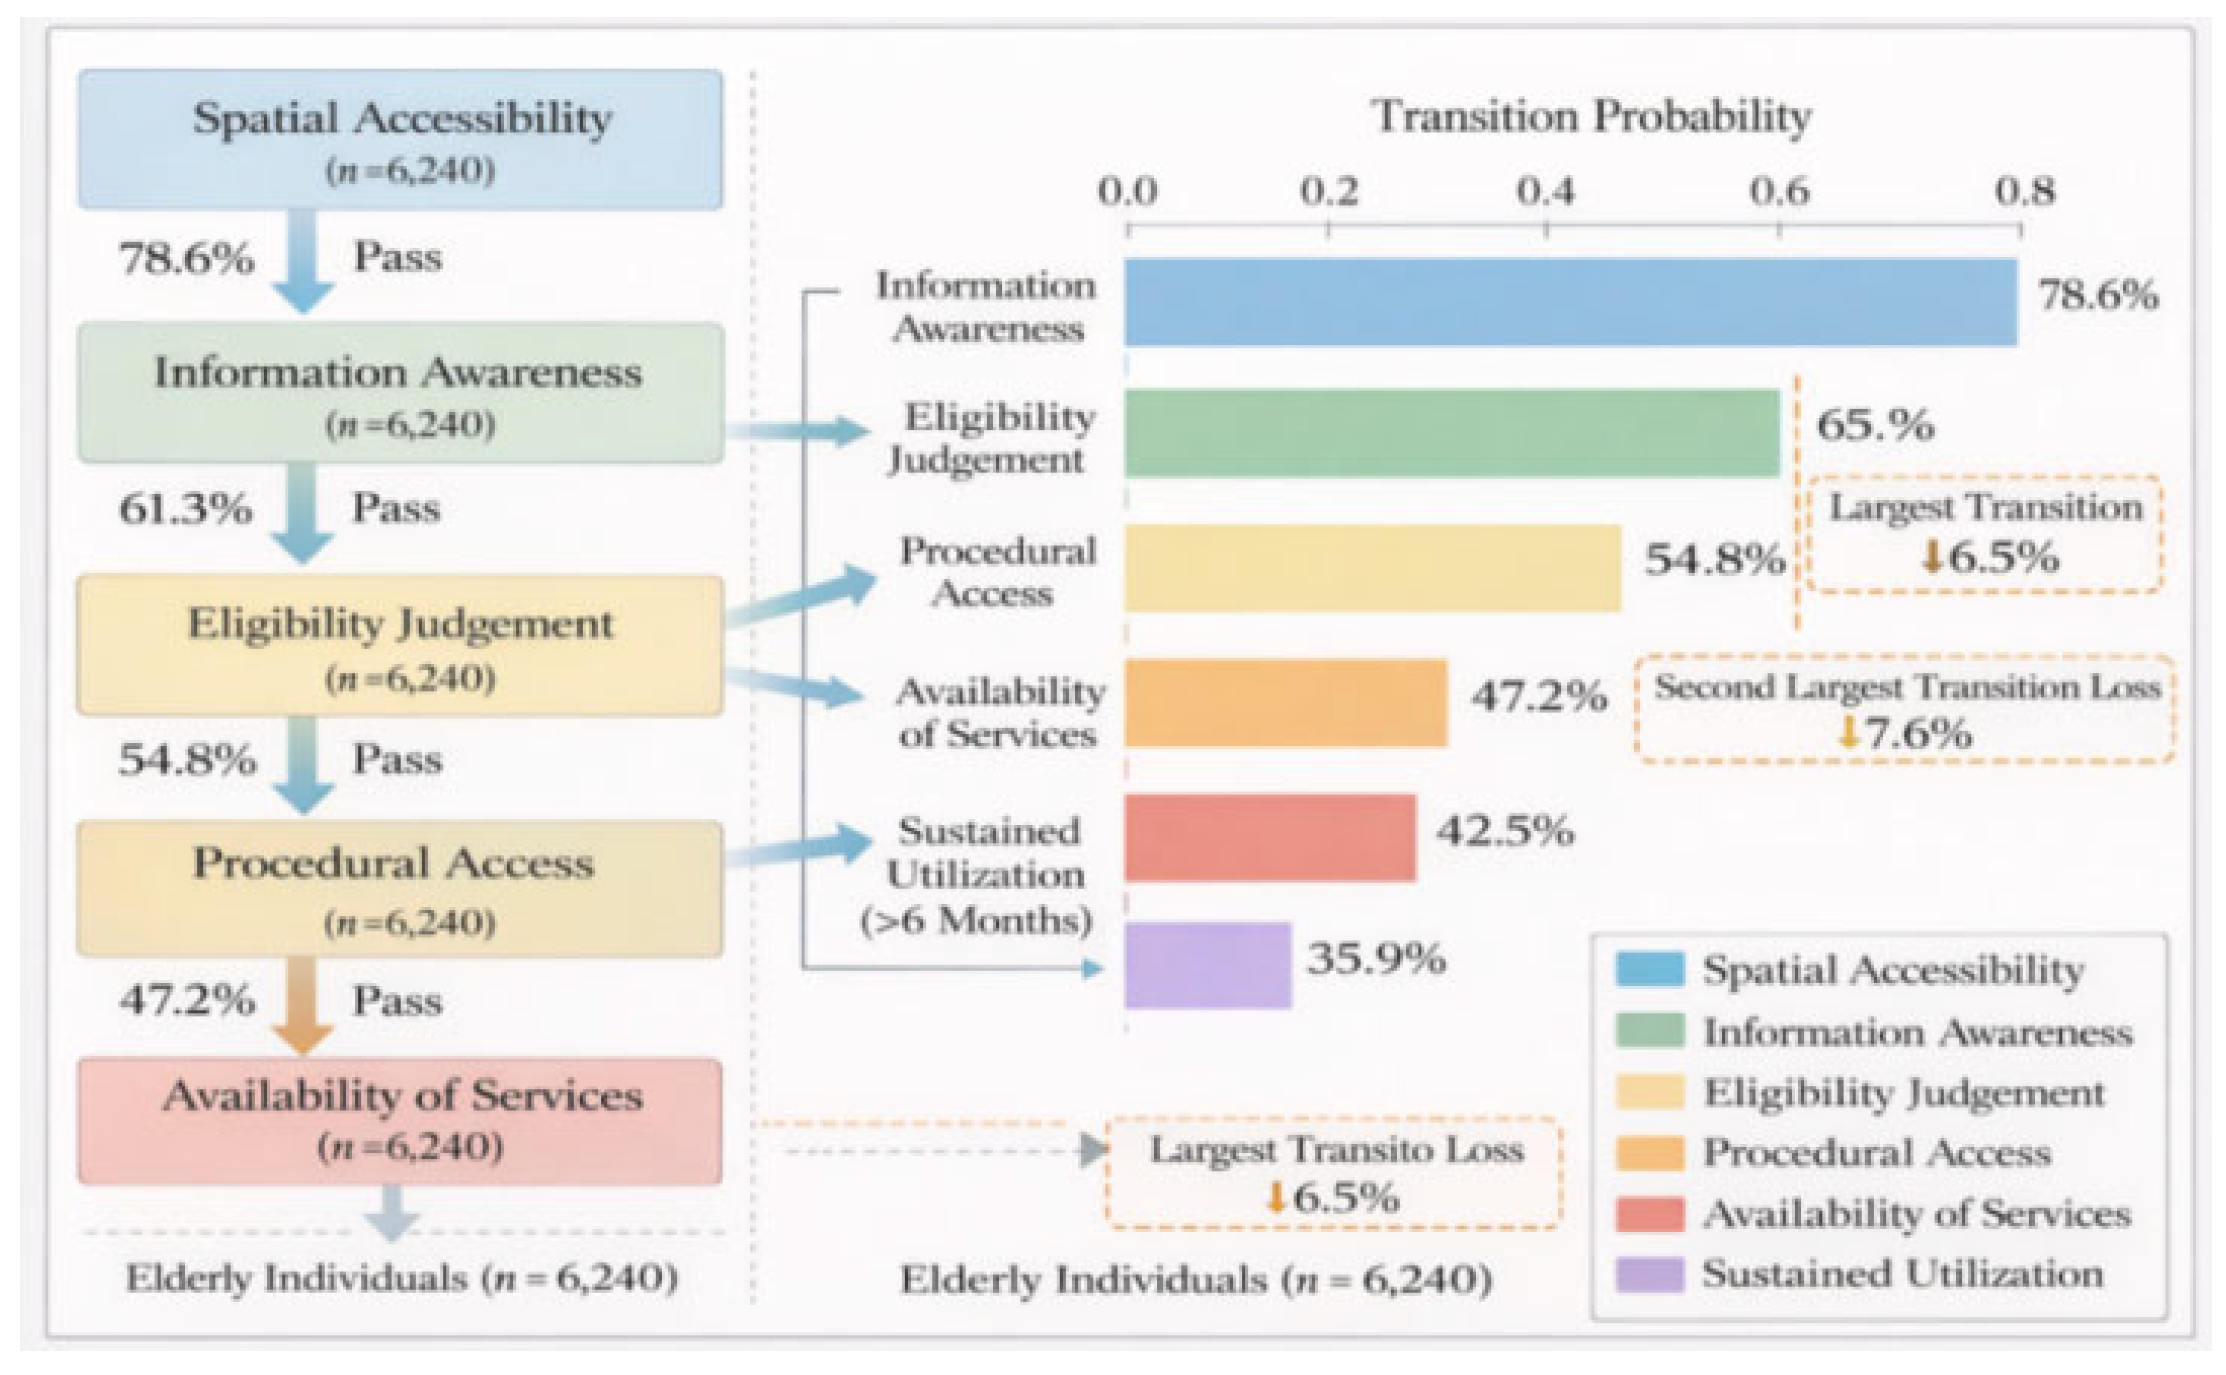
Figure 5.
Cross-Vulnerability Effects.
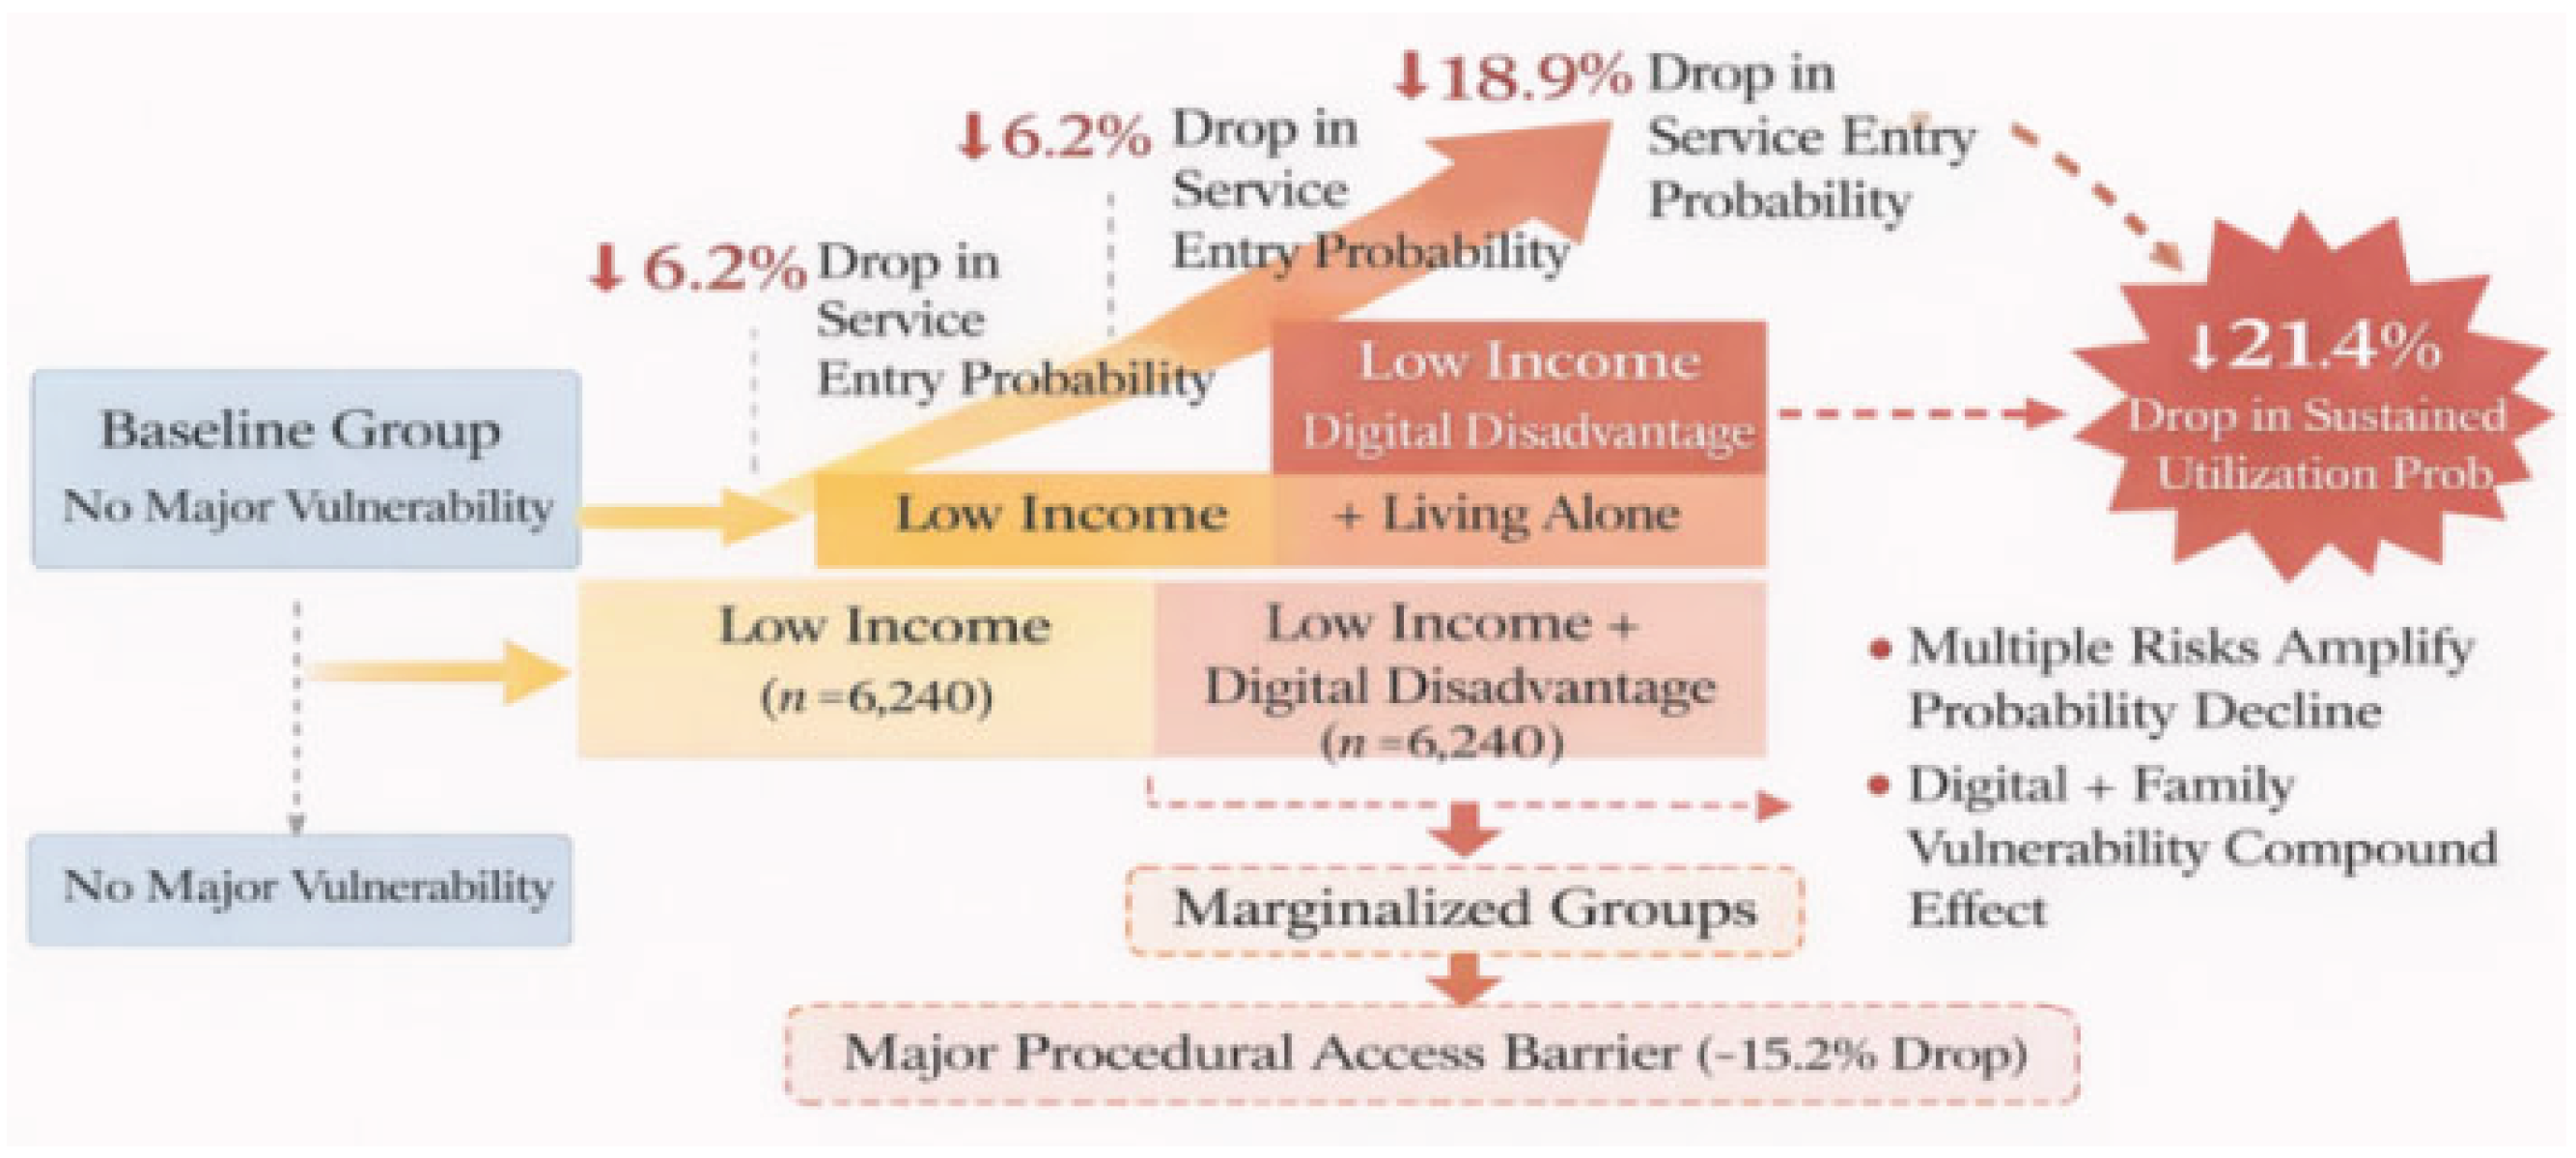

Table 1.
Model Performance Comparison.
| Model | AUC | F1-score | Accuracy | Log-loss |
| Model A: Spatial accessibility only | 0.681 | 0.642 | 0.658 | 0.612 |
| Model B: Spatial + individual features | 0.742 | 0.701 | 0.719 | 0.558 |
| Model C: Full stage-coupled model | 0.811 | 0.768 | 0.782 | 0.497 |
| Model C w/o road-network graph | 0.776 | 0.735 | 0.748 | 0.526 |
| Model C w/o vulnerability embedding | 0.759 | 0.721 | 0.732 | 0.541 |
| Model C w/o stage coupling | 0.748 | 0.709 | 0.724 | 0.552 |
Disclaimer/Publisher’s Note: The statements, opinions and data contained in all publications are solely those of the individual author(s) and contributor(s) and not of MDPI and/or the editor(s). MDPI and/or the editor(s) disclaim responsibility for any injury to people or property resulting from any ideas, methods, instructions or products referred to in the content. |
© 2026 by the authors. Licensee MDPI, Basel, Switzerland. This article is an open access article distributed under the terms and conditions of the Creative Commons Attribution (CC BY) license (http://creativecommons.org/licenses/by/4.0/).
Copyright: This open access article is published under a Creative Commons CC BY 4.0 license, which permit the free download, distribution, and reuse, provided that the author and preprint are cited in any reuse.