
Submitted:
21 May 2026
Posted:
21 May 2026
You are already at the latest version
Abstract
Metabolic syndrome (MetS) arises from widespread insulin resistance (IR) and endoplasmic reticulum (ER) stress caused by lipid accumulation in metabolic tissues. This study investigates the multi-organ therapeutic effects of Schisandrin B (Sch B), a bioactive compound from Schisandra chinensis, on diet-induced MetS in mice. Over eight weeks, Sch B treatment (10 and 30 mg/kg) effectively counteracted high-fat diet (HFD)-induced weight gain, increased fat mass, high blood sugar, and systemic inflammation (measured by plasma TNF-α). It also significantly improved markers of systemic insulin sensitivity, such as HOMA-IR, QUICKI, and Adipo-IR. Mechanistically, Sch B normalized insulin-stimulated Akt phosphorylation (at Thr308 and Ser473) and reduced lipotoxic ER stress across the liver, adipose tissue, and muscle. This reduction in ER stress was indicated by decreased glucose-regulated protein 78 (GRP78) expression. Additionally, Sch B ameliorated inter-organ endocrine imbalances by improving the plasma adiponectin-to-leptin ratio and lowering plasma levels of harmful hepatokines like FGF21, LECT2, and FGL1. Importantly, these systemic metabolic benefits correlated with increased expression of the active, spliced form of X-box binding protein 1 (XBP-1s) in muscle and adipose tissues. These findings establish Sch B as a powerful, multi-target natural compound that can reverse obesity-related metabolic dysfunction, with non-canonical XBP-1s activation appearing as a key mechanism of its therapeutic action.
Keywords:
Schisandrin B
; metabolic syndrome
; insulin resistance
; endoplasmic reticulum
; spliced form of X-box binding protein 1
1. Introduction
Metabolic syndrome (MetS), a constellation of obesity, dyslipidemia, hypertension, and hyperglycemia, significantly elevates the risk for cardiovascular disease, metabolic dysfunction-associated steatotic liver disease (MASLD, formally named as non-alcoholic fatty liver disease (NAFLD)), and type 2 diabetes mellitus (T2DM) [1]. Affecting an estimated 12.5–31.4% of adults globally, MetS prevalence mirrors the alarming rise in T2DM [2]. Insulin resistance (IR) is the unifying pathological mechanism underlying MetS and T2DM, serving as both a predictive marker and a critical therapeutic target [3,4]. IR manifests as impaired insulin signaling in crucial organs such as skeletal muscle, adipose tissue, and the liver, leading to defective glucose uptake and suppressed hepatic glucose production [5]. This often progresses from prediabetes to overt hyperglycemia due to compensatory hyperinsulinemia and eventual β-cell failure [5]. While genetic factors contribute, modern lifestyles – characterized by energy-dense diets and sedentary behavior – are major environmental drivers of IR [6]. Chronic glucolipotoxicity, a hallmark of MetS, induces cellular damage through oxidative and ER stress, inflammation, and mitochondrial dysfunction, all compromising insulin signaling pathways. High-fat diet (HFD) rodent models, particularly in obesity-prone strains, accurately recapitulate the metabolic dysregulation of human MetS, including IR, hepatic steatosis, and inflammation, making them ideal for studying the disease progression [7,8]. Central to insulin signaling is protein kinase B (Akt), which mediates glucose and lipid homeostasis in metabolic tissues [9]. HFD models are characterized by impaired insulin-stimulated Akt phosphorylation, reflecting lipid-induced IR [9,10].
Schisandrin B (Sch B), a bioactive compound from the fruit of Schisandra chinensis, shows promise for metabolic disorders, demonstrating benefits in mitigating hepatic steatosis, lowering glucose, and reducing ER stress in NAFLD models [12], and regulating lipid metabolism in adipose tissue [13]. However, current research on Sch B primarily focuses on isolated systems or individual tissues, leaving its systemic inter-organ effects unexplored. Specifically, no study has investigated the simultaneous impact of Sch B on ER stress and the restoration of Akt signaling across the liver-adipose-muscle axis in vivo. To address this critical gap, this study utilizes an HFD mouse model to systematically elucidate how Sch B improves tissue-specific insulin sensitivity, alleviates lipotoxic ER stress, and rescues Akt phosphorylation, aiming to define its potential as a multi-target intervention for obesity-induced insulin resistance.
2. Results
2.1. Effects of Sch B/ Met on Body Weight in ND-Fed and HFD-Fed Mice
Changes in body weight over 8 weeks were recorded and plotted in a graph with % initial body weight against increasing weeks. Figure 1a shows that in mice fed a Normal Diet (ND), body weight increased by 10%. Both Sch B (30 mg/kg) and Met treatments completely prevented this weight gain. Mice on an HFD experienced a substantial weight gain, 2.4 times greater than that observed in ND-fed mice. Sch B demonstrated a dose-dependent effect, reducing HFD-induced weight gain by 24% at a dose of 10 mg/kg and by 34% at 30 mg/kg. Met (250 mg/kg) also effectively counteracted HFD-induced weight gain, achieving a 33% inhibition (Figure 1b).
Notably, the observed weight gain in HFD-fed mice was not a consequence of increased food consumption, as these groups actually consumed less food than the ND groups. Sch B treatment did not alter food intake in HFD mice, indicating its weight-reducing effect was independent of appetite suppression (data not shown, Table S1 in supplementary materials).
2.2. Effects of SchB/ Met on Fat Pad Indices in ND-Fed and HFD-Fed Mice
HFD significantly increased posterior subcutaneous, epididymal, and mesenteric fat indices by 272, 140, and 213%, respectively. In HFD-fed mice, Sch B treatment (10 and 30 mg/kg) significantly reduced posterior subcutaneous and mesenteric fat by 57 and 34% at 10 mg/kg; by 54 and 42% at 30 mg/kg, respectively; notably 30 mg/kg Sch B treatment also lowered epididymal fat by 21%, leading to an 18 and 38% reduction in total fat mass. Met also significantly decreased HFD-induced fat mass gain in all three fat pads, resulting in a 65% reduction in total fat mass. Neither treatment affected fat pads in ND mice (Figure 2a & b).
2.3. Effects of SchB/ Met on Glycated Hemoglobin (HbA1c) and Fasting Plasma Glucose Levels, and Lipid Contents in ND-Fed and HFD-Fed Mice
Feeding mice an HFD led to a significant increase in HbA1c levels, rising by 20-32% compared to their ND controls (Figure 3a, b). Similarly, HFD significantly elevated fasting plasma glucose levels by approximately 27% compared to the respective ND controls (Figure 3c, d).
Sch B demonstrated a dose-dependent effect on reversing the HFD-induced increase in HbA1c, reducing it by 22-38% (Figure 3a). At a dose of 30 mg/kg, Sch B significantly inhibited the HFD-induced elevation in fasting plasma glucose by 61% (Figure 3c). Met effectively reversed the HFD-induced increases in both HbA1c and fasting plasma glucose. It reduced HbA1c by 45% and fasting plasma glucose by 100% (Figure 3b, d), indicating complete normalization of fasting glucose levels in this context.
Compared to the ND controls, HFD feeding significantly increased plasma TG by 37%, TC by about 31%, and NEFA by 15% (Figure 4). Sch B did not suppress the HFD-induced elevations in plasma TG and TC levels. However, at a dose of 30 mg/kg, Sch B completely inhibited the HFD-induced increase in plasma NEFA levels in HFD-fed mice (Figure 4e). Met demonstrated a broad inhibitory effect on HFD-induced lipid dysregulation. It reduced elevated plasma TC, TG, and NEFA levels by 75, 100, and 56%, respectively (Figure 4b, d, f), indicating significant improvements in lipid profiles.
The TyG index, calculated using plasma glucose and TG, serves as a biomarker for early-stage insulin resistance and metabolic dysregulation driven by lipotoxicity and glucotoxicity. Table 1 shows that HFD feeding significantly increased the TyG index. Both Sch B and Met effectively suppressed this elevation, indicating a positive impact on insulin sensitivity.
2.4. Effects of SchB/ Met on Fasting Plasma Insulin Level and HOMA-IR in ND-Fed and HFD-Fed Mice
In mice fed an HFD, fasting plasma insulin levels were significantly elevated, approximately 9-12 fold higher than in control mice fed with ND (Figure 5a-b). Sch B treatment partially reversed this HFD-induced hyperinsulinemia, reducing fasting plasma insulin levels by about 72-76% (Figure 5a). Met, however, completely normalized the elevated fasting insulin levels in HFD-fed mice (Figure 5b). Importantly, neither Sch B nor Met altered basal fasting plasma insulin levels in ND-fed mice (Figure 5).
Insulin resistance was assessed using the HOMA-IR index, a well-established measure derived from fasting glucose and insulin. Consistent with the elevated fasting glucose and insulin levels, HFD feeding significantly increased HOMA-IR. Both Sch B and Met reduced HOMA-IR (by 70-80 and 92%, respectively) (Figure 5c-d), indicating improved insulin sensitivity.
2.5. Effects of Sch B/ Met on Oral Glucose Tolerance in ND-Fed and HFD-Fed Mice
Beyond measuring HbA1c, fasting plasma glucose, and HOMA-IR, oral glucose tolerance tests (OGTT) were performed. The HFD induced a 46-68% increase in glucose intolerance (Figure 6). Treatment with Sch B and Met partially corrected this HFD-induced glucose intolerance, reducing it by 37-68 and 74%, respectively.
2.6. Effects of Sch B at 30 mg/kg on Oral Glucose Tolerance with Parallel Plasma Insulin Level in ND-Fed and HFD-Fed Mice
In mice fed an HFD, oral glucose administration initially led to a surge in insulin levels (Figure 7c, d). However, in these HFD-fed mice, insulin levels subsequently declined over time, even as blood glucose remained elevated (Figure 7a,c). In contrast, HFD-fed mice treated with Sch B exhibited a similar initial insulin surge following glucose administration, but their insulin and blood glucose levels then decreased in a coordinated manner (Figure 7).
2.7. Effects of Sch B on Intraperitoneal Glucose Tolerance in ND-Fed and HFD-Fed Mice
HFD induced significant glucose intolerance in mice, as evidenced by a sharp rise in blood glucose 30 minutes after intraperitoneal glucose injection and persistently high levels at 120 minutes (Figure 8a). Treatment with Sch B at 30 mg/kg improved glucose tolerance by accelerating the decline of blood glucose after the initial peak at 30 minutes (Figure 8).
2.8. Effects of Sch B/ Met on Plasma TNF-α Level in ND-Fed and HFD-Fed Mice
HFD feeding significantly elevated plasma TNF-α levels by 165-202% in mice (Figure 9). Subsequent treatment with either Sch B or Met effectively restored plasma TNF-α levels to normal.
2.9. Effects of Sch B/ Met on QUICKI and Adipo-IR in ND-Fed and HFD-Fed Mice
QUICKI is an indirect measure of insulin sensitivity. In the HFD-fed control group, the QUICKI value was significantly decreased by approximately 30% compared to the ND-fed control group, indicating insulin insensitivity. Both Sch B and Met treatments restored the QUICKI value in HFD-fed mice by approximately 30-42 and 67%, respectively (Table 2a).
2.10. Effects of SchB/ Met on Plasma Adipokine Levels in ND-Fed and HFD-Fed Mice
Adipocytes respond to fasting and feeding by secreting adipokines such as leptin and adiponectin, which are crucial for regulating systemic lipid metabolism. Leptin, primarily signaling energy sufficiency and controlling food intake, also directly influences lipid metabolism. HFD feeding in mice led to elevated plasma leptin levels (Table 3). Treatment with Sch B significantly attenuated this HFD-induced leptin increase by 72% (Table 3a), whereas Met restored plasma leptin levels to baseline (Table 3b).
Adiponectin plays a vital role in systemic energy metabolism, enhancing insulin sensitivity, and providing protection against inflammation and oxidative stress. HFD feeding reduced plasma adiponectin levels by approximately 17%. Met, but not Sch B, effectively restored adiponectin levels to normal (Table 3).
2.11. Effects of Sch B / Met on Plasma Hepatokine Levels in ND-Fed and HFD-Fed Mice
Hepatokines FGF21, LECT2, and FGL1 play a critical role in cross-organ signaling, regulating energy homeostasis and systemic insulin sensitivity. In mice fed an ND, neither Sch B nor Met treatment altered plasma levels of FGF21, LECT2, or FGL1. Conversely, HFD feeding significantly elevated plasma FGF21 by approximately 360%, LECT2 by ~101%, and FGL1 by ~112% (Figure 10). Treatment with Sch B markedly attenuated these HFD-induced elevations, reducing plasma hepatokine levels by 41-70% (Figure 10a, c, e). Met demonstrated a more pronounced suppressive effect on these HFD-induced increases (Figure 10b, d, and f).
2.12. Effects of Sch B/ Met on Hepatic Lipid Contents in ND-Fed and HFD-Fed Mice
Neither Sch B nor Met treatment affected hepatic cholesterol (TC) and triglyceride (TG) levels in ND-fed mice (Figure 11). However, HFD feeding significantly increased hepatic TC by approximately 35% compared to the ND control (Figure 11a and b). Both Sch B (30 mg/kg) and Met treatments effectively counteracted this HFD-induced TC elevation, reducing it by 21% and 22%, respectively, to a similar extent when compared to untreated HFD mice (Figure 11a and b). HFD also markedly raised hepatic TG levels, by 66-92% (Figure 11c and d). In HFD-fed mice, both Sch B and Met significantly reduced these elevated hepatic TG levels, by 38 and 30%, respectively (Figure 11c and d).
2.13. Effects of Sch B on pAkt and Total Akt Expressions from Different Tissue Lysates in ND-Fed and HFD-Fed Mice
To understand how Sch B improves glucose tolerance and insulin sensitivity at a molecular level, we examined the levels of total Akt and its activated forms (phosphorylated Akt, or p-Akt) in key metabolic tissues.
Posterior Subcutaneous Fat
After eight weeks, mice fed an HFD showed a significant decrease in the activated forms of Akt (p-Akt at Thr308 and Ser473) by 29 and 27%, respectively, compared to ND-fed mice. While total Akt levels slightly increased but not significantly, Sch B treatment at 30 mg/kg fully restored these reduced p-Akt levels in HFD-fed mice (Figure 12a and b).
Skeletal Muscle
In mice on an ND, Sch B treatment decreased p-Akt at Thr308 by 27% without affecting total Akt or p-Akt at Ser473. Conversely, the HFD increased total Akt by 44% while reducing p-Akt at Ser473 by 15%, with no change in p-Akt at Thr308. Under HFD conditions, Sch B treatment did not significantly alter any of the Akt measurements compared to HFD-fed mice without treatment (Figure 12 c and d).
Liver
Sch B treatment had no impact on Akt levels in ND-fed mice. However, the HFD led to a substantial 157% increase in total Akt expression in the liver. Simultaneously, HFD feeding reduced activated Akt (p-Akt) at both Thr308 and Ser473 sites by 31 and 49%, respectively, compared to ND-fed controls. Sch B treatment did not change total or p-Akt levels in the liver of HFD-fed mice compared to their untreated HFD counterparts.
2.14. Effects of Sch B on pAkt Expressions from Different Tissues After Glucose Intake in ND-Fed and HFD-Fed Mice
The responsiveness of Akt phosphorylation(s) after glucose intake reflects the insulin sensitivity status of the tissue.
Time-course analysis revealed that in ND-fed mice, Akt phosphorylation at Thr308 peaked 15 min after glucose administration and returned to baseline levels by 30 minutes. Both Sch B treatment and HFD feeding significantly elevated basal (0 min) pAkt (Thr308) levels compared to ND controls. Under ND conditions, Sch B treatment preserved this temporal response, with Akt phosphorylation still reaching its maximum extent at 15 minutes post-glucose intake. However, despite initially high basal pAkt (Thr308) levels in HFD mice, subsequent glucose administration failed to enhance phosphorylation; instead, levels decreased relative to baseline. Although Sch B administration in HFD-fed mice similarly lacked a dynamic temporal response to glucose, p-Akt (Thr308) levels remained constitutively high throughout the entire observation period (Figure 13b).
In ND-fed control mice, phosphorylation at another Akt site, Ser473, exhibited a similar temporal pattern as compared to that of Akt (Thr308) following glucose intake. Sch B treatment did not alter these changes in ND-fed mice. Under HFD feeding, the temporal pattern for p-Akt (Ser473) mirrored the declining trend observed for pAkt (Thr308) post-glucose administration, albeit the differences were statistically significant. Interestingly, in contrast to the constitutively high p-Akt (Thr308) levels being maintained in Sch B-treated HFD-fed mice, p-Akt (Ser473) levels progressively decreased over the observation period compared to their initial baseline value (Figure 13c).
Similar to the observations in subcutaneous fat, skeletal muscle from ND-fed mice exhibited a temporal increase in Akt phosphorylation at Thr308, though the peak at 15 min post-glucose administration, it was less pronounced relative to baseline. Sch B treatment in ND-fed mice preserved this dynamic response pattern. While HFD feeding elevated basal p-Akt (Thr308) expression, subsequent glucose administration elicited only a marginal further increase. In contrast, although the Sch B-treated HFD mice also displayed a high initial p-Akt (Thr308) level, the glucose challenge significantly stimulated further Akt phosphorylation at 15 min, which then returned to baseline by the 30-min time point (Figure 13e).
While basal p-Akt (Ser473) expression was elevated in the Sch B, HFD, and HFD + Sch B groups compared to the baseline value of ND-fed mice, none of these groups exhibited the post-glucose administration induced change (Figure 13f).
In contrast to subcutaneous fat and skeletal muscle, Akt phosphorylation in liver tissue exhibited a completely different profile following glucose administration, lacking any observable temporal response. Furthermore, under ND conditions, Sch B treatment significantly decreased basal p-Akt (Ser473) levels, whereas under HFD feeding, it elevated baseline phosphorylation at both Akt sites (Figure 13h and i).
2.15. Effects of Sch B on GRP78 and XBP-1s Expression from Different Tissues in ND-Fed and HFD-Fed Mice
As shown in Figure 14a and c, HFD feeding led to a significant increase in GRP78 levels in both subcutaneous fat and the liver. This suggests that the excess lipids in the diet caused ER stress in these tissues. Treatment with Sch B reversed these increases, bringing GRP78 levels back to normal (control levels). This indicates that Sch B helped to reduce the ER stress caused by the HFD. In contrast to fat and liver, HFD feeding actually decreased GRP78 expression in skeletal muscle (Figure 14c). Sch B treatment did not change this observed decrease in skeletal muscle.
In subcutaneous fat and skeletal muscle, XBP-1s levels were significantly higher only in the HFD-fed mice that also received Sch B treatment. In the liver, both the HFD-fed mice (even without Sch B) and the HFD-fed mice treated with Sch B showed higher XBP-1s levels compared to ND-fed mice (Figure 15).
3. Discussion
Overnutrition is the primary driver of metabolic syndrome (MetS), characterized by a pathological constellation of overweight, dyslipidemia, hyperglycemia, and glucose intolerance [1]. To model this human condition, we utilized an HFD in mice to induce obesity and insulin resistance over 8 weeks [7,8]. This model effectively recapitulated MetS, evidenced by significant alterations in body weight and blood parameters.
Key indicators of MetS in our HFD-fed mice included impaired glucose homeostasis and systemic insulin resistance. Elevated HbA1c and fasting glucose levels pointed to compromised hepatic glucose regulation [14]. Concurrently, indices like the TyG index (fasting TG and glucose) [15,16], HOMA-IR, and QUICKI [17] confirmed widespread insulin resistance across multiple tissues. Specifically, the increased TyG index suggested dysregulation of glucose and lipid metabolism [15,16], while the inverse trends in QUICKI and HOMA-IR further supported systemic insulin resistance [17]. The elevated Adipo-IR indicated that adipose tissue insulin resistance was a potentially early event in this HFD-induced model [18,19].
Treatment with Sch B effectively suppressed or delayed the development of MetS in these mice, demonstrating a particular efficacy in mitigating insulin resistance. Its effects were comparable to Met, an established therapeutic for MetS. To further elucidate Sch B's impact, we employed both oral glucose tolerance tests (OGTT) with insulin measurements, which assess insulin sensitivity, and intraperitoneal glucose tolerance tests (IPGTT), which specifically evaluate insulin-independent glucose disposal (termed glucose effectiveness) [20,21]. Glucose effectiveness plays a critical role in maintaining basal glucose homeostasis during fasting or resting states by facilitating glucose-mediated suppression of hepatic glucose production and enhancing glucose uptake. Impaired IPGTT in HFD-fed mice indicated compromised glucose effectiveness, likely manifesting as increased hepatic glucose output or reduced basal tissue glucose uptake [20,21]. The significant rescue of IPGTT by Sch B treatment suggests that, in addition to its effects on insulin sensitivity, Sch B positively modulates hepatic glucose metabolism through insulin-independent pathways. The greater degree of IPGTT rescue compared to OGTT by Sch B under HFD conditions may be linked to its potential as a GLP-1R agonist, which can stimulate insulin secretion [22]. This suggests that Sch B's improvement in IPGTT reflects a combination of enhanced glucose effectiveness and preserved insulin-independent control of hepatic glucose flux.
Our observation that Sch B reduced hepatic TG and TC without normalizing plasma TG aligns with prior lipidomic findings [23]. In the HFD state, circulating plasma TG is primarily influenced by dietary fat intake and chylomicron delivery, rather than hepatic de novo lipogenesis [24]. Therefore, while Sch B effectively combats hepatic steatosis by inhibiting SREBP-1/FAS-mediated lipogenesis and promoting local lipid clearance [25,26,27], this mechanism is insufficient to overcome the high dietary TG load in the systemic circulation. Despite elevated plasma TC and TG levels, the beneficial effects of Sch B under HFD challenge are promising. Taken together, these findings raise crucial questions: Which tissues are most significantly affected by the HFD, and does Sch B alleviate these abnormalities by modulating specific insulin signaling pathways?
HFD triggers a detrimental glycolipid cycle driven by the disruption of the Akt signaling pathway in insulin-sensitive tissues [28]. This cycle begins with an oversupply of dietary fat, leading to adipose tissue hypertrophy and inflammation [30]. These changes impair the IRS-1/PI3K/Akt signaling cascade, weakening the normal suppression of lipolysis by insulin. Consequently, circulating FFAs increase [8].
These elevated FFAs accumulate in skeletal muscle and liver, forming diacylglycerols (DAGs) and ceramides. These lipid species activate protein kinase C epsilon/ zeta (PKCε/ ζ) and stress kinases, which further inhibit Akt activation by promoting the serine phosphorylation of IRS-1 [30,31]. This impaired Akt signaling has broad metabolic consequences, including reduced GLUT4 translocation and hindrance of glucose uptake in skeletal muscle [32]. Inefficient suppression of lipolysis, perpetuating FFA release in adipose tissue, and deregulation of FOXO1/GSK3β-mediated gluconeogenesis, leading to excessive glucose production in the liver [33,34,35]. The resulting hyperglycemia, hyperlipidemia, and ectopic fat deposition create a feedback loop, intensifying lipid toxicity and further inhibiting the Akt pathway. This self-perpetuating imbalance establishes systemic insulin resistance [32,33,34,35].
HFD significantly reduced the ratio of phosphorylated Akt (p-Akt) to total Akt in subcutaneous adipose tissue. This indicates insulin signaling inefficiency at or upstream of Akt activation. This finding aligns with evidence that HFD-induced hyperinsulinemia disrupts IRS-1/PI3K signaling, leading to impaired Akt phosphorylation and dysregulated lipolysis [36,37]. Treatment with Sch B fully restored these p-Akt/total Akt ratios to levels seen in ND-fed controls. This adipose-specific rescue effectively suppressed lipolysis, which is the primary upstream trigger for the FFA overflow that initiates the glycolipid cycle [37]. This suppression of lipolysis correlated directly with the observed reduction in plasma NEFAs after Sch B administration in HFD-fed mice, suggesting the role of Sch B in improving insulin responsiveness in adipose tissue and acting as an insulin sensitizer. In contrast to adipose tissue, the classic p-Akt/total Akt ratio was not a reliable indicator of insulin signaling in skeletal muscle and liver under HFD. This was due to HFD-induced increases in total Akt protein levels in these tissues, a characteristic adaptation to chronic metabolic stress [38,39,40]. However, analysis of absolute p-Akt levels (p-Akt normalized to β-actin) revealed distinct insights [39]: (1) Both p-Akt(Thr308) and p-Akt(Ser473) were elevated in skeletal muscle and liver under HFD. This reflects preserved or augmented basal activation of Akt through PDK1 (at Thr308) and mTORC2 (at Ser473), respectively; (2) These compensatory increases, despite higher total Akt, indicate downstream Akt inefficiency [36,37,40,41]. The pathway requires hyperactivation to maintain metabolic flux in the face of partial insulin resistance. Sch B treatment normalized the balance between Ser473 and Thr308 phosphorylation and restored absolute p-Akt levels to those observed in ND-fed mice. This suggests Sch B enhances functional Akt capacity and sustains insulin signaling efficacy in HFD-challenged mice. This tissue-specific normalization by Sch B is crucial as it mitigates the maladaptive hyperinsulinemia-driven pseudo-activation, thereby breaking the glycolipid dysmetabolism cycle across adipose tissue, muscle, and liver.
HFD feeding induces significant metabolic dysregulation, characterized by ER stress, disrupted signaling pathways, and altered organ crosstalk [42]. This study demonstrates that Sch B effectively ameliorates these detrimental effects, promoting systemic adaptive remodeling. Sch B treatment alleviates HFD-induced ER stress in both adipose tissue and the liver, as evidenced by reduced GRP78 expression. This attenuation of ER stress is further supported by decreased levels of cleaved ATF6 in Sch B-treated HFD mice (data not shown). Importantly, under these conditions of reduced ER stress, Sch B treatment leads to an increase in the active, spliced form of XBP-1 (XBP-1s) in the liver. This rise in XBP-1s is concomitant with significant improvements in systemic glucose regulation and a reduction in inflammation, as indicated by lower plasma TNF-α levels. Furthermore, Sch B treatment resulted in an improved hepatic lipid profile in HFD-fed mice, as evidenced by the amelioration of hepatic lipid accumulation. These findings collectively suggest that Sch B promotes systemic adaptive remodeling, potentially by modulating non-canonical XBP-1s signaling pathways.
HFD feeding consistently elevates plasma levels of hepatokines FGF21, LECT2, and FGL1. The liver, responding to lipid overload and ER stress, secretes these signals to peripheral tissues like adipose and muscle [43,44]. This elevated hepatokine profile, however, drives maladaptive crosstalk: FGF21 attempts compensation but paradoxically signals resistance [45]; LECT2 exacerbates IR by activating JNK in muscle [46]; and FGL1 worsens hepatic steatosis and adipogenesis [47,48]. Sch B effectively reduces these three hepatokines below HFD-induced elevated levels by alleviating hepatic lipid accumulation, inflammation, and IR. The normalization of these hepatokines reflects restored sensitivity and energy homeostasis (lower FGF21), improved muscle insulin signaling (decreased LECT2), and the curbing of ERK/JNK-driven pathology across organs (reduced FGL1). This disruption of detrimental liver-peripheral crosstalk ultimately enhances systemic glucose and lipid metabolism [43,44,45,46,47,48].
In HFD-induced obesity, adipose tissue function is compromised, leading to a marked disruption of the adipokine milieu [49]. This is characterized by a robust increase in circulating leptin and a pronounced decline in adiponectin [49]. While initial hyperleptinemia might be a compensatory response, prolonged HFD exposure leads to leptin resistance [50]. Concurrently, reduced adiponectin decreases fatty acid oxidation, lipid clearance, and insulin-sensitizing signaling, aggravating metabolic deterioration [49,50]. In this study, Sch B lowered plasma leptin levels in HFD-fed mice, though it did not restore reduced adiponectin concentrations. Despite this, Sch B improved the adiponectin/leptin ratio, indicating a partial recovery of adipose endocrine function. This improvement in the ratio is biologically significant, as it is considered a more sensitive indicator of adipose tissue dysfunction and insulin resistance than individual adipokines [18]. The failure of Sch B to normalize total adiponectin may suggest its action is primarily focused on suppressing leptin excess rather than fully correcting adiponectin biosynthesis or secretion. Notably, Sch B increased XBP-1s expression in adipose tissue, which could contribute to its beneficial metabolic effects [51]. XBP-1s is known to regulate ER chaperones involved in adiponectin folding and multimerization, promoting the formation of the more insulin-sensitizing high-molecular-weight (HMW) adiponectin. The increased HMW form of adiponectin is associated with improved systemic glucose homeostasis [52]. Therefore, even without increasing total adiponectin levels, Sch B may enhance adiponectin bioactivity by favoring its multimerization into the HMW form. Collectively, these findings suggest that Sch B alleviates HFD-induced adipose dysfunction, at least in part, through modulation of the leptin axis and XBP-1s-dependent lipid metabolism. Furthermore, XBP-1s have been shown to alleviate insulin resistance by promoting GLUT4 translocation through the activation of the FGF21/PPARγ axis [53]. Notably, our data reveal that Sch B treatment successfully augmented XBP-1s expression in both adipose tissue and skeletal muscle of HFD-fed mice. This concurrent upregulation in major metabolic organs implies that Sch B might also mitigate systemic insulin resistance by promoting peripheral glucose clearance.
4. Materials and Methods
4.1. Chemicals and Reagents
Chemicals: Tris-base, glycerol, bromphenol blue, DL-dithiothreitol (DTT), N,N,N′, N′-tetramethylethylenediamine (TEMED), N, N'-Methylenebis(acrylamide), and acrylamide were purchased from Sigma-Aldrich (Burlington, MA, USA). Sodium dodecyl sulfate (SDS) was obtained from MedChemExpress (MCE; Monmouth Junction, NJ, USA). Glycine was acquired from Santa Cruz Biotechnology, Inc. (Dallas, TX, USA). Free fatty acid bovine serum albumin (FFABSA) was purchased from Gold Biotechnology®, Inc. (St. Louis, MO, USA). GenScript SurePAGETM 4-20% precast gels were obtained from GenScript Biotech Corporation (Nanjing, P.R. China).
Reagents: Radioimmunoprecipitation (RIPA) Lysis Buffer System was obtained from Santa Cruz Biotechnology, Inc. Protein concentrations were determined using the Bio-Rad DC Protein Assay (Lowry method) from Bio-Rad Laboratories, Inc. (Hercules, CA, USA). Molecular weight markers for SDS-PAGE included a color pre-stained ladder (6.25-270 kDa) from Bio-Platform Co., Ltd. (Shanghai, P.R. China) and the PageRuler™ Plus Prestained Protein Ladder (10-250 kDa) from Thermo Fisher Scientific (Waltham, MA, USA). Primary antibodies for Western blotting were purchased from Santa Cruz Biotechnology (catalog prefix "sc"), Thermo Fisher Scientific, Cell Signaling Technology (CST; Danvers, MA, USA), or FineTest (FN; Wuhan Fine Biotech Co., Ltd., Wuhan, P.R. China). Corresponding secondary antibodies, either anti-mouse or anti-rabbit IgG conjugated to HRP, were obtained from Santa Cruz Biotechnology (e.g., m-IgG Fc BP-HRP: sc-525409) or Thermo Fisher Scientific (e.g., Goat Anti-Rabbit IgG (H+L) Secondary Antibody, HRP: 31460). Restor™ Western Blot Stripping Buffer and SuperSignal™ West Pico PLUS Chemiluminescent Substrate were purchased from Thermo Fisher Scientific. Western blot sample loading buffer (6X) was prepared in-house, consisting of 0.75 M Tris base, 12% (w/v) SDS, 60% (v/v) glycerol, 6 mg/mL bromphenol blue, and 0.6 M DTT. Tris-Buffered Saline with Tween 20 (TBST) was prepared by dissolving 2.4 g Tris base and 8.8 g sodium chloride in 900 mL of double-distilled water (ddH2O). The solution was then adjusted to pH 7.6 with HCl, followed by the addition of 0.5 mL of Tween® 20 detergent, and brought up to a final volume of 1 L.
Animal Diets: In our animal model experiments, mice were fed either a standard diet (ND) or a HFD. The ND (PicoLab Rodent Diet 20, model 5053) provided 24.5% kcal from protein, 13.1% kcal from fat, and 62.4% kcal from carbohydrates. The HFD (Research Diets Formula D12492) consisted of 20% kcal from protein, 60% kcal from fat, and 20% kcal from carbohydrates. The ND was sourced from LabDiet (St. Louis, MO, USA), and the HFD was purchased from Research Diets, Inc. (New Brunswick, NJ, USA). Assay Kits and Reagents: A variety of commercial kits and reagents were utilized for biochemical analysis. These included: Glucose Measurement: Glucose Liqui-UV kit (Hexokinase method) and Glucose Liquicolor® kit, both from Stanbio Laboratory (Boerne, TX, USA); Glycohemoglobin Measurement: Glycohe-moglobin kit from Stanbio Laboratory (Boerne, TX, USA); Lipid Measurement: Triglyceride Liquicolor® kit and Cholesterol Liquicolor® kit, both from Stanbio Laboratory (Boerne, TX, USA); Blood Glucose Monitoring: LifeScan OneTouch Ultra blood glucose monitoring system from Johnson & Johnson company (Milpitas, CA, USA); Non-Esterified Fatty Acid (NEFA) Measurement: LabAssay NEFA (ACS-ACOD Method) from FUJIFILM Wako Pure Chemical Corporation (Osaka, Japan); Insulin Measurement: Insulin ELISA kit from Crystal Chem (Itasca, IL, USA); Cytokine Measurement: Cusabio mouse TNF-α and FGF21 ELISA kits from Cusabio Technology LLC (Houston, TX, USA), and mouse LECT2 and FGL1 ELISA kits from FineTest.
4.2. Animal Care
Eight-week-old male ICR mice were sourced from the Laboratory Animal Facility (LAF, CWB) at the Hong Kong University of Science and Technology (HKUST). The animals were housed in a temperature-controlled room (approximately 22 °C) under a standard 12-hour light/dark cycle, with ad libitum access to food and water. All experimental procedures were conducted in accordance with the protocol approved by the HKUST Animal Ethics Committee (approval number: 16103221).
4.3. Animal Treatment
Eight-week-old male ICR mice were randomly allocated to six experimental groups (n = 5-10 per group) to assess the effects of Sch B. The groups were: 1) ND control, 2) ND + Sch B (10 mg/kg), 3) ND + Sch B (30 mg/kg), 4) HFD control, 5) HFD + Sch B (10 mg/kg), and 6) HFD + Sch B (30 mg/kg). For the Metformin (Met) experiments, mice were assigned to four groups (n = 4-13 per group): 1) ND control, 2) ND + Met (250 mg/kg), 3) HFD control, and 4) HFD + Met (250 mg/kg).
Throughout the 8-week study, control groups received their respective diets ad libitum and a vehicle control, while treatment groups were administered Sch B or Met via intragastric gavage concurrently with their assigned diet. Body weights were recorded weekly. At study termination, mice were fasted overnight and euthanized by cervical dislocation. Blood was collected via cardiac puncture into syringes containing 0.5% heparinized saline. Plasma was isolated by centrifuging whole blood at 2000 ×g for 10 minutes at 4°C and stored at -20°C for biochemical analysis.
Posterior subcutaneous, epididymal, and mesenteric fat pads were dissected, weighed, and expressed as a fat pad index (fat pad weight/body weight). Muscle (right hindlimb, de-fatted) and liver tissues (~0.6 g) were also harvested, snap-frozen in pre-cooled isopentane, and stored in cryo-vials at -80°C for subsequent biochemical analyses [54,55].
4.4. Blood and Plasma Parameter Measurement
Whole blood samples were used for HbAc1 measurement. Plasma samples were used for measuring levels of fasting blood glucose, TG, TC, NEFA, insulin, TNF-α, hepatokines (FGF21, LECT2, and FGL1), and adipokines (leptin and adiponectin) by corresponding kits listed in Chemicals and Reagents 4.1 [54,55].
TyG index was calculated by the equation: Ln [fasting TG (mg/dL) × fasting glucose (mg/dL)]/2 [56,57]. Equation for HOMA-IR was [fasting insulin (µU/mL) x fasting glucose (mmol/L)/ 22.5] [56,58]; and QUICKI was calculated using the following equation: {1/ [log (fasting insulin μU/mL) + log (fasting glucose mg/dL)]} [56,58]. The equation for Adipo-IR index was [fasting insulin (mmol/L) × fasting NEFA (pmol/L)][18].
4.5. Glucose Tolerance Measurement
Following the 8-week experimental period, an OGTT/ IPGTT was conducted. Mice were fasted for 6 h and subsequently given an intragastric (for OGTT) or intraperitoneal (for IPGTT) glucose load (2 g/kg). Blood samples were collected from the tail vein before the glucose challenge (0 min) and at 15, 30, 60, and 120 min post-administration. Blood glucose concentrations were immediately determined using a blood glucose monitoring system. Total glucose tolerance was evaluated by calculating the area under the curve (AUC) from the resulting concentration-time graph [54,55].
4.6. OGTT with Parallel Plasma Insulin Level and Sample Collection for p-Akt Expressions from Different Tissues After Glucose Intake
Following the 8-week experimental period, a modified OGTT was performed. A subset of fifteen mice per group was selected and subdivided across five distinct time points (0, 15, 30, 60, and 120 min), yielding three mice per time point (n = 3). Following a 6-h fast, the animals were administered an intragastric glucose load (2 g/kg). Blood glucose levels were measured from the tail vein at each assigned time point, after which the mice were immediately euthanized by cervical dislocation. Blood, plasma, and tissue samples were then collected and processed as previously described.
4.7. Western Blot
The protein expression levels were estimated by Western blot analysis using the corresponding antibody following SDS-PAGE analysis of the tissue lysates, using a separating gel of 10% or precast 4-20% acrylamide. Briefly, frozen tissue samples were lysed with RIPA lysis buffer (supplemented with protein and phosphatase inhibitors according to the kit manufacturer). The mixture (tissue sample + RIPA lysis buffer) was homogenized with Teflon-in-glass to create 20-30% homogenates (depending on the type of tissues). The lysates were rocked for 2 h in a cold room, followed by centrifugation at 12,000 ×g. Supernatants were collected for protein measurements (Lowry method) and sample loading. Thirty μg (for fat tissue) or 150 μg (liver and muscle) was loaded and β-actin was used as a loading reference. Proteins in gel were then transferred to polyvinylidene difluoride (PVDF; 0.45 μm) membrane. The membrane was then blocked with blocking solution prepared with 3% (w/v) FFABSA in TBST. First and second antibodies were prepared in 1% (w/v) FFABSA in TBST. The immune-stained protein bands were obtained and analyzed by densitometry (e-BLOT Touch Imager with software, e-BLOT Life Science (Shanghai) Co., Ltd; Shanghai, P.R. China), and the amounts (arbitrary units) of target protein were normalized with reference to β-actin (arbitrary units) in the sample. The following was the list of first antibodies used: Akt (CST9272), p-Akt (Thr308) (CST9275), p-Akt (Ser473) (CST9271S), GRP78 (FNab03662), XBP-1 (sc-8015), β-actin (CST4697L) [53,54].
4.8. Statistical Analysis
Data were expressed as the mean ± Standard Error of the Mean (SEM). Unless otherwise specified, data from different groups at the same time point were analyzed by one-way analysis of variance (one-way ANOVA), and significant intergroup differences were detected by post hoc Tukey’s test, with P < 0.05.
Western blot data were expressed as the mean ± standard deviation (SD). Data from different groups at the same time point were analyzed by one-way ANOVA, and significant intergroup differences were detected by post hoc LSD tests, with P < 0.05.
5. Conclusions
In conclusion, Sch B markedly ameliorated HFD-induced insulin resistance and systemic metabolic dysregulation. These beneficial effects were associated with the restoration of Akt-dependent insulin signaling in the liver, adipose tissue, and skeletal muscle, modulation of hepatokine profiles, and attenuation of systemic inflammation. Notably, this study provides the first direct link between the metabolic benefits of Sch B and XBP-1s, highlighting its pivotal role in mediating these multi-organ effects. This underscores the potential of XBP-1s as a central mechanistic regulator of Sch B-induced metabolic improvement.
Supplementary Materials
The following supporting information can be downloaded at the website of this paper posted on Preprints.org, Table S1: Food intake records during the 8-week experiment period. Figure S1: Original image for Figure 12. Effects of Sch B on total Akt and p-Akt expressions in different tissues of ND-fed and HFD-fed mice. Figure S2: Original image for Figure 13. Effects of Sch B on p-Akt levels from different tissues after glucose intake in ND-fed and HFD-fed mice. Figure S3: Original image for Figure 14. Effects of Sch B on GRP78 expression from different tissue lysates in ND-fed and HFD-fed mice. Figure S4: Original image for Figure 15. Effects of Sch B on XBP-1s expression from different tissues in ND-fed and HFD-fed mice.
Author Contributions
Conceptualization, Ko, K.M. and Leung, H.Y.; methodology, Leung, H.Y.; formal analysis, Leung, H.Y.; writing—original draft preparation, Leung, H.Y.; writing—review and editing, Ko, K.M. and Leung, H.Y.; supervision, Ko, K.M. All authors have read and agreed to the published version of the manuscript.
Funding
This research received no external funding.
Institutional Review Board Statement
The animal study protocol was approved by the Institutional Review Board (or Ethics Committee) of Laboratory Animal Facility (CWB) in The Hong Kong University of Science and Technology (animal ethics protocol number 16103221, date of approval: 19-Feb-2021).” for studies involving animals.
Acknowledgments
During the preparation of this manuscript/study, the author(s) used Perplexity for text editing. The authors have reviewed and edited the output and take full responsibility for the content of this publication.
Conflicts of Interest
The authors declare no conflicts of interest.
Abbreviations
| Adipo-IR | Adipose Tissue Insulin Resistance |
| Akt | Protein kinase B |
| ER | Endoplasmic Reticulum |
| FGF21 | Fibroblast Growth Factor 21 |
| FGL1 | Fibrinogen-like Protein 1 |
| GRP78 | Glucose-regulated Protein 78 |
| GLUT4 | Glucose Transporter 4 |
| HFD | High-fat Diet |
| HOMA-IR | Homeostatic Model Assessment for Insulin Resistance |
| IPGTT | Intraperitoneal Glucose Tolerance Test |
| IR | Insulin Resistance |
| IRS-1 | Insulin Receptor Substrate -1 |
| LECT2 | Leukocyte Cell-derived Chemotazin 2 |
| MASLD | Metabolic Dysfunction-associated Steatoic Liver Disease |
| MetS | Metabolic Syndrome |
| NAFLD | Non-alcoholic fatty liver disease |
| ND | Normal Diet |
| OGTT | Oral Glucose Tolerance Test |
| PI3K | Phosphoinositide 3-kinase |
| QUICKI | Quantitative Insulin Sensitivity Check Index |
| Sch B | Schisandrin B |
| T2DM | Type 2 Diabetes Mellitus |
| TNF-α | Tumor Necrosis Factor-alpha |
| XBP-1s | Spliced form of X-box Binding Protein 1 |
References
- Peterseim, C.M.; Jabbour, K.; Kamath Mulki, A. Metabolic syndrome: An updated review on diagnosis and treatment for primary care clinicians. J. Prim. Care Community Health 2024, 15, 21501319241309168. [Google Scholar] [CrossRef]
- Noubiap, J.J.; Nansseu, J.R.; Lontchi-Yimagou, E.; Nkeck, J.R.; Nyaga, U.F.; Ngouo, A.T.; Tounouga, D.N.; Tianyi, F.L.; Foka, A.J.; Ndoadoumgue, A.L.; Bigna, J.J. Geographic distribution of metabolic syndrome and its components in the general adult population: A meta-analysis of global data from 28 million individuals. Diabetes Res. Clin. Pract. 2022, 188, 109924. [Google Scholar] [CrossRef]
- Zyoud, S.H.; Shakhshir, M.; Koni, A.; Abushanab, A.S.; Shahwan, M.; Jairoun, A.A.; Al Subu, R.; Abu Taha, A.; Al-Jabi, S.W. Mapping the global research landscape on insulin resistance: Visualization and bibliometric analysis. World J. Diabetes 2022, 13, 786–798. [Google Scholar] [CrossRef]
- Alawdi, S.H.; Al-Dholae, M.; Al-Shawky, S. Metabolic syndrome and pharmacotherapy outcomes in patients with type 2 diabetes mellitus. Front. Clin. Diabetes Healthc. 2024, 5, 1380244. [Google Scholar] [CrossRef]
- International Diabetes Federation. IDF Diabetes Atlas, 10th ed.; International Diabetes Federation: Brussels, Belgium, 2021. [Google Scholar]
- Chen, M.E.; Hannon, T.S. Clinical Manifestations of Insulin Resistance in Youth. In Insulin Resistance: Childhood Precursors of Adult Disease, 2nd ed.; Zeitler, P.S., Nadeau, K.J., Eds.; Humana Press: Cham, Switzerland, 2020; pp. 3–18. [Google Scholar] [CrossRef]
- Li, J.; Wu, H.; Liu, Y.; Yang, L. High fat diet induced obesity model using four strains of mice: Kunming, C57BL/6, BALB/c and ICR. Exp. Anim. 2020, 69, 326–335. [Google Scholar] [CrossRef] [PubMed]
- Small, L.; Brandon, A.E.; Turner, N.; Cooney, G.J. Modeling insulin resistance in rodents by alterations in diet: What have high-fat and high-calorie diets revealed? Am. J. Physiol. Endocrinol. Metab. 2018, 314, E251–E265. [Google Scholar] [CrossRef]
- Savova, M.S.; Mihaylova, L.V.; Tews, D.; Wabitsch, M.; Georgiev, M.I. Targeting PI3K/AKT signaling pathway in obesity. Biomed. Pharmacother. 2023, 159, 114244. [Google Scholar] [CrossRef]
- Tang, W.; Liu, H.; Li, X.; Deng, S.; Gao, C. Influence and treatment of insulin receptor substrate/PI3K/Akt-mediated insulin resistance in diabetes mellitus (Review). Mol. Med. Rep. 2026, 33, 63. [Google Scholar] [CrossRef] [PubMed]
- Ehambarampillai, D.; Wan, M.L.Y. A comprehensive review of Schisandra chinensis lignans: Pharmacokinetics, pharmacological mechanisms, and future prospects in disease prevention and treatment. Chin. Med. 2025, 20, 47. [Google Scholar] [CrossRef]
- Ma, R.; Zhan, Y.; Zhang, Y.; Wu, L.; Wang, X.; Guo, M. Schisandrin B ameliorates non-alcoholic liver disease through anti-inflammation activation in diabetic mice. Drug Dev. Res. 2022, 83, 735–744. [Google Scholar] [CrossRef] [PubMed]
- Kwan, H.Y.; Wu, J.; Su, T.; Chao, X.J.; Yu, H.; Liu, B.; Fu, X.; Tse, A.K.W.; Chan, C.L.; Fong, W.F.; Yu, Z.L. Schisandrin B regulates lipid metabolism in subcutaneous adipocytes. Sci. Rep. 2017, 7, 10266. [Google Scholar] [CrossRef]
- Jiang, S.; Young, J.L.; Wang, K.; Qian, Y.; Cai, L. Diabetic-induced alterations in hepatic glucose and lipid metabolism: The role of type 1 and type 2 diabetes mellitus (Review). Mol. Med. Rep. 2020, 22, 603–611. [Google Scholar] [CrossRef]
- Sun, Y.; Ji, H.; Sun, W.; An, X.; Lian, F. Triglyceride glucose (TyG) index: A promising biomarker for diagnosis and treatment of different diseases. Eur. J. Intern. Med. 2025, 131, 3–14. [Google Scholar] [CrossRef] [PubMed]
- Marquez, A.; Andrada, E.; Russo, M.; Babot, J.D.; Medina, R.; Gauffin-Cano, P. Anti-Obesity and hepatoprotective effects of probiotic goat milk in mice: Insights from hepatic proteomics. Fermentation 2025, 11, 419. [Google Scholar] [CrossRef]
- Avtanski, D.; Pavlov, V.A.; Tracey, K.J.; Poretsky, L. Characterization of inflammation and insulin resistance in high-fat diet-induced male C57BL/6J mouse model of obesity. Anim. Model. Exp. Med. 2019, 2, 252–258. [Google Scholar] [CrossRef] [PubMed]
- Becerril, S.; Rodríguez, A.; Catalán, V.; Ramírez, B.; Mentxaka, A.; Neira, G.; Gómez-Ambrosi, J.; Frühbeck, G. Sex- and age-dependent changes in the adiponectin/leptin ratio in experimental diet-induced obesity in mice. Nutrients 2022, 15, 73. [Google Scholar] [CrossRef]
- Søndergaard, E.; Espinosa De Ycaza, A.E.; Morgan-Bathke, M.; Jensen, M.D. How to measure adipose tissue insulin sensitivity. J. Clin. Endocrinol. Metab. 2017, 102, 1193–1199. [Google Scholar] [CrossRef]
- Small, L.; Ehrlich, A.; Iversen, J.; Ashcroft, S.P.; Trošt, K.; Moritz, T.; Hartmann, B.; Holst, J.J.; Treebak, J.T.; Zierath, J.R.; Barrès, R. Comparative analysis of oral and intraperitoneal glucose tolerance tests in mice. Mol. Metab. 2022, 57, 101440. [Google Scholar] [CrossRef]
- Ahrén, B.; Pacini, G. Glucose effectiveness: Lessons from studies on insulin-independent glucose clearance in mice. J. Diabetes Investig. 2021, 12, 675–685. [Google Scholar] [CrossRef]
- Shang, J.; Yan, W.; Cui, X.; Ma, W.; Wang, Z.; Liu, N.; Yi, X.; Guo, T.; Wei, X.; Sun, Y.; Hu, H.; Cui, W.; Chen, L. Schisandrin B, a potential GLP-1R agonist, exerts anti-diabetic effects by stimulating insulin secretion. Mol. Cell. Endocrinol. 2023, 577, 112029. [Google Scholar] [CrossRef] [PubMed]
- Kwan, H.Y.; Niu, X.; Dai, W.; Tong, T.; Chao, X.; Su, T.; Chan, C.L.; Lee, K.C.; Fu, X.; Yi, H.; Yu, H.; Li, T.; Tse, A.K.; Fong, W.F.; Pan, S.Y.; Lu, A.; Yu, Z.L. Lipidomic-based investigation into the regulatory effect of Schisandrin B on palmitic acid level in non-alcoholic steatotic livers. Sci. Rep. 2015, 5, 9114. [Google Scholar] [CrossRef]
- Jensen-Urstad, A.P.; Semenkovich, C.F. Fatty acid synthase and liver triglyceride metabolism: Housekeeper or messenger? Biochim. Biophys. Acta 2012, 1821, 747–753. [Google Scholar] [CrossRef]
- Yun, Y.R.; Kim, J.H.; Kim, J.H.; Jung, M.H. Protective effects of gomisin N against hepatic steatosis through AMPK activation. Biochem. Biophys. Res. Commun. 2017, 482, 1095–1101. [Google Scholar] [CrossRef] [PubMed]
- Wan, J.; Lang, C.; Gao, M.; Liu, F.; Feng, X.; Li, H.; Wang, C.; Sun, J. Schisandrin B alleviates metabolic associated fatty liver disease by regulating the PPARγ signaling pathway and gut microbiota in mice. Front. Pharmacol. 2025, 16, 1583307. [Google Scholar] [CrossRef]
- Gao, M.; Liu, F.; Feng, X.; Wang, M.; Zhang, Z.; Li, H.; Wang, C.; Sun, J. Schisandrin B alleviates lipid metabolism disorders and apoptosis of MAFLD via modulation of PPARγ-PCK1 and Caspase-3 signaling pathways. Pharmaceuticals 2025, 18, 1441. [Google Scholar] [CrossRef]
- Hage Hassan, R.; Bourron, O.; Hajduch, E. Defect of insulin signal in peripheral tissues: Important role of ceramide. World J. Diabetes 2014, 5, 244–257. [Google Scholar] [CrossRef] [PubMed]
- Sokolowska, E.; Blachnio-Zabielska, A. The role of ceramides in insulin resistance. Front. Endocrinol. 2019, 10, 577. [Google Scholar] [CrossRef]
- Xu, W.; Zhang, D.; Ma, Y.; Gaspar, R.C.; Kahn, M.; Nasiri, A.; Murray, S.; Samuel, V.T.; Shulman, G.I. Ceramide synthesis inhibitors prevent lipid-induced insulin resistance through the DAG-PKCε-insulin receptorT1150 phosphorylation pathway. Cell Rep. 2024, 43, 114746. [Google Scholar] [CrossRef]
- Hsieh, C.T.; Chuang, J.H.; Yang, W.C.; Yin, Y.; Lin, Y. Ceramide inhibits insulin-stimulated Akt phosphorylation through activation of Rheb/mTORC1/S6K signaling in skeletal muscle. Cell Signal. 2014, 26, 1400–1408. [Google Scholar] [CrossRef]
- Beg, M.; Abdullah, N.; Thowfeik, F.S.; Altorki, N.K.; McGraw, T.E. Distinct Akt phosphorylation states are required for insulin regulated Glut4 and Glut1-mediated glucose uptake. eLife 2017, 6, e26896. [Google Scholar] [CrossRef] [PubMed]
- Galicia-Garcia, U.; Benito-Vicente, A.; Jebari, S.; Larrea-Sebal, A.; Siddiqi, H.; Uribe, K.B.; Ostolaza, H.; Martín, C. Pathophysiology of type 2 diabetes mellitus. Int. J. Mol. Sci. 2020, 21, 6275. [Google Scholar] [CrossRef]
- Burhans, M.S.; Hagman, D.K.; Kuzma, J.N.; Schmidt, K.A.; Kratz, M. Contribution of adipose tissue inflammation to the development of type 2 diabetes mellitus. Compr. Physiol. 2018, 9, 1–58. [Google Scholar] [CrossRef] [PubMed]
- Shimu, S.J.; Mahir, J.U.K.; Shakib, F.A.F.; Ridoy, A.A.; Samir, R.A.; Jahan, N.; Hasan, M.F.; Sazzad, S.; Akter, S.; Mohiuddin, M.S.; Shawon, M.J.A.; Shariare, M.H.; Mohib, M.M.; Uddin, M.B. Metabolic reprogramming through polyphenol networks: A systems approach to metabolic inflammation and insulin resistance. Med. Sci. 2025, 13, 180. [Google Scholar] [CrossRef]
- Huang, X.; Liu, G.; Guo, J.; Su, Z. The PI3K/AKT pathway in obesity and type 2 diabetes. Int. J. Biol. Sci. 2018, 14, 1483–1496. [Google Scholar] [CrossRef]
- Cao, R.; Tian, H.; Zhang, Y.; Liu, G.; Xu, H.; Rao, G.; Tian, Y.; Fu, X. Signaling pathways and intervention for therapy of type 2 diabetes mellitus. MedComm 2023, 4, e283. [Google Scholar] [CrossRef]
- Tomada, I.; Negrão, R.; Almeida, H.; Neves, D. Long-term high-fat consumption leads to downregulation of Akt phosphorylation of eNOS at Ser1177 and upregulation of Sirtuin-1 expression in rat cavernous tissue. Age 2014, 36, 597–611. [Google Scholar] [CrossRef]
- Gao, H.; Li, Y.F. Distinct signal transductions in fast- and slow-twitch muscles upon denervation. Physiol. Rep. 2018, 6, e13606. [Google Scholar] [CrossRef] [PubMed]
- Miao, R.; Fang, X.; Wei, J.; Wu, H.; Wang, X.; Tian, J. Akt: A potential drug target for metabolic syndrome. Front. Physiol. 2022, 13, 822333. [Google Scholar] [CrossRef]
- Sharma, N.; Arias, E.B.; Bhat, A.D.; Sequea, D.A.; Ho, S.; Croff, K.K.; Sajan, M.P.; Farese, R.V.; Cartee, G.D. Mechanisms for increased insulin-stimulated Akt phosphorylation and glucose uptake in fast- and slow-twitch skeletal muscles of calorie-restricted rats. Am. J. Physiol. Endocrinol. Metab. 2011, 300, E966–E978. [Google Scholar] [CrossRef]
- Chen, X.; Shi, C.; He, M.; Xiong, S.; Xia, X. Endoplasmic reticulum stress: Molecular mechanism and therapeutic targets. Signal Transduct. Target. Ther. 2023, 8, 352. [Google Scholar] [CrossRef] [PubMed]
- de Oliveira Dos Santos, A.R.; de Oliveira Zanuso, B.; Miola, V.F.B.; Barbalho, S.M.; Santos Bueno, P.C.; Flato, U.A.P.; Detregiachi, C.R.P.; Buchaim, D.V.; Buchaim, R.L.; Tofano, R.J.; Mendes, C.G.; Tofano, V.A.C.; Dos Santos Haber, J.F. Adipokines, myokines, and hepatokines: Crosstalk and metabolic repercussions. Int. J. Mol. Sci. 2021, 22, 2639. [Google Scholar] [CrossRef]
- Miao, X.; Alidadipour, A.; Saed, V.; Sayyadi, F.; Jadidi, Y.; Davoudi, M.; Amraee, F.; Jadidi, N.; Afrisham, R. Hepatokines: Unveiling the molecular and cellular mechanisms connecting hepatic tissue to insulin resistance and inflammation. Acta Diabetol. 2024, 61, 1339–1361. [Google Scholar] [CrossRef]
- Morrice, N.; Mcilroy, G.D.; Tammireddy, S.R.; Reekie, J.; Shearer, K.D.; Doherty, M.K.; Delibegović, M.; Whitfield, P.D.; Mody, N. Elevated fibroblast growth factor 21 (FGF21) in obese, insulin resistant states is normalised by the synthetic retinoid Fenretinide in mice. Sci. Rep. 2017, 7, 43782. [Google Scholar] [CrossRef]
- Zhang, Z.; Zeng, H.; Lin, J.; Hu, Y.; Yang, R.; Sun, J.; Chen, R.; Chen, H. Circulating LECT2 levels in newly diagnosed type 2 diabetes mellitus and their association with metabolic parameters: An observational study. Medicine 2018, 97, e0354. [Google Scholar] [CrossRef] [PubMed]
- Wu, H.T.; Chen, S.C.; Fan, K.C.; Kuo, C.H.; Lin, S.Y.; Wang, S.H.; Chang, C.J.; Li, H.Y. Targeting fibrinogen-like protein 1 is a novel therapeutic strategy to combat obesity. FASEB J. 2020, 34, 2958–2967. [Google Scholar] [CrossRef] [PubMed]
- Liu, X.H.; Qi, L.W.; Alolga, R.N.; Liu, Q. Implication of the hepatokine, fibrinogen-like protein 1 in liver diseases, metabolic disorders and cancer: The need to harness its full potential. Int. J. Biol. Sci. 2022, 18, 292–300. [Google Scholar] [CrossRef]
- Kim, J.E.; Kim, J.S.; Jo, M.J.; Cho, E.; Ahn, S.Y.; Kwon, Y.J.; Ko, G.J. The roles and associated mechanisms of adipokines in development of metabolic syndrome. Molecules 2022, 27, 334. [Google Scholar] [CrossRef] [PubMed]
- Francisco, V.; Ruiz-Fernández, C.; Pino, J.; Mera, A.; González-Gay, M.A.; Gómez, R.; Lago, F.; Mobasheri, A.; Gualillo, O. Adipokines: Linking metabolic syndrome, the immune system, and arthritic diseases. Biochem. Pharmacol. 2019, 165, 196–206. [Google Scholar] [CrossRef] [PubMed]
- Madhavan, A.; Kok, B.P.; Rius, B.; Grandjean, J.M.D.; Alabi, A.; Albert, V.; Sukiasyan, A.; Powers, E.T.; Galmozzi, A.; Saez, E.; Wiseman, R.L. Pharmacologic IRE1/XBP1s activation promotes systemic adaptive remodeling in obesity. Nat. Commun. 2022, 13, 608. [Google Scholar] [CrossRef]
- Sha, H.; Yang, L.; Liu, M.; Xia, S.; Liu, Y.; Liu, F.; Kersten, S.; Qi, L. Adipocyte spliced form of X-box-binding protein 1 promotes adiponectin multimerization and systemic glucose homeostasis. Diabetes 2014, 63, 867–879. [Google Scholar] [CrossRef]
- Cho, Y.M.; Kim, D.H.; Lee, K.H.; Jeong, S.W.; Kwon, O.J. The IRE1α-XBP1s pathway promotes insulin-stimulated glucose uptake in adipocytes by increasing PPARγ activity. Exp. Mol. Med. 2018, 50, 1–15. [Google Scholar] [CrossRef] [PubMed]
- Chen, J.; Wong, H.S.; Leung, H.Y.; Leong, P.K.; Chan, W.M.; Ko, K.M. An ursolic acid-enriched Cynomorium songarium extract attenuates high fat diet-induced obesity in mice possibly through mitochondrial uncoupling. J. Funct. Foods 2014, 9, 211–224. [Google Scholar] [CrossRef]
- Wong, H.S.; Chen, J.; Leong, P.K.; Leung, H.Y.; Chan, W.M.; Ko, K.M. Cistanches Herba reduces the weight gain in high fat diet-induced obese mice possibly through mitochondrial uncoupling. J. Funct. Foods 2014, 10, 292–304. [Google Scholar] [CrossRef]
- Aliyu, U.; Toor, S.M.; Abdalhakam, I.; Elrayess, M.A.; Abou Samra, A.B.; Albagha, O.M.E. Evaluating indices of insulin resistance and estimating the prevalence of insulin resistance in a large biobank cohort. Front. Endocrinol. 2025, 16, 1591677. [Google Scholar] [CrossRef] [PubMed]
- Alizargar, J.; Hsieh, N.C.; Wu, S.V. The correct formula to calculate triglyceride-glucose index (TyG). J. Pediatr. Endocrinol. Metab. 2020, 33, 945–946. [Google Scholar] [CrossRef]
- Duan, X.; Davis, L.M.; Patel, S.; Bidault, G.; Long, L.; Jenkins, B.; Yi, Y.; Pushpa, P.; Wesseling, J.; Koulman, A.; Vidal-Puig, A.; Fazakerley, D.J.; Savage, D.B. Integrated analysis of insulin resistance reveals metabolic remodeling following diet switch-triggered calorie reduction. Sci. Adv. 2026, 12, eaed0535. [Google Scholar] [CrossRef] [PubMed]
Figure 1.
Effect of Sch B and Met on body weight gain in mice fed an ND or HFD. Body weight was monitored weekly over the 8-week experimental period and presented as a percentage of the initial body weight. Panels (a) and (b) illustrate the time course of body weight changes. Statistical significance between groups was assessed using one-way ANOVA followed by Tukey's post-hoc test. Values given are means ± SEM, with n ≥ 4. * Significantly different from the ND control; # Significantly different from the HFD control.
Figure 1.
Effect of Sch B and Met on body weight gain in mice fed an ND or HFD. Body weight was monitored weekly over the 8-week experimental period and presented as a percentage of the initial body weight. Panels (a) and (b) illustrate the time course of body weight changes. Statistical significance between groups was assessed using one-way ANOVA followed by Tukey's post-hoc test. Values given are means ± SEM, with n ≥ 4. * Significantly different from the ND control; # Significantly different from the HFD control.
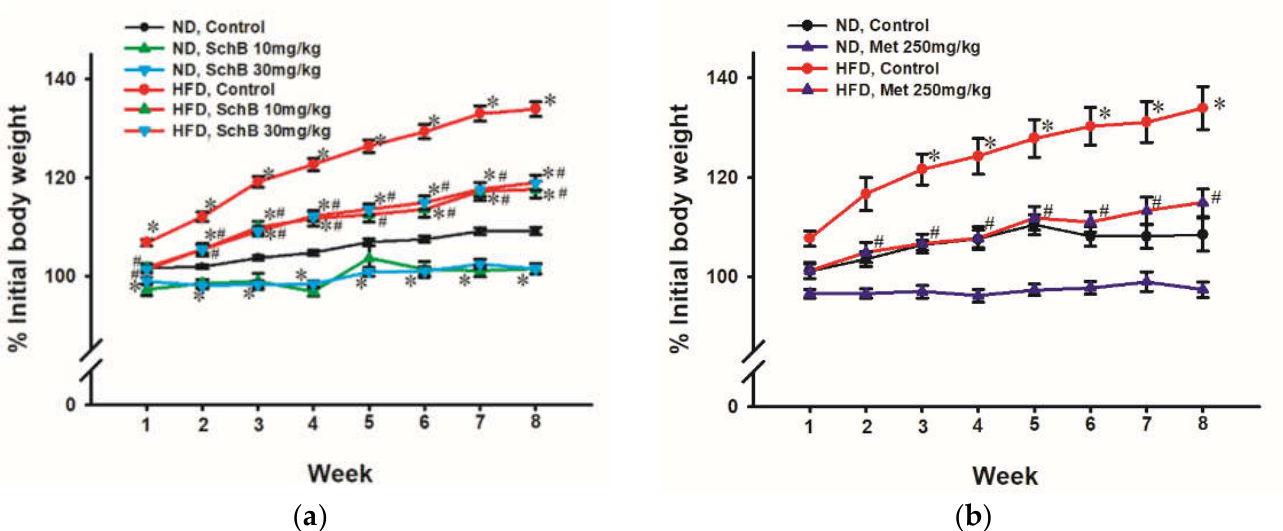
Figure 2.
Effect of Sch B or Met on fat pad indices in ND-fed and HFD-fed Mice. Posterior subcutaneous fat, epididymal fat, and mesenteric fat were weighed. Values given are means ± SEM, with n ≥ 4. * Significantly different from the ND control; # Significantly different from the HFD control.
Figure 2.
Effect of Sch B or Met on fat pad indices in ND-fed and HFD-fed Mice. Posterior subcutaneous fat, epididymal fat, and mesenteric fat were weighed. Values given are means ± SEM, with n ≥ 4. * Significantly different from the ND control; # Significantly different from the HFD control.
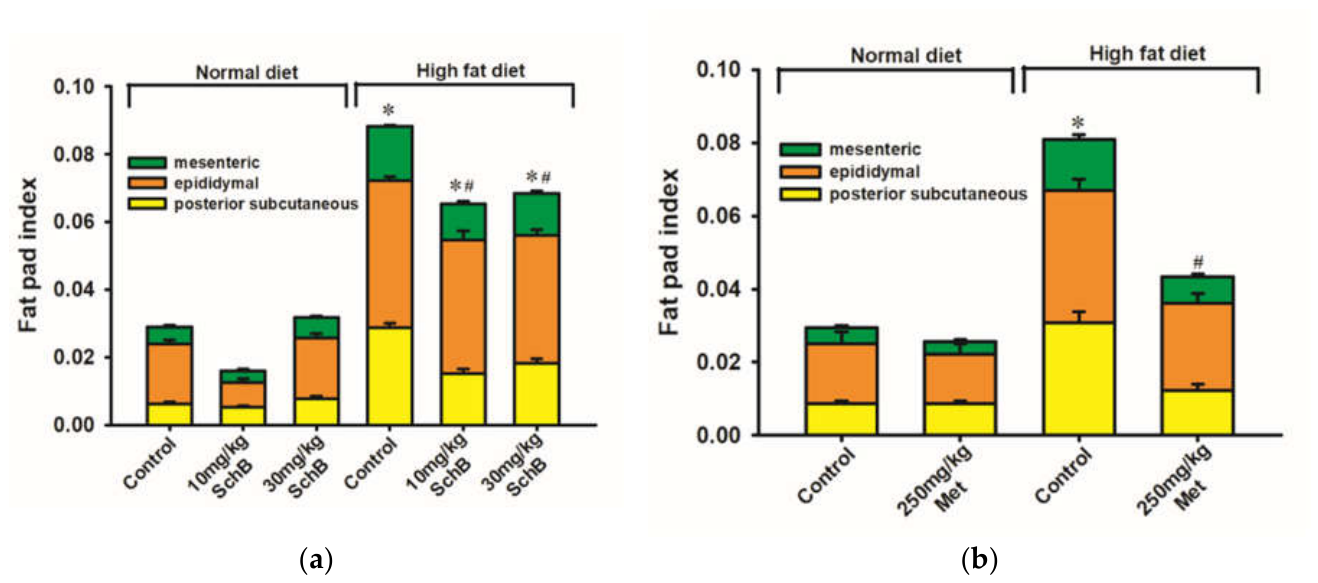
Figure 3.
Effects of Sch B or Met on HbA1c and fasting plasma glucose levels in ND-fed and HFD-fed mice. Data were expressed in percent control with respect to the ND control [control HbA1ac level (%) = 2.31 ± 0.06 (Sch B data set); 2.04 ± 0.10 (Met set); control plasma glucose level (mg/dL) = 101 ± 2.17 (Sch B data set)/ 106 ± 3.72 (Met set)]. Values given are means ± SEM, with n ≥ 4. * Significantly different from the ND control; # Significantly different from the HFD control.
Figure 3.
Effects of Sch B or Met on HbA1c and fasting plasma glucose levels in ND-fed and HFD-fed mice. Data were expressed in percent control with respect to the ND control [control HbA1ac level (%) = 2.31 ± 0.06 (Sch B data set); 2.04 ± 0.10 (Met set); control plasma glucose level (mg/dL) = 101 ± 2.17 (Sch B data set)/ 106 ± 3.72 (Met set)]. Values given are means ± SEM, with n ≥ 4. * Significantly different from the ND control; # Significantly different from the HFD control.
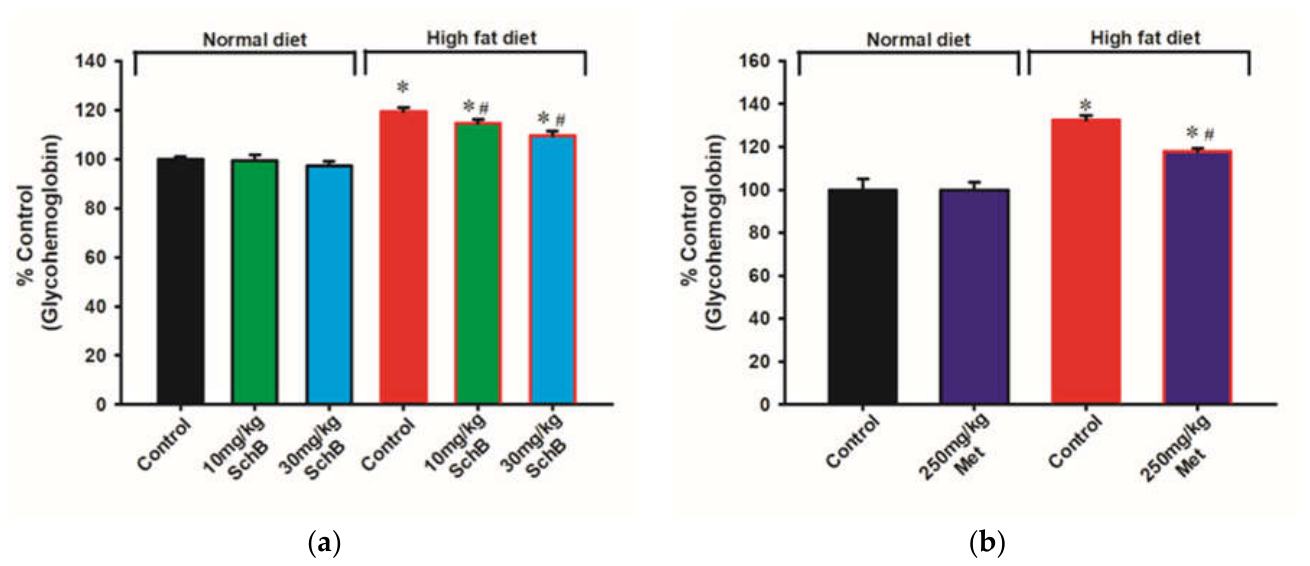
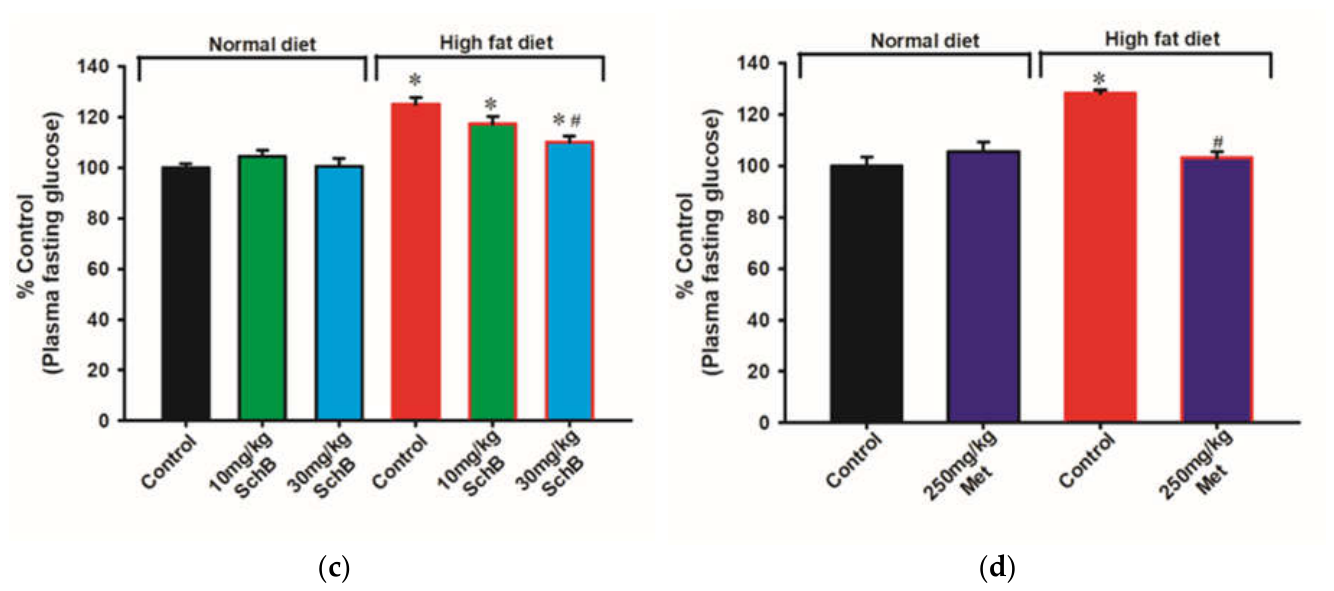
Figure 4.
Effects of Sch B or Met on plasma lipid contents in ND-fed and HFD-fed mice. Data were expressed in percent control with respect to the ND control [control plasma TC level (mg/ dL) = 116 ± 3.88 (Sch B data set); 97.0 ± 1.13 (Met set); control plasma TG level (mg/ dL) = 59.8 ± 1.47 (Sch B data set); 45.6 ± 1.56 (Met set); control plasma NEFA level (mEq/ dL)= 1.18 ± 0.02 (Sch B data set)/ 1.12 ± 0.04 (Met set)]. Values given are means ± SEM, with n ≥ 4. * Significantly different from the ND control; # Significantly different from the HFD control.
Figure 4.
Effects of Sch B or Met on plasma lipid contents in ND-fed and HFD-fed mice. Data were expressed in percent control with respect to the ND control [control plasma TC level (mg/ dL) = 116 ± 3.88 (Sch B data set); 97.0 ± 1.13 (Met set); control plasma TG level (mg/ dL) = 59.8 ± 1.47 (Sch B data set); 45.6 ± 1.56 (Met set); control plasma NEFA level (mEq/ dL)= 1.18 ± 0.02 (Sch B data set)/ 1.12 ± 0.04 (Met set)]. Values given are means ± SEM, with n ≥ 4. * Significantly different from the ND control; # Significantly different from the HFD control.
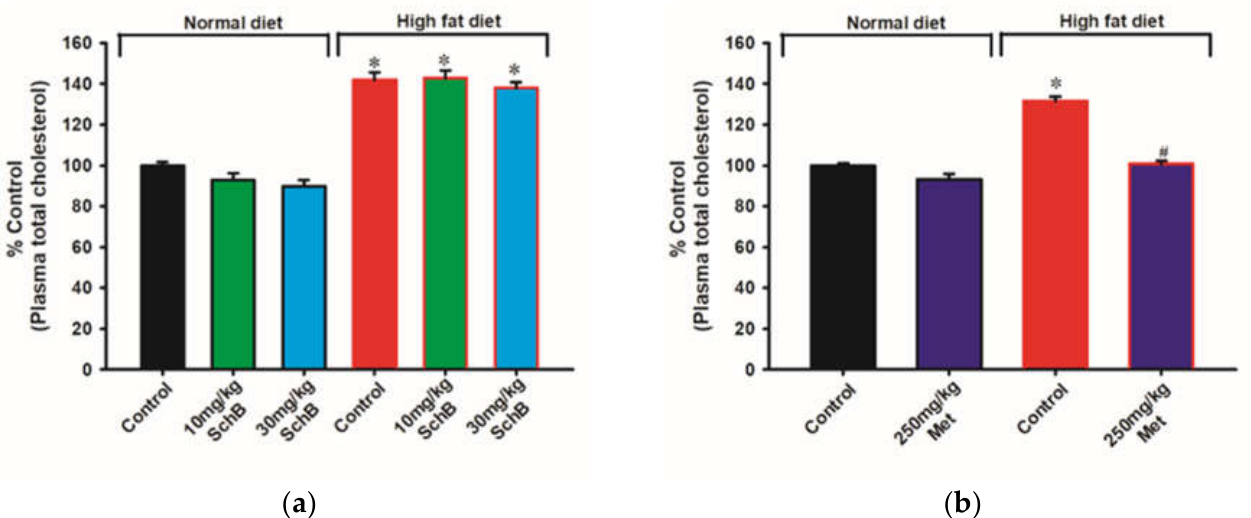
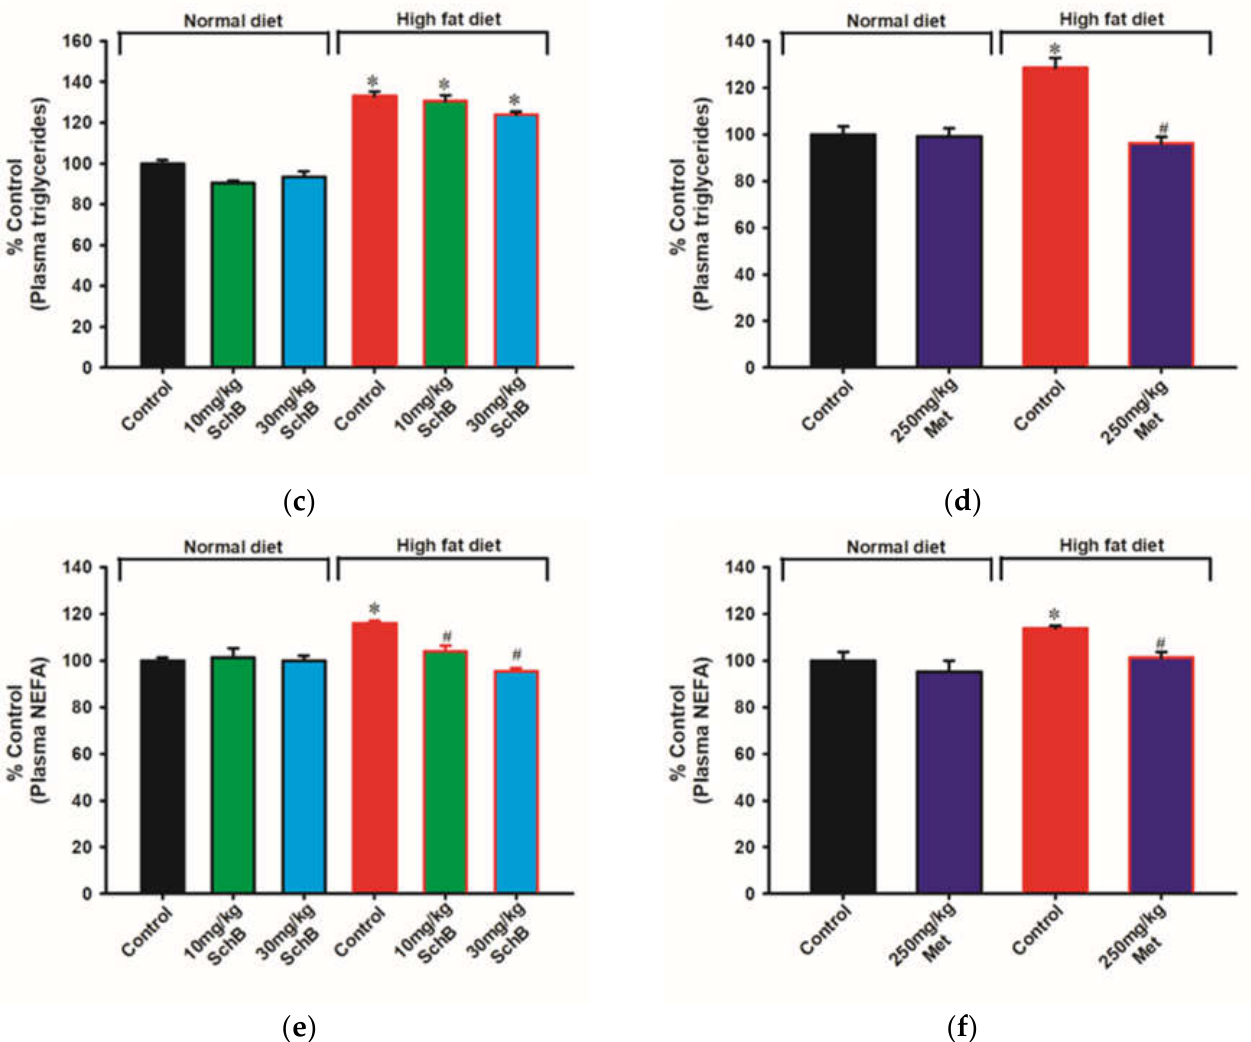
Figure 5.
Effects of Sch B or Met on fasting plasma insulin level and HOMA-IR in ND-fed and HFD-fed mice. Data were expressed in percent control with respect to the ND control [control fasting plasma insulin level (ng/ mL) = 0.21 ± 0.01 (Sch B data set); 0.23 ± 0.01 (Met set)]. HOMA-IR values were calculated from fasting plasma glucose and insulin levels. Data were expressed in percent control with respect to the ND control [control HOMA-IR = 15.7 ± 0.48 (Sch B data set); 17.1 ± 1.04 (Met set)]. Values given are means ± SEM, with n ≥ 4. * Significantly different from the ND control; # Significantly different from the HFD control.
Figure 5.
Effects of Sch B or Met on fasting plasma insulin level and HOMA-IR in ND-fed and HFD-fed mice. Data were expressed in percent control with respect to the ND control [control fasting plasma insulin level (ng/ mL) = 0.21 ± 0.01 (Sch B data set); 0.23 ± 0.01 (Met set)]. HOMA-IR values were calculated from fasting plasma glucose and insulin levels. Data were expressed in percent control with respect to the ND control [control HOMA-IR = 15.7 ± 0.48 (Sch B data set); 17.1 ± 1.04 (Met set)]. Values given are means ± SEM, with n ≥ 4. * Significantly different from the ND control; # Significantly different from the HFD control.
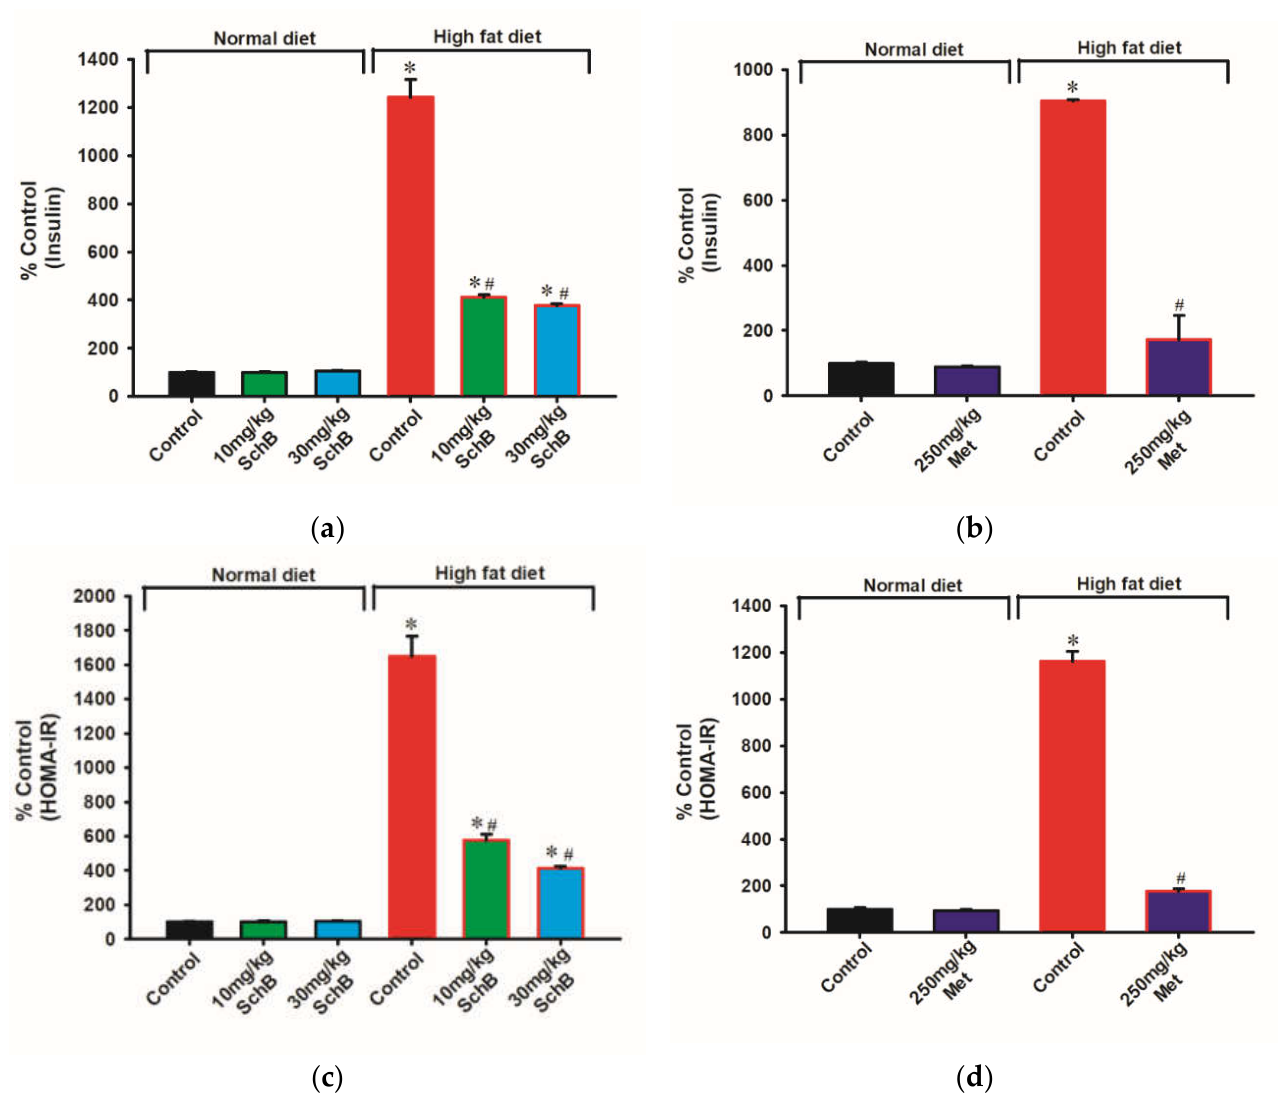
Figure 6.
Effects of Sch B or Met on oral glucose tolerance in ND-fed and HFD-fed mice. (a) and (b): The time course of changes in blood glucose level was analyzed by a one-way ANOVA, and the intergroup difference was detected by Tukey’s test. (c) and (d): The time-dependent changes in glucose levels were quantified by computing the area under the curve (AUC) as described in Materials and Methods. Data were expressed in percent control with respect to the ND control [control AUC value (arbitrary unit): Sch B data set = 1346 ± 45.5; Met data set = 1277 ± 69.5]. Values given are means ± SEM, with n ≥ 4. * Significantly different from the ND control; # Significantly different from the HFD control.
Figure 6.
Effects of Sch B or Met on oral glucose tolerance in ND-fed and HFD-fed mice. (a) and (b): The time course of changes in blood glucose level was analyzed by a one-way ANOVA, and the intergroup difference was detected by Tukey’s test. (c) and (d): The time-dependent changes in glucose levels were quantified by computing the area under the curve (AUC) as described in Materials and Methods. Data were expressed in percent control with respect to the ND control [control AUC value (arbitrary unit): Sch B data set = 1346 ± 45.5; Met data set = 1277 ± 69.5]. Values given are means ± SEM, with n ≥ 4. * Significantly different from the ND control; # Significantly different from the HFD control.
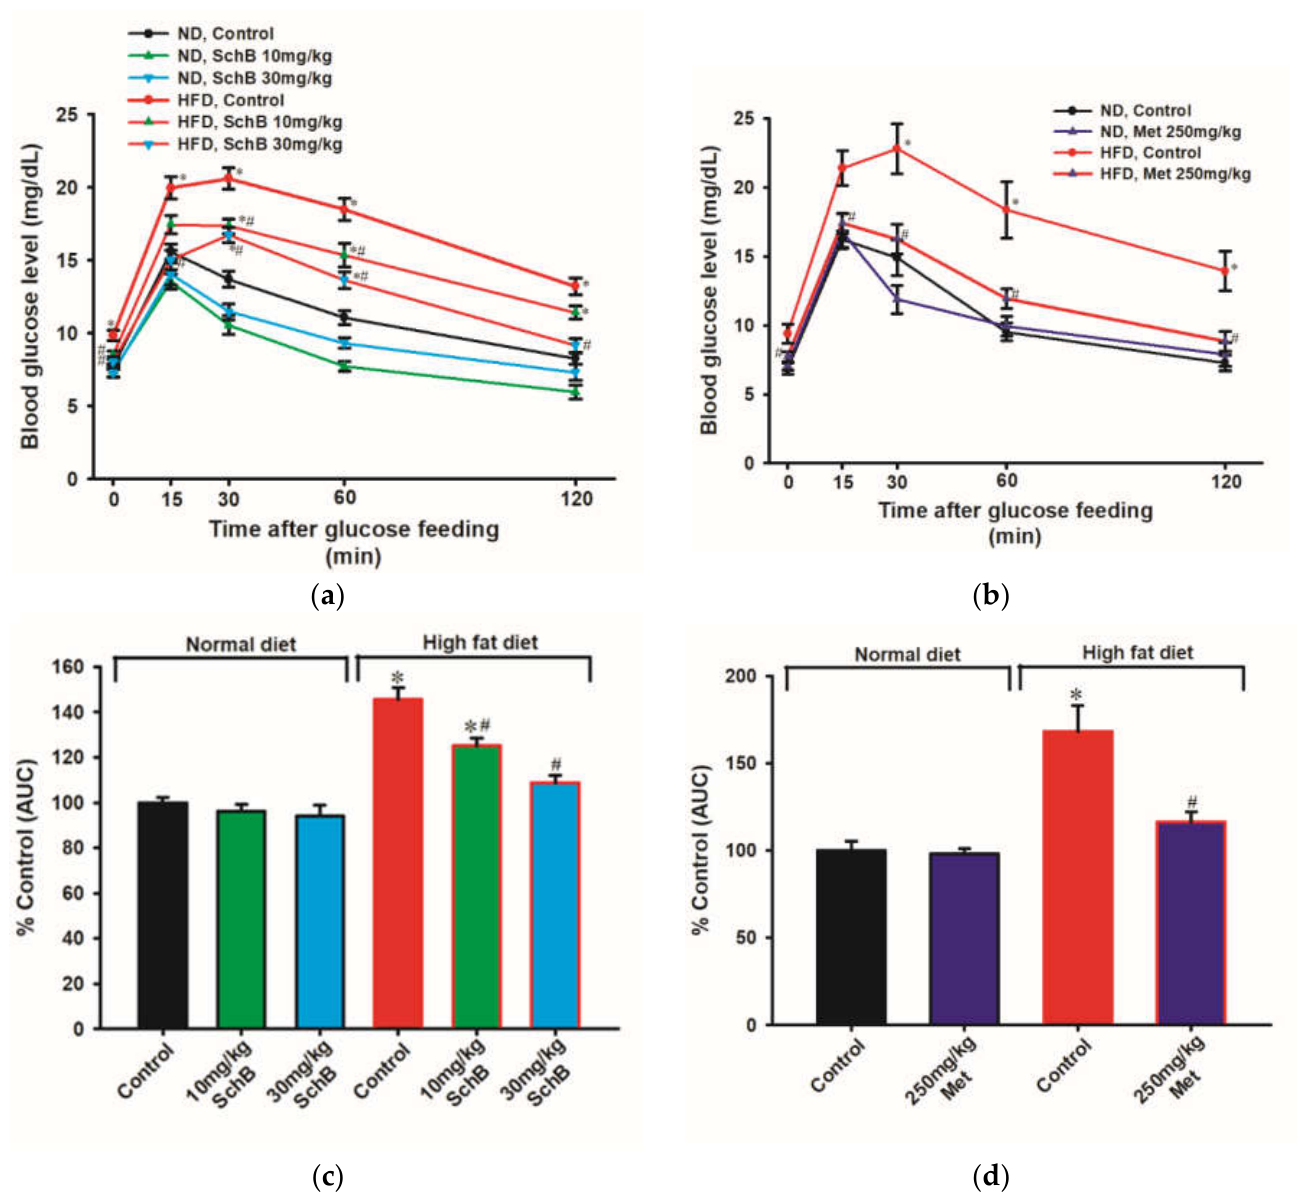
Figure 7.
Effects of Sch B (30 mg/kg) on oral glucose tolerance with parallel plasma insulin level in ND-fed and HFD-fed mice. (a) The time course of changes in blood glucose levels was analyzed as described in Figure 6. (b) The changes in blood glucose levels were quantified as described in Figure 6. Data were expressed in percent control with respect to the ND control [control AUC value (arbitrary unit) = 1425 ± 46.0]. (c) The time course of changes in plasma insulin levels was analyzed in the same way as the blood glucose level. (d) The changes in plasma insulin levels were quantified by computing AUC as described in Materials and Methods. Data were expressed in percent control with respect to the ND control [control AUC value (arbitrary unit) = 143 ± 8.74]. Values given are means ± SEM, with n =7. * Significantly different from the ND control; # Significantly different from the HFD control.
Figure 7.
Effects of Sch B (30 mg/kg) on oral glucose tolerance with parallel plasma insulin level in ND-fed and HFD-fed mice. (a) The time course of changes in blood glucose levels was analyzed as described in Figure 6. (b) The changes in blood glucose levels were quantified as described in Figure 6. Data were expressed in percent control with respect to the ND control [control AUC value (arbitrary unit) = 1425 ± 46.0]. (c) The time course of changes in plasma insulin levels was analyzed in the same way as the blood glucose level. (d) The changes in plasma insulin levels were quantified by computing AUC as described in Materials and Methods. Data were expressed in percent control with respect to the ND control [control AUC value (arbitrary unit) = 143 ± 8.74]. Values given are means ± SEM, with n =7. * Significantly different from the ND control; # Significantly different from the HFD control.
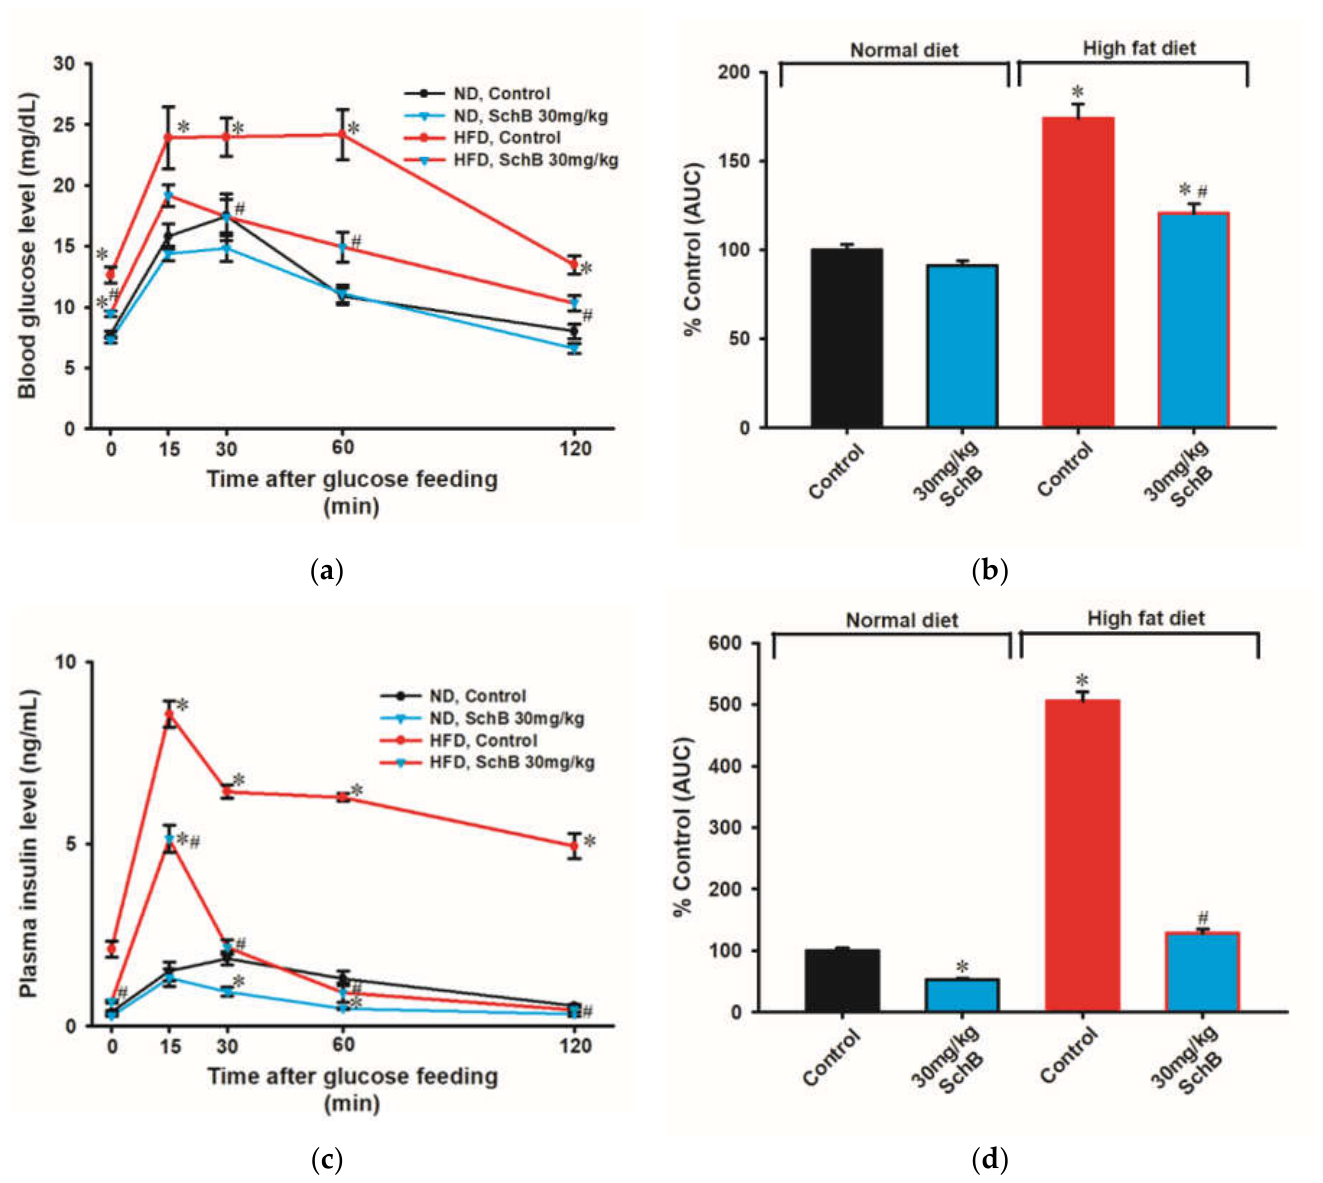
Figure 8.
Effects of Sch B on intraperitoneal glucose tolerance in ND-fed and HFD-fed mice. (a) The time course of changes in blood glucose level and data were analyzed as described in Figure 6 . (b) The changes in blood glucose levels were quantified as described in Figure 6. Data were expressed in percent control with respect to the ND control [control AUC value (arbitrary unit) = 1623 ± 135]. Values given are means ± SEM, with n = 15. * Significantly different from the ND control; # Significantly different from the HFD control.
Figure 8.
Effects of Sch B on intraperitoneal glucose tolerance in ND-fed and HFD-fed mice. (a) The time course of changes in blood glucose level and data were analyzed as described in Figure 6 . (b) The changes in blood glucose levels were quantified as described in Figure 6. Data were expressed in percent control with respect to the ND control [control AUC value (arbitrary unit) = 1623 ± 135]. Values given are means ± SEM, with n = 15. * Significantly different from the ND control; # Significantly different from the HFD control.
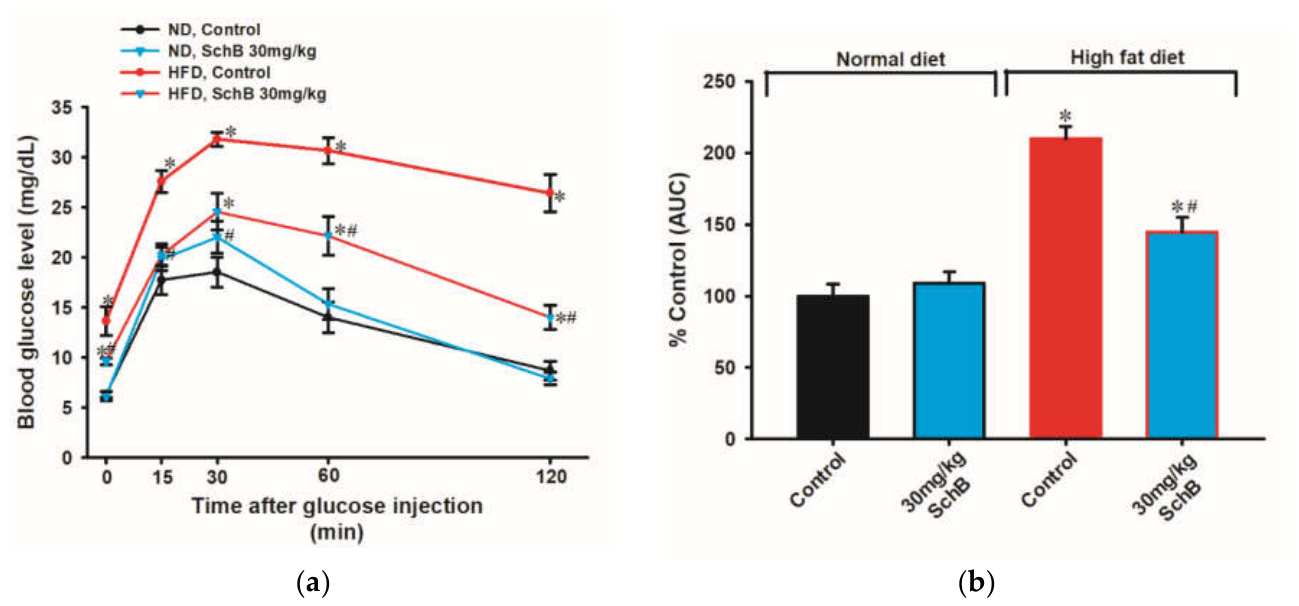
Figure 9.
Effects of Sch B or Met on plasma TNF-α level in ND-fed and HFD-fed mice. Data were expressed in percent control with respect to the ND control [control plasma TNF-α level (pg/ mL) = 116 ± 3.88 (Sch B set); 97.0 ± 1.13 (Met data set). Values given are means ± SEM, with n ≥ 4. * Significantly different from the ND control; # Significantly different from the HFD control.
Figure 9.
Effects of Sch B or Met on plasma TNF-α level in ND-fed and HFD-fed mice. Data were expressed in percent control with respect to the ND control [control plasma TNF-α level (pg/ mL) = 116 ± 3.88 (Sch B set); 97.0 ± 1.13 (Met data set). Values given are means ± SEM, with n ≥ 4. * Significantly different from the ND control; # Significantly different from the HFD control.
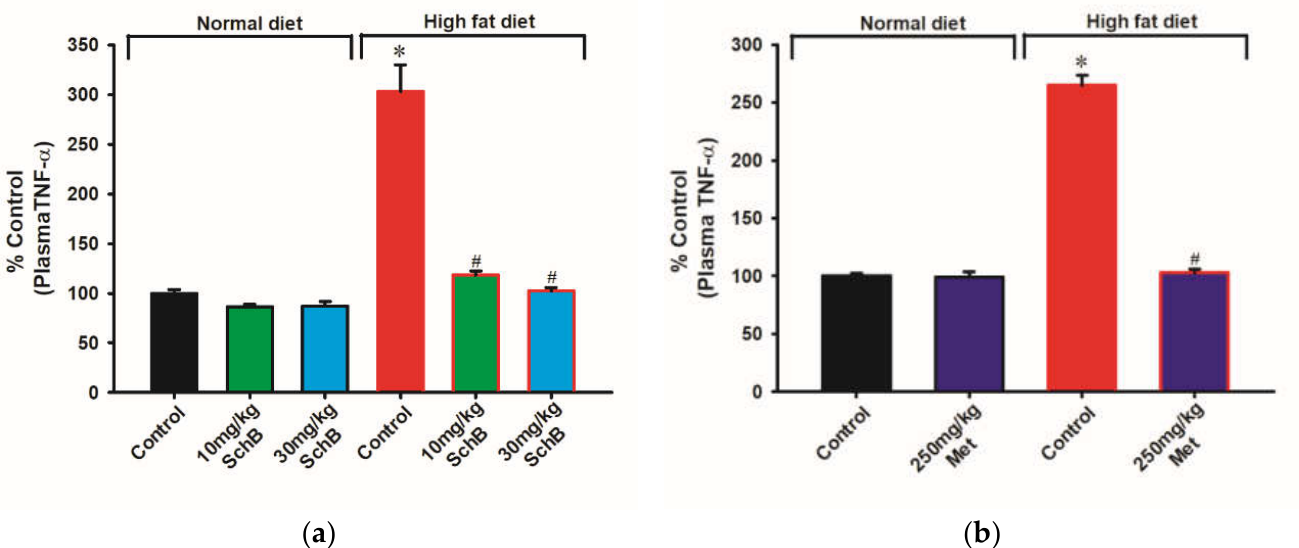
Figure 10.
Effects of Sch B or Met on plasma hepatokine levels in ND-fed and HFD-fed mice. Plasma FGF21, LECT2, and FGL1 levels were measured. Data were expressed in percent control with respect to the ND control [control plasma FGF21 level (pg/ mL) = 542 ± 12.4 (Sch B data set); 592 ± 5.96 (Met data set); control plasma LECT2 level (ng/ mL) = 10.2 ± 0.46 (Sch B data set); 13.7 ± 0.60 (Met data set); control plasma FGL1 level (pg/mL) = 930 ± 41.6 (Sch B data set); 1585 ± 57.5 (Met data set)]. Values given are means ± SEM, with n ≥ 4. * Significantly different from the ND control; # Significantly different from the HFD control.
Figure 10.
Effects of Sch B or Met on plasma hepatokine levels in ND-fed and HFD-fed mice. Plasma FGF21, LECT2, and FGL1 levels were measured. Data were expressed in percent control with respect to the ND control [control plasma FGF21 level (pg/ mL) = 542 ± 12.4 (Sch B data set); 592 ± 5.96 (Met data set); control plasma LECT2 level (ng/ mL) = 10.2 ± 0.46 (Sch B data set); 13.7 ± 0.60 (Met data set); control plasma FGL1 level (pg/mL) = 930 ± 41.6 (Sch B data set); 1585 ± 57.5 (Met data set)]. Values given are means ± SEM, with n ≥ 4. * Significantly different from the ND control; # Significantly different from the HFD control.
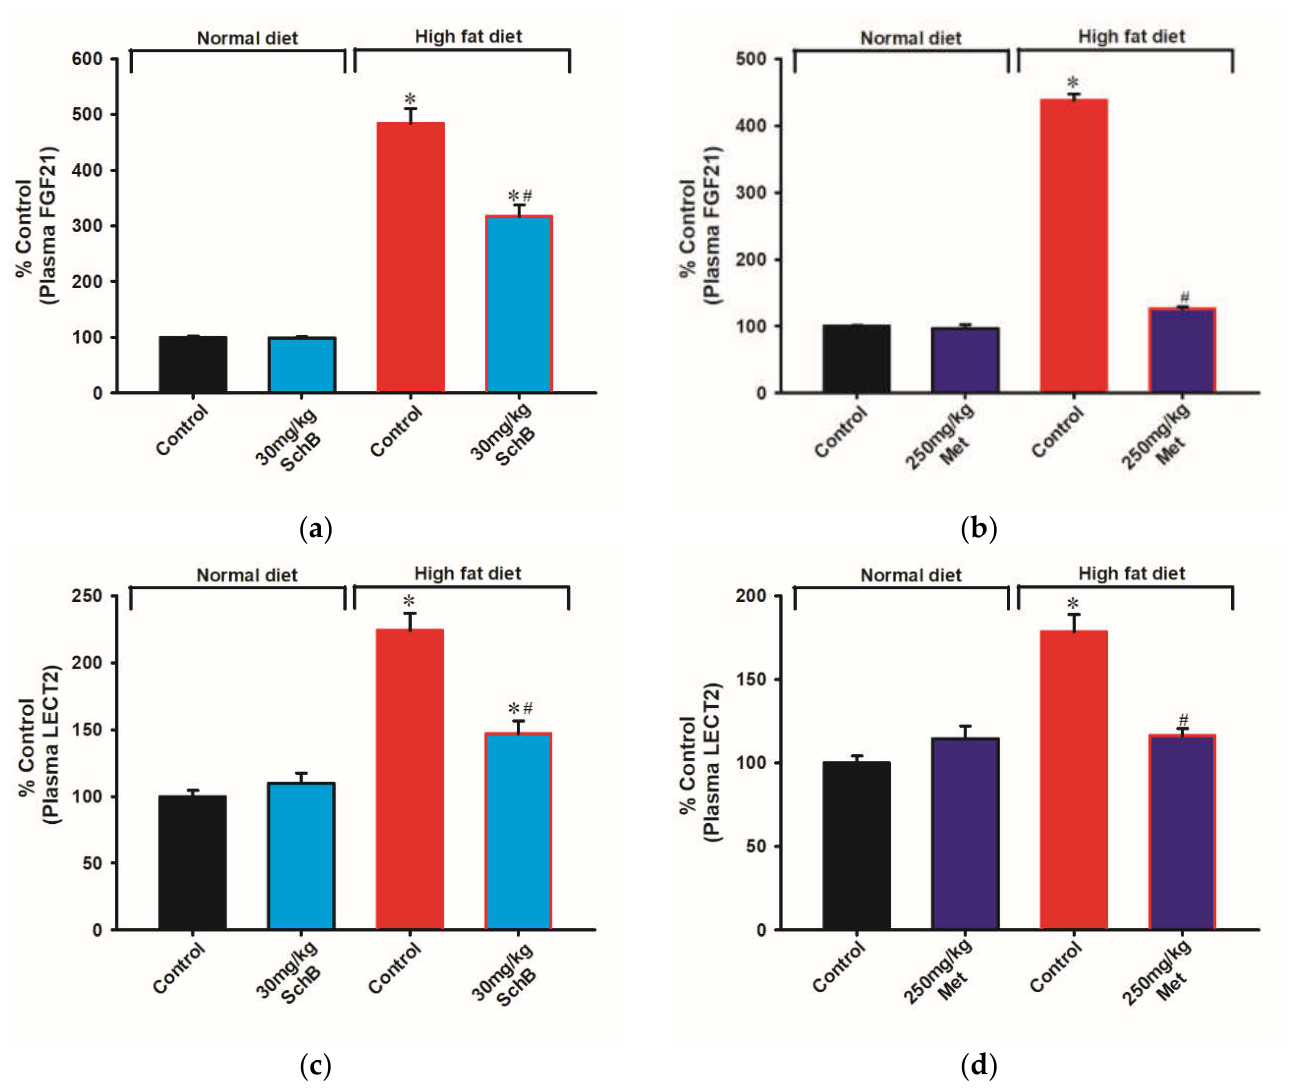
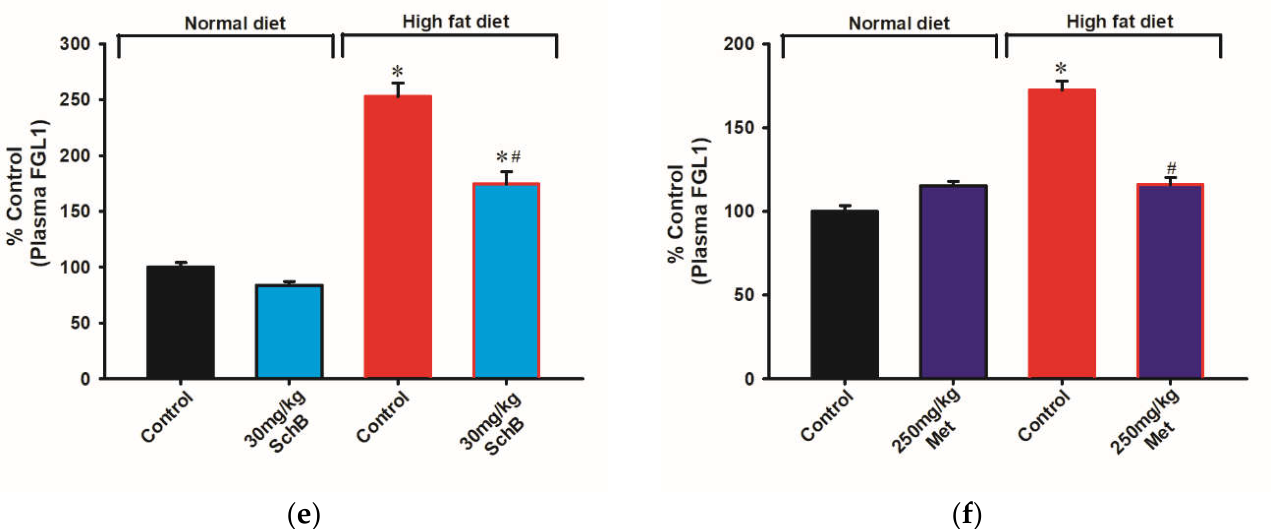
Figure 11.
Effects of Sch B or Met on hepatic lipid contents in ND-fed and HFD-fed mice. Hepatic TG and TC levels were measured. Data were expressed in percent control with respect to the ND control [control hepatic TC level (μg/mg protein): 2.16 ± 0.06 (Sch B data set); 2.64 ± 0.12 (Met data set); control hepatic TG level (μg/mg protein): 3.60 ± 0.15 (Sch B data set); 4.10 ± 0.17 (Met data set)]. Values given are means ± SEM, with n ≥ 4. * Significantly different from the ND control; # Significantly different from the HFD control.
Figure 11.
Effects of Sch B or Met on hepatic lipid contents in ND-fed and HFD-fed mice. Hepatic TG and TC levels were measured. Data were expressed in percent control with respect to the ND control [control hepatic TC level (μg/mg protein): 2.16 ± 0.06 (Sch B data set); 2.64 ± 0.12 (Met data set); control hepatic TG level (μg/mg protein): 3.60 ± 0.15 (Sch B data set); 4.10 ± 0.17 (Met data set)]. Values given are means ± SEM, with n ≥ 4. * Significantly different from the ND control; # Significantly different from the HFD control.
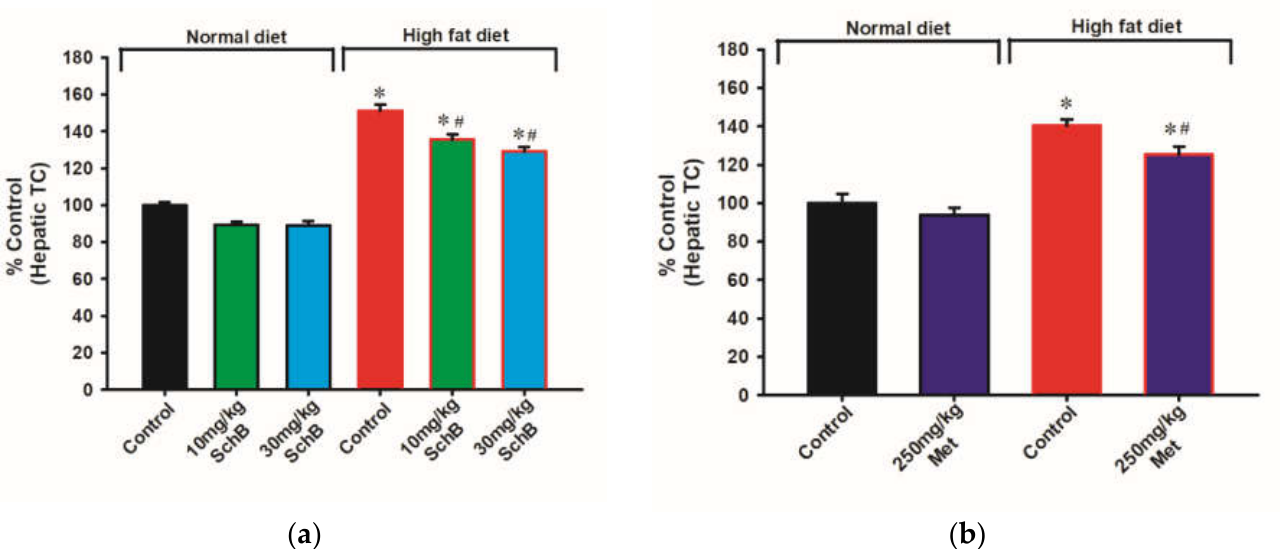
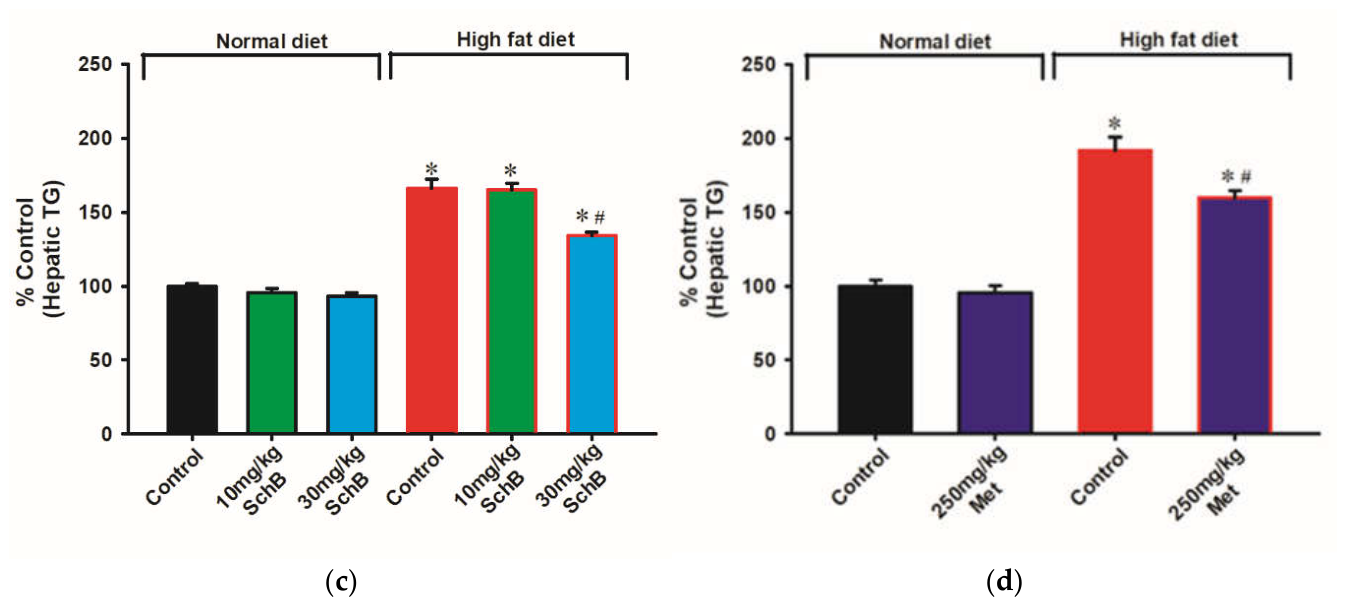
Figure 12.
Effects of Sch B on total Akt and pAkt expressions in different tissues of ND-fed and HFD-fed mice. (a-b) Posterior subcutaneous fat (c-d), skeletal muscle and (e-f) liver tissues were lysed and measured for total Akt and pAkt expressions by Western blot analysis. Data were quantified and expressed in arbitrary units. Values given are means ± SD, with n = 4. * Significantly different from the untreated ND-control.
Figure 12.
Effects of Sch B on total Akt and pAkt expressions in different tissues of ND-fed and HFD-fed mice. (a-b) Posterior subcutaneous fat (c-d), skeletal muscle and (e-f) liver tissues were lysed and measured for total Akt and pAkt expressions by Western blot analysis. Data were quantified and expressed in arbitrary units. Values given are means ± SD, with n = 4. * Significantly different from the untreated ND-control.
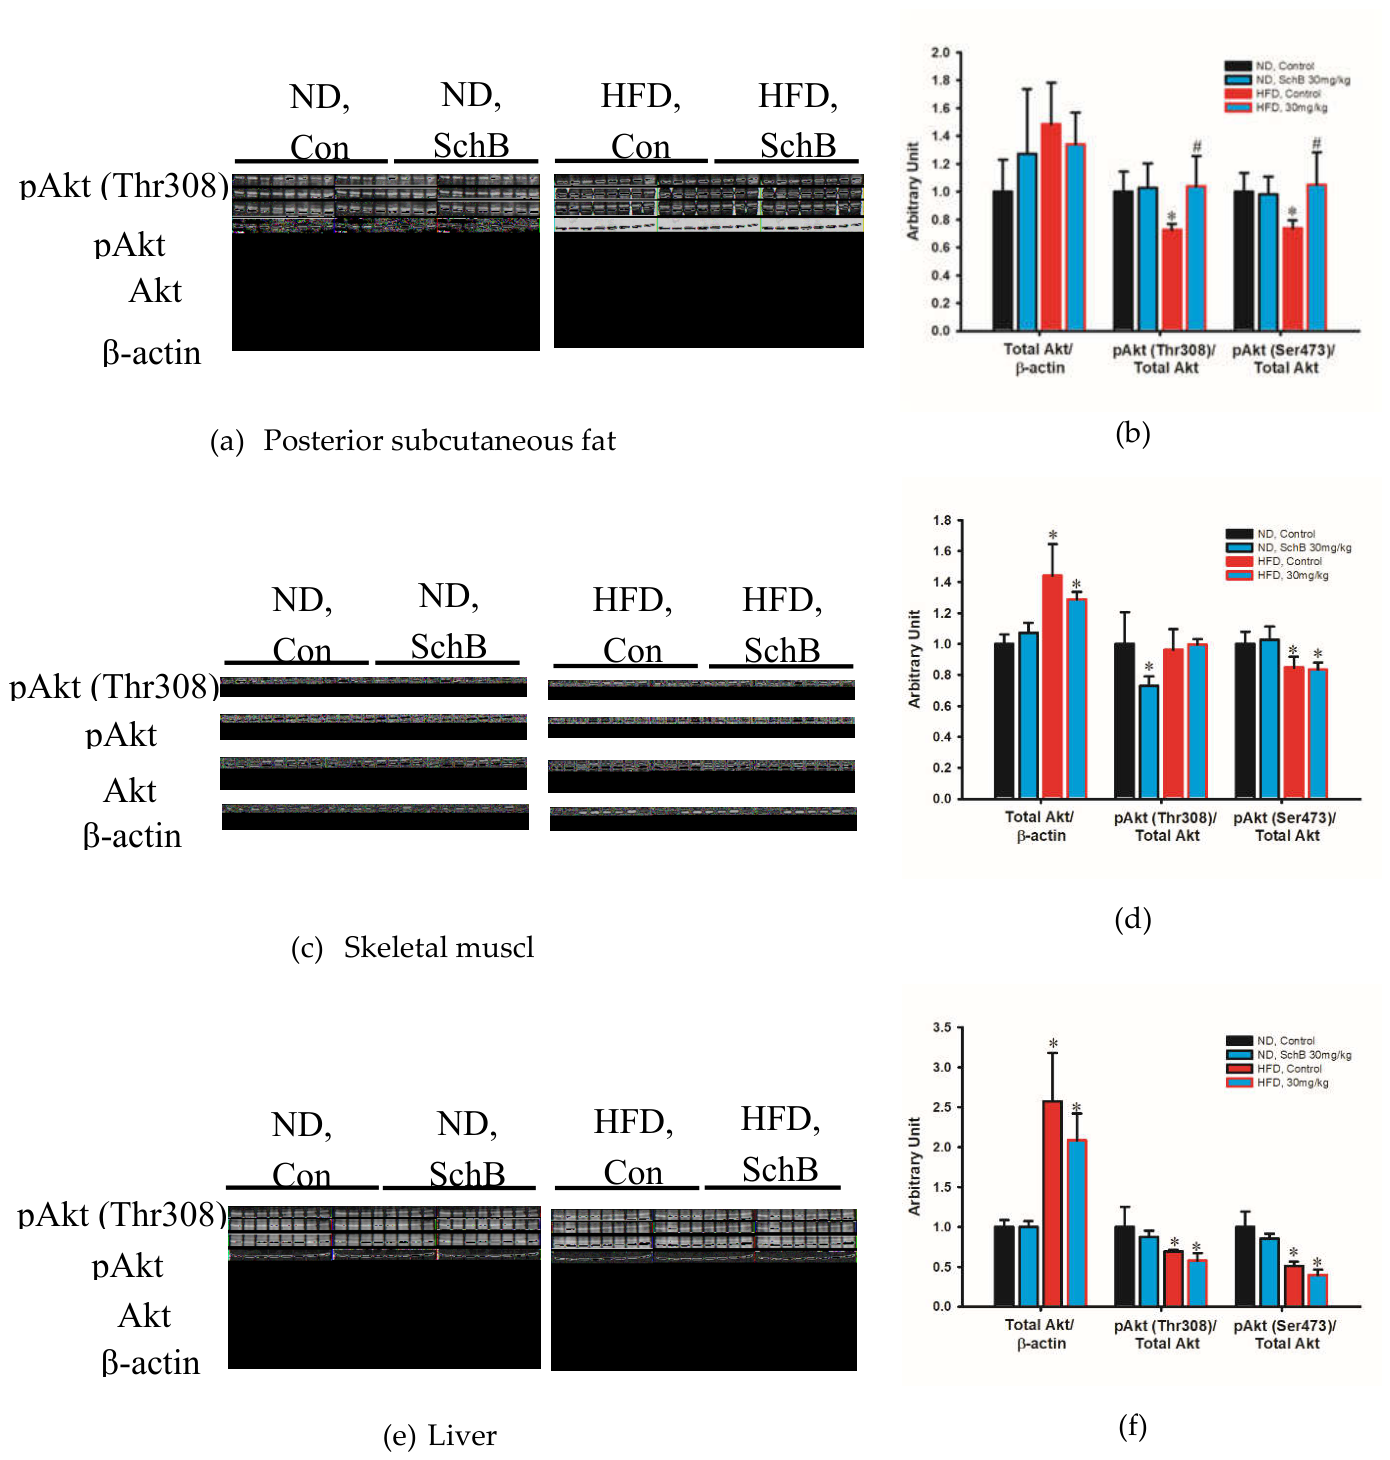
Figure 13.
Effects of Sch B on p-Akt levels from different tissues after glucose intake in ND-fed and HFD-fed mice. (a-c) Posterior subcutaneous fat (d-f), skeletal muscle and (g-i) liver samples were lysed and measured for p-Akt(Thr308) and p-Akt(Ser473) expressions as described in Figure 12. Data were quantified and expressed in arbitrary units. Values given are means ± SD, with n = 3. * Significantly different from the untreated ND-control. # Significantly different from the respective basal level (0 min).
Figure 13.
Effects of Sch B on p-Akt levels from different tissues after glucose intake in ND-fed and HFD-fed mice. (a-c) Posterior subcutaneous fat (d-f), skeletal muscle and (g-i) liver samples were lysed and measured for p-Akt(Thr308) and p-Akt(Ser473) expressions as described in Figure 12. Data were quantified and expressed in arbitrary units. Values given are means ± SD, with n = 3. * Significantly different from the untreated ND-control. # Significantly different from the respective basal level (0 min).
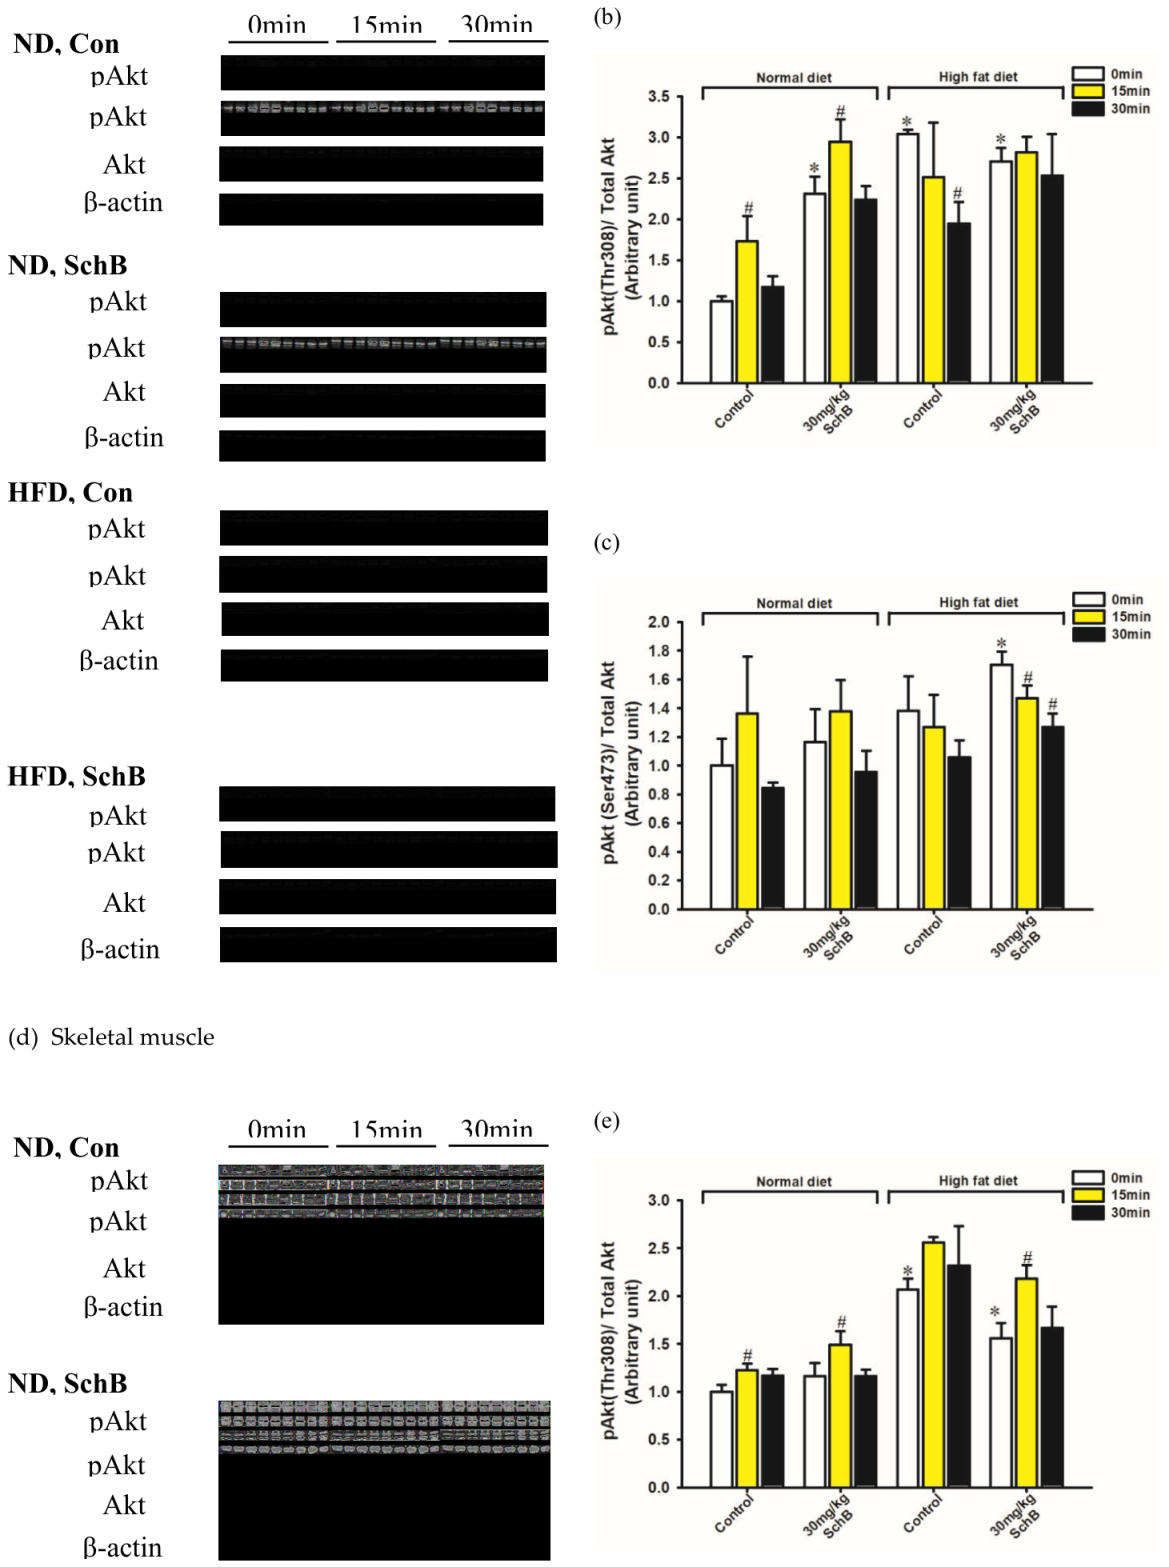
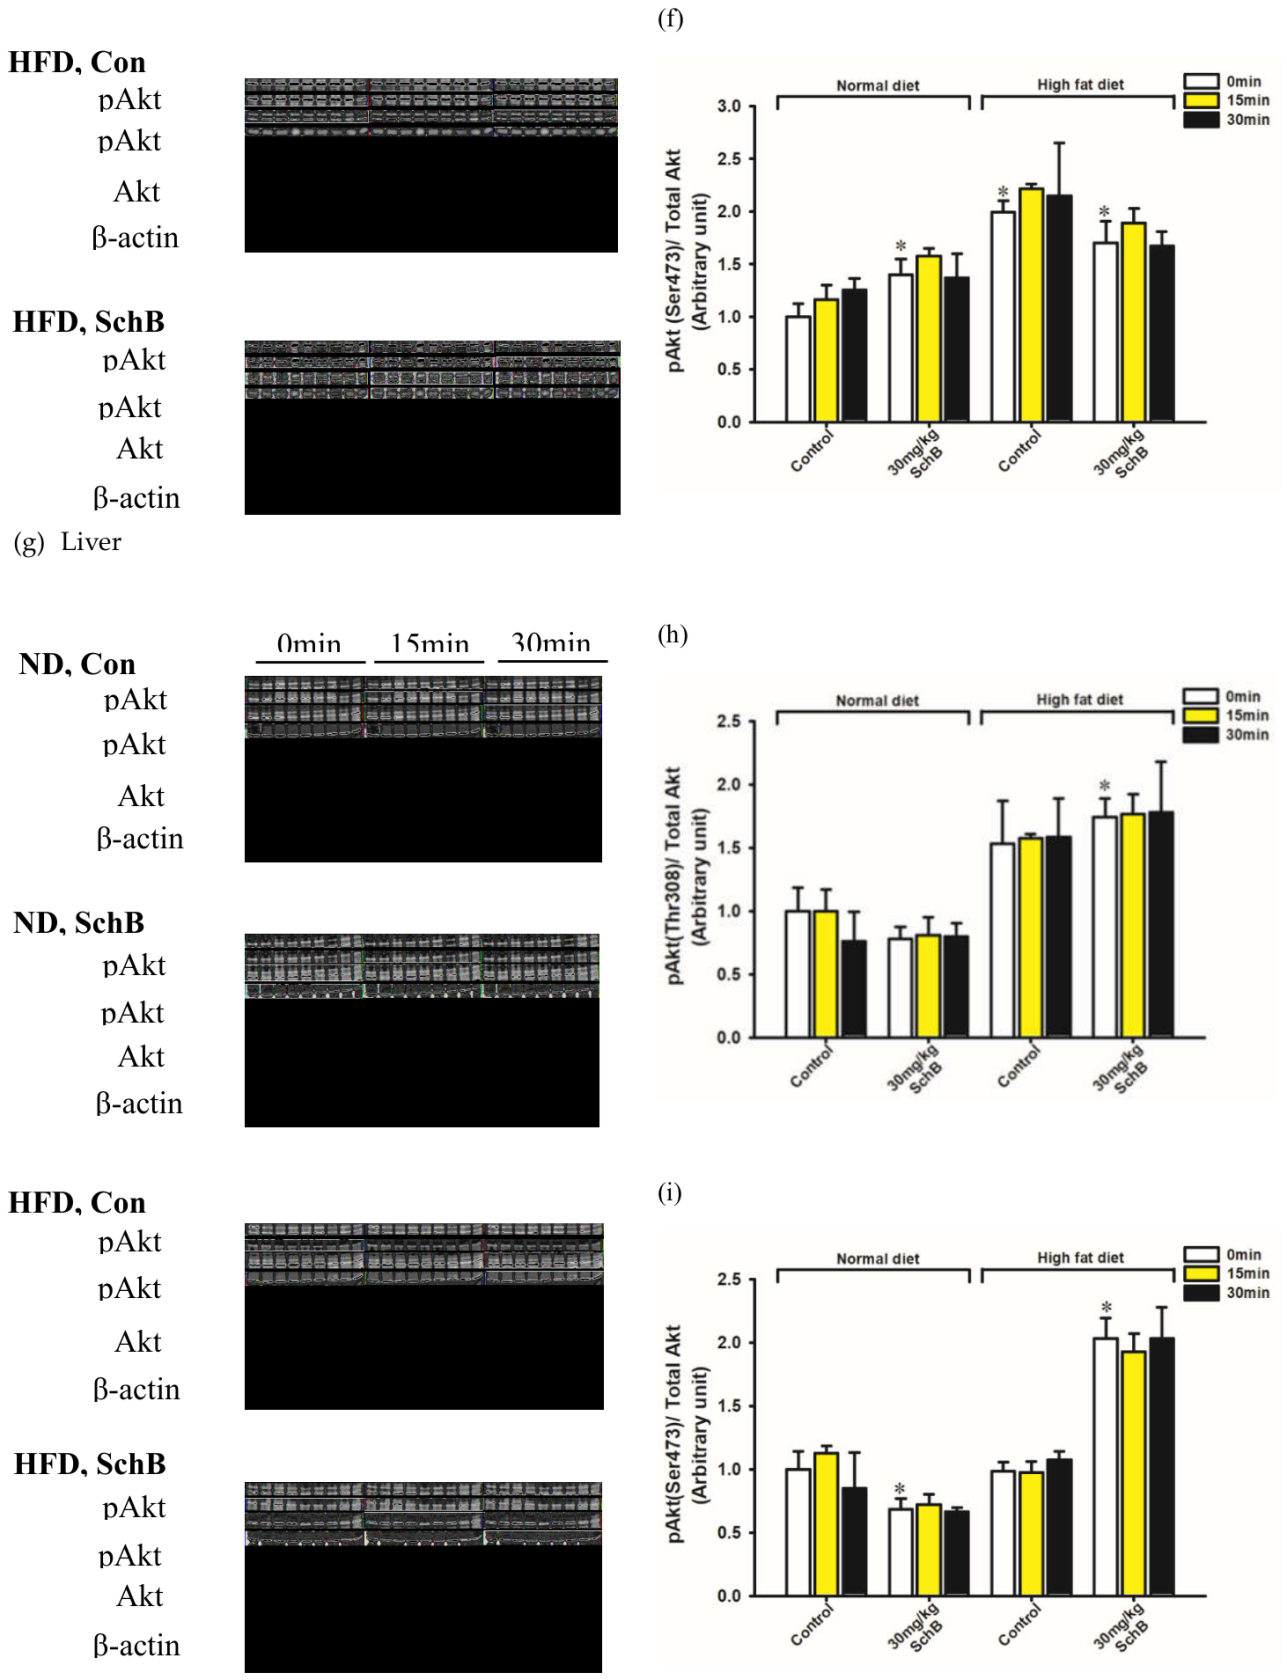
Figure 14.
Effects of Sch B on GRP78 expression from different tissue lysates in ND-fed and HFD-fed mice. (a) Posterior subcutaneous fat, (b) skeletal muscle, and (c) liver samples were lysed as described in Materials and Methods, and GRP78 level was measured by Western blot analysis. Data were quantified and expressed in arbitrary units. Values given are means ± SD, with n = 3-4. * Significantly different from the untreated ND-control. # Significantly different from the HFD-control.
Figure 14.
Effects of Sch B on GRP78 expression from different tissue lysates in ND-fed and HFD-fed mice. (a) Posterior subcutaneous fat, (b) skeletal muscle, and (c) liver samples were lysed as described in Materials and Methods, and GRP78 level was measured by Western blot analysis. Data were quantified and expressed in arbitrary units. Values given are means ± SD, with n = 3-4. * Significantly different from the untreated ND-control. # Significantly different from the HFD-control.
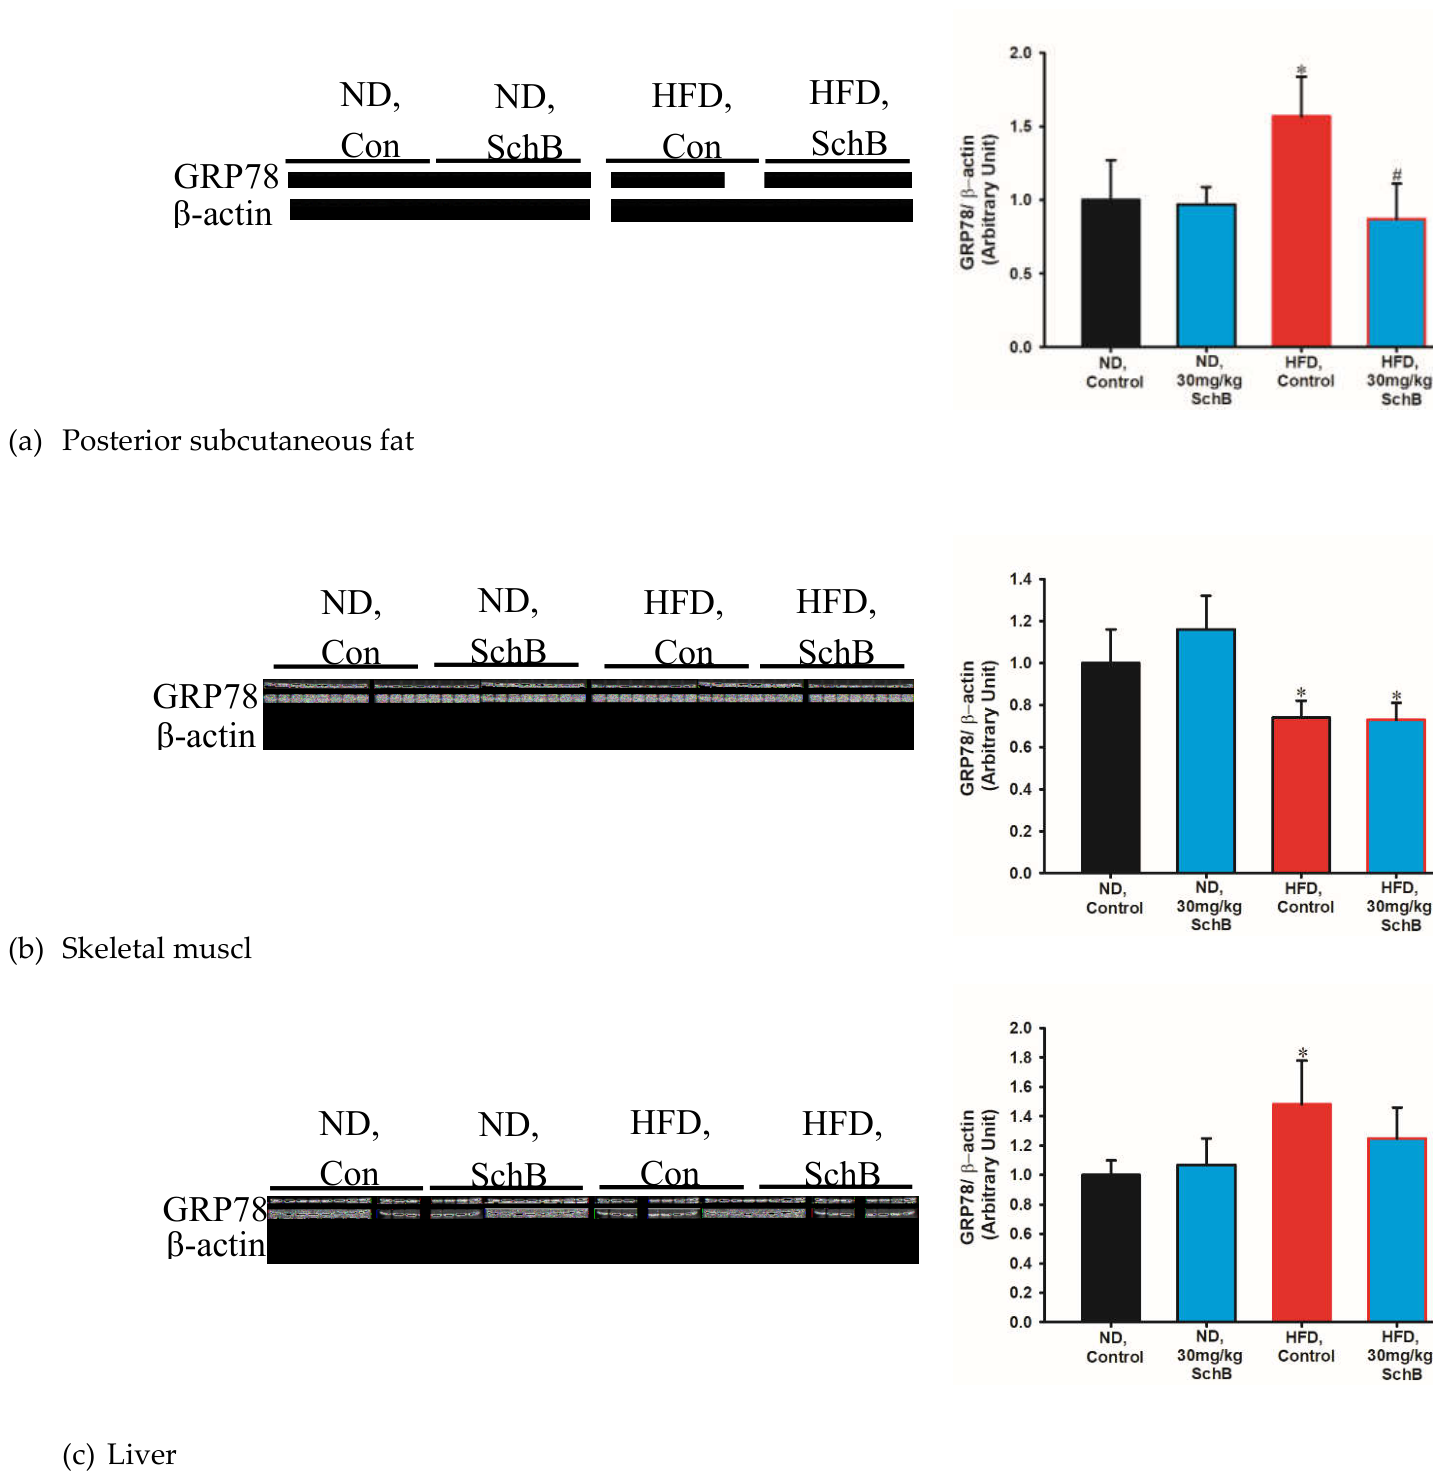
Figure 15.
Effects of Sch B on XBP-1s expression from different tissues in ND-fed and HFD-fed mice. (a) Posterior subcutaneous fat, (b) skeletal muscle, and (c) liver tissues were lysed and measured for XBP-1s level by Western blot analysis. Data were quantified and expressed in arbitrary units. Values given are means ± SD, with n = 3-4. * Significantly different from the untreated ND-control. # Significantly different from the HFD-control.
Figure 15.
Effects of Sch B on XBP-1s expression from different tissues in ND-fed and HFD-fed mice. (a) Posterior subcutaneous fat, (b) skeletal muscle, and (c) liver tissues were lysed and measured for XBP-1s level by Western blot analysis. Data were quantified and expressed in arbitrary units. Values given are means ± SD, with n = 3-4. * Significantly different from the untreated ND-control. # Significantly different from the HFD-control.
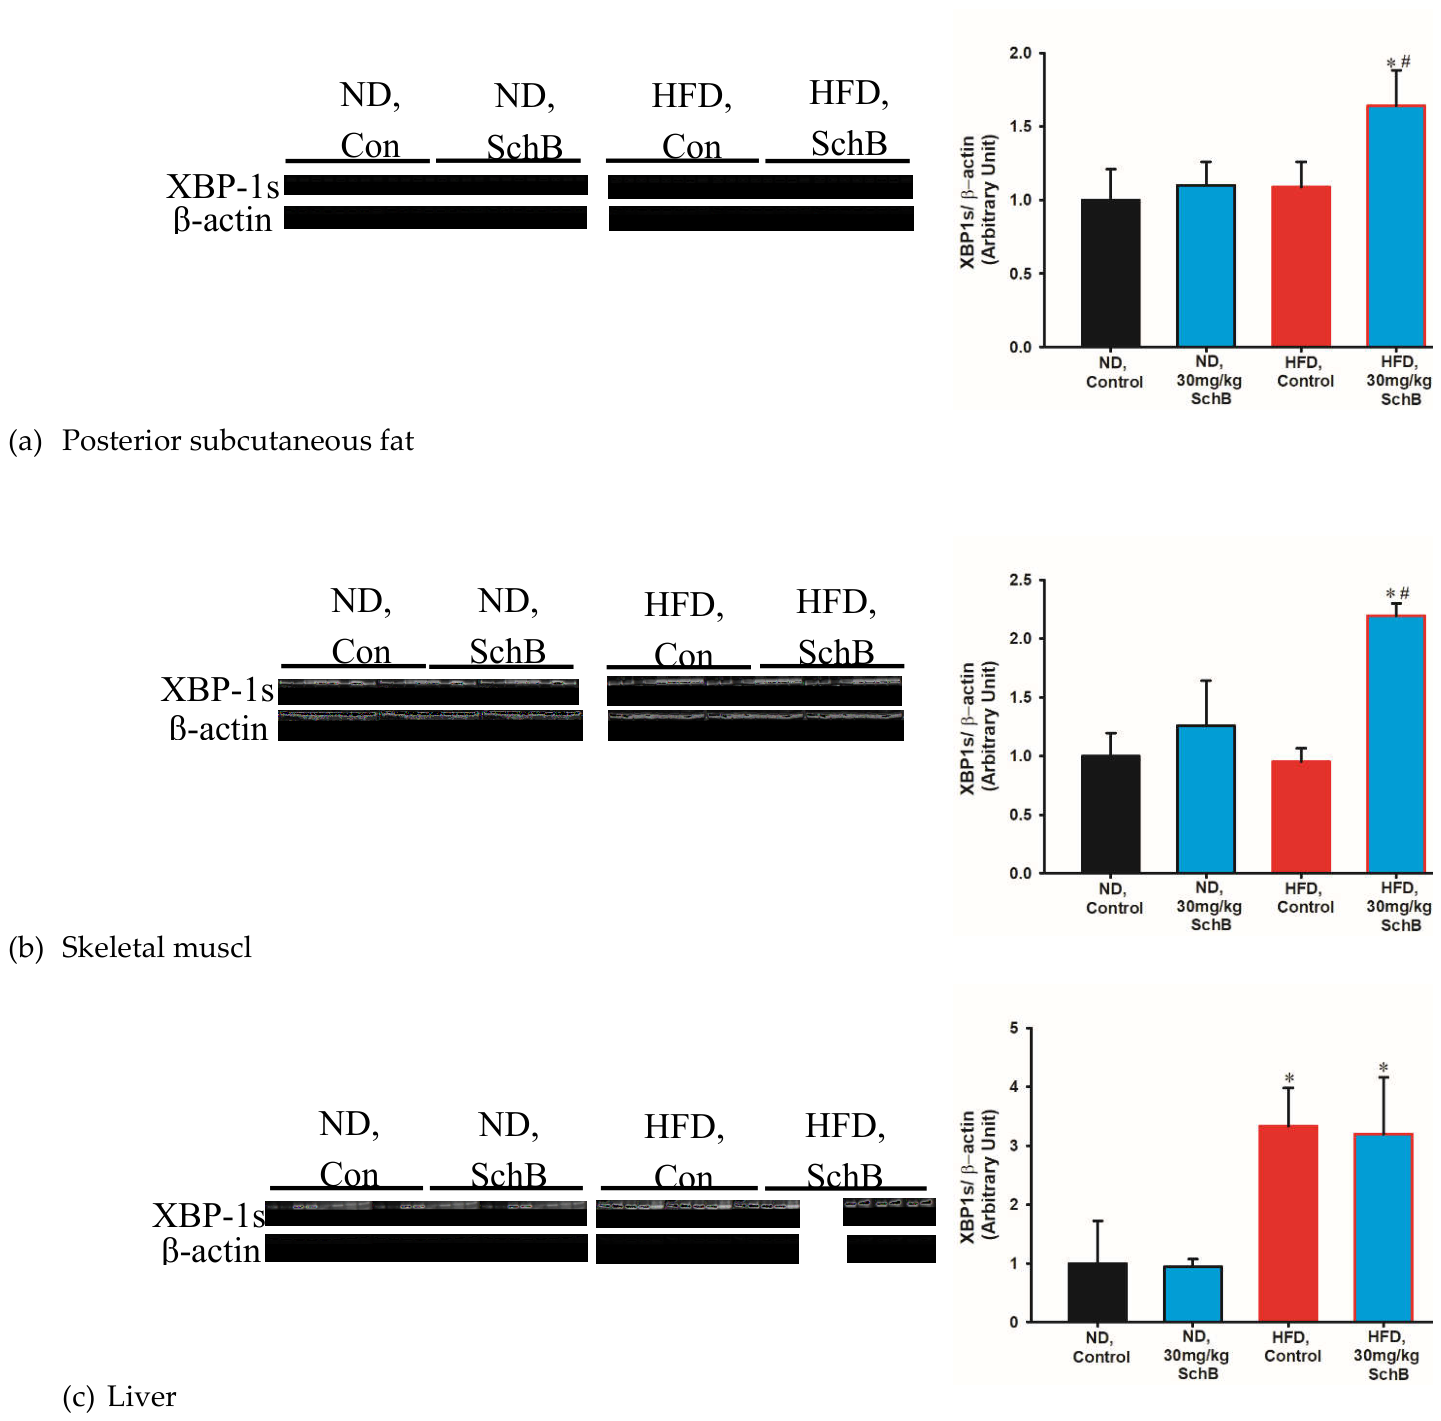

Table 1.
The effect of Sch B or Met on TyG index in ND-fed and HFD-fed mice. TyG indices were calculated by plasma fasting glucose and TG. Values given are means ± SEM, with n ≥ 4. * Significantly different from the ND control; # Significantly different from the HFD control.
Table 1.
The effect of Sch B or Met on TyG index in ND-fed and HFD-fed mice. TyG indices were calculated by plasma fasting glucose and TG. Values given are means ± SEM, with n ≥ 4. * Significantly different from the ND control; # Significantly different from the HFD control.
| (a) | ||||
| Diet | Group | TyG index | ||
| ND | Control | 4.34 | ± | 0.02 |
| Sch B, 10 mg/kg | 4.31 | ± | 0.01 | |
| Sch B, 30 mg/kg | 4.36 | ± | 0.04 | |
| HFD | Control | 4.63 | ± | 0.02* |
| Sch B, 10 mg/kg | 4.53 | ± | 0.03*# | |
| Sch B, 30 mg/kg | 4.51 | ± | 0.02*# | |
| (b) | ||||
| Diet | Group | TyG index | ||
| ND | Control | 4.24 | ± | 0.02 |
| Met, 250 mg/kg | 4.28 | ± | 0.02 | |
| HFD | Control | 4.48 | ± | 0.03* |
| Met, 250 mg/kg | 4.24 | ± | 0.02# | |
Table 2.
The effect of Sch B or Met on QUICKI and Adipo-IR in ND-fed and HFD-fed mice. QUICKI and Adipo-IR values were calculated as described in Materials and Methods. Data were expressed in percent control with respect to the ND control [control QUICKI value (arbitrary unit) = 0.36 ± 0.00 (Sch B data set); 0.36 ± 0.00 (Met data set); control Adipo-IR value (arbitrary unit) = 4.09 ± 0.17 (Sch B data set); 4.43 ± 0.30 (Met data set)]. Values given are means ± SEM, with n ≥ 4. * Significantly different from the ND control; # Significantly different from the HFD control.
Table 2.
The effect of Sch B or Met on QUICKI and Adipo-IR in ND-fed and HFD-fed mice. QUICKI and Adipo-IR values were calculated as described in Materials and Methods. Data were expressed in percent control with respect to the ND control [control QUICKI value (arbitrary unit) = 0.36 ± 0.00 (Sch B data set); 0.36 ± 0.00 (Met data set); control Adipo-IR value (arbitrary unit) = 4.09 ± 0.17 (Sch B data set); 4.43 ± 0.30 (Met data set)]. Values given are means ± SEM, with n ≥ 4. * Significantly different from the ND control; # Significantly different from the HFD control.
| (a) | |||||||
| Diet | Group | QUICKI | Adipo-IR | ||||
| ND | Control | 100 | ± | 0.50 | 100 | ± | 2.79 |
| Sch B, 10 mg/kg | 100 | ± | 1.10 | 99.0 | ± | 8.54 | |
| Sch B, 30 mg/kg | 99.4 | ± | 0.47 | 106 | ± | 4.48 | |
| HFD | Control | 69.6 | ± | 0.52* | 1468 | ± | 91.8* |
| Sch B, 10 mg/kg | 78.3 | ± | 0.59*# | 448 | ± | 29.1*# | |
| Sch B, 30 mg/kg | 81.7 | ± | 0.35*# | 356 | ± | 9.10*# | |
| (b) | |||||||
| Diet | Group | QUICKI | Adipo-IR | ||||
| ND | Control | 100 | ± | 0.95 | 100 | ± | 6.68 |
| Met, 250 mg/kg | 101 | ± | 1.05 | 83.8 | ± | 4.20 | |
| HFD | Control | 72.4 | ± | 0.29* | 1028 | ± | 30.5* |
| Met, 250 mg/kg | 92.1 | ± | 0.81*# | 173 | ± | 9.12# | |
Table 3.
The effect of Sch B or Met on plasma leptin and adiponectin levels in ND-fed and HFD-fed mice. Values given are means ± SEM, with n ≥ 4. * Significantly different from the ND control; # Significantly different from the HFD control.
Table 3.
The effect of Sch B or Met on plasma leptin and adiponectin levels in ND-fed and HFD-fed mice. Values given are means ± SEM, with n ≥ 4. * Significantly different from the ND control; # Significantly different from the HFD control.
| (a) | ||||||||
| Diet | Group | Adiponectin (μg/mL) | Leptin (ng/mL) | Adiponectin/ Leptin Ratio | ||||
| ND | Control | 6.19 | ± | 0.07 | 1.07 | ± | 0.02 | 5.79 |
| Sch B, 30 mg/kg | 5.93 | ± | 0.09 | 1.04 | ± | 0.02 | 5.70 | |
| HFD | Control | 5.29 | ± | 0.08* | 43.0 | ± | 1.62* | 0.12 |
| Sch B, 30 mg/kg | 5.38 | ± | 0.12* | 12.6 | ± | 0.47*# | 0.43 | |
| (b) | ||||||||
| Diet | Group | Adiponectin (μg/mL) | Leptin (ng/mL) | Adiponectin/ Leptin Ratio | ||||
| ND | Control | 6.05 | ± | 0.09 | 1.13 | ± | 0.03 | 5.35 |
| Met, 250 mg/kg | 6.39 | ± | 0.12 | 1.04 | ± | 0.03 | 6.14 | |
| HFD | Control | 4.99 | ± | 0.12* | 42.3 | ± | 1.51* | 0.12 |
| Met, 250 mg/kg | 6.07 | ± | 0.11# | 1.20 | ± | 0.03# | 5.06 | |
Disclaimer/Publisher’s Note: The statements, opinions and data contained in all publications are solely those of the individual author(s) and contributor(s) and not of MDPI and/or the editor(s). MDPI and/or the editor(s) disclaim responsibility for any injury to people or property resulting from any ideas, methods, instructions or products referred to in the content. |
© 2026 by the authors. Licensee MDPI, Basel, Switzerland. This article is an open access article distributed under the terms and conditions of the Creative Commons Attribution (CC BY) license (http://creativecommons.org/licenses/by/4.0/).
Copyright: This open access article is published under a Creative Commons CC BY 4.0 license, which permit the free download, distribution, and reuse, provided that the author and preprint are cited in any reuse.


