

Submitted:
20 May 2026
Posted:
21 May 2026
You are already at the latest version
Abstract
This study analyzes the organizational and environmental determinants that predict the intention to adopt biogas–solar microgrids within a circular bioeconomy framework. A quantitative, applied, cross-sectional, and exploratory design was used with 71 valid responses from actors linked to productive, agro-industrial, livestock, energy, and waste-management sectors. The questionnaire measured perceived benefits, barriers, institutional conditions, financial feasibility, environmental value, organizational capabilities, and adoption intention. Psychometric reliability was assessed using Cronbach’s alpha and McDonald’s omega, and predictive modeling compared supervised classification, regression, and unsupervised segmentation techniques. ExtraTrees achieved the best classification performance, with a test ROC-AUC of 0.889, while RandomForestRegressor showed the best regression performance. Organizational capabilities and environmental criteria emerged as the most influential predictors, and K-Means identified two readiness profiles. The findings suggest that adoption intention depends on a systemic configuration of organizational maturity, environmental legitimacy, financial feasibility, and institutional support.
Keywords:
biogas
; solar energy
; microgrids
; circular bioeconomy
; renewable energy
; machine learning
; technology adoption
; organizational capabilities
; environmental sustainability
; energy transition
1. Introduction
The transition toward decentralized and renewable-based energy systems has become one of the strategic priorities of the global climate agenda, particularly in rural territories where dependence on fossil fuels continues to operate as a structural obstacle to sustainable development. According to Tracking SDG 7: The Energy Progress Report 2025, jointly prepared by the International Energy Agency, the International Renewable Energy Agency, the United Nations Statistics Division, the World Bank, and the World Health Organization [1], approximately 666 million people still lacked access to electricity in 2023, while nearly 2.1 billion remained dependent on polluting fuels for cooking. This gap makes the achievement of universal access by 2030 unfeasible if the current pace of progress is maintained.
In addition, Sub-Saharan Africa accounts for approximately 85% of this deficit, while rural regions of Latin America and South Asia share similar structural patterns, in which geographic dispersion, low population density, and the limited profitability of conventional grid expansion make hybrid microgrids the most technically viable and economically competitive alternative. Consequently, systems that combine photovoltaic generation with anaerobic digestion for biogas production emerge as a particularly promising configuration because of their seasonal complementarity, their capacity to use agricultural and livestock residues, and their alignment with the guiding principles of the circular bioeconomy [2,3,4].
Despite the growing technical evidence supporting the feasibility of these hybrid solutions, the specialized scientific literature has focused predominantly on sizing optimization, economic dispatch, and techno-economic analysis, leaving comparatively underexplored the behavioral and organizational determinants that condition the effective adoption decision [5,6,7]. Indeed, while HOMER-based simulation tools, metaheuristic algorithms, and multi-objective models have reached considerable methodological maturity for sizing biogas-solar microgrids [8,9,10], a tangible disconnect persists between the technological prescriptions derived from such models and the actual willingness of recipient organizations to internalize these solutions in their daily operations.
Likewise, the most recent evidence on barriers to renewable energy integration indicates that obstacles are not concentrated exclusively in the financial dimension; rather, they are intertwined with institutional factors, internal organizational capabilities, and perceived environmental legitimacy. This condition requires integrative analytical frameworks capable of capturing such multidimensionality [11,12,13]. In addition, bibliometric studies published over the last three years converge in showing that the conversion of favorable environmental attitudes into effective investment intentions remains a process mediated by internal configurations that have not yet been sufficiently mapped within the circular bioenergy field.
In parallel, interpretable machine learning has consolidated its role as an increasingly prominent analytical tool in energy transition research, owing to its ability to model nonlinear relationships among multiple predictors while preserving the traceability of predictive decisions through permutation importance, SHAP values, and hierarchical variable-decomposition techniques [14,15]. However, its specific application to modeling the adoption intention of hybrid biogas-solar microgrids within explicit circular bioeconomy frameworks remains, to date, a scarcely explored niche, particularly in Latin American contexts where the convergence of residual biomass availability, high solar irradiation, and unmet rural demand would generate ideal conditions for deployment.
Accordingly, the research problem is synthesized in the following guiding question: what configuration of organizational and environmental determinants makes it possible to predict, through interpretable machine learning, the adoption intention of biogas-solar microgrids in organizations embedded within a circular bioeconomy framework? This question is disaggregated into three operational questions: what is the aggregate descriptive profile of the predictor blocks; which supervised algorithm provides the best balance between predictive performance and interpretability; and which latent profiles can be identified through unsupervised segmentation as an explanatory complement to the main model.
The justification of the study rests on three complementary analytical dimensions. From the theoretical dimension, the study provides exploratory evidence regarding the articulation between internal organizational capabilities and perceived environmental legitimacy as antecedents of technological intention, thereby extending classical technology-adoption frameworks toward a systemic approach to sociotechnical maturity that integrates capabilities, perceptions, and contextual conditions within a single explanatory model [16]. From the methodological dimension, it integrates a reproducible pipeline that combines supervised classification, continuous regression, and unsupervised segmentation using ExtraTrees, Random Forest, permutation importance, principal component analysis, and K-Means clustering, thereby strengthening interpretive capacity without sacrificing predictive performance, a fundamental requirement for data science tools to be adopted by the environmental research community [14]. From the applied dimension, the findings may guide the design of targeting policies intended to identify organizational profiles with greater willingness to invest in circular bioenergy solutions, thus facilitating the prioritization of public and private resources in territories where financial, institutional, and organizational-capability constraints coexist simultaneously. In this sense, the study is positioned as an analytical bridge between the technical evidence accumulated by the techno-economic literature and the operational needs of those who design instruments to promote the energy transition.
The knowledge gap addressed by this study emerges from the convergence of four systematically identified gaps. First, most research on biogas-solar microgrids privileges techno-economic analysis over the behavioral component, producing knowledge that is useful for sizing but insufficient for sustained implementation [17,18]. Second, studies addressing renewable-energy adoption often rely on classical linear models, such as logistic regression, multilevel regression, or structural equations, thereby underusing the potential of tree-ensemble algorithms to capture complex interactions among behavioral predictors [19]. Third, the specific dimension of the circular bioeconomy has been treated predominantly from macroeconomic or public-policy perspectives, with limited incorporation at the organizational micro level, which restricts its usefulness for operational decision-making [16]. Finally, the evidence available from developing economies in Latin America regarding circular technology adoption remains fragmented and dispersed. For these reasons, the study is explicitly aligned with Sustainable Development Goal 7, which concerns affordable and clean energy; Goal 12, related to responsible consumption and production; and Goal 13, associated with urgent climate action, thereby articulating its scientific contribution with global targets on energy access, organic-waste valorization, and greenhouse-gas mitigation.
As a consequence of the preceding framework, the general objective of the study is to analyze, through interpretable machine learning, the organizational and environmental determinants that predict the adoption intention of biogas-solar microgrids within a circular bioeconomy framework. Three specific objectives derive from this general objective: first, to identify the aggregate descriptive profile of the organizational, environmental, financial, institutional, perceived-benefit, and barrier variable blocks associated with adoption intention; second, to compare the predictive performance of eight supervised classification algorithms and eight continuous-regression algorithms, selecting the model with the best discriminant and interpretive capacity according to a composite criterion integrating ROC AUC, F1 score, balanced accuracy, and average precision; and third, to identify latent organizational-readiness profiles through unsupervised segmentation with K-Means and validation by silhouette coefficient, thereby complementing the supervised predictive reading with a typological reading of the cases.
Based on the available conceptual evidence, three working hypotheses are proposed. The first hypothesis (H1) states that organizational capabilities constitute the predictor block with the greatest explanatory weight over adoption intention, surpassing perceived benefits, institutional conditions, and financial factors. The second hypothesis (H2) proposes that tree-ensemble algorithms will outperform penalized linear models in predictive capacity because of the nonlinear nature of the interactions among behavioral predictors. The third hypothesis (H3) posits that the sample will reveal at least two differentiated latent profiles, in which high intention will emerge from a systemic configuration that simultaneously articulates organizational capabilities, environmental legitimacy, financial feasibility, and institutional conditions, rather than from a single isolated factor.
2. Theoretical Framework and Hypothesis Development
2.1. Technology Adoption Intention in Energy Transitions
Within classical planned-behavior frameworks, adoption intention constitutes the most robust proximal antecedent of effective behavior, in accordance with Ajzen’s seminal formulation [20] of the Theory of Planned Behavior. In the energy domain, this tradition has been extended through the UTAUT2 model and the integration of contextual variables that recognize the collective nature of organizational decision-making.
On this basis, recent evidence published in first-quartile journals confirms the relevance of the extended model for examining hybrid technologies: Oliva and Atehortua Santamaria [21] synthesize thirteen theoretical frameworks applied to solar adoption in developing countries and note that the combination of attitudes, social norms, and perceived control explains between 45% and 60% of intentional variance. Consistently, Qamar et al. [22] report, in a study on rural biodigesters, positive and significant regression coefficients for perceived usefulness (β = 0.41) and institutional trust (β = 0.33), supporting the operationalization of intention as an aggregate construct based on three Likert items, as was done in the present study through the INT1, INT2, and INT3 indicators.
Bakhuis et al. [23], for their part, highlight a frequent phenomenon in intention research: the so-called intention-behavior gap, according to which stated dispositions overestimate actual decisions when financial, institutional, or capability constraints are present. This observation therefore imposes two analytical cautions that the present study deliberately incorporates: on the one hand, dual modeling through a continuous score and a binary variable with a demanding threshold (≥ 4.0); and, on the other hand, the inclusion of predictor blocks that specifically capture the enabling contextual conditions.
2.2. Organizational Capabilities as Antecedents of the Technological Decision
The resource-based view, originally formulated by Barney [24], holds that an organization’s capacity to appropriate an innovation depends on the internal assets it controls, particularly when such assets are valuable, rare, inimitable, and organizable. Cohen and Levinthal [25] complement this perspective through the construct of absorptive capacity, understood as the ability to recognize, assimilate, and apply external knowledge for commercial purposes.
In the bioenergy domain, this theoretical articulation has gained renewed relevance. Kunskaja and Pažėraitė [26] examine determinants of renewable-technology deployment through a systematic review of 187 studies and conclude that internal technical-administrative capabilities constitute the factor with the greatest explanatory consistency, even above financial availability. Along the same argumentative line, Ahmar et al. [27] report that organizational infrastructure and management capability predict biogas adoption with an elasticity of 0.52, higher than the elasticity observed for direct economic incentives.
These findings therefore support the hypothesis that the ORG block will operate as the dominant predictor in modeling adoption intention. The present study adopts this theoretical reading and integrates six organizational indicators (ORG1 to ORG6) that capture technical, managerial, absorptive, and internal coordination capabilities, thereby allowing an empirical approximation to the construct of organizational maturity proposed by the classical literature and refined by recent bioenergy evidence.
2.3. Environmental Legitimacy and Institutional Isomorphism
Legitimacy Theory, developed by Suchman [28], posits that organizations adopt practices and technologies whose symbolism is congruent with the socially constructed value systems of their environment. Applied to the bioenergy field, this perspective suggests that the adoption of biogas-solar microgrids does not respond exclusively to economic calculations but also operates, to a considerable extent, as a mechanism of legitimation vis-à-vis environmental, regulatory, and community stakeholders.
Recent evidence published in Q1 journals corroborates this reading. Hussain et al. [29] demonstrate, through statistical analysis of 312 solar projects in England, that perceived environmental legitimacy explains 38% of the variability in local approvals, controlling for economic variables. Additionally, Hildebrand et al. [30] report, based on a representative German sample, that environmental concern measured with a validated scale predicts the acceptance of Power-to-X technologies with a standardized coefficient of 0.47, a result that exceeds predictors traditionally associated with perceived usefulness or technological trust.
Complementarily, Osei et al. [31] and López et al. [32] warn that environmental legitimacy should not be interpreted as a monolithic variable; rather, it operates through differentiated mechanisms that include personal ecological values, peer normative pressure, and exposure to public discourses on climate change. Therefore, the eight items of the ENV block incorporated in the present study capture this multidimensionality and enable a granular reading of the construct, rather than a reductionist aggregation that would sacrifice explanatory richness.
2.4. Perceived Barriers, Financial Factors, and Institutional Conditions
Diffusion of Innovations Theory, proposed by Rogers [33], identifies five attributes that modulate the speed of adoption: relative advantage, compatibility, complexity, observability, and trialability. When these attributes are negative, they configure barriers that slow down or nullify technological transition. The Multi-Level Perspective, formulated by Geels [34], also adds a systemic dimension by considering that the adoption of sustainable innovations depends on the dynamic interaction among niches, regimes, and sociotechnical landscapes.
Sträter et al. [35] provide empirical evidence of these mechanisms in a study on seasonal thermal energy storage, in which perceived technical complexity and regulatory uncertainty emerge as the two barriers with the greatest explanatory weight. Martens et al. [36], for their part, report in a mixed sample of 1,244 Flemish households that financial constraints explain 29% of the variance in heat-pump rejection, while the lack of institutional support contributes an additional 18%, thereby confirming the multidimensional nature of barriers.
At the institutional level, Orsitto et al. [37] argue that renewable energy communities thrive only when stable regulatory frameworks, differentiated financing schemes, and local governance capabilities coexist. These contributions therefore justify the simultaneous inclusion of the BAR, FIN, and INS blocks in the predictive model of the present study, a structure that enables the empirical decomposition of aggregate barriers and the differentiation of the relative contribution of each subsystem.
2.5. Interpretable Machine Learning in Energy-Behavior Research
The incorporation of interpretable machine learning into energy-behavior research responds to a recognized limitation of classical linear models: their inability to capture nonadditive interactions among multiple behavioral predictors. Tree-ensemble algorithms, such as Random Forest, Extra Trees, and Gradient Boosting, overcome this limitation through recursive partitions of the predictor space without imposing restrictive assumptions on the functional form of the relationships.
Zhang et al. [38] demonstrate, using data from 75 countries, that machine-learning-based meta-frontier models exceed the explanatory capacity of traditional parametric approaches by 23% when examining carbon-emission efficiency. Analogously, Boateng et al. [39] show, through post hoc interpretability techniques, that the relationships between environmental-sustainability factors and economic growth in West Africa present a nonlinear structure, a finding that invalidates the usual assumption of linearity in energy-transition studies.
Sarıışık et al. [40] and van der Laag et al. [41] reinforce this methodological orientation by reporting that, for moderate sample sizes and high dimensionality, tree-based algorithms offer greater predictive stability than parametric models. In this context, permutation importance constitutes the preferred interpretive tool because it quantifies the marginal contribution of each predictor based on the degradation of performance when that variable is randomized, a procedure that consequently enables comparable reading across heterogeneous algorithms.
2.6. Circular Bioeconomy as an Articulating Framework
The circular bioeconomy emerges as an articulating paradigm that reconfigures production systems through the comprehensive valorization of biological flows, waste minimization, and the regeneration of natural capital. Unlike the conventional circular economy, this approach gives centrality to biological processes, particularly anaerobic digestion, biorefinery, and fermentation, as mechanisms for closing metabolic cycles.
Calise et al. [42] model, in Italian dairy farms, the integration of anaerobic digestion and photovoltaics under a bio-circular approach and report emission reductions of 67% together with positive economic returns over horizons shorter than seven years. Wang et al. [43], for their part, synthesize the development stages of biorefineries for sugarcane wastes and warn that economic viability depends primarily on the articulation among biomass availability, institutional capacity, and local demand, a convergence that supports the multidimensional operationalization adopted in the present study.
Anbarasu et al. [44] and Ibarra-Esparza et al. [45] deepen the organizational dimension by arguing that the effective implementation of circular bioenergy solutions requires coordination capabilities, supplier management, and technical learning that go beyond mere technological availability. The present research is explicitly embedded within this articulating framework and operationalizes the circular bioeconomy not as a merely descriptive context but as a system of organizational, environmental, and institutional requirements that predict effective adoption willingness.
The articulation among the five theoretical perspectives presented above makes it possible to formulate an integrated conceptual model in which the adoption intention of biogas-solar microgrids operates as the dependent variable, while organizational capabilities, environmental legitimacy, financial factors, institutional conditions, perceived benefits, and barriers configure the multidimensional predictor space. Based on this theoretical architecture, the following hypotheses are formally proposed:
H1. Organizational capabilities will constitute the predictor block with the greatest explanatory weight over the adoption intention of biogas-solar microgrids, in line with the resource-based view and the theory of absorptive capacity.
H2. Tree-ensemble algorithms will outperform penalized linear models in predictive capacity, given the nonlinear nature of the interactions among behavioral predictors documented in recent literature on machine learning applied to energy transition.
H3. The sample will reveal at least two differentiated latent profiles, in which high adoption intention will emerge from a systemic configuration that simultaneously articulates organizational capabilities, environmental legitimacy, financial feasibility, and institutional conditions, rather than from a single isolated factor, consistent with the integrative logic of the Multi-Level Perspective and the circular bioeconomy as an articulating framework.
3. Materials and Methods
3.1. Research Design
The study was developed under a quantitative, applied, cross-sectional, and correlational-predictive approach aimed at analyzing the factors that explain the adoption intention of biogas-solar microgrids within the framework of the circular bioeconomy. The research was non-experimental because no variable was manipulated; rather, the perceptions, capabilities, and organizational conditions declared by participants were observed in their real context. Likewise, the design was cross-sectional, since the information was collected during a single fieldwork period between December 2025 and February 2026.
From the analytical standpoint, the study combined psychometric procedures, statistical modeling, and machine-learning techniques. This strategy made it possible to evaluate not only the internal structure and reliability of the instrument but also the capacity of the data to classify profiles with high technological-adoption intention. Consequently, the methodology was conceived as an integrated process of measurement, validation, predictive modeling, and explainable interpretation of the factors associated with the adoption of sustainable energy solutions.
3.2. Population, Sample, and Sampling
The population of interest consisted of actors linked to production units, organizations, ventures, or companies related to agricultural, agro-industrial, livestock, energy, waste-management, or other sectors with potential for biomass use and transition toward circular bioeconomy models. Given that no closed and verifiable population frame was available for this type of actor, nonprobabilistic convenience sampling was applied, with purposive inclusion criteria associated with the participant’s relevance to the phenomenon under study.
The analytical database comprised 71 original responses, with no record deletion, and 42 initial columns that included profile variables and 35 Likert-type items. In territorial terms, the sample showed a relevant concentration in Cajamarca, which recorded 31 valid responses and represented 47% of cases with a declared region; participation was also observed from La Libertad, Lambayeque, Lima, Piura, Amazonas, and Trujillo, allowing a differentiated territorial reading of the phenomenon.
3.3. Instrument and Operationalization of Variables
The information was collected through a structured questionnaire composed of closed items on a five-point Likert scale, aimed at measuring perceptions, barriers, institutional conditions, financial viability, environmental value, organizational capabilities, and adoption intention. The instrument was organized into seven analytical blocks: perceived benefits, adoption barriers, institutional readiness, financial feasibility, environmental value, organizational capability, and adoption intention. This structure made it possible to capture the phenomenon from a multidimensional perspective, considering both technical and economic factors as well as organizational and environmental conditions.
The main dependent variable was constructed from the items associated with the intention to adopt or invest in biogas-solar microgrids. First, these items were aggregated into a continuous intention score; subsequently, a binary variable was generated to distinguish cases with high adoption intention from cases with low or moderate intention. This dual operationalization allowed the phenomenon to be analyzed both as a gradual disposition and as a classifiable condition. To avoid problems of circularity or predictive overestimation, the items used to construct the target variable were excluded from the predictor set in the supervised models.
3.4. Instrument Validity and Expert Judgment
The content validity of the instrument was supported through expert judgment, a procedure that made it possible to evaluate the relevance, clarity, coherence, and representativeness of the items with respect to the proposed theoretical dimensions. The expert review was oriented toward ensuring that each questionnaire block adequately reflected the conceptual components of the model, especially in relation to the adoption of sustainable energy technologies, the circular bioeconomy, and the organizational capabilities required to implement biogas-solar microgrids.
On the basis of this validation, the instrument was refined before its definitive application, seeking to ensure that the items maintained conceptual correspondence with the study variables and were understandable to participants. This procedure strengthened the content validity of the questionnaire and reduced the risk of semantic ambiguity in the responses, an especially relevant aspect given the technological, environmental, and organizational nature of this emerging phenomenon.
3.5. Internal Reliability: Cronbach’s Alpha and McDonald’s Omega
The internal reliability of the instrument was evaluated using Cronbach’s alpha and McDonald’s omega in order to estimate the consistency of the items grouped within each theoretical dimension of the questionnaire. Cronbach’s alpha allowed the internal homogeneity of the scales to be assessed under the assumption of item consistency, while McDonald’s omega was incorporated as a more robust complementary indicator in the presence of possible differences in the factorial loadings of the items. This double verification strengthened the psychometric evaluation of the instrument and supported its subsequent use in statistical, structural, and predictive analyses.
The Cronbach’s alpha results showed adequate levels of internal consistency in most dimensions. The perceived-benefits dimension obtained a value of α = 0.7933; institutional support and alliances, α = 0.7837; economic-financial viability, α = 0.8879; environmental-circular impact, α = 0.9260; organizational circular readiness, α = 0.8777; and adoption/investment intention, α = 0.7054. These values exceed the commonly accepted minimum threshold of 0.70, indicating adequate internal coherence among the items comprising each block. In the case of perceived barriers, the coefficient was α = 0.6983, a value practically equivalent to the 0.70 cutoff point; therefore, it was considered acceptable with methodological caution, especially because this dimension consisted of only two items, a condition that may naturally reduce the magnitude of alpha. The reversed version of this same dimension maintained the same coefficient, α = 0.6983, as it was a linear transformation of the same items.
3.6. Data Preparation and Cleaning
Before modeling, the database was subjected to a statistical preparation process. Record consistency was verified, variable names were standardized, Likert responses were transformed into numeric format, and the presence of missing values was reviewed. According to the data-preparation matrix, Likert-type items were converted to integers from 1 to 5, the blocks were aggregated by simple means for each theoretical dimension, and the final matrix was structured in numeric format for use in SEM, machine learning, or regression.
Likewise, the items associated with barriers were treated according to their conceptual orientation so that they could be interpreted coherently within the general model. The final matrix made it possible to construct dimensional indicators, profile variables, categorical codifications, and a binary target variable linked to high adoption intention. This phase was fundamental to ensuring that the data entered the models under appropriate conditions of consistency, traceability, and comparability.
3.7. Statistical Analysis and Modeling Strategy
The analysis incorporated a descriptive, psychometric, and predictive route. First, the sample was characterized using frequencies and percentages associated with region, economic sector, company size, biomass availability, previous experience with renewable energies, and participant role. Second, the quality of the instrument was evaluated through internal consistency, content validity, and dimensional aggregation of the items. Third, a modeling strategy was developed to explain and predict the adoption intention of biogas-solar microgrids.
The supervised strategy included a binary classification task to estimate the probability of high adoption intention and a regression task to approximate the continuous intention score. For this purpose, linear and nonlinear models were compared, including penalized logistic regression, support vector machines, Random Forest, Extra Trees, Gradient Boosting, HistGradientBoosting, and XGBoost for classification; while Ridge, Elastic Net, SVR, and tree-based ensemble models were considered for regression. This comparison made it possible to identify the type of algorithm with the best performance for representing a phenomenon characterized by complex relationships among perceptions, capabilities, and technological disposition.
3.8. Validation and Performance Metrics
Model validation was performed through train-test partitioning and cross-validation. In classification, the split was stratified to preserve the proportion between the high-intention and low/moderate-intention groups. Performance was evaluated using accuracy, balanced accuracy, precision, recall, specificity, F1-score, ROC-AUC, average precision, Matthews correlation coefficient, Brier score, and log loss. This multimetric evaluation made it possible to assess both global accuracy and class balance, probabilistic discrimination, and the calibration quality of the model.
In the regression task, performance was examined using RMSE, MAE, MAPE, R², and explained variance. Selection of the best model was based on differentiated criteria according to the nature of the task: for classification, a composite criterion integrating ROC-AUC, F1-score, balanced accuracy, and average precision was prioritized; for regression, the reduction of RMSE was considered primarily, complemented by R² as an indicator of explanatory capacity. This strategy avoided dependence on a single metric and allowed a more robust evaluation of predictive performance.
3.9. Interpretability and Complementary Analysis
The interpretation of the results was strengthened through variable-importance analysis, correlations with adoption intention, permutation importance, and native importance of tree-based models. These techniques made it possible to identify the most influential predictors and to understand which dimensions contributed greater explanatory capacity in the classification of high-intention profiles. Complementarily, unsupervised exploration procedures, such as principal component analysis and K-Means clustering, were applied to identify latent profiles of organizational readiness, environmental perception, and technological disposition.
This methodological combination transformed perceptual data into analytical evidence useful for understanding the adoption of biogas-solar microgrids. Rather than being limited to a description of responses, the proposed approach made it possible to recognize patterns, estimate probabilities, compare models, and explain the relative contribution of the analyzed dimensions. In this way, the methodology offered a solid technical basis for studying the adoption of sustainable energy technologies in circular bioeconomy contexts.
4. Results
The analytical processing was conducted on 71 valid observations and 40 original columns. After excluding the three items used to construct the target variable, the modeling system retained 37 numerical predictors associated with participant profile, perceived benefits, barriers, institutional conditions, financial factors, environmental criteria, and organizational capabilities. The main dependent variable was constructed as the average of the INT1, INT2, and INT3 items, generating the continuous Target_Intention_Score indicator. Additionally, a binary variable called Target_High_Intention was defined using a threshold value of 4.0 on the Likert scale, which made it possible to differentiate cases with high adoption or investment intention from cases with low or moderate intention. According to Table 1, the final analytical configuration presents an almost balanced distribution between classes, with 36 cases of low or moderate intention and 35 cases of high intention, a methodologically favorable condition for training supervised classifiers because it reduces the risk of extreme bias toward a dominant class.
The empirical distribution of the target variable confirms that intention toward the adoption of biogas-solar microgrids does not behave as a marginal or exceptional variable within the sample, but rather as an outcome with substantive presence in almost half of the cases. According to Figure 1, the intention score is concentrated around medium-high values, although without collapsing completely at the upper end of the scale. This pattern is relevant because it indicates that the phenomenon should not be interpreted only as general acceptance of the circular bioeconomy, but as a heterogeneous disposition modulated by organizational, environmental, financial, and institutional conditions. In modeling terms, this variability is especially important because it allows algorithms to learn decision boundaries and response gradients instead of operating on a database saturated by homogeneous responses.
The descriptive profile of the predictor blocks shows a consistently favorable valuation structure toward environmental components and perceived benefits, although with greater caution regarding barriers and some financial factors. According to Table 2, the environmental block presents the highest aggregate mean among the observed constructs, with an average of 4.092, followed by perceived benefits with 4.028 and organizational capabilities with 3.984. These values suggest that environmental legitimacy and the perception of strategic usefulness of biogas-solar microgrids constitute mature dimensions within respondents’ imaginaries. However, the barriers block registers the lowest mean, with 3.387, indicating that obstacles do not disappear in the presence of a positive valuation of the technology; rather, they remain a structural dimension that may moderate the conversion of favorable attitudes into effective adoption intention.
The item-level analysis confirms that environmental valuation does not operate as a peripheral element, but rather as one of the model’s highest-intensity cores. The ENV1, ENV8, ENV3, ENV6, and ENV2 indicators are among the variables with the highest means, all above 4.09 on the scale, which evidences that the adoption of biogas-solar microgrids is strongly associated with an expectation of environmental contribution and operational sustainability. In contrast, BAR2 and BAR1 register the lowest averages, with means of 3.366 and 3.408, respectively. This gap suggests a central tension in the results: the field of application perceives high environmental and strategic benefits, but adoption still faces technical, economic, institutional, or implementation barriers that prevent an automatic transition from conceptual acceptance to the investment decision.
The correlation matrix between predictors and the continuous intention score reveals that organizational capabilities explain a substantive part of the observed variability in adoption intention. According to Table 3, ORG4 shows the highest correlation with intention, with a coefficient of 0.680, followed by ORG5 with 0.657, ORG2 with 0.597, ENV3 with 0.590, ORG6 with 0.575, and ORG3 with 0.565. This result is technically relevant because it indicates that intention does not depend solely on environmental perception or technological attractiveness, but on the internal capacity of organizations to translate that opportunity into a viable decision. Figure 2 complements this reading by showing that the main predictors are not randomly distributed, but rather form a correlational core in which organizational and environmental variables appear as closely articulated dimensions.
For the prediction of high adoption intention, eight supervised algorithms were compared: logistic regression with L2 regularization, Elastic Net logistic regression, radial-basis-function support vector machines, Extra Trees, Random Forest, Gradient Boosting, HistGradientBoosting, and histogram-based XGBoost. The comparison was performed through stratified cross-validation and hold-out evaluation, using a broad set of metrics that included accuracy, balanced accuracy, precision, recall, specificity, F1-score, ROC-AUC, average precision, Matthews correlation coefficient, Brier score, and log loss. According to Table 4, the best overall model was ExtraTrees, selected for the highest combined performance in ROC-AUC, F1-score, balanced accuracy, and average precision. In cross-validation, ExtraTrees reached a mean accuracy of 0.723, balanced accuracy of 0.727, F1-score of 0.744, ROC-AUC of 0.819, and average precision of 0.862. In the test set, the same model reached accuracy of 0.833, balanced accuracy of 0.833, precision of 0.875, recall of 0.778, specificity of 0.889, F1-score of 0.824, ROC-AUC of 0.889, and average precision of 0.879.
The visual comparison of classifiers reinforces the selection of ExtraTrees as the model with the best balance between discrimination and stability. According to Figure 3, tree-ensemble models dominate overall predictive performance, especially ExtraTrees and Random Forest, whereas linear models show a more limited capacity to capture complex relationships among predictors. This difference is methodologically coherent with the nature of the problem, since the adoption intention of biogas-solar microgrids probably responds to nonlinear interactions among organizational capabilities, financial constraints, environmental legitimacy, and institutional conditions. The fact that ExtraTrees outperforms linear models and other boosting algorithms suggests that the decision structure benefits from flexible partitions and randomized tree aggregation, especially in a small sample with multiple ordinal predictors.
The ROC curve of the best classifier confirms high discriminant capacity to distinguish between organizations with high intention and those with low or moderate intention. According to Figure 4, the area under the curve in the test set was 0.889, which indicates that the model assigns a higher risk or probability score to positive cases in a proportion considerably greater than expected by chance. This result is particularly important because the objective of the model is not only to correctly classify observed cases but also to build an analytical tool capable of prioritizing organizational profiles with a higher probability of moving toward adoption or investment in circular bioenergy solutions. From an applied perspective, a ROC-AUC of 0.889 suggests solid capacity to rank cases according to propensity, which may be useful in policy-targeting scenarios, pilot-organization selection, or the design of differentiated incentives.
The precision-recall analysis adds a more demanding reading of the model’s capacity to recover high-intention cases without inflating false positives. According to Figure 5, ExtraTrees achieved an average precision of 0.879 in testing, a performance consistent with the observed balance between precision and recall. In substantive terms, this means that the model not only distinguishes reasonably well between classes but also maintains a high capacity to identify relevant positive cases when attention focuses on the class of greatest practical interest: organizations with high willingness to adopt. This aspect is critical for energy-transition and circular-bioeconomy studies because classification errors do not have the same interpretive cost. Classifying an organization as highly willing when it still lacks sufficient conditions may lead to inefficient interventions; conversely, omitting organizations with high intention may limit the identification of early actors for technological scaling processes.
The confusion matrix makes it possible to observe the concrete distribution of correct and incorrect classifications produced by the selected classifier. According to Figure 6, ExtraTrees correctly classified 8 negative cases and 7 positive cases, with only 1 false positive and 2 false negatives. This configuration explains the observed balance between specificity of 0.889 and recall of 0.778. The result suggests that the model is slightly more conservative in declaring high-intention cases than in identifying low- or moderate-intention cases, which may be a desirable property when the objective is to avoid overestimating system readiness to adopt biogas-solar microgrids. However, the two false negatives also indicate that there are profiles with high intention that the model does not capture, possibly because they combine favorable signals in some blocks with constraints or atypical patterns in others. Consequently, the model should be understood as a decision-support system, not as a substitute for individual technical evaluation.
Calibration assessment shows an additional component of predictive quality, since it is not sufficient to rank cases correctly; estimated probabilities must also correspond reasonably with the observed frequency of the event. According to Figure 7, the calibration curve makes it possible to assess whether the probabilities generated by ExtraTrees tend to underestimate or overestimate high adoption intention. Given the reduced size of the test set, this reading should be considered exploratory, but it remains methodologically valuable because it incorporates a probabilistic dimension that goes beyond dichotomous accuracy. For the technical study, this result strengthens the presentation of the model by demonstrating that the evaluation is not limited to conventional classification metrics but incorporates discriminant performance, positive-case recovery capacity, error balance, and probabilistic quality.
The regression route was used as a complementary analysis to estimate the continuous intention score, not only its binary version. In this case, RidgeCV, ElasticNetCV, radial-basis-function SVR, ExtraTreesRegressor, RandomForestRegressor, GradientBoostingRegressor, HistGradientBoostingRegressor, and XGBoost_Regressor_Hist were compared. The cross-validation comparison shows that the best performance corresponded to RandomForestRegressor, with a mean RMSE of 0.453, MAE of 0.358, mean R² of 0.453, explained variance of 0.534, and MAPE of 0.100. ExtraTreesRegressor showed practically equivalent performance, with RMSE of 0.454, MAE of 0.348, R² of 0.455, and explained variance of 0.532. According to Table 5, ensemble models again outperform most linear or boosting alternatives, confirming that the empirical structure of the phenomenon presents relationships among predictors that are not strictly additive.
The graphical comparison of regression models confirms the superiority of Random Forest- and Extra Trees-type ensembles. According to Figure 8, the distance between the leading models and the remaining algorithms is not extreme, but it is consistent across error metrics. This suggests that the intention score can be approximated with a reasonable level of precision, although continuous prediction is naturally more demanding than binary classification. From the substantive standpoint, this result indicates that adoption intention should not be understood only as a dichotomous category but also as a gradient of readiness or disposition. Nevertheless, the regression-test results sheet recorded a compatibility error in the RMSE calculation with the squared argument; therefore, the interpretation of regression is supported mainly by cross-validation, which is the most stable comparative evidence available in the exported file.
The relationship between observed and predicted values of the best regressor makes it possible to visually evaluate the model’s capacity to approximate the continuous intention score. According to Figure 9, the expected pattern in a useful model is the concentration of points around the reference diagonal, which would indicate correspondence between observed and estimated intention. In this case, the cross-validation evidence suggests a moderate explanatory capacity, with R² close to 0.45; therefore, the point cloud should be interpreted as a reasonable but imperfect predictive approximation. In applied research terms, this result is useful because it supports the assertion that organizational, environmental, financial, and institutional predictors capture a significant portion of intention, although there are still unobserved components that may be associated with technological, regulatory, cultural, or actual biomass- and capital-availability factors.
The residual distribution complements the evaluation of the regression model by showing whether errors are concentrated around zero or whether relevant asymmetries are present. According to Figure 10, the technical reading should focus on the shape of the distribution and the presence of tails or systematic deviations. A reasonably centered residual distribution suggests the absence of severe global bias, whereas pronounced tails would indicate atypical cases in which the model underestimates or overestimates intention. Because the dependent variable is constructed from an aggregated Likert scale, small deviations may have important substantive interpretation, especially when working with technological-adoption decisions. Therefore, residual evaluation should not be treated as a secondary formal requirement, but rather as evidence of model stability in the face of organizational heterogeneity.
The plot of residuals against predicted values allows examination of possible heteroscedasticity patterns or systematic errors across the estimated range of intention. According to Figure 11, the absence of a clearly curved structure or funnel-shaped pattern would be consistent with acceptable predictive behavior. If errors intensify at the upper or lower extremes, this would suggest that the model predicts intermediate cases better than extreme adoption profiles. This reading is important because, in studies of microgrids and circular transition, extreme cases are often the most relevant for public policy and strategic management: those with very high intention may act as early adopters, whereas those with low intention may represent segments where critical financing, information, or organizational-capability barriers are concentrated.
Variable-importance analysis adds a layer of explainability to the classification model. According to Table 6, ORG4 was the most important predictor according to both permutation importance and the model’s native importance, with values of 0.049 and 0.091, respectively. In addition, ORG6, ENV6, ENV1, ENV2, ORG5, ENV5, ORG1, ORG3, FIN7, and ENV3 appear among the predictors with the greatest contribution by permutation. In technical terms, the convergence among bivariate correlation, permutation importance, and native importance reinforces the interpretive robustness of the organizational and environmental variables. The result should not be read as causality, but rather as evidence that the prediction of high intention depends especially on internal capabilities and environmental criteria that act as readiness signals for translating the circular bioeconomy into a concrete technological decision.
Figure 12 visualizes the hierarchy of predictors from a model-perturbation perspective: a variable is more important when its randomization deteriorates predictive performance to a greater extent. According to Figure 12, the predominance of ORG and ENV variables confirms that the model is not simply capturing general positive responses, but rather a pattern of organizational readiness and environmental orientation. This distinction is fundamental to the study’s contribution because it places the adoption of biogas-solar microgrids in a space that is more complex than the mere perception of benefits. The results suggest that organizations with higher intention not only value sustainability but also present internal capacity signals to operate, absorb, or manage the transition toward circular energy schemes.
Finally, the unsupervised analysis explored the existence of latent profiles within the sample. Solutions with two, three, and four clusters were evaluated using the silhouette coefficient. According to Table 7, the two-cluster solution obtained the best silhouette value, with 0.208, above the three-cluster solution, with 0.123, and the four-cluster solution, with 0.097. Although the coefficient does not indicate strong separation, it does suggest that the most interpretable structure of the data is organized into two general profiles. This segmentation is consistent with the classificatory objective of the study because it differentiates a group with lower readiness and intention from another group with greater alignment toward the adoption of biogas-solar microgrids.
The cluster profile confirms that the segmentation differentiates two substantively relevant groups. According to Table 8, cluster 0 presents lower means across all aggregate blocks, with an intention score of 3.468 and a proportion of high intention of 0.324. In contrast, cluster 1 shows higher means in benefits, institutional conditions, financial factors, environmental criteria, and organizational capabilities, with an intention score of 4.216 and a proportion of high intention of 0.676. This difference suggests that high adoption intention does not emerge from a single isolated factor, but from a systemic configuration in which perceived benefits, environmental legitimacy, institutional support, financial feasibility, and organizational capabilities mutually reinforce one another. Consequently, the adoption of biogas-solar microgrids should be interpreted as a phenomenon of sociotechnical and organizational maturity, not merely as a technological preference.
The PCA representation of the clusters offers a visual reading of the latent structure of the sample. According to Figure 13, the separation between groups should not be understood as a rigid boundary, but as a gradual differentiation of profiles in a reduced principal-component space. This evidence is coherent with the supervised results: adoption intention presents sufficient structure to be modeled, but preserves internal heterogeneity. Partial overlap between profiles may indicate that some organizations share similar environmental perceptions or benefits while differing in internal capabilities, financial conditions, or institutional maturity. Therefore, cluster analysis does not replace the predictive model, but complements it by showing that the transition toward biogas-solar microgrids can be grouped into differentiated strategic segments.
The results show that the intention to adopt biogas-solar microgrids within a circular bioeconomy approach can be modeled with technically solid performance through machine-learning algorithms, especially tree ensembles. The superiority of ExtraTrees in classification and RandomForestRegressor in regression suggests that the phenomenon has a nonlinear structure, in which organizational and environmental variables operate as central predictive determinants. The combined evidence from correlations, permutation importance, ROC-AUC performance, average precision, confusion matrix, calibration, residual analysis, and PCA-cluster segmentation supports the argument that high intention does not depend solely on recognizing environmental benefits, but on a broader configuration of organizational capabilities, perceived feasibility, and strategic alignment with sustainability criteria. This result strengthens the technical contribution of the study because it transforms a Likert-type perceptual matrix into an interpretable predictive system capable of identifying profiles with greater propensity for adoption, prioritizing critical variables, and providing quantitative evidence for designing implementation strategies for circular microgrids based on biogas and solar energy.
5. Discussion
5.1. Explanatory Predominance of the Organizational Block over Adoption Intention
The findings corresponding to permutation importance, bivariate correlation, and the aggregate descriptive profile converge on a consistent conclusion: organizational capabilities constitute the predictor block with the greatest explanatory weight over adoption intention. The ORG4 indicator reached the highest correlation with intention (r = 0.680), followed by ORG5 (r = 0.657), ORG2 (r = 0.597), ORG6 (r = 0.575), ORG3 (r = 0.565), and ORG1 (r = 0.488); this pattern is replicated in permutation importance, where ORG4 (0.049) and ORG6 (0.037) lead the predictive hierarchy. This result empirically confirms H1 and directly dialogues with Kunskaja and Pažėraitė [26], who document the explanatory consistency of internal technical-administrative capabilities above financial availability.
In the same direction, Ahmar et al. [27] report that organizational infrastructure and management capability predict biogas adoption with elasticities higher than those observed for direct economic incentives. The evidence of the present study reinforces this reading, since the six ORG indicators appear among the eleven predictors with the highest correlations with intention, whereas the financial block contributes only FIN9 (r = 0.497). This asymmetry suggests that organizational maturity does not operate as a marginal complement to the technological decision, but as an enabling condition, a reading coherent with the absorptive-capacity perspective reactivated by recent bioenergy literature.
5.2. Environmental Legitimacy as the Second Explanatory Axis
The environmental-criteria block is positioned as the second predictive axis in terms of magnitude and presence among the main predictors. The ENV3 (r = 0.590), ENV8 (r = 0.528), ENV5 (r = 0.509), and ENV2 (r = 0.472) items are among the eleven highest correlations, while ENV6, ENV1, ENV2, ENV5, and ENV3 appear in the permutation-importance hierarchy with values between 0.010 and 0.023. Additionally, the ENV block records the highest aggregate mean of the entire database (4.092), even surpassing perceived benefits (4.028) and organizational capabilities (3.984).
This combination of high mean valuation and strong predictive weight constitutes a pattern consistent with Hussain et al. [29], who document that perceived environmental legitimacy explains a significant proportion of the variability in local approvals of solar projects, controlling for economic variables. Complementarily, the results approximate those of Hildebrand et al. [30], who reported that environmental concern outperforms perceived usefulness and technological trust as a predictor of acceptance. The multidimensionality of legitimacy described by Osei et al. [31] and López et al. [32] therefore finds an empirical correlate in the dispersion of ENV items throughout the model’s predictive hierarchy.
5.3. Predictive Superiority of Tree Ensembles over Linear Models
The systematic comparison among the eight classifiers confirms H2 with an analytically relevant margin. ExtraTrees reached a Test ROC AUC of 0.889 and an MCC of 0.671, positioning itself above Random Forest (Test ROC AUC = 0.864), Gradient Boosting (Test ROC AUC = 0.852), and, particularly, the penalized linear models, where Logistic Elastic Net recorded a CV ROC AUC of 0.672 and Logistic L2 a CV ROC AUC of 0.636. The gap of approximately fifteen percentage points between the best ensemble and the best linear model suggests that the relationships among behavioral predictors are not adequately captured by additive structures. In the regression task, RandomForestRegressor obtained the lowest CV RMSE (0.453), followed by ExtraTreesRegressor (0.454), while RidgeCV reached an RMSE of 0.488. The convergence between both tasks reinforces the robustness of the methodological conclusion and falls in line with Boateng et al. [39] and Zhang et al. [38], who document analogous results regarding the superiority of nonparametric algorithms when predictors incorporate complex interactions.
5.4. Latent Profiles of Organizational Readiness
The unsupervised analysis using K-Means identified two differentiated latent profiles with a silhouette coefficient of 0.208, a value higher than that obtained for three-cluster (0.123) and four-cluster (0.097) solutions. Cluster 1 concentrates organizations with consistently high valuations across all blocks: perceived benefits (4.569), environmental criteria (4.629), organizational capabilities (4.456), institutional conditions (4.382), and financial factors (4.284), together with an intention score of 4.216 and a high-intention proportion of 67.6%. Cluster 0, by contrast, presents lower valuations across all blocks and a high-intention proportion of only 32.4%. The systematic difference across the six dimensions, rather than in a single block, empirically confirms H3 and aligns with the integrative logic proposed by Romero Castro et al. [16] and Orsitto et al. [37], who document that effective willingness toward renewable energies responds to systemic configurations rather than individual variables.
5.5. Gap Between Stated Intention and Technical Performance of Microgrids
The aggregate mean of intention (3.826) and the proportion of cases with high intention (49.30%) reveal a moderate-to-positive disposition toward adoption, without reaching saturation levels. Bakhuis et al. [23] precisely note this phenomenon when documenting the so-called intention-behavior gap, according to which stated dispositions tend to overestimate actual decisions when financial, institutional, or capability constraints are present. This reading contextualizes the asymmetry between the technical and behavioral dimensions of the problem: while the sizing literature, represented by Hassan et al. [2] and Sadeghi et al. [8], has achieved considerable methodological maturity for optimizing biogas-solar configurations, the findings of the present study suggest that the effective bottleneck of the transition is not located primarily in technological prescription, but in organizational willingness to internalize it, a repositioning coherent with Obuseh et al.’s [11] warning regarding the multidimensional character of barriers to renewable-energy integration.
5.6. Implications for Policy Design in the Circular Bioeconomy
The applied implications can be summarized in three areas. First, the explanatory centrality of the organizational block suggests that public and private promotion policies should include components for strengthening technical-administrative capabilities, rather than being limited to financial-subsidy schemes; this orientation is consistent with Chanda et al. [19] regarding the role of observational learning and peer influence in the adoption of solar technologies in rural communities. Second, the simultaneous coexistence of elevated dimensions within cluster 1 supports the relevance of integrated policy instruments in which financing, technical assistance, enabling regulation, and environmental awareness operate in a coordinated manner. Third, articulation with the circular bioeconomy is operationally translated into the possibility of using agro-industrial residues as substrates for anaerobic digestion, a dimension coherent with Calise et al. [42] on Italian dairy farms under a bio-circular approach and with Ibarra-Esparza et al. [45] on the anaerobic co-digestion of agro-industrial wastes.
5.7. Limitations and Future Research Lines
The findings should be interpreted in light of five recognized limitations: a sample size of 71 observations, nonprobabilistic convenience sampling, the exploratory nature of the model, the need for additional confirmatory factor validation, and circumscription to the territorial context studied. Based on these limitations, four future research lines are delineated: replication with larger and geographically diversified samples to examine the transcontextual stability of organizational centrality; incorporation of longitudinal measurements to examine the conversion between intention and behavior, an analytical gap noted by Sahu et al. [13]; integration of objective technical-performance data with behavioral data, articulating the techno-economic tradition represented by Roy et al. [14] with the behavioral tradition of the present study; and incorporation of additional post hoc explainability techniques such as SHAP, complementing permutation importance with additive decompositions that enable a more granular reading of predictive contributions.
5. Conclusions
The study analyzed, through interpretable machine learning, the organizational and environmental determinants that predict the adoption intention of biogas-solar microgrids within a circular bioeconomy framework, based on an exploratory sample of 71 organizations. The empirical evidence confirms the three hypotheses formulated: organizational capabilities emerged as the predictor block with the greatest explanatory weight, with six of their indicators among the eleven main predictors and ORG4 leading both bivariate correlation (r = 0.680) and permutation importance (0.049); tree-ensemble algorithms outperformed penalized linear models, with ExtraTrees achieving a Test ROC AUC of 0.889 compared with 0.672 for Logistic Elastic Net; and the unsupervised analysis revealed two differentiated latent profiles with a silhouette coefficient of 0.208, where high intention arises from a systemic configuration that simultaneously articulates capabilities, environmental legitimacy, financial feasibility, and institutional conditions.
From the theoretical perspective, the study provides preliminary evidence on the primacy of internal organizational capabilities and environmental legitimacy as antecedents of technological intention, extending classical adoption frameworks toward a systemic reading of sociotechnical maturity. From the methodological perspective, the convergence among supervised classification, continuous regression, and unsupervised segmentation, articulated through a reproducible pipeline of interpretable machine learning, demonstrates the feasibility of extending this set of techniques to energy-behavior research with moderate sample sizes. From the applied perspective, the findings support the design of integrated policy instruments in which the strengthening of technical-administrative capabilities operates in coordination with financing, enabling regulation, and environmental awareness, rather than as fragmented subsidy schemes.
The results should be read as exploratory evidence circumscribed to the territorial context studied, without claiming inferential generalization to the bioenergy sector as a whole. Future research could examine the transcontextual stability of the organizational centrality documented here using larger and geographically diversified samples, incorporate longitudinal measurements that make it possible to study the effective conversion between stated intention and investment behavior, integrate objective technical-performance data with behavioral data, and apply additional post hoc explainability techniques that enrich the reading of predictive contributions. The triple alignment among technical efficiency, organizational viability, and metabolic circularity places the study within the global Sustainable Development Goals agenda, particularly those related to affordable and clean energy, responsible consumption and production, and climate action, configuring a modest but defensible contribution to the energy transition in territories with structural constraints.
Supplementary Materials
The following supporting information can be downloaded at: https://github.com/aharo8014/Biogas-Solar-Microgrids-within-a-Circular-Bioeconomy. The repository includes the expert peer-review documentation of the research instrument, the expert validation forms in Spanish and English, and the ethical justification/declaration letter.
Author Contributions
Conceptualization, G.C.F.C., P.V.Z. and A.H.S.; methodology, A.H.S., M.E.Z.S. and J.R.I.E.; software, A.H.S. and J.R.I.E.; validation, M.R.S.C., E.V.R.F. and O.H.C.C.; formal analysis, A.H.S. and J.R.I.E.; investigation, G.C.F.C., P.V.Z., M.E.Z.S., A.H.S., M.R.S.C., E.V.R.F., O.H.C.C. and J.R.I.E.; resources, G.C.F.C., P.V.Z. and M.R.S.C.; data curation, A.H.S., M.E.Z.S. and J.R.I.E.; writing—original draft preparation, G.C.F.C., P.V.Z., M.E.Z.S. and A.H.S.; writing—review and editing, M.R.S.C., E.V.R.F., O.H.C.C. and J.R.I.E.; visualization, A.H.S. and J.R.I.E.; supervision, P.V.Z. and M.R.S.C.; project administration, G.C.F.C. and A.H.S.; funding acquisition, not applicable. All authors have read and agreed to the published version of the manuscript.
Funding
This research received no external funding.
Institutional Review Board Statement
Ethical review and approval were waived for this study because the research was conducted using non-invasive academic procedures, did not involve clinical intervention, biomedical experimentation, or the collection of personally identifiable sensitive data, and was limited to the application and validation of a research instrument for scholarly purposes. The ethical justification/declaration supporting this procedure is available in the supplementary materials.
Informed Consent Statement
Informed consent was obtained from all subjects involved in the study. Participation was voluntary, anonymous, and limited to the academic purposes of the research.
Data Availability Statement
The supplementary documentation supporting the methodological and ethical procedures of this study is publicly available at: https://github.com/aharo8014/Biogas-Solar-Microgrids-within-a-Circular-Bioeconomy. Additional data supporting the findings of this study may be made available by the corresponding author upon reasonable request, subject to ethical and privacy considerations.
Acknowledgments
The authors acknowledge the support of the experts who participated in the review and validation of the research instrument. Their academic evaluation contributed to strengthening the methodological quality and content validity of the instrument used in this study.
Conflicts of Interest
The authors declare no conflicts of interest.
Abbreviations
The following abbreviations are used in this manuscript:
| AD | Anaerobic digestion |
| BAR | Barriers |
| BEN | Perceived benefits |
| CBE | Circular bioeconomy |
| CE | Circular economy |
| CHP | Combined heat and power |
| CO₂ | Carbon dioxide |
| ENV | Environmental criteria |
| FIN | Financial factors |
| GHG | Greenhouse gas |
| INS | Institutional conditions |
| INT | Adoption/investment intention |
| IRB | Institutional Review Board |
| LCOE | Levelized cost of energy |
| MAE | Mean absolute error |
| MAPE | Mean absolute percentage error |
| MCC | Matthews correlation coefficient |
| MG | Microgrid |
| ORG | Organizational capabilities |
| PCA | Principal component analysis |
| PV | Photovoltaic |
| RES | Renewable energy sources |
| RMSE | Root mean square error |
| SEM | Structural equation modeling |
| SHAP | Shapley additive explanations |
| SVM | Support vector machine |
| TPB | Theory of planned behavior |
| UTAUT2 | Unified Theory of Acceptance and Use of Technology 2 |
| XGBoost | Extreme Gradient Boosting |
References
- International Energy Agency; International Renewable Energy Agency; United Nations Statistics Division; World Bank; World Health Organization. Tracking SDG 7: The Energy Progress Report 2025. Washington (DC): World Bank; 2025. Available from: https://trackingsdg7.esmap.org.
- Hassan R, Das BK, Hasan M. Integrated off grid hybrid renewable energy system optimization based on economic, environmental, and social indicators for sustainable development. Energy. 2022;250:123823. [CrossRef]
- Nawab F, Abd Hamid AS, Arif M, Khan TA, Naveed A, Sadiq M, et al. Solar biogas microgrid: A strategy for the sustainable development of rural communities in Pakistan. Sustainability. 2022;14(18):11124. [CrossRef]
- Ennemiri N, Berrada A, Emrani A, Abdelmajid J, El Mrabet R. Optimization of an off grid PV/biogas/battery hybrid energy system for electrification: A case study in a commercial platform in Morocco. Energy Conversion and Management: X. 2024;21:100508. [CrossRef]
- Araoye TO, Ashigwuike EC, Mbunwe MJ, Bakinson OI, Ozue TI. Techno economic modeling and optimal sizing of autonomous hybrid microgrid renewable energy system for rural electrification sustainability using HOMER and grasshopper optimization algorithm. Renewable Energy. 2024;229:120712. [CrossRef]
- Yadav S, Kumar P, Kumar A. Hybrid renewable energy systems design and techno economic analysis for isolated rural microgrid using HOMER. Energy. 2025;322:136442. [CrossRef]
- Kaur S, Kumar R, Singh K, Singh S. Systematic review of hydrogen, biomass, biogas, and solar photovoltaics in hybrid renewable energy systems: Advancements, challenges, and future directions. International Journal of Hydrogen Energy. 2025;124:1024-1042. [CrossRef]
- Sadeghi A, Maleki A, Haghighat S. Techno economic analysis and optimization of a hybrid solar wind biomass battery framework for the electrification of a remote area: A case study. Energy Conversion and Management: X. 2024;24:100732. [CrossRef]
- Panbechi B, Hajinezhad A, Moosavian SF, Fattahi R. Enhancing the enviro economic viability of biogas solar hybrid systems: Strategies for sustainable energy development in Iran. Energy Strategy Reviews. 2025;58:101671. [CrossRef]
- Kimutai SK, Dushengere B, Muchilwa I. Assessing the viability of solar biogas hybrid systems for energy provision in rural Kenyan communities. Sustainable Energy Technologies and Assessments. 2025;75:104244. [CrossRef]
- Obuseh E, Eyenubo J, Alele J, Okpare A, Oghogho I. A systematic review of barriers to renewable energy integration and adoption. Journal of Asian Energy Studies. 2025;9:23-48. [CrossRef]
- James GA, Ahiabor FS, Abalo EM. Analysing the barriers to renewable energy adoption in Ghana using Delphi and a fuzzy synthetic evaluation approach. Energy for Sustainable Development. 2025;84:101667. [CrossRef]
- Sahu KK, Sahoo TR, Santosh I, Guru S, Chaudhary RK. Behavioral determinants of solar energy adoption in India: Insights for policy from an extended TPB framework. Energy Policy. 2026;192:115079. [CrossRef]
- Roy D, Zhu S, Wang R, Mondal P, Ling Chin J, Roskilly AP. Techno economic and environmental analyses of hybrid renewable energy systems for a remote location employing machine learning models. Applied Energy. 2024;361:122884. [CrossRef]
- Vignesh Kumar V, Madhesh K, Sanjay K, Guru Prasath P, Pavish Karthik A, Praveen Kumar S. A novel ensemble machine learning approach for optimizing sustainability and green hydrogen production in hybrid renewable based organic Rankine cycle operated systems. Renewable Energy. 2025;240:122369. [CrossRef]
- Romero Castro N, Ángeles López Cabarcos M, Miramontes Viña V, Ribeiro Soriano D. Sustainable energy transition and circular economy: The heterogeneity of potential investors in rural community renewable energy projects. Environment, Development and Sustainability. 2025;27:6989-7016. [CrossRef]
- Nguyen VG, Sharma P, Bora BJ, Bui TMT, Efremov C, Tran MH, et al. Techno economic analysis of a hybrid energy system for electrification using an off grid solar/biogas/battery system employing HOMER: A case study in Vietnam. Process Safety and Environmental Protection. 2024;191:1334-1351. [CrossRef]
- Diyono D, Onwuanaku V, Cappon H, Kujawa Roeleveld K, Keesman KJ. Optimized design of a hybrid renewable energy system with biogas energy storage for sustainable rural electrification: A case study in Sempu, East Java, Indonesia. Energy Reports. 2026;13:109288. [CrossRef]
- Chanda H, Mohareb E, Peters M, Harty C. Community led solar energy technology adoption in rural Zambia: The role of observational learning and neighbor influence. Energy Research and Social Science. 2025;119:103972. [CrossRef]
- Ajzen I. The theory of planned behavior. Organizational Behavior and Human Decision Processes. 1991;50(2):179-211. [CrossRef]
- Oliva EJD, Atehortua Santamaria R. Decoding solar adoption: A systematic review of theories and factors of photovoltaic technology adoption in households of developing countries. Sustainability. 2025;17(12):5494. [CrossRef]
- Qamar S, Zhang Q, Ahmad M, Pinzón S, Ahmed N, Işık C. Roadmap to green future: Biodigester technology acceptance to upscale rural energy access. Energy. 2025;320:134437. [CrossRef]
- Bakhuis J, Barbour N, Chappin ÉJL. Exploring user willingness to adopt vehicle-to-grid (V2G): A statistical analysis of stated intentions. Energy Policy. 2025;197:114619. [CrossRef]
- Barney J. Firm resources and sustained competitive advantage. Journal of Management. 1991;17(1):99-120. [CrossRef]
- Cohen WM, Levinthal DA. Absorptive capacity: A new perspective on learning and innovation. Administrative Science Quarterly. 1990;35(1):128-152. [CrossRef]
- Kunskaja S, Pažėraitė A. Determinants of renewable energy technology deployment: A systematic review. Sustainability. 2025;17(23):10538. [CrossRef]
- Ahmar M, Ali F, He C, Jiang Y. Understanding the role of socio-economic, demographic, environmental, infrastructural, and institutional attributes in the uptake of biogas. Energy Economics. 2025;144:108699. [CrossRef]
- Suchman MC. Managing legitimacy: Strategic and institutional approaches. Academy of Management Review. 1995;20(3):571-610. [CrossRef]
- Hussain MM, Concetti C, Toke D, Thomas K, Duffy P, Vergunst J. “Here comes the sun”: Determinants of solar farm planning at local authority level in England. Energy Research and Social Science. 2025;119:103916. [CrossRef]
- Hildebrand J, Kortsch T, Rau I. The public acceptance of Power-to-X technologies: Results from environmental psychological research using a representative German sample. Sustainability. 2025;17(14):6574. [CrossRef]
- Osei J, Brown K, Nejati M. Understanding the factors affecting social acceptance of solar energy technologies. Energy Strategy Reviews. 2025;60:101861. [CrossRef]
- López I, Sanagustín-Fons V, Moseñe Fierro JA. Social perception of renewable energies: Barriers and opportunities for an inclusive energy transition. Energy Policy. 2026;191:114899. [CrossRef]
- Rogers EM. Diffusion of innovations. 5th ed. New York: Free Press; 2003.
- Geels FW. Technological transitions as evolutionary reconfiguration processes: A multi-level perspective and a case-study. Research Policy. 2002;31(8-9):1257-1274. [CrossRef]
- Sträter R, Lüchinger R, Zumofen G. Exploring the market and community acceptance of seasonal thermal energy storage technologies: Insights from a population survey in Switzerland. Energy Research and Social Science. 2025;121:103954. [CrossRef]
- Martens E, Naeyaert S, Van Hove S, Pelka S, Preuß S, Gabriel M. Transitioning towards sustainable heating: A mixed-methods study of heat pump acceptance among Flemish homeowners. Energy Research and Social Science. 2025;124:104137. [CrossRef]
- Orsitto L, Riefolo M, Taormina V, Lombardi M, Faccilongo N. Social and political dimensions of renewable energy communities: A systematic literature review. Sustainability. 2026;18(7):3357. [CrossRef]
- Zhang F, Li R, Wang Q. How does AI technology innovation drive carbon emission efficiency? A machine learning-based meta-frontier analysis across 75 countries. Sustainable Development. 2026;34(3):2841-2862. [CrossRef]
- Boateng SA, Xi J, Fumey MP, Kumi JK. Exploring the nonlinear relationship of environmental sustainability factors and economic growth in West Africa: Novel machine learning evidence. Sustainable Development. 2026;34(2):1885-1904. [CrossRef]
- Sarıışık G, Göncü B, Öğütlü AS. Harnessing Industry 4.0 technologies to reduce SMEs’ carbon footprint: A machine learning-based assessment. Journal of Environmental Management. 2026;372:128459. [CrossRef]
- van der Laag R, Rizzato A, Bäck T, Fan Y. Machine learning for hydrogen technologies: A comprehensive review of challenges, opportunities, and emerging trends. International Journal of Hydrogen Energy. 2026;134:152556. [CrossRef]
- Calise F, Cappiello FL, Cimmino L, Cutolo L, Vicidomini M. Sustainable energy solutions for dairy farms under the bio-circular economy approach: Dynamic modelling and energy and economic analysis. Renewable Energy. 2026;245:123886. [CrossRef]
- Wang D, Sarsaiya S, Zheng J, Wong JWC, Zhou J, Zhang J. A critical review on the development stages of biorefinery systems for sugarcane processing wastes. Renewable and Sustainable Energy Reviews. 2026;215:116316. [CrossRef]
- Anbarasu K, Vickram AS, Yaashikaa PR, Thanigaivel S, Saravanan A, Thamarai P, et al. A comprehensive review on pioneering sustainable biotechnologies: Transforming waste biomass into high-value products for a circular bioeconomy and a zero-waste future. Sustainable Energy Technologies and Assessments. 2026;76:104759. [CrossRef]
- Ibarra-Esparza FE, González-López ME, Senés-Guerrero C, Chong JPJ, Forrester S, Gradilla-Hernández MS. Anaerobic co-digestion of agro-industrial wastes: A systematic review focused on feedstock physicochemical parameter optimization. Biomass and Bioenergy. 2026;196:108671. [CrossRef]
Figure 1.
Distribution of the target intention score for biogas-solar microgrid adoption.
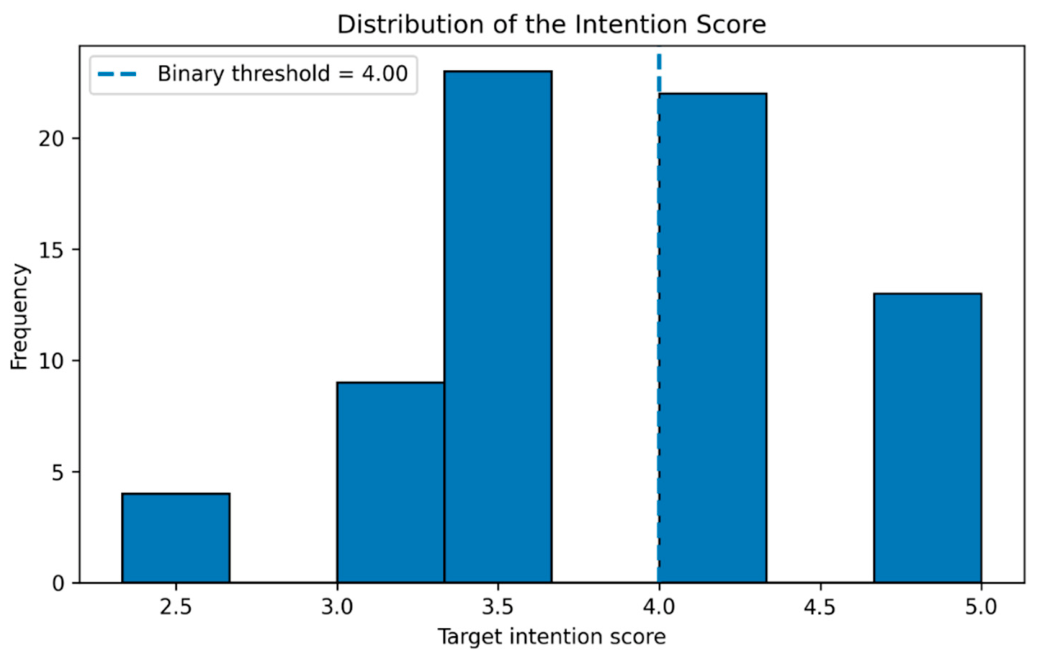
Figure 2.
Correlation heatmap of the top predictors associated with adoption intention.
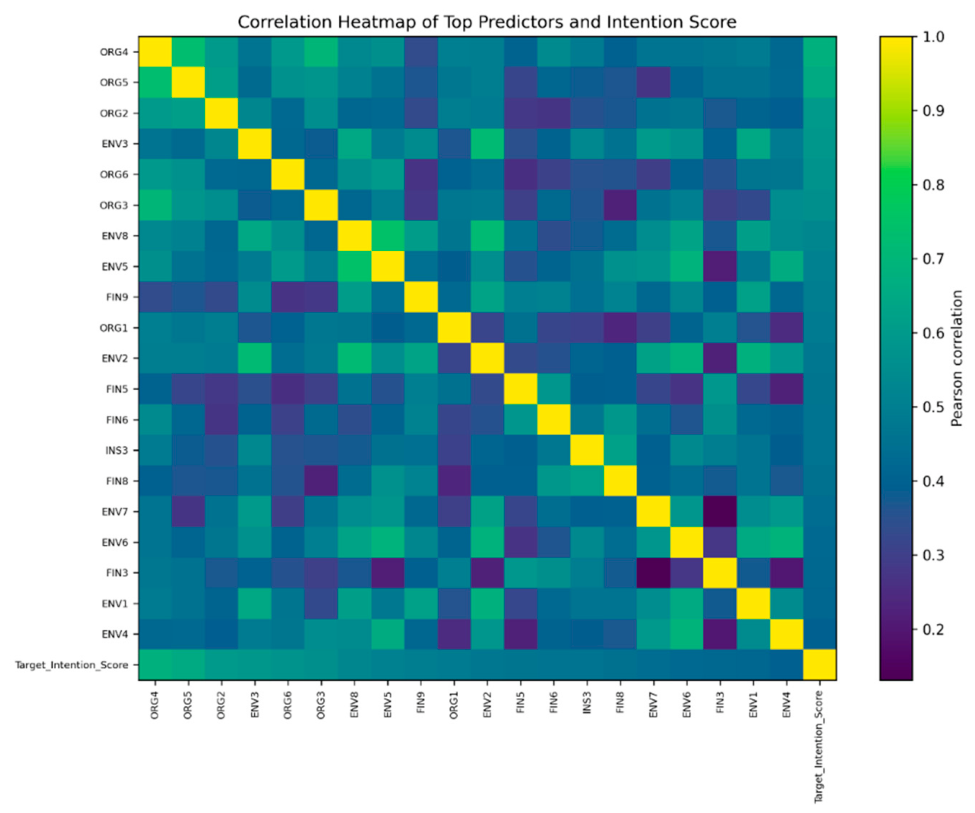
Figure 3.
Classification model comparison based on cross-validated performance.
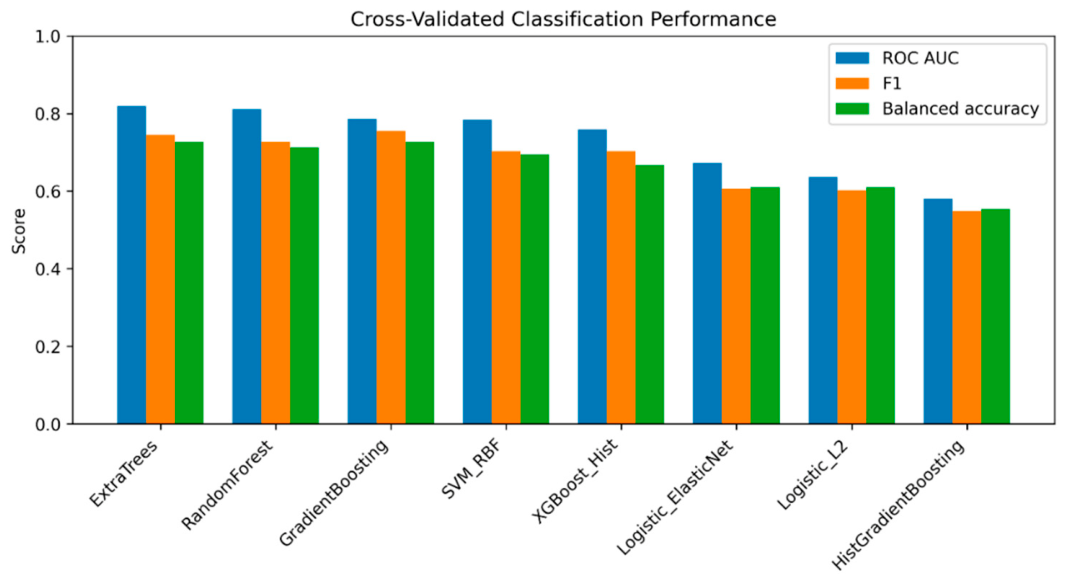
Figure 4.
ROC curve for the best classifier.
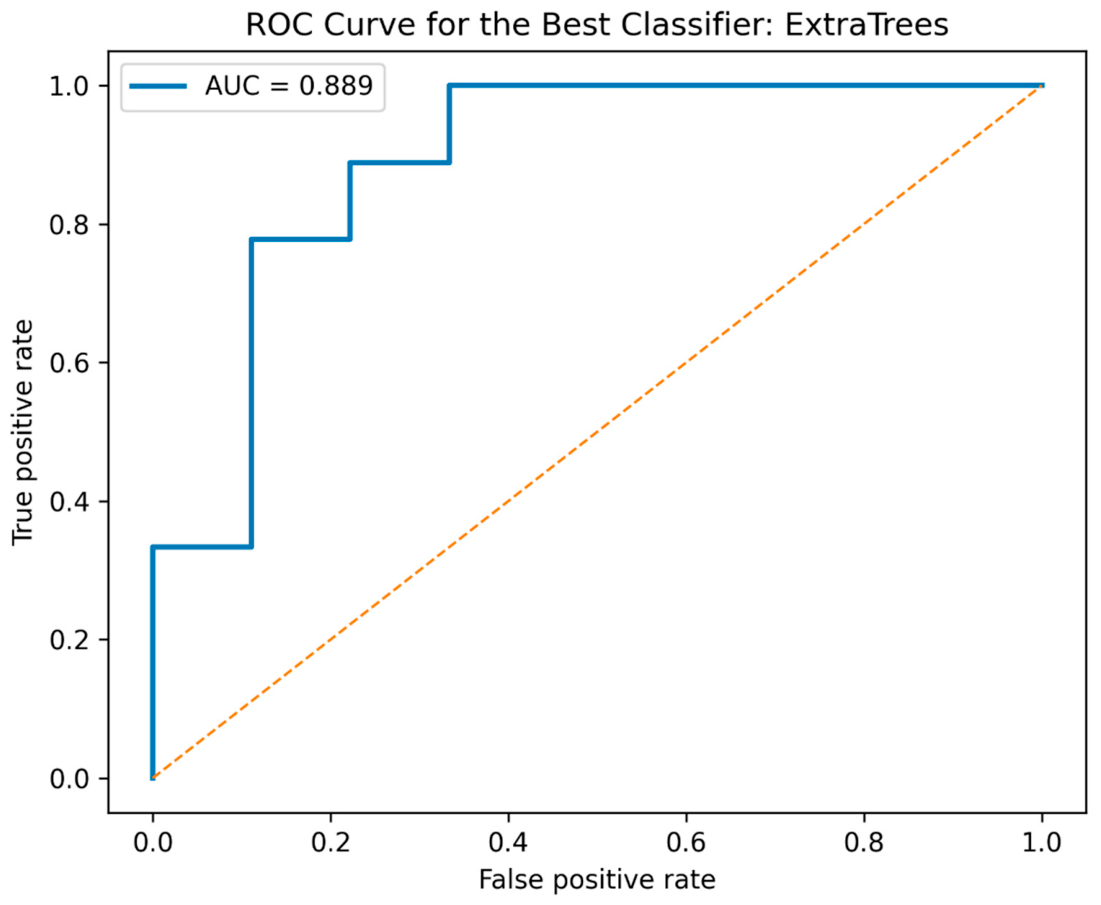
Figure 5.
Precision-recall curve for the best classifier.
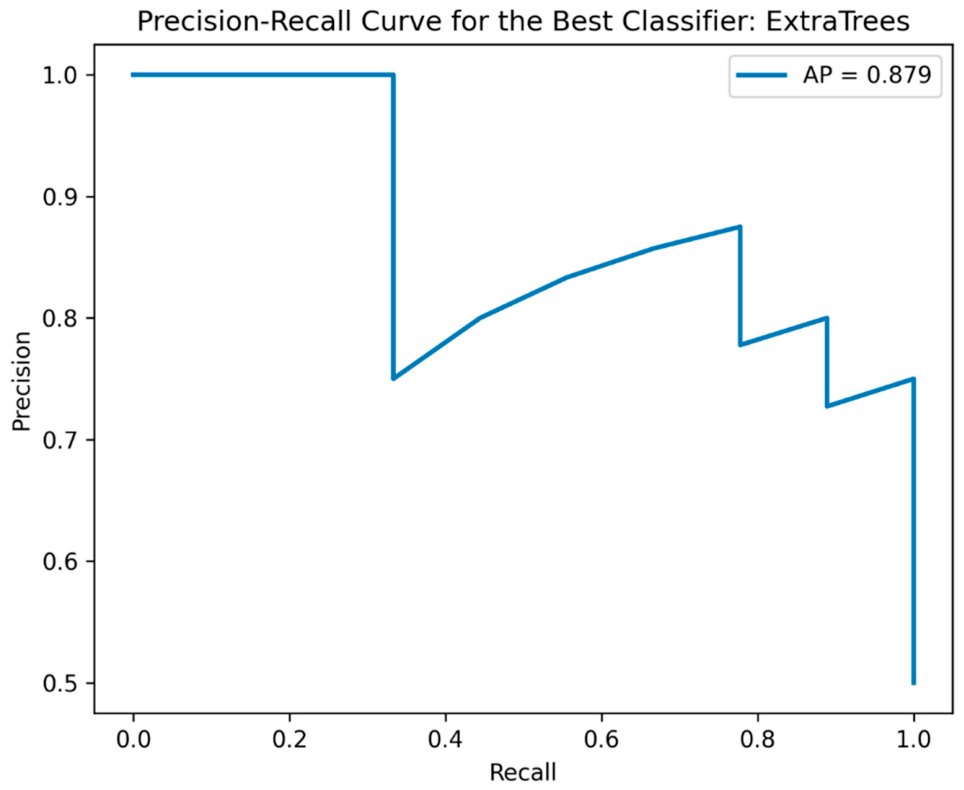
Figure 6.
Confusion matrix for the best classifier.
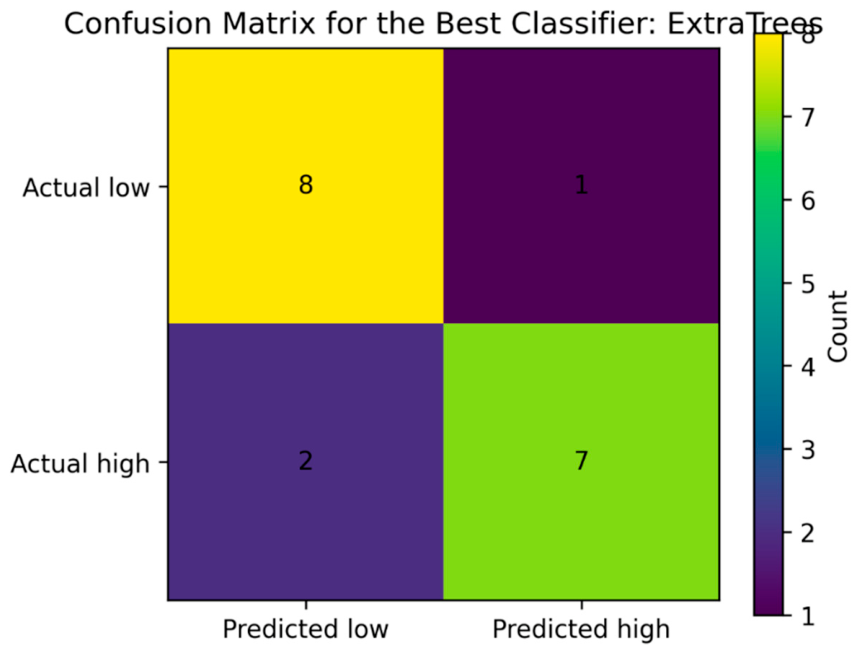
Figure 7.
Calibration curve for the best classifier.
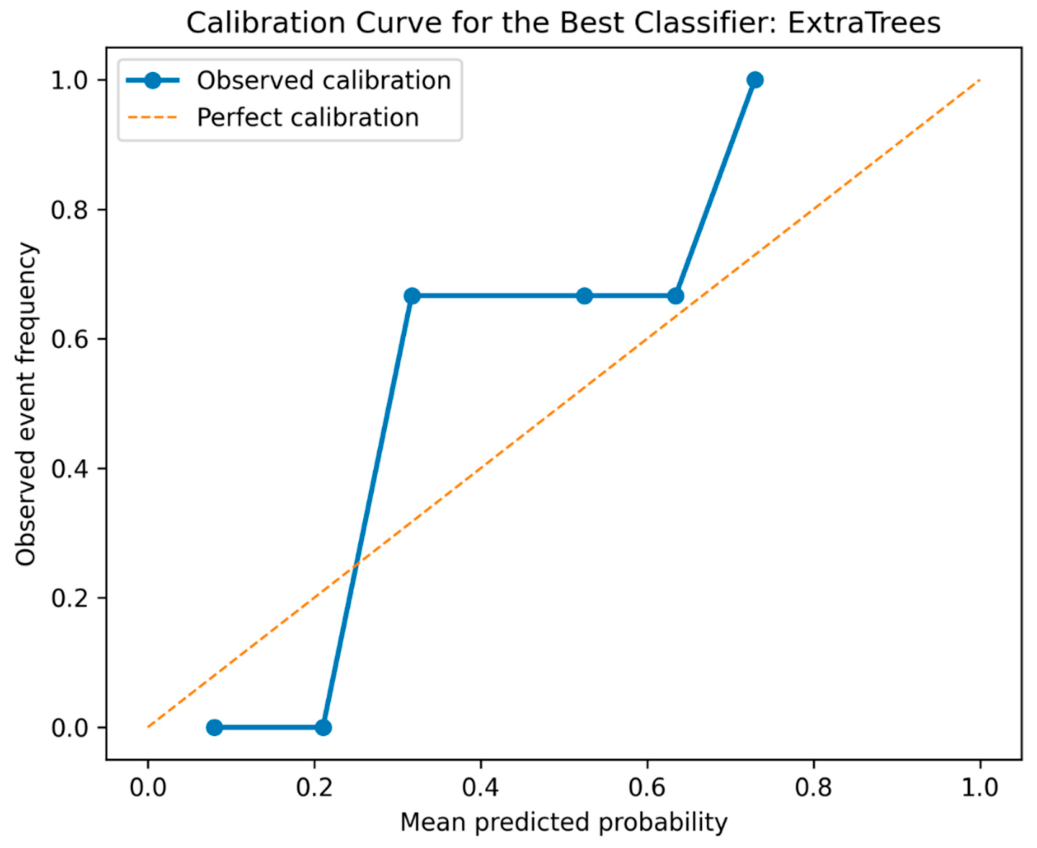
Figure 8.
Regression model comparison based on RMSE.
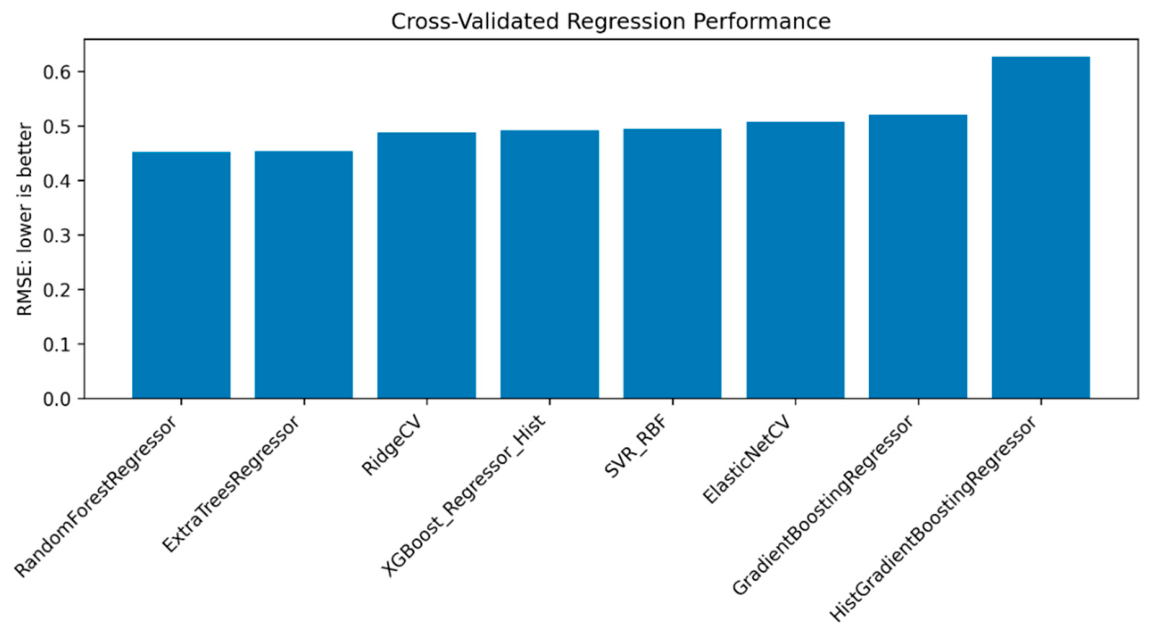
Figure 9.
Observed versus predicted values for the best regressor.
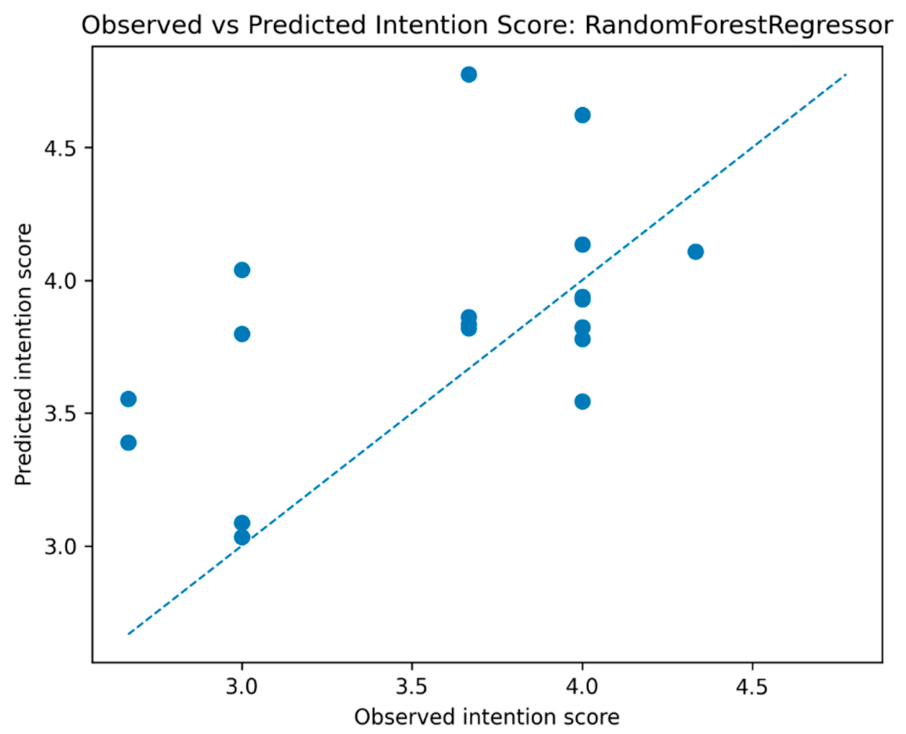
Figure 10.
Residual distribution for the best regressor.
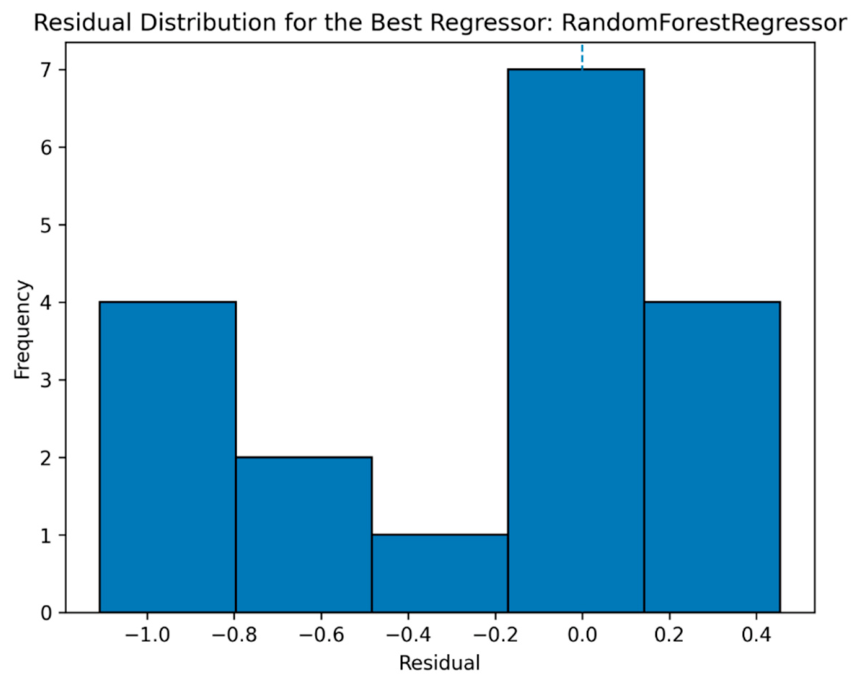
Figure 11.
Residuals versus predicted values for the best regressor.
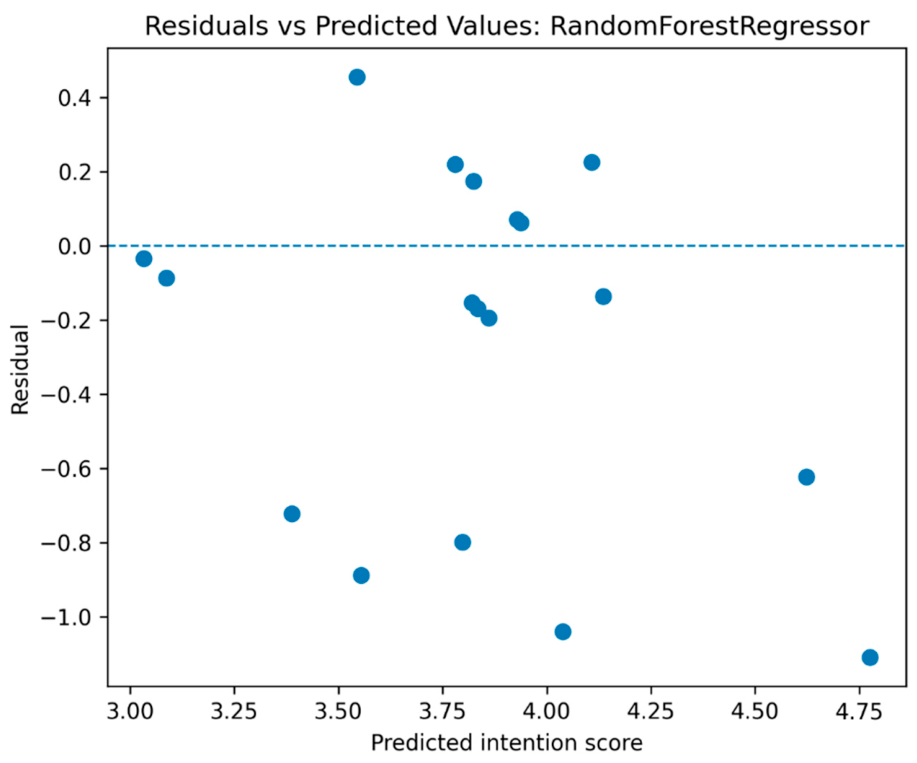
Figure 12.
Permutation feature importance for the best predictive model.
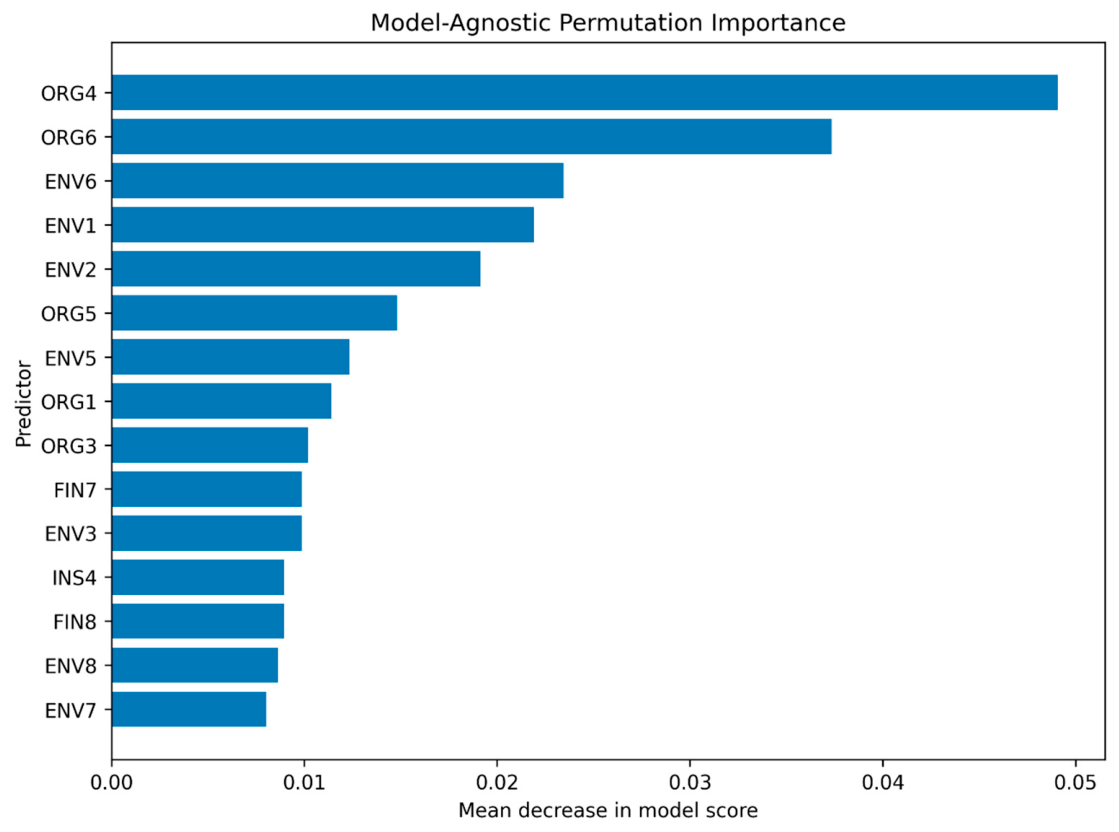
Figure 13.
PCA-based cluster map of organizational profiles.
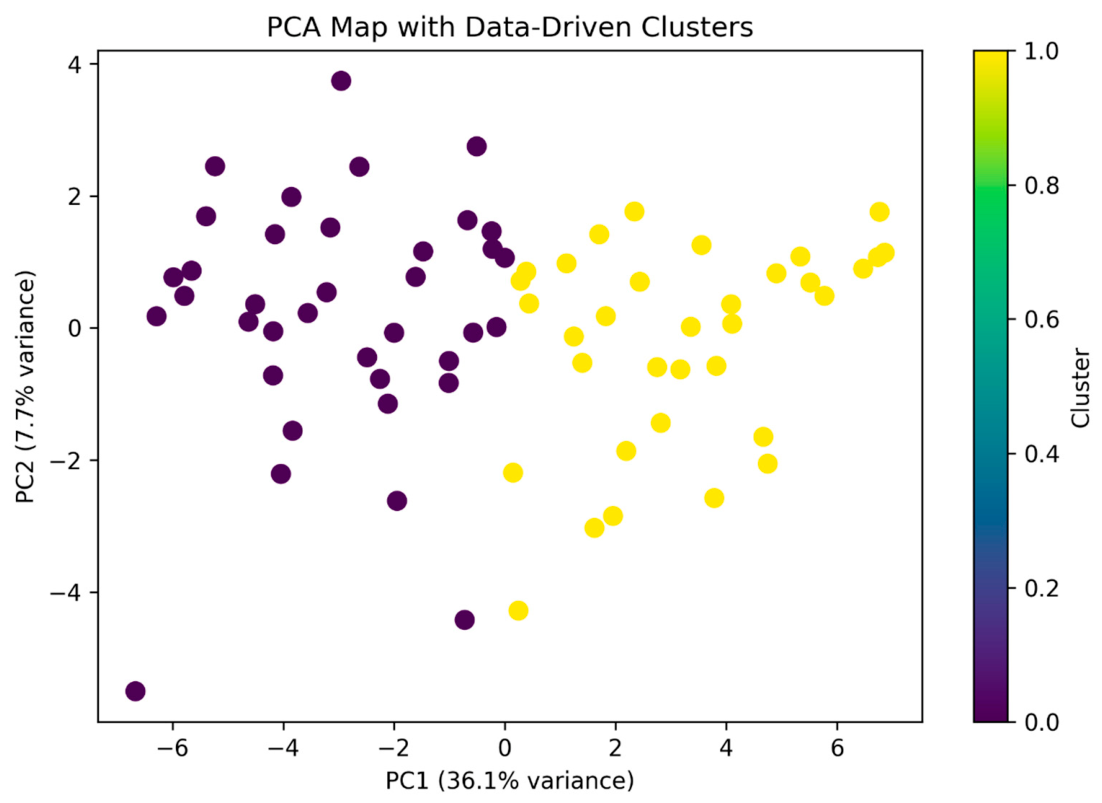

Table 1.
Analytical configuration of the modeling database and the target variable.
| Indicator | Result |
| Analyzed observations | 71 |
| Predictors used | 37 |
| Items used to construct intention | INT1, INT2, INT3 |
| Mean intention score | 3.826 |
| Standard deviation of the intention score | 0.680 |
| Threshold for high intention | 4.000 |
| Cases with low or moderate intention | 36 |
| Cases with high intention | 35 |
| Proportion of high intention | 49.30% |
Table 2.
Aggregate descriptive profile of the model’s variable blocks.
| Variable block | Number of items | Aggregate mean | Minimum item mean | Maximum item mean | Average standard deviation |
| Perceived benefits, BEN | 3 | 4.028 | 3.915 | 4.127 | 0.947 |
| Barriers, BAR | 2 | 3.387 | 3.366 | 3.408 | 0.984 |
| Institutional conditions, INS | 4 | 3.849 | 3.718 | 3.944 | 0.965 |
| Financial factors, FIN | 9 | 3.809 | 3.549 | 3.986 | 0.915 |
| Environmental criteria, ENV | 8 | 4.092 | 3.958 | 4.239 | 0.814 |
| Organizational capabilities, ORG | 6 | 3.984 | 3.930 | 4.070 | 0.871 |
| Adoption/investment intention, INT | 3 | 3.826 | 3.690 | 3.915 | 0.856 |
Table 3.
Main predictors associated with the continuous intention score.
| Variable | Pearson correlation with the intention score |
| ORG4 | 0.680 |
| ORG5 | 0.657 |
| ORG2 | 0.597 |
| ENV3 | 0.590 |
| ORG6 | 0.575 |
| ORG3 | 0.565 |
| ENV8 | 0.528 |
| ENV5 | 0.509 |
| FIN9 | 0.497 |
| ORG1 | 0.488 |
| ENV2 | 0.472 |
Table 4.
Comparative performance of the main classification models.
| Model | CV ROC-AUC | CV F1 | Test Accuracy | Test Balanced Accuracy | Test Precision | Test Recall | Test F1 | Test ROC-AUC | Test Average Precision | Test MCC | Brier Score |
| ExtraTrees | 0.819 | 0.744 | 0.833 | 0.833 | 0.875 | 0.778 | 0.824 | 0.889 | 0.879 | 0.671 | 0.154 |
| RandomForest | 0.811 | 0.728 | 0.778 | 0.778 | 0.778 | 0.778 | 0.778 | 0.864 | 0.847 | 0.556 | 0.157 |
| GradientBoosting | 0.786 | 0.755 | 0.778 | 0.778 | 0.857 | 0.667 | 0.750 | 0.852 | 0.835 | 0.570 | 0.205 |
| XGBoost_Hist | 0.760 | 0.703 | 0.722 | 0.722 | 0.700 | 0.778 | 0.737 | 0.827 | 0.745 | 0.447 | 0.176 |
| SVM_RBF | 0.784 | 0.703 | 0.778 | 0.778 | 0.857 | 0.667 | 0.750 | 0.802 | 0.732 | 0.570 | 0.190 |
| Logistic_ElasticNet | 0.672 | 0.606 | 0.833 | 0.833 | 0.875 | 0.778 | 0.824 | 0.778 | 0.727 | 0.671 | 0.169 |
| Logistic_L2 | 0.636 | 0.603 | 0.722 | 0.722 | 0.750 | 0.667 | 0.706 | 0.802 | 0.732 | 0.447 | 0.173 |
| HistGradientBoosting | 0.580 | 0.549 | 0.722 | 0.722 | 1.000 | 0.444 | 0.615 | 0.556 | 0.714 | 0.535 | 0.240 |
Table 5.
Performance of regression models through cross-validation.
| Model | CV RMSE | CV MAE | CV R² | CV Explained Variance | CV MAPE |
| RandomForestRegressor | 0.453 | 0.358 | 0.453 | 0.534 | 0.100 |
| ExtraTreesRegressor | 0.454 | 0.348 | 0.455 | 0.532 | 0.097 |
| RidgeCV | 0.488 | 0.407 | 0.358 | 0.461 | 0.111 |
| XGBoost_Regressor_Hist | 0.492 | 0.384 | 0.345 | 0.420 | 0.108 |
| SVR_RBF | 0.495 | 0.405 | 0.355 | 0.497 | 0.113 |
| ElasticNetCV | 0.508 | 0.421 | 0.323 | 0.409 | 0.115 |
| GradientBoostingRegressor | 0.521 | 0.425 | 0.303 | 0.374 | 0.117 |
| HistGradientBoostingRegressor | 0.628 | 0.528 | -0.042 | 0.079 | 0.144 |
Table 6.
Main explanatory variables according to permutation importance, native importance, and correlation with intention.
Table 6.
Main explanatory variables according to permutation importance, native importance, and correlation with intention.
| Variable | Permutation importance | Native importance | Correlation with intention |
| ORG4 | 0.049 | 0.091 | 0.680 |
| ORG6 | 0.037 | 0.044 | 0.575 |
| ENV6 | 0.023 | 0.039 | Not included in top 11 |
| ENV1 | 0.022 | Not included in top 11 | Not included in top 11 |
| ENV2 | 0.019 | 0.055 | 0.472 |
| ORG5 | 0.015 | 0.045 | 0.657 |
| ENV5 | 0.012 | Not included in top 11 | 0.509 |
| ORG1 | 0.011 | Not included in top 11 | 0.488 |
| ORG3 | 0.010 | 0.067 | 0.565 |
| FIN7 | 0.010 | Not included in top 11 | Not included in top 11 |
| ENV3 | 0.010 | 0.039 | 0.590 |
Table 7.
Selection of the number of clusters using the silhouette coefficient.
| Number of clusters | Silhouette coefficient |
| 2 | 0.208 |
| 3 | 0.123 |
| 4 | 0.097 |
Table 8.
Aggregate profile of the identified clusters.
| Cluster | 0 | 1 |
| Benefits | 3.532 | 4.569 |
| Barriers | 3.203 | 3.588 |
| Institutional | 3.358 | 4.382 |
| Financial | 3.372 | 4.284 |
| Environmental | 3.598 | 4.629 |
| Organizational | 3.550 | 4.456 |
| Intention score | 3.468 | 4.216 |
| Proportion of high intention | 0.324 | 0.676 |
Disclaimer/Publisher’s Note: The statements, opinions and data contained in all publications are solely those of the individual author(s) and contributor(s) and not of MDPI and/or the editor(s). MDPI and/or the editor(s) disclaim responsibility for any injury to people or property resulting from any ideas, methods, instructions or products referred to in the content. |
© 2026 by the authors. Licensee MDPI, Basel, Switzerland. This article is an open access article distributed under the terms and conditions of the Creative Commons Attribution (CC BY) license (http://creativecommons.org/licenses/by/4.0/).
Copyright: This open access article is published under a Creative Commons CC BY 4.0 license, which permit the free download, distribution, and reuse, provided that the author and preprint are cited in any reuse.


