

Submitted:
19 May 2026
Posted:
20 May 2026
You are already at the latest version
Abstract
(1) Background. Food sovereignty and local sustainability are ensured by large agro-industrial holdings and small-scale farms; this is synergy forms a complementary model of the agrifood system. Maintaining this model’s balance requires the creation of a unified digital ecosystem that integrates all suppliers and consumers into production chains, thereby eliminating unnecessary intermediaries. (2) Methods. This study employs a comprehensive methodological framework, including systems analysis and mathematical modeling, to develop service algorithms. Object-oriented design and software engineering methods facilitated the development and implementation of a service-oriented architecture for the digital system. (3) Results. The study presents a multi-tier architecture featuring an integration bus based on a service-oriented approach. To implement direct supply-and-demand coupling strategies, the system integrates both internal services (microeconomic indicators) and external services (macroeconomic indicators). Additionally, a recommender system based on neural networks and mathematical models was developed to personalize consumer requests and manage product sales. (4) Conclusions. The software solution is consistent with the AgTech 4.0 concept and enables the creation of a seamless environment for interstate trade. The implementation of the system enhances the transparency of the “product footprint”, facilitates the redistribution of surpluses, and, consequently, contributes to price stabilization.
Keywords:
agriculture
; crop production
; digital transformation
; food footprint
; food availability
; consumer basket
1. Introduction
The task of ensuring food security at the international level is a significant and stabilizing factor in the global order [1,2]. The historical development of humanity starkly illustrates that “national security largely depends not only on human resources, military power, and spatial quantity, but also on the potential to provide the population with food” [3].
Originally the idea of food security constituted the stability in the food market by ensuring the availability of basic foodstuffs of all countries of the world [4]. The transformation of global processes, the increasing frequency of geopolitical conflicts, and the increase in international tensions have constantly challenged and changed the definition of food security. The dictates of the time pronounced the definition of food security as “the correspondence of the quantity of nutritious and safe food to the dietary needs of the population, presuming active and healthy lifestyle” [2], further expanding the concept in a social context, adding the factor which covers needs of the population in terms of stable access to food [5,6]. Food crises, arising in one country, trigger a chain of widespread problems, thus link food and national security in a global context [7,8,9].
The key aspects, from the viewpoint of the food security management process, include:
- physical availability of food for the population in the required quantities;
- economic accessibility of food products for the population;
- ensuring the population meets energy and physiological consumption standards for a balanced diet;
- food safety and suitability for consumption.
All of this can be achieved through domestic public resources, based on the activity of the agro-industrial complex. The transformation of the agricultural sector is determined by the vector of national economic development. Energy, chemical industry, and information technology evolution enables for systemic transition from an extensive to intensive model of food production, processing, and marketing, driven by technological convergence. Moreover, depending on the region, the pace of such transformation is determined not only by self-sufficiency in internal food needs but also by the ability to to acquire sufficient food at the global market [8,10,11].
This approach is typical for countries with emerging economy. They spend the resources of the agro-industrial sector on producing cost-effective products only, including through export. Import of products is possible either using the proceeds or using the products cheaper than domestic production yield [12]. From a food security perspective, such strategies are exposed to considerable logistical, political, and currency risks [9,13]. Of particular note are the emerging problems in terms of product availability and quality, which make the food not a basic human right but a market asset [14]. Farmers might consider it profitable to produce only those products for which there is demand and the ability to afford the means of production (seeds, breeding livestock, fertilizers, feed additives, equipment, spare parts, etc.). Under recessional conditions (including fragile economy), the full and effective operation of large agricultural holdings becomes complicated, which is why small farms are emerging [15,16].
Ecological agenda is an increasingly important accelerator here [17]. At the current stage of societal development, major participants in the agricultural sector are blamed for the environmental crises burn out. Depending on their activities, agricultural holdings are criticized for soil degradation, the overuse of mineral fertilizers and pesticides to increase yields, tending to the cultivation of monocultures, the destruction of natural ecosystems, the origination of carbon footprints, etc. The resulting negative public sentiment has influenced a shift in consumer demand, like an expanding market for organic and local products, individual nutrition, the production of rare types of products, etc. [18,19]. Small farms cope better with cultivating unique varieties and perform manual quality control, which appears to be difficult to implement in conveyor-type production. In addition, it is unprofitable for large companies to engage in such high-margin products, as they cherish volume rather than uniqueness.
With intelligent technologies small farmers are now capable to generate high profits from small plots through the implementation of various sensors and control systems, as well as automated solutions for managing technological and business processes [20]. Technologies and subsidies for small agribusinesses, designed to avoid the monopoly of large corporations, have attracted specialists with marketing competencies and modern management methods to remote communities, turning agriculture into a trendy startup [21].
Thus, the main challenge today is the ability of small farms and large agricultural holdings to produce and sell products, ensuring national food security. For reasons given, this paper aims to develop a conceptual model and mechanisms for the functioning of agricultural production and marketing processes to ensure food sustainability for a group of countries.
To achieve this goal, the following research tasks shall be completed:
- Conduct an analysis of mechanisms for ensuring food security at the intergovernmental level.
- Analyze international experience in digital transformation of the agricultural sector in the context of ensuring control, monitoring, and data exchange in the agricultural production engineering and marketing to identify the best-performing technological solutions.
- Develop a digital system architecture model that integrates consumers, suppliers, and representatives of government regulatory agencies.
- Develop key scenarios for interaction between all parties concerned of the relevant process by means of the digital system.
The scientific novelty of this study lies in the development of a digital food security management system that facilitates the transition from a reactive to a predictive management model, incorporating a consensus-based system for assessing internal and external threats. From the perspective of end market participants (farmers and consumers), a unified scientific and methodological framework is being developed for creating a transparent food footprint system at the interstate level.
The theoretical significance of this study is justified by its scientific novelty and lies in the development of algorithms for managing the availability of agricultural products in the digital ecosystem of an interstate association, planning the production of specific products, providing farmers with collective access to a common infrastructure enabling the sale of products at varying degree of readiness, and custom consumption of finished products. These algorithms and models can be used in research and development related to yield forecasting, adaptive crop planning based on consumer demand (or other factors), and the organization of practice-oriented educational programs for training specialists in the field of production and logistics process management.
The practical significance of this study lies in the creation of a one-to-one model directly linking suppliers and consumers, eliminating speculative intermediaries from the pricing system for finished products. The results obtained can be used to create a unified support system for farmers or vulnerable consumer groups (for instance, against sharp price hikes).
2. Literature Review
2.1. Specification of Current Research in the Field of Food Security
Consumer demand in terms of food varies depending on the level of social, cultural, economic, and technological development of society [22,23,24]. Despite this, Russian and international researchers lack a comprehensive model of food security that would evolve in response to societal demands. However, there are existing conventional models based on quantitative assessments of the physical and economic availability of food, compliance with health nutrition standards, and product compliance with certain quality requirements [25,26]. These models are most clearly expressed in the works of Russian researchers.
Russian researchers focus their attention on the development of domestic food production [5,27,28,29]. This aligns with the state strategy for the development of national agro-industrial complex, as formulated in the Doctrine of Food Security of the Russian Federation [28,30]. The strategic goals and objectives outlined therein are assessed as quantitative indicators in accordance with traditional models of food security. In addition to physical food accessibility and the development of domestic production, the Doctrine emphasizes the development of distribution infrastructure and adherence to healthy eating standards. Mityashin, in his study of Russian scientific literature, claims that access to food between production and consumption regions is disproportionate, and increasing production rates may never guarantee resolving of food security issue [25].
Russian researchers note that the relevance of traditional food security models manifested itself against the backdrop of the changing geopolitical situation in the world in 2014 [29,31]. Restricted access to foreign resources, including food, triggered the development of domestic production [32,33]. Timely measures taken and their strengthening in 2022 suggest that Russia is not experiencing difficulties in providing its population with basic foodstuffs using its own resources [25,28,30].
Food availability in challenging conditions (in addition to geopolitical conditions, constantly changing climatic and weather conditions shall be considered) is the result not only of management or economic activity, but also of complex scientific work. In Russian science, as well as everywhere in the world, the main trends are research and development related to selection and genetics, precision farming, the creation of alternative food sources, the improvement of storage and logistics technologies, the preservation of biodiversity, and the reduction of anthropogenic impact on ecosystems. It should be noted that food security is not in the focus of such work.
Researchers focus on localized solutions aimed at specific regions. In particular, the use of drones, IoT sensors, and artificial intelligence technologies is primarily directed toward solving crop yield management issues, reducing the environmental footprint, or improving business process management within agricultural complexes and farms. However, these findings are rarely considered in the broader context of food security. Nevertheless, they are crucial for building national scientific potential and creating mechanisms to mitigate the impact of global market shocks.
Contemporary research enriches the traditional food security model with qualitative characteristics based on medical nutritional standards and requirements for the food products themselves. In such models, products are assessed from the perspective of their interaction with the consumer in a precise context:
The listed characteristics of the food security model represent distinct areas of research that shape healthy lifestyles for both individuals and society as a whole. The objects of such research are processes whose detailing serves a specific goal—from molecular levels to the behavior of human populations. An analysis of the practical significance of the results suggests that they align with food security based on the "how to ensure health" principle, rather than merely "how to ensure food." To this end, households may utilize the Household Food Insecurity Access Scale (HFIAS), the Household Dietary Diversity Score (HDDS), the Household Hunger Scale (HHS), and the Coping Strategies Index (CSI).
Research may be subject to territorial limitations. Studies are associated not only with localization within a single country based on particular characteristics (climate zone, level of economic development, etc.) [3,5,51], but also with the forms that deep integration may take based on the freedom of movement, a unified economic policy, and common governing bodies [4,13]. Countries may enter economic and customs unions, specialized food alliances, and other associations that affect food security for both members and non-member states [9,39,52]. In particular, researchers emphasize existing problems in the modernization of agro-industrial infrastructure, product distribution methods, market monopolization, import substitution, regional poverty levels, the shortage of personnel in high-quality production, and the availability of such products. International research experience is based on the Aglink-Cosimo and PEM dynamic economic-mathematical models of partial equilibrium for long-term forecasting [53,54], and the EPACIS model for analyzing the risks of deliberate interference in supply chains [55].
The theoretical significance of the results of studies utilizing the Aglink-Cosimo or PEM models lies in the substantiation of the relationships between demand, supply, pricing, and trade policy amid changes in agriculture at global and national levels. The applied methodological tools allow for an effective evaluation of agricultural policies (subsidies, loans, tariffs) to achieve a balance between supply and demand, as well as to model consumption levels in regions relative to global prices, climate change, or geopolitical shifts. PEM models also provide a theoretical justification for how government policies affect farmers' decision-making (for example, by demonstrating transfer efficiency). The results obtained are of practical significance and are used to assess political risks, generate annual agricultural forecasts, and develop long-term investment strategies for the private sector.
2.2. Classification of Software in Agriculture
The agro-industrial software market is in between a transformation, offering solutions differentiated by production scale and business process specifics. Agricultural enterprises are offered both specialized software products and comprehensive digital ecosystems to support sustainable development [4]. These ecosystems are based on analytical services that minimize risks in the face of volatile external factors (climate change, agricultural conditions, market conditions, etc.) [17].
The predictive potential of these systems not only contributes to improved production performance but also to the identification of macroeconomic patterns necessary to ensure national food security [13,57]. The implementation of comprehensive digital solutions enables the identification of inappropriate land use, the creation of end-to-end data channels for simulation modeling and forecasting of export-import transactions, and the optimization of government regulation mechanisms such as preferential lending, subsidies, and grant support. The pace of global digital transformation in agriculture is determined by regional specifics, namely, the level of economic development, the availability of technology, the state of the research base, climatic conditions, and government support measures [11,58]. The following groups of regions are distinguished:
Leaders (Western Europe, North America). These countries are characterized by consistently high rates of digitalization. A priority is the development and implementation of solutions for creating autonomous farms realizing the principles of precision farming. The technological foundation is sensor networks, unmanned aerial vehicles, IoT technologies, and artificial intelligence for crop yield optimization. Strict environmental standards and high labor costs also serve as additional incentives. Figure 1 presents a software classification with examples of relevant commercial products and their key functionalities.
- 5.
- Dynamically developing countries (Russia, Brazil, China). These countries are characterized by accelerated rates of transformation through the customization of ready-made software solutions for large-scale production. The main driver here is government support for agricultural holdings. However, regional specifics are observed, like in Russia and Brazil, the focus is shifted to the use of smart technology, production cycle monitoring systems, and digital accounting; in China, priority is given to supply chain management based on cloud platforms. Figure 2 presents a classification of software with examples of corresponding commercial products and their main functional capabilities in dynamically developing countries.
- 6.
- Spot developemtn countries (India, Southeast Asian countries). Rates of digitalization are quite moderate and piecewise there. Due to the high degree of parcellation of land, the use of specialized software products adapted to the needs of small farms is prevalent. Figure 3 shows the main classification of the functional capabilities of such software products.
- 7.
- Countries with a low digitalization rate (most of Africa and Central Asia). The industry's development is hampered by the lack of basic infrastructure (communications, electricity). Discrete services (e.g., SMS alerts) are used instead of comprehensive systems. The implementation of technologies is primarily carried out within the framework of international grants and humanitarian initiatives to combat hunger. Figure 4 shows the software solutions used according to the classification of their main functional capabilities.
At this stage of development, there is a distinct gap between modern hardware and software solutions and research in the field of digital transformation in agriculture [30,59,60]. This is primarily due to the increasing complexity of digital systems: they include numerous services, equipment, and various peripheral devices, which increases their overall cost. The primary goal of scientific research is to find and substantiate ways to reduce the cost of such technologies [61].
Cost reduction is achieved through improved downgrading, the development of technologies for producing low-cost analogs that retain the key properties of components, as well as the optimization, standardization, and unification of the design of hardware components [62,63]. Furthermore, the practical significance of this research lies in the possibility of creating fully autonomous systems, whereas the goal of modern software is to develop tools that merely assist the user and require confirmation of individual operations for decision-making [64,65].
3. Materials and Methods
3.1. Area of Concern Specification
Agriculture all over the world tends to shift from large state-owned or collectively owned structures to smaller farms, specifically, family farms, individual entrepreneurs, and other types of farming, depending on the region [30,38]. This is leading to the emergence of millions of smallholders who can more quickly adapt to demand and produce unique products (organic vegetables, microgreens, meat, berries, etc.). Some of the yield may be retained for personal consumption, while the surplus can be sold, thereby becoming a part of a small business.
From a food security perspective, this approach might be seen as both beneficial and risky. For consumers, the bankruptcy or demise of a single small producer will go virtually unnoticed, which contributes to the overall stability of the market. Individual entrepreneurship allows for the creation of jobs and the development of infrastructure in remote areas, the use of organic production methods, and the effective use of available software and hardware in cultivated areas [16,21].
However, these same peculiarities entail serious risk exposure for farms. The most important of these is marketing. Retailers require stable volumes of certified products. Failure to ensure the required scale of production significantly hinders market access and attracting regular buyers, who are often limited to nearby areas. Expanding the sales market requires addressing logistical issues not only with sales but also with resource procurement. Purchasing feed, equipment, seeds, and other items at retail is always more expensive than wholesale. Furthermore, any negative factor caused by natural disasters or human impacts can lead to product destruction and bankruptcy for small businesses. This is due to the lack of production capacity and financial "safety net" typical for large agricultural complexes.
Based on the above, the research area of concern is the organization of farm management processes for the marketing of crop products in the context of food security.
The research focuses on the processes of organizing a digital market for farm produce.
The subject of the study covers the tools that support economic and technological relationships in a direct farmer-consumer relationship model.
The following were used as input data for testing the system and training the neural networks:
A public cadastral map (e.g., for Russia - https://map.ru/pkk; Kyrgyzstan - https://cadastre.kg/svc-portal/map/main.do; Kazakhstan - https://map.gov4c.kz/egkn) to obtain information on the economic purpose of plots, addresses and coordinates of their actual location, as well as location in comparison to accessible road infrastructure.
- 8.
- A public catalog of fruit varieties, providing a description of cultivation characteristics and photographs demonstrating varying degrees of ripeness (https://vniispk.ru/species/cherry/alphabet).
- 9.
- A public catalog of vegetables, classified by type and providing access to the characteristics of the selected plant (https://www.cnshb.ru/AKDiL/0055/default.shtm).
- 10.
- State Register of Varieties and Hybrids of Agricultural Plants Approved for Use in the Russian Federation (https://gossortrf.ru/registry).
3.2. Methodology Particulars
Manageability and predictability of software development is supported by a methodology that includes a rigorous system of principles, methods, and tools:
Systems analysis was used to formalize requirements. This interdisciplinary methodology enabled structural and logical modeling of a complex subject area. The object of study is characterized by a set of heterogeneous elements with non-obvious relationships. Furthermore, the state of the system and its components is influenced by random factors. Decomposition and structuring methods were used comprehensively to identify key system characteristics. These methods helped define the core functionality of the software and the corresponding user categories.
Methods consistent with an architectural pattern represented the system as a set of small, independent services divided into logical layers. This implements the principles of layered and microservice architectures. Conventionally, the application architecture can be divided into layers of data access, business logic, and controllers.
Mathematical modeling methods were used to give quantitative characteristics of the real-world objects and processes. These methods are necessary in the study for constructing models based on experimental data to implement individual software functionalities.
A deep convolutional neural network architecture was used for image recognition. The ResNet18 model, pretrained on the ImageNet dataset, was used as a feature extractor in this study. The tradeoff between computational efficiency and hierarchical feature extraction quality was consistent with the objectives and goals of the study. The training strategy consisted of a gradual “unfreezing” of layers, implemented in two stages.
The integrated use of object-oriented analysis and object-oriented design allowed us to represent the system as a collection of objects and their interactions through classes, attributes, and methods. Adherence to the basic principles of this approach (abstraction, encapsulation, inheritance, and polymorphism) enabled the independence of software modules and services, ensuring architectural stability.
For data management in the developed software, a relational method was used in conjunction with normalization theory. These methods represented data as unique entities identified by a set of attributes. To structure the data in the area of concern, entities were linked by unique attributes into a common data schema. Normalization methods were applied to the schema to ensure integrity and eliminate redundancy and inconsistency. This is a formalized process of transforming data structures to prevent modification, deletion, and addition anomalies.
The graphical user interface combined object-oriented design methods, component-based approaches, prototyping, design systems, and declarative and imperative approaches. The interface is based on standardized controls that adhere to common style guides, ensuring consistency and usability principles.
To test the user interface logic, assess the accessibility of functionality, prioritize user tasks, and determine the context of use, a user scenario method was used. This method was used to describe a specific user interaction history with the developed software product to achieve a specific goal. This scenario allowed for the presentation of user actions without the details of software implementation, but taking into account external circumstances. These circumstances included the location of use (home, work, transportation), time, the user's emotional state, and the risks imposed by interference with the execution of actions.
A graphical method was used to model the quantitative and qualitative characteristics of the concern area and the results of individual research methods. This method allowed the creation of unified logical models that allowed the synthesis of disparate data to identify relationships between variables, trends, and distributions. To interpret the results, this approach was used in conjunction with the analytical method. The choice of diagram type corresponded to the relevance of the characteristics being studied, ensuring strict adherence to scale, coordinate grids, and units of measurement.
- 11.
- A graphic simulation method was used to visualize the semantic results of applying the methods to the research object. It is based on a conventional graphical language that allows for the demonstration of cause-and-effect relationships between unrelated objects, their states, and characteristics.
3.3. Specifications of Mathematical Models for Recommender Services
The operating algorithms of individual software services required the development of mathematical models. These models were used to define basic system settings, enabling recommendations to be generated automatically or manually (in the latter case, using filters working together). The primary parameter used was the distance from the user to the farm or warehouse from which products are transported. This approach was chosen because the supplier's location is always stable and certain. For this purpose, a mathematical model was developed to determine the distance from the farm to the user (formulas 1–4).
- Where lat1 and lng1 are the user's coordinates (rad);
- lat2 and lng2 are the farm's coordinates (rad);
- a is the haversine of the angle (the square of half the chord);
- D is the distance between the supplier and the user (km);
- R is the average radius of the Earth (6371 km);
- places is the number of farms located within the user-specified distance;
- p is the set of plots corresponding to the maximum distance between the user and the supplier;
- Dmax is the maximum distance to the supplier set by the user (km);
- fp is the farms corresponding to the set distance filter;
- dch is the normalized distance for correct execution of the algorithms;
- di is the distance to the i-th farm (km).
The presented model allows one to determine the distance between the user and the supplier based on geodata for filtering the results.
Farms may be similar in nature, so to optimize software performance, they should be clustered. For this purpose, a mathematical model was used, including formulas 5–6.
- Where n is the number of values in the sample;
- v is the current value of the selected characteristic for the farm;
- vmin and vmax are the minimum and maximum values that the characteristic can take, respectively;
- i is the number of intervals;
- hi is the number of values belonging to the i-th interval.
The model is based on Sturges's rule, which involves determination of the optimal number of intervals for data with a normal distribution and a moderate sample size [66]. The choice of this model is justified by the fact that it is not necessary to analyze multiple characteristics (area, revenue, equipment availability, etc.) when the user selects a product.
Based on this information, the rating of the farm or cluster is determined. Depending on the user-set search parameters, a list of the most suitable clusters or individual farms within a cluster with a high rating will be displayed.
The basic level ranking is based on three j-cluster metrics: average distance to the farm (formula 7), average supplier rating (formula 8) and the level at which supplier has access to digital services (formula 9).
The formation of a cluster is carried out through the integrated use of the following methods:
- Calculating Shannon entropy (H) for a qualitative assessment of the obtained results (general formula 10 for different characteristics);
- Entropy normalization (Hnorm) to bring the results to a single scale in the range from 0 to 1 (formula 11);
- Calculating the entropy weight (equal to 1 in total) for an objective assessment of the significance of features: distance (wd for distance entropy Hd - formula 12), rating (wr for entropy Hr - formula 13), and service access level (wsub for entropy Hsub - formula 14);
- Determining distances, including assortment, calculating gaps, and finding their median between adjacent points;
- Determining the clustering threshold to control detail and eliminate distortions.
The result is a mathematical model for determining the farm plot rating, Sp (formula 15), and a cluster, Sc (formula 16).
The developed mathematical models take into account that a single farm may have several different plots for growing different crops. Based on this, the cluster rating is determined by plot and is a number ranging from 0 to 100.
4. Results
4.1. Functional Architecture of the Software Package
To address the objectives of this paper, a multi-level digital platform architecture was developed (Figure 5). Elements located at the corresponding logical levels interact with each other via a common service bus.
In the developed model, the service bus serves as the central link in a service-oriented architecture. System components interact indirectly, but rather through a unified bus interface, implementing the principle of logical data flow management.
Digital system services are distributed among layers according to their functional purpose. The model includes the following layers:
External layer. It interfaces with external systems to synchronize data (public procurement API) and ensure the operability of services at other layers (mapping services, electronic resources on vegetable crops). It also aggregates data needed for forecasting events and improving the accuracy of mathematical models. Furthermore, the external layer houses a data warehouse, providing long-term storage of information generated by the services for subsequent analysis and report preparation.
Data layer. Contains databases with information divided by user segments. The system supports services that process requests from two segments: farmers and consumers. Appendix A shows the general database model. It is normalized to third normal form (data is atomic, all non-key attributes depend on the key attribute, and there are no transitive dependencies). All established system settings ensure data integrity, consistency, and coherence.
ML model layer. Includes a neural network model that enables data processing for predictive analytics. Its metrics and characteristics are described in detail in Section 4.2.
- 12.
- Service Layer. Contains the system's business logic, represented by analytical and operational services.
- 13.
- Presentation Layer. Includes a set of client interfaces corresponding to roles, which are provided to users depending on their level of access to the system's functionality and resources. The interaction model for these user categories is given in Figure 6.
For the purpose of implementing management features (resources, capabilities, etc.), user functions are divided into the following global groups:
Administrators. Configuration of functionality for other functions (Admin). This group also includes Managers, who conduct system content control and support communication with system users, and have a farmer or consumer authorization.
Consumers. Include all users with access to product sales functionality (Farmer) and individuals capable to procure products (Customer).
Unauthorized users. Individuals who have not completed the authorization procedure (Guests). They have access to basic functionality like viewing reference information on vegetable growing, farm arrangement, healthy eating, and government regulations in agriculture.
The Farmer group is further divided into the Standard Farmer and Advanced Farmer classes. When a farmer wishes to be registered in the system, he has to pay a registration fee to access basic functionality:
- Creating and editing a profile describing the products sold and their location (legal and physical addresses);
- Sales service by product type (manual or automated creation of product cards depending on availability, ripeness, delivery methods, and delivery time to the consumer);
- Communication service (notifications concerning order statuses and product conditions, reviewing transaction details with the consumer, and communicating with account and order managers);
- A consumer recommendation service based on clustering and ratings.
In this case, the farmer is assigned the Standard Farmer function. For the sake of capability enhancement, a subscription is available that activates the Advanced Farmer function, which provides access to the following services:
- Auction service. The final price of products is determined through open bidding between buyers. The farmer can put products up for auction within the quantity limits of the digital system that ensures food security. This restrictive measure is necessary to prevent food and price imbalances.
- Production planning service. A recommender system that forecasts regional demand for products based on consumer activity, government policy, production volumes and cultivation of relevant crops by competitors, and external factors (environment, climate, weather).
- Advance order service. A channel for interacting with specific consumers to reserve a specific harvest volume at different stages of production (before the beginning of season, during cultivation, or harvest). This function allows farmers to manage crop acreage and production capacity. To minimize risks, the system includes prepayment, a standard service agreement, and consumer ratings. The system acts as an aggregator and does not fully guarantee the integrity of all parties to the transaction.
- Interactive map. A tool for monitoring regionally grown produce and a communication platform for farmers.
Buyers in the system are classified by their organizational and legal form:
- legal entities and sole proprietors,
- individuals.
Manager implements user verification occurs upon registration. Verification is voluntary, so if it is not completed, the user is considered an individual. Access to the system's functionality is the same for all customer classes, the difference is only in order scope and delivery methods. Each user has an internal rating and a specific cluster attribution. Based on this data, a recommender system generates lists of buyers available to farmers. Buyers can purchase products through advance order, directly from the farmer, or if delivery is available.
A recommender system has been implemented for consumers, which, when creating product selections, takes into account:
- User settings (delivery time and methods, ripeness level);
- Farmer rating (transaction success, reviews, production scope, availability of certificates of conformity, quality of communication in the system);
- Healthy eating principles.
All product types belong to one of the dietary systems, namely sports, therapeutical prophylactic nourishment, therapeutic, and rational nutrition. Each agricultural crop (regardless of variety) has a set of metrics that determine its suitability for specific diets. When a user selects a nutritional system, the service will generate a list of the most suitable products based on their market availability.
Users can access the digital system's resources via a browser (personal computer, tablet, or smartphone) or a mobile app (smartphone), regardless of their function. The software and hardware is to meet the minimum specifications presented in Table 1.
The system is designed so that the primary user requirements are an up-to-date browser and sufficient RAM for real-time data processing.
The smooth operation of all levels of the digital system architecture, requires the hardware and software shown in Table 2.
The developed multi-tier service model is an architectural solution that partitions the system into independent functional layers connected by a centralized service bus. This approach provides a strategic advantage for scalability and fault tolerance, and enables efficient data management.
4.2. Neural Network Architecture and Analysis of Its Training Results
The neural network model is based on the ResNet18 architecture, adapted for multi-classification tasks. Based on the analysis of the vegetable image, the digital system's services uses the classification results to perform as follows:
- Automated creation of a product card (farmer’s confirmation required) intended for sale through auction or retail;
- Determining the degree of vegetable ripeness to calculate the timing and methods of sale based on current demand;
- Verifying that the product received by the buyer matches the farmer’s order.
The neural network model consists of a convolutional feature extraction block (backbone) and independent multi-task heads, the diagram of which is shown in Figure 7.
The user-uploaded image undergoes preprocessing: it is resized to 224×224 pixels and normalized using ImageNet statistics with channel means of [0.485, 0.456, 0.406] and standard deviations of [0.229, 0.224, 0.225]. The network generates a hierarchical feature representation characterized by a progressive increase in semantic complexity and a corresponding decrease in spatial resolution. A description of these levels is provided in Table 3.
The total number of feature maps generated by the neural network at different hierarchy levels is 2048.
The parametric complexity of the model includes 11,182,668 parameters, 100% of which are available for training. The model size is 42.66 MB (FP32 format).
Model training is implemented using a stepwise layer unfreezing strategy.
In the first stage (epochs 1 through 5), only the multi-task heads are trained with a frozen feature extractor. The model interprets the features extracted by the network pretrained on ImageNet in the context of vegetable classification.
In the second stage (starting from epoch 6), the upper layers of the feature extractor (Layer 3 and Layer 4) are partially unfrozen to fine-tune the high-level features to suit the task. Meanwhile, the lower layers (Layer1 and Layer2) remain frozen, preserving the generalized features obtained during pretraining. The loss function sums the cross-entropy losses for each task. Optimization is performed using the AdamW algorithm (initial learning rate of 10-3) and the ReduceLROnPlateau scheduler, which halves the training rate when the quality metric plateaus during the validation set.
Training of the neural network model involves data augmentation methods are used, specifically, random horizontal flipping, random rotation within ±15°, and changes in brightness, contrast, saturation, and hue.
The performance of machine learning models can be assessed using confusion matrices; fragments of these matrices are shown in Figure 8.
The variety classification model (Figure 8a) demonstrates high accuracy (values on the main diagonal). The overall accuracy is 99.5%. Only a few instances of misclassification are noticeable: 98.45% for the "Bell Pepper" class and 97.62% for "Tomato Cherry Red." This means that the model is conservative in identifying the varieties "Chile Pepper", "Cucumber Medium", "New Mexico Green Chile", "Potato Pink", "Potato Yellow", and "Tomato Bull Heart", and tends to predict "Bell Pepper" more often in situations of uncertainty.
Similar results are observed for the ripeness error matrix, means, the majority of values are concentrated on the diagonal, with rare errors occurring only between adjacent classes. All indicators exceed 98%, demonstrating the robustness of the ripeness classifier. The model is balanced, for it identifies target objects with equal efficiency and prevents them from being falsely confused with other classes.
Errors are deemed to be natural occurrence in all types of classification. Boundaries between ripeness stages and crop varieties can be unclear. From the perspective of using the results in digital system services, this accuracy is acceptable.
The model was trained over 25 epochs, the results of which are shown in Figure 9.
Graph 9a shows the change in the loss function. On the training set, by approximately the 7th epoch, the model had established general patterns, resulting in the number of errors decreasing to virtually zero. Meanwhile, losses on the validation data were initially low and gradually decreased to nearly zero. There are no signs of overfitting, as the training and validation curves converge near zero and subsequently stabilize at this point.
Graph 9b shows an increase in accuracy when solving the variety and ripeness classification problems. The training and validation curves for variety classification quickly plateau at 1.0 by approximately the 10th epoch, confirming the calculations from the confusion matrix (Figure 8a). When solving the ripeness determination problem, the curve on the training data reaches 100%, unlike the curve on the validation set. The latter has "noise" and stabilizes slightly below the other curves, which is explained by the presence of isolated errors in the corresponding matrix (Figure 8b). High accuracy achieved over 10-12 epochs indicates successful training. Convergence between the validation and training curves indicates that the neural network will perform equally well on new, unfamiliar data.
4.3. Verification of Results Based on a User Case
A comprehensive assessment of the functionality, architectural solutions, and user interfaces of the developed digital system was conducted using case modeling. This approach makes it possible to trace the logic of interaction between users of various functions and the software environment. Case fragments implementing basic functionality for the "Buyer" and "Farmer" functions are presented below.
When a user with the "Buyer" function logs into the system, the front page opens with a list of farms available for ordering (Figure 10). If geolocation access is granted, the basic ranking criterion for farms is how distant they are from the user. Search is performed using a search bar (across all farm card attributes) and dynamic filters: distance radius (in km), farm rating, and sold product categories. If geolocation access is unavailable, the list is formed into clusters based on farm ratings (from top to bottom). The user retains access to filtering tools and a search bar within each cluster.
An alternative way to find a farm is to search by the type of agricultural product it yields. In the digital system, this functionality is implemented through the integration of filters, a search bar, and a crop image recognition tool. The user can upload a photograph or an external image of a crop to find the most suitable producer for the corresponding product. Figure 11 shows a software implementation model for this scenario.
The buyer may use this functionality not only to search and order products, but also for the following purposes:
- Verification of delivered orders to confirm that the delivered goods match the declared ones;
- Identification of agricultural products during retail purchases;
- Creation of an individual diet and selection of appropriate products.
These features are available to the user both in the mobile app and in the mobile browser. The process involves uploading an image of an agricultural crop (Input Stream), which is sent to the ML MODEL LAYER (Stream 1) for recognition. Based on the result (Stream 2), reference information on the product is imported from the external Crop Production System API service: Stream 3 is the data request, and Stream 4 includes a description of the variety, calorie content, nutrient content, growing season, and other information. Based on the information received, the user can activate the recommender system to find farmers selling similar products and create a customized diet.
To enter product information into the system, users with the "Farmer" function shall create a profile for their farm. This is accomplished by importing a cadastral map showing land parcels or a location corresponding to the legal address. To ensure accurate logistics calculations, the location of the warehouse from which delivery to the end consumer will be made should be specified. Moreover, for each allocated plot, the option to select products produced immediately within the area is provided. Figure 12 shows the farmer's personal account interface, which allows for the creation of these profiles.
The next step is to define a list of products grown or stored in the warehouse for each site. With the ready digital profile, an interactive map is created visualizing the level of agricultural production by region, and the site clustering is updated accordingly.
Product data can be entered in several modes:
- manual;
- automated.
When entering data manually, the farmer must fill out a form in the mobile app or mobile version of the website. In automated mode, some fields are populated with data obtained by analyzing crop images using a neural network. To do this, the farmer must upload an image of the seed packaging or the fruit at various stages of growth. After determining the variety, ripeness, and estimated growing season, the farmer determines the marketing method. This is necessary to ensure the correct operation of the recommender system, as products can be sold through advanced order, auction, or immediate availability at a negotiated price. Figure 13 shows a model of how a farmer interacts with the product card generation system.
When implementing the a product card case based on photofixation, two Input Streams are generated: the actual vegetable image and data added by the farmer after verifying the performance of the services associated with the recognition function (Product Service, Neural Model, and Crop Procurement API). Stream A transmits the image to determine the variety and ripeness level (Stream B), which is compared with reference information about the vegetable (growing season, caloric value, nutrient content, storage conditions, etc.). The generated Stream C (transformed into Output Stream 1) is sent to the farmer to agree on product characteristics, which include timing, volume, methods, and cost of sale (Input Stream 2).
The obtained information (Stream D) is transmitted to the food security forecasting service. The analysis results (acceptable sales volume and recommended cost) are sent to the Product Service as Stream E to prepare the data imported into related services. They ensure clustering data updates, releasing recommendation, storage of current product cards, and data archiving for reporting (stream G). Similar information is transmitted to the farmer: stream G is transformed for display in the application interface – Output Stream 2. Any adjustments by the farmer trigger stream F, which is sent to the Product Service to update the data associated with stream G.
In automatic mode, the system can update product ripeness information based on standard growing seasons, allowing for optimized recommendations for buyers. Furthermore, the farmer can vary the methods of product distribution:
Retail or wholesale sales: by advanced order (the buyer reserving a specific volume of produce at any stage from the beginning of the growing season to harvest) or based on the availability of a specific volume of produce at a piece price;
Auction, which allows products to be offered for competitive wholesale distribution (Figure 14).
The recommender system, depending on the volume of products sold and market conditions, offers the farmer the most effective sales strategies:
- Wholesale of the entire product volume through auctions or direct transactions with the customer;
- Dividing the product into batches for subsequent sale through a advanced order system or upon availability.
5. Discussion
The results of the study are consistent with the principles of digital transformation in the agricultural sector. They can be considered from both conceptual and technical perspectives.
The developed digital system model enables the transition from reactive to predictive food security management. Development strategies for such a system directly depend on the availability of valid and reproducible methodological tools for assessment and forecasting. These tools should be based on the integration of diverse data from various sources, take into account territorial specifics, and enable early risk communication [5,7,14].
The developed model ensures a balance between the economic efficiency of the agrifood complex, social accessibility, the nutritional adequacy of products for the population, and environmental balance. The model is based on the one-to-one principle (from producer to consumer), ensuring direct farmer-buyer interaction. This addresses one of the major issues of small agribusinesses, specifically, the dependence on speculative intermediaries and market monopolization by large retailers. Removing unnecessary links from the pricing chain increases farmers' economic resilience and makes finished products more accessible and diverse. In essence, a transformation of market relations occurs along the social development vector. This conclusion is supported by studies aimed at identifying negative social trends in food accessibility in specific areas or for certain population groups [19,40].
The use of clustering algorithms based on entropy analysis enables automatic segmentation of producers and consumers, helping to determine the actual balance of supply and demand. This enables government agencies to quickly identify surplus products and redirect them from surplus to deficit regions, as well as organize exports or imports, stabilizing prices and the market for products. Farmers thus gain a tool for planning and adjusting their cropping structure based on actual market conditions: the volume of advanced orders and production levels in their own and neighboring regions. Buyers, meanwhile, can manage their food consumption levels over the long term. This approach creates a unified system for monitoring food security at various levels. This also addresses the fundamental problem noted in domestic studies regarding the dominance of models based solely on comparative analysis of regional production and self-sufficiency indicators with national averages [51,55,59].
It should be noted that the results of this study create new challenges in ensuring food security. It can be assumed that the use of a digital system will increase market volatility, create new forms of inequality in access to resources and information, and transform consumer behavior. The listed risks are found in the conclusions of studies on the digital transformation of the economy [38,58,67]. However, there is also observed an emerging opportunity to collect and analyze data in real time, optimize supply chains, personalize food and other types of assistance (for both consumers and farmers), and provide early warning of crisis situations [38,54,65]. This is achieved through the use of simulation models that reproduce the internal logic of various processes to identify cause-and-effect relationships and test management strategies [27,37,68,69]. The paper presents an architecture for a digital system that involves collecting and processing data for services that perform the listed functions. Moreover, the services are based on microeconomic indicators, taking into account changes in macroeconomic indicators.
Economic research argues that a comprehensive approach to assessing food security is multidimensional, and the integration of its aspects has a synergistic effect [7,15]. A systemic analysis of both groups of indicators reveals structural imbalances: for example, high rates of agricultural production at the macro level may be attended by a decline in the quality of the population's diet at the micro level. Timely identification of the dynamics of such indicators will help determine the causes of the situation, whether it is inefficient income distribution, low consumer demand, or else. The digital system's services do not predict changes in macroeconomic indicators, but they do allow for the acquisition of microeconomic data in real time and their export to the external environment for analysis by other systems.
The use of microeconomic indicators in the developed system focuses attention on specific farmers, households, and consumers, reflecting the physical and economic availability of food. Researchers note that consumption patterns may deteriorate even with favorable macroeconomic indicators [12,70]. For example, the population may be consuming food depleted in vitamins and protein, while the corresponding products remain in warehouse, unclaimed. Using predictive models in the services of the developed digital system allows for the analysis of current indicators and forecasting how the composition and quality of the consumer basket is about to change.
From a technical perspective, the developed software meets the requirements of digital transformation and represents a tool for supporting existing processes, but also by all means a digital platform that fosters a new economic model. The system's architecture integrates key Industry 4.0 technologies:
- A neural network to support product quality decision-making and perform some routine document management tasks;
- Predictive analytics and big data to generate statistics on microeconomic indicators and forecast changes in food balances;
- Cloud services providing system flexibility and scalability, as well as technology integration at the interstate level;
- Mathematical models for automatic clustering and ratings, enabling recommendations based on real-time data rather than retrospective statistics;
- A unified digital ecosystem creating a seamless environment for diverse stakeholders in food security processes and an absolute "product footprint";
- Customization and client centricity principles for creating personalized offers for products of a specific quality and origin.
Software solutions, already existing on the market can be divided into government monitoring systems, marketplaces, and analytical models [51]. They perform local tasks related to enterprise management or individual processes (production, technical), sales, logistics, government oversight, etc. Most existing platforms are geared toward large farms due to the complexity of implementation and long payback periods. The developed system enables the creation of a unified digital ecosystem for food sustainability for all participants in the domestic and foreign agricultural product market.
The choice of architectural solution ensures stable system operation with indicators corresponding to the stated problem. Research by domestic and international scientists notes that dividing the architecture into layers with abstraction of communication channels allows for modification the internal logic of the service without transforming other components [11,35,57,63]. This ensures semantic compatibility across different layers, guarantees transaction integrity, and ensures fault tolerance during peak loads or temporary unavailability of individual services. Furthermore, the architectural model is scalable, allowing for the integration of new functional modules without compromising the structural integrity of the entire system.
Despite this, the work is exposed to technical, economic, and social limitations.
Some regions of the world face infrastructure shortages, including uneven access to high-speed internet and the availability of modern mobile devices. This complicates the full implementation of the system and the adequate assessment of the results of the transformation of food security processes. Long-term system performance testing was not conducted under macroeconomic shocks, such as abrupt changes in customs duties or global disasters (either climatic or technological). These are all unpredictable factors that can impact the operation of individual service algorithms (e.g., clustering or recommender systems). For countries outside economic unions, problems may arise due to the lack of harmonization of trade legislation. This factor poses risks to determining the final price of products, accounting for their volume, concluding transactions, and forecasting.
The main societal problem may be the conservatism of small farmers, who distrust software that makes autonomous decisions, as well as their personal connections to local resellers for selling their yield. Accordingly, further research is needed to estimate what happens when the most vulnerable participants go underground from the digital market since they unable to ensure the required quality of digital interaction.
6. Conclusions
The creation of an international digital system for interaction between agricultural producers and end consumers is part of AgTech 4.0. Advances in technology have not only enabled the transition to "smart" production but also influenced the attendant processes of the agricultural sphere. The pace of globalization has made food more accessible, but it has also created uncertainty in ensuring food security for each country in particular. Food production has increased globally, but its distribution is uneven, making it exposed to the slightest market fluctuations. In fact, food security depends not only on the volume of available agricultural products but also on the stability of government ties with the rest of the world. At the same time, domestic agriculture becomes hostage to global prices, and small farmers are unable to compete with cheap imports.
The developed digital system presents a tool for optimizing transaction costs, minimizing the number of intermediaries in the food supply chain and ensuring direct market connections between supply and demand. Integrating big data on farm performance enables a high level of pricing transparency, protecting the interests of small and medium-sized agribusinesses in matters of fair market value. Furthermore, economic entities gain a means for planning their operations based on current demand and forecast microeconomic indicators.
Digital coordination on an interstate scale allows for the consideration of macroeconomic indicators to effectively address planning, logistics, and pricing issues. This contributes to product lifecycle traceability, enables resource redistribution, minimizes logistical losses (which is critical for perishable products), and monitors phytosanitary standards. This ensures product quality and increases consumer confidence (including for imported goods).
The developed digital system fosters interstate ties in agricultural marketing, beyond the growth of the agro-industrial complex and farms inspiring also institutional resilience in international trade relations amid volatile global markets.
Supplementary Materials
The following supporting information can be downloaded at: Preprints.org, Appendix A: Data Model.
Author Contributions
Conceptualization, M.L. and V.F.; methodology, M.L. and V.F.; software, V.F.; validation, M.L. and V.F.; formal analysis, M.L.; resources, V.F.; data curation, V.F.; writing—original draft preparation, M.L. and V.F.; writing—review and editing, M.L.; visualization, M.L.; supervision, M.L.; project administration, M.L. All authors have read and agreed to the published version of the manuscript.
Funding
This research received no external funding.
Data Availability Statement
Commercial restrictions apply to the provision of full access to the source code and test data. Data not subject to such restrictions are available in an open repository at the following link: https://github.com/SymplysoF/Marplatf. Use of these materials in research and publications requires mandatory attribution and a citation of the original source. Any additional information is available from the author upon request.
Conflicts of Interest
The authors declare no conflicts of interest. The funders had no role in the design of the study; in the collection, analyses, or interpretation of data; in the writing of the manuscript; or in the decision to publish the results.
Institutional Review Board Statement
The study did not use personal data. The work was carried out without experimental studies of plants (cultivated and wild) and collection of plant material, without the participation of animals and animal materials. Ethical review and approval was not required for the study on human participants in accordance with the local legislation and institutional requirements.
Abbreviations
The following abbreviations are used in this manuscript:
| AgTech | Agricultural Technology |
| IoT | Internet of Things |
| HDDS | Household Dietary Diversity Score |
| HHS | Household Hunger Scale |
| CSI | Coping Strategies Index |
| PEM | Policy Evaluation Model |
| EPACIS | Econometric Partial Aquilibrium Computational Information System |
| SMS | Short Message Service |
| rad | Radian |
| km | Kilometer |
| API | Application Programming Interface |
| ML model layer | Machine Learning model layer |
| RAM | Random Access Memory |
| GB | Gigabyte |
| GHz | Gigahertz |
| AMD | Advanced Micro Devices |
| Full HD | Full High Definition |
| LTE | Long-Term Evolution |
| GPS | Global Positioning System |
| GLONASS | Global Navigation Satellite System |
| Mbps | Megabits per second |
| MB | Megabyte |
| iOS | iPhone Operating System |
| MacOS | Macintosh Operating System |
| HTML5 | HyperText Markup Language 5 |
| Portable Document Format | |
| CryptoPro EDS | CryptoPro Electronic Digital Signature |
| DDR4 | Double Data Rate 4 |
| NVMe SSDs | Non-Volatile Memory Express Solid-State Drives |
| RAID | Redundant Array of Independent Disks |
| VRAM | Video Random Access Memory |
| CUDA | Compute Unified Device Architecture |
| T4 | Tesla T4 |
| GbE SFP+ | Gigabit Ethernet Small Form-factor Pluggable Plus |
| LTS | Long-Term Support |
| RHEL 9 | Red Hat Enterprise Linux 9 |
| PostgreSQL | Post-Ingres Structured Query Language |
| W | Watt |
| FP32 | 32-bit Floating Point |
Appendix A
Appendix A.1. Data Model
References
- Melnikov, A.B.; Мikhaylushkin, P.V.; Yu, Kotok N. Assessment of the level of food security in the world. Mezhdunarodnyi Sel'skokhozyaistvennyi Zhurnal 2021, 1(379), 4–6. [Google Scholar] [CrossRef]
- Drynochkin, A. Some aspects of food security in the countries of Central and South-Eastern Europe. Contemp. Eur. 2023, 1(115), 88–99. [Google Scholar] [CrossRef]
- Stolyarova, A.N.; Shamray-kurbanova, L.V.; Darelina, O.V.; Chumakova, E.A. Food security as an element of state's national security. Food Policy Secur. 2023, 10(2), 219–236. [Google Scholar] [CrossRef]
- Lu, Y.; Zhang, Y.; Hong, Y.; He, L.; Chen, Y. Experiences and lessons from Agri-Food system transformation for sustainable food security: A review of China’s practices. Foods 2022, 11(2), 137. [Google Scholar] [CrossRef] [PubMed]
- Kamalian, A.K. Food security in the Eurasian economic union: Problems and solutions. Econ. Agric. Russ. 2022, 4, 12–20. [Google Scholar] [CrossRef]
- Tsvetkov, V.A.; Anishchenko, A.N. Food security is a global problem amid geopolitical tensions. Econ. Agric. Russ. 2023, 11, 2–5. [Google Scholar] [CrossRef]
- Oluwole, O.; Ibidapo, O.; Arowosola, T.; Raji, F.; Zandonadi, R.P.; Alasqah, I.; et al. Sustainable transformation agenda for enhanced global food and nutrition security: a narrative review. Front. Nutr. 2023, 10, 1226538. [Google Scholar] [CrossRef] [PubMed]
- Nekmahmud, M. Food consumption behavior, food supply chain disruption, and food security crisis during the COVID-19: The mediating effect of food price and food stress. J. Foodserv. Bus. Res. 2024, 27(3), 227–253. [Google Scholar] [CrossRef]
- Abdullahi, A.M.; Kalengyo, R.B.; Warsame, A.A. The unmet demand of food security in East Africa: review of the triple challenges of climate change, economic crises, and conflicts. Discov. Sustain. 2024, 5(1), 244. [Google Scholar] [CrossRef]
- Mumah, E.; Hong, Y.; Chen, Y. Exploring the reality of global food insecurity and policy gaps. Humanit. Soc. Sci. Commun. 2025, 12(1), 1–23. [Google Scholar] [CrossRef]
- Karpov, A.; Dorofeev, O.; Smirnova, Yu.; Kulibaba, I.; Beresneva, Ya. Hardware and software system for adaptive precision agriculture management within the consolidation of modern agrotechnologies in the crop production sector of the Kyrgyz Republic. Front. Comput. Sci. 2026, 8, 1763420. [Google Scholar] [CrossRef]
- Varzakas, T.; Smaoui, S. Global food security and sustainability issues: the road to 2030 from nutrition and sustainable healthy diets to food systems change. Foods 2024, 13(2), 306. [Google Scholar] [CrossRef] [PubMed]
- Krykavskyy, Y.; Shandrivska, O.; Pawłyszyn, I. A study of macroeconomic and geopolitical influences and security risks in supply chains in times of disruptions. LogForum 2023, 19(3), 423–441. [Google Scholar] [CrossRef]
- Campomanes, F.; Marshall, M.; Nelson, A. A method for estimating physical and economic food access at high spatial resolution. Food Secur. 2024, 16, 47–64. [Google Scholar] [CrossRef]
- Adukov, R.Kh. Functions of the state in the development of small businesses and contracting in the agricultural sector. Econ. Labor Manag. Agric. 2025, 12(131), 140–150. [Google Scholar] [CrossRef]
- Rodnina, N.V. On the role of farming in food security. AIC Econ. Manag. 2022, 8, 3–10. [Google Scholar] [CrossRef]
- Rudnicki, R.; Biczkowski, M.; Wiśniewski, Ł.; Wiśniewski, P.; Bielski, S.; Marks-Bielska, R. Towards green agriculture and sustainable development: Pro-environmental activity of farms under the common agricultural policy. Energies 2023, 16(4), 1770. [Google Scholar] [CrossRef]
- Khachatryan, A.; Sakhbieva, A.; Kirpicheva, M.; Dolgova, M.; Chernov, S. Consumer Demand for Environmental Friendliness as a New Round of Modern Marketing Development. Pol. J. Environ. Stud. 2023, 32(5), 4095–4111. [Google Scholar] [CrossRef]
- Snimshchikova, I.V. The trend of consumer demand in the current economic realities of Russia. Work. Kuban. State Agrar. Univ. 2022, 100, 70–73. [Google Scholar] [CrossRef]
- Garg, D.; Alam, M. Smart agriculture: A literature review. J. Manag. Anal. 2023, 10(2), 359–415. [Google Scholar] [CrossRef]
- Champia, M.N. Agricultural Startups: Innovation, Challenges, and Future Prospects. Int. J. Sci. Res. Technol. 2025, 2(3), 175–176. [Google Scholar] [CrossRef]
- Kurepina, N.L.; Pavlova, N.T.S.; Sarunova, M.P.; Krasnokutskii, N.A. Providing the population with quality food - strategic food security rural areas: Risk assessment, development models. AIC Econ. Manag. 2024, 12, 3–11. [Google Scholar] [CrossRef]
- Korolkova, A.P.; Shatilov, M.V. Analysis of the state of production and consumption of vegetables in the Russian Federation. Mach. Equip. Rural Area 2021, 6(288), 40–50. [Google Scholar] [CrossRef]
- Evdokimova, O.; Evdokimov, N.; Goncharova, I.; Butenko, I.; Pyanikova, E.; Kovaleva, A. Actual problems of production of functional and specialized food products in the food industry. E3S WoC 2024, 486, 02005. [Google Scholar] [CrossRef]
- Mityashin, G.Yu. Food security: forms and institutions of ensuring. Theor. Econ. 2023, 3(99), 104–116. [Google Scholar] [CrossRef]
- Bondarenko, L.V.; Iakovleva, O.A.; Simanovskii, N.A. Food consumption in Russia: Regulatory approach to regulation. AIC Econ. Manag. 2021, 12, 13–27. [Google Scholar] [CrossRef]
- Krasnikov, A.; Nikishina, I.; Mudrakova, O.; Krasilnikov, I. Simulation modelling of traffic flow of the east-west latitudinal corridor for socio-economic development of the Novosibirsk region. BIO Web Conf. 2024, 83, 05003. [Google Scholar] [CrossRef]
- Avarskii, N.D.; Seregin, S.N.; Khashir, B.O.; Sysoev, G.V. Sustainable production growth in the agricultural sector - a strategic objective for ensuring food security in Russia. Econ. Labor Manag. Agric. 2025, 10–11(128), 3–11. [Google Scholar] [CrossRef]
- Altukhov, A.I. Priority development of agriculture - the basis for ensuring food security of Russia. Vestn. Ross. Akad. Nauk 2025, 6, 9–19. [Google Scholar] [CrossRef]
- Migunov, R.A.; Syutkina, A.A. Research of challenges of the agro-industrial complex as the basis of strategic goal-setting of the development of the agricultural sector. Izv. Timiryazev Agric. Acad. 2022, 4, 135–145. [Google Scholar] [CrossRef]
- Osenniy, V.V.; Shevkunenko, M.Yu. State mechanisms to support import-substituted and export-oriented production in the agro-industrial complex of the Russian Federation. Work. Kuban. State Agrar. Univ. 2024, 112, 70–74. [Google Scholar] [CrossRef]
- Ushachev, I.; Serkov, A.; Chekalin, V.; Kharina, M. Long-term agrarian policy of Russia: Challenges and strategic priorities. AIC Econ. Manag. 2021, 1, 3–17. [Google Scholar] [CrossRef]
- Sandu, I.S.; Nechaev, V.I.; Ryzhenkova, N.E. On the development of a new strategy for innovative development of the agro-industrial complex: Prerequisites and priorities. Econ. Agric. Russ. 2022, 8, 2–12. [Google Scholar] [CrossRef]
- Kushwah, N.; Billore, V.; Sharma, O.P.; Singh, D.; Chauhan, A.P.S. Integrated Nutrient management for optimal plant health and crop yield. Plant Sci. Arch. 2024, 8(3), 10–12. [Google Scholar] [CrossRef]
- Liu, R.; Sun, Y.; Li, M.; Zhang, M.; Zhang, Z.; Li, H.; Yang, W. Development and application experiments of a grain yield monitoring system. Comput. Electron. Agric. 2022, 195, 106851. [Google Scholar] [CrossRef]
- Krasnikova, I.; Mudrakova, O. Simulation modeling of transport and socioeconomic development of megapolis districts (on the example of Moscow city). E3S WoC 2024, 515, 02024. [Google Scholar] [CrossRef]
- Simonov, V.; Karpov, A. Process modeling of unmanned aerial vehicles using intelligent systems in forestry. BIO Web Conf. 2024, 145, 04023. [Google Scholar] [CrossRef]
- Simonović, Z.; Ilić, B. Complex business system management in an agro-industrial complex. In IV International Scientific Conference “Sustainable Agriculture And Rural Development”; Institute of Agricultural Economics: Belgrade, Serbia, 2024; pp. 265–274. [Google Scholar]
- Avarskii, N.D.; Kolesnikov, A.V.; Seregin, S.N. The quality as a factor in ensuring the safety of food products. Econ. Labor Manag. Agric. 2025, 4(122), 4–13. [Google Scholar] [CrossRef]
- Lisitsyn, A.B.; Chernukha, I.M.; Lunina, O.I. From food security to food safety and quality. Food Ind. 2021, 2, 8–14. [Google Scholar] [CrossRef]
- De Queiroz, F.L.N.; Raposo, A.; Han, H.; Nader, M.; Ariza-Montes, A.; Zandonadi, R.P. Eating competence, food consumption and health outcomes: An overview. Int. J. Environ. Res. Public Health 2022, 19(8), 4484. [Google Scholar] [CrossRef]
- Odoms-Young, A.; Brown, A.G.; Agurs-Collins, T.; Glanz, K. Food insecurity, neighborhood food environment, and health disparities: state of the science, research gaps and opportunities. Am. J. Clin. Nutr. 2024, 119(3), 850–861. [Google Scholar] [CrossRef]
- Silva, P.; Araújo, R.; Lopes, F.; Ray, S. Nutrition and food literacy: framing the challenges to health communication. Nutrients 2023, 15(22), 4708. [Google Scholar] [CrossRef]
- Moreno, L.A.; Meyer, R.; Donovan, S.M.; Goulet, O.; Haines, J.; Kok, F.J.; et al. Perspective: striking a balance between planetary and human health‒is there a path forward? Adv. Nutr. 2022, 13(2), 355–375. [Google Scholar] [CrossRef]
- Biesbroek, S.; Kok, F.J.; Tufford, A.R.; Bloem, M.W.; Darmon, N.; Drewnowski, A.; et al. Toward healthy and sustainable diets for the 21st century: importance of sociocultural and economic considerations. Proc. Natl. Acad. Sci. 2023, 120(26), e2219272120. [Google Scholar] [CrossRef] [PubMed]
- Dahiya, A.; Duggal, S.; Kumar, N. Religious and cultural perspectives on food selection. In Food Chemistry, Function and Analysis Functional Foods of the Future; Gupta, V.K., Sharma, M., Gaur, S., Kuhad, R.C., Eds.; Royal Society of Chmistry: London, UK, 2025; pp. 277–292. [Google Scholar] [CrossRef]
- Ovsiannykov, Y. The impact of religious food standards on the formation of a quality control system in the food industry. Three Seas. Econ. J. 2025, 6(4), 51–56. [Google Scholar] [CrossRef]
- Turgunova, G.; Djumaeva, M.; Aitbaeva, A. Preserving health through traditions: How folk customs form a healthy lifestyle. BIO WoC 2024, 120, 01059. [Google Scholar] [CrossRef]
- Tegegne, G.E.; Berlie, A.B.; Mengistie, D.; Yigzaw, A. Determinants of food security indicators in Bahir Dar City, Ethiopia: a focus on female-headed households. Discov. Sustain. 2025, 6(1), 48. [Google Scholar] [CrossRef]
- Fadol, A.A.; Tong, G.; Akram, M.W.; Andleeb, S.; Akram, N.; Rehman, K.U. The role of coping strategies in food consumption assessment: evidence from Sudan using FCS and HDDS. Cogent Food Agric. 2025, 11(1), 2514291. [Google Scholar] [CrossRef]
- Kato, K.Y.M.; Delgado, N.G.; Romano, J.O. Territorial approach and rural development challenges: Governance, state and territorial markets. Sustainability 2022, 14(12), 7105. [Google Scholar] [CrossRef]
- Moch, E. The economic and geopolitical significance of the BRICS nations: A comparative analysis of their global influence in the 21st century. East Afr. J. Bus. Econ. 2024, 7(2), 86–100. [Google Scholar] [CrossRef]
- Pieralli, S.; Chatzopoulos, T.; Elleby, C.; Domínguez, I.P. Documentation of the European Commission's EU Module of the Aglink-Cosimo Model: 2021 Version; Publications Office of the European Union: Luxembourg, 2022. [Google Scholar] [CrossRef]
- Kanojia, M.; Kamani, P.; Kashyap, G.S.; Naz, S.; Wazir, S.; Chauhan, A. Alternative agriculture land-use transformation pathways by partial-equilibrium agricultural sector model: A mathematical approach. Int. J. Inf. Technol. 2025, 17(4), 2533–2552. [Google Scholar] [CrossRef]
- Gulizahra, T. Forecasting Gross Yield in Agriculture Using The Arima Model: The Case of Cereal Crops. Cent. Asian J. Innov. Tour. Manag. Financ. 2026, 7(1), 235–241. [Google Scholar] [CrossRef]
- Zhao, X.; Wise, M.A.; Waldhoff, S.T.; Kyle, G.P.; Huster, J.E.; Ramig, C.W.; et al. The impact of agricultural trade approaches on global economic modeling. Glob. Environ. Change 2022, 73, 102413. [Google Scholar] [CrossRef] [PubMed]
- Hernández Hernández, G.C.; Gómez Gómez, J.; Jiménez-Cabas, J. Predictive models based on artificial intelligence to estimate crop yield: A literature review. Agriculture 2025, 15(23), 2438. [Google Scholar] [CrossRef]
- Suci, E.Ş.; Kalender, M.A. Digital Transformation in Agricultural Structures: Evaluation in Terms of Technological Developments, Practices and Sustainability. Turk. J. Agric.-Food Sci. Technol. 2025, 13(s2), 3708–3717. [Google Scholar] [CrossRef]
- Kasemi, R.; Lammer, L.; Vincze, M. The gap between technology and agriculture, barrier identification and potential solution analysis. IFAC-Pap. 2022, 55(39), 314–318. [Google Scholar] [CrossRef]
- Sarkar, A.; Wang, H.; Rahman, A.; Memon, W.H.; Qian, L. A bibliometric analysis of sustainable agriculture: based on the Web of Science (WOS) platform. Environ. Sci. Pollut. Res. 2022, 29(26), 38928–38949. [Google Scholar] [CrossRef]
- Afzal, A.; Bell, M. 2023 Precision agriculture: Making agriculture sustainable. In Precision Agriculture; Zaman, Q., Ed.; Academic Press: London, UK, 2023; pp. 187–210. [Google Scholar] [CrossRef]
- Panfilov, V.A. Synergistic approach to the design of agroindustrial complex sophisticated technologies. Vestn. Russ. Agric. Sci. 2021, 2, 4–7. [Google Scholar] [CrossRef]
- Zinoviev, A.Yu.; Vinogradov, P.N. Modern technological solutions in the design and construction of agricultural facilities. Mach. Equip. Rural Area 2023, 12(318), 13. [Google Scholar]
- Pak, J.; Kim, J.; Park, Y.; Son, H.I. Field evaluation of path-planning algorithms for autonomous mobile robot in smart farms. IEEE Access 2022, 10, 60253–60266. [Google Scholar] [CrossRef]
- Gackstetter, D.; Von Bloh, M.; Hannus, V.; Meyer, S.T.; Weisser, W.; Luksch, C.; et al. Autonomous field management–an enabler of sustainable future in agriculture. Agric. Syst. 2023, 206, 103607. [Google Scholar] [CrossRef]
- Erokhin, V.I.; Krasnikov, A.S.; Khvostov, M.N. Matrix corrections minimal with respect to the Euclidean norm for linear programming problems. Autom. Remote Control 2012, 73, 219–231. [Google Scholar] [CrossRef]
- Vatutina, L.A.; Grankina, V.L.; Suetin, A.N.; Khomenko, E.B. Big Data Analytics in Stock Exchange Practice. In Management of Digital Technologies in the Innovative Economy. Advances in Science, Technology & Innovation; Popkova, E.G., Ed.; Springer: Cham, Switzerland, 2025; pp. 13–18. [Google Scholar] [CrossRef]
- Kulibaba, I.; Kuchmezov, Kh.; Laamarti, Yu.; Shamshurina, N.; Shamshurin, V. Managing traffic and pedestrian flows at an intersection: simulation model parameters. E3S WoC 2022, 363, 02040. [Google Scholar] [CrossRef]
- Altunina, Yu.; Korotun, O.; Polevshchikov, I. Simulation model of a queuing system in the service of state registration, cadastre and cartography. E3S WoC 2024, 535, 05003. [Google Scholar] [CrossRef]
- Kozlova, S.A.; Ferova, I.S. Regional Food Security in the Era of Digital Transformation: Theoretical and Methodological Analysis of Assessment Approaches. J. Sib. Fed. Univ. Humanit. Soc. Sci. 2025, 18(12), 2478–2489. [Google Scholar]
Figure 1.
Classification of software products used in countries that occupy leading positions in the digital transformation of agriculture
Figure 1.
Classification of software products used in countries that occupy leading positions in the digital transformation of agriculture
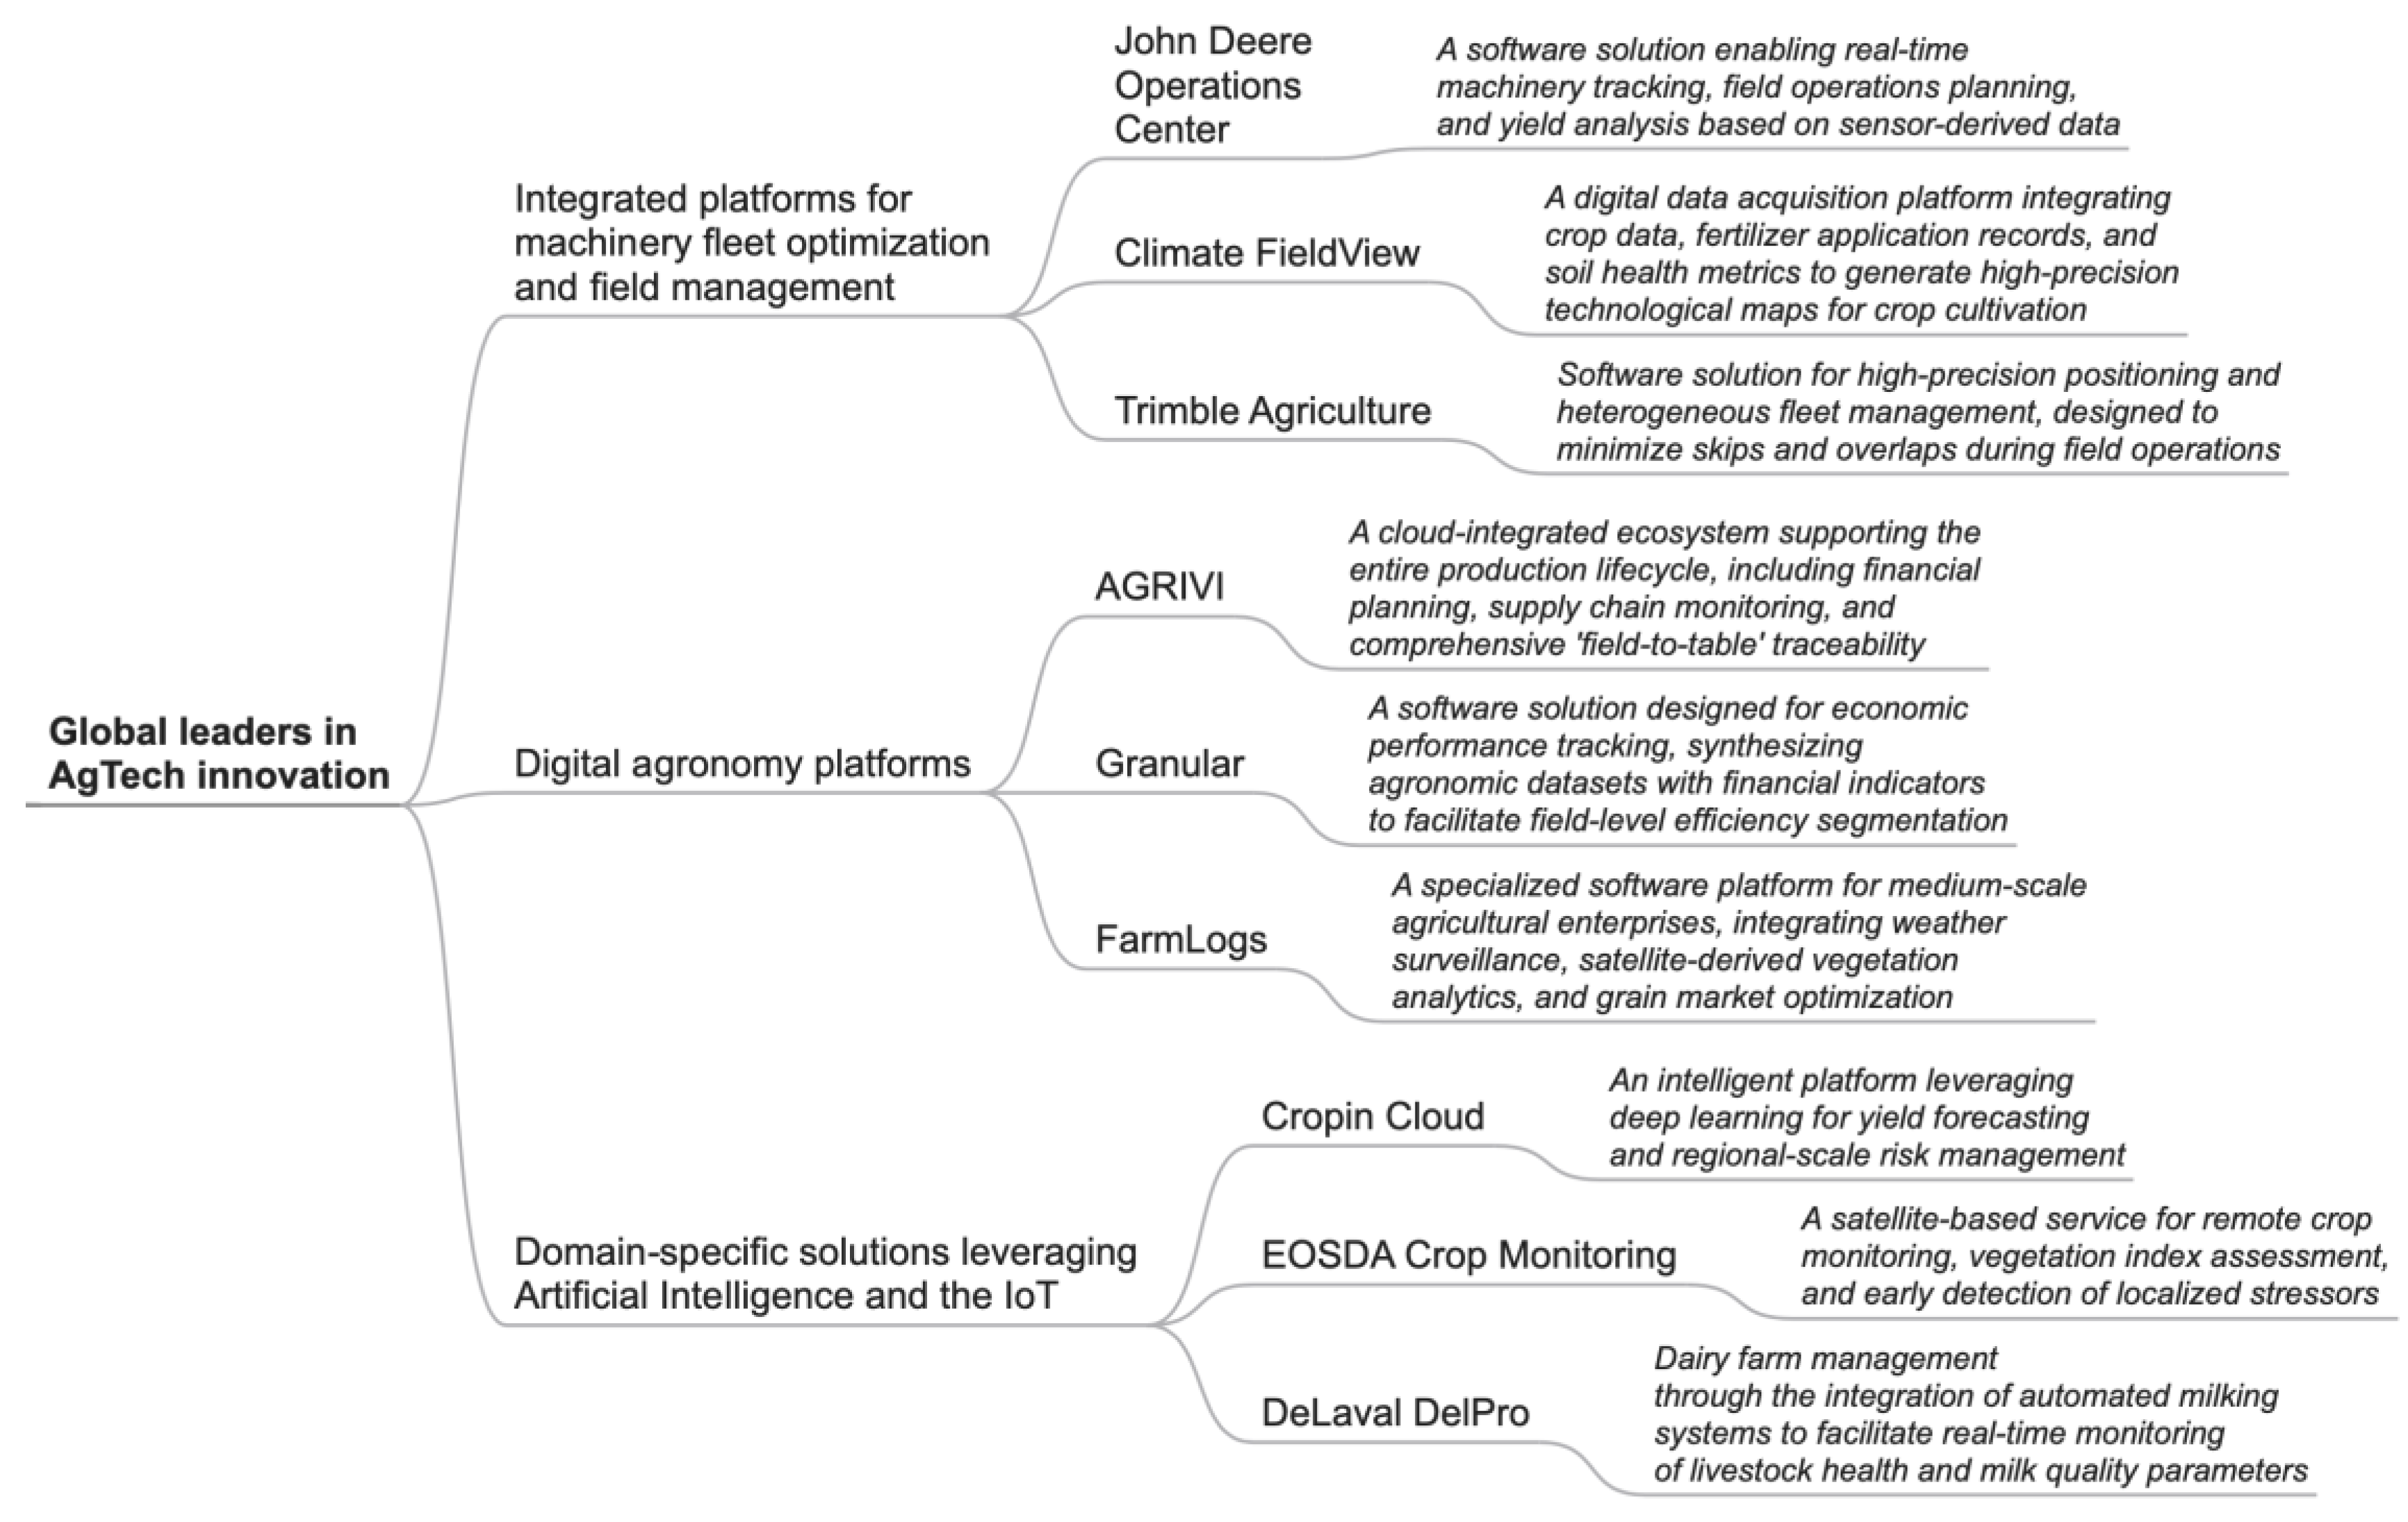
Figure 2.
Classification of software products used in dynamically developing countries in the field of digital transformation of agriculture
Figure 2.
Classification of software products used in dynamically developing countries in the field of digital transformation of agriculture
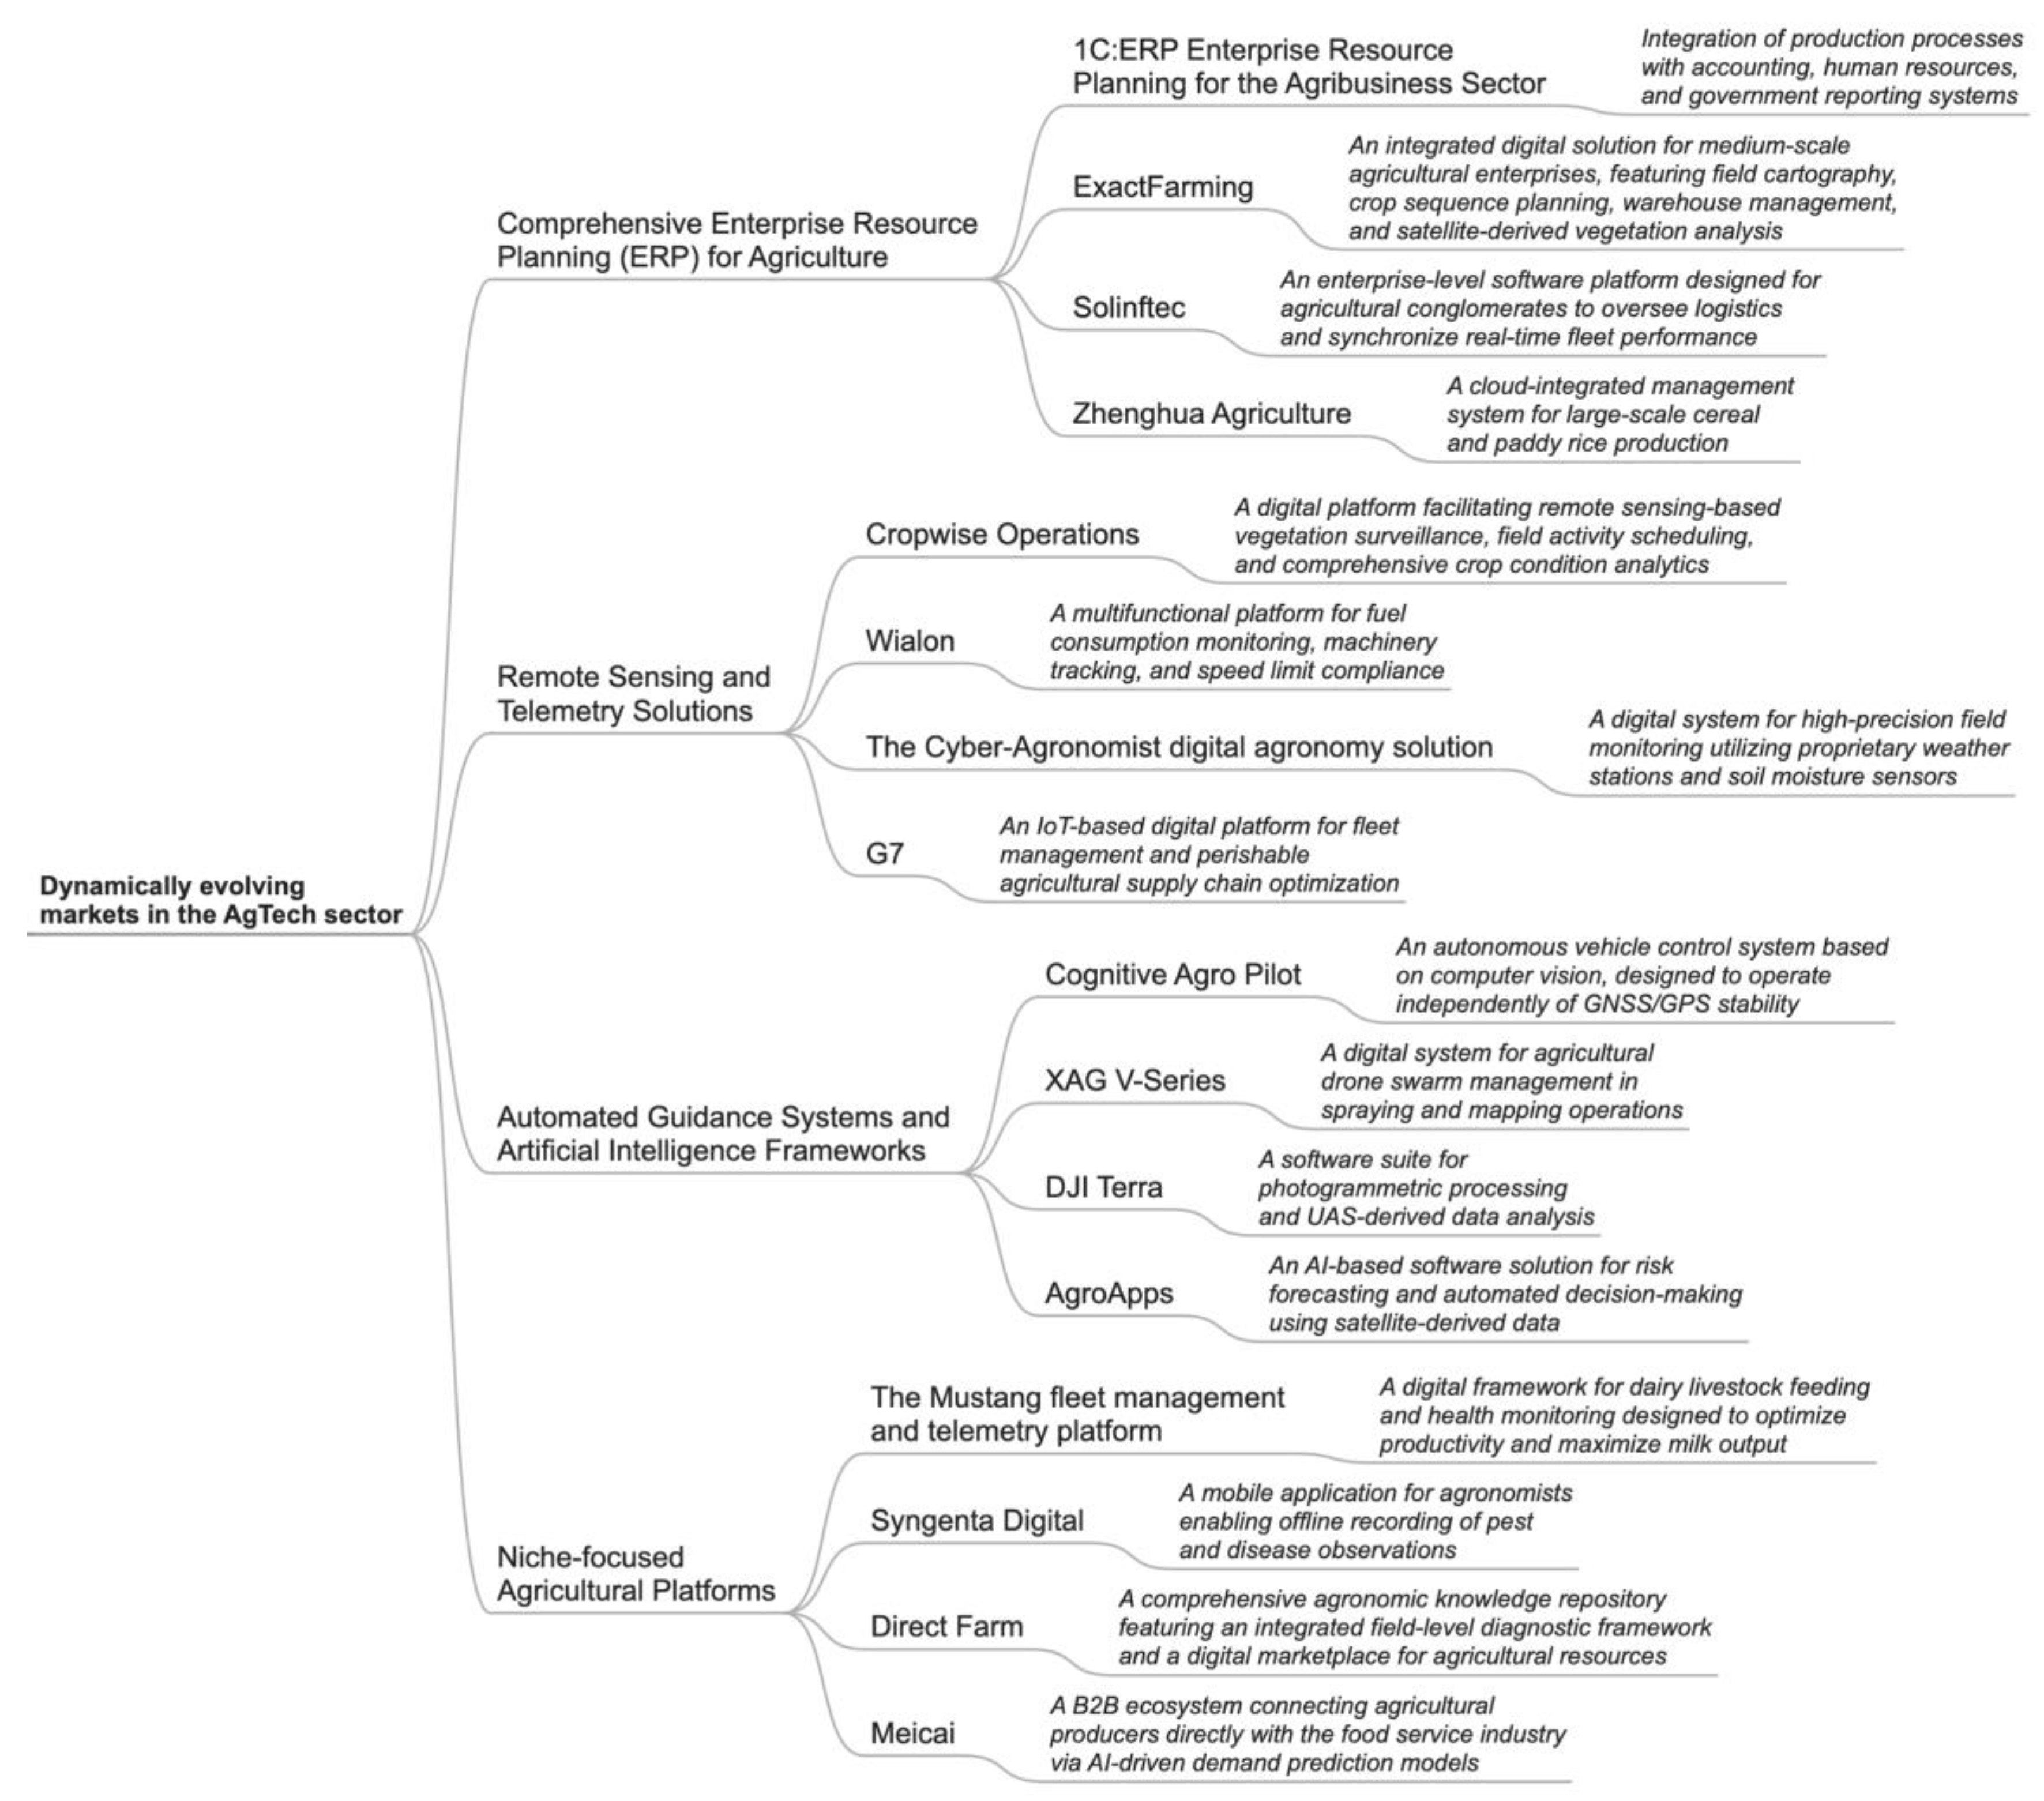
Figure 3.
Classification of software products used in spot development countries in the field of digital transformation of agriculture
Figure 3.
Classification of software products used in spot development countries in the field of digital transformation of agriculture
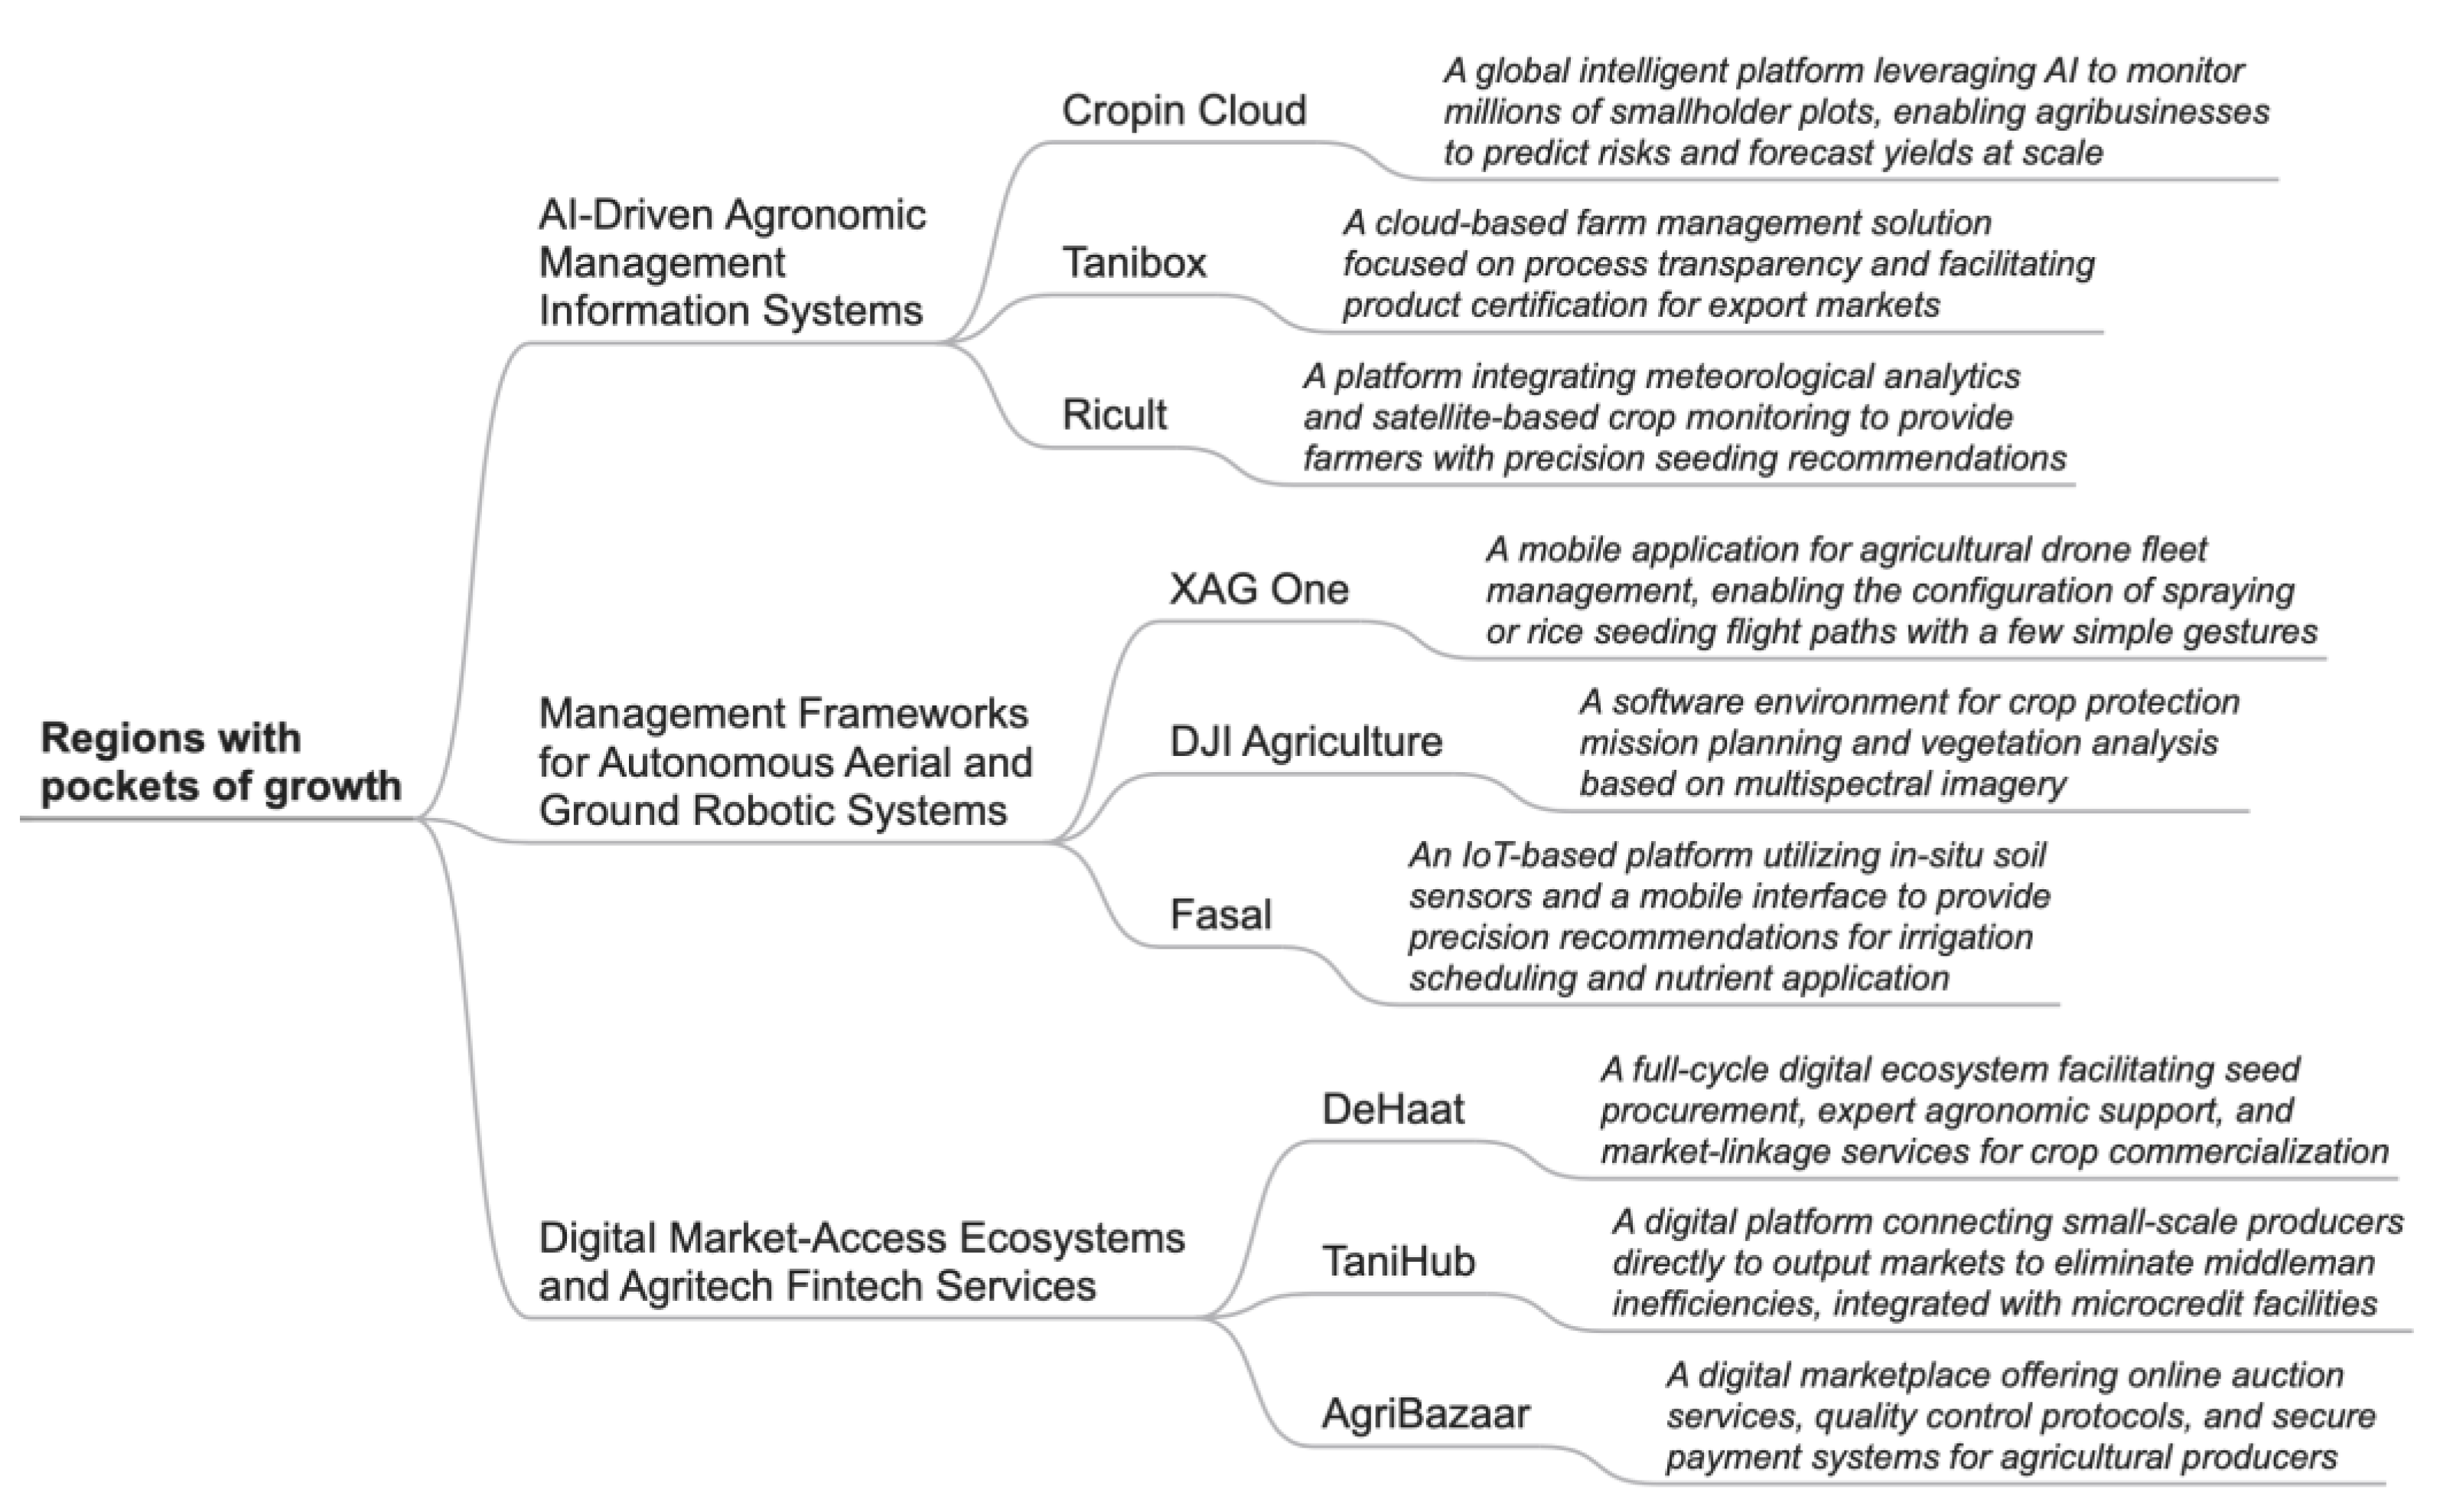
Figure 4.
Classification of software products used in lagging countries in the field of digital transformation of agriculture
Figure 4.
Classification of software products used in lagging countries in the field of digital transformation of agriculture
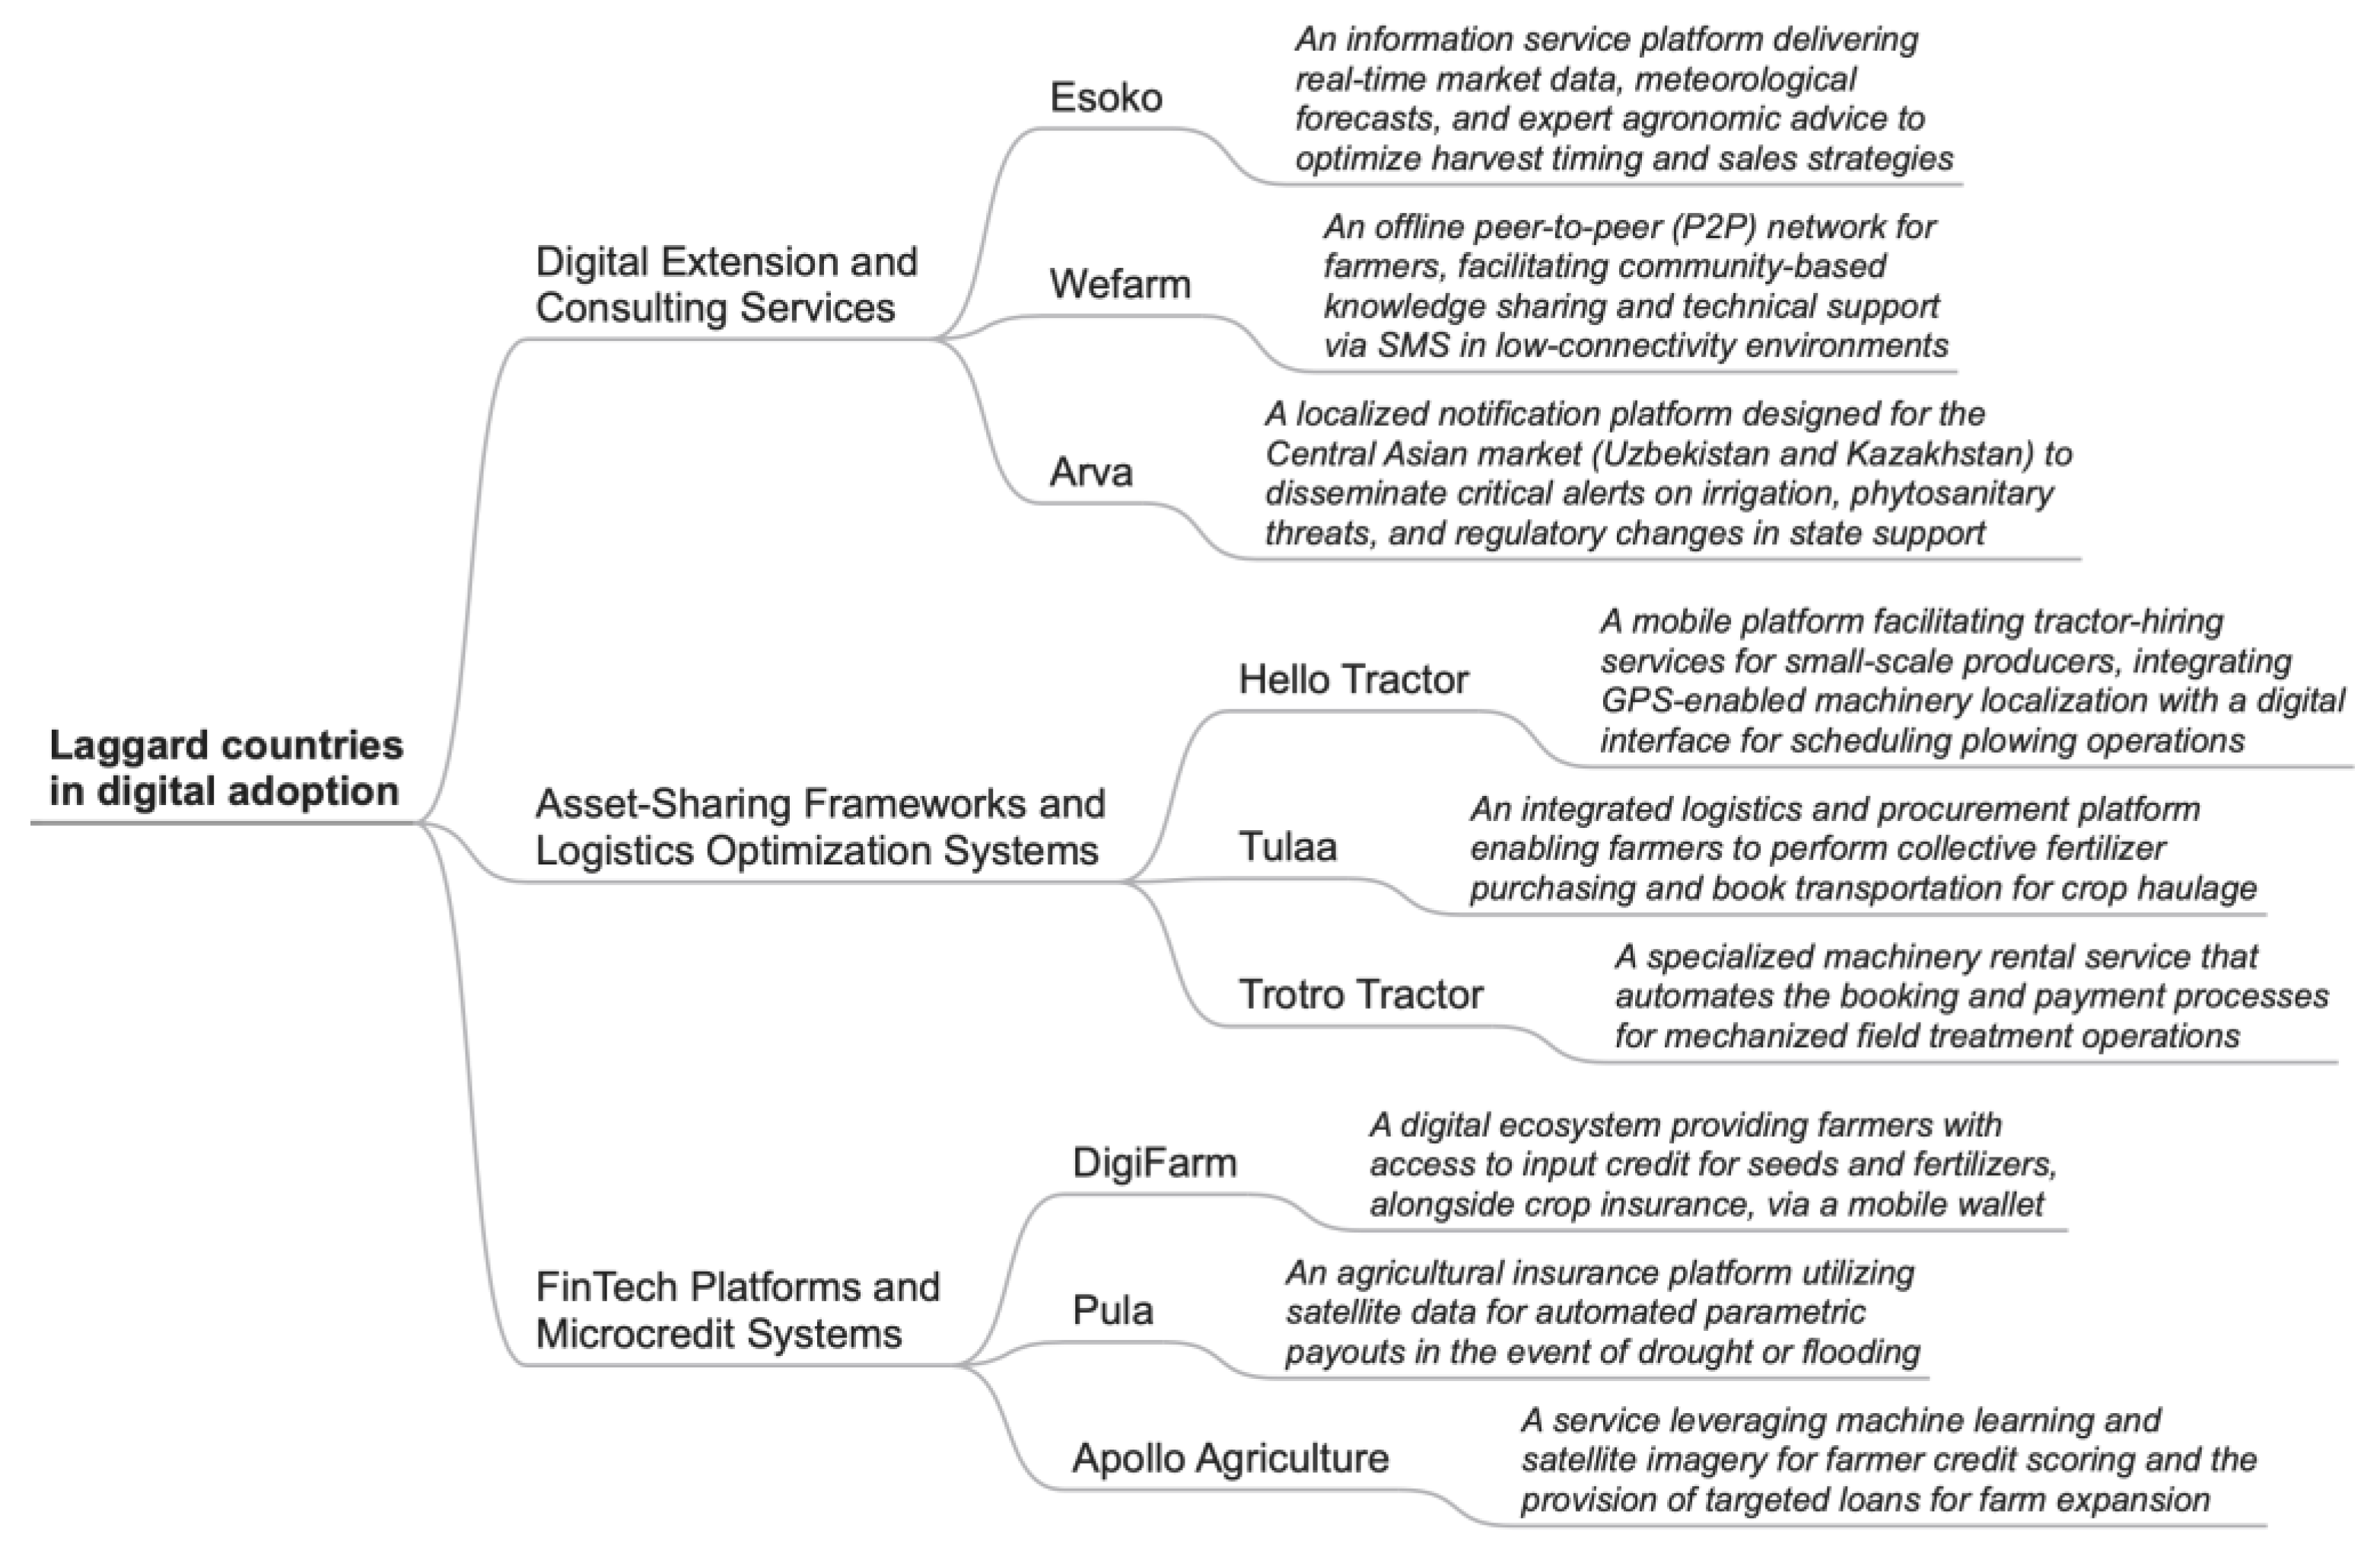
Figure 5.
Model of the architecture of a digital food security system
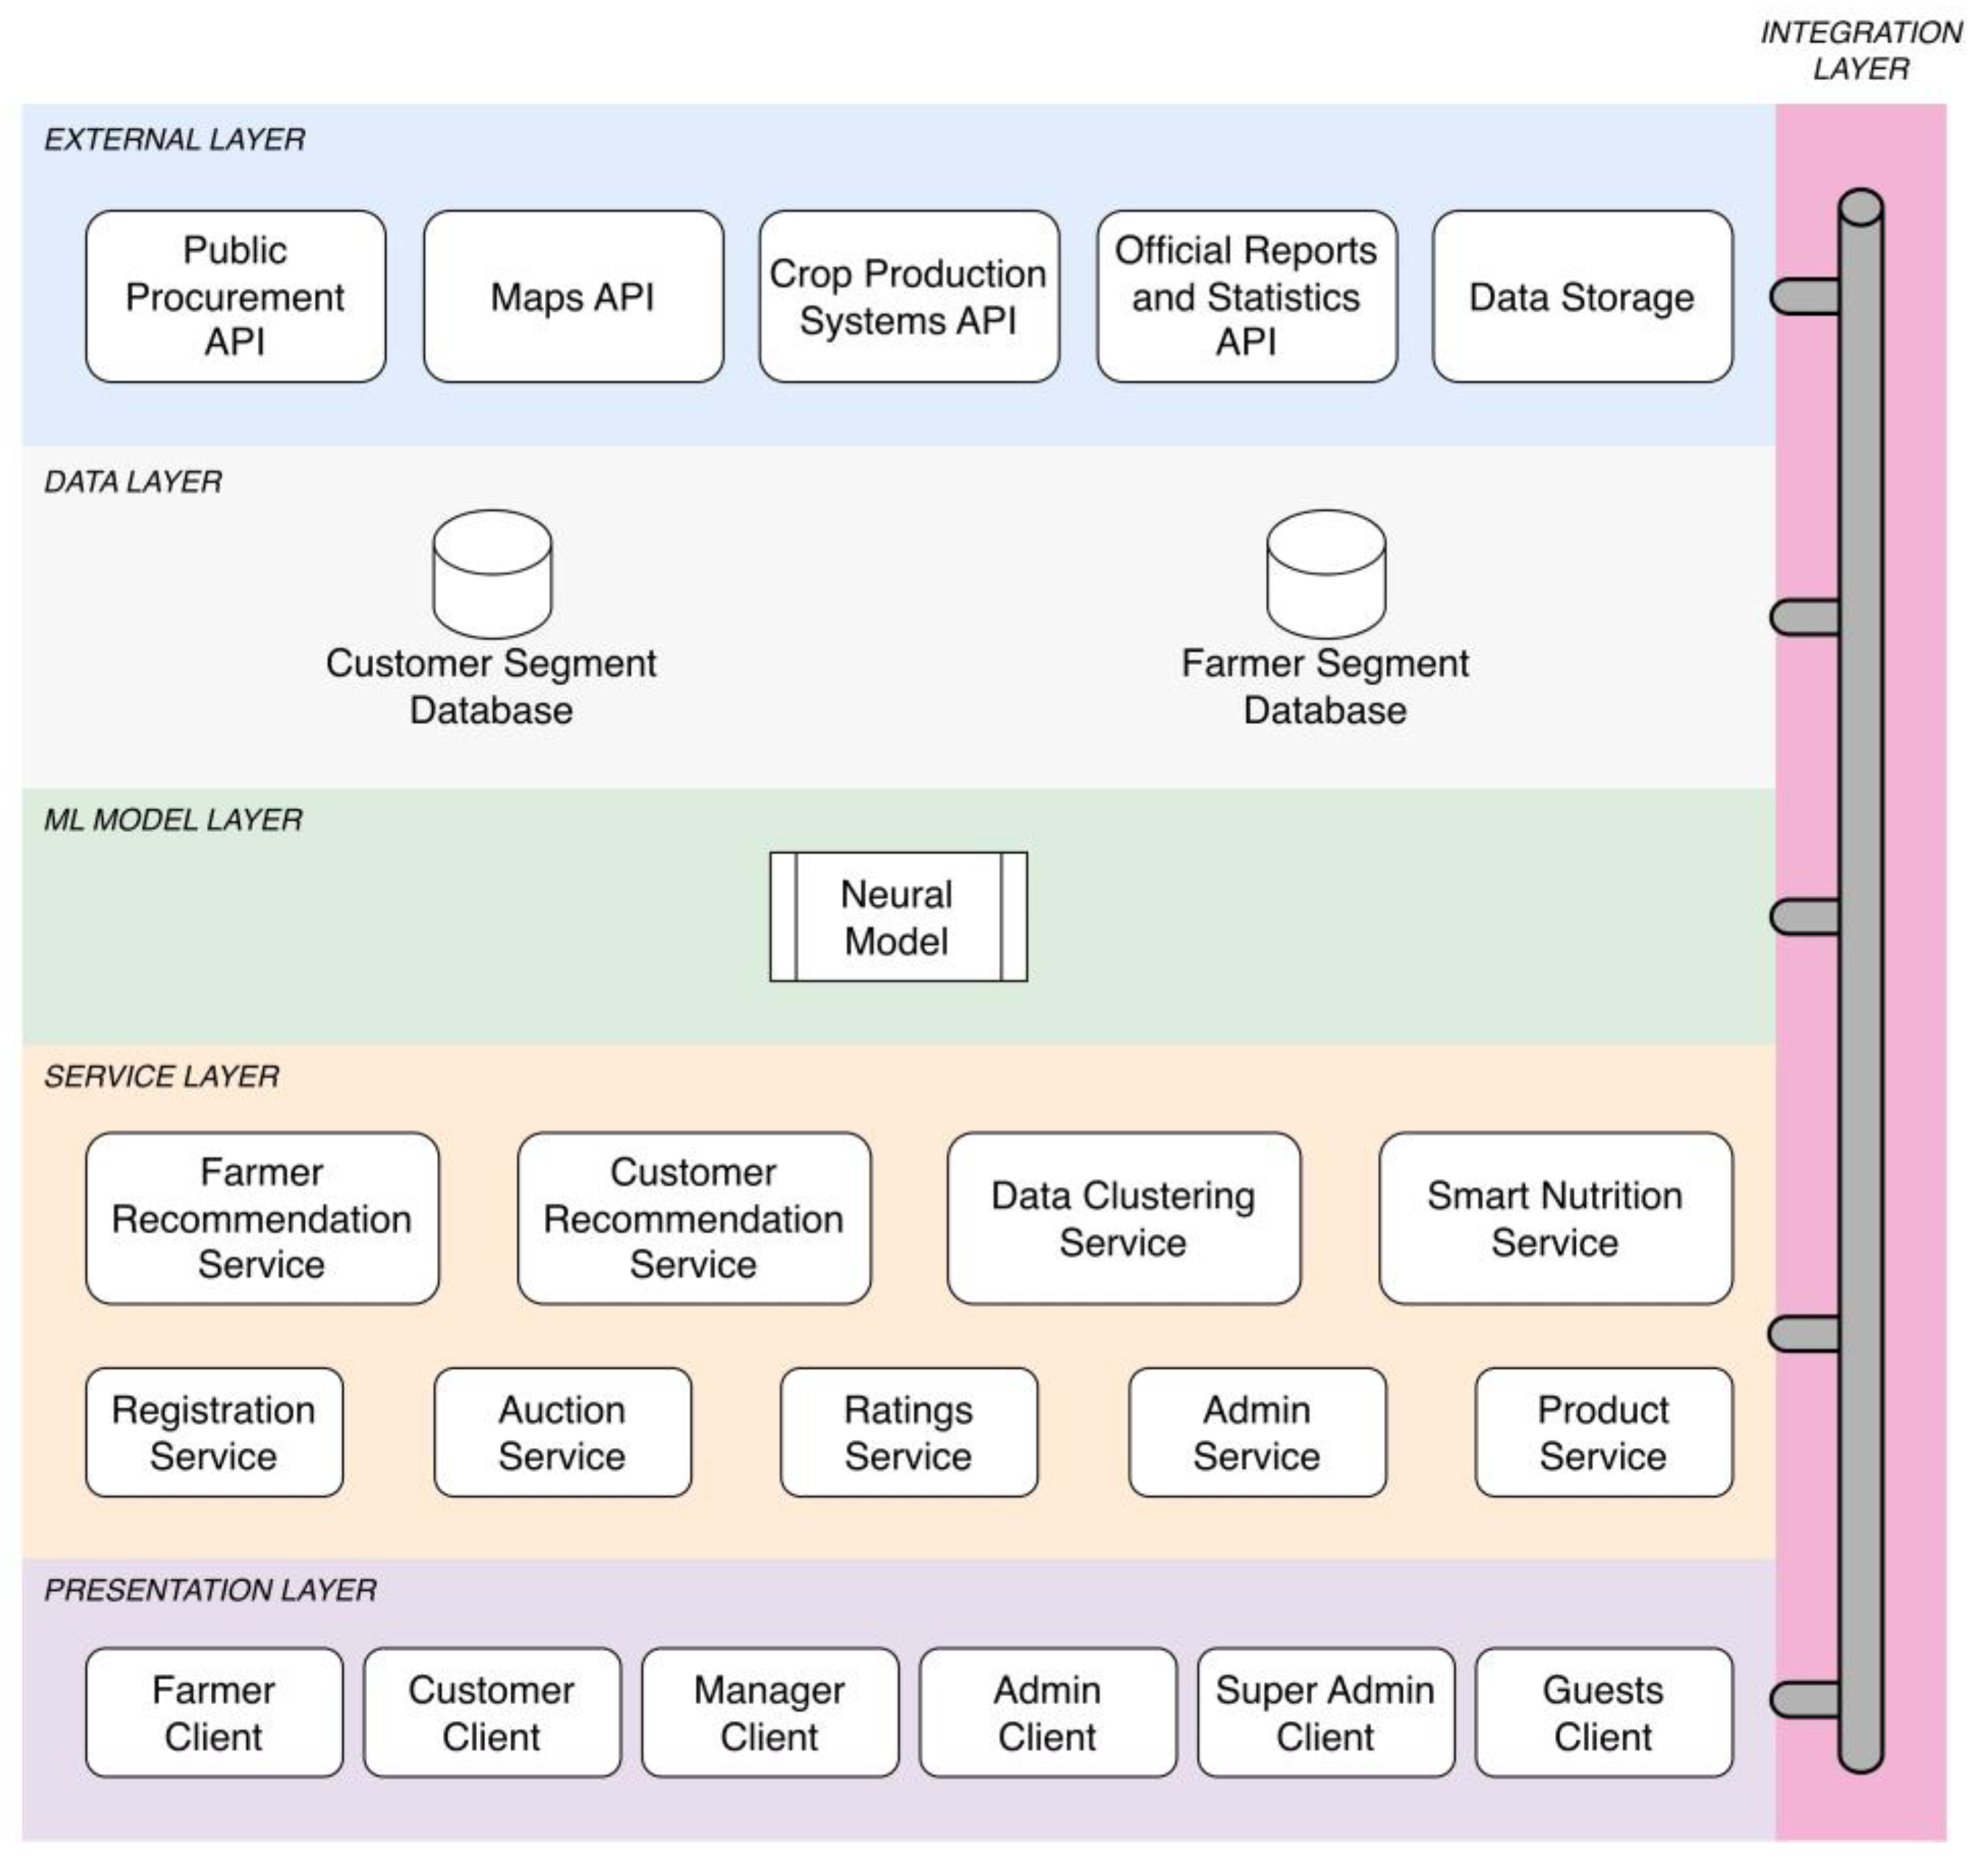
Figure 6.
Model of user functions in a digital food security system
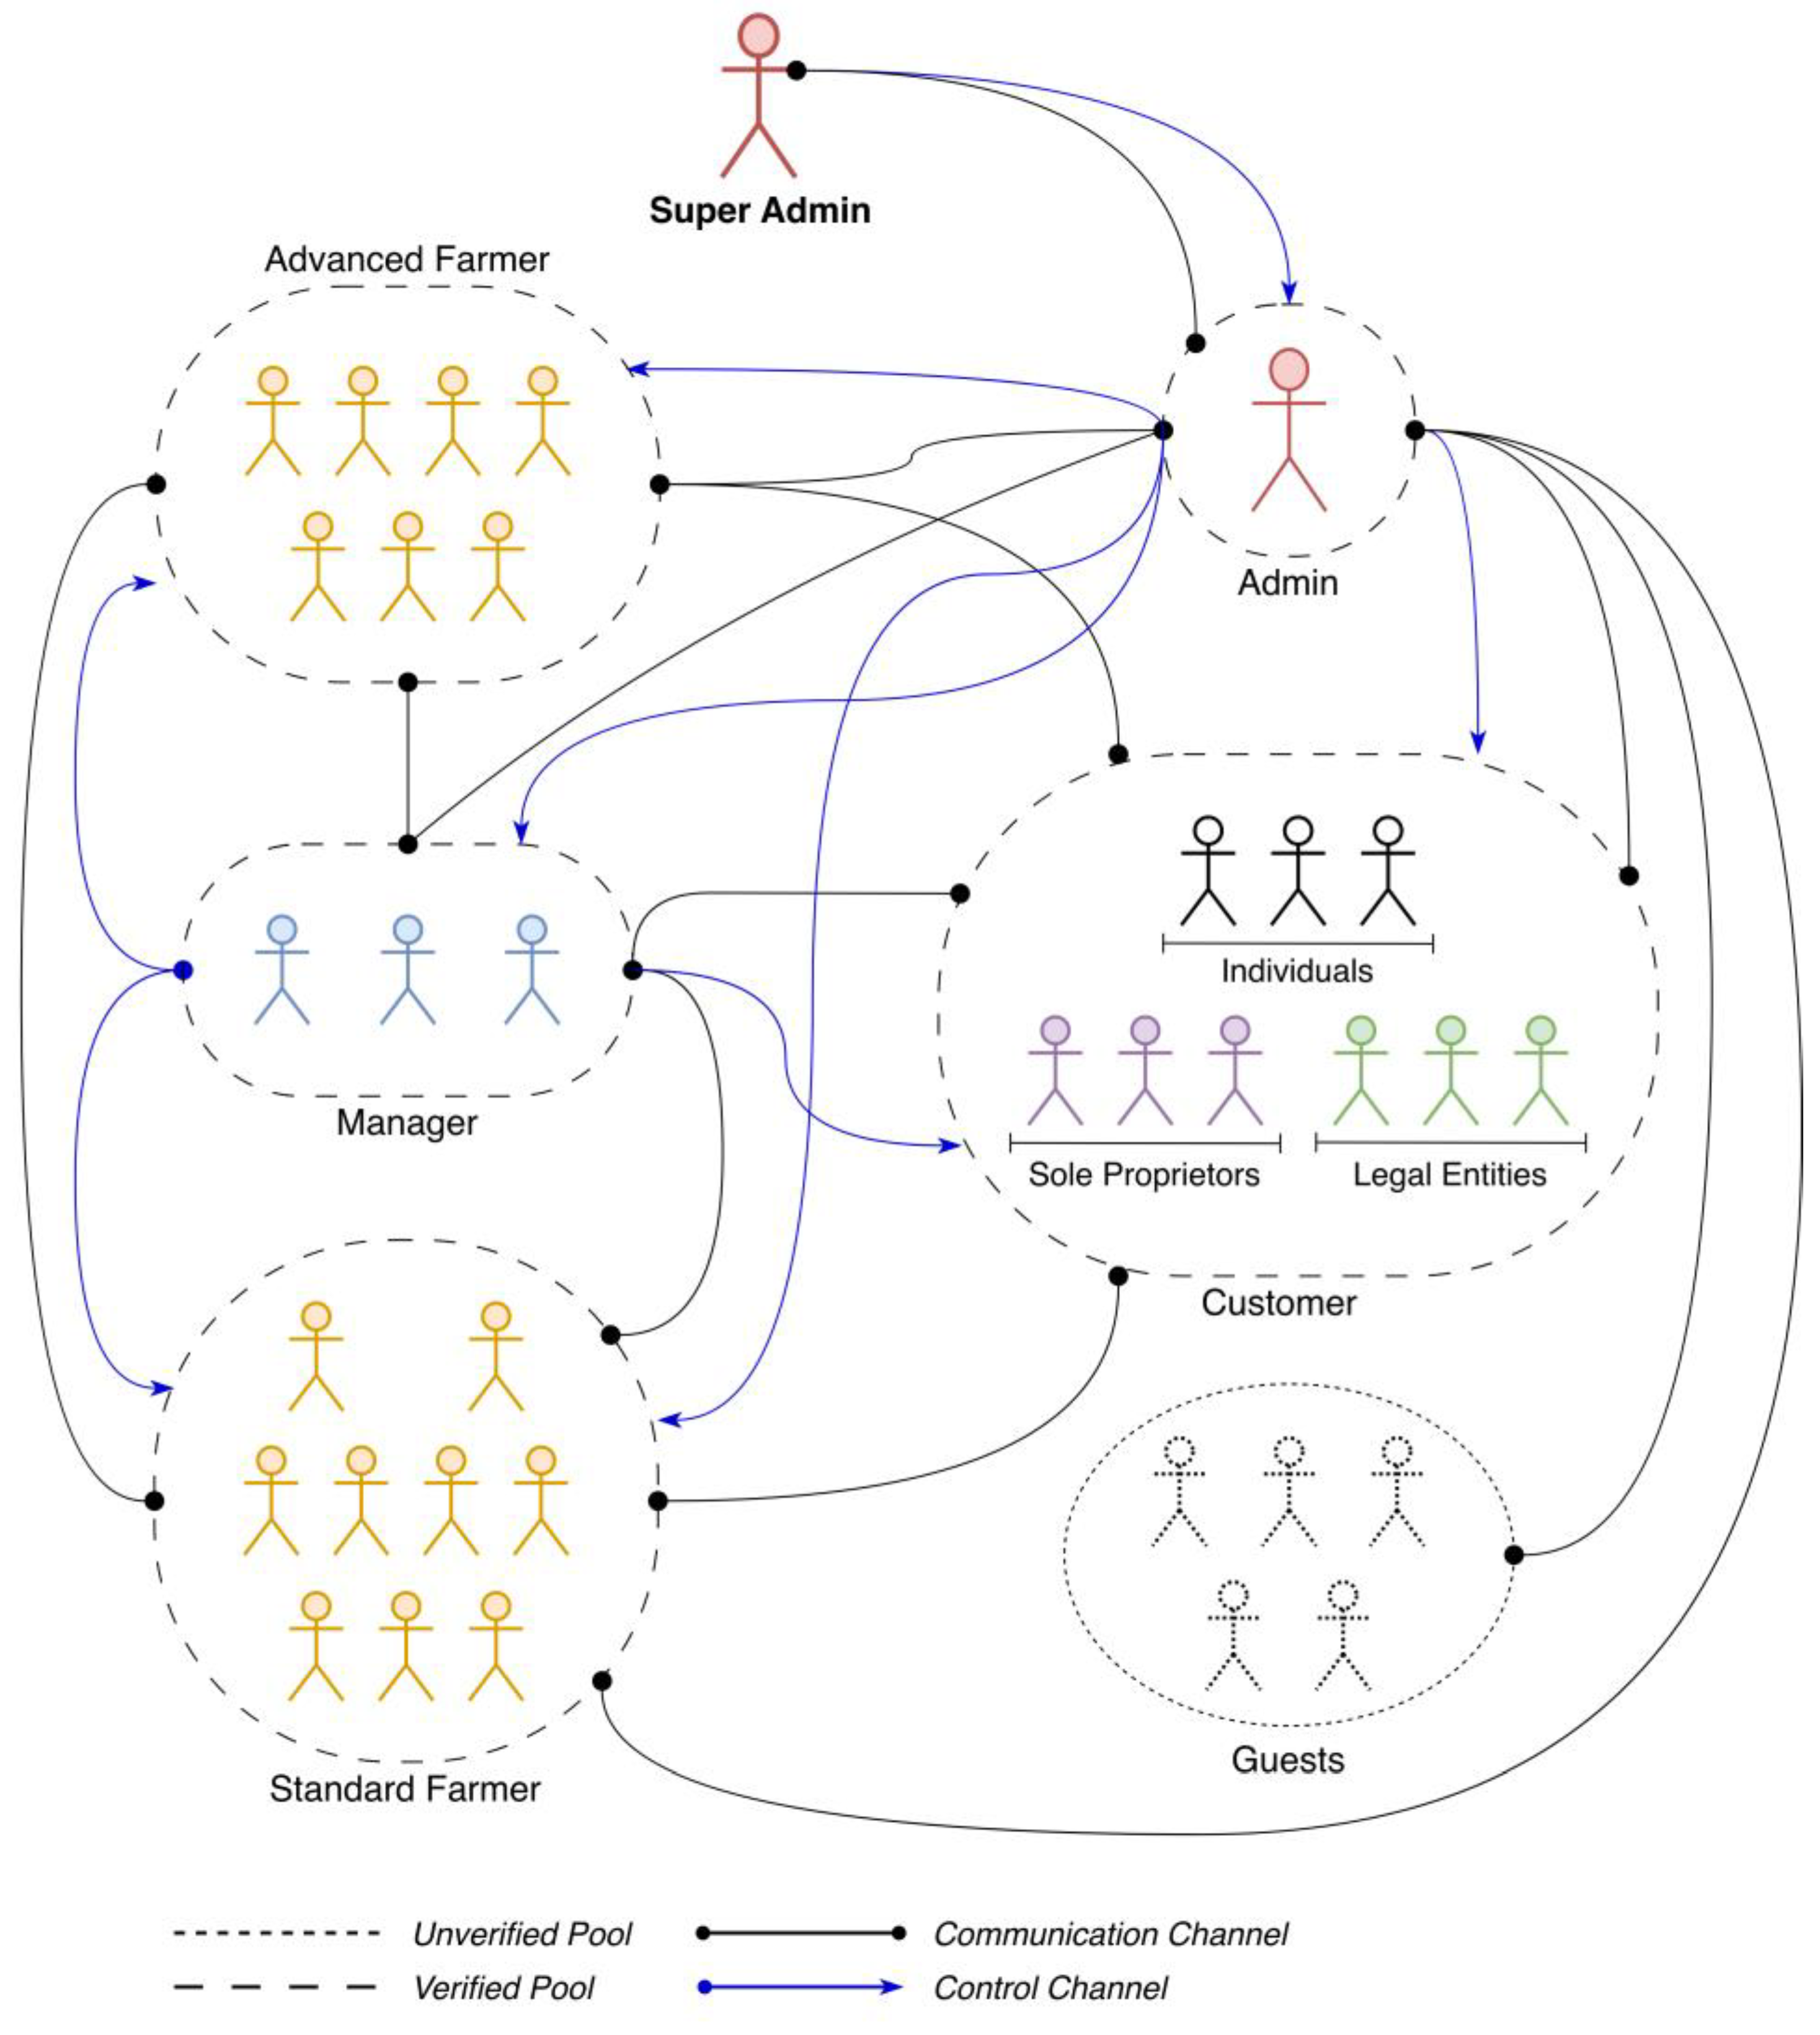
Figure 7.
Neural network model for vegetable classification
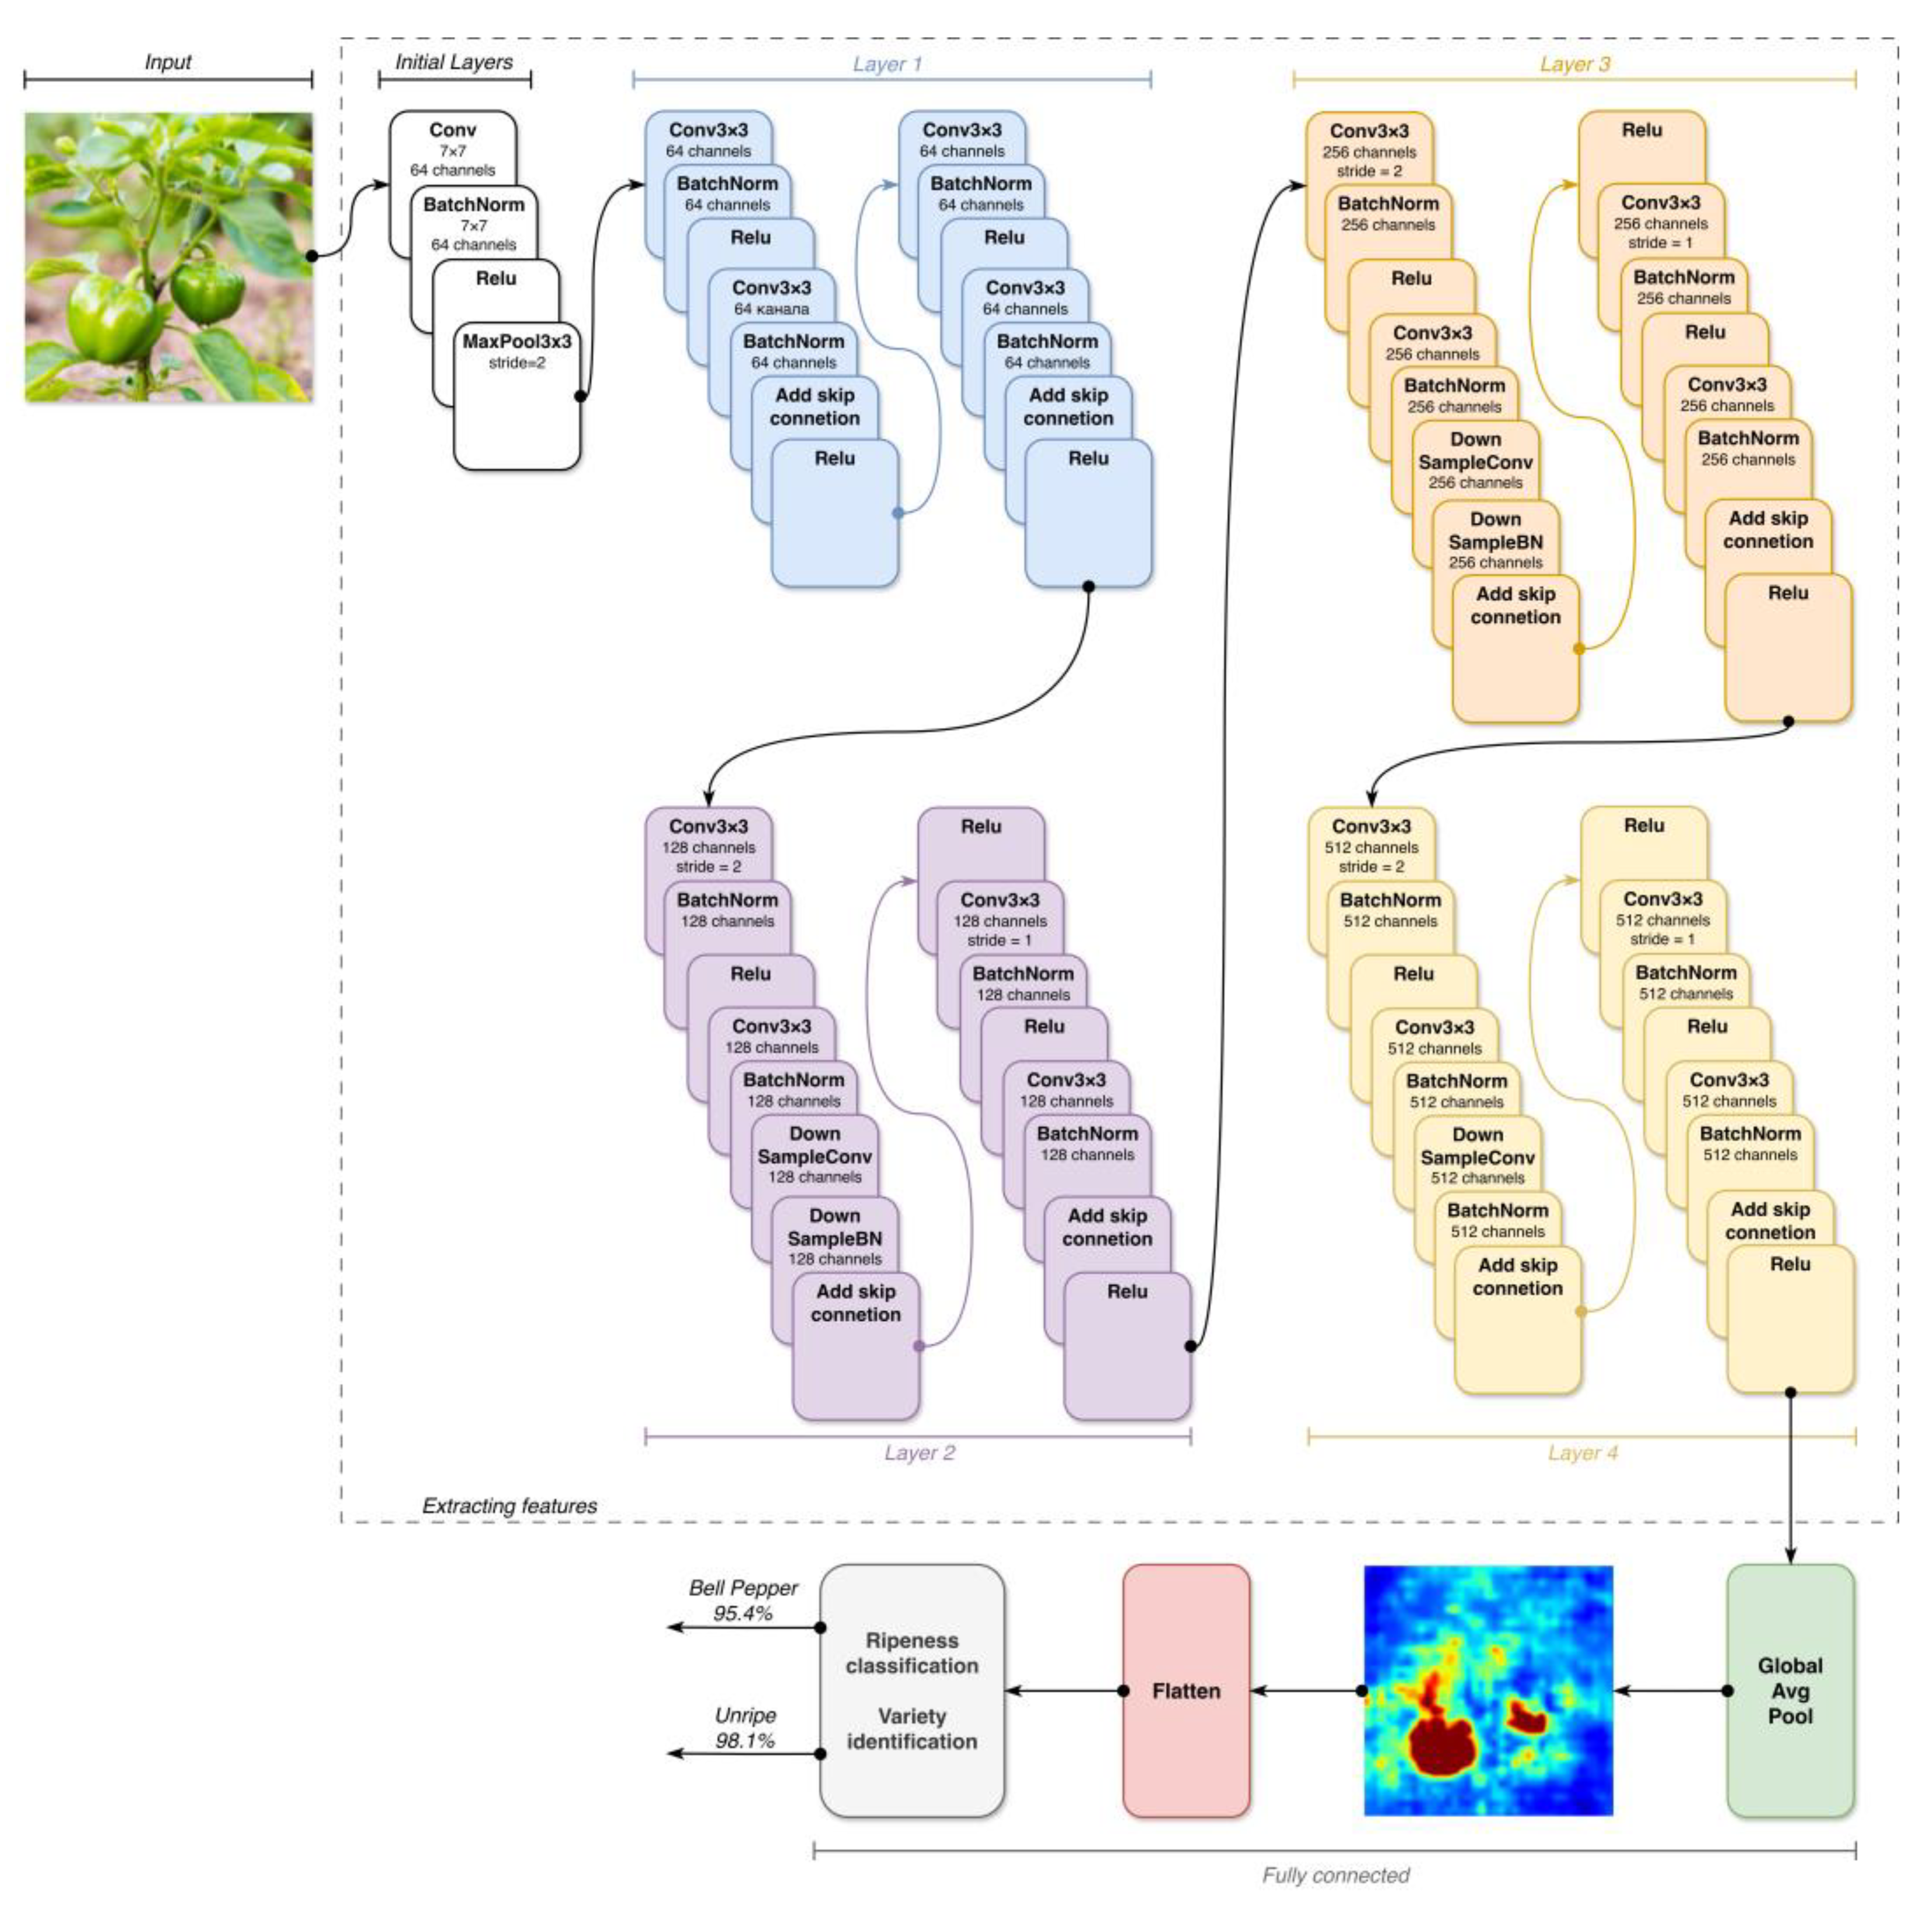
Figure 8.
Confusion matrix: (a) identification of vegetable varieties; (b) assessment of vegetable ripeness
Figure 8.
Confusion matrix: (a) identification of vegetable varieties; (b) assessment of vegetable ripeness
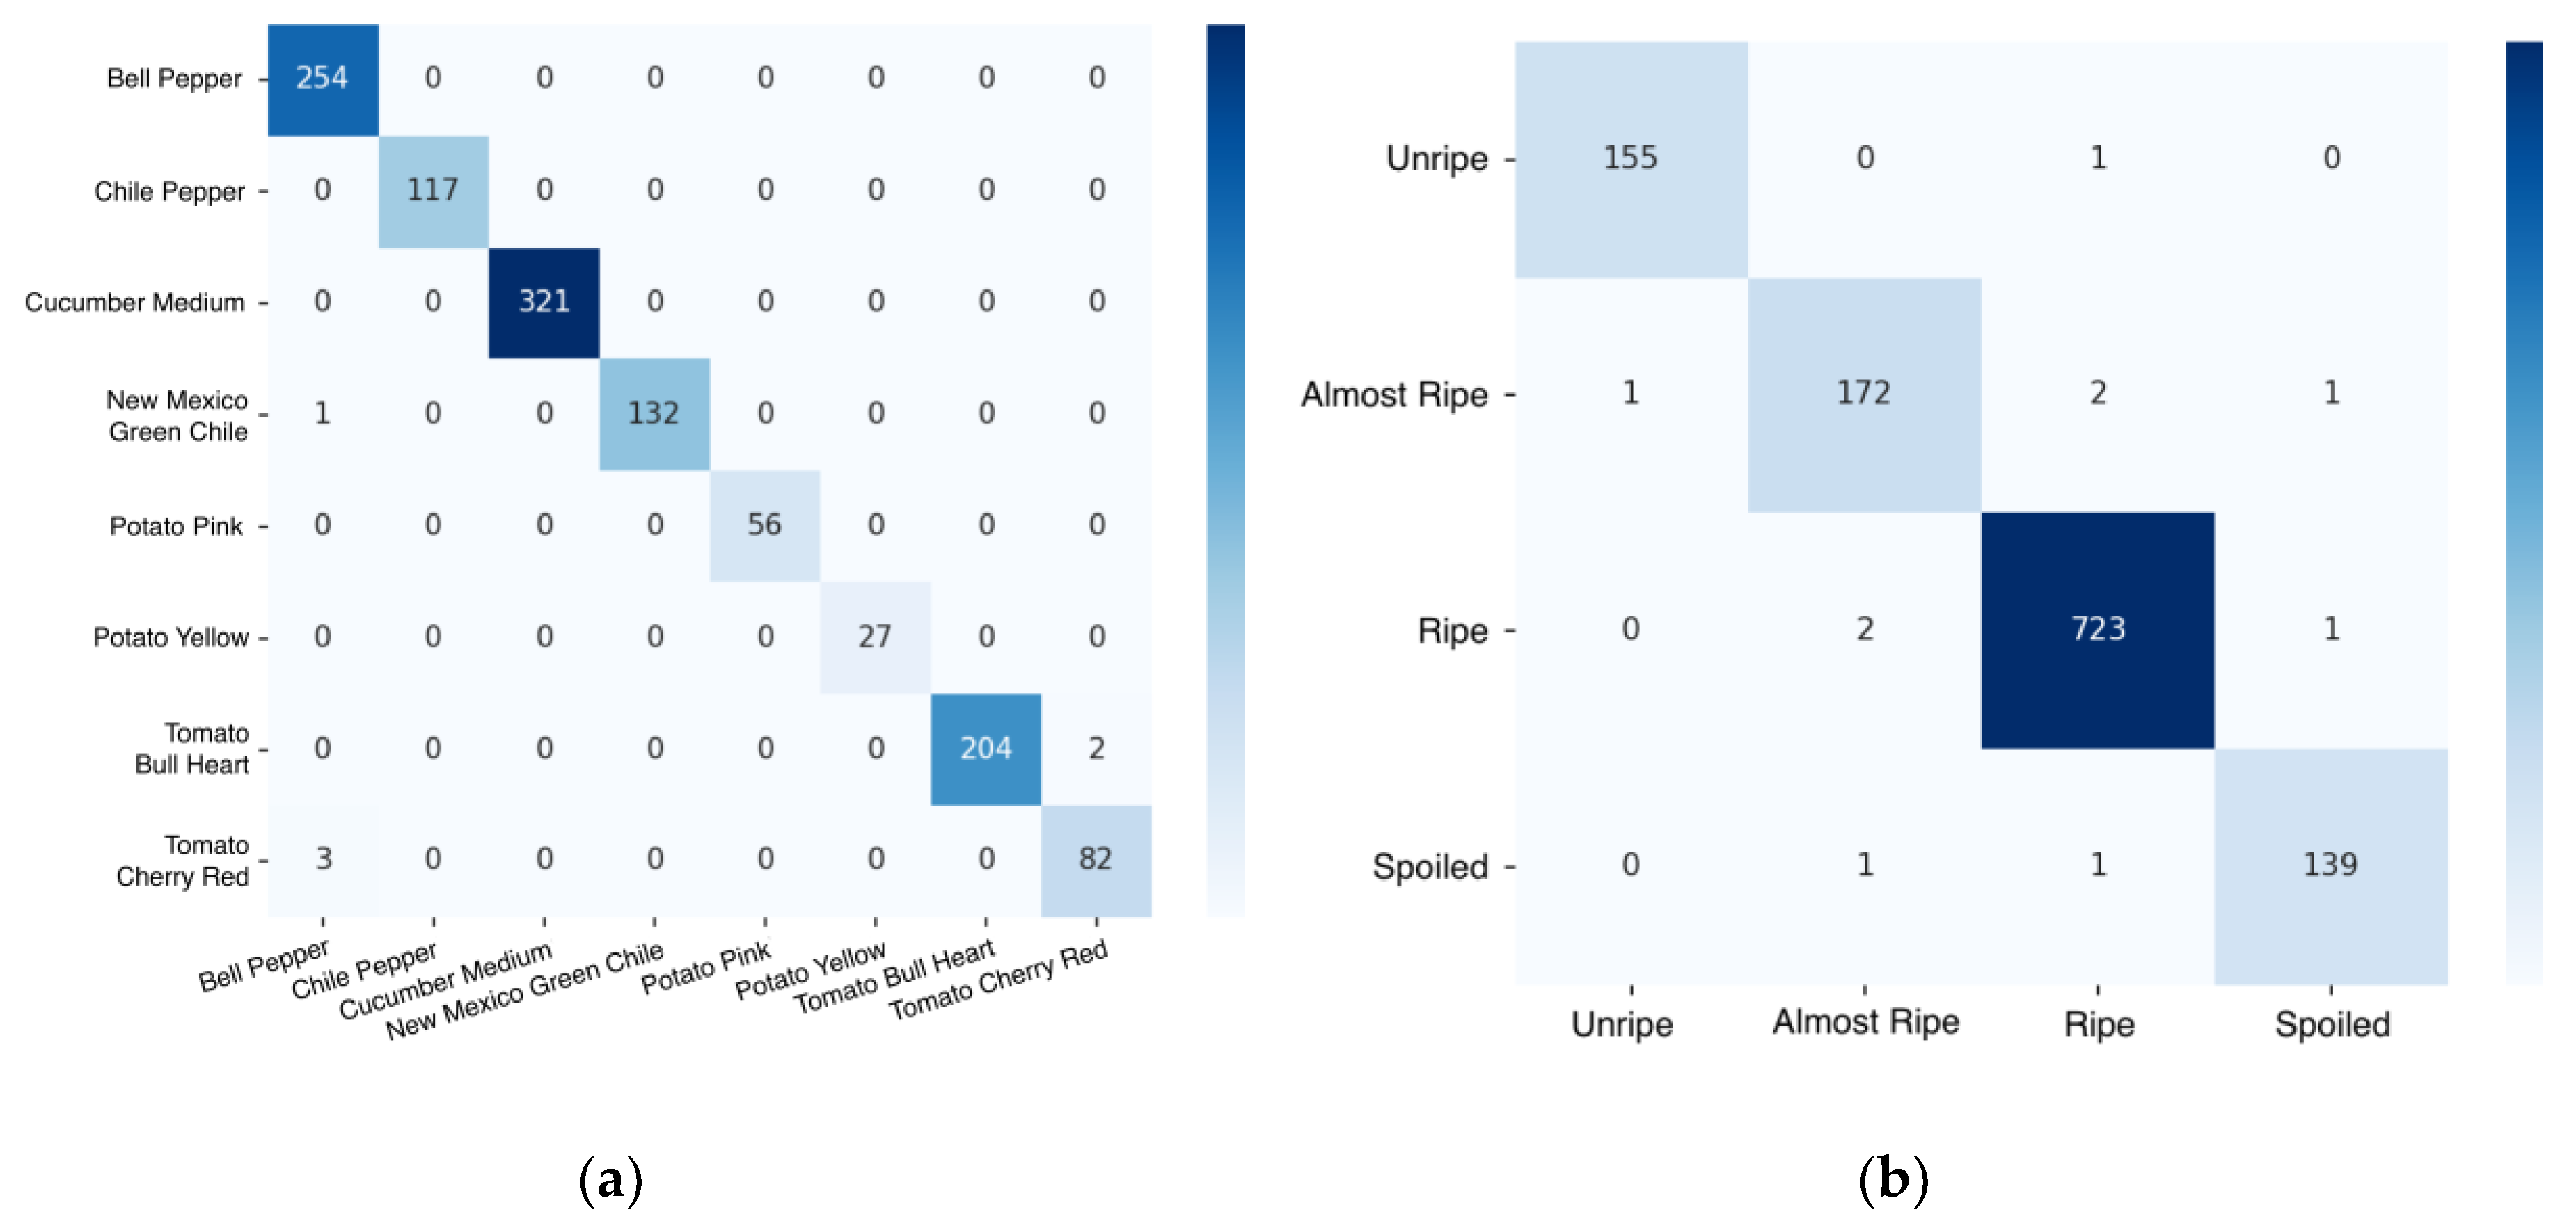
Figure 9.
Graphs of training results: (a) loss function and (b) classification accuracy
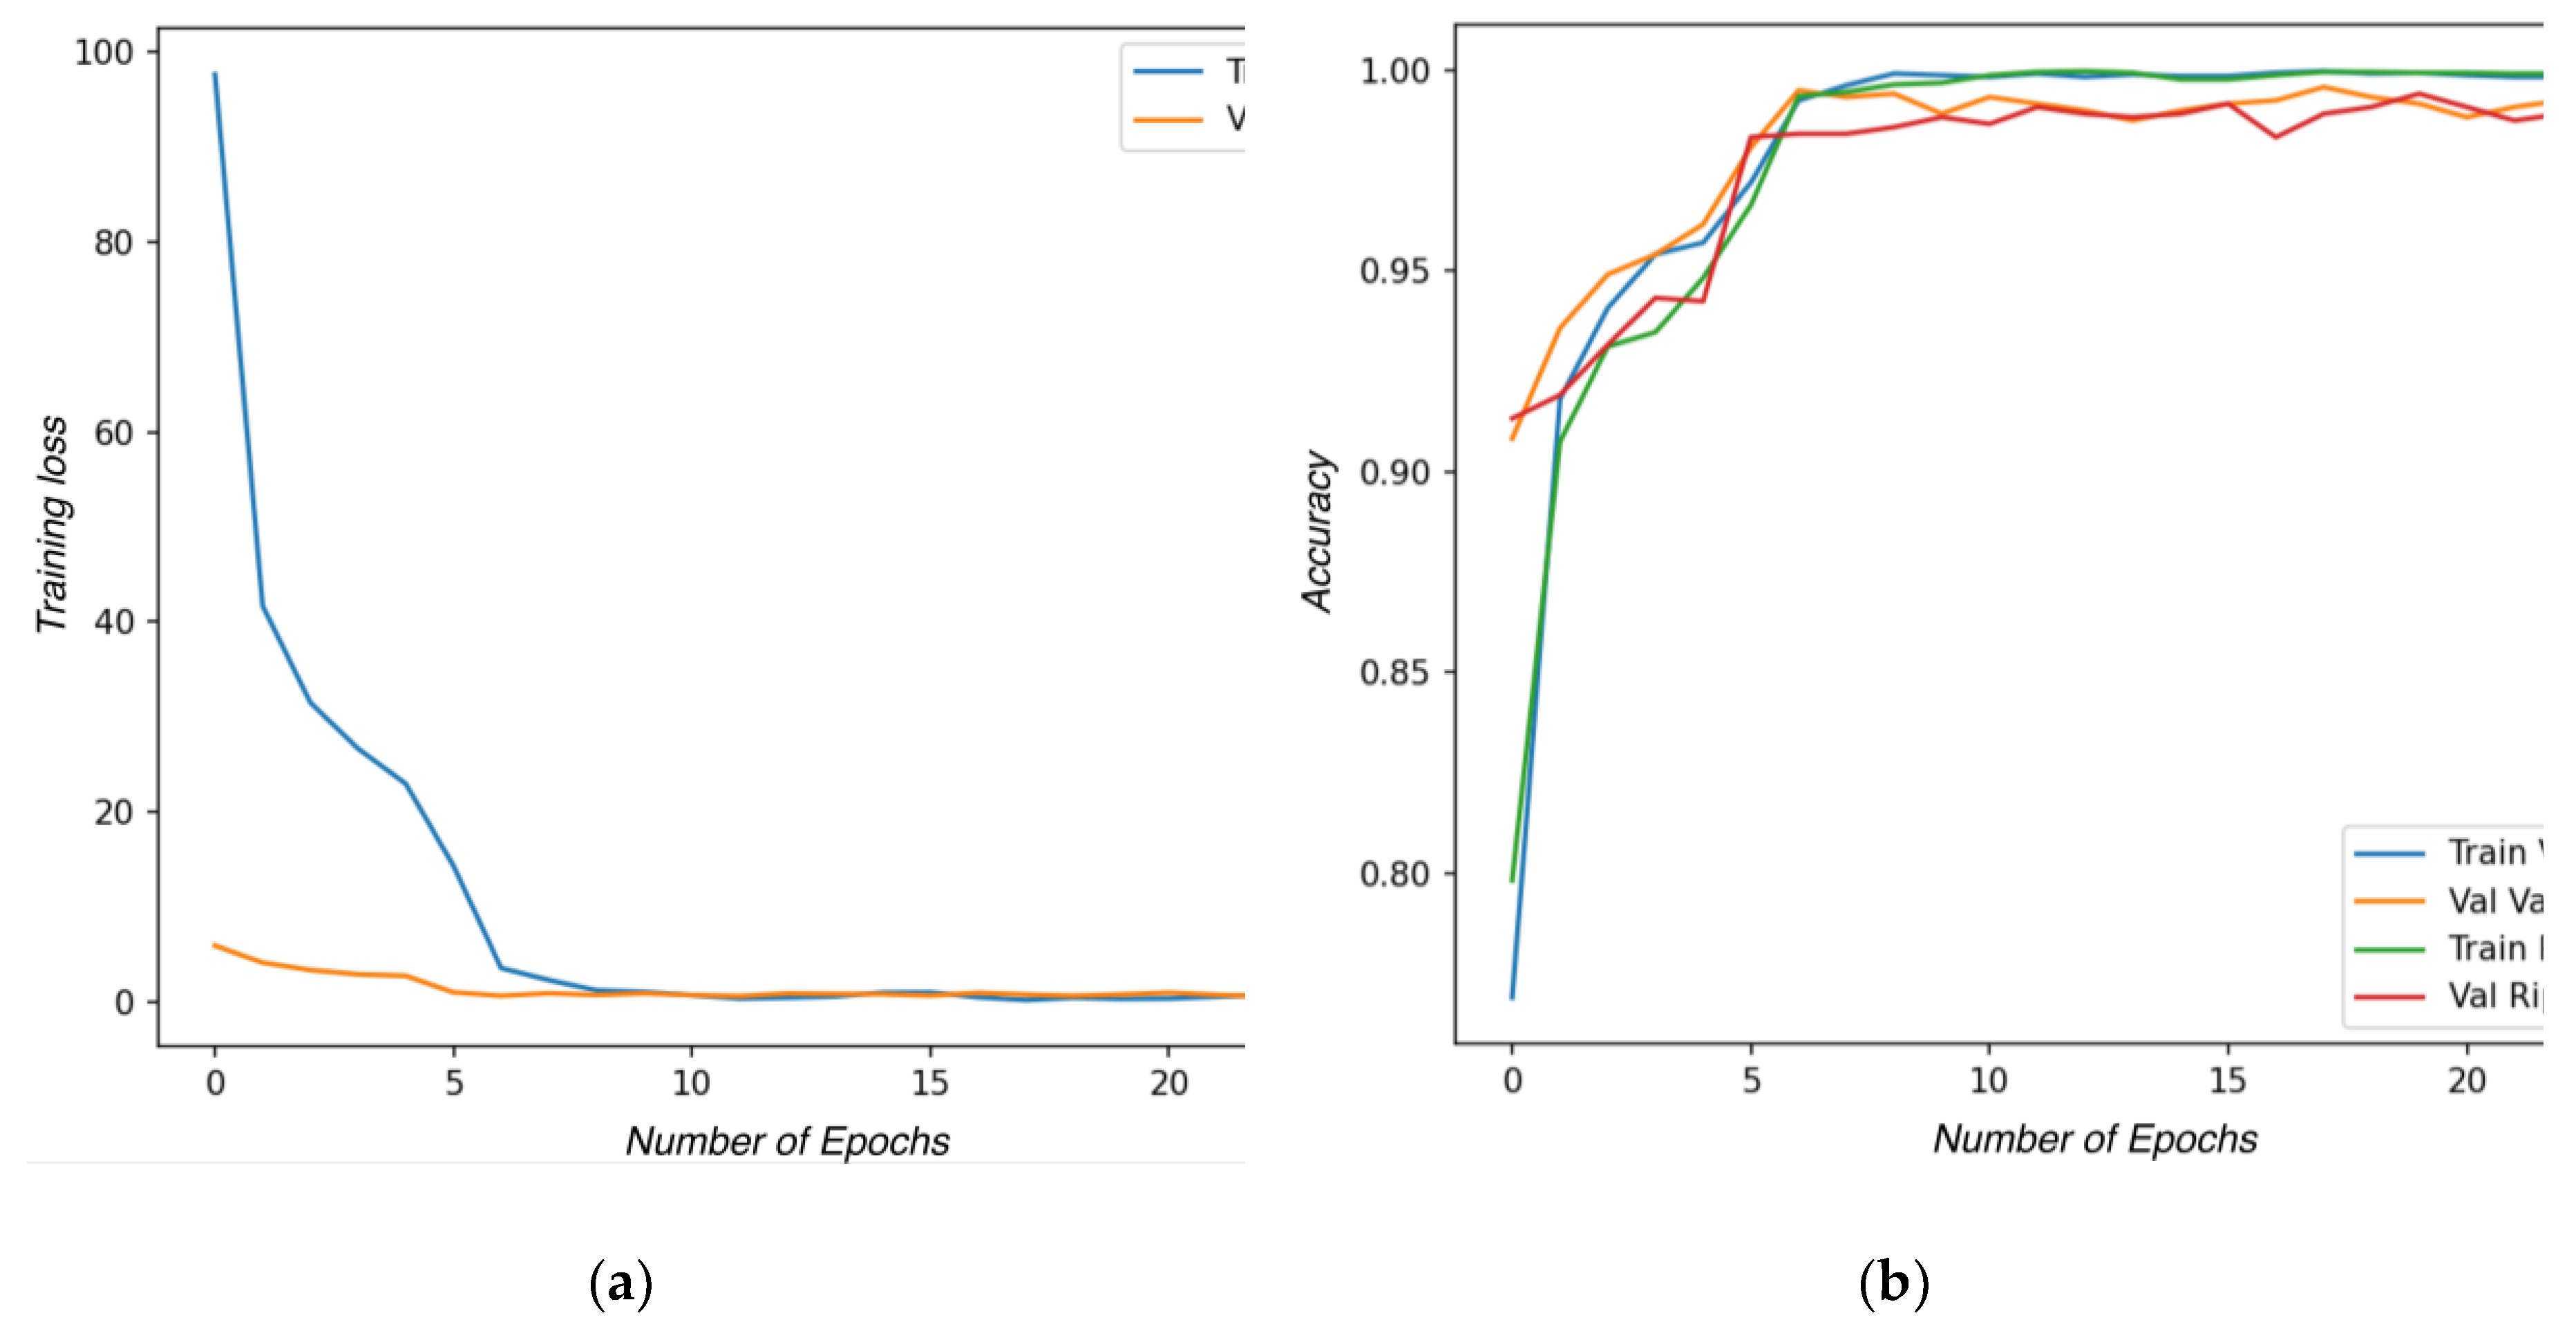
Figure 10.
The front page of the digital system with a list of farms available to the user with the “Buyer” role
Figure 10.
The front page of the digital system with a list of farms available to the user with the “Buyer” role
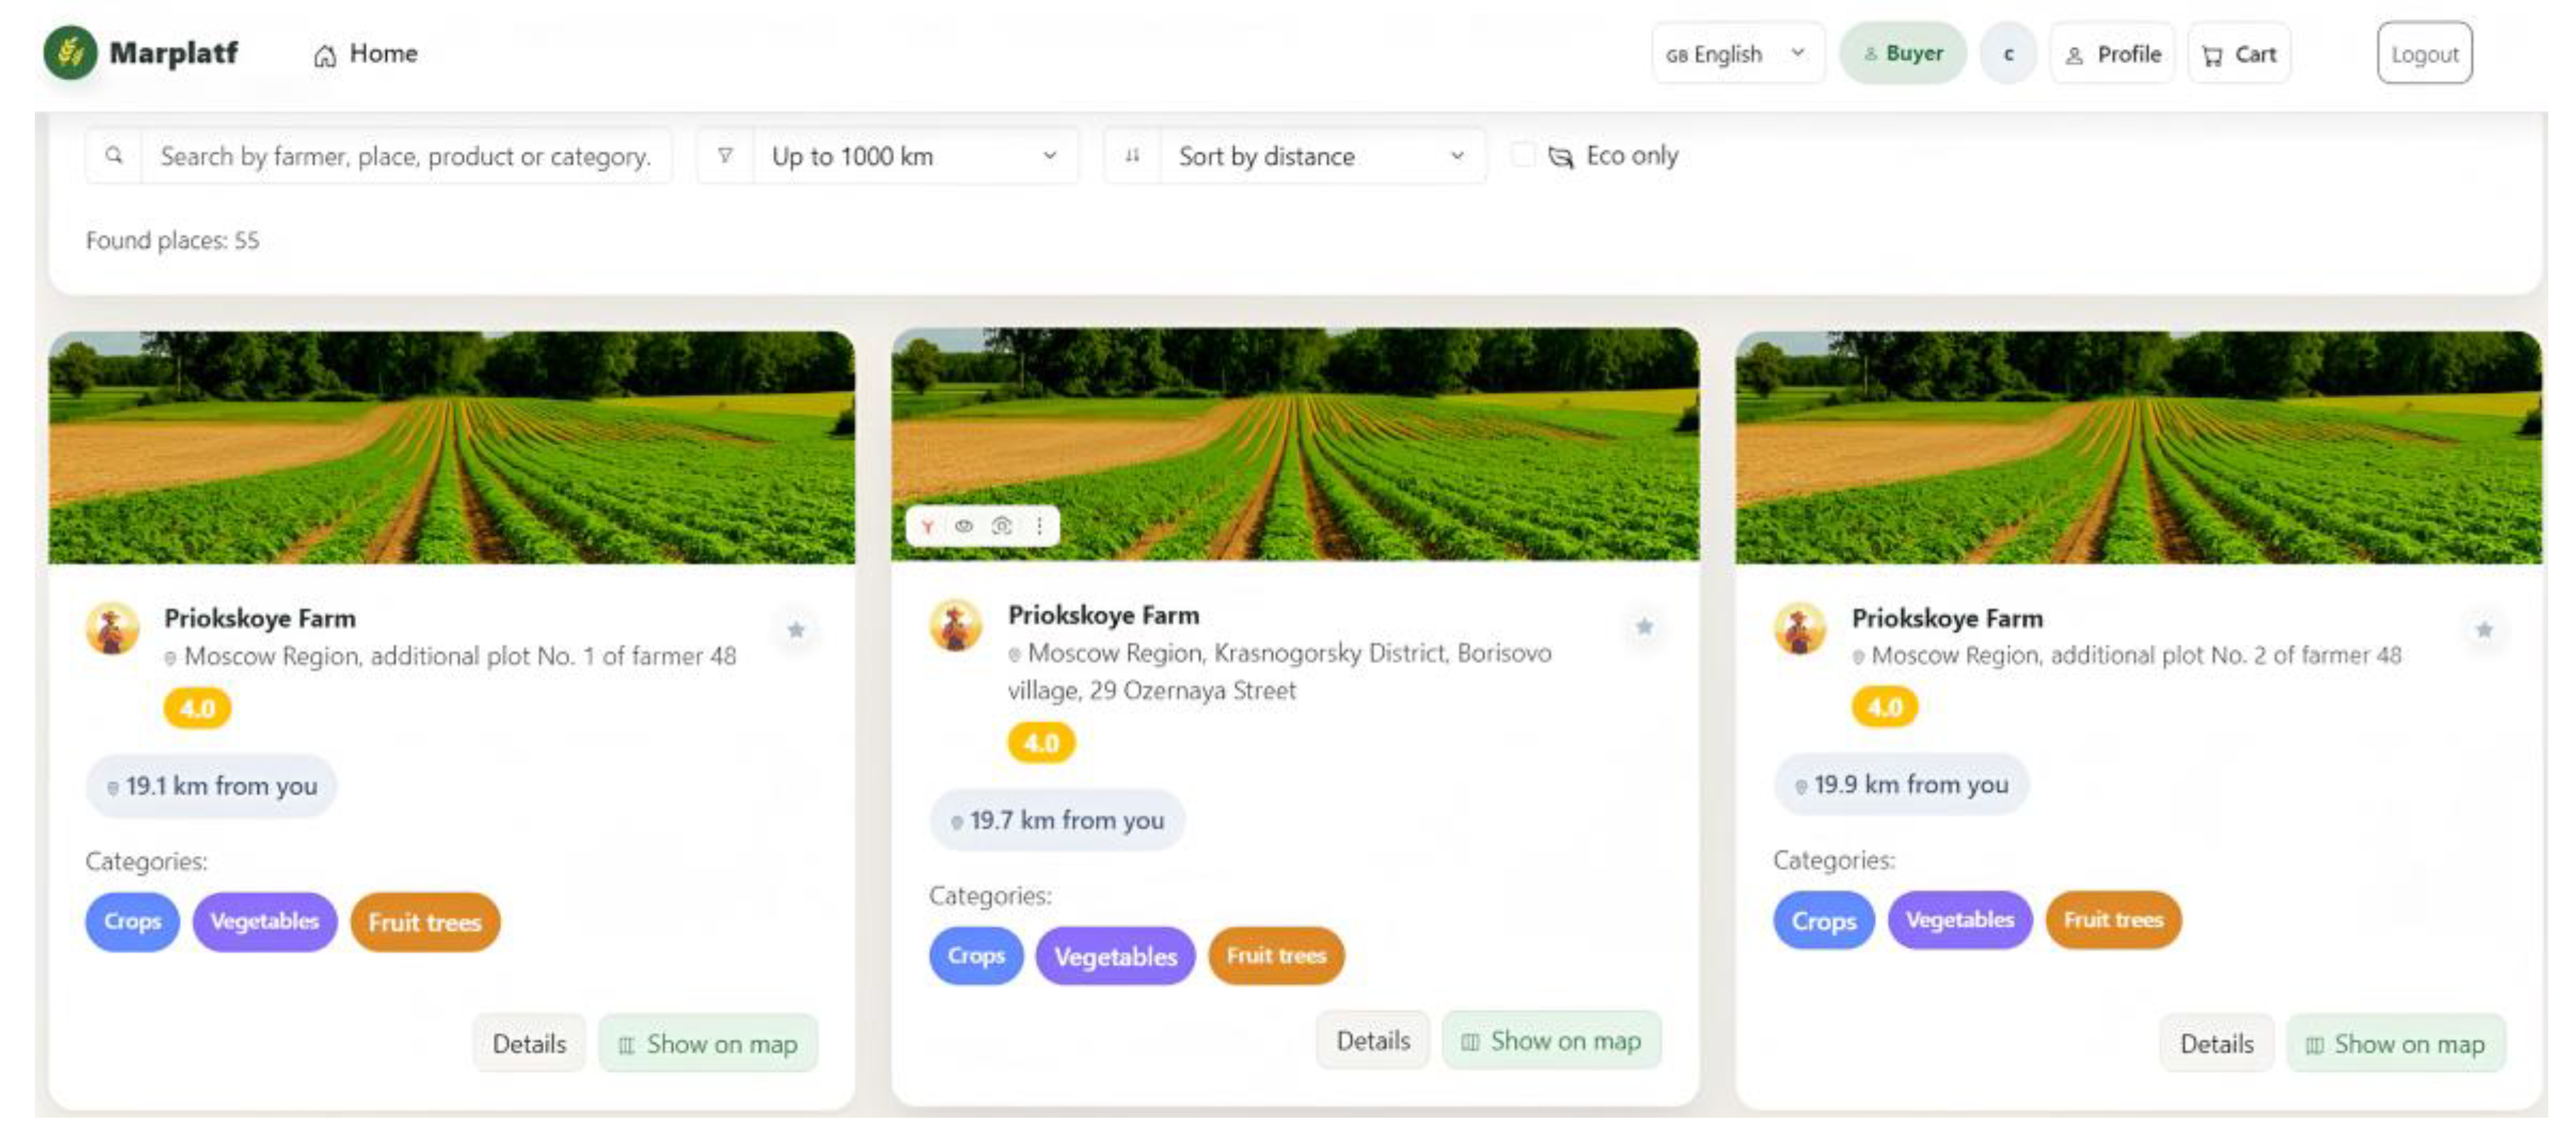
Figure 11.
Model of customer-system interaction when searching for products by image
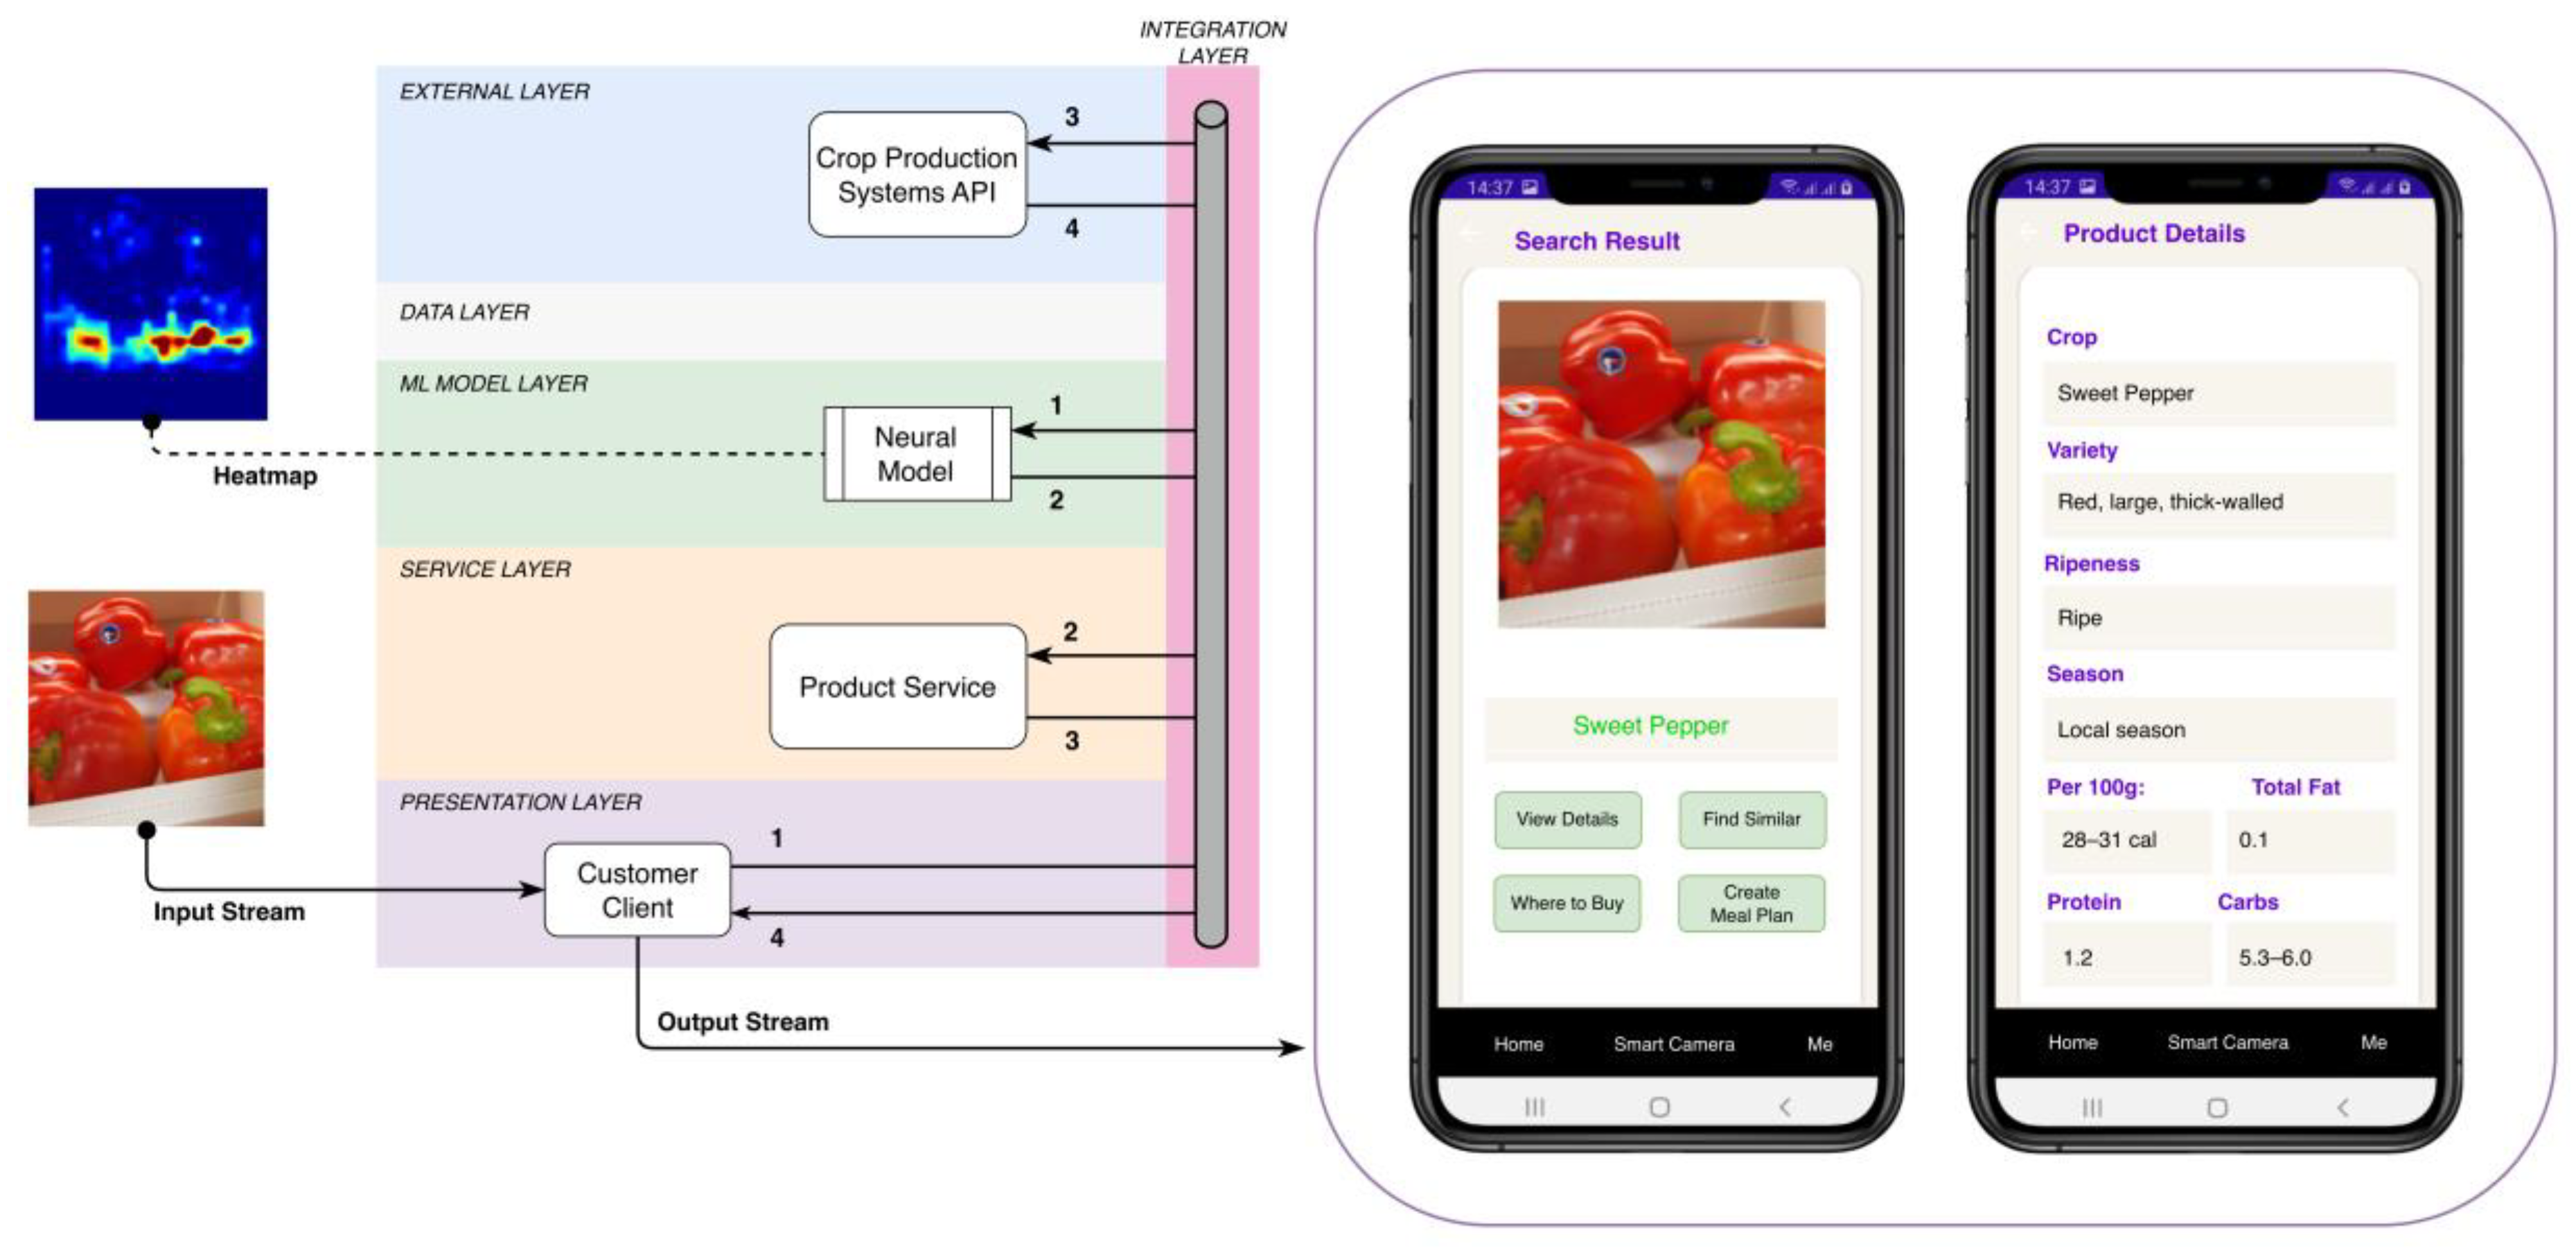
Figure 12.
The page for generating farm profiles in the farmer's personal account
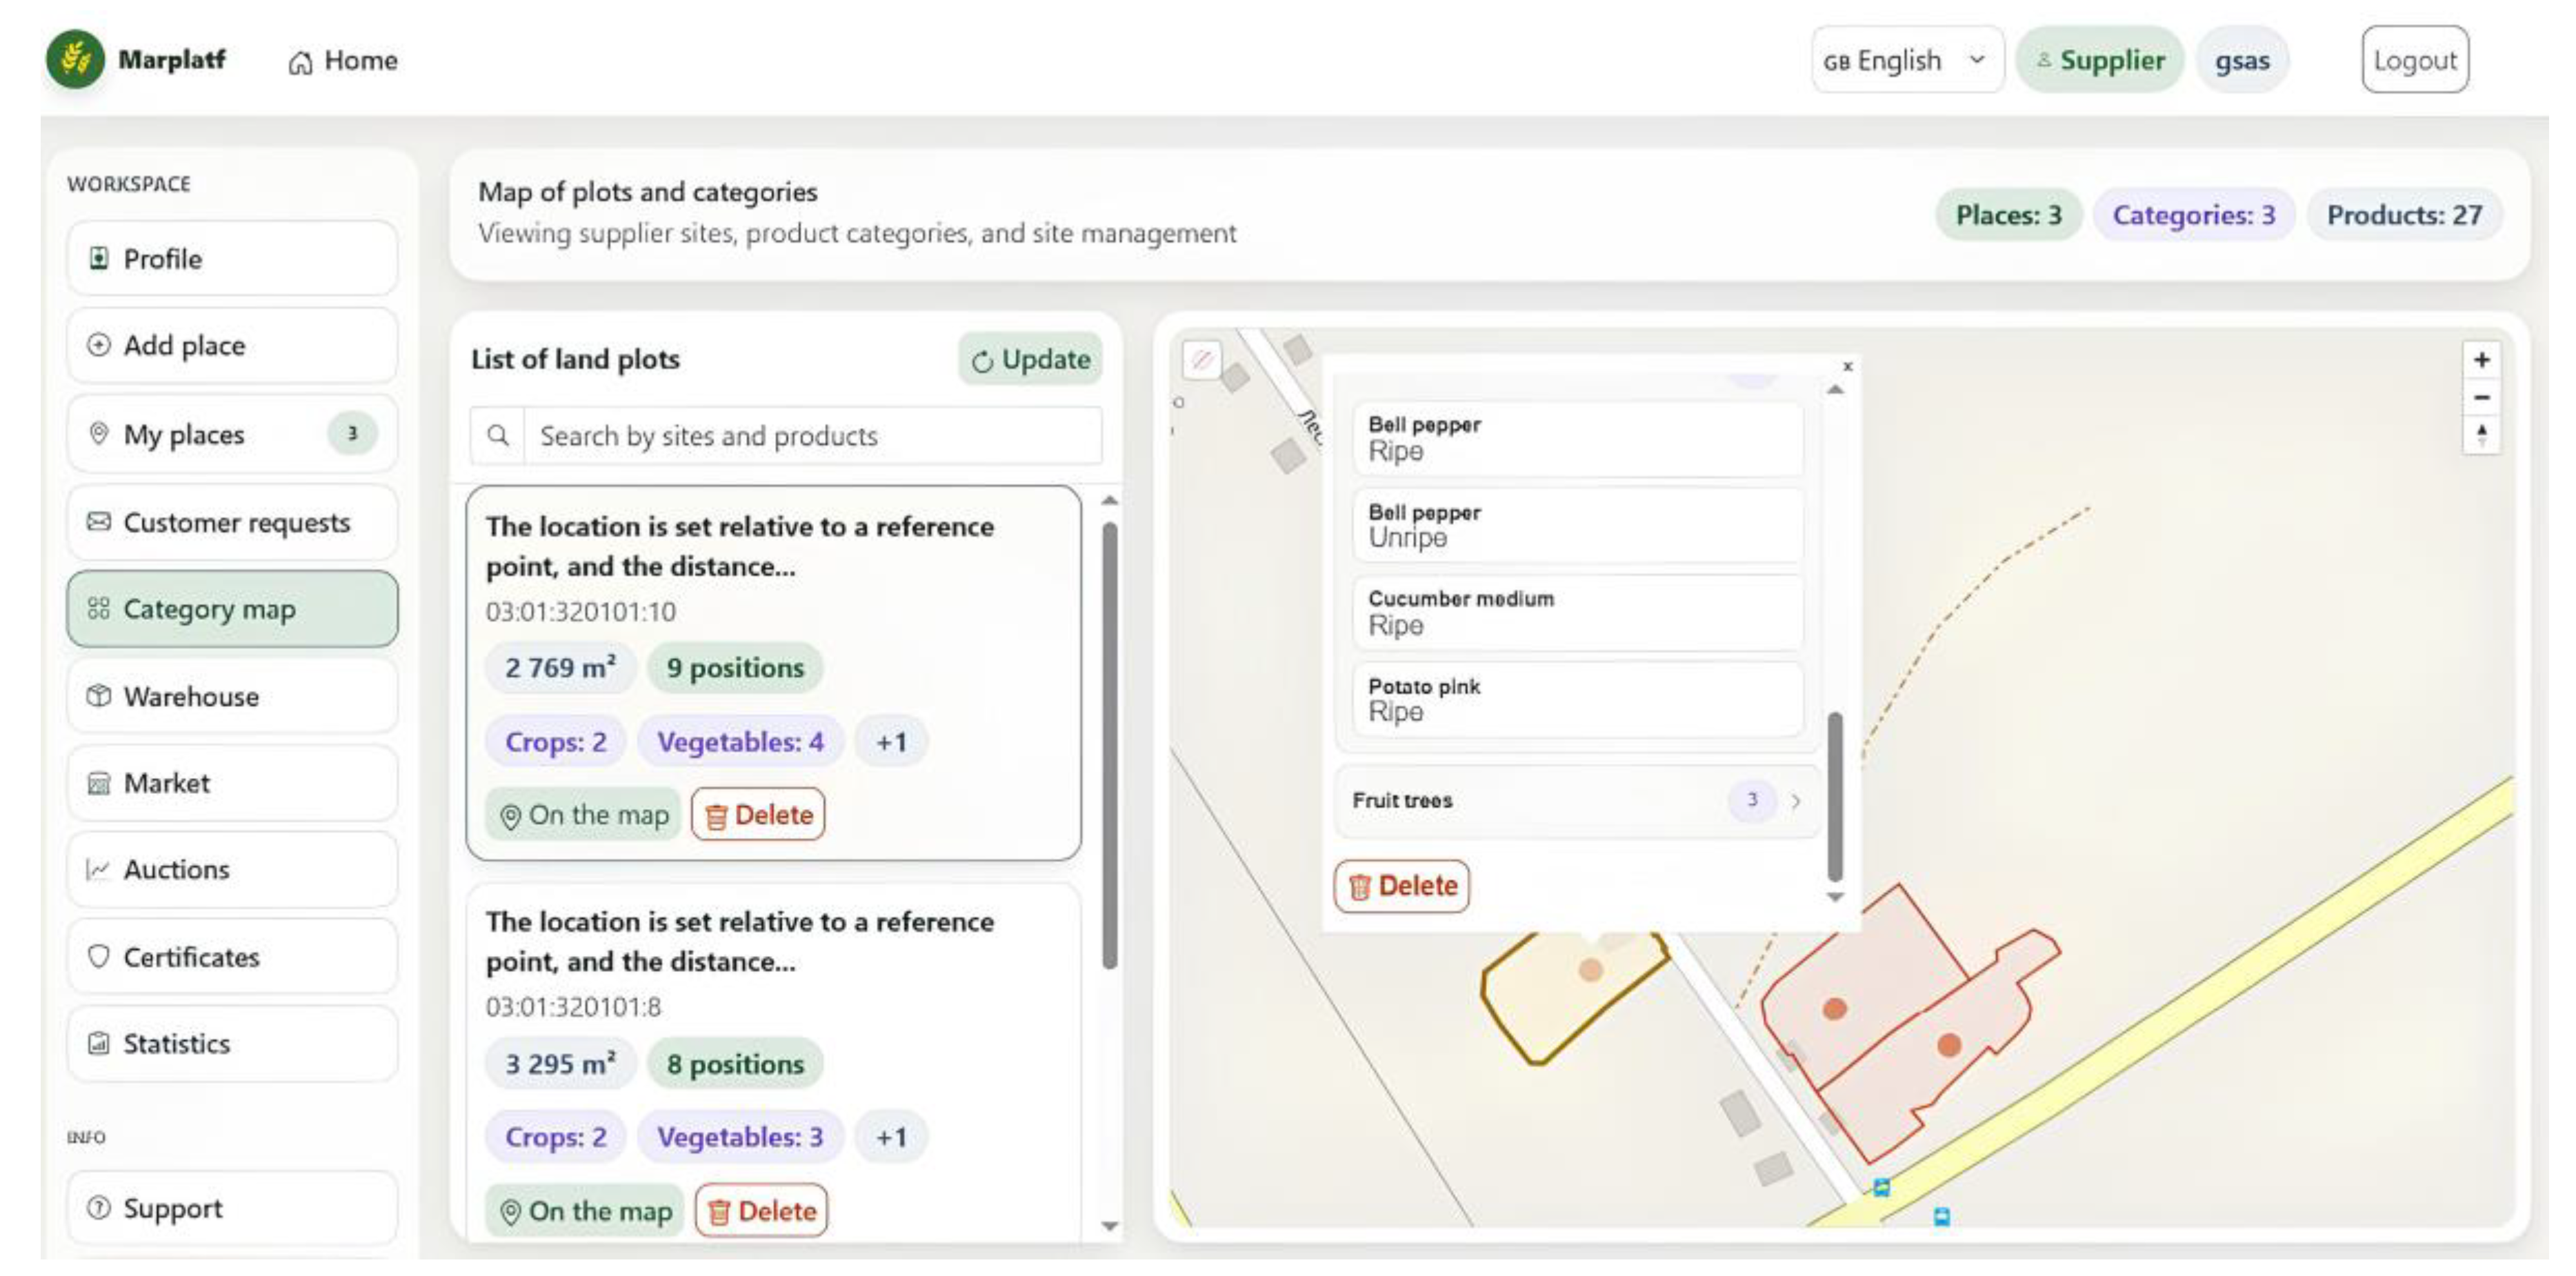
Figure 13.
Model of the digital system-farmer interaction when generating product cards
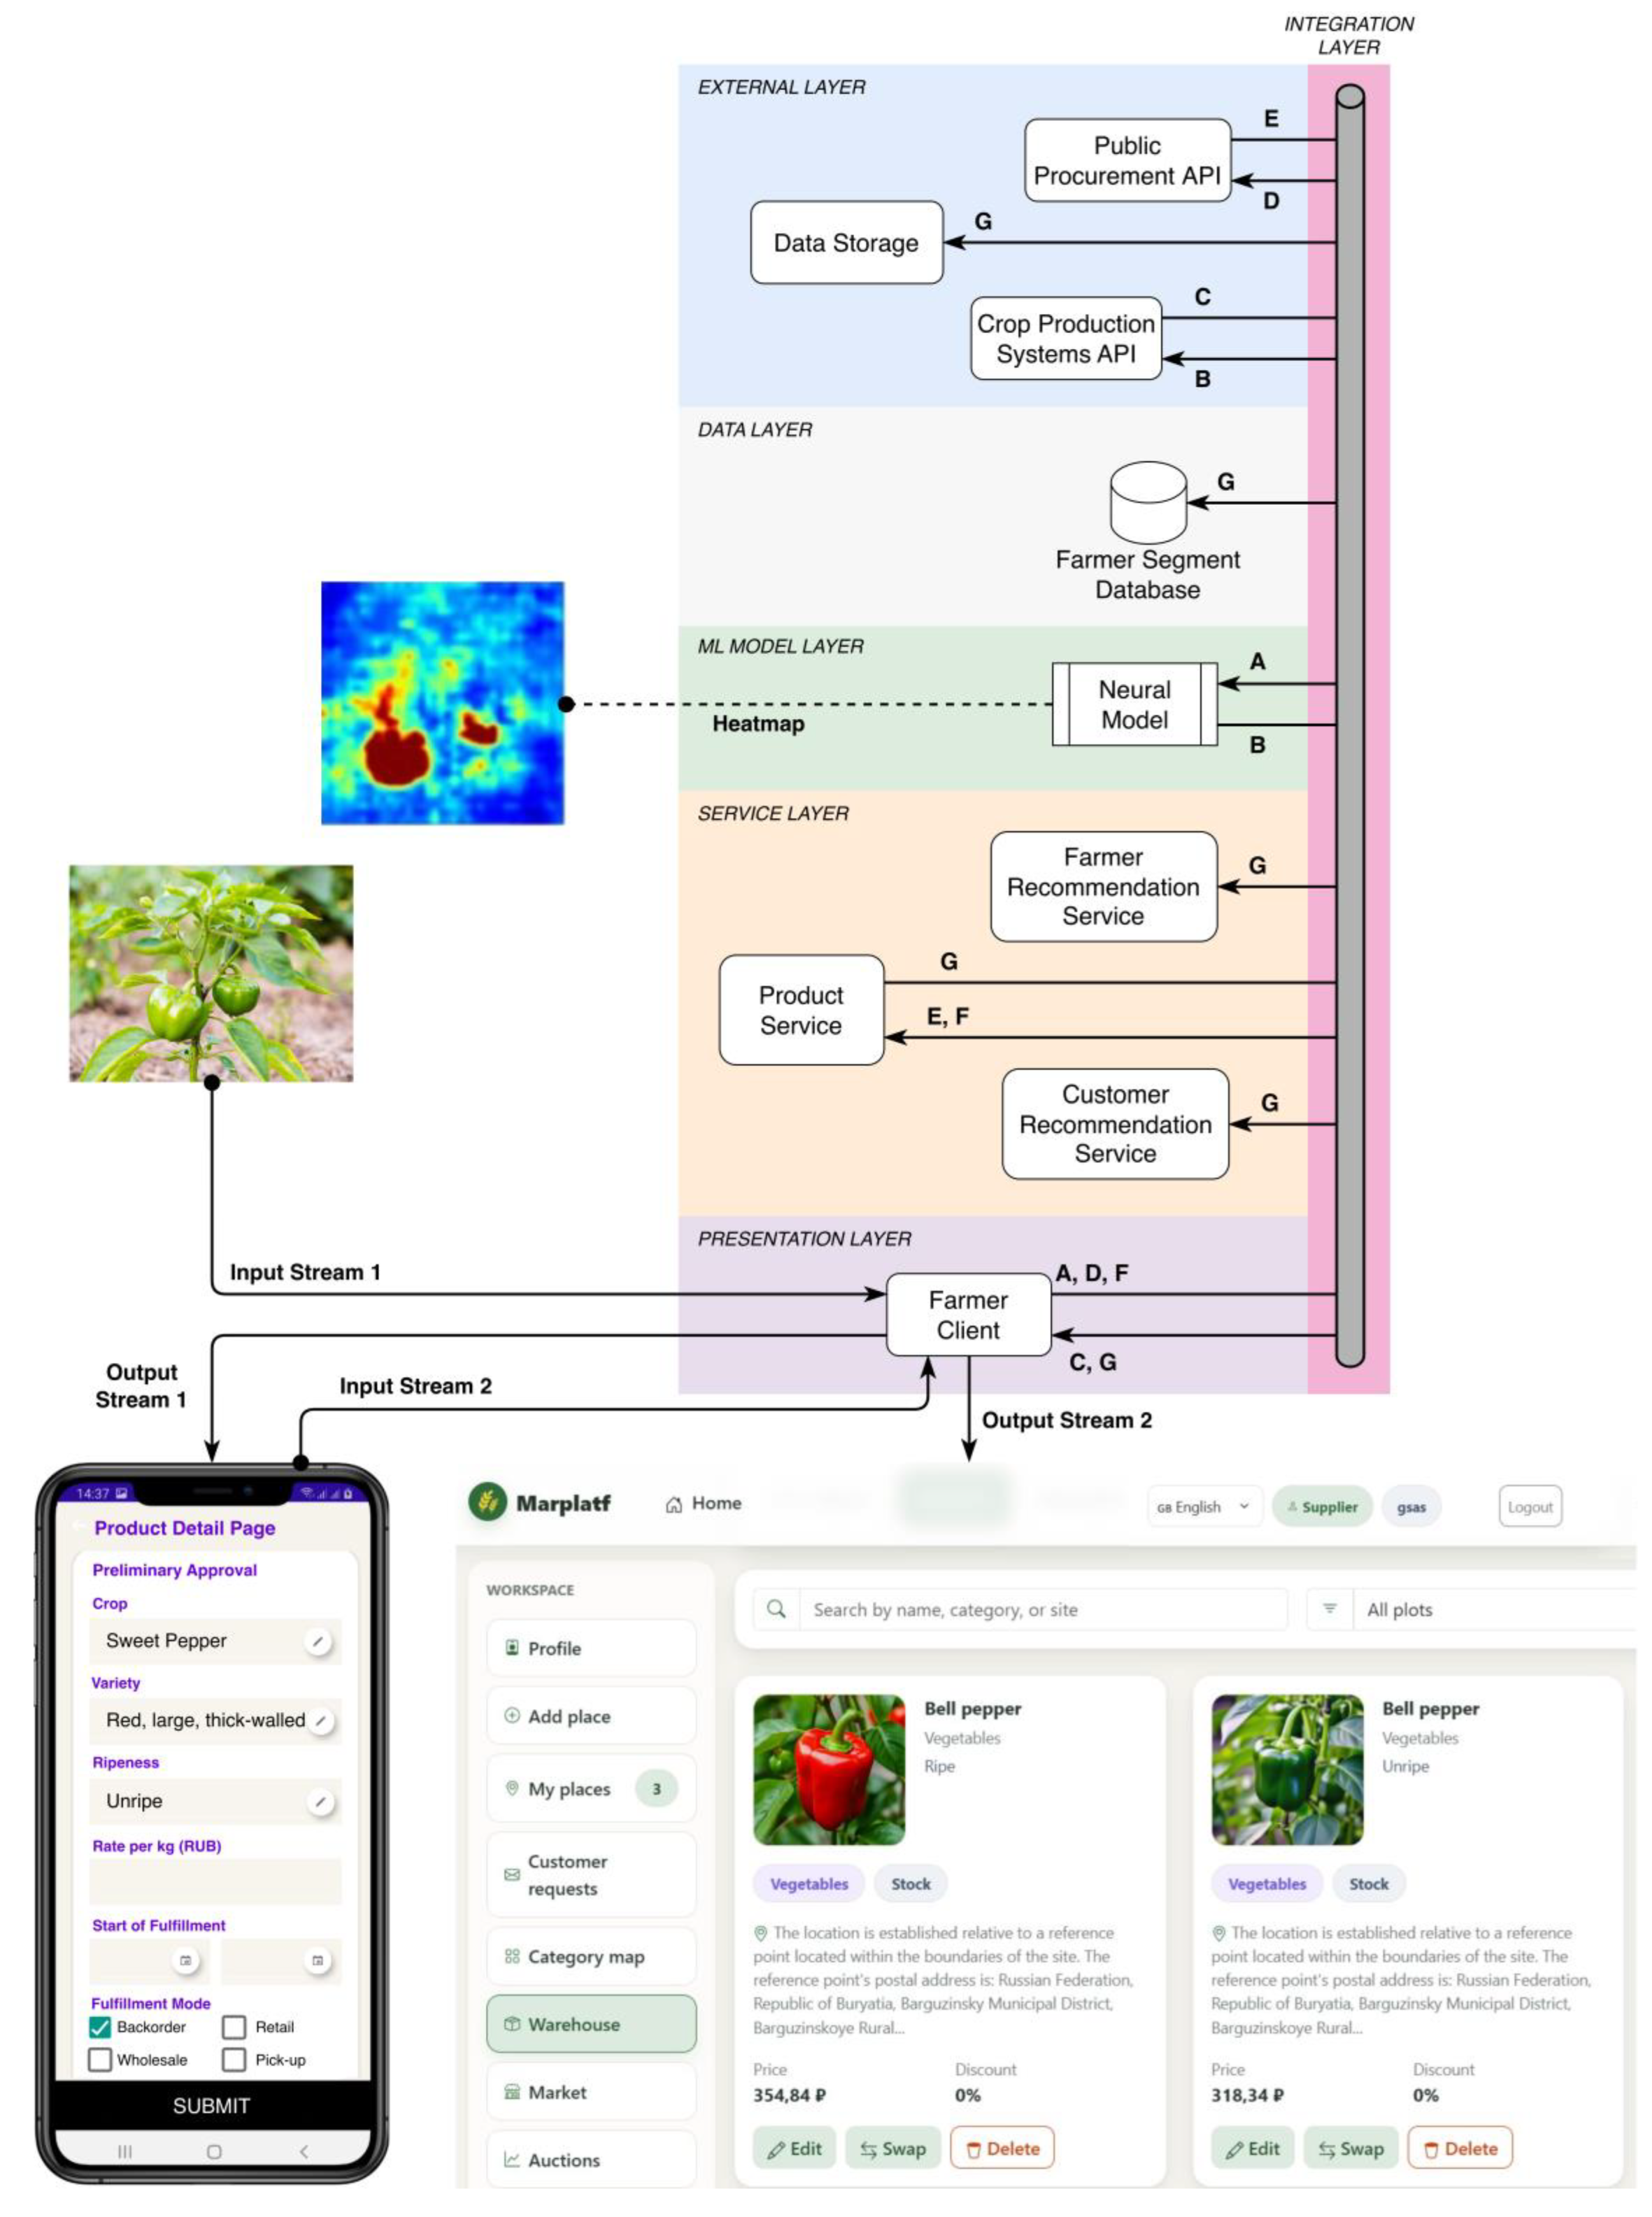
Figure 14.
Auction organization interface in the personal account of a user with the “Farmer” function
Figure 14.
Auction organization interface in the personal account of a user with the “Farmer” function
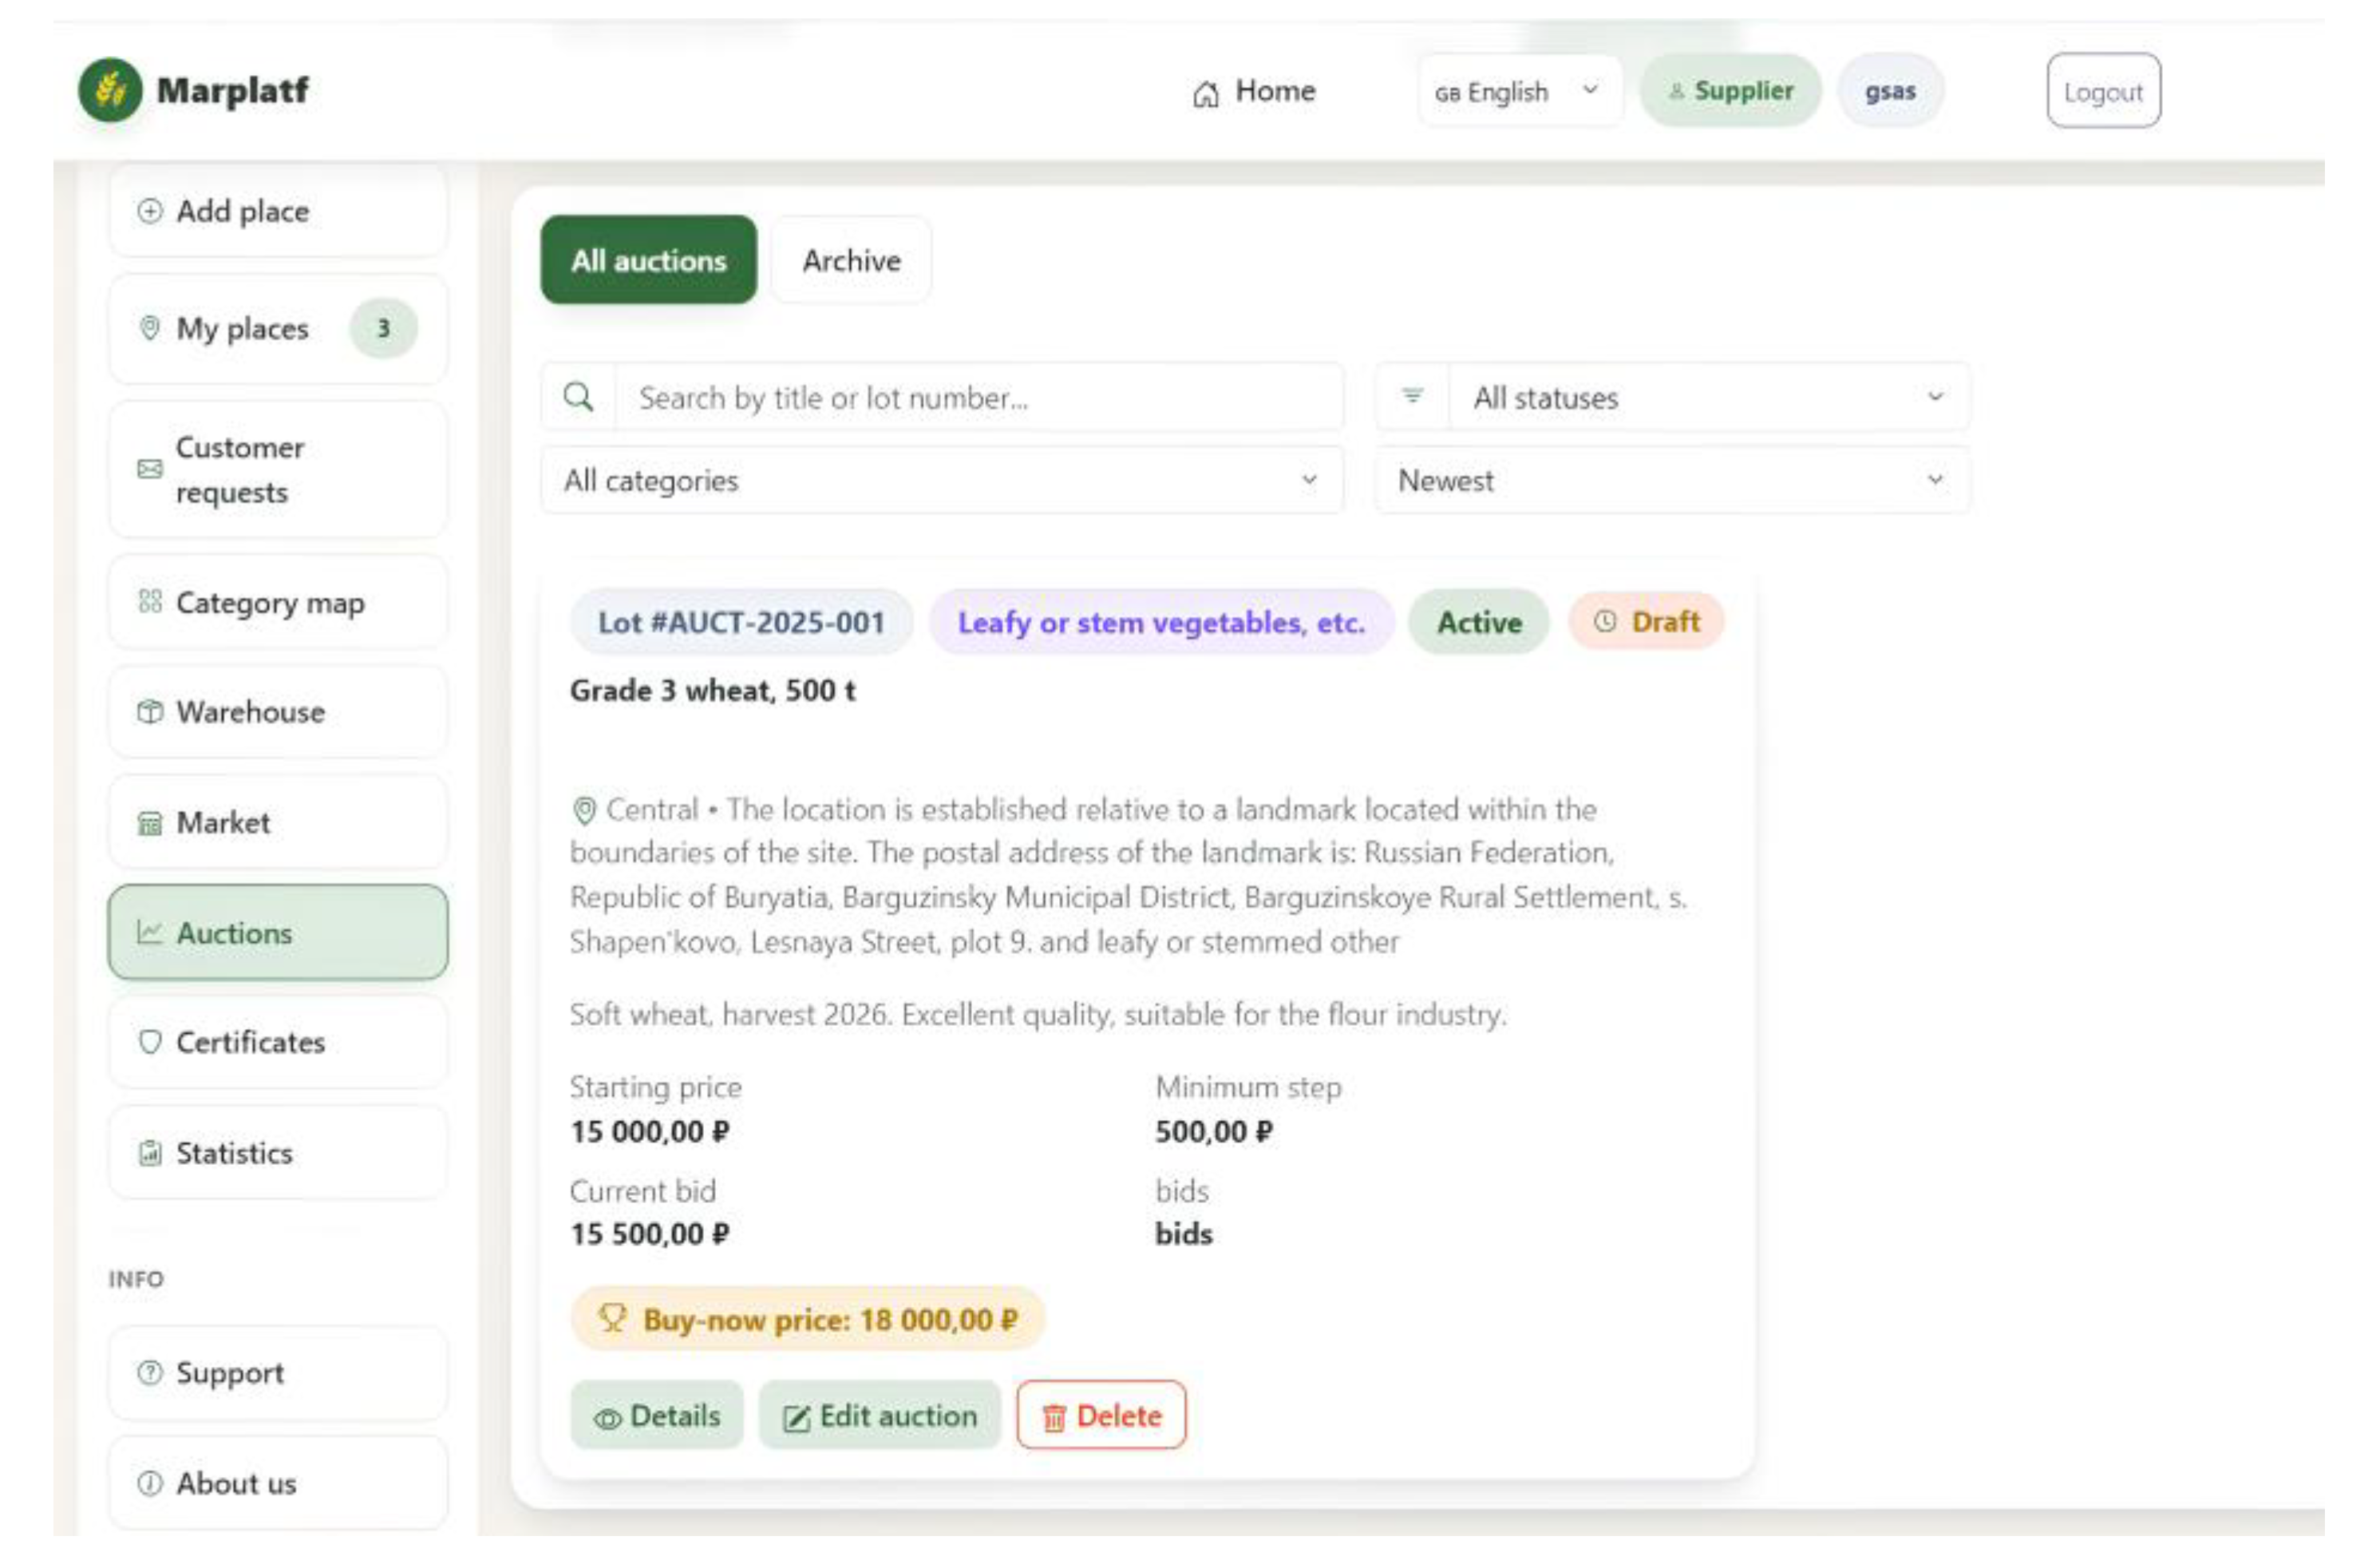

Table 1.
Characteristics of the user's software and hardware in a digital system
| Characteristics | Minimum requirements | |
| Mobile application or mobile version | Browser on a personal computer | |
| RAM | 2 GB. 4 GB For interactive maps. | 8 GB |
| Processor | Quad-core processor with a frequency of at least 1.5 GHz. | Dual-core processor (e.g., Intel Core i3 or AMD Ryzen 3) with a frequency of at least 2.0 GHz |
| Screen resolution | 1280×720 | 1366×768 (1920×1080 Full HD recommended) |
| Internet connection | 3G/4G (LTE) or Wi-Fi. GPS/GLONASS module preferred. | Stable internet connection with a speed of 5–10 Mbps |
| Storage | 500 MB | 2–5 GB of available disk space |
| Operating system | Android: 8.0 (Oreo) and up. iOS: 13.0 and up. |
Windows: 10 or 11 (64-bit).MacOS: 11.0 (Big Sur). Linux: Current Ubuntu or Astra Linux distributions with a graphical shell. |
| Browser | Up-to-date versions of Chrome, Safari, or Yandex Browser with JavaScript and HTML5 support (for mobile version). | Up-to-date versions of Google Chrome, Yandex Browser, Microsoft Edge or Mozilla Firefox |
| Additional (optional) conditions | A camera for identifying product grade and quality. PDF reader for viewing downloaded reports and certificates. |
CryptoPro EDS Browser plug-in for electronic signing of contracts. Adobe Acrobat Reader or built-in browser tools for viewing documents. A spreadsheet and document management package (Microsoft Office, LibreOffice, or MyOffice) for analyzing downloaded data. |
Table 2.
Specification of the software and hardware complex of the digital system in the minimum configuration
Table 2.
Specification of the software and hardware complex of the digital system in the minimum configuration
| Component | Technical requirement | Purpose |
| Server | x86-64 architecture, at least 2 processors (16 cores / 32 threads total), base frequency from 2.5 GHz | Service Layer and Business Logic Support |
| RAM | 64 GB DDR4/DDR5 ECC with error correction | Integration Layer Operation and Caching |
| Storage | 2×960 GB NVMe SSDs in RAID 1 (Mirror) | High-Speed Access to the Data Layer |
| GPU | NVIDIA A2 or T4 (16 GB VRAM) with CUDA/Tensor core support | ML Model Layer Inference and Operation |
| Network Interface | 2×10 GbE SFP+ (channel redundancy) | Data Exchange with the External Layer and High Bus Throughput |
| System Software | Linux 64-bit (Ubuntu Server 22.04 LTS / RHEL 9) | Base Operating Environment |
| Virtualization Environment | Docker Engine 24.0+, Kubernetes (K8s) or K3s | Isolation and Deployment of System Microservices |
| DBMS and Brokers | PostgreSQL 15+, Redis 7+, Apache Kafka / RabbitMQ | Implementation of Data Layers and the Service bus |
| Power Supply | Two independent power supplies (hot-plug) with a minimum capacity of 750W each | Security |
Table 3.
Characteristics of the layers of the neural network model
| Level | Number of layers | Features by type | Characteristics |
|---|---|---|---|
| Initial Layers | 4 | Low-level (edges, corners, color) | Primary processing for dimensionality reduction and feature extraction: convolution with a large kernel to cover large regions (Conv7×7); data normalization to speed up training (BatchNorm); activation to introduce nonlinearity (Relu); reduction of the spatial dimension of the feature map (MaxPool3×3). |
| Layer1 | 14 | Basic textures | 64 different feature maps are created to preserve image detail. Convolutional layers (Conv3×3) capture local textures and shapes. After each convolution, batch normalization (BatchNorm) and negative value zeroing are performed to model complex nonlinear dependencies (Relu). The use of skip connections ensures that the original pixel and gradient data is preserved for deep learning without training loss. |
| Layer2 | 16 | Complex patterns | The channel scale is reduced and the channel depth is doubled. The feature map resolution is halved vertically and horizontally. Increasing the number of channels is used to recognize complex image elements (roundness, curves, textures, etc.). A special convolution adjusts the size and number of channels of the input signal to the output (Down SampleConv) and normalizes it (Down SampleBN) for subsequent summation (Add skip connection). To refine and consolidate the obtained features, a series of 3×3, BatchNorm, and Relu convolutions are run. |
| Layer3 | 16 | Partial objects | The spatial size of the feature map is halved to increase the receptive field of subsequent filters on the original image. A chain of convolutions and a parallel path convert the 128 input channels to 256 output channels for subsequent summation. Preparation and refinement for final processing occur. Isolated features are assembled into unified concepts. |
| Layer4 | 16 | Whole objects | Maximum level of abstraction. Data is transformed from 256 channels to 512, scaled down, and features are refined before being passed to the classifier. |
| Fully connected | 2 | Aggregated features | Global average pooling transforms 7×7×512 spatial feature maps into a 512-dimensional feature vector. The Flatten operation creates a one-dimensional representation. |
Disclaimer/Publisher’s Note: The statements, opinions and data contained in all publications are solely those of the individual author(s) and contributor(s) and not of MDPI and/or the editor(s). MDPI and/or the editor(s) disclaim responsibility for any injury to people or property resulting from any ideas, methods, instructions or products referred to in the content. |
© 2026 by the authors. Licensee MDPI, Basel, Switzerland. This article is an open access article distributed under the terms and conditions of the Creative Commons Attribution (CC BY) license.
Copyright: This open access article is published under a Creative Commons CC BY 4.0 license, which permit the free download, distribution, and reuse, provided that the author and preprint are cited in any reuse.