

Submitted:
19 May 2026
Posted:
20 May 2026
You are already at the latest version
Abstract
Previous studies on rats showed a deterioration of left ventricular (LV) function and myocardial injury characterized by oxidative/nitrosative stress, PARylation, and apoptosis in the heart after three days of hypoxia. In the present study on rats, we investigated whether a three-day recovery period in normoxia can reverse myocardial injury and dysfunction. Further, we studied the effects of norepinephrine (NE) administration as a model of strong sympathetic activation on hypoxia-induced LV dysfunction and myocardial damage, as well as their reversibility. Three days of normobaric hypoxia (10% O2) significantly decreased LV systolic function. Contrary to our expectations, NE infusion even aggravated the depression in LV function. These dysfunctions were completely reversed after three days of normoxic recovery. In contrast, nitrotyrosine as a marker of oxidative/nitrosative stress receded only partially, and poly-ADP-ribose (PAR) increased even further during the recovery period. Apoptosis-inducing factor receded at least partially indicating that PAR-related apoptosis (parthanatos) is not a major cause of hypoxia-induced LV dysfunction. Additional administration of NE mildly aggravated oxidative/nitrosative stress but did not significantly intensify PARylation and consequently, parthanatos. The findings demonstrate that hypoxia-induced LV dysfunction is reversible suggesting that subchronic hypoxia and subsequent reoxygenation has a better prognosis for the LV than classical ischemia/reperfusion injury.
Keywords:
hypoxia/reoxygenation
; norepinephrine
; cardiac function
; left and right ventricular catheterization
; oxidative/nitrosative stress
; nitrotyrosine
; PARylation
; parthanatos
; apoptosis-inducing factor
1. Introduction
Stays in hypoxic environments, e.g., at high altitudes or in rooms with low oxygen content, are a challenge to all organs and tissues. A low arterial oxygen partial pressure (paO2) leads to poor oxygen supply to the tissues and energy depletion, which can ultimately result in reduced organ function. The heart is a high-energy consuming organ and absolutely dependent on aerobic energy production. Even minor reductions in oxygen availability lead to changes in heart function, which then — due to impaired circulation— affect other organs further reducing their oxygen supply. Previous studies on rats showed a significant decrease of cardiac pump function after three days of normobaric hypoxia at 10% O2 as indicated by significant reductions in left ventricular systolic peak pressure (LVSP) and left ventricular (LV) contractility, heart rate (HR), stroke volume (SV), and cardiac index (CI) [1]. The decrease in LVSP and LV contractility became significant as early as after 6 h of hypoxia exposure, while CI remained unaltered during the first 16 h of hypoxia exposure and only began to decline after 24 h [2]. Prolonged exposure to hypoxia over 6 days further deteriorated CI due to a further reduction in HR despite a recovery of LVSP and LV contractility [3].
In contrast, acute hypoxia in humans is associated with an increase in cardiac output resulting from tachycardia in combination with unchanged stroke volume [4,5,6]. The stroke volume can be maintained by improved LV twist mechanics as has been demonstrated in echocardiographic studies [6,7,8]. This improvement in cardiac function is considered to result from sympathetic activation, which is stimulated by peripheral chemoreceptors [9,10]. In the first hours of hypoxia, the hypoxia-induced systemic vasodilation tends to override sympathetic vasoconstriction. Consequently, the total peripheral resistance (TPR) decreases and the blood pressure in the systemic circulation remains largely constant or rises only slightly [10,11,12].
One possible reason for the significant decline in LV systolic function in rats under hypoxia could be that sympathetic activation is only weak. This was indicated by only insignificant increases in serum norepinephrine (NE) and epinephrine concentrations in rats exposed to hypoxia for up to 24 h. Moreover, additional adrenergic blockade only slightly reduced LV systolic pressure and contractility, HR and cardiac output compared to hypoxia without adrenergic blockade [2]. After three days of hypoxia, however, β-adrenergic blockade (alone or on combination with α1-adrenergic blockade) induced a significant reduction of LV contractility, SV, HR and CI [1]. Studies on humans have shown that sympathetic activation increases considerably with longer exposure to hypoxia [13,14]. It is noteworthy, however, that hypoxia also increases NE clearance [9] and induces downregulation of β-adrenergic receptors [15], which may attenuate the effects of sympathetic activation and thus prevent recovery of LV function.
Another reason for the LV depression in hypoxic rats can be found in the restricted metabolic situation due to the reduced oxygen supply. Under hypoxic conditions, most cells, including cardiomyocytes, shift their metabolism towards reduced mitochondrial respiration and increased anaerobic glycolysis resulting in a reduced production of adenosine triphosphate (ATP) [16,17,18]. Further, hypoxia impairs mitochondrial electron transport, leading to increased production of reactive oxygen species (ROS) such as superoxide anions. Several mechanisms are involved in mitochondrial ROS production that are mediated both by hypoxia directly and by hypoxia-inducible factor (HIF) signaling pathways, of which HIF-1 is the most important [19,20]. ATP deficiency exacerbates mitochondrial ROS formation by an increase in intracellular calcium concentration. This calcium increase causes a mitochondrial calcium overload and leads to severe mitochondrial dysfunction, massive exacerbation of energy depletion and ROS production and finally, cell demise [21,22]. In addition, hypoxia increases the expression of inducible nitric oxide (NO) synthase and consequently, NO synthesis [23]. When excessively produced NO binds to the superoxide radical, the highly cytotoxic reactive nitrogen species (RNS) peroxynitrite is formed [24]. Peroxynitrite causes oxidation and nitration of numerous proteins and lipids. As it is a short-lived and highly reactive oxidant, it is difficult to detect, but nitrotyrosine (NT), the stable product of peroxynitrite-mediated tyrosine nitration, is established as a relevant biomarker of oxidative/nitrosative stress [25]. Besides exacerbation of oxidative damage to mitochondrial proteins and membranes, peroxynitrite induces DNA injuries including single strand breaks [26]. These DNA injuries activate energy-consuming repair mechanisms including the ribosylation of poly-adenosine diphosphate (ADP) forming poly-ADP-ribose (PAR), which is also triggered by peroxynitrite [27]. In cases of severe DNA damage and pathological stress, overexpression of PAR polymerase (PARP)-1 causes excessive production of PAR, which releases apoptosis-inducing factor (AIF) from the mitochondria. AIF then translocates to the nucleus, where it induces extensive DNA fragmentation leading to cell death [27,28,29]. This pathological mechanism, designated as parthanatos, plays a key role in tissues with high metabolic activity, such as the heart, and is involved in numerous cardiovascular diseases such as myocardial ischemia/reperfusion (I/R) injury and heart failure [30,31]. Unlike classical apoptosis, parthanatos does not depend on the activation of specific “death proteins” such as caspases. Instead, it utilizes pleiotropic proteins that perform essential functions under physiological conditions such as PARP-1, an important signaling molecule initiating DNA repair processes [32], or AIF, which is involved in normal mitochondrial respiration [28]. In cases of extreme cellular stress, this pathway is hyperactivated and then functions as an emergency program to eliminate the damaged cells. Studies on rats exposed to normobaric or hypobaric hypoxia showed increased ROS/RNS generation in the myocardium [33,34]. Further, a previous study on rats exposed to normobaric hypoxia over three days showed a significant increase of NT, PARP-1, PAR, and AIF in the heart [1] indicating that this pathway is also implicated in the myocardial injury induced by exposure to systemic hypoxia. Strong sympathetic activation or administration of high doses of NE can also increase formation of ROS/RNS, activate PARP-1 and induce apoptosis and necrosis [35,36,37,38], which may further promote the hypoxic myocardial damage.
The main aim of the present study was to study the effects of a three-day normoxic recovery on cardiac function and of markers of hypoxic myocardial injury. As ischemia-induced damage to myocardial cells is often deteriorated after reperfusion [39,40,41], we hypothesized that oxidative/nitrosative stress and the associated myocardial damage including parthanatos might persist after return to normoxia. This leads to the second question as to whether heart function improves or remains impaired after reoxygenation. The third question was related to the contribution of NE administration to myocardial function and myocyte injury with particular focus on oxidative/nitrosative stress, PAR formation and AIF release. Here, we hypothesize that NE administration would aggravate hypoxia-induced myocardial damage and parthanatos. Finally, we investigated whether and to what extent myocardial function and myocardial injury recede after this treatment followed by three days of normoxic recovery and withdrawal of NE.
2. Materials and Methods
2.1. Animal Model
All experiments were performed on 98 female Sprague–Dawley rats supplied by Charles River (Sulzfeld, Germany). At the beginning of the study, the body weight (BW) of the animals was 242.8 ± 1.9 g, corresponding to an age of about 10–12 weeks. All animal protocols were approved by the Federal State Agency (Landesdirektion Sachsen, protocol number TVV 46/18). The experiments were conducted in accordance with the Guide for the Care and Use of Laboratory Animals published by the National Institutes of Health and with the “European Convention for the Protection of Vertebrate Animals used for Experimental and other Scientific Purposes” (Council of Europe No 123, Strasbourg 1985).
2.2. Study Protocol
Animals were divided at random into two cohorts for exposure to normoxia (N, n = 50) or normobaric hypoxia (H, n = 48). The animals were housed in individual cages, which were placed in a chamber sized 65 x 105 x 50 cm. This chamber was ventilated either with ambient air (for normoxic animals) or with a gas mixture containing 10% oxygen in nitrogen (for animals exposed to hypoxia). A special equipment prevented ambient air from entering the chamber during manipulations on the animals, thus maintaining a stable oxygen concentration of 10 ± 0.5% inside the chamber. All animals received an intravenous infusion over the total experimental time with automatic pumps (Infors AG, Basel, Switzerland) at a rate of 0.1 mL h−1 via an infusion catheter (Vygon, Aachen, Germany). Both the normoxic and hypoxic cohorts were randomly subdivided into two groups, which were infused with either 0.9% sodium chloride (NaCl) solution or with NE (0.1 mg kg−1 h−1). This first phase of the experiment, the intervention period, lasted 72 h; after that, the experiment ended for a part of the animals of those 4 groups. These four subgroups were referred to as N-NaCl (n = 14), H-NaCl (n = 18), N-NE (n = 14), H-NE (n = 10). For the remaining animals, the intervention period was followed by a 72-hour recovery period during which they remained in normoxia and were infused with NaCl. These animals were labeled as N-NaCl+R (n = 8), H-NaCl+R (n = 8), N-NE+R (n = 14) and H-NE+R (n = 12) (Figure 1). The transition to the recovery period did not require any direct manipulations to the animals.
At the beginning of the experiment, we inserted the infusion catheter into the left jugular vein under anesthesia with 2% isofluran. The exposure to the hypoxic environment started immediately after catheter insertion. After that, the animals woke up and moved freely with access to tap water and a rat chow diet (Altromin C100, Altromin GmbH, Lage, Germany). The oxygen concentration in the chamber as well as sufficient availability of food and drinking water were checked regularly.
2.3. Hemodynamic Measurements
About 50 min before the end of the experiment, the animals were anesthetized with an intraperitoneal injection of thiopental (Trapanal® 80 mg kg−1). The animals were weighed to calculate the BW difference over the experimental period. Once a sufficient depth of anesthesia had been achieved, as verified by testing the foot-withdrawal reflex, we performed a tracheotomy and placed a polyethylene cannula into the trachea. First, the right ventricle (RV) was catheterized with a Millar® (Millar Instruments, Houston, TX, USA) ultraminiature catheter pressure transducer via the right internal jugular vein. After measuring RV hemodynamics, a pressure-volume catheter (Millar Instruments, Houston, TX, USA) was inserted into the left ventricle (LV) via the right carotid artery. Data acquisition and analysis were performed with Power Lab and Lab Chart Software from ADInstruments (version 8.1.9, ADInstruments Europe/UK, Oxford, UK) and a modified LabChart Software (version 1.0) from the ADInstruments sales department (FMI Föhr Medical Instruments GmbH, Seeheim, Germany). Parallel conductance was corrected by injection of 0.1 ml of 0.9% NaCl solution, and stroke volume (SV) was calibrated by the thermodilution method. The following variables were measured in RV and LV: systolic peak pressures (LVSP, RVSP), heart rate (HR), and the maximum rate of pressure increase (LV dP/dt max, RV dP/dt max) or decrease (LV dP/dt min, RV dP/dt min) as measures of ventricular contractility and relaxation, respectively. In the LV, we further determined stroke volume (SV), ejection fraction (EF), stroke work (SW) as well as end-diastolic pressure (LV edP) and volume (LV edV). After withdrawing the LV catheter tip into the aorta, diastolic aortic pressure (DAP) was measured to calculate mean aortic pressure (MAP). The cardiac index (CI, body mass-related cardiac output) was determined by thermodilution using a thermosensitive 1.5F microprobe and a Cardiomax II computer (Columbus Instruments, Columbus, OH, USA). Total peripheral resistance (TPR) was calculated by dividing MAP by CI.
Animals of the H-NaCl and H-NE groups remained in hypoxia until the completion of hemodynamic measurements.
2.4. Sampling of Materials
After termination of the hemodynamic measurements, the abdominal cavity was opened by midline incision. Animals were sacrificed by drawing blood from the abdominal aorta. A small sample of aortic blood was used for oximetry and blood gas assessment, which were performed using a blood gas analyzer ABL800 BASIC (Radiometer Medical ApS, Brønshøj, Denmark). We measured the arterial saturation of oxygen (SaO2), the partial pressures of oxygen (pO2) and carbon dioxide (pCO2), the pH, the concentration of lactate (cLac), the concentrations of potassium (cK+) and sodium (cNa+) as well as the concentration of hemoglobin (cHb) and the hematocrit (Hct).
The heart was then excised, and the apex was trimmed off and fixated in formalin for immunohistochemical analyses. Finally, we weighed the feed residues to determine the total feed consumption and to calculate the daily feed intake of the animals. Drinking water consumption was measured every day in all animals that were in the experiment for 6 days, meaning those that had completed both the intervention and recovery phases. This allowed us to directly compare the water intake during the two experimental phases in the same animals.
2.5. Immunohistochemistry
Immunohistochemical analysis was applied to determine markers of oxidative/nitrosative stress (NT), for DNA damage and its repair (PAR), and for the PAR-induced apoptosis (AIF) in the heart. We cut 2 μm thick sections of the cardiac apex. These slices were dewaxed, rehydrated, cooked in 0.01 M citrate buffer (pH = 6) and then blocked with bovine serum albumin to saturate unspecific bindings. The specimens were treated with the primary antibodies overnight at 4 °C. For the determination of NT, we used mouse monoclonal anti-nitrotyrosine primary antibody (1 mg/mL, product number = MAB5404; Merck-Millipore, Darmstadt, Germany). For PAR, the primary antibody was mouse monoclonal antibody IgG2a (1 mg/mL, product number = ALX-804-220; Enzo, Lörrach, Germany), and for determination of AIF, we employed mouse monoclonal antibody IgG (200 μL/mL, product number = sc-13116; Santa Cruz, Heidelberg, Germany). The next day, the specimens were washed, and the horseradish peroxidase-labeled secondary antibody (goat anti-mouse antibody; product number = 12-349; Merck-Millipore, Darmstadt, Germany) was applied for 1 h (AIF and PAR) or 2 h (NT) at room temperature. After another wash cycle, visualization of positive cells was performed with AEC red chromogen (Enzo, Lörrach, Germany). Cell nuclei were counterstained with hemalum.
To conduct the microscopic examination and photography, we used the Axioimager M1 microscope from Zeiss (Carl Zeiss, Jena, Germany) together with an AxioCam MRc 5 camera and Zen Blue 3.1 software (Carl Zeiss, Jena, Germany). For detection of each of the markers, we took at least 50 photographs per animal at 100× magnification (10× through the objective lens, 10× through the eyepiece). The positive areas (in µm2) in the pictures were measured using the program ImageJ [42]. The expression of each marker is given as the positive area related to the total area of the specimen (in percent).
2.6. Statistical Analysis
Statistical analyses were performed using the software package SigmaPlot Version 16.0 (Systat Software GmbH, Erkrath, Germany) for Windows. We applied analysis of variance (ANOVA) procedures to compare all groups against one another. First, we used a Shapiro–Wilk test to ensure normal distribution. If the data were normally distributed, a one-way ANOVA with post hoc tests according to Fisher’s method of least significant differences (LSD) was performed. If the data were not normally distributed, we employed a Kruskal–Wallis ANOVA on ranks with a post hoc test according to Dunn’s method. p values < 0.05 were considered significant.
2.7. Use of Generative Artificial Intelligence (GenAI)
We used GenAI exclusively to assist with literature research while drafting the manuscript.
3. Results
3.1. General Metabolic Situation
Under hypoxia, food uptake was reduced by more than 50% compared to normoxic control animals. Consequently, the H-NaCl animals lost about 5% of their initial body weight (BW) during the days of hypoxia, while normoxic animals kept their BW almost stable. With NE infusion, the BW loss was significantly greater, even in normoxia (about 7%), but even more so in hypoxia (13%). During the 72 h-recovery period, food uptake normalized, and the BW returned to its initial level and remained only slightly below it (Figure 2).
Arterial oxygen saturation (SaO2) and pO2 decreased in hypoxia from 95% to ~80% and from 97 to 87 mmHg, respectively, in the NaCl-infused rats. The acid-base situation shifted in these animals towards a mildly acidotic state with a pH of about 7.35 and a lactate concentration in the blood of 3 mmol/L. pCO2 was slightly reduced to ~33 mmHg indicating mild hyperventilation. With NE infusion, these changes were even more pronounced. SaO2 was already ~80% in the normoxic NE group and decreased further to ~75% under hypoxia, while pO2 did not further decrease. pH in the N-NE group was normal (7.4), and pCO2 was slightly elevated (46 mmHg). Under hypoxia and NE infusion, both values decreased to 7.33 and 33 mmHg, respectively. Most of these parameters tended to normalize during the recovery period, only pCO2 decreased further in animals that were previously infused with NE (Figure 3 and Table 1).
Three days of hypoxia induced a significant increase in hemoglobin concentration (cHb) and hematocrit (Hct) indicating that acclimatization to hypoxia is taking place. With NE infusion, both parameters were slightly elevated already in normoxia, but further increased under hypoxia to a similar level as with NaCl infusion. After three days of normoxic recovery, they showed a tendency to return to normal levels, but not a complete normalization. However, also serum potassium (cK+) and sodium concentrations (cNa+) increased during the hypoxic period and reverted after three days of recovery (Figure 4). It should be noted that the animals reduced their daily fluid uptake during the period of hypoxia by about 50%, but compensated for this during the days of recovery. With NE infusion, the daily fluid uptake was even mildly increased in normoxia, but also decreased significantly under hypoxic conditions. During recovery, the daily fluid uptake increased even further in the formerly normoxic NE animals. However, in the previously hypoxic animals, the fluid uptake per day reached levels more than three times as high as those during the intervention period (Figure 5).
3.2. Hemodynamic Results
Hemodynamic data are presented in Figure 6 and Table 2. Exposure to hypoxia deteriorated LV systolic function as indicated by a significant decrease in LVSP, LV dP/dt max and SW. HR was also significantly reduced. SV, EF and CI decreased by 12-16% (n.s.). A reduction of LV dP/dt min and an increase of LV edP demonstrate that LV diastolic function was compromised as well. In contrast, RV function was not impaired at all. On the contrary, RVSP and RV dP/dtmax were actually slightly improved by about 10%. The TPR was slightly but not significantly reduced.
NE infusion further aggravated the LV depression even in normoxia, but even more so under hypoxic conditions. LVSP decreased significantly by about 25%, and consequently, SV, SW and CI also decreased significantly by about 40-50% compared to the N-NaCl group. LV edP decreased in N-NE rats, but increased in the H-NE group by more than one third above the level in N-NaCl animals. This increase was associated with an increase in TPR to almost 150% of that in the N-NaCl group.
After a three-day period of normoxic recovery with NaCl infusion, most of the hemodynamic parameters were restored to the levels of the N-NaCl group or even exceeded them. Only HR and consequently, CI remained slightly reduced in the previously NE-infused animals.
3.3. Immunohistochemical Results
Hypoxia induced oxidative/nitrosative stress in the heart as indicated by significant increase in NT. NE infusion, however, increased NT to almost the same level even in normoxia and increased it further under hypoxic conditions. Three days of recovery completely restored the NT levels in the animals that had only received NaCl infusion. Of note, in rats kept in normoxia with NaCl infusion over six days, the NT values were even lower than after three days of this treatment. In contrast, no decrease in the NT levels was observed after the recovery phase in those animals that were previously infused with NE (Figure 7).
Moreover, we found a significant increase in the levels of PAR under hypoxia. The extent of hypoxic PARylation was in a similar range with NaCl and with NE infusion. After the recovery period, the PAR levels receded in the animals previously exposed to NE plus hypoxia, but they increased even further in those animals that had received NaCl during the intervention phase (Figure 8).
Finally, we observed a significant increase in AIF under hypoxia in NaCl-infused rats, which completely regressed after three days of normoxic recovery. With NE infusion, however, AIF was significantly elevated even in normoxia and did not further increase under hypoxic conditions. In the recovery period, the AIF levels declined slightly in the formerly hypoxic animals, but increased even more in animals that were previously exposed to NE and normoxia. Of note, we found that AIF was predominantly distributed in the cytoplasm rather than in the nucleus (Figure 9).
4. Discussion
4.1. General Metabolic Situation
Exposure to a hypoxic environment with atmospheric O₂ levels or pO₂ values that are only half those found at sea level leads to arterial hypoxemia, resulting in insufficient oxygen supply to the tissues. This, in turn, means that the body must increasingly rely on anaerobic glycolysis to meet its energy needs [18,43]. The accumulation of lactate leads to metabolic acidosis. Both hypoxemia and metabolic acidosis cause an increase in ventilation, which counteracts the acidosis. In awake rats, the mean arterial pH (pHa) is slightly higher at 7.47 ± 0.02, while the mean arterial pCO₂ is slightly lower at 34.5 ± 3.0 mmHg than in humans [44]; the values observed in the N-NaCl group thus correspond well to these normal values. In contrast, pH values of 7.35 or even lower, as measured in the hypoxic animal groups (H-NaCl; H-NE), together with the elevated lactate levels, indicate metabolic acidosis. The pCO₂ levels of approximately 33 mmHg measured in these groups are slightly diminished, indicating mild hyperventilation, which is caused by hypoxia on the one hand, but also represents a respiratory compensation for metabolic acidosis. After 3 days of normoxic recovery, pH values have shifted toward alkalosis, which may result from hyperventilation that persists after return to normoxia as part of a deacclimatization reaction [45]. This post-hypoxic hyperventilation largely subsides within 24 h [46], which could explain the normal pCO2 levels in the H-NaCl group. As hypoxia-induced sympathetic activation also persists over several days after return to normoxia [14], we would expect that hyperventilation during the recovery phase following NE infusion will be prolonged and more pronounced than after NaCl infusion, resulting in a significant reduction in pCO₂ levels in the NE+R groups.
Despite the reduced energy supply, appetite and food uptake are reduced under hypoxic conditions [47], and this has also been observed in travelers to high altitude [48,49]. We assume that reduced feed and water intake are major causes for the BW loss of hypoxia-exposed animals. However, there must be other factors contributing to the BW loss as also demonstrated by a comprehensive meta-analysis [50]. While under NE infusion, food intake was only little (in normoxia) or not at all reduced (in hypoxia) compared to the respective NaCl groups, BW loss was significantly greater than with NaCl infusion. We suspect that increased physical activity and stress in NE-infused rats are the reasons for the greater BW loss of these animals, a conclusion supported by the greater BW loss in humans during exposure to moderate or high altitudes combined with physical activity compared to physical inactivity [50]. Another factor contributing to the reduction in BW is a reduction in plasma volume [51,52]. A reduced plasma volume means a reduced load for the heart, which improves oxygen supply to the tissues while at the same time reducing the strain on the heart. The main mechanism of this hypoxia-induced fluid loss is increased urine excretion, also referred to as acute hypoxic diuretic response [53,54], but it is enhanced by reduced fluid intake [51], as we also observed in the animals of the present study during hypoxia exposure. Plasma volume reduction is an early response during adaptation to high altitude or systemic hypoxia that can already exceed 10% within the first 24 hours [52] and thus contribute to an early increase in cHb and Hct. A sustained increase in O₂ transport capacity is triggered by the increase in erythropoiesis mediated by HIFs and erythropietin and begins after a few days of hypoxia [55,56]. The elevated values of cHb, Hct, cK+ and cNa+, combined with reduced water intake in the hypoxic animal groups demonstrate that these adaptive responses also occurred in the hypoxic animals of the present study. An earlier study in rats exposed to hypoxia for 6 days demonstrated that cHb continues to rise significantly with prolonged exposure to hypoxia [3].
4.2. Hemodynamic Situation
Previous studies revealed that hypoxia significantly impairs LV systolic function, as reflected in reduced values of LVSP, LV dP/dt max, MAP, DAP, SV, SW, and CI. LV depression starts after just 6 hours of hypoxia exposure and persists with continued hypoxia [1,2], as confirmed by the results of the present study. This functional impairment is largely based on an energetic depletion of myocardial cells resulting from the shift in their energy metabolism to anaerobic glycolysis, which is less ATP-efficient [16,18,57]. LV diastolic function is generally even more sensitive than systolic function to a lack of energy, as the return of Ca2+ from the cytoplasm to the sarcoplasmic reticulum is delayed, and this impairs LV relaxation [58]. The resulting increase in stiffness is reflected in the increased LV edP in the hypoxic animals in this study. In addition, oxidative and nitrosative stress and apoptosis cause myocardial damage [1], which further impairs myocardial function, as discussed in more detail below. The reduction in SV is exacerbated by hypovolemia, which leads to diminished venous return and reduced end-diastolic filling [59]. A decrease in HR, which is promoted by elevated cK+ in the blood, also contributes to the deterioration of LV function [60]. An earlier study in rats exposed to hypoxia for up to 24 hours showed that the hypoxia-induced sympathetic activation was relatively weak and thus could not compensate for the functional impairments caused by hypoxia [2]. In contrast, RVSP was not impaired under hypoxic conditions but actually increased slightly, even though hypoxia-induced myocardial damage due to oxidative/nitrosative stress, PARylation, and apoptosis was similarly pronounced in both the RV and LV [1]. One possible cause of the slightly elevated RVSP could be hypoxic pulmonary vasoconstriction, since the resulting increase in pulmonary vascular resistance requires the RV to generate higher pressure. In the systemic circulation, however, TPR did not increase because hypoxia has a vasodilatory effect on systemic arteries [61]. Due to the lower pressures in the pulmonary circulation, the systolic work of the RV is only about 1/5 to 1/7 of the stroke work of the LV, so that hypoxic myocardial damage has a less pronounced effect on the pumping function of the RV than on that of the LV. Another explanation for the different responses of the two ventricles to hypoxia can be found in the differing densities of adrenergic receptors between LV and RV and their response to hypoxia [62]. In addition, transcriptomic studies have shown that under hypoxic conditions, numerous genes are expressed at higher levels in the RV than in the LV, suggesting that the RV may be better adapted to hypoxic conditions than the LV [63].
However, a weak hypoxic sympathetic activation cannot be the sole explanation to account for the hypoxic LV depression. Even with additional NE infusion, systolic LV function did not improve. Although the decline in HR was prevented, SW, SV and CI actually decreased even further under hypoxia plus NE infusion. In contrast, sympathetic vasoconstrictor effects were clearly pronounced, as reflected in the increase in TPR. This may also have contributed to the depression of LV systolic function under NE infusion. These findings are in line with observations in humans at high altitude [10]. Diastolic function also further deteriorated with NE administration and hypoxia, as evidenced by the significantly increased LV edP. We assume that a lack of energy is the primary cause of the deterioration in LV function in this context, since the administration of NE disproportionately increases myocardial oxygen consumption—a phenomenon also known as the “oxygen-wasting effect of norepinephrine” [64]. This effect is already evident in normoxia, as evidenced by reduced values of SW, SV, and CI, and becomes even more pronounced under hypoxia. The increased NE clearance under hypoxia could be another possible explanation for the reduced LV function despite the NE administration [9]. Additionally, the NE effects decrease with longer duration of infusion due to the downregulation of β-adrenoceptors [65]. Finally, heart cell damage caused by NE also contributes to functional decline. In human pathology, Takotsubo syndrome is a well-known condition in which excessive release of catecholamines leads to nitrosative stress, causing a life-threatening reduction in myocardial contractility that can result in acute heart failure [66,67]. In a rat model, it was demonstrated that injection of the β-adrenergic agonist isoproterenol led to an intramyocardial accumulation of NT at levels approximately four times higher than those in control animals [68]. In contrast, the function of the RV is not impaired by NE administration; in fact, it is slightly improved. This observation has been repeatedly made in earlier rat studies [69,70,71]. One possible explanation for this could be that the distribution of α- and β-adrenergic receptors differs between the two ventricles and is regulated differently in the LV and RV during NE infusion. The NE-mediated regulation of adrenergic receptors in the two ventricles is not identical to the changes in the receptors induced by hypoxia [62].
The assumption that energy depletion is the primary cause of LV depression under hypoxic conditions is strongly supported by the finding that the functional impairment resolved completely upon return to normoxia, that is, once oxygen supply was restored. In the animals that had received NE during the intervention phase, most LV functional parameters also recovered completely. LVSP and LV dP/dt max even rose to levels higher than those of the normoxic control animals. Only HR and CI remained slightly reduced after three days of recovery. This can be explained by several mechanisms. First, a re-expansion of plasma volume following the end of hypoxic exposure can lead to increased ventricular filling. This mechanical stimulus, combined with myocardial damage caused by the preceding hypoxia and NE infusion, can trigger the Bezold-Jarisch reflex, in which stimulation of ventricular mechanoreceptors and chemoreceptors causes an increase in parasympathetic activity and a decrease in sympathetic activity [72,73,74]. Such a shift in the sympatho-vagal balance can also be triggered by desensitization of the arterial baroreflex induced by sustained adrenergic stimulation, e.g., via NE infusion [75,76] and the subsequent rise in LVSP and MAP during the recovery phase [77,78]. Finally, the NE infusion leads to downregulation of β-receptors [65,79], a process that can be further exacerbated by hypoxia [15], resulting in reduced cardiac sensitivity to sympathetic activity after the NE infusion is discontinued.
4.3. Immunohistochemical Signs of Myocardial Damage
In addition to the direct effect of reduced ATP production, cardiac function is also impaired by hypoxia-induced damage to myocardial cells caused by oxidative/nitrosative stress. After three days of hypoxia, the proportion of NT-positive myocardial tissue increased significantly by >50% compared to normoxic animals. This increase in NT was accompanied by even greater increases in PAR and AIF in the myocardium. These data confirm previous findings that hypoxia leads to increased peroxynitrite production, which in turn results in enhanced PARylation and AIF-dependent apoptosis [1]. Furthermore, activation of PARP-1 causes depletion of nicotinamide adenine dinucleotide (NAD+) and ATP, thus further exacerbating myocardial cell stress [27,32].
It is well-known that cardiomyocyte injury not only persists after hypoxia but may paradoxically worsen during reoxygenation due to I/R injury. I/R injury is a typical complication occurring in the treatment of various cardiovascular diseases such as myocardial infarction when myocardial perfusion is restored after a period of ischemia leading to further mitochondrial injury and aggravation of myocardial damage [80,81,82]. While ischemia typically causes more severe, focal cellular damage, hypoxia—in which blood flow is generally maintained—tends to impose a diffuse metabolic burden on tissues and organs. Reoxygenation following prolonged systemic hypoxia can induce oxidative stress, calcium dysregulation, and mitochondrial dysfunction in cardiomyocytes, resembling mechanisms of I/R injury. A study on isolated rat cardiomyocytes demonstrated that reoxygenation after exposure to hypoxia but not hypoxia alone increased mitochondrial calcium concentration and peroxynitrite production [41]. Following ischemia or hypoxia, the production of ROS, including peroxynitrite, increases significantly immediately after reoxygenation or reperfusion and then decreases slightly [83,84,85]. However, peroxynitrite and/or NT levels remain elevated and can be detected in the tissue for hours to several days [86,87]. This increase in ROS/RNS and the resulting damage to mitochondria and DNA lead to the activation of PARP in the reperfused myocardium. Numerous studies in various experimental models involving hypoxia/reoxygenation or coronary artery occlusion/reocclusion have shown that pharmacological inhibition or genetic deletion of PARP significantly improved the outcome of myocardial I/R injury (reviewed in [32]). In the present study as well, PARP-1 activation persisted after three days of normoxic recovery, as evidenced by the continued rise in PAR levels. Typically, I/R injury is associated with a decrease in LV contractile function [82], which was not observed in our results—on the contrary: after three days in normoxia, LV function recovered completely. A key function of PARP-1 is its involvement in the translocation of AIF from the mitochondria to the nucleus, which leads to DNA fragmentation and ultimately to cell death [27,28,29]. However, the animals of the H-NaCl+R group showed a complete return to baseline AIF levels in the heart after three days of normoxia. This may suggest that the damage to myocardial cells caused by hypoxia and subsequent reoxygenation was only moderate. Under moderate genotoxic stress, the activation of PARP-1 facilitates the repair of DNA damage without directly leading to cell death, thereby enabling the survival of the myocardial cell [32,88]. Another possible explanation for the regression of AIF and for its predominantly cytoplasmic localization could involve the activation of anti-apoptotic signals, such as HSP70 or AKT2, which inhibit the translocation of AIF into the cell nucleus [89,90,91]. However, the decrease in AIF despite persistently elevated PAR levels can also be explained by the different temporal dynamics of the two proteins. An elevated PAR level reflects ongoing PARP-1 activity in response to persistent DNA damage, which can remain elevated over time, thus indicating sustained cellular stress. In contrast, AIF release is a transient event that occurs during the early phase of mitochondrial injury [88,92]. At later stages of apoptosis, detectability of AIF can decrease due to clearance of apoptotic cells or relocation of AIF to mitochondria [93,94]. Overall, the results suggest that the reduced oxygen supply and the associated energy depletion and acidosis were the primary mechanisms underlying hypoxia-induced LV depression. The complete recovery of LV function after reoxygenation suggests that oxidative stress, PAR formation and apoptosis did not induce massive myocardial damage.
NE administration led to a significant increase in NT levels even under normoxic conditions, and this effect was further amplified under hypoxic conditions. NT levels did not return to baseline even after three days of recovery under normoxic conditions and NaCl infusion. AIF showed a similar trend: AIF levels were also significantly higher with NE in normoxia than in normoxic control animals and remained at this level after discontinuation of the NE infusion. Only after prior combined exposure to hypoxia and NE infusion did AIF levels decrease slightly. It is well known that hypoxic sympathetic activation at high-altitude persists for several days after returning to normoxia [14]. Prolonged, intense sympathetic activation leads to oxidative stress and apoptosis in the myocardium through persistent stimulation of β1-adrenoceptors, but also via α-adrenergic receptors. In this process, NE activates intracellular signaling cascades that remain active even after NE is withdrawn. These reactive intermediates sustain ROS generation and apoptosis [36,37,95,96]. This pathway mediated by adrenergic stimulation is relevant in numerous cardiac conditions, such as Takotsubo syndrome, heart failure, and I/R injury [67,97,98,99,100]. Interestingly, PAR levels did not rise higher during NE infusion—neither under normoxic nor hypoxic conditions—than in the corresponding NaCl-infused groups. In the H-NE+R group, PAR levels even returned to near-control levels. These results clearly demonstrate that NE is not a significant enhancer of PAR-induced apoptosis. In addition to PAR, other factors can also promote the release of AIF from the mitochondria, e.g., activation of Bcl-2 proteins such as Bax or Bak, or of mitochondrial calpain, as well as of caspases [93,101,102]. Cell culture studies on cardiomyocytes and cardiac fibroblasts showed that NE induces apoptosis via various pathways, such as the overexpression of proapoptotic Bcl-2 proteins, c-Jun N-terminal kinase (JNK), or tumor necrosis factor (TNF)-α; however, these pathways primarily involve the activation of caspases [35,103,104]. Cardiac pathologies are usually associated with chronic severe sympathetic activation and primarily cause classic caspase-dependent apoptosis [100,105,106]. In cardiomyocytes, NE-induced ROS generation leads to mitochondrial damage and activation of mitochondrial apoptotic signals [36,67,95,106], resulting in the release of AIF from the mitochondria even without PARP-1 overactivation. NE thus induces ROS/RNS-dependent cell damage, which, however, cannot be classified as parthanatos. Generally, the results from the NE-treated groups show that NE intensifies and prolongs mitochondrial stress, which could explain the impaired LV function observed with NE administration. Particularly under hypoxia, the mismatch between the reduced O2 supply and the increased energy demand caused by the NE-induced stress, as also reflected in a rise in HR, is exacerbated, leading to a significant reduction in LVSP, SV, and CI. On the other hand, the complete recovery of LV function after the three days of recovery in normoxia and without further NE administration suggests that NE-induced cell damage and apoptosis were rather moderate and reversible, and that hypoxic damage was hardly exacerbated by NE administration.
4.4. Limitations of the Study
Although the components of PARP-1-dependent cell death (parthanatos)—such as oxidative/nitrosative stress, PAR, and AIF—increased significantly under hypoxia and/or NE administration, the results showed that the deterioration in LV function was reversible, suggesting that parthanatos played a relatively minor role in the present experimental setup. However, one of the main limitations of this study is that we have no measure of the extent of cell death or of the extent to which other mechanisms of cell damage or cell death such as classical (caspase-dependent) apoptosis might have contributed to the observed functional impairments. Future studies should include measurements of caspase activation and cell viability to obtain a clearer picture of hypoxia- and NE-mediated cardiac damage. Furthermore, it must be considered that the development of damage caused by hypoxia and reoxygenation is a gradual process. Determining relevant markers at a single, arbitrarily chosen point in time cannot adequately reflect this process. Repeated measurements at different stages of the exposure phase and, above all, during the recovery phase provide a more accurate picture of the actual extent of myocardial damage and should therefore be employed in future studies.
The reversibility of the functional impairment observed in this experiment suggests that reversible myocardial damage, resulting from myocardial energy depletion, was the predominant mechanism. An assessment of energy status, including the simultaneous determination of ATP, ADP, and adenosine monophosphate (AMP) as well as the measurement of phosphocreatine (PCr), would confirm this hypothesis and should be incorporated into future studies.
Another limitation of this study is that the present experiments were performed on female rats only. The intention behind this choice was to ensure comparability with the results of earlier studies of our group [1,2,3,69,70,71]. A comparative study on rats demonstrated that blood pressure and heart rate were similar in adult male and female rats both in normoxia and normobaric hypoxia [107]. However, studies in mice indicated that female animals have a better tolerance for hypoxia than males. It was shown that chronic hypoxia induced a reduction in HR and in daytime activity in male but not in female mice. In addition, male mice exhibited stronger RV hypertrophy than females [108]. Another study demonstrated that the hearts of male and female animals employ different mechanisms to cope with oxidative stress with female hearts proving to be more resistant to I/R injuries than male hearts [109]. These findings are in line with other animal studies and clinical observations in patients [98,110] and suggest that the present experiment may have caused more severe LV dysfunction and myocardial damage in male rats than we observed in female animals.
5. Conclusions
Our results show that the deterioration in LV function induced by three days of hypoxia exposure was completely reversed after three days of normoxic recovery, even though signs of oxidative/nitrosative stress and ongoing PARP-1 activity persisted. This suggests that—unlike in cases of I/R injury—myocardial damage caused by hypoxia and reoxygenation was relatively mild and, above all, reversible, and that cell death due to parthanatos played a minor role. The observed functional decline is partly due to general adaptations to the challenge of hypoxia exposure, but is primarily the result of myocardial energy depletion and is completely reversed by restoration of the O2 supply. NE administration exacerbated mitochondrial stress, which also persisted after the cessation of exposure to NE and hypoxia. Nevertheless, the functional impairment resolved completely even under these conditions, indicating that additional NE administration (as a model of strong sympathetic activation) mainly causes reversible cellular damage and does not exacerbate parthanatos. The results of this study reveal important differences from I/R injury that are not only relevant for individuals in a hypoxic environment but may also have prognostic significance for patients with hypoxemia.
Author Contributions
Conceptualization, A.S. and B.R.; methodology, C.B., S.D., C.R., A.S. and B.R.; formal analysis, C.B., S.D., C.R., A.S., and B.R.; investigation, C.B., S.D., C.R., A.S., and B.R.; writing—original draft preparation, B.R. and A.S.; writing—review and editing, B.R., C.R., and A.S.; visualization, B.R., C.B., and A.S.; supervision, A.S. and B.R. All authors have read and agreed to the published version of the manuscript.
Funding
This research received no external funding. Publication is supported by the Open Access Publishing Fund of Leipzig University.
Institutional Review Board Statement
The study was conducted according to the guidelines of the Declaration of Helsinki, and approved by the state agency (Landesdirektion Sachsen, number and date of approval: TVV 46/18; 17 December 2018).
Informed Consent Statement
Not applicable as the study did not involve humans.
Data Availability Statement
Data are available on request from the corresponding author.
Acknowledgments
We gratefully appreciate the provision of the blood gas analyzer ABL800 BASIC by the Medical Experimental Center of the Leipzig University. We acknowledge support from the Open Access Publishing Fund of Leipzig University.
Conflicts of Interest
The authors declare no conflicts of interest.
Abbreviations
The following abbreviations are used in this manuscript:
| ADP | adenosine diphosphate |
| AIF | apoptosis-inducing factor |
| AMP | adenosine monophosphate |
| ANOVA | analysis of variance |
| ATP | adenosine triphosphate |
| BW | body weight |
| c | concentration |
| cHb | concentration of hemoglobin |
| CI | cardiac index |
| DAP | diastolic aortic pressure |
| dP/dt max | maximum rate of pressure increase |
| dP/dt min | maximum rate of pressure decrease |
| EF | ejection fraction |
| H | normobaric hypoxia (10% O2 in N2) |
| Hct | hematocrit |
| HIF | hypoxia-inducible factor |
| HR | heart rate |
| I/R | Ischemia/reperfusion |
| LV | left cardiac ventricle |
| LV edP | left ventricular end-diastolic pressure |
| LV edV | left ventricular end-diastolic volume |
| LVSP | left ventricular systolic peak pressure |
| MAP | mean aortic pressure |
| N | normoxia |
| NaCl | 0.9% sodium chloride solution |
| NE | norepinephrine |
| NO | nitric oxide |
| NT | nitrotyrosine |
| PAR | poly-ADP-ribose |
| PARP-1 | PAR polymerase-1 |
| pCO2 | partial pressure of carbon dioxide |
| pO2 | partial pressure of oxygen |
| +R | plus recovery period |
| RNS | reactive nitrogen species |
| ROS | reactive oxygen species |
| RV | right cardiac ventricle |
| RVSP | right ventricular systolic peak pressure |
| SaO2 | arterial saturation of oxygen |
| SEM | standard error of the mean |
| SV | stroke volume |
| SW | stroke work |
| TPR | total peripheral resistance |
References
- Neubert, E.; Rassler, B.; Hoschke, A.; Raffort, C.; Salameh, A. Effects of Normobaric Hypoxia and Adrenergic Blockade over 72 h on Cardiac Function in Rats. Int. J. Mol. Sci. 2023, 24, 11417. [CrossRef]
- Bölter, C.; Gabriel, P.; Appelt, P.; Salameh, A.; Schierle, K.; Rassler, B. Effects of Adrenergic Agonists and Antagonists on Cardiopulmonary Function During Normobaric Hypoxia in Rat. Front. Physiol. 2019, 10, 860. [CrossRef]
- Bambor, C.; Daunheimer, S.; Raffort, C; Koedel, J.; Salameh, A.; Rassler, B. Effects of a three-day vs. six-day exposure to normobaric hypoxia on the cardiopulmonary function of rats. Curr. Issues Mol. Biol. 2025, 47, 125. [CrossRef]
- Talbot, N.P.; Balanos, G.M.; Dorrington, K.L.; Robbins, P.A. Two temporal components within the human pulmonary vascular response to approximately 2 h of isocapnic hypoxia. J. Appl. Physiol. 2005, 98, 1125-1139. [CrossRef]
- Yan, B.; Hu, Y.; Ji, H.; Bao, D. The effect of acute hypoxia on left ventricular function during exercise. Eur. J. Appl. Physiol. 2007, 100, 261-265. [CrossRef]
- Maufrais, C.; Rupp, T.; Bouzat, P.; Doucende, G.; Verges, S.; Nottin, S.; Walther, G. Heart mechanics at high altitude: 6 days on the top of Europe. Eur. Heart J. Cardiovasc. Imaging 2017, 18, 1369-1377. [CrossRef]
- Stembridge, M.; Ainslie, P.N.; Hughes, M.G.; Stöhr, E.J.; Cotter, J.D.; Nio, A.Q.; Shave, R. Ventricular structure, function, and mechanics at high altitude: chronic remodeling in Sherpa vs. short-term lowlander adaptation. J. Appl. Physiol. 2014, 117, 334-343. [CrossRef]
- Osculati, G.; Revera, M.; Branzi, G.; Faini, A.; Malfatto, G.; Bilo, G.; Giuliano, A.; Gregorini, F.; Ciambellotti, F.; Lombardi, C.; Agostoni, P.; Mancia, G.; Parati, G. Effects of hypobaric hypoxia exposure at high altitude on left ventricular twist in healthy subjects: data from HIGHCARE study on Mount Everest. Eur. Heart J. Cardiovasc. Imaging 2016, 17, 635-643. [CrossRef]
- Leuenberger, U.; Gleeson, K.; Wroblewski, K.; Prophet, S.; Zelis, R.; Zwillich, C.; Sinoway, L. Norepinephrine clearance is increased during acute hypoxemia in humans. Am. J. Physiol. 1991, 261, H1659-1664. [CrossRef]
- Bärtsch, P.; Gibbs, J.S. Effect of altitude on the heart and the lungs. Circulation 2007, 116, 2191-2202. [CrossRef]
- Dedobbeleer, C.; Hadefi, A.; Naeije, R.; Unger, P. Left ventricular adaptation to acute hypoxia: a speckle-tracking echocardiography study. J. Am. Soc. Echocardiogr. 2013, 26, 736-745. [CrossRef]
- Rao, M.; Li, J.; Qin, J.; Zhang, J.; Gao, X.; Yu, S.; Yu, J.; Chen, G.; Xu, B.; Li, H.; Rao, R.; Huang, L.; Jin, J. Left ventricular function during acute high-altitude exposure in a large group of healthy young Chinese men. PLoS One. 2015, 10, e0116936. [CrossRef]
- Saito, M.; Mano, T.; Iwase, S.; Koga, K.; Abe, H.; Yamazaki, Y. Responses in muscle sympathetic activity to acute hypoxia in humans. J. Appl. Physiol. (1985). 1988, 65, 1548-1552. [CrossRef]
- Hansen, J.; Sander, M. Sympathetic neural overactivity in healthy humans after prolonged exposure to hypobaric hypoxia. J. Physiol. 2003, 546, 921-929. [CrossRef]
- Kacimi, R.; Richalet, J.P.; Corsin, A.; Abousahl, I.; Crozatier, B. Hypoxia-induced downregulation of beta-adrenergic receptors in rat heart. J. Appl. Physiol. (1985). 1992, 73, 1377-1382. [CrossRef]
- Essop, M.F.; Razeghi, P.; McLeod, C.; Young, M.E.; Taegtmeyer, H.; Sack, M.N. Hypoxia-induced decrease of UCP3 gene expression in rat heart parallels metabolic gene switching but fails to affect mitochondrial respiratory coupling. Biochem. Biophys. Res. Commun. 2004, 314, 561-564. [CrossRef]
- Heather, L.C.; Cole, M.A.; Tan, J.J.; Ambrose, L.J.; Pope, S.; Abd-Jamil, A.H.; Carter, E.E.; Dodd, M.S.; Yeoh, K.K.; Schofield, C.J.; Clarke, K. Metabolic adaptation to chronic hypoxia in cardiac mitochondria. Basic Res. Cardiol. 2012, 107, 268. [CrossRef]
- Kierans, S.J.; Taylor, C.T. Regulation of glycolysis by the hypoxia-inducible factor (HIF): implications for cellular physiology. J. Physiol. 2021, 599, 23-37. [CrossRef]
- Hernansanz-Agustín, P.; Enríquez, J.A. Generation of Reactive Oxygen Species by Mitochondria. Antioxidants (Basel). 2021, 10, 415. [CrossRef]
- Dwyer, K.D.; Snyder, C.A.; Coulombe, K.L.K. Cardiomyocytes in Hypoxia: Cellular Responses and Implications for Cell-Based Cardiac Regenerative Therapies. Bioengineering (Basel). 2025, 12, 154. [CrossRef]
- Görlach, A.; Bertram, K.; Hudecova, S.; Krizanova, O. Calcium and ROS: A mutual interplay. Redox Biol. 2015, 6, 260-271. [CrossRef]
- Dridi, H.; Santulli, G.; Bahlouli, L.; Miotto, M.C.; Weninger, G.; Marks, A.R. Mitochondrial Calcium Overload Plays a Causal Role in Oxidative Stress in the Failing Heart. Biomolecules. 2023, 13, 1409. [CrossRef]
- Jung, F.; Palmer, L.A.; Zhou, N.; Johns, R.A. Hypoxic regulation of inducible nitric oxide synthase via hypoxia inducible factor-1 in cardiac myocytes. Circ. Res. 2000, 86, 319-325. [CrossRef]
- Alvarez, M.N.; Trujillo, M.; Radi, R. Peroxynitrite formation from biochemical and cellular fluxes of nitric oxide and superoxide. Methods Enzymol. 2002, 359, 353-366. [CrossRef]
- Radi, R. Peroxynitrite, a stealthy biological oxidant. J. Biol. Chem. 2013, 288, 26464-26472. [CrossRef]
- Szabó, C.; Ischiropoulos, H.; Radi, R. Peroxynitrite: biochemistry, pathophysiology and development of therapeutics. Nat. Rev. Drug Discov. 2007, 6, 662-680. [CrossRef]
- Islam, B.U.; Habib, S.; Ali, S.A.; Moinuddin; Ali, A. Role of Peroxynitrite-Induced Activation of Poly(ADP-Ribose) Polymerase (PARP) in Circulatory Shock and Related Pathological Conditions. Cardiovasc. Toxicol. 2017, 17, 373-383. [CrossRef]
- Wang, Y.; Dawson, V.L.; Dawson, T.M. Poly(ADP-ribose) signals to mitochondrial AIF: a key event in parthanatos. Exp. Neurol. 2009, 218, 193-202. [CrossRef]
- David, K.K.; Andrabi, S.A.; Dawson, T.M.; Dawson, V.L. Parthanatos, a messenger of death. Front. Biosci. (Landmark Ed). 2009, 14, 1116-1128. [CrossRef]
- Bárány, T.; Simon, A.; Szabó, G.; Benkő, R.; Mezei, Z.; Molnár, L.; Becker, D.; Merkely, B.; Zima, E.; Horváth, E.M. Oxidative Stress-Related Parthanatos of Circulating Mononuclear Leukocytes in Heart Failure. Oxid. Med. Cell. Longev. 2017, 2017, 1249614. [CrossRef]
- Fang, Q.; Li, Y.; Wang, Y.; Mu, N.; Ma, H.; Yu, L. Parthanatos: A redox-dependent cell death pathway in cardiovascular disease and myocardial aging. Pathol. Res. Pract. 2025, 274, 156178. [CrossRef]
- Pacher, P.; Szabó, C. Role of poly(ADP-ribose) polymerase 1 (PARP-1) in cardiovascular diseases: the therapeutic potential of PARP inhibitors. Cardiovasc. Drug Rev. 2007, 25, 235-260. [CrossRef]
- Singh, M.; Thomas, P.; Shukla, D.; Tulsawani, R.; Saxena, S.; Bansal, A. Effect of subchronic hypobaric hypoxia on oxidative stress in rat heart. Appl. Biochem. Biotechnol. 2013, 169, 2405-2419. [CrossRef]
- Aguilar, M.; González-Candia, A.; Rodríguez, J.; Carrasco-Pozo, C.; Cañas, D.; García-Herrera, C.; Herrera, E.A.; Castillo, R.L. Mechanisms of Cardiovascular Protection Associated with Intermittent Hypobaric Hypoxia Exposure in a Rat Model: Role of Oxidative Stress. Int. J. Mol. Sci. 2018, 19, 366. [CrossRef]
- Fu, Y.C.; Yin, S.C.; Chi, C.S.; Hwang, B.; Hsu, S.L. Norepinephrine induces apoptosis in neonatal rat endothelial cells via a ROS-dependent JNK activation pathway. Apoptosis. 2006, 11, 2053-2063. [CrossRef]
- Corbi, G.; Conti, V.; Russomanno, G.; Longobardi, G.; Furgi, G.; Filippelli, A.; Ferrara, N. Adrenergic signaling and oxidative stress: a role for sirtuins? Front. Physiol. 2013, 4, 324. [CrossRef]
- Thakur, A.; Alam, M.J.; Ajayakumar, M.R.; Ghaskadbi, S.; Sharma, M.; Goswami, S.K. Norepinephrine-induced apoptotic and hypertrophic responses in H9c2 cardiac myoblasts are characterized by different repertoire of reactive oxygen species generation. Redox Biol. 2015, 5, 243-252. [CrossRef]
- Waller, C.; Rhee, D.S.; Gröger, M.; Rappel, M.; Maier, T.; Müller, M.; Rottler, E.; Nerz, K.; Nerz, C.; Brill, S.; Becker, H.P.; Radermacher P. Social Stress-Induced Oxidative DNA Damage Is Related to Prospective Cardiovascular Risk. J. Clin. Med. 2020, 9, 3783. [CrossRef]
- Kim, G.T.; Chun, Y.S.; Park, J.W.; Kim, M.S. Role of apoptosis-inducing factor in myocardial cell death by ischemia-reperfusion. Biochem. Biophys. Res. Commun. 2003, 309, 619-624. [CrossRef]
- Dostar, Y., Gorjani, A., Hashemi, M., Shahir, R.R. The effect of time on apoptosis changes following ischemia-reperfusion in isolated heart of rats. Asia Pac. J. Cancer Biol. 2017, 2, 77-80. [CrossRef]
- Zenebe, W.J.; Nazarewicz, R.R.; Parihar, M.S.; Ghafourifar, P. Hypoxia/reoxygenation of isolated rat heart mitochondria causes cytochrome c release and oxidative stress; evidence for involvement of mitochondrial nitric oxide synthase. J. Mol. Cell. Cardiol. 2007, 43, 411-419. [CrossRef]
- Abramoff, M.D.; Magalhaes, P.J.; Ram, S.J. Image processing with ImageJ. Biophotonics Int. 2004, 11, 36-42.
- Reddan, B.; Cummins, E.P. The regulation of cell metabolism by hypoxia and hypercapnia. J. Biol. Chem. 2025, 301, 108252. [CrossRef]
- Brun-Pascaud, M.; Gaudebout, C.; Blayo, M.C.; Pocidalo, J.J. Arterial blood gases and acid-base status in awake rats. Respir. Physiol. 1982, 48, 45-57. [CrossRef]
- Dempsey, J.A.; Powell, F.L.; Bisgard, G.E.; Blain, G.M.; Poulin, M.J.; Smith, C.A. Role of chemoreception in cardiorespiratory acclimatization to, and deacclimatization from, hypoxia. J. Appl. Physiol. (1985). 2014, 116, 858-866. [CrossRef]
- Dempsey, J.A.; Forster, H.V.; Bisgard, G.E.; Chosy, L.W.; Hanson, P.G.; Kiorpes, A.L.; Pelligrino, D.A. Role of cerebrospinal fluid [H+] in ventilatory deacclimatization from chronic hypoxia. J. Clin. Invest. 1979, 64, 199-205. [CrossRef]
- Wasse, L.K.; Sunderland, C.; King, J.A.; Batterham, R.L.; Stensel, D.J. Influence of rest and exercise at a simulated altitude of 4,000 m on appetite, energy intake, and plasma concentrations of acylated ghrelin and peptide YY. J. Appl. Physiol. (1985). 2012, 112, 552-559. [CrossRef]
- Aeberli, I.; Erb, A.; Spliethoff, K.; Meier, D.; Götze, O.; Frühauf, H.; Fox, M.; Finlayson, G.S.; Gassmann, M.; Berneis, K.; Maggiorini, M.; Langhans, W.; Lutz, T.A. Disturbed eating at high altitude: influence of food preferences, acute mountain sickness and satiation hormones. Eur. J. Nutr. 2013, 52, 625-635. [CrossRef]
- Matu, J.; O’Hara, J.; Hill, N.; Clarke, S.; Boos, C.; Newman, C.; Holdsworth, D.; Ispoglou, T.; Duckworth, L.; Woods, D.; Mellor, A.; Deighton, K. Changes in appetite, energy intake, body composition, and circulating ghrelin constituents during an incremental trekking ascent to high altitude. Eur. J. Appl. Physiol. 2017, 117, 1917-1928. [CrossRef]
- Dünnwald, T.; Gatterer, H.; Faulhaber, M.; Arvandi, M.; Schobersberger, W. Body Composition and Body Weight Changes at Different Altitude Levels: A Systematic Review and Meta-Analysis. Front. Physiol. 2019, 10, 430. [CrossRef]
- Honig, A. Peripheral arterial chemoreceptors and reflex control of sodium and water homeostasis. Am. J. Physiol. 1989, 257, R1282-1302. [CrossRef]
- Siebenmann, C.; Robach, P.; Lundby, C. Regulation of blood volume in lowlanders exposed to high altitude. J. Appl. Physiol. (1985). 2017, 123, 957-966. [CrossRef]
- Hildebrandt, W.; Ottenbacher, A.; Schuster, M.; Swenson, E.R.; Bärtsch, P. Diuretic effect of hypoxia, hypocapnia, and hyperpnea in humans: relation to hormones and O(2) chemosensitivity. J. Appl. Physiol. 2000, 88, 599-610. [CrossRef]
- Haditsch, B.; Roessler, A.; Krisper, P.; Frisch, H.; Hinghofer-Szalkay, H.G.; Goswami, N. Volume regulation and renal function at high altitude across gender. PLoS One 2015, 10, e0118730. [CrossRef]
- Zubieta-Calleja, G.R.; Paulev, P.E.; Zubieta-Calleja, L.; Zubieta-Castillo, G. Altitude adaptation through hematocrit changes. J. Physiol. Pharmacol. 2007, 58 Suppl 5, 811-818.
- Watts, D.; Gaete, D.; Rodriguez, D.; Hoogewijs, D.; Rauner, M.; Sormendi, S.; Wielockx, B. Hypoxia Pathway Proteins are Master Regulators of Erythropoiesis. Int. J. Mol. Sci. 2020, 21, 8131. [CrossRef]
- Holloway, C.; Cochlin, L.; Codreanu, I.; Bloch, E.; Fatemian, M.; Szmigielski, C.; Atherton, H.; Heather, L.; Francis, J.; Neubauer, S.; Robbins, P.; Montgomery, H.; Clarke, K. Normobaric hypoxia impairs human cardiac energetics. FASEB J. 2011, 25, 3130-3135. [CrossRef]
- Kass, D.A.; Bronzwaer, J.G.; Paulus, W.J. What mechanisms underlie diastolic dysfunction in heart failure? Circ. Res. 2004, 94, 1533-1542. [CrossRef]
- Alexander, J.K.; Grover, R.F. Mechanism of reduced cardiac stroke volume at high altitude. Clin. Cardiol. 1983, 6, 301-303. [CrossRef]
- Severi, S.; Cavalcanti, S.; Mancini, E.; Santoro, A. Effect of electrolyte and pH changes on the sinus node pacemaking in humans. J. Electrocardiol. 2002, 35, 115-124. [CrossRef]
- Bruno, R.M.; Ghiadoni, L.; Pratali, L. Vascular adaptation to extreme conditions: The role of hypoxia. Artery Res. 2016, 14, 15-21. [CrossRef]
- León-Velarde, F.; Bourin, M.C.; Germack, R.; Mohammadi, K.; Crozatier, B.; Richalet, J.P. Differential alterations in cardiac adrenergic signaling in chronic hypoxia or norepinephrine infusion. Am. J. Physiol. Regul. Integr. Comp. Physiol. 2001, 280, R274-R281. [CrossRef]
- Gorr, M.W.; Sriram, K.; Chinn, A.M.; Muthusamy, A.; Insel, P.A. Transcriptomic profiles reveal differences between the right and left ventricle in normoxia and hypoxia. Physiol. Rep. 2020, 8, e14344. [CrossRef]
- Chandler, B.M.; Sonnenblick, E.H.; Pool, P.E. Mechanochemistry of cardiac muscle. 3. Effects of norepinephrine on the utilization of high-energy phosphates. Circ. Res. 1968, 22, 729-735. [CrossRef]
- Foulon, P.; De Backer, D. The hemodynamic effects of norepinephrine: far more than an increase in blood pressure! Ann. Transl. Med. 2018, 6, S25. [CrossRef]
- Lyon, A.R.; Citro, R.; Schneider, B.; Morel, O.; Ghadri, J.R.; Templin, C.; Omerovic, E. Pathophysiology of Takotsubo Syndrome: JACC State-of-the-Art Review. J. Am. Coll. Cardiol. 2021, 77, 902-921. [CrossRef]
- Mauriello, A.; Giudice, C.D.; Vecchio, G.E.D.; Correra, A.; Maratea, A.C.; Grieco, M.; Amata, A.; Quagliariello, V.; Maurea, N.; Proietti, R.; Giordano, A.; D’Andrea, A.; Russo, V. Takotsubo Syndrome and Oxidative Stress: Physiopathological Linkage and Future Perspectives. Antioxidants (Basel). 2025, 14, 522. [CrossRef]
- Surikow, S.Y.; Nguyen, T.H.; Stafford, I.; Chapman, M.; Chacko, S.; Singh, K.; Licari, G.; Raman, B.; Kelly, D.J.; Zhang, Y.; Waddingham, M.T.; Ngo, D.T.; Bate, A.P.; Chua, S.J.; Frenneaux, M.P.; Horowitz, J.D. Nitrosative Stress as a Modulator of Inflammatory Change in a Model of Takotsubo Syndrome. JACC Basic Transl. Sci. 2018, 3, 213-226. [CrossRef]
- Rassler, B.; Barth, W.; Zimmer, H.G. Transient pleural effusion in norepinephrine-stimulated rats. Basic Res. Cardiol. 2001, 96, 471-477. [CrossRef]
- Rassler, B.; Reissig, C.; Briest, W.; Tannapfel, A.; Zimmer H.G. Catecholamine-induced pulmonary edema and pleural effusion in rats--alpha- and beta-adrenergic effects. Respir. Physiol. Neurobiol. 2003, 135, 25-37. [CrossRef]
- Rassler B.; Marx G.; Schierle K.; Zimmer HG. Catecholamines can induce pulmonary remodeling in rats. Cell. Physiol. Biochem. 2012, 30, 1134-1147. [CrossRef]
- Thorén, P.N. Characteristics of left ventricular receptors with nonmedullated vagal afferents in cats. Circ. Res. 1977, 40, 415-421. [CrossRef]
- Zucker, I.H. Left ventricular receptors: physiological controllers or pathological curiosities? Basic Res. Cardiol. 1986; 81, 539-557. [CrossRef]
- Arya, S.; Belwal, S.; Uniyal, B.; Tiwari, B.; Sharma, P. Bezold Jarisch Reflex- New Interest, Old Phenomenon. Am. J. Intern. Med. 2020, 8, 24. [CrossRef]
- Wang, J.; Ochoa, M.; Patel, M.B.; Zucker, I.H.; Loud, A.V.; Zeballos, G.A.; Hintze, T.H. Carotid baroreceptor function in dogs with chronic norepinephrine infusion. Hypertension. 1991, 17, 745-754. [CrossRef]
- Berdeaux, A.; Giudicelli, J.F. Antihypertensive drugs and baroreceptor reflex control of heart rate and blood pressure. Fundam. Clin. Pharmacol. 1987, 1, 257-282. [CrossRef]
- Larsen, T.R.; Kaszala, K.; Tan, A.Y.; Ellenbogen, K.A.; Huizar, J.F. Paradoxical reflex bradycardia after epinephrine infusion for arrhythmia induction in the electrophysiology laboratory. HeartRhythm Case Rep. 2018, 4, 455-458. [CrossRef]
- Biaggioni, I.; Shibao, C.A.; Diedrich, A.; Muldowney, J.A.S. 3rd.; Laffer, C.L.; Jordan, J. Blood Pressure Management in Afferent Baroreflex Failure: JACC Review Topic of the Week. J. Am. Coll. Cardiol. 2019, 74, 2939-2947. [CrossRef]
- Lu, X.Y.; Barnett, D.B. Differential rates of down regulation and recovery of rat myocardial beta-adrenoceptor subtypes in vivo. Eur. J. Pharmacol. 1990, 182, 481-486. [CrossRef]
- Alsadder, L.; Hamadah, A. Cardiac Ischaemia-Reperfusion Injury: Pathophysiology, Therapeutic Targets and Future Interventions. Biomedicines. 2025, 13, 2084. [CrossRef]
- Di Lisa, F.; Bernardi, P. Mitochondria and ischemia-reperfusion injury of the heart: fixing a hole. Cardiovasc. Res. 2006, 70, 191-199. [CrossRef]
- Dhalla, N.S.; Elmoselhi, A.B.; Hata, T.; Makino, N. Status of myocardial antioxidants in ischemia-reperfusion injury. Cardiovasc. Res. 2000, 47, 446-456. [CrossRef]
- van den Tweel, E.R.; Nijboer, C.; Kavelaars, A.; Heijnen, C.J.; Groenendaal, F.; van Bel, F. Expression of nitric oxide synthase isoforms and nitrotyrosine formation after hypoxia-ischemia in the neonatal rat brain. J. Neuroimmunol. 2005, 167, 64-71. [CrossRef]
- Hirabayashi, H.; Takizawa, S.; Fukuyama, N.; Nakazawa, H.; Shinohara, Y. Nitrotyrosine generation via inducible nitric oxide synthase in vascular wall in focal ischemia-reperfusion. Brain Res. 2000, 852, 319-325. [CrossRef]
- Grosche, A.; Freeman, D.E.; Morton, A.J.; Polyak, M.M.; Matyjaszek, S.A. Effects of ischemia and reperfusion on production of nitrotyrosine, activation of eosinophils, and apoptosis in the large colonic mucosa of horses. Am. J. Vet. Res. 2012, 73, 53-61. [CrossRef]
- Takizawa, S.; Fukuyama, N.; Hirabayashi, H.; Nakazawa, H.; Shinohara, Y. Dynamics of nitrotyrosine formation and decay in rat brain during focal ischemia-reperfusion. J. Cereb. Blood Flow Metab. 1999, 19, 667-672. [CrossRef]
- Nag, S.; Picard, P.; Stewart, D.J. Expression of nitric oxide synthases and nitrotyrosine during blood-brain barrier breakdown and repair after cold injury. Lab. Invest. 2001, 81, 41-49. [CrossRef]
- Huang, P.; Chen, G.; Jin, W.; Mao, K.; Wan, H.; He, Y. Molecular Mechanisms of Parthanatos and Its Role in Diverse Diseases. Int. J. Mol. Sci. 2022, 23, 7292. [CrossRef]
- Lui, J.C.; Kong, S.K. Heat shock protein 70 inhibits the nuclear import of apoptosis-inducing factor to avoid DNA fragmentation in TF-1 cells during erythropoiesis. FEBS Lett. 2007, 581, 109-117. [CrossRef]
- Choudhury, S.; Bae, S.; Ke, Q.; Lee, J.Y.; Kim, J.; Kang, P.M. Mitochondria to nucleus translocation of AIF in mice lacking Hsp70 during ischemia/reperfusion. Basic Res. Cardiol. 2011, 106, 397-407. [CrossRef]
- Yang, S.; Zhao, X.; Xu, H.; Chen, F.; Xu, Y.; Li, Z.; Sanchis, D.; Jin, L.; Zhang, Y.; Ye, J. AKT2 Blocks Nucleus Translocation of Apoptosis-Inducing Factor (AIF) and Endonuclease G (EndoG) While Promoting Caspase Activation during Cardiac Ischemia. Int. J. Mol. Sci. 2017, 18, 565. [CrossRef]
- Zhang, Y.; Zhang, X.; Park, T.S.; Gidday, J.M. Cerebral endothelial cell apoptosis after ischemia-reperfusion: role of PARP activation and AIF translocation. J. Cereb. Blood Flow Metab. 2005, 25, 868-877. [CrossRef]
- Sevrioukova, I.F. Apoptosis-inducing factor: structure, function, and redox regulation. Antioxid. Redox Signal. 2011, 14, 2545-2579. [CrossRef]
- Wickman, G.; Julian, L.; Olson, M.F. How apoptotic cells aid in the removal of their own cold dead bodies. Cell Death Differ. 2012, 19, 735-742. [CrossRef]
- Neri, M.; Cerretani, D.; Fiaschi, A.I.; Laghi, P.F.; Lazzerini, P.E.; Maffione, A.B.; Micheli, L.; Bruni, G.; Nencini, C.; Giorgi, G.; D’Errico, S.; Fiore, C.; Pomara, C.; Riezzo, I.; Turillazzi, E.; Fineschi, V. Correlation between cardiac oxidative stress and myocardial pathology due to acute and chronic norepinephrine administration in rats. J. Cell. Mol. Med. 2007, 11, 156-170. [CrossRef]
- Deo, S.H.; Jenkins, N.T.; Padilla, J.; Parrish, A.R.; Fadel, P.J. Norepinephrine increases NADPH oxidase-derived superoxide in human peripheral blood mononuclear cells via α-adrenergic receptors. Am. J. Physiol. Regul. Integr. Comp. Physiol. 2013, 305, R1124-R1132. [CrossRef]
- Jiang, J.P.; Downing, S.E. Catecholamine cardiomyopathy: review and analysis of pathogenetic mechanisms. Yale J. Biol. Med. 1990, 63, 581-591.
- Cross, H.R.; Murphy, E.; Steenbergen, C. Ca(2+) loading and adrenergic stimulation reveal male/female differences in susceptibility to ischemia-reperfusion injury. Am. J. Physiol. Heart Circ. Physiol. 2002, 283, H481-H489. [CrossRef]
- Zhu, W.Z.; Wang, S.Q.; Chakir, K.; Yang, D.; Zhang, T.; Brown, J.H.; Devic, E.; Kobilka, B.K.; Cheng, H.; Xiao, R.P. Linkage of beta1-adrenergic stimulation to apoptotic heart cell death through protein kinase A-independent activation of Ca2+/calmodulin kinase II. J. Clin. Invest. 2003, 111, 617-625. [CrossRef]
- de Lima-Seolin, B.G.; Nemec-Bakk, A.; Forsyth, H.; Kirk, S.; da Rosa Araujo, A.S.; Schenkel, P.C.; Belló-Klein, A.; Khaper, N. Bucindolol Modulates Cardiac Remodeling by Attenuating Oxidative Stress in H9c2 Cardiac Cells Exposed to Norepinephrine. Oxid. Med. Cell. Longev. 2019, 2019, 6325424. [CrossRef]
- Arnoult, D.; Parone, P.; Martinou, J.C.; Antonsson, B.; Estaquier, J.; Ameisen, J.C. Mitochondrial release of apoptosis-inducing factor occurs downstream of cytochrome c release in response to several proapoptotic stimuli. J. Cell. Biol. 2002, 159, 923-929. [CrossRef]
- Candé, C.; Vahsen, N.; Garrido, C.; Kroemer, G. Apoptosis-inducing factor (AIF): caspase-independent after all. Cell Death Differ. 2004, 11, 591-595. [CrossRef]
- Fu, Y.C.; Chi, C.S.; Yin, S.C.; Hwang, B.; Chiu, Y.T.; Hsu, S.L. Norepinephrine induces apoptosis in neonatal rat cardiomyocytes through a reactive oxygen species-TNF alpha-caspase signaling pathway. Cardiovasc. Res. 2004, 62, 558-567. [CrossRef]
- Lai, K.B.; Sanderson, J.E.; Yu, C.M. High dose norepinephrine-induced apoptosis in cultured rat cardiac fibroblast. Int. J. Cardiol. 2009, 136, 33-39. [CrossRef]
- Jain, A.; Atale, N.; Kohli, S.; Bhattacharya, S.; Sharma, M.; Rani, V. An assessment of norepinephrine mediated hypertrophy to apoptosis transition in cardiac cells: a signal for cell death. Chem. Biol. Interact. 2015, 225, 54-62. [CrossRef]
- Camargo, L.L.; Rios, F.J.; Montezano, A.C.; Touyz, R.M. Reactive oxygen species in hypertension. Nat. Rev. Cardiol. 2025, 22, 20-37. [CrossRef]
- Mortola, J.P.; Saiki, C. Ventilatory response to hypoxia in rats: gender differences. Respir. Physiol. 1996, 106, 21-34. [CrossRef]
- Wearing, O.H.; Scott, G.R. Sex-specific effects of chronic hypoxia on routine cardiovascular function and metabolism in CD-1 mice. Am. J. Physiol. Regul, Integr. Comp. Physiol. 2022, 323, R547-R560. [CrossRef]
- Lim, C.C.; Bryan, N.S.; Jain, M.; Garcia-Saura, M.F.; Fernandez, B.O.; Sawyer, D.B.; Handy, D.E.; Loscalzo, J.; Feelisch, M.; Liao, R. Glutathione peroxidase deficiency exacerbates ischemia-reperfusion injury in male but not female myocardium: insights into antioxidant compensatory mechanisms. Am. J. Physiol. Heart Circ. Physiol. 2009, 297, H2144-H2153. [CrossRef]
- Kander, M.C.; Cui, Y.; Liu, Z. Gender difference in oxidative stress: a new look at the mechanisms for cardiovascular diseases. J. Cell. Mol. Med. 2017, 21, 1024-1032. [CrossRef]
Figure 1.
Experimental protocol: Upper part: Four groups of rats were exposed only to the 72-hour intervention period, i.e., exposure to room air (normoxia, N) or normobaric hypoxia (H, 10% O2 in N2) with infusion of 0.9% saline (NaCl) or norepinephrine (NE, 0.1 mg kg-1 h-1). Lower part: Four other groups of rats were exposed to the intervention period followed by a 72-hour recovery period with exposure to room air (normoxia, N) and infusion of 0.9% saline (NaCl). HD marks the start of hemodynamic measurements (50 min before the end of the experiment). The color and pattern codes presented here are also used in the following figures for the respective animal groups.
Figure 1.
Experimental protocol: Upper part: Four groups of rats were exposed only to the 72-hour intervention period, i.e., exposure to room air (normoxia, N) or normobaric hypoxia (H, 10% O2 in N2) with infusion of 0.9% saline (NaCl) or norepinephrine (NE, 0.1 mg kg-1 h-1). Lower part: Four other groups of rats were exposed to the intervention period followed by a 72-hour recovery period with exposure to room air (normoxia, N) and infusion of 0.9% saline (NaCl). HD marks the start of hemodynamic measurements (50 min before the end of the experiment). The color and pattern codes presented here are also used in the following figures for the respective animal groups.
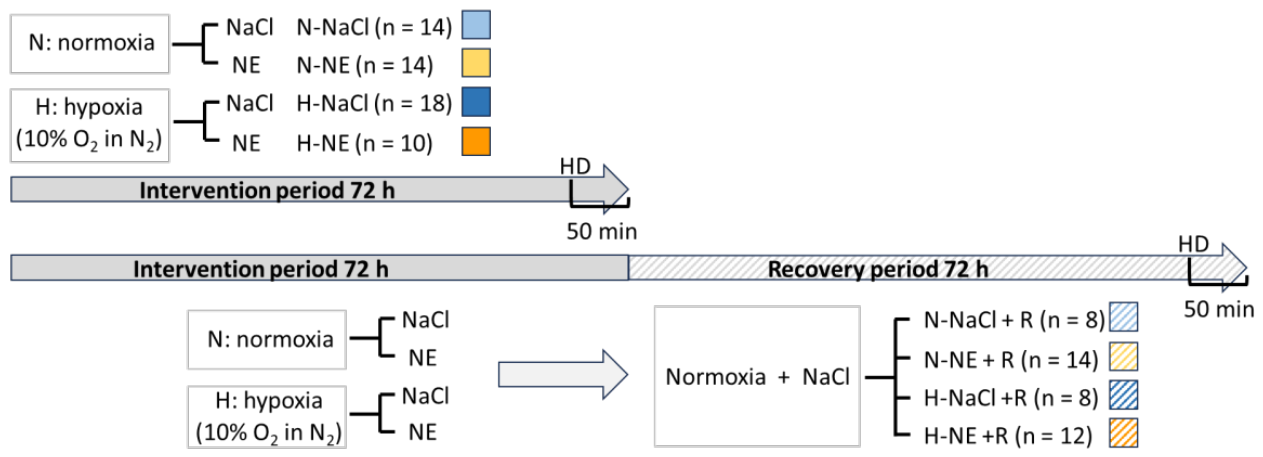
Figure 2.
(a) Daily food intake in g; (b) Change in body weight (ΔBW) in g between the first and last day of the experiment. Data are given as mean ± SEM. N normoxia; H hypoxia; 72 h intervention period only; 72 h + R intervention + recovery period; NaCl, NE saline or norepinephrine infusion. Significance marks: * p<0.05, ** p<0.01, *** p<0.001.
Figure 2.
(a) Daily food intake in g; (b) Change in body weight (ΔBW) in g between the first and last day of the experiment. Data are given as mean ± SEM. N normoxia; H hypoxia; 72 h intervention period only; 72 h + R intervention + recovery period; NaCl, NE saline or norepinephrine infusion. Significance marks: * p<0.05, ** p<0.01, *** p<0.001.
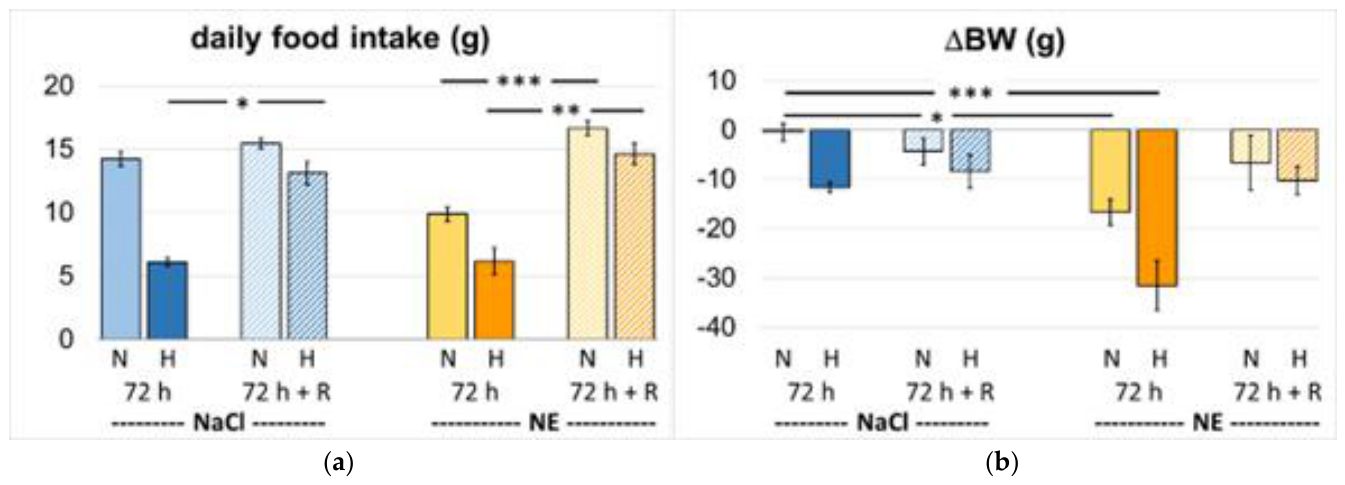
Figure 3.
(a) arterial pH; (b) arterial oxygen saturation (SaO2) in %. Data are given as mean ± SEM. N normoxia; H hypoxia; 72 h intervention period only; 72 h + R intervention + recovery period; NaCl, NE saline or norepinephrine infusion.
Figure 3.
(a) arterial pH; (b) arterial oxygen saturation (SaO2) in %. Data are given as mean ± SEM. N normoxia; H hypoxia; 72 h intervention period only; 72 h + R intervention + recovery period; NaCl, NE saline or norepinephrine infusion.
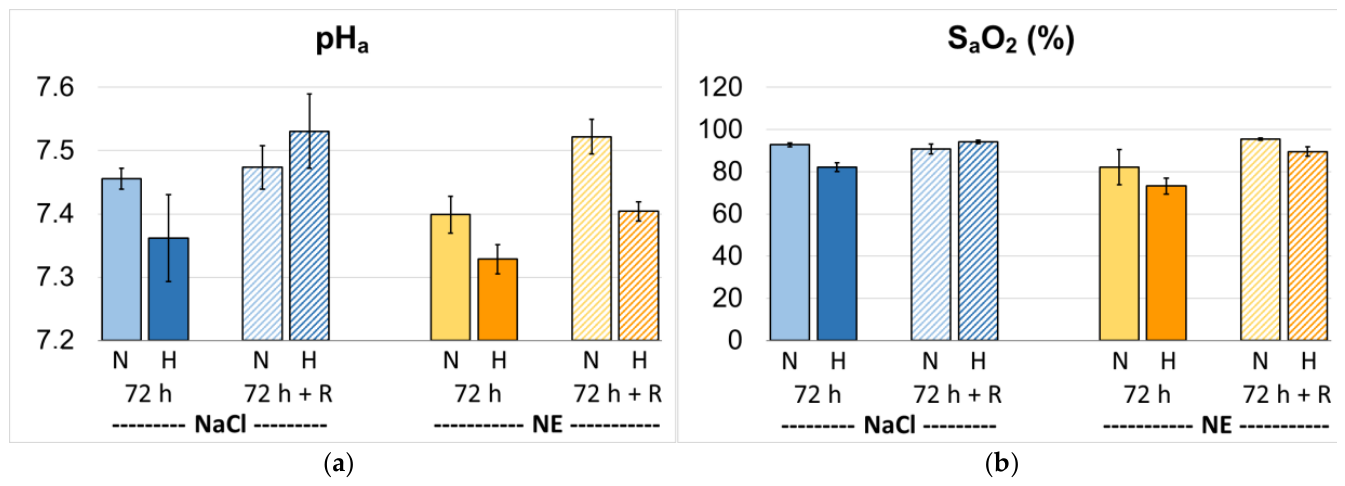
Figure 4.
(a) Hemoglobin concentration (cHb) in g/100 mL; (b) hematocrit (Hct) in %; (c) K+ concentration (cK+) in mmol/L; (d) Na+ concentration (can+) in mmol/L. Data are given as mean ± SEM. N normoxia; H hypoxia; 72 h intervention period only; 72 h + R intervention + recovery period; NaCl, NE saline or norepinephrine infusion. Significance marks: * p<0.05, ** p<0.01, *** p<0.001.
Figure 4.
(a) Hemoglobin concentration (cHb) in g/100 mL; (b) hematocrit (Hct) in %; (c) K+ concentration (cK+) in mmol/L; (d) Na+ concentration (can+) in mmol/L. Data are given as mean ± SEM. N normoxia; H hypoxia; 72 h intervention period only; 72 h + R intervention + recovery period; NaCl, NE saline or norepinephrine infusion. Significance marks: * p<0.05, ** p<0.01, *** p<0.001.
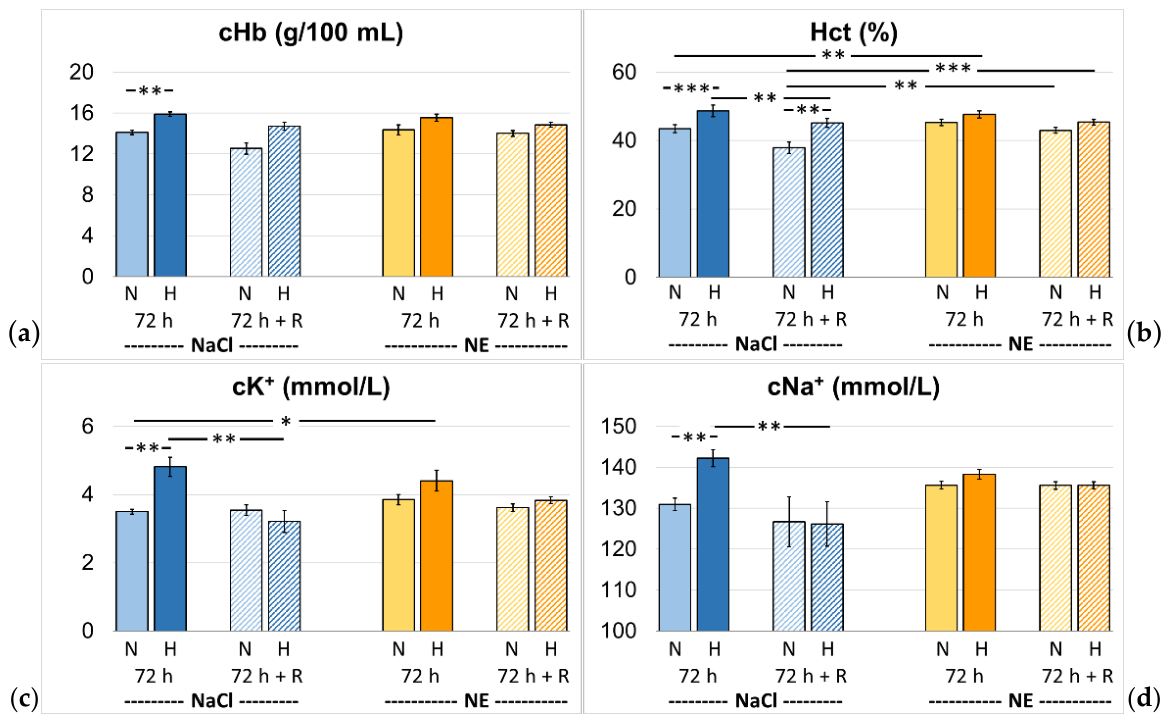
Figure 5.
Daily drinking water intake in mL. (a) during the intervention period (day 1-3); (b) during the recovery period (day 4-6). Drinking water consumption was measured only in the animals that were exposed to the 6-day experiment, including the intervention and recovery phases. Data are given as mean ± SEM. N normoxia; H hypoxia; NaCl, NE saline or norepinephrine infusion. Significance marks: * p<0.05, ** p<0.01, *** p<0.001; significant difference vs. corresponding intervention period: •• p<0.01, ••• p<0.001.
Figure 5.
Daily drinking water intake in mL. (a) during the intervention period (day 1-3); (b) during the recovery period (day 4-6). Drinking water consumption was measured only in the animals that were exposed to the 6-day experiment, including the intervention and recovery phases. Data are given as mean ± SEM. N normoxia; H hypoxia; NaCl, NE saline or norepinephrine infusion. Significance marks: * p<0.05, ** p<0.01, *** p<0.001; significant difference vs. corresponding intervention period: •• p<0.01, ••• p<0.001.
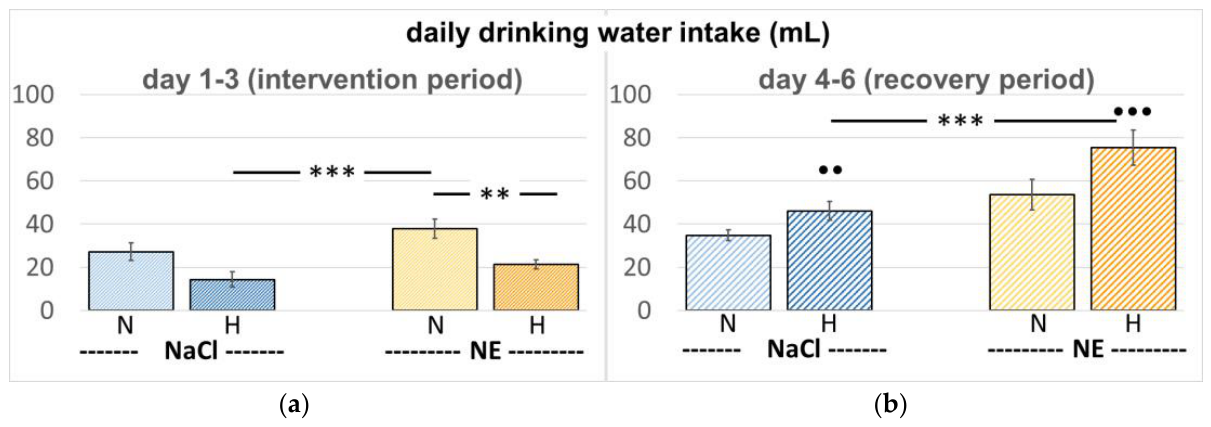
Figure 6.
(next page) (a) Left ventricular systolic peak pressure (LVSP) in mmHg; (b) right ventricular systolic peak pressure (RVSP) in mmHg; (c) left ventricular maximum rate of pressure increase (LV dP/dt max) in mmHg/s; (d) left ventricular end-diastolic pressure (LV edP) in mmHg; (e) stroke work in mmHg μL; (f) stroke volume in μL; (g) heart rate in min-1; (h) cardiac index in mL min-1 kg-1. Data are given as mean ± SEM. N normoxia; H hypoxia; 72 h intervention period only; 72 h + R intervention + recovery period; NaCl, NE saline or norepinephrine infusion. Significance marks: significant difference vs. N-NaCl: * p<0.05; ** p<0.01; *** p<0.001; vs. H-NaCl: † p<0.05; †† p<0.01; ††† p<0.001; vs. N-NE: + p<0.05; ++ p<0.01; +++ p<0.001; vs. H-NE: ### p<0.001; vs. N-NaCl+R: ° p<0.05; °° p<0.01; °°° p<0.001; vs. H-NaCl+R: ‡‡ p<0.01.
Figure 6.
(next page) (a) Left ventricular systolic peak pressure (LVSP) in mmHg; (b) right ventricular systolic peak pressure (RVSP) in mmHg; (c) left ventricular maximum rate of pressure increase (LV dP/dt max) in mmHg/s; (d) left ventricular end-diastolic pressure (LV edP) in mmHg; (e) stroke work in mmHg μL; (f) stroke volume in μL; (g) heart rate in min-1; (h) cardiac index in mL min-1 kg-1. Data are given as mean ± SEM. N normoxia; H hypoxia; 72 h intervention period only; 72 h + R intervention + recovery period; NaCl, NE saline or norepinephrine infusion. Significance marks: significant difference vs. N-NaCl: * p<0.05; ** p<0.01; *** p<0.001; vs. H-NaCl: † p<0.05; †† p<0.01; ††† p<0.001; vs. N-NE: + p<0.05; ++ p<0.01; +++ p<0.001; vs. H-NE: ### p<0.001; vs. N-NaCl+R: ° p<0.05; °° p<0.01; °°° p<0.001; vs. H-NaCl+R: ‡‡ p<0.01.
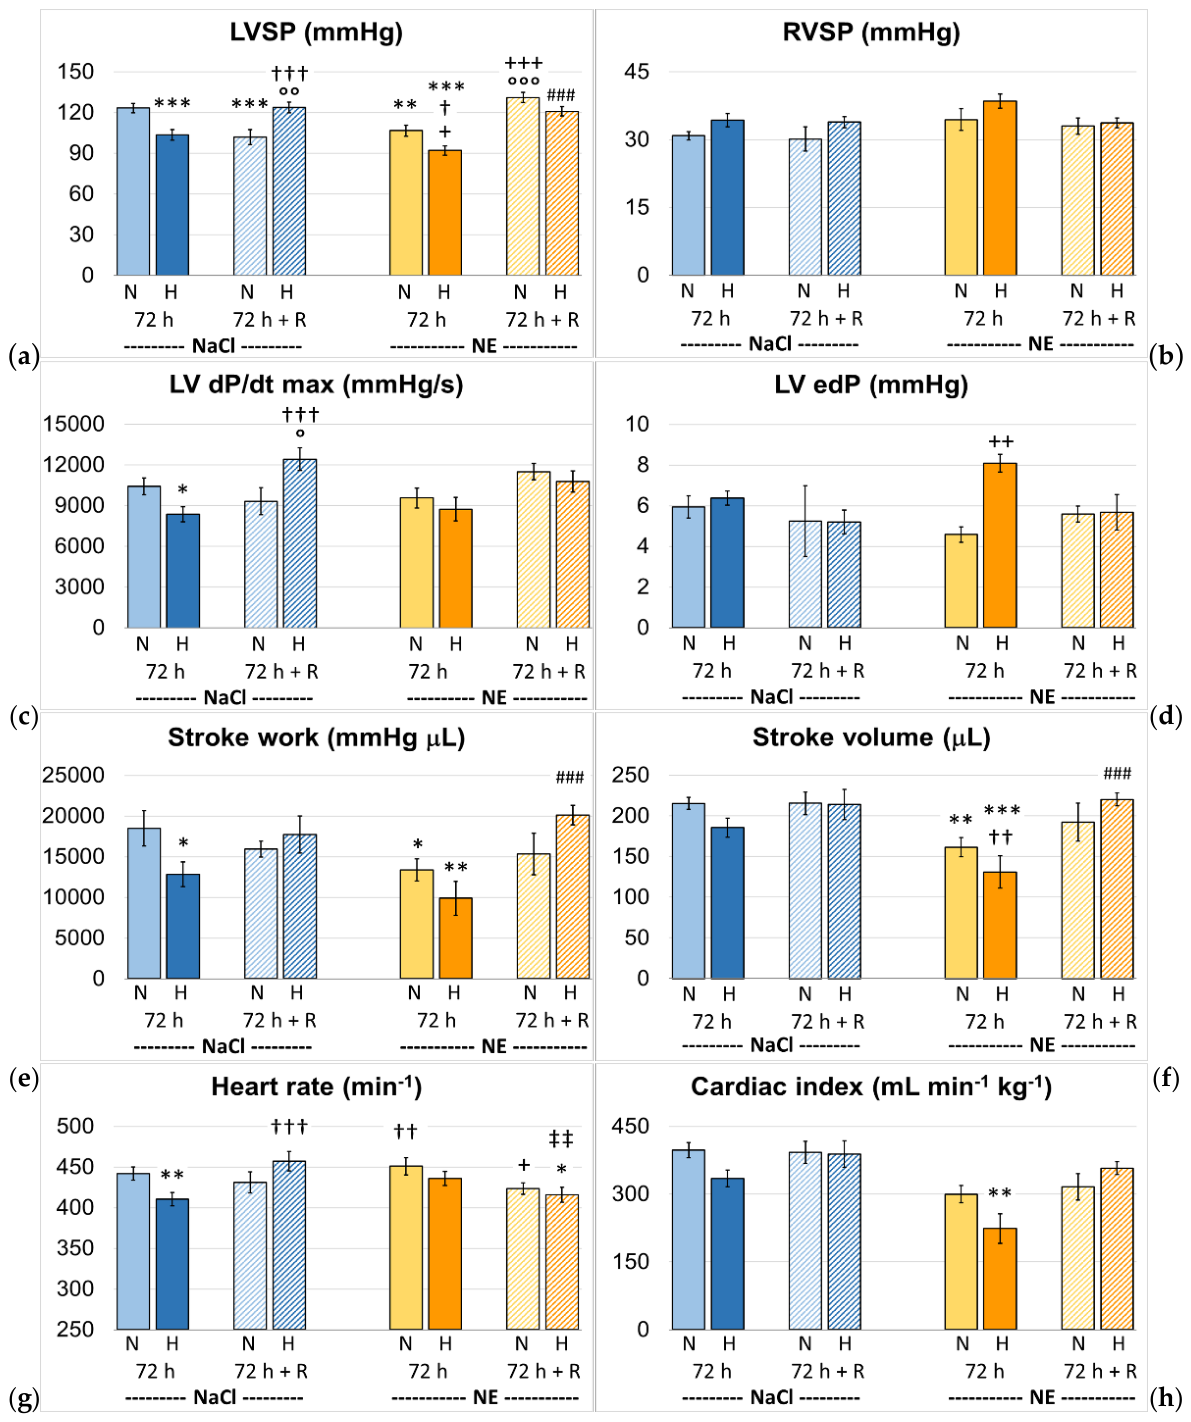
Figure 7.
Nitrotyrosine (NT) in the heart: Representative immunohistochemical images from N-NaCl (a), H-NaCl (b), N-NE (c), H-NE (d), H-NaCl+R (e), and H-NE+R (f) hearts. (g) Abundance of NT in the heart expressed as percentage of positive area related to the total area of the cardiac walls. Data are presented as means ± SEM. N normoxia; H hypoxia; NaCl, NE saline or norepinephrine infusion. Significance marks: significant difference vs. N-NaCl: * p<0.05; ** p<0.01; vs. N-NaCl+R: ° p<0.05; °°° p<0.001; vs. H-NaCl+R: ‡‡ p<0.01; ‡‡‡ p<0.001. All images are shown in the same magnification with the scale bars indicating 500 µm each.
Figure 7.
Nitrotyrosine (NT) in the heart: Representative immunohistochemical images from N-NaCl (a), H-NaCl (b), N-NE (c), H-NE (d), H-NaCl+R (e), and H-NE+R (f) hearts. (g) Abundance of NT in the heart expressed as percentage of positive area related to the total area of the cardiac walls. Data are presented as means ± SEM. N normoxia; H hypoxia; NaCl, NE saline or norepinephrine infusion. Significance marks: significant difference vs. N-NaCl: * p<0.05; ** p<0.01; vs. N-NaCl+R: ° p<0.05; °°° p<0.001; vs. H-NaCl+R: ‡‡ p<0.01; ‡‡‡ p<0.001. All images are shown in the same magnification with the scale bars indicating 500 µm each.
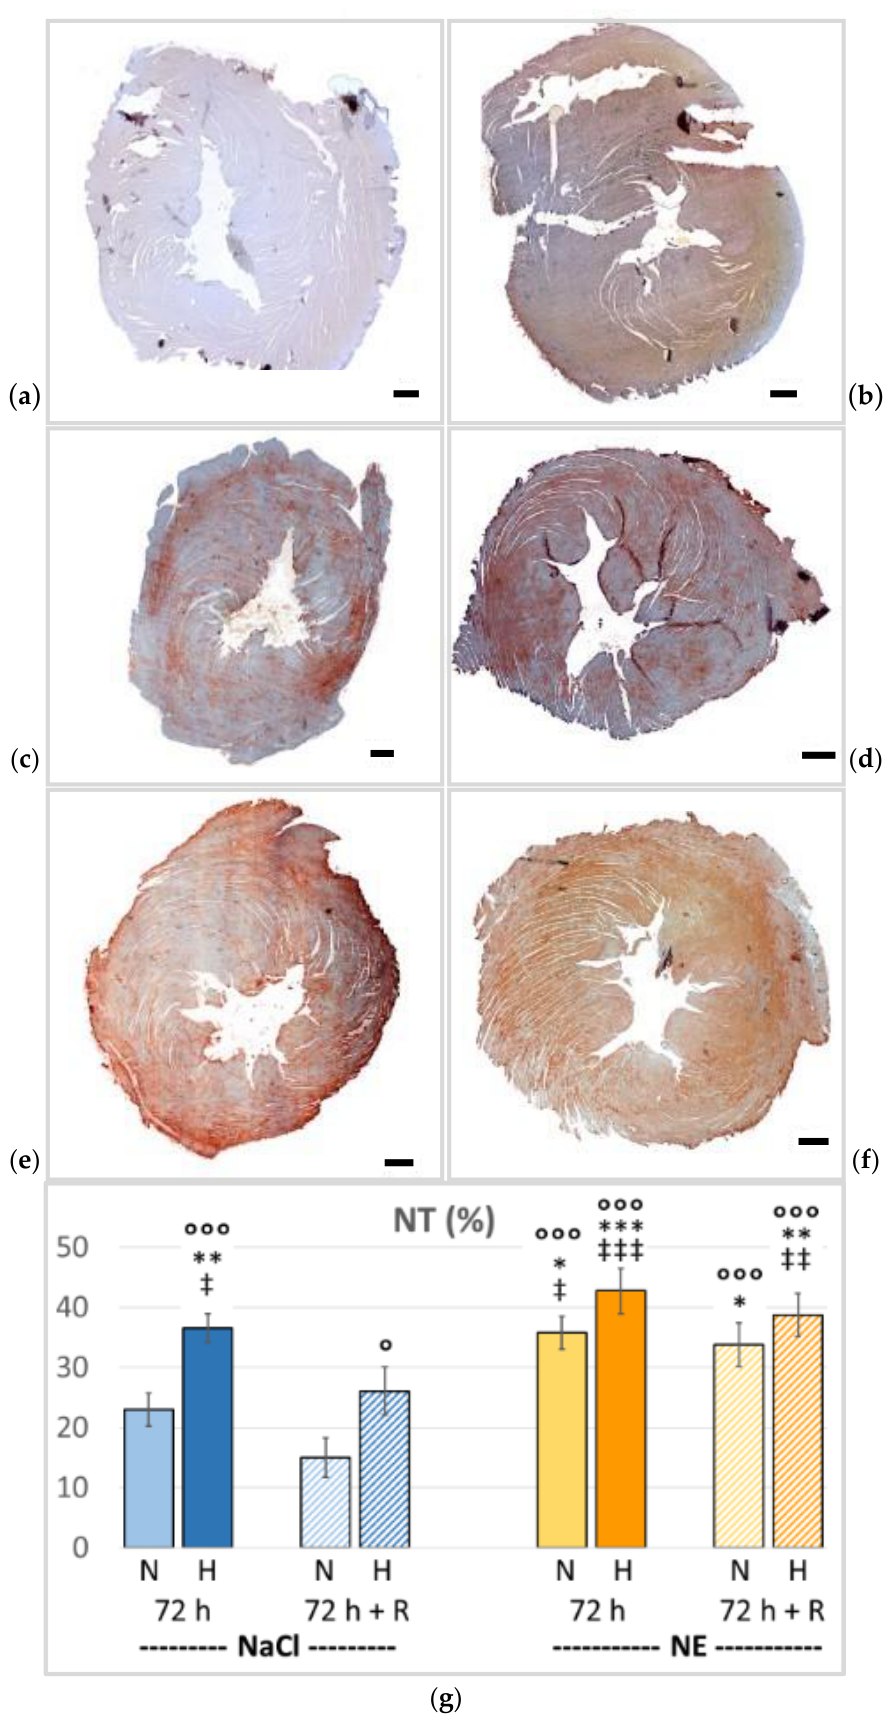
Figure 8.
Poly-ADP-ribose (PAR) in the heart: Representative immunohistochemical images from N-NaCl (a), H-NaCl (b), N-NE (c), H-NE (d), H-NaCl+R (e), and N-NE+R (f) hearts. (g) Abundance of PAR in the heart expressed as percentage of positive area related to the total area of the cardiac walls. Data are presented as means ± SEM. N normoxia; H hypoxia; NaCl, NE saline or norepinephrine infusion. Significance marks: significant difference vs. N-NaCl: * p<0.05; ** p<0.01; vs. H-NaCl+R: ‡ p<0.05; ‡‡‡ p<0.001. All images are shown in the same magnification with the scale bars indicating 500 µm each.
Figure 8.
Poly-ADP-ribose (PAR) in the heart: Representative immunohistochemical images from N-NaCl (a), H-NaCl (b), N-NE (c), H-NE (d), H-NaCl+R (e), and N-NE+R (f) hearts. (g) Abundance of PAR in the heart expressed as percentage of positive area related to the total area of the cardiac walls. Data are presented as means ± SEM. N normoxia; H hypoxia; NaCl, NE saline or norepinephrine infusion. Significance marks: significant difference vs. N-NaCl: * p<0.05; ** p<0.01; vs. H-NaCl+R: ‡ p<0.05; ‡‡‡ p<0.001. All images are shown in the same magnification with the scale bars indicating 500 µm each.
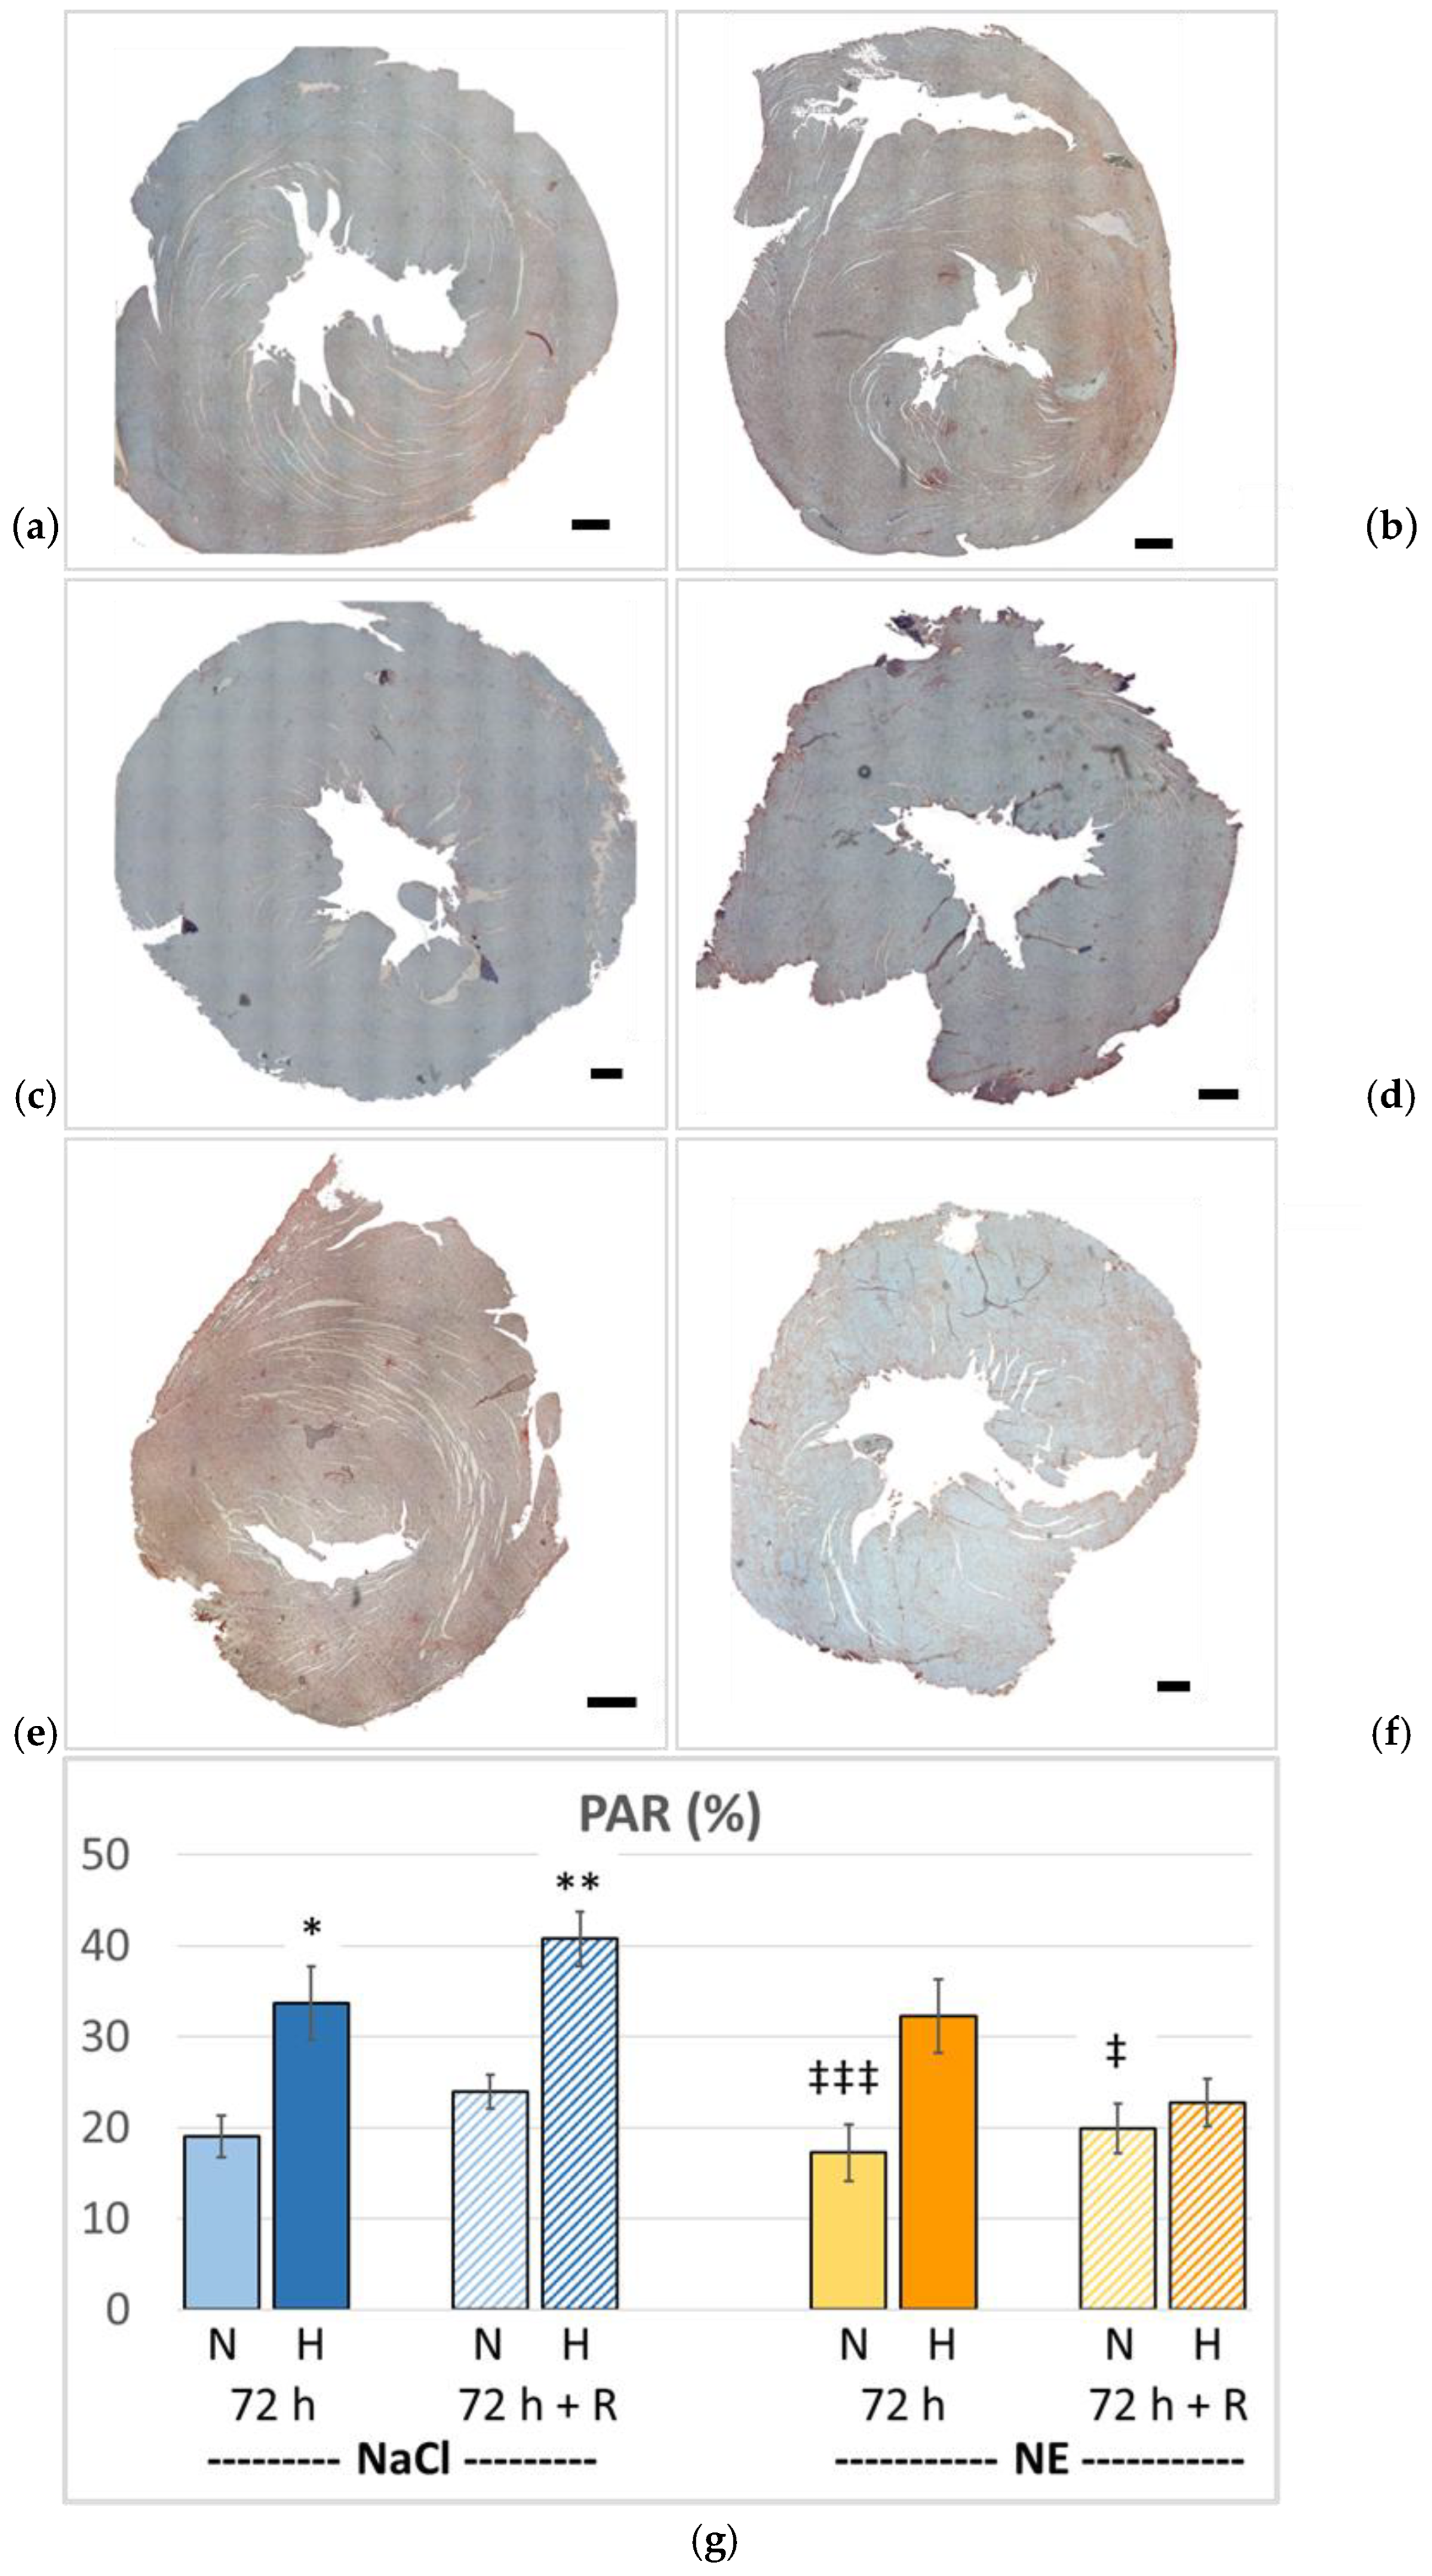
Figure 9.
Apoptosis-inducing factor (AIF) in the heart: Representative immunohistochemical images from N-NaCl (a), H-NaCl (b), N-NE (c), H-NE (d), H-NaCl+R (e), and N-NE+R (f) hearts. (g) Abundance of AIF in the heart expressed as percentage of positive area related to the total area of the cardiac walls. Data are presented as means ± SEM. N normoxia; H hypoxia; NaCl, NE saline or norepinephrine infusion. Significance marks: significant difference vs. N-NaCl: * p<0.05; ** p<0.01; vs. H-NaCl: † p<0.05; †† p<0.01; vs. N-NaCl+R: ° p<0.05; vs. H-NaCl+R: ‡ p<0.05; ‡‡ p<0.01. All images are shown in the same magnification with the scale bars indicating 500 µm each.
Figure 9.
Apoptosis-inducing factor (AIF) in the heart: Representative immunohistochemical images from N-NaCl (a), H-NaCl (b), N-NE (c), H-NE (d), H-NaCl+R (e), and N-NE+R (f) hearts. (g) Abundance of AIF in the heart expressed as percentage of positive area related to the total area of the cardiac walls. Data are presented as means ± SEM. N normoxia; H hypoxia; NaCl, NE saline or norepinephrine infusion. Significance marks: significant difference vs. N-NaCl: * p<0.05; ** p<0.01; vs. H-NaCl: † p<0.05; †† p<0.01; vs. N-NaCl+R: ° p<0.05; vs. H-NaCl+R: ‡ p<0.05; ‡‡ p<0.01. All images are shown in the same magnification with the scale bars indicating 500 µm each.
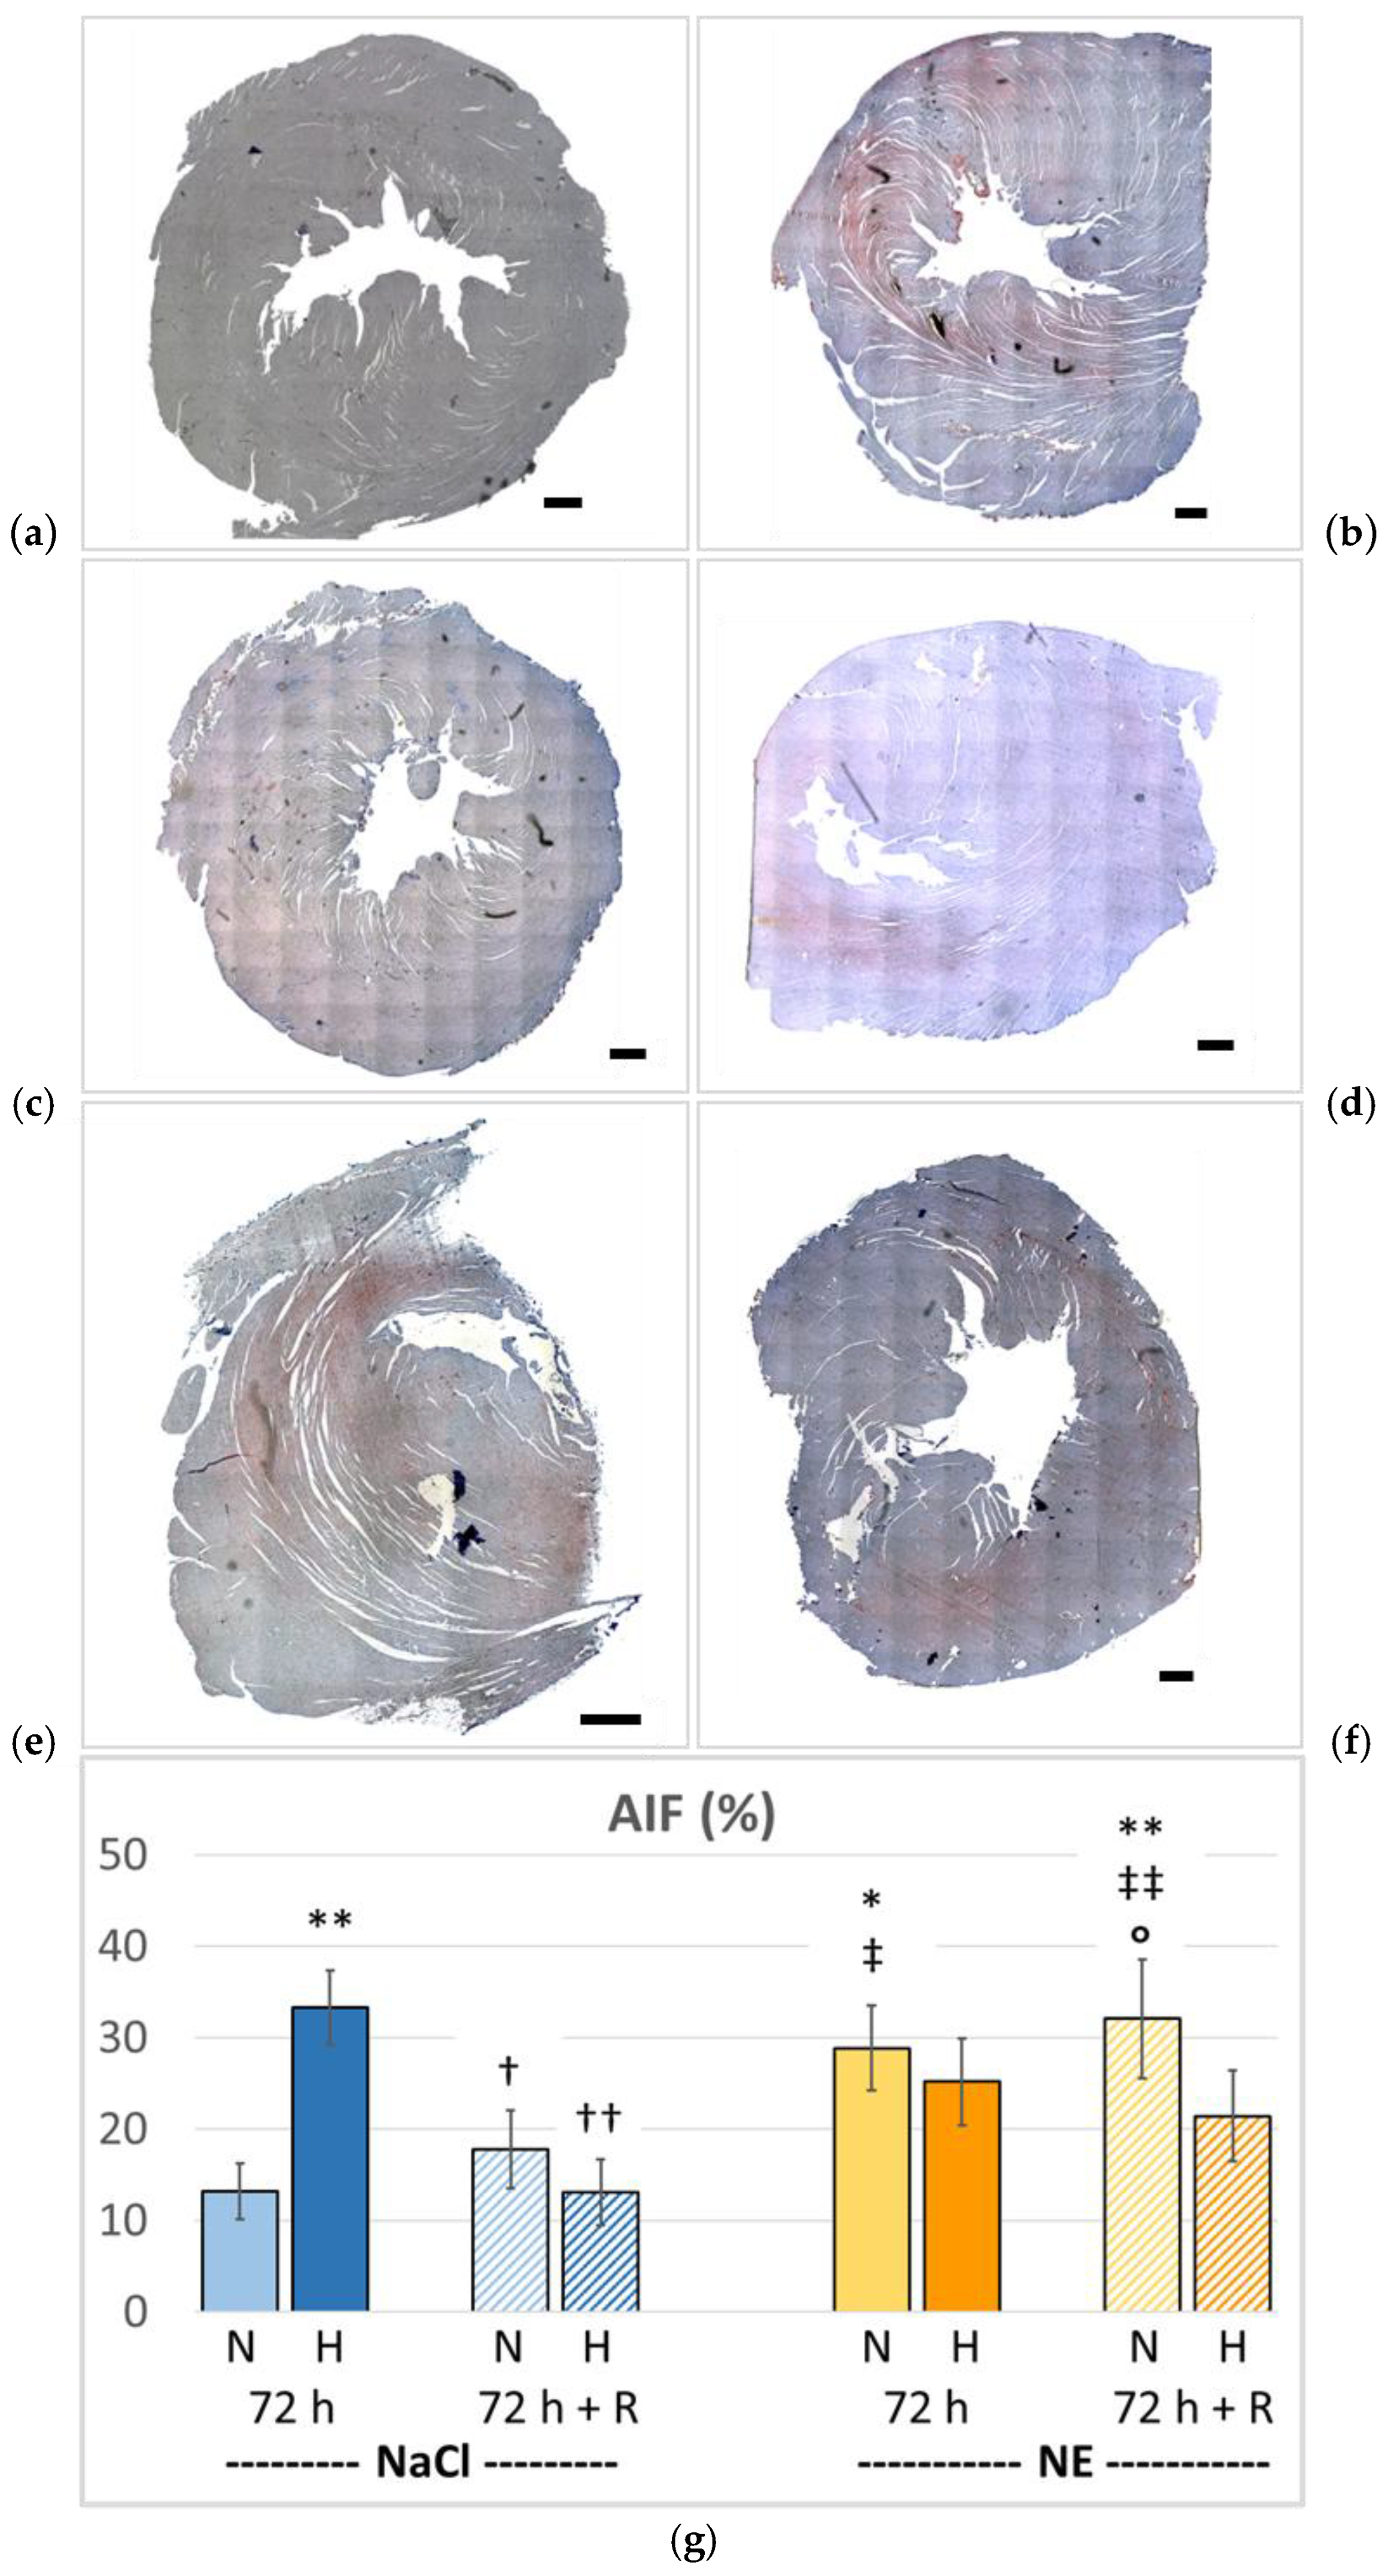

Table 1.
Oximetry and blood gas assessment.
| NaCl | NE | |||||||
|---|---|---|---|---|---|---|---|---|
| N-NaCl | H-NaCl | N-NaCl+R | H-NaCl+R | N-NE | H-NE | N-NE+R | H-NE+R | |
| pO2 (mmHg) | 97.1 (89.2; 100.2) |
86.7 (83.6; 93.8) |
94.0 (79.4; 106.3) |
97.1 (93.2; 110.8) |
92.3 (66.0; 100.2) |
76.5 | 105.0 (90.5; 118.0) |
89.9 (67.9; 100.3) |
| pCO2 (mmHg) | 38.1 (34.3; 41.3) |
33.3 (27.0; 38.3) |
38.2 (33.2; 44.0) |
35.4 (29.7; 38.4) |
45.7 40.7; 49.5) |
32.7 + 30.0; 36.7) |
28.9 +++ (10.3; 32.3) |
17.5 (16.7; 45.4) |
| cLac (mmol/L) | 0.9 (0.3; 1.6) |
3.0 (1.7; 5.8) |
2.4 (1.2; 3.9) |
2.1 (1.5; 4.1) |
2.7 (1.9; 3.2) |
3.1 (2.0; 3.3) |
2.5 (2.1; 3.0) |
2.6 (1.2; 4.5) |
* Partial pressures of oxygen (pO2) and carbon dioxide (pCO2); concentration of lactate (cLac). Data are presented as median (25th; 75th percentile). Significance marks: significant difference vs. N-NE: + p<0.05; +++ p<0.001.
Table 2.
Hemodynamic parameters.
| NaCl | NE | |||||||
|---|---|---|---|---|---|---|---|---|
| N-NaCl | H-NaCl | N-NaCl+R | H-NaCl+R | N-NE | H-NE | N-NE+R | H-NE+R | |
| LV dP/dt min (mmHg/s) | -11896 ± 468 |
-10175 ± 614 |
-10570 ± 1091 |
-14055 ††† ° ± 344 |
-8464 *** ± 633 |
-6668 *** ††† ± 461 |
-11069 + ± 820 |
-12126 ### ± 854 |
| RV dP/dt max (mmHg/s) | 2307 ± 183 |
2458 ± 192 |
2456 ± 274 |
2583 ± 226 |
2448 ± 158 |
2686 ± 190 |
2445 ± 151 |
2521 ± 141 |
| RV dP/dt min (mmHg/s) | -2098 ± 174 |
-1928 ± 137 |
-1986 ± 195 |
-2348 ± 167 |
-2024 ± 144 |
-2148 ± 151 |
-1996 ± 117 |
-2262 ± 152 |
| EF (%) |
62.9 (59.8; 63.6) |
52.0 (43.1; 62.3) |
61.2 (57.7; 71.8) |
59.6 (55.0; 84.1) |
45.9 (42.6; 57.8) |
43.9 (23.9; 57.5) |
60.5 (37.7; 66.6) |
65.2 (60.0; 69.3) |
| LV edV (μL) |
321 (294; 331) |
281 (244; 312) |
292 (243; 321) |
283 (245; 305) |
282 (258; 309) |
268 (248; 304) |
257 (243; 298) |
297 (284; 319) |
| DAP (mmHg) | 98.4 ± 3.9 |
79.8 *** ± 3.4 |
80.9 ** ± 5.7 |
100.0 ††† °° ± 2.7 |
82.7 ** ± 4.0 |
63.6***+++†† ± 2.8 |
103.4 +++ °°° ± 3.4 |
95.1 ### ° ± 2.5 |
| MAP (mmHg) | 109.6 ± 3.5 |
91.4 *** ± 3.6 |
91.4 ** ± 5.6 |
111.9 ††† °° ± 3.2 |
94.7 ** ± 4.0 |
77.9 *** ++ † ± 3.0 |
117.2 +++ °°° ± 3.5 |
108.0 ### °° ± 2.9 |
| TPR (mmHg min kg mL-1) | 0.28 (0.26; 0.31) |
0.25 (0.23; 0.30) |
0.22 (0.20; 0.30) |
0.31 (0.24; 0.34) |
0.31 (0.27; 0.38) |
0.32 (0.27; 0.61) |
0.34 ° (0.29; 0.45) |
0.31 (0.29; 0.32) |
* LV and RV maximum rate of pressure decrease (LV dP/dt min, RV dP/dt min); RV maximum rate of pressure increase (RV dP/dt max); ejection fraction (EF); LV end-diastolic pressure (LV edP); diastolic aortic pressure (DAP); mean aortic pressure (MAP); total peripheral resistance (TPR). Normally distributed data are presented as mean ± SEM. Data that are not normally distributed are presented as median (25th; 75th percentile). Significance marks: significant difference vs. N-NaCl: * p<0.05; ** p<0.01; *** p<0.001; vs. H-NaCl: † p<0.05; †† p<0.01; ††† p<0.001; vs. N-NE: + p<0.05; ++ p<0.01; +++ p<0.001; vs. H-NE: ### p<0.001; vs. N-NaCl+R: ° p<0.05; °° p<0.01; °°° p<0.001.
Disclaimer/Publisher’s Note: The statements, opinions and data contained in all publications are solely those of the individual author(s) and contributor(s) and not of MDPI and/or the editor(s). MDPI and/or the editor(s) disclaim responsibility for any injury to people or property resulting from any ideas, methods, instructions or products referred to in the content. |
© 2026 by the authors. Licensee MDPI, Basel, Switzerland. This article is an open access article distributed under the terms and conditions of the Creative Commons Attribution (CC BY) license (http://creativecommons.org/licenses/by/4.0/).
Copyright: This open access article is published under a Creative Commons CC BY 4.0 license, which permit the free download, distribution, and reuse, provided that the author and preprint are cited in any reuse.