

Submitted:
18 May 2026
Posted:
20 May 2026
You are already at the latest version
Abstract
Objective: To characterize the structural fragility of installed health-service capacity in Barranquilla, Atlántico, Colombia, using absolute capacity, supply concentration, reserve or transitory capacity, and service-line clinical sensitivity as structural-risk dimensions. Methods: An ecological health-services study was conducted using a local installed-capacity dataset traceable to the Colombian Special Registry of Health Service Providers and SISPRO, together with two contextual World Bank series for Colombia: physicians per 1,000 population and premature mortality from noncommunicable diseases. Traceable data cleaning, functional normalization, separation of baseline versus transitory capacity when allowed by the source fields, and exploratory estimation of a relative structural fragility proxy index using a normalized Poisson-type transformation were performed. This index was interpreted exclusively as a comparative structural-fragility ranking and not as an observed probability of saturation. Results: The analytical capacity of the Barranquilla node included 5,397 installed capacity slots. Adult ICU accounted for 707 slots and neonatal ICU for 160. Reserve capacity was low in neonatal ICU (2.5%) and higher in adult ICU (32.2%). The largest service lines were adult general hospitalization, adult ICU, and pediatric general hospitalization, whereas the highest relative structural fragility was observed in low-scale and highly concentrated services, including burn care, acute mental health, and selected highly specialized lines. Conclusion: Barranquilla has a broad but markedly heterogeneous structural health-service capacity network. The critical pattern is not determined only by the absolute number of slots, but by the interaction between limited capacity, high concentration, low stable reserve, and clinical sensitivity. The evidence generated is structural and should not be interpreted as observed occupancy, real-time saturation, or operational collapse.
Keywords:
installed capacity
; structural fragility
; Barranquilla
; REPS
; concentration
; Herfindahl Hirschman index
; mental health
; pediatric intensive care
; neonatal intensive care
; public health
Introduction
Assessing hospital sufficiency in complex urban systems cannot rely solely on crude counts of beds or service slots. Recent literature has shown that health-system resilience depends on the interaction between physical capacity, effective staffing, territorial distribution, provider concentration, the possibility of transitory expansion, and the type of service involved [7,8,9,10,11,12,13,14,15,16,17,18,19]. In particular, hospital occupancy is best understood as a complementary indicator of system pressure; however, its interpretation requires information on capacity, flows, and operational availability. Therefore, international thresholds, including the frequently cited 85% alert threshold, should be considered referential and not equivalent to real-world performance [8,9,10,14].
This clarification is particularly important for clinically sensitive services such as pediatric critical care, mental health, acute psychiatry, neonatal intensive care, and burn units. In these lines, a small number of slots may appear acceptable in absolute terms but become structurally fragile when supply is concentrated in a few providers or when expansion depends on transitory mechanisms [11,12,17,20,21,22,23,24]. In practice, structural fragility emerges when a service line combines low scale, high concentration, and limited stable response capacity. The objective of this study was to develop a critical reading of installed capacity in Barranquilla as a provider node within Atlántico, without assuming that the city represents the entire department. The study also sought to improve methodological traceability by specifying extraction platforms, data-cleaning procedures, functional normalization, the distinction between baseline and transitory capacity, and the analytical framework used to derive a relative structural fragility proxy index, explicitly acknowledging that real occupancy was not available and that an exact probability of saturation could not be estimated. The contribution of this study lies in integrating volume, concentration, reserve, and clinical sensitivity to identify potentially vulnerable lines even when the aggregate volume of service slots appears broad.
Methods
Design and Setting
An ecological and descriptive-analytical study of installed health-service capacity was conducted. The primary setting was Barranquilla, analyzed as a provider node within Atlántico. The analysis did not use data from other departments and did not assume that Barranquilla was equivalent to the departmental total. The design relied on administrative installed-capacity sources and country-level macro indicators for contextualization, not for direct local inference.
Data Sources and Extraction Platforms
The main source was a local installed-capacity file by provider/site, traceable to the Colombian Special Registry of Health Service Providers (REPS) and the SISPRO repository “Services and installed capacity of health-care institutions by department or district and legal nature” [1,2]. As macro-context, two World Bank/World Development Indicators CSV files were used: physicians per 1,000 people (SH.MED.PHYS.ZS) and premature mortality from cardiovascular disease, cancer, diabetes, or chronic respiratory disease between exact ages 30 and 70 years (SH.DYN.NCOM.ZS) [3,4,5,6]. Table 1 summarizes the platforms, analyzed files, analytical units, and role of each source. To strengthen regulatory traceability and national context, recent Ministry of Health documents related to REPS, service availability, and sectoral management frameworks were also reviewed [25,26,27,28,29].
Cleaning, Normalization, and Variable Construction
Data cleaning followed previously audited and traceable rules. Negative values were excluded from the analysis. Missing values would only be considered zero if the field represented capacity slots and the record explicitly indicated that the service did not apply; this condition was not observed in the final dataset. Duplicates by provider-site were flagged in a quality log and were not resolved by simple inference. A normalization dictionary was subsequently built to avoid double counting across functionally equivalent service labels, for example, conventional adult ICU and adult ICU “3100”. Consolidation used a conservative row-level rule (the maximum value across equivalent labels) to avoid overestimating supply.
Capacity was distinguished as baseline versus reserve/transitory only when the field name explicitly declared this distinction. When the file structure did not allow separation of baseline and transitory capacity, the line was analyzed as total capacity. Services were additionally grouped into clinical macroblocks (adult general/critical/observation, neonatal, pediatric, mental health/psychiatry, addictions/substance use, obstetric, burn care, and other services) to synthesize fragility patterns at a functional scale.
Structural Indicators
Four main dimensions were calculated: (1) absolute capacity by service line; (2) supply concentration, using the leading provider share, the cumulative share of the top three providers, and the Herfindahl-Hirschman Index (HHI); (3) reserve availability, expressed as the percentage of transitory slots over total capacity; and (4) clinical sensitivity, defined a priori to penalize lines in which delay or operational closure could generate more severe consequences, including pediatric ICU, neonatal ICU, acute mental health, psychiatry, and burn care [11,12,20,21,22,23,24].
Relative Structural Fragility Proxy Index
Because information on real occupancy, average length of stay, bed turnover, functional closures, staffing by shift, and temporal referral/counter-referral flows was unavailable, no observational probability of saturation was estimated. Instead, a relative structural fragility proxy index was constructed for exploratory and comparative purposes across service lines. The index integrated four predefined dimensions: lower effective capacity, greater supply concentration, greater dependence on reserve/transitory capacity, and higher clinical sensitivity. Concentration was represented through the Herfindahl-Hirschman Index and the cumulative share of the top three providers. Clinical sensitivity was assigned qualitatively a priori, penalizing lines in which delay, functional closure, or low redundancy could have more severe clinical consequences, such as neonatal ICU, pediatric ICU, acute mental health, psychiatry, and burn care [11,12,20,21,22,23,24].
To express results on a common scale, a normalized Poisson-type transformation was used, in which the parameter λ increased when low capacity, high concentration, reserve dependence, and greater clinical sensitivity coincided. The transformation p = 1 − exp(−λ) was used exclusively as a comparative scaling mechanism. Therefore, the resulting values should not be interpreted as a real probability of saturation, operational collapse, expected occupancy, or individual clinical risk. Their usefulness is limited to structurally ranking service lines within the analyzed set. The fragility traffic-light classification was defined by terciles of the service-line distribution: low, medium, and high relative structural fragility (Table 3).
Results
The normalized dataset consolidated 35 functional service lines and a total analytical capacity of 5,397 installed capacity slots. The network showed a strongly adult-centered profile: adult general hospitalization (2,163 slots) and adult ICU (707 slots) dominated installed capacity, whereas neonatal ICU contributed 160 slots and pediatric general hospitalization 355. These relationships are summarized in Table 2 and visualized in Figure 1.
However, a volume-based reading alone was not sufficient to identify relative structural fragility. When capacity was examined together with concentration, small but critically exposed services emerged. Figure 2 shows a particularly sensitive quadrant in the low-capacity and high-HHI segment, where adult and pediatric burn ICU, acute mental care, pediatric mental health, and selected highly specialized lines were located. Table 3 presents the 10 service lines with the highest relative structural fragility proxy index.
Lines classified with a high signal should not be interpreted as currently saturated services, but as lines with greater relative structural fragility within the analyzed set. Descriptively, these lines shared three patterns: low capacity scale, high concentration among providers, and greater clinical sensitivity. Operational interpretation of these findings requires additional information on real occupancy, staffing availability, referral flows, functional closures, and timeliness of access.
Reserve availability was not distributed homogeneously. Reserve dependence was very low in neonatal ICU (2.5%) and considerably higher in adult ICU (32.2%), suggesting that part of adult slack may depend on slots that are not necessarily stable. This pattern is relevant because a high physical ceiling can overestimate resilience when the permanent base is comparatively smaller. Additionally, 19 lines showed high HHI (>2,500), a finding compatible with structural dependence on few providers even within a sizeable network.
At the macroblock level, the largest volume corresponded to adult general/critical/observation services, followed by pediatric and neonatal services. However, the highest mean proxy index shifted toward mental health/psychiatry and burn care, reflecting the combined influence of lower scale and concentration. Table 4 summarizes this synthesis and Figure 3 facilitates comparison across clinical macroblocks.
Discussion
The central finding of this study is that structural fragility of installed capacity does not necessarily coincide with the highest absolute volume of service slots. In apparently broad urban networks, structural sufficiency should not be assessed only by the aggregate magnitude of supply, but also by its functional distribution, concentration among providers, reserve stability, and the clinical sensitivity of each service line. This approach does not allow claims about observed saturation or real operational performance; however, it does identify lines with greater relative structural vulnerability that should be prioritized in surveillance, planning, and sufficiency analysis.
The results also suggest that concentration is an insufficiently incorporated dimension in local discussions of installed capacity. High HHI in multiple lines indicates that operational continuity of certain services may depend on very few providers. From a public-health perspective, this implies greater vulnerability to closures, financial crises, supply shortages, workforce constraints, or contractual reconfigurations. International evidence on pediatric critical care and respiratory-surge management supports the importance of considering not only how many beds exist, but also where they are located, how much load they absorb, and how balanced their distribution is [20,21,22,23,24].
Another relevant finding was the difference between baseline and transitory capacity. Neonatal ICU showed a relatively stable structure, whereas adult ICU depended more heavily on reserve capacity. This contrast does not allow the inference of saturation, but it does modulate the interpretation of sufficiency. A service with more total slots may be less resilient than a service with fewer slots if much of its expansion depends on contingent mechanisms. This distinction is consistent with contemporary hospital-resilience frameworks that emphasize real rather than merely nominal redundancy [16,17,18,19].
The analysis benefited from a more explicit methodology for traceability and cleaning. Identification of negative values, duplicates, nominal equivalences, and transitory capacity helped avoid double-counting bias and structural optimism. In addition, explicit mention of SISPRO/REPS and World Bank DataBank extraction platforms improves reproducibility and allows other groups to replicate or extend the approach in other cities [1,2,3,4,5,6,25,26,27,28,29].
The main strength of the study is the integration of data-quality auditing, clinical normalization, structural modeling, and advanced visualization into a single analytical workflow. Another strength is the use of recent references and official platforms to anchor methodological interpretation and sectoral discussion. However, the limitations are substantive. First, the study did not include real occupancy, average length of stay, bed turnover, functional closures, staffing by shift, or referral/counter-referral flows. Second, the unit of analysis was structural and administrative; therefore, the results cannot infer timeliness of access, quality of care, operational continuity, or clinical outcomes. Third, the relative structural fragility proxy index was designed as an exploratory tool for internal ranking and not as a validated predictive model. Consequently, the findings should be interpreted as a mapping of relative structural fragility rather than as evidence of observed saturation, real operational deficit, or service collapse.
Conclusions
Barranquilla presents a broad but heterogeneous structural network of installed health-service capacity. Relative fragility is not necessarily concentrated in the lines with the largest number of slots, but in those that combine low scale, high concentration, limited stable slack, and high clinical sensitivity. Acute mental health, burn care, and selected pediatric and specialized lines require priority structural surveillance. These findings should not be interpreted as evidence of observed saturation, but as an analytical signal to guide health planning, sufficiency monitoring, reduction of excessive dependence on few providers, and strengthening of clinically sensitive services. Future studies should integrate real occupancy, temporal flows, workforce availability, and clinical outcomes to move from structural fragility mapping toward operational risk assessment.
Ethics and Consent
This study used secondary administrative data on installed capacity and did not include identifiable patient data or intervention on human participants; therefore, individual informed consent did not apply.
Data and Code Availability
Derived analytical files, including Excel sheets, JSONL files, and HTML visualizations, may be shared as supplementary material and/or upon reasonable request to the corresponding author.
Conflicts of Interest
The authors declare no conflicts of interest related to the content, analysis, or interpretation of the results of this study.
Use of Artificial Intelligence
Computational assistance was used to support editorial organization, textual cleaning, and manuscript structuring. Study conception, interpretation of results, critical review, final approval, and responsibility for the content remain exclusively with the human authors.
References
- Ministerio de Salud y Protección Social de Colombia; SISPRO. Registro Especial de Prestadores de Servicios de Salud (REPS) (Internet). SISPRO: Bogotá, 2025. Available online: https://www.sispro.gov.co/central-prestadores-de-servicios/Pages/REPS-Registro-especial-de-prestadores-de-servicios-de-salud.aspx.
- Ministerio de Salud y Protección Social de Colombia; SISPRO. Servicios y capacidad instalada de las IPS por departamento o distrito y naturaleza jurídica (Internet). SISPRO: Bogotá, 2025. Available online: https://www.sispro.gov.co/central-prestadores-de-servicios/Pages/Servicios-y-capacidad-de-IPS-por-naturaleza-juridica.aspx.
- World Bank. Physicians (per 1,000 people) (Internet); World Bank: Washington, DC, 2025; Available online: https://data.worldbank.org/indicator/SH.MED.PHYS.ZS.
- World Bank. Metadata glossary: Physicians (per 1,000 people), code SH.MED.PHYS.ZS (Internet); World Bank: Washington, DC, 2025; Available online: https://databank.worldbank.org/metadataglossary/health-nutrition-and-population-statistics/series/SH.MED.PHYS.ZS.
- World Bank. Mortality from CVD, cancer, diabetes or CRD between exact ages 30 and 70 (%) (Internet); World Bank: Washington, DC, 2025; Available online: https://data.worldbank.org/indicator/SH.DYN.NCOM.ZS.
- World Bank. Metadata glossary: SH.DYN.NCOM.ZS (Internet); World Bank: Washington, DC, 2025; Available online: https://databank.worldbank.org/metadataglossary/world-development-indicators/series/SH.DYN.NCOM.ZS.
- World Health Organization. Beds, hospital beds (per 10,000 population) (Internet); WHO: Geneva, 2025; Available online: https://www.who.int/data/gho/data/indicators/indicator-details/GHO/hospital-beds-%28per-10-000-population%29.
- OECD. Hospital beds (Internet); OECD: Paris, 2025; Available online: https://www.oecd.org/en/data/indicators/hospital-beds.html.
- OECD. Hospital beds and occupancy. In Health at a Glance 2025 (Internet); OECD: Paris, 2025; Available online: https://www.oecd.org/en/publications/health-at-a-glance-2025_8f9e3f98-en/full-report/hospital-beds-and-occupancy_152d839e.html.
- OECD; European Commission. Hospital beds and discharges. In Health at a Glance: Europe 2024 (Internet); OECD: Paris, 2024; Available online: https://www.oecd.org/en/publications/health-at-a-glance-europe-2024_b3704e14-en/full-report/component-64.html.
- World Health Organization Regional Office for Europe. Mental health systems capacity in European Union, Iceland and Norway (Internet); WHO Europe: Copenhagen, 2024; Available online: https://www.who.int/europe/publications/i/item/WHO-EURO-2024-9529-49301-73695.
- World Health Organization Regional Office for Europe. Strengthening mental health in the WHO European Region (Internet); WHO Europe: Copenhagen, 2025; Available online: https://www.who.int/europe/publications/i/item/WHO-EURO-2025-11229-51001-51001.
- Burke, S.; Parker, S.; Fleming, P.; Barry, S.; Thomas, S. Building health system resilience through policy development in response to COVID-19 in Ireland: From shock to reform. Lancet Reg. Health Eur. 2021, 9, 100223. [Google Scholar] [CrossRef] [PubMed]
- Sagan, A.; Thomas, S.; Webb, E.; McKee, M. Assessing resilience of a health system is difficult but necessary to prepare for the next crisis. BMJ 2023, 382, e073721. [Google Scholar] [CrossRef] [PubMed]
- Saulnier, D.D.; Duchenko, A.; Ottilie-Kovelman, S.; Tediosi, F.; Blanchet, K. Re-evaluating our knowledge of health system resilience during COVID-19: Lessons from the first two years of the pandemic. Int. J. Health Policy Manag. 2023, 12, 6659. [Google Scholar] [CrossRef] [PubMed]
- Copeland, S.; Hinrichs-Krapels, S.; Fecondo, F.; Agerholm, J.; Kennedy, M.; Legido-Quigley, H. A resilience view on health system resilience: A scoping review of empirical studies and reviews. BMC Health Serv. Res. 2023, 23. [Google Scholar] [CrossRef] [PubMed]
- Khalil, M.; Ravaghi, H.; Samhouri, D.; Abo, J.; Ali, A.; Sakr, H.; et al. What is hospital resilience? A scoping review on conceptualization, operationalization, and evaluation. Front Public Health 2022, 10, 1009400. [Google Scholar] [CrossRef] [PubMed]
- Al Asfoor, D.; Al Heraish, A.; Almaskari, S.; Kiani, M.; Perla, R.J.; Al Zadjali, N.; et al. Concept analysis of health system resilience. BMC Health Serv. Res. 2024, 24. [Google Scholar] [CrossRef] [PubMed]
- Tonga, C.; Verdonck, K.; Essomba Edzoa, B.; Ewokolo Ateba, O.; Marchal, B.; Michielsen, J. How is health system resilience being assessed? A scoping review. Int. J. Health Policy Manag. 2024, 13, 8097. [Google Scholar] [CrossRef] [PubMed]
- Zheng, Q.; Zeng, Z.; Tang, X.; Ma, L. Impact of an ICU bed capacity optimisation method on the average length of stay and average cost of hospitalisation after the open policy of COVID-19 in China: A difference-in-differences analysis. BMJ Open 2024, 14, e078069. [Google Scholar] [CrossRef] [PubMed]
- Ganesan, S.L.; Garros, D.; Foster, J.; Di Genova, T.; Fontela, P.S.; Murthy, S.; et al. Pediatric critical care capacity in Canada. Paediatr. Child. Health 2024, 30(1), 30–39. [Google Scholar] [CrossRef] [PubMed]
- Bongiorno, D.M.; Ravicz, M.; Nadeau, N.L.; Michelson, K.A.; Alpern, E.R.; Myers, S.R.; et al. Pediatric capacity crisis: A framework and strategies to prepare for a pediatric surge. J. Am. Coll. Emerg. Physicians Open. 2024, 5(1), e13093. [Google Scholar] [CrossRef] [PubMed]
- Christner, L.P.; Carlton, E.F.; Gorga, S.; Whittington, T.; Odetola, F.O. The 2022-2023 pediatric respiratory illness surge: Survey of acute and critical care resource use. Disaster Med. Public Health Prep. 2024, 18, e127. [Google Scholar] [CrossRef] [PubMed]
- Ijaz, N.; Radu, C.; Rothenberg, C.; Janke, A.T.; Venkatesh, A.K. Pediatric bed capacity, bed strain, and load imbalance during the 2022 respiratory viral season. JAMA Netw. Open. 2025, 8(9), e2533943. [Google Scholar] [CrossRef] [PubMed]
- Janke, A.T.; Venkatesh, A.K. Understanding and addressing the US hospital bed shortage-Build, Baby, Build. JAMA Netw. Open. 2025, 8(2), e2460652. [Google Scholar] [CrossRef] [PubMed]
- Ministerio de Salud y Protección Social de Colombia. Informe de gestión 2024 (Internet). MSPS: Bogotá, 2025. Available online: https://www.minsalud.gov.co/sites/rid/Lists/BibliotecaDigital/RIDE/DE/PES/informe-gestion-msps-2024.pdf.
- Ministerio de Salud y Protección Social de Colombia. Ranquin de Instituciones Prestadoras de Servicios de Salud 2024 (Internet). MSPS: Bogotá, 2024. Available online: https://www.minsalud.gov.co/sites/rid/Lists/BibliotecaDigital/RIDE/VP/DOA/ranquin-ips-2024.pdf.
- Ministerio de Salud y Protección Social de Colombia. Circular Externa No. 010 de 2024 (Internet). MSPS: Bogotá, 2024. Available online: https://www.minsalud.gov.co/Normatividad_Nuevo/Circular%20Externa%20No.%20010%20de%202024.pdf.
- Ministerio de Salud y Protección Social de Colombia. Resolución No. 465 de 2025 (Internet). MSPS: Bogotá, 2025. Available online: https://www.minsalud.gov.co/Normatividad_Nuevo/Resolucion%20No%20465%20de%202025.pdf.
Figure 1.
Barranquilla node: top 12 service lines by total installed capacity. The horizontal bar chart shows the predominance of adult service lines and the structural weight of adult ICU within the node.
Figure 1.
Barranquilla node: top 12 service lines by total installed capacity. The horizontal bar chart shows the predominance of adult service lines and the structural weight of adult ICU within the node.
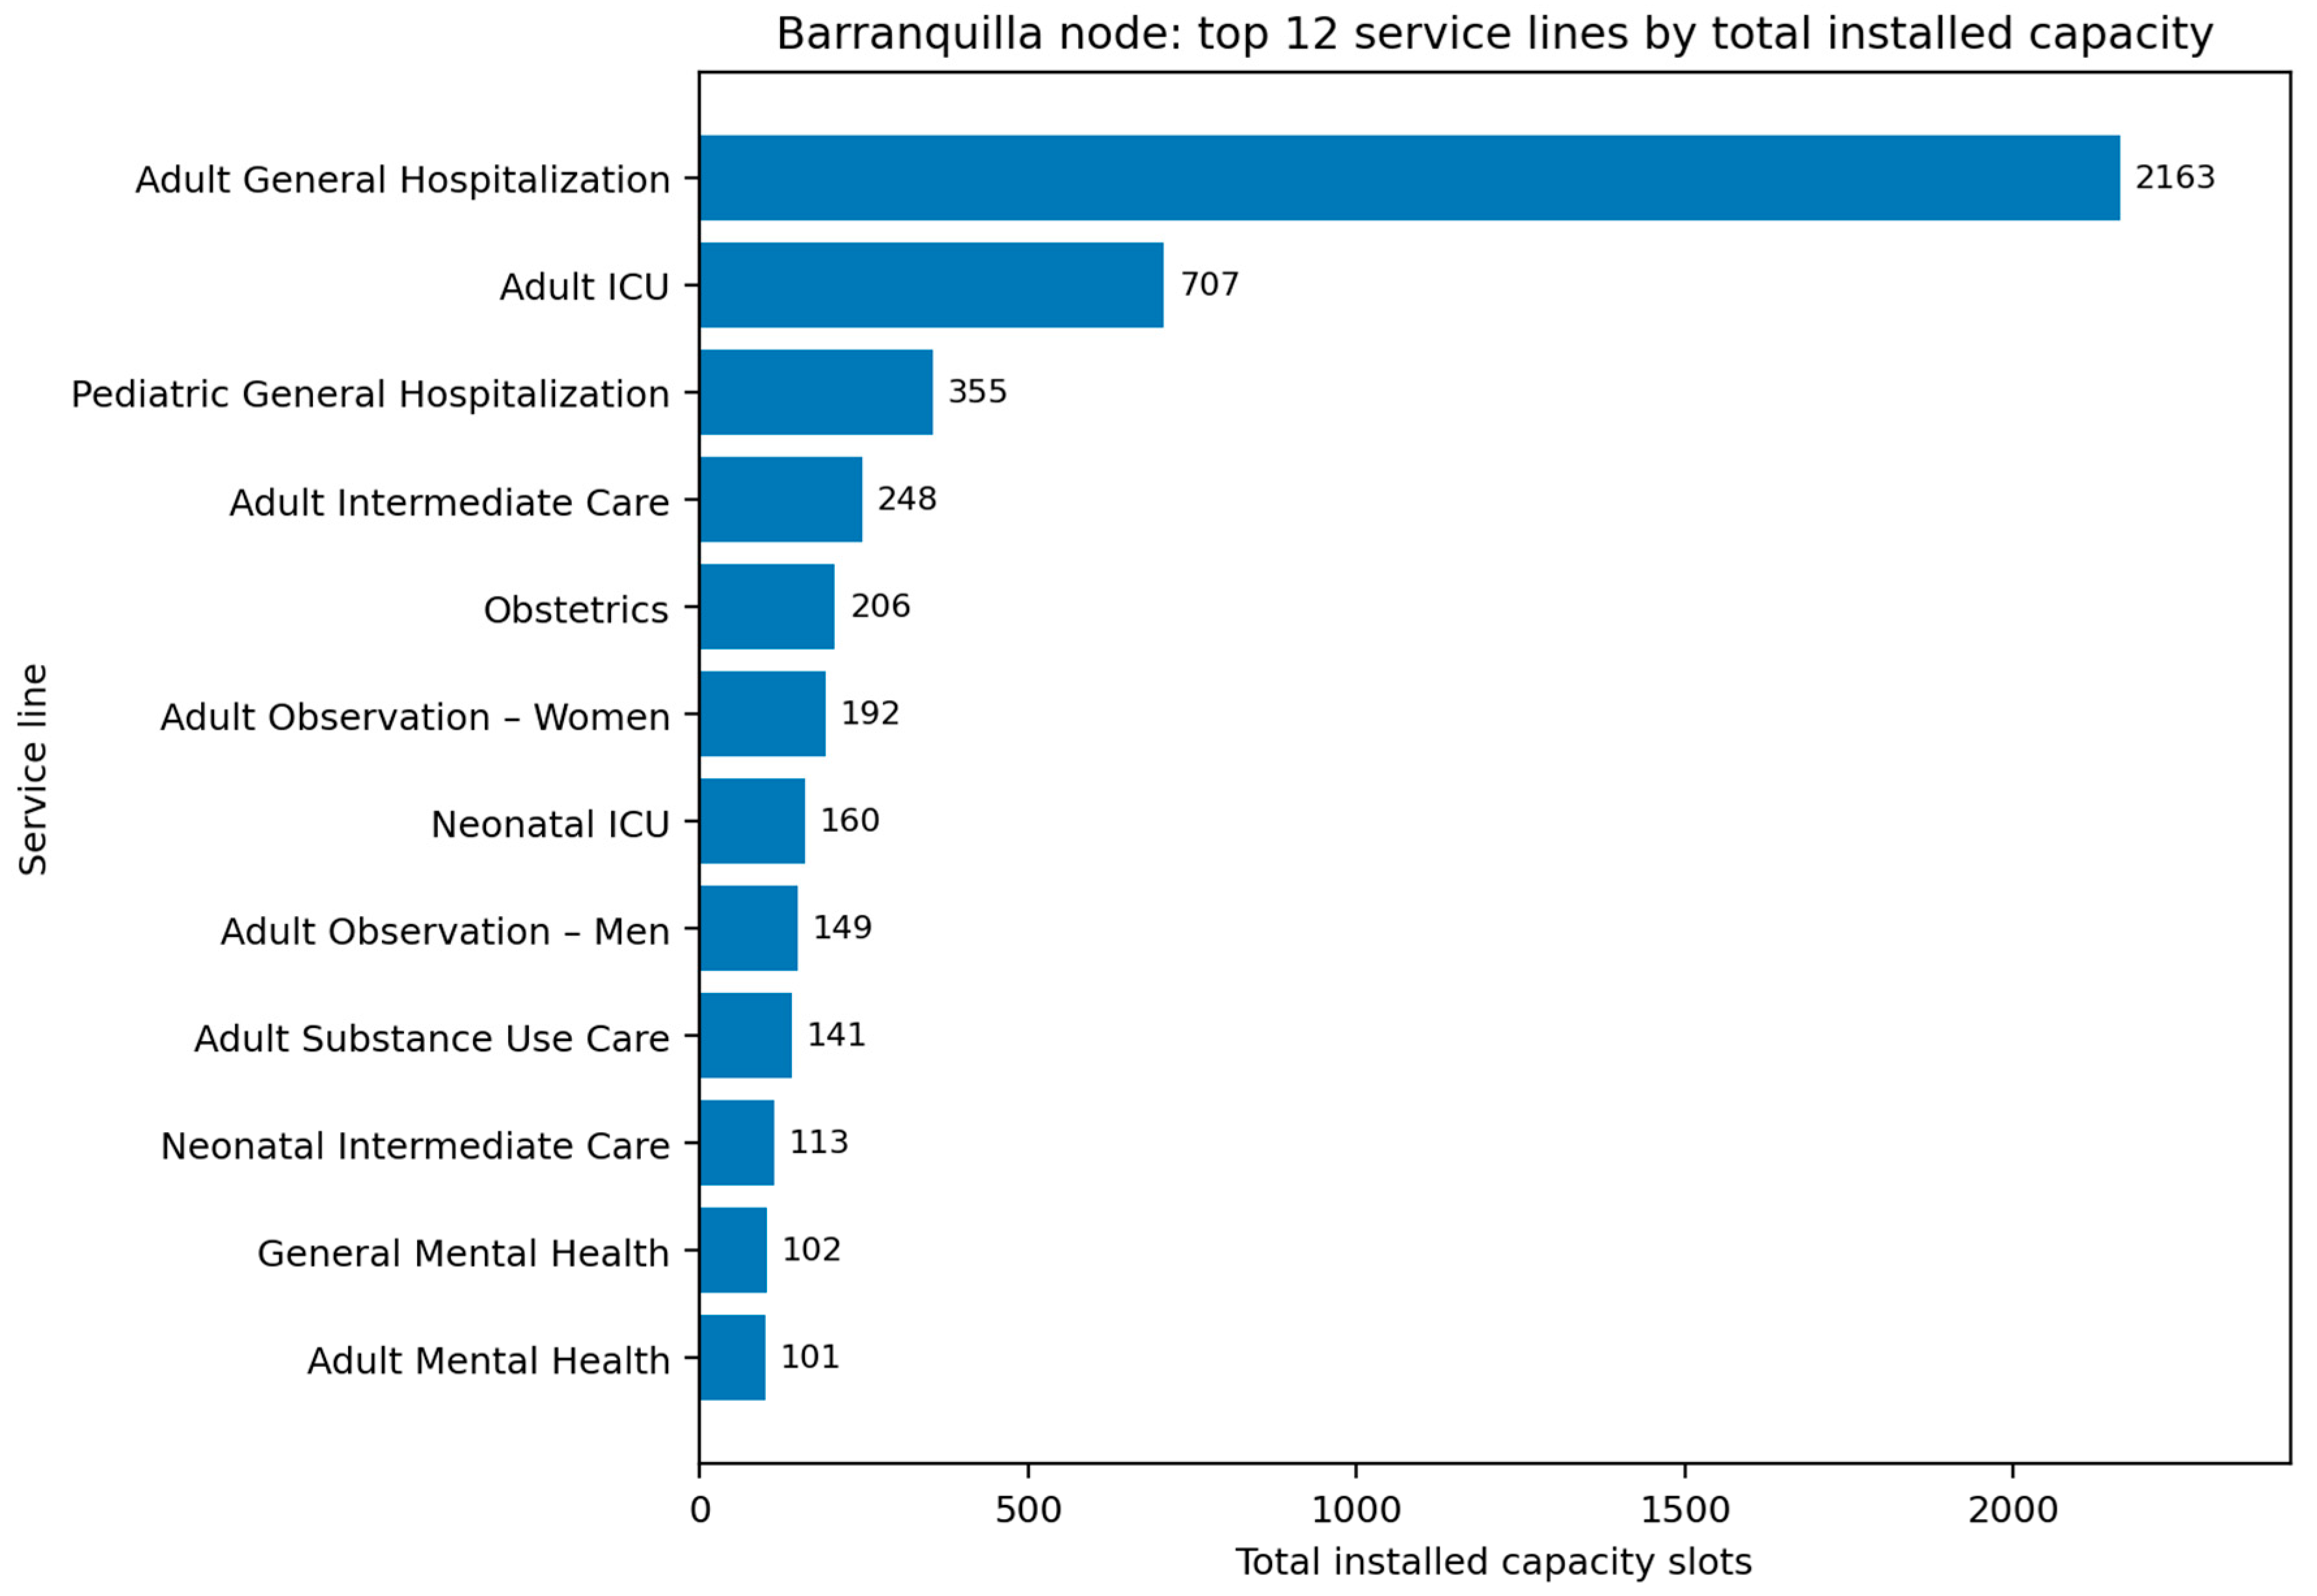
Figure 2.
Concentration versus capacity (marker size = relative structural fragility proxy index). Each marker represents a service line. Marker size increases with the relative structural fragility proxy index, and the marker type/color follows the traffic-light signal.
Figure 2.
Concentration versus capacity (marker size = relative structural fragility proxy index). Each marker represents a service line. Marker size increases with the relative structural fragility proxy index, and the marker type/color follows the traffic-light signal.
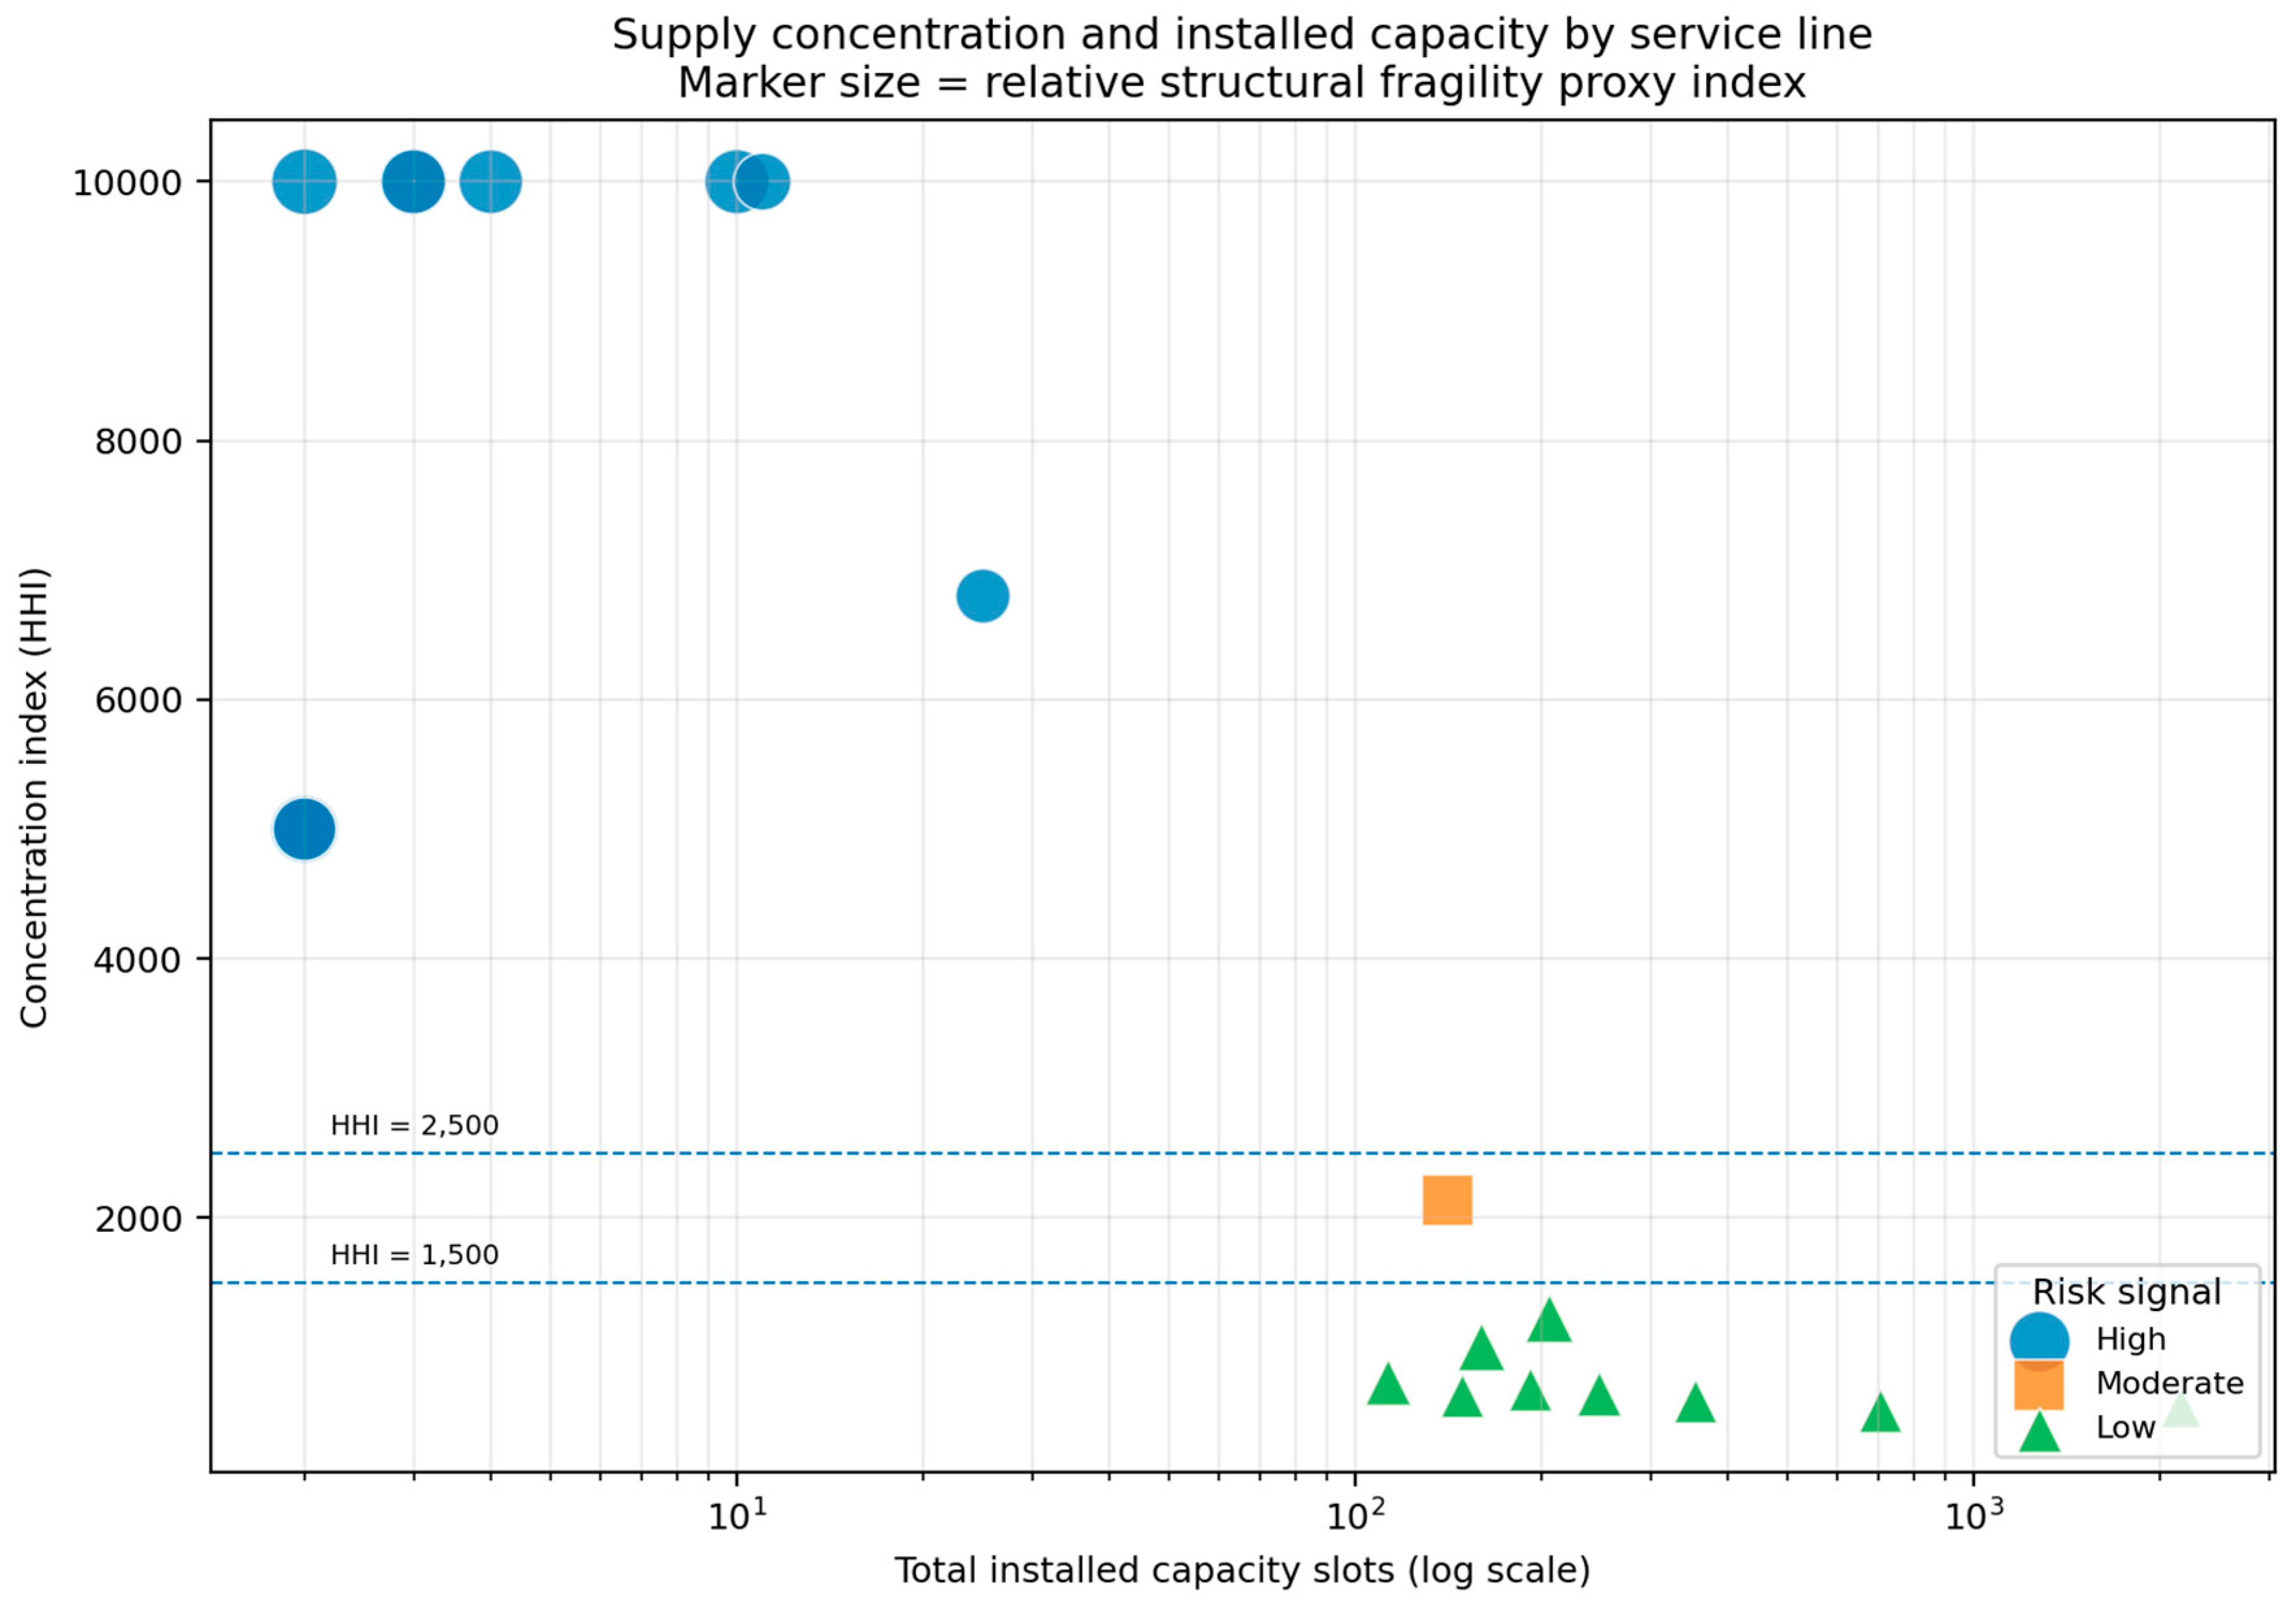
Figure 3.
Mean relative structural fragility proxy index by clinical macroblock. Mental health/psychiatry and burn care show greater relative structural exposure despite their lower absolute volume.
Figure 3.
Mean relative structural fragility proxy index by clinical macroblock. Mental health/psychiatry and burn care show greater relative structural exposure despite their lower absolute volume.
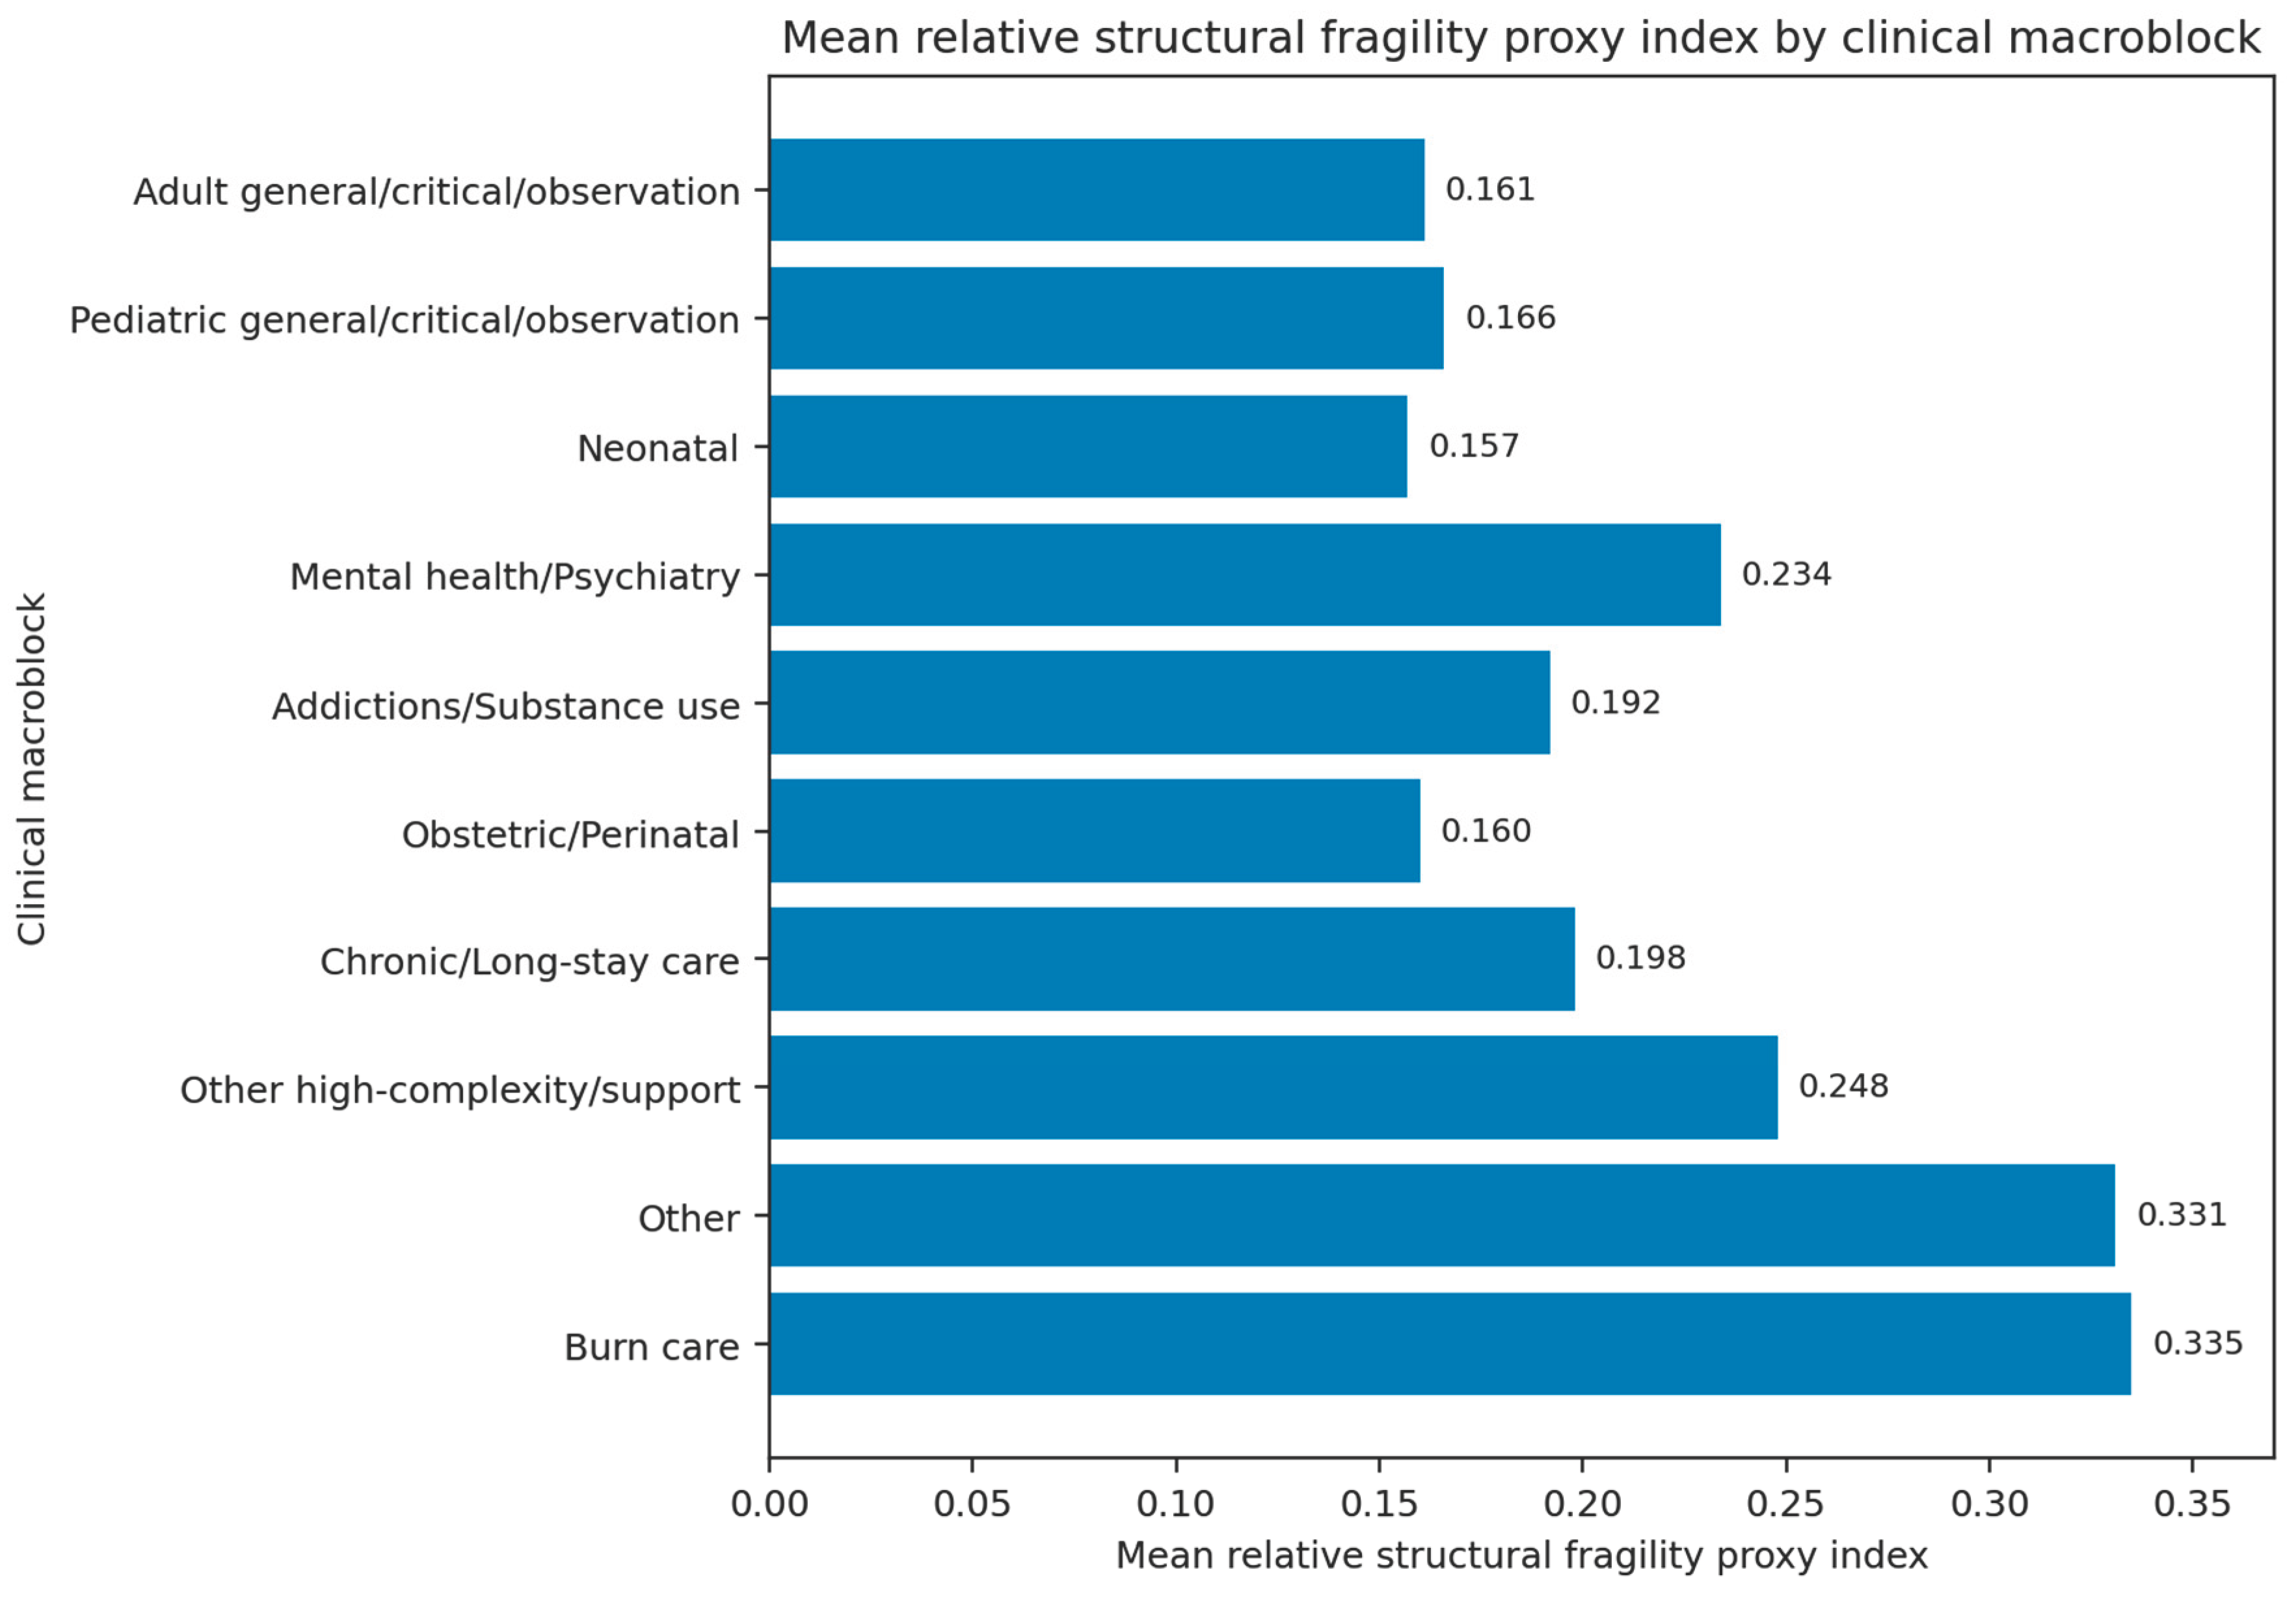

Table 1.
Extraction platforms, analyzed files, and role of each source.
| Platform | Analyzed file | Analytical unit | Analytical role |
| SISPRO/REPS | Local extract ‘CAPACIDAD_INSTALADA_EN_BARRANQUILLA_20260228.xlsx’ | Provider-site and capacity lines | Main source: tracer installed supply |
| World Bank DataBank/WDI | WB_WDI_SH_MED_PHYS_ZS.csv | Colombia, annual series | Macro-context for medical workforce |
| World Bank DataBank/WDI | WB_GS_SH_DYN_NCOM_ZS.csv | Colombia, annual series | Macro-context for premature NCD mortality |
The local source was treated as an administrative extract traceable to REPS/SISPRO; the World Bank series were used only to contextualize the local analysis.
Table 2.
Top 10 service lines by total installed capacity.
| Service line | Total slots | Providers with capacity | % reserve | HHI | Concentration |
| Adult General Hospitalization | 2163 | 47 | 0.0 | 538 | Low |
| Adult ICU | 707 | 31 | 0.3 | 511 | Low |
| Pediatric General Hospitalization | 355 | 23 | 0.1 | 585 | Low |
| Adult Intermediate Care | 248 | 30 | 0.2 | 641 | Low |
| Obstetrics | 206 | 10 | 0.0 | 1224 | Low |
| Adult Observation – Women | 192 | 20 | 0.0 | 676 | Low |
| Neonatal ICU | 160 | 16 | 0.0 | 1004 | Low |
| Adult Observation – Men | 149 | 20 | 0.0 | 627 | Low |
| Adult Substance Use Care | 141 | 5 | 0.0 | 2133 | Moderate |
| Neonatal Intermediate Care | 113 | 17 | 0.0 | 731 | Low |
The table shows that the largest structural volume is concentrated in adult general hospitalization, adult ICU, and pediatric general hospitalization.
Table 3.
Service lines with the highest relative structural fragility proxy index.
| Service line | Macroblock | Total slots | % reserve | HHI | Top 3 (%) | Proxy index | Signal |
| Adult Burn ICU | Burn care | 2 | 0.0 | 5000 | 100.0 | 0.367 | High |
| Pediatric Burn ICU | Burn care | 3 | 0.0 | 10000 | 100.0 | 0.353 | High |
| Acute Mental Care | Mental health/Psychiatry | 2 | 0.0 | 10000 | 100.0 | 0.349 | High |
| TPR | Other | 10 | 100.0 | 10000 | 100.0 | 0.331 | High |
| Pediatric Mental Health | Mental health/Psychiatry | 3 | 0.0 | 10000 | 100.0 | 0.326 | High |
| Adult General Observation | Adult general/critical/observation | 4 | 100.0 | 10000 | 100.0 | 0.326 | High |
| Adult Burn Care | Burn care | 2 | 0.0 | 5000 | 100.0 | 0.310 | High |
| Pediatric Burn Care | Burn care | 2 | 0.0 | 5000 | 100.0 | 0.310 | High |
| Hematopoietic Progenitor Transplantation | Other high-complexity/support | 11 | 0.0 | 10000 | 100.0 | 0.248 | High |
| Mental Health Stretchers | Mental health/Psychiatry | 25 | 0.0 | 6800 | 100.0 | 0.222 | High |
The ranking integrates capacity, concentration, reserve, and clinical sensitivity; it does not represent real occupancy or observed saturation.
Table 4.
Summary by clinical macroblock.
| Macroblock | N lines | Total slots | Median HHI | Median % reserve | Mean proxy index |
| Adult general/critical/observation | 6 | 3463 | 634 | 12.5 | 0.161 |
| Pediatric general/critical/observation | 4 | 536 | 1021 | 0.7 | 0.166 |
| Neonatal | 3 | 341 | 830 | 0.0 | 0.157 |
| Mental health/Psychiatry | 6 | 327 | 5935 | 0.0 | 0.234 |
| Addictions/Substance use | 5 | 321 | 4688 | 0.0 | 0.192 |
| Obstetric/Perinatal | 2 | 271 | 1972 | 0.0 | 0.160 |
| Chronic/Long-stay care | 3 | 108 | 2837 | 0.0 | 0.198 |
| Other high-complexity/support | 1 | 11 | 10000 | 0.0 | 0.248 |
| Other | 1 | 10 | 10000 | 100.0 | 0.331 |
| Burn care | 4 | 9 | 5000 | 0.0 | 0.335 |
The indices are relative and comparative across macroblocks; they are not equivalent to a real probability of saturation.
Disclaimer/Publisher’s Note: The statements, opinions and data contained in all publications are solely those of the individual author(s) and contributor(s) and not of MDPI and/or the editor(s). MDPI and/or the editor(s) disclaim responsibility for any injury to people or property resulting from any ideas, methods, instructions or products referred to in the content. |
© 2026 by the authors. Licensee MDPI, Basel, Switzerland. This article is an open access article distributed under the terms and conditions of the Creative Commons Attribution (CC BY) license.
Copyright: This open access article is published under a Creative Commons CC BY 4.0 license, which permit the free download, distribution, and reuse, provided that the author and preprint are cited in any reuse.