

Submitted:
19 May 2026
Posted:
19 May 2026
You are already at the latest version
Abstract
The landscapes of most tropical regions have been shaped by the indigenous peoples’ and their livelihood practices. The utility of plants within these landscapes for traditional purposes has been facing intense competition from commercial logging. To gain insights into this conflict, this paper examined how landscape conditions may influence the presence and spatial distribution of indigenous subsistence and commercial logging ecosystem services relative to one another. Data on the ecosystem services and landscape conditions in the form of physical environment variables were obtained for twelve indigenous villages in the Rupununi, Southern Guyana. For each village, the relative log risk ratios of subsistence values to logging values were computed and regressed against six physical environment variables – village presence, distance to village, distance to road, distance to waterways, elevation, and slope – to examine if and how landscape conditions may favor the presence of one service over the other. The estimates were then used to map the relative differences in the spatial distributions of subsistence and commercial logging services in each village. It was found that mean relative log risk ratios for the villages were generally positive, indicating an inclination towards the presence of subsistence services. However, the maps revealed that while some areas within a given village were indeed more favorable for the presence of subsistence services, other areas within the same village were inclined towards the presence of logging services. Similar spatial analyses can be explored to guide policy-makers in developing land-use strategies that allocate forest lands between competing users by identifying areas that are best suited for indigenous peoples’ subsistence activities and for commercial logging operations.
Keywords:
commercial interests
; conflicts of use
; indigenous interests
; land sharing
; resource allocation
1. Introduction
In Amazonia, indigenous peoples have lived and shaped the forest plant species present to support their subsistence lifestyles for centuries [1,2,3,4,5,6,7] primarily through their swidden agriculture practices. However, in recent times swidden landscapes have faced increasing competition from other forest users [8,9], in particular commercial logging which is attracted to the high density of tropical timber species within these landscapes [2,10,11]. The lack of spatial tools that can help indigenous peoples assess how their own reliance on forest plant species may be compromised by conflicting uses [10] makes it challenging for them to push back against competitors, despite the increasing recognition of the authority of local communities over their forests [12].
Although there has been an increase in the forest tenure rights of indigenous peoples [12,13], in the adoption of practices such as land-sharing and land-sparing strategies [14,15], and in community forestry, which gives local communities some degree of autonomy over the management of their forests, there has been more ecological than socioeconomic benefits [16,17,18]. While community-based forestry schemes seek to benefit indigenous peoples by managing resources based on the local, traditional knowledge, the empowerment of indigenous communities is frequently hampered by government regulations [19]. Further, the jurisdictions of community-based conservation initiatives are not always clear, and land and resource management strategies are often not clearly defined. There is also a general ambiguity about those who benefit from such conservation policies [20]. Additionally, although legally titled indigenous communities may allow other users to access the forests through formal or informal agreements [1], the lack of their ability to value their forest resources means that such agreements with commercial loggers may result in unforeseen and often undesirable consequences for indigenous peoples. For example, in Corentyne, Guyana, the logging activities of the Barama timber company had diverted some Orealla members away from subsistence activities, which had negative impacts on families’ socio-economic positions [1]. As such, developing strategies that support indigenous rights to their forest resources is becoming more urgent in the face of commercial logging and other extractive operations.
As more swidden landscapes undergo change, spatial allocation and optimization questions are arising especially in the face of the introduction of payment for ecosystem services initiatives such as the United Nation’s Reduced Emissions from Deforestation and Degradation (REDD+) program (http://www.un-redd.org/). Many indigenous lands are already subject to threats from logging, mining and oil interests due to their impacts on the forests [21], and such conservation schemes may become even more problematic for local communities especially in places where indigenous rights are either not recognized or tenuous [22,23,24,25,26]. In fact, payment for ecosystem services programs have already been shown to have adverse impacts on the livelihoods of indigenous people. For example, the Chinantec community of southern Mexico have reported declines in agricultural yield due to the limitations set by new conservation policies [27], and the disruption of indigenous families’ livelihood activities due to REDD+ regulations have led to a pushback against the initiative [28]. Essentially, these landscapes are now facing challenges over balancing conflicting perspectives on the most optimal use of resources distributed throughout the forests [29].
To begin thinking of ways in which indigenous peoples can protect their uses of the forests, this paper explored how comparing the relative distributions of subsistence and commercial logging ecosystem services can help identify forest areas in which plant use values are optimized for the indigenous peoples and for commercial loggers. Given the findings of Shah & Cummings [10] which suggested that potential conflicts of plant use could exist at a spatial extent, this study postulated that the landscape conditions, in the form of physical environment variables, of a given location would favor the presence of one type of ecosystem service over the other, and would also influence the distributions of the two ecosystem services relative to each other. To address this hypothesis, two objectives were developed. First, the relative log risk ratios of the Subsistence Value Index (SVI) to Commercial Logging Index (CLI) [10] were computed and regressed against six physical environment variables—village presence, distance to village, distance to road, distance to waterways, elevation, and slope—at the village-level, to assess how the presence of one ecosystem service may be favored over the other given the landscape conditions of a village. Second, the relative differences in the spatial distributions of the SVI and CLI values were mapped in each village to identify areas where the presence of subsistence services may be more favorable versus where the presence of logging services may be preferred. To begin thinking of land-use policies that can mitigate the conflicting uses of forest resources, this paper explored a potential resource use allocation strategy in which indigenous peoples and commercial loggers can spatially target their activities in particular areas of the forest where their plant use values are optimized.
2. Materials and Methods
2.1. Study Area
The Rupununi study area (Figure 1) is home to two of Guyana’s major indigenous nations, the Wapishiana and the Makushi, who share strong connections to their forests [2,30]. Some areas in the region have been inhabited by large numbers of indigenous populations for longer than recorded history [1], although newer villages have been established in more recent years (Amerindian Act of 2006; see https://moipa.gov.gy/). The Rupununi has also attracted commercial logging interests due to the area’s high densities of valuable timber species [2,10,11,31].
Both subsistence and commercial logging ecosystem services have been accessed by streams, including the Rupununi river [2], as well as unpaved paths and cattle trails [2,32], though recent road developments are increasing forest accessibility [2,33]. Accessibility is also constrained by the region’s elevation which varies from the mountainous Kanuku and Pakaraima areas to the lower flatlands and savannahs.
Guyana has also committed to implementing a low carbon development economy (lcds.gov.gy) as part of its response to REDD+. One of the program’s primary objectives is to enhance forest carbon stocks, which sometimes occurs at the expense of indigenous peoples’ use of the forests [28,34,35]. While communities across the Rupununi area have been participating in REDD+ projects, there are concerns that some program incentives could increase land-grabbing by people with higher economic or political status and threaten the land tenures and customary rights of the indigenous peoples to the forest [36,37].
2.2. Data for Computing the Relative Differences Between Svi and Cli Distributions
The ecosystem services data utilized for this analysis were developed by Shah & Cummings [10]. The SVI value measured the different types of subsistence services derived from a plant (food, medicines, household items, construction materials, tools and raw materials, accessories, fuel, and hunted wildlife species that depended on the plant for food) that were commonly used by indigenous peoples. Based on a ratio of the number of subsistence uses associated with the plant out of the seven most common uses, the plant’s SVI was developed as a normalized index that ranged between 0 and 1. A SVI value that approached 1indicated that the plant offered relatively more subsistence services, and was therefore perceived to be more valuable for an indigenous person’s perspective. Conversely, if the SVI approached 0 the plant was perceived to be of lesser value to indigenous peoples. Similarly, the CLI, which measured the commercial logging services derived from a plant, was developed based on the plant’s stem diameter (diameter-at-breast-height). If the CLI value of a plant approached 1, it indicated that the plant could potentially offer a greater amount of logging material for commercial loggers to harvest compared to a plant with a lower CLI value. The plants for which the SVI and CLI were developed were sampled in 92 transects across fourteen sites including two uninhabited control sites [10]. This analysis used a subset of the SVI and CLI services data from 76 transects across twelve villages, the latter being defined as the lands legally granted to Amerindian communities who have lived there for at least 25 years (Amerindian Act of 2006; see https://moipa.gov.gy/).
As for the landscape conditions that could potentially influence the presence of one ecosystem service over the other, Shah & Cummings [38] found that six physical environment variables—village presence, distance-to-village, distance-to-road, distance-to-water, elevation, and slope (Table 1)—generally influenced the distribution of subsistence and commercial logging services throughout the Rupununi landscape. Therefore, these variables were used as proxies to represent the landscape conditions of each village and were analyzed to understand how each variable may potentially favor the presence of subsistence services over commercial logging or vice versa, and how they affected the distributions of the services relative to each other.
2.3. Analysis
2.3.1. Using the Relative Log Risk Ratios to Compute Differences Between SVI and CLI Distributions
In order to begin looking at the relative differences in SVI and CLI distributions, relative log risk ratios were incorporated into the analysis. Relative risk ratios were used because the spatial distributions of the SVI and CLI values in each village were in the forms of predicted probabilities (ranging between 0 and 1) derived from binomial generalized linear models (GLMs; [38]). The relative risk ratio can measure the relative differences in the distributions of the two services by dividing the probability of SVI presence by the probability of CLI presence. Applying the logarithmic transformation ensured that the output values generated from computing the ratios were not undefined and would also range between to (instead of -1 to 1) which would facilitate accuracy. The relative log risk ratio values were first regressed against the six physical environment variables in stepwise regressions to identify and remove the predictors that did not help the models explain the relative differences in the predicted probabilities of SVI and CLI distributions with a given village (Equation 1). After the influential predictors for each model were identified, the distributions of the relative log risk ratio values for each village were re-computed.
where represented the relative log risk ratio of the predicted probability of presence of subsistence ecosystem services relative to the predicted probability of presence of commercial logging ecosystem services at the ith location, is the binary variable that indicated the presence or absence of the services within the village’s boundary, village is the distance of the services to the nearest village center, road is the distance of the services to the nearest road, water is the distance of the services to the nearest river/creek, elevation is the altitude of the area where the services are present or absent, and slope is the steepness of the area where the services are present or absent.
2.3.2. Mapping the Relative Differences Between SVI and CLI Distributions in Each Village
The regression estimates were used in a geographic information system (GIS) to create raster maps showing SVI and CLI distributions relative to each other in each village. For each influential landscape variable, a raster layer was created with a cell size of 10m, based on the width of sampling transects [10]. The village presence data was used to create a binary raster layer which identified whether SVI/CLI values were located within or outside of a village boundary. The distance-to-village, distance-to-road, and distance-to-water variables were processed as raster layers based on the Euclidean distances between each SVI/CLI and the variable. The elevation and slope raster layers were generated from the digital elevation model (DEM) of the landscape [39]. These layers were then incorporated into regressions in R, using packages ‘raster’, ‘rgdal’, ‘dismo’, ‘maptools’, and ‘prettympr’, and ‘MASS’ to generate raster maps of the relative differences in the SVI and CLI distributions in each village.
3. Results
3.1. Comparison of Mean Relative Log Risk Ratio Values Between Villages
Overall, it was found that the mean relative log risk ratio values in ten of the twelve villages were positive, suggesting that landscape conditions across the Rupununi may generally favor the presence of subsistence services over commercial logging services (Table 2). The landscape conditions in Village 17 seemed especially favorable for the presence of subsistence services in light of its relatively high mean value of 0.667, while the negative mean values in Villages 12 and 18 suggested that the landscape conditions within these locations may be slightly more favorable for the presence of commercial logging services. Still, the mean relative log risk ratios in these two villages along with the mean values of Villages 1 and 13 were quite close to zero, indicating that the landscape conditions in these villages may not heavily prefer the presence of one ecosystem services over the other (Table 2).
3.2. Influence of the Landscape Variables on the Log Risk Ratio Values
The impacts of the variables on the relative differences between the SVI and CLI distributions showed varying results from village to village. All the variables had significant impact (p < 0.05) on the relative log risk ratio in Village 19, but for the rest of the villages the number of variables that had significant impact (p < 0.05) differed (Table 3).
Of the individual variables, both distance-to-village and slope influenced (p < 0.05) the relative differences between SVI and CLI in four villages, and elevation was influential in five (p < 0.05). On the other hand, both distance-to-road and distance-to-water had significant impact on the relative differences between SVI and CLI (p < 0.05) in nine villages (Table 3), indicating that transportation networks such as roads and rivers might generally influence the type of ecosystem services found within an area.
Additionally, some of the variables showed inconsistent relationships with the relative log risk ratio values at the village-level. For example, the ratio grew more positive (presence of SVI more favorable compared to that of CLI) with increase in distance from road in six villages, but demonstrated opposite patterns in three others (p < 0.05). Similarly, the presence of SVI grew more favorable with distance from water in all villages but one (p < 0.05). On the other hand, elevation generally demonstrated a significant association (p < 0.05) with negative relative log risk ratio values; presence of CLI appeared to be more favorable at higher altitudes. Overall, it was found that the increase in distance-to-road and distance-to-water generally favored the presence of subsistence services, whereas increase in elevation appeared to favor the presence of commercial logging services (Table 3).
3.3. Mapping the Relative Risk Ratio Values in Each Village
While previous results suggested that the Rupununi landscape may generally favor the presence of subsistence services over commercial logging services, the maps indicated that the relative differences in the distributions of the two ecosystem services might be more comparable (Figure 2). The distributions of the ecosystem services in Villages 5, 12, 13, 17, and 18 suggested that areas within these villages may generally be more favorable for the presence of subsistence services, whereas Village 1 may overall be more suitable for the presence of commercial logging services (Figure 2).
It was also found that the presence of subsistence services may be favored over commercial logging services and vice versa in different areas of the same village. For example, in Village 19, the eastern part of the area appeared to be more suitable for the presence of subsistence services versus the northern parts, where logging services appeared to be preferable. Similarly, the western side of Village 22 appeared to be more conducive for the presence of subsistence services versus the eastern side which appeared to be more suitable for the presence of logging services (Figure 2).
On the other hand, the areas around the centers of four villages (20, 21, 22, and 23) generally exhibited paler shades (Figure 2), indicating that subsistence and commercial logging ecosystem services may exist in similar levels around these centers and that the presence of one service may not be significantly favored over the other.
4. Conclusions
The increasing competition that indigenous peoples are facing with regard to the use of their forest resources has led to the need for spatial tools that can help local communities address spatial optimization challenges in their forest use. To begin tackling this problem, this paper has explored a potential resource use allocation strategy based on how subsistence and commercial logging ecosystem services may be spatially distributed relative to each other given the landscape conditions. The findings of this analysis highlighted four points which can help provide deeper insights into the issue.
Firstly, Roos et al. [29] had noted that allocating forest land uses to generate optimal ecosystem service values can be challenging because of the different approaches to valuating ecosystem services. In this context, the SVI and CLI [10] reflected the importance of the provisioning ecosystem services derived from forest species from the perspectives of two clashing groups: indigenous peoples and commercial loggers. Thus, applying these indicators in forest management to define and allocate forest land classes between indigenous peoples and commercial loggers can allow each group to optimize their plant uses without significantly compromising the others’ uses. Such allocation schemes can also clarify which group is benefitting from using plants in a given forest land and how [20].
Secondly, the findings of this analysis suggested that slope generally did not influence the presence of any one ecosystem service over the other. On the other hand, not only was elevation influential in determining the relative differences between the two types of ecosystem services, but also appeared to favor the presence of commercial logging services over subsistence services. These findings have significant implications for Guyana’s current logging guidelines. While slope is an important factor in Guyana’s Code of Practice [40] that determines where in space logging can take place [10,40], the results of this analysis suggested that elevation, rather than slope, may be a more appropriate physical environment variable to consider when making logging decisions.
Thirdly, the results of this analysis demonstrated that in certain villages similar levels of subsistence and commercial logging services were concentrated around the centers. The proximity of the subsistence services to village centers reinforced Sivasailam & Cummings’ findings [41] and were also consistent with inferences from the literature [6,42,43,44] about the close proximity of useful plant species, and by extension ecosystem services, to homesteads. However, the presence of logging services in the same areas suggested that these centers may have potential for strong tensions between the two types of ecosystem services. Such results can provide insights into why swidden landscapes often attract commercial logging interests.
Fourthly, visualizing where landscape conditions favor the presence of subsistence ecosystem services can also be used to protect plant species important for indigenous peoples’ subsistence livelihoods when they face potential drawbacks from the policies of payment for ecosystem services programs. For example, REDD+ provides incentives such as placing value on carbon stocks that can lead to increased land grabbing by elites [36], and as a result, the indigenous peoples’ customary rights to their use of the forest are threatened especially in the absence of legal land tenures [36,37]. Based on the findings of this analysis, identifying forest lands around indigenous villages within which optimal values of subsistence services are derived can assist REDD+ policymakers in better acknowledging the legal rights of the indigenous peoples to their subsistence resources [41,45]. Such spatial approaches can also help identify forest areas with high subsistence values that should be removed from considerations for REDD+ implementations.
The findings of this analysis also had implications for the spatial methods employed in this study which will pave way for future research. This analysis assessed landscape conditions in the form of physical environment variables that may influence the type of ecosystem service found in any given area. However, the relationship between the variables and their preferences for a particular ecosystem service varied across villages. It is important to understand why the spatial relationships between some of the landscape variables and the subsistence and commercial logging services were inconsistent, and whether these relationships may be attributed to other underlying factors such as village age, sample sizes, and location-specific factors such as the presence of logging concessions. Thus, gathering more comprehensive data and larger sample sizes will be made a point for future work. Another point to think about is the indices themselves. The SVI and CLI have been developed based on certain assumptions [10] but given the findings of this analysis, future research will revisit these assumptions to explore ways to modify the indices that may help them become better proxies for indigenous subsistence and commercial logging ecosystem services.
This paper explored how landscape conditions may favor the presence of one type of ecosystem service over the other across an indigenous landscape. Relative log risk ratios were computed to measure the relative differences in the distributions of subsistence and commercial logging ecosystem services in each indigenous village, and the impacts of six physical environment variables (village presence, distance-to-village, distance-to-road, distance-to-water, elevation, and slope) on the relative log risk ratios were assessed. These ratios were then used to plot maps in a GIS to visualize the relative distributions of subsistence and commercial logging ecosystem services, and to identify where the presence of one service may be favored over the other given the landscape conditions of a village. It was found that while the landscape conditions were generally inclined towards the presence of subsistence services, some village areas also showed strong preferences for the presence of commercial logging services. Such comparative spatial analyses can serve as decision-making tools for indigenous communities who need to address resource use and spatial optimization questions about their forest use, especially in the presence of competing users such as commercial loggers and initiatives like REDD+ who have very different viewpoints on how forests should be used.
Author Contributions
Muna Shah: Conceptualization, Methodology, Investigation, Resources, Writing—original draft. Anthony R. Cummings: Conceptualization, Methodology, Investigation, Writing—review & editing.
Funding
The authors also acknowledge and are grateful for the funding for the data collection included in this which was provided by the US National Science Foundation BE/CNH Grant 0837531 led by Dr Jose Fragoso. Additionally, the authors are grateful to all of the field assistants who made data collection possible across the Rupununi. The authors express their gratitude to Dr. Jane Read and the entire Project Fauna team who have made invaluable contributions to the development of this project, in particular the collection of plant distribution data.
References
- Colchester, M. (1997). Guyana Fragile Frontier: Loggers, Miners and Forest Peoples. Gloucestershire, UK: World Rainforest Movement, Forest Peoples Programme.
- Cummings, A.R. (2013). For Logs, For Traditional Purposes and For Food: Identification of Multiple–Use Plant Species of Northern Amazonia and an Assessment of Factors Associated with Their Distribution. Ph.D. Dissertation, Syracuse University, Syracuse, NY, USA.
- Fisher, R.J., Srimongkontip, S., & Veer, C. (1997). Numbers of forest ‘dependent’ peoples and types of people forest relationships. Asia-Pacific forestry sector outlook study: Working paper No: APFSOS/WP/27. Bangkok, Thailand: Regional Office for Asia and the Pacific.
- Forte, J. (1996). Makusipe Komanto Iseru: Sustaining Makushi way of life. Guyana: North Rupununi District Development Board.
- Miller, R., & Nair, P. (2006). Indigenous Agroforestry Systems in Amazonia: From Prehistory to Today. Agroforestry Systems, 66(2), 151-164. [CrossRef]
- Posey, D. A. (1985). Indigenous management of tropical forest ecosystems: The case of the Kayapo Indians of the Brazilian Amazon. Agroforestry Systems 3(2), 139-158. [CrossRef]
- Shackleton, C.M., & Shackleton, S.E. (2004). The importance of non-timber forest products in rural livelihood security and as safety nets: a review of evidence from South African. South African Journal of Science, 100(11-12), 658–664.
- Rist, L., Shanley, P., Sunderland, T., Sheil, D., Ndoye, O., Liswanti, N., & Tieguhong, J. (2012). The impacts of selective logging on non-timber forest products of livelihood importance. Forest Ecology And Management, 268, 57-69. [CrossRef]
- Shanley, P., & Luz, L. (2003). The Impacts of Forest Degradation on Medicinal Plant Use and Implications for Health Care in Eastern Amazonia. Bioscience, 53(6), 573. [CrossRef]
- Shah, M., & Cummings, A.R. (2018). Comparing logging and subsistence values of plants across an indigenous peoples’ influenced landscape. Ecological Indicators 95(1), 165-175. [CrossRef]
- Wenze, C. (2013). Profile of Guyana-China timber industry economic and trading cooperation park: Chinese enterprises to Guyana. Unpublished manuscript.
- Larson A.M., & Dahal, G.R. (2012). Forest tenure reform: New resource rights for forest-based communities?. Conservation and Society 10(2), 77-90. [CrossRef]
- White, A. & Martin, A. (2002). Who owns the world’s forests? Washington, DC: Forest Trends.
- Edwards, D., Gilroy, J., Woodcock, P., Edwards, F., Larsen, T., Andrews, D., Derhé, M., Docherty, T., Hsu, W., Mitchell, S., Ota, T., Williams, L., Laurance, W., Hamer, K. & Wilcove, D. (2014). Land-sharing versus land-sparing logging: reconciling timber extraction with biodiversity conservation. Global Change Biology, 20(1), 183-191. [CrossRef]
- Scariot, A. (2013). Land sparing or land sharing: the missing link. Frontiers in Ecology and the Environment, 11, 177-178. [CrossRef]
- Brockington, D., J. Igoe, & K. Schmidt-Soltau. (2006). Conservation, human rights, and poverty reduction. Conservation Biology, 2 (1), 250-252. [CrossRef]
- Charnley, S. & Poe, M.R. (2007). Community Forestry in Theory and Practice: Where Are We Now? Annual Review of Anthropology, 36, 301-336. [CrossRef]
- Sylvester, O., Segura, A.G., & Davidson-Hunt, I.J. (2016). The Protection of Forest Biodiversity can Conflict with Food Access for Indigenous People. Conservation & Society, 14(3), 279-90. [CrossRef]
- Sitoe, A. A., & Guedes, B. S. (2015). Community forestry incentives and challenges in Mozambique. Forests, 6(12), 4558-4572. [CrossRef]
- Hitchner, S. (2010). Heart of Borneo as a ‘Jalan Tikus’: Exploring the links between indigenous rights, extractive and exploitative industries, and conservation at the World Conservation Congress 2008. Conservation and Society, 8(4), 320-330. [CrossRef]
- Käyhkö, N., Fagerholm, N., Asseid, B. S, & Mzee, A. J. (2011). Dynamic land use and land cover changes and their effect on forest resources in a coastal village of Matemwe, Zanzibar, Tanzania. Land Use Policy, 28(1), 26-37. [CrossRef]
- Adams, W.M. & Hutton, J. (2007). Parks, people, and poverty: political ecology and biodiversity conservation. Conservation and Society, 5(2), 147-183.
- Ghimire, K. (1994). Parks and people: livelihood issues in national park management in Thailand and Madagascar. Development and Change, 25(1), 195-229. [CrossRef]
- Lam, Lai. (2011). Cultural perspectives of land and livelihoods: A case study of Shuklaphanta Wildlife Reserve in far-Western Nepal. Conservation and Society, 9 (4), 311-324. [CrossRef]
- McLean, J., & Straede, S. (2003). Conservation, Relocation, and the Paradigms of Park and People Management: A Case Study of Padampur Villages and the Royal Chitwan National Park, Nepal. Society and Natural Resources, 16(6), 509-526. [CrossRef]
- van Dam, C. (2011). Indigenous Territories and REDD in Latin America: Opportunity or Threat? Forests 2(1), 394-414. [CrossRef]
- Ibarra, J.T., Barreau, A., Del Campo, C., Camacho, C.I., Martin, G.J. & McCandless, S.R. (2011). When formal and market-based conservation mechanisms disrupt food sovereignty: impacts of community conservation and payments for environmental services on an indigenous community of Oaxaca, Mexico. International Forestry Review, 13(3), 318-337. [CrossRef]
- Friends of the Earth International. (2014). The great REDD Gamble. Amsterdam, Netherlands: Friends of the Earth International. Retrieved 1 August 2018, from https://www.foei.org/wp-content/uploads/2014/09/The-great-REDD-gamble.pdf.
- Roos, A., Eggers, J., Mark-Herbert, C., & Lindhagen, A. (2018). Using von Thünen rings and service-dominant logic in balancing forest ecosystem services. Land Use Policy, 79, 622-632. [CrossRef]
- David, B., Isaacs, P., Johnny, A., Johnson, L., Pugsley, M., Ramacindo, C.,Winter, G., & Winter, Y. (2006). Wa Wiizi—Wa Kaduzu: Customary use of biological resources and related traditional practices within Wapichan territory in Guyana. UK: Forest Peoples Programme.
- Polak, A. M. (1992). Major timber plants of Guyana: A field guide. Wageningen, Netherlands, and Amsterdam: Tropenbos Foundation.
- Tourism and Hospitality Association of Guyana. (2017). Guyana’s Rupununi. Tourism and Hospitality Association of Guyana. Retrieved 3 April 2018, from https://rupununi.org/tourism/.
- Seales, I. (2010). Brazil tables proposal on paved Lethem road funding. Stabroek News, 28 August. Retrieved 22 July 2018, from https://www.stabroeknews.com/2010/news/guyana/08/28/brazil- tables-proposal-on-paved-lethem-road-funding/.
- Overman, H., Butt, N., Cummings, A.R., Luzar, J.B. & and Fragoso, J.M.V. (2018a). National REDD+ Implications for Tenured Indigenous Communities in Guyana, and Communities’ Impact on Forest Carbon Stocks. Forests, 9(5), 231. [CrossRef]
- World Rainforest Movement. (2015). REDD: A Collection of Conflicts, Contradictions and Lies. Retrieved 15 August 2018, from https://wrm.org.uy/books-and-briefings/redd-a-collection-of-conflicts-contradictions-and-lies/.
- Overman, H., Cummings, A.R., Luzar, J.B., & Fragoso, J.M.V. (2018b). National REDD+ outcompetes gold and logging: the potential of cleaning profit chains. World Development118, 16-26. [CrossRef]
- Sunderlin, W.D., Larson, A.M., Duchelle, A.E., Resusodarmo, I.A.P., Huynh, T.B., Awono, A., Dokken, T. (2014). How are REDD+ Proponents Addressing Tenure Problems? Evidence from Brazil, Cameroon, Tanzania, Indonesia, and Vietnam. World Development 55, 37-52. [CrossRef]
- Shah, M., & Cummings, A.R. (2021). An analysis of the influence of the human presence on the distribution of provisioning ecosystem services: A Guyana case study. Ecological Indicators 122, 107255. [CrossRef]
- Cogley, G. (2009). The ASTER global digital elevation model. Retrieved from http://www.environmentalresearchweb.org.
- Guyana Forestry Commission. (2013). Code of Practice for Forest Operations—3rd edition. Georgetown, Guyana: Guyana Forestry Commission.
- Sivasailam A., & Cummings A.R. (2017). Does the Location of Amerindian Communities Provide Signals About the Spatial Distribution of Plant and Palm Species?. In Griffith, D., Chun, Y., & Dean, D., Advances in Geocomputation (pp. 169-179). Cham, Switzerland: Springer.
- Denevan, W. (1992). The Pristine Myth: The Landscape of the Americas in 1492. Annals Of The Association Of American Geographers, 82(3), 369-385. [CrossRef]
- Lamont, S., Eshbaugh, W., & Greenberg, A. (1999). Species composition, diversity, and use of homegardens among three Amazonian villages. Economic Botany, 53(3), 312-326. [CrossRef]
- Miller, R., Penn, J. & Leeuwen, J. (2006). Amazonian homegardens: Their ethnohistory and potential contribution to agroforestry development. In B. Mohan Kumar & P.K.R. Nair, Tropical Homegardens: A Time-Tested Example of Sustainable Agroforestry (pp.43-60). Dordrecht, Netherlands: Springer. [CrossRef]
- Louman, B., Cifuentes, M., & Chacón, M. (2011). REDD+, RFM, Development, and Carbon Markets. Forests, 2(1), 357-372. [CrossRef]
Figure 1.
Areas of interest to indigenous peoples, commercial timber loggers, and REDD+ mechanisms across the Rupununi, Guyana.
Figure 1.
Areas of interest to indigenous peoples, commercial timber loggers, and REDD+ mechanisms across the Rupununi, Guyana.
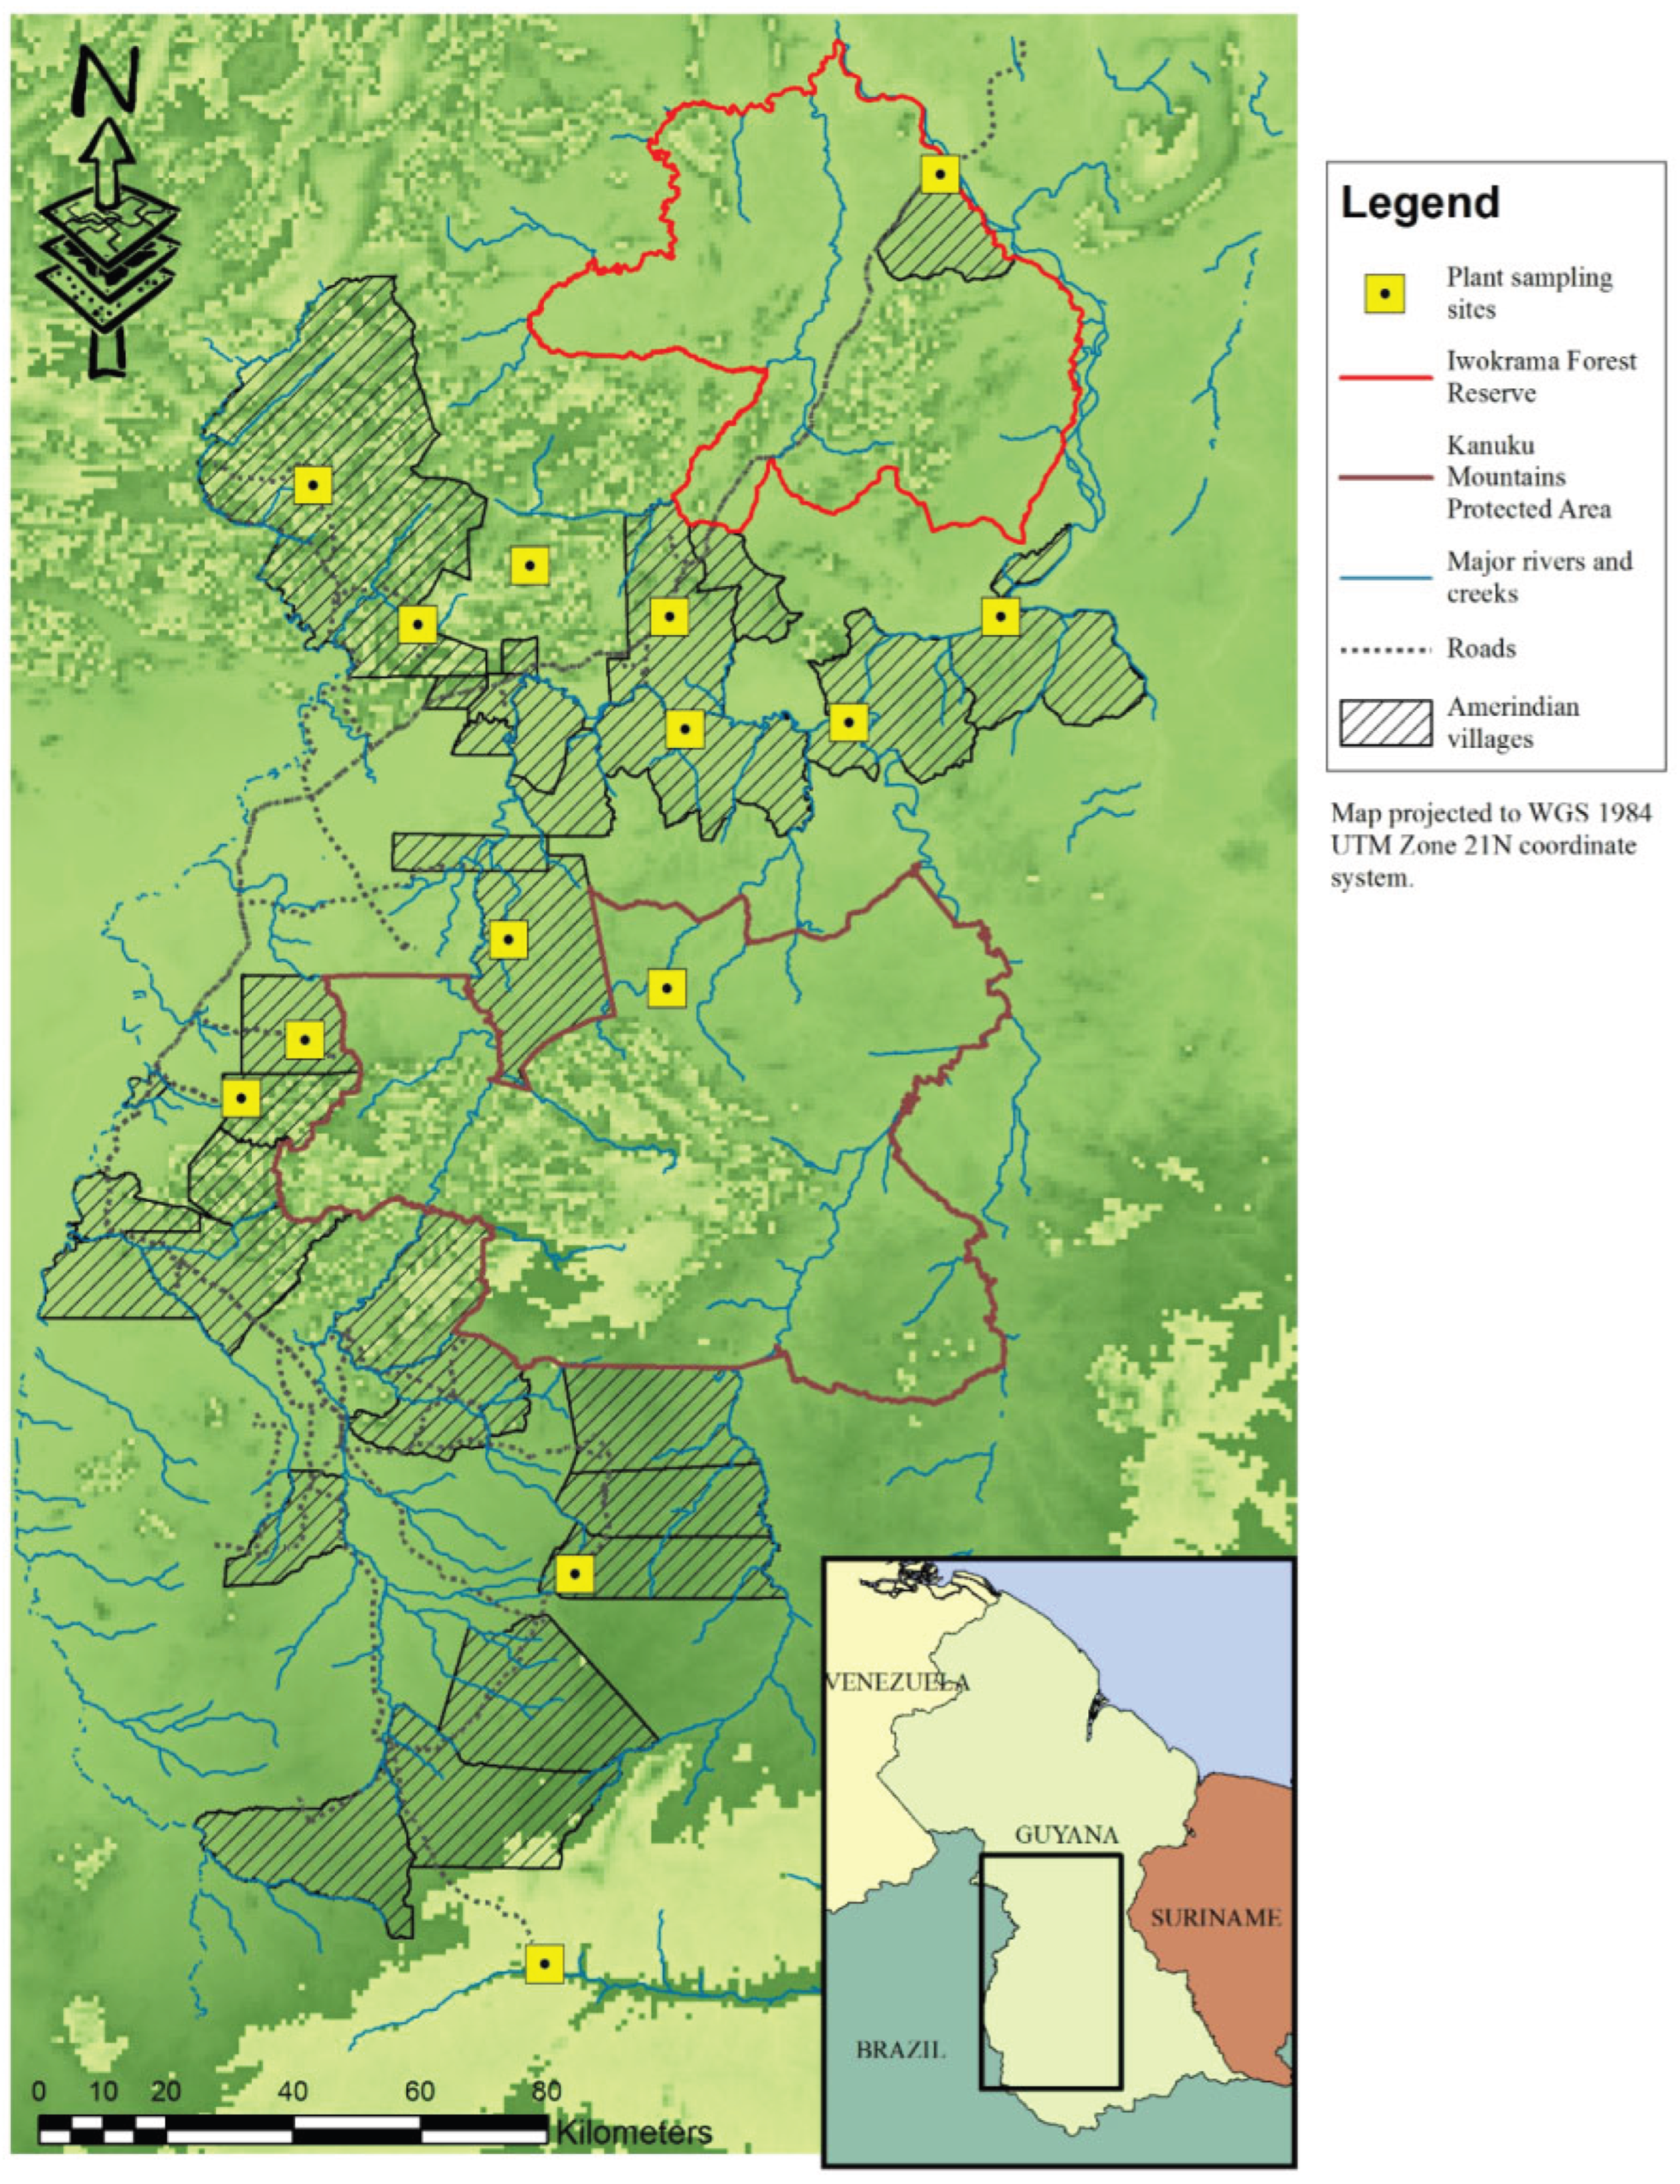
Figure 2.
Differences in the spatial distribution of subsistence and logging ecosystem services relative to each other.
Figure 2.
Differences in the spatial distribution of subsistence and logging ecosystem services relative to each other.
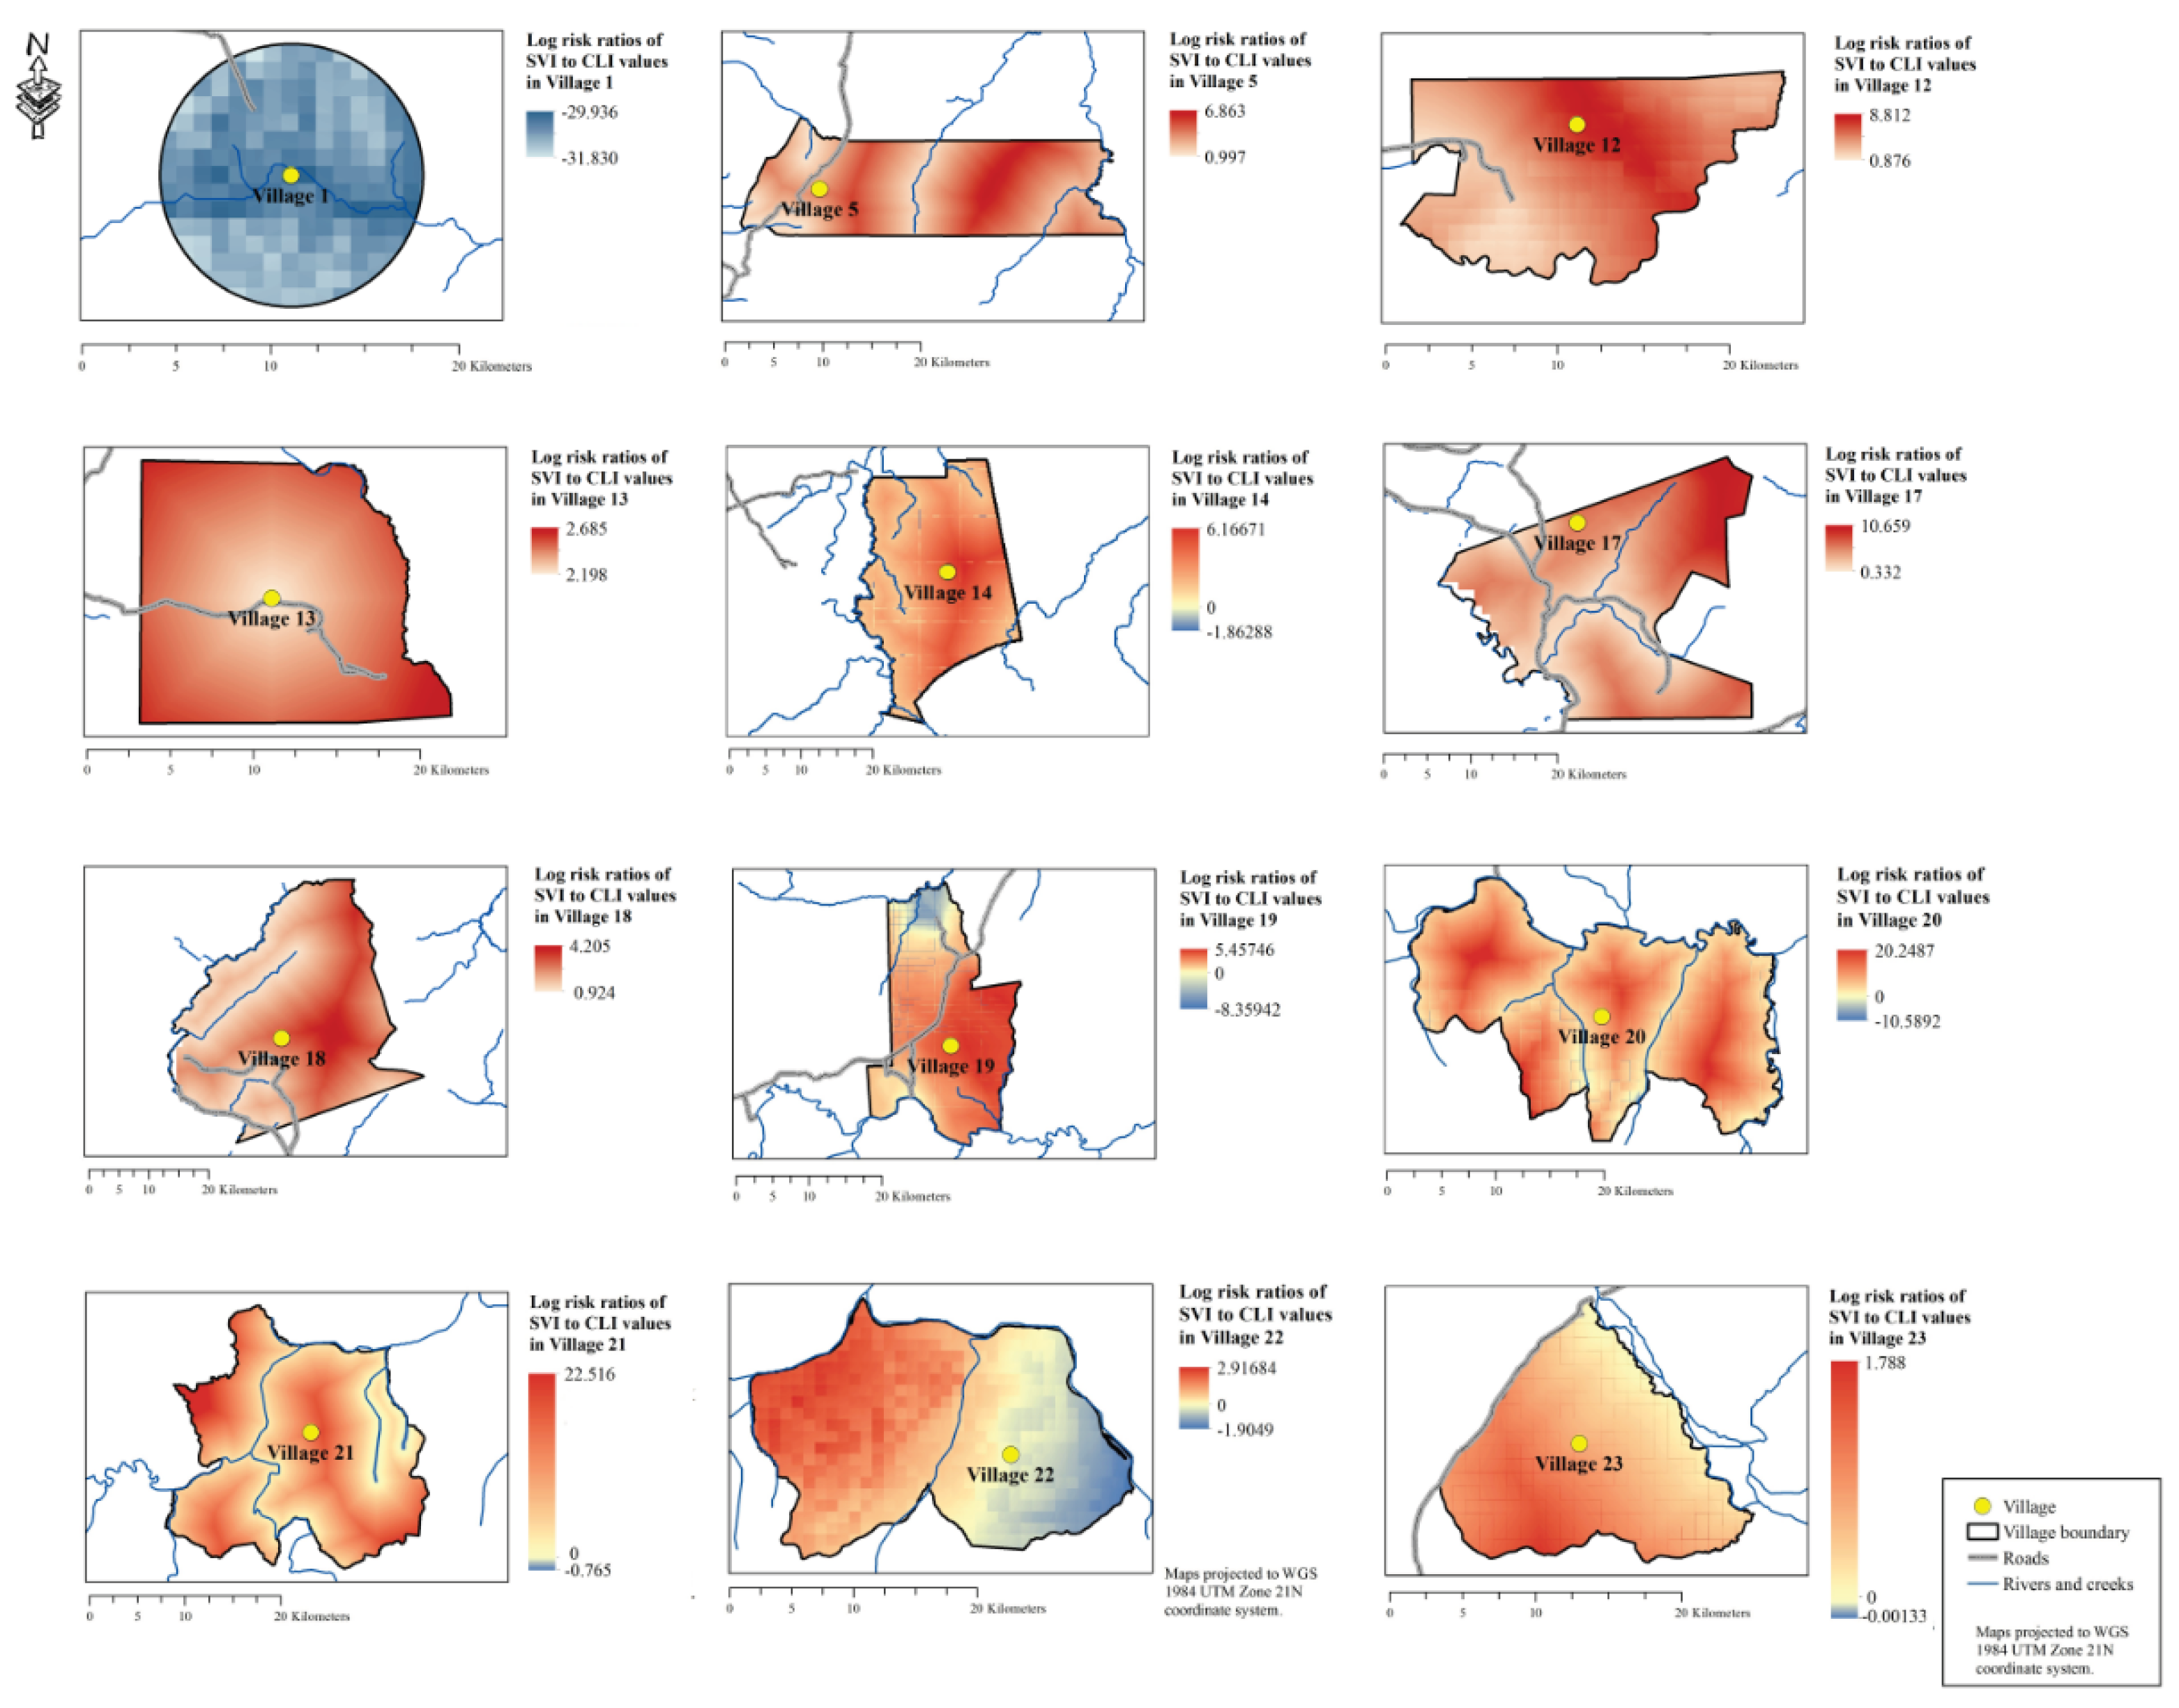

Table 1.
Descriptions of the six physical environment variables that influenced the spatial distribution s of subsistence and commercial logging ecosystem services (also see Shah & Cummings (2021).
Table 1.
Descriptions of the six physical environment variables that influenced the spatial distribution s of subsistence and commercial logging ecosystem services (also see Shah & Cummings (2021).
| Variable | Indicator |
|---|---|
| Presence within village boundary | Indicates people’s proximity to SVI and CLI |
| Distance-to-village | Indicates people’s proximity to SVI and CLI |
| Distance-to-road | Indicates access to SVI and CLI; many of the roads are walking trails |
| Distance-to-water | Indicates access to SVI and CLI; many of the waterways are frequent routes of travel |
| Elevation | Reflects the constraints people may have for accessing SVI and CLI; it is assumed that the ecosystem services are more difficult to access at higher elevations |
| Slope | Reflects the constraints on accessing SVI and CLI; it is assumed that the ecosystem services are more difficult to access at steeper locations |
Table 2.
Mean log risk ratio values of each village.
| Location | Mean log risk ratio values |
| Village 1 | 0.035 |
| Village 5 | 0.234 |
| Village 12 | -0.063 |
| Village 13 | 0.091 |
| Village 14 | 0.537 |
| Village 17 | 0.667 |
| Village 18 | -0.075 |
| Village 19 | 0.353 |
| Village 20 | 0.483 |
| Village 21 | 0.432 |
| Village 22 | 0.101 |
| Village 23 | 0.324 |
Table 3.
Variables that affect the relative log risk ratio of SVI to CLI values.
| Risk ratio (SVI/CLI) | Village | Distance to village (m) | Distance to road (m) | Distance to water (m) | Elevation (m) | Slope (%) |
| MODEL 1 | 1 | - | - | 0.028 (0.031)* |
-3.078 (0.051)* |
0.057 (0.14) |
| MODEL 2 | 5 | - | 0.047 (0.0012)* |
0.058 (9.52e-06)* |
- | - |
| MODEL 3 | 12 | -0.51 (2e-04)* |
0.046 (0.038)* |
- | -0.21 (0.017)* |
- |
| MODEL 4 | 13 | 0.14 (0.071) |
- | - | - | - |
| MODEL 5 | 14 | - | - | 0.12 (8.36e-15)* |
- | 0.40 (1.19e-05)* |
| MODEL 6 | 17 | - | 0.068 (0.020)* |
0.074 (0.00099)* |
- | - |
| MODEL 7 | 18 | - | -0.019 (0.012)* |
-0.020 (0.0058)* |
- | - |
| MODEL 8 | 19 | -0.27 (0.0016)* |
0.045 (0.0021)* |
0.031 (0.054)* |
-0.47 (0.050)* |
-0.18 (0.00027)* |
| MODEL 9 | 20 | - | 0.12 (0.033)* |
0.16 (1.35e-07)* |
-2.74 (3.39e-06)* |
0.18 (0.059)* |
| MODEL 10 | 21 | 0.22 (0.0024)* |
-0.65 (0.22)* |
0.062 (0.0094)* |
- | - |
| MODEL 11 | 22 | - | -0.93 (< 2e-16)* |
- | -0.41 (0.018)* |
- |
| MODEL 12 | 23 | -0.10 (0.027)* |
0.050 (1.24e-07)* |
0.060 (2.48e-11)* |
- | 0.19 (4.37e-08)* |
Disclaimer/Publisher’s Note: The statements, opinions and data contained in all publications are solely those of the individual author(s) and contributor(s) and not of MDPI and/or the editor(s). MDPI and/or the editor(s) disclaim responsibility for any injury to people or property resulting from any ideas, methods, instructions or products referred to in the content. |
© 2026 by the authors. Licensee MDPI, Basel, Switzerland. This article is an open access article distributed under the terms and conditions of the Creative Commons Attribution (CC BY) license (http://creativecommons.org/licenses/by/4.0/).
Copyright: This open access article is published under a Creative Commons CC BY 4.0 license, which permit the free download, distribution, and reuse, provided that the author and preprint are cited in any reuse.