

Submitted:
15 May 2026
Posted:
18 May 2026
You are already at the latest version
Abstract
The calibrated model reproduced the overall trend of specimen-to-specimen mechanical variation observed experimentally. Predicted stiffness values were in reasonable agreement with measured data. Fracture force predictions showed moderate agreement for dynamically tested specimens (R² = 0.60), which improved to R² = 0.88 after exclusion of one statistically identified outlier. Compared with a purely linear elastic formulation, the proposed viscoelastic model demonstrated modest improvement in stiffness prediction and more substantial improvement in fracture force prediction. These findings indicate that incorporating density-dependent viscoelastic effects improves representation of vertebral mechanical behavior, particularly at higher loading rates. Owing to its simplicity and computational efficiency, the proposed model requires only limited imaging input and may be useful for future biomechanical investigations, rapid screening, and injury risk prediction.
Keywords:
vertebral biomechanics
; trabecular bone
; viscoelasticity
; strain-rate dependence
; bone density
1. Introduction
Vertebral fractures are one of the most common bone injuries and are a major clinical problem, especially in older people and in patients with low bone density [1,2,3]. These fractures can lead to severe pain, changes in the shape of the spine, reduced mobility, and a greater risk of future fractures [2,3]. As a result, predicting the mechanical behavior and failure of vertebrae has become an important subject in spine biomechanics and injury research.
The mechanical behavior of trabecular bone and vertebral structures has been investigated using different experimental, analytical, and computational methods. Multiscale micromechanical models have been proposed to describe the anisotropic mechanical properties of vertebral trabecular bone by Haj-Ali et al. [4]. Green et al. [5] have used experimental studies, together with finite element analysis to examine stress–strain behavior and the start of damage in trabecular bone. In addition, models such as poroelastic formulations have been developed to study the effect of fluid flow inside the porous trabecular structure by Lim and Hong [6].
Finite element models have been widely used to investigate the mechanical behavior of spinal components and vertebrae under various loading conditions. In addition, viscoelastic formulations have been applied to examine load sharing within spinal structures at different loading rates [7] and to identify critical loading conditions through nonlinear analyses [8]. Experimental studies have also characterized the viscoelastic behavior of trabecular bone across multiple length scales using techniques such as dynamic mechanical testing and nanoindentation [9]. Many studies have demonstrated that the mechanical properties of trabecular bone are strongly dependent on apparent density. Several works have reported power-law relationships between elastic modulus and density, although these relationships vary with anatomical location and microstructural characteristics [10,11,12,13]. Wu et al. [14] have also shown that these properties can vary significantly and that density plays an important role in bone stiffness and strength. While density-dependent elastic behavior has been extensively studied, relatively few analytical models incorporate both density dependence and strain-rate sensitivity within a unified framework. In addition to density effects, trabecular bone exhibits pronounced strain-rate dependence. Under dynamic loading conditions such as falls, sports impacts, or motor vehicle accidents, its mechanical response can differ significantly from that observed under quasi-static loading. Previous research has shown that both stiffness and strength increase with increasing strain rate [11,12,13]. This behavior is primarily attributed to the porous microstructure of trabecular bone, which contains marrow and fluid and exhibits time-dependent mechanical effects [15]. Several studies have investigated the viscoelastic properties of trabecular bone using creep and stress relaxation tests. For example, Manda et al. [16] examined the relationship between viscoelastic behavior and bone volume fraction using creep tests on bovine trabecular bone, and later extended this work to include nonlinear viscoelastic effects [17]. However, most of these experiments were performed at low strain rates (about 0.01 s⁻¹), which may not fully represent traumatic conditions where strain rates are much higher. As a result, viscoelastic parameters obtained from low strain-rate testing may not completely describe the behavior of vertebral bone under dynamic loading conditions. Including strain-rate effects by using compression tests at different loading rates may improve prediction accuracy. Although many studies have investigated density-dependent elastic properties, only a limited number of studies have included density-dependent viscoelastic parameters in analytical models of vertebral mechanics. Developing models that consider both density changes and rate-dependent behavior is still an important challenge.
This study presents an analytical model to predict the mechanical response and fracture force of human vertebral specimens under different loading rates. It also investigates the effect of including viscoelastic behavior compared with a purely linear elastic model. The model incorporates density-dependent elastic properties together with a Kelvin–Voigt representation of trabecular bone. Unlike many previous studies in which viscoelastic parameters were derived primarily from low strain-rate creep or relaxation experiments, the present approach identifies these parameters directly from vertebral compression tests performed at different loading rates.
In this context, although finite element methods can provide detailed predictions of vertebral mechanics, they usually require complex image processing, specialized expertise, and high computational cost. Therefore, the analytical model presented in this study can provide a practical and computationally efficient approach for vertebral evaluation.
2. Materials and Methods
2.1. Vertebral Specimens and Experimental Data
Experimental data used in this study were obtained from a previously published biomechanical investigation on cadaveric spinal segments conducted by Rezaei et al. [18] at the Mayo Clinic. In the original study, 28 spinal specimens were tested under compression loading conditions. From these specimens, 10 intact vertebrae were selected for the present study. Three vertebrae were tested under quasi-static loading, and seven were tested at higher strain rates to simulate fracture conditions. The tests gave force–displacement curves, which were used to calculate stiffness and fracture force for each specimen. These results were used as reference data to calibrate the model in this study.
2.2. Image-Based Density and Geometric Measurements
Quantitative computed tomography (QCT) images were used to obtain geometric and density-related parameters for each vertebra. For each specimen, the vertebral body was divided into cortical and trabecular regions using several axial CT slices. The density and cross-sectional area of the cortical and trabecular regions were measured in each slice. These values were averaged along the vertebral height to obtain the mean cortical density, trabecular density, cortical cross-sectional area, and trabecular cross-sectional area for each specimen. The average values were used as input parameters in the analytical model. The specimen specifications are shown in Table 1.
2.3. Model Description
The vertebra was represented using an analytical model in which the vertebral body was approximated as a cylindrical structure composed of two mechanically distinct components: cortical bone and trabecular bone. A schematic illustration of the vertebral body, including the cortical shell and trabecular core, together with the corresponding equivalent mechanical model, is presented in Figure 1. The cortical region was modeled as a linear elastic material, whereas the trabecular region was described using a viscoelastic formulation. Under axial compression, cortical and trabecular bone experience the same overall deformation. Therefore, the two components were assumed to act mechanically in parallel, resulting in identical strains in both trabecular and cortical bone, i.e., ε = εt = εc. where ε denotes the overall axial strain of the vertebra, and εt and εc are the trabecular and cortical bone strains, respectively. The viscoelastic behavior of the trabecular bone was represented using a Kelvin–Voigt model consisting of an elastic spring and a viscous dashpot connected in parallel. The Kelvin–Voigt formulation has been widely used to characterize the time-dependent mechanical response of biological tissues [19]. Accordingly, the constitutive relation for trabecular bone can be written as
where σt is the stress in the trabecular part, Et is the trabecular elastic modulus, η is the viscous coefficient, and ε denotes the strain rate.
The cortical component was assumed to behave as a purely elastic material, described by σc = Ecε Since the cortical and trabecular components act in parallel, the total stress carried by the vertebra can be expressed as the sum of the stresses in each phase,
where Fc and Ft denote the forces carried by cortical and trabecular bone, respectively. These forces can be expressed as Fc = Ac σc and Ft = At σt where Ac and At represent the cross-sectional areas of the cortical shell and trabecular core. Substituting the constitutive relations into the force equilibrium equation yields
F = Fc + Ft
2.4. Density-Dependent Material Formulation
To consider differences in bone density between specimens, density-dependent material relationships were used. The elastic modulus of the bone was defined as a power-law function of density. This type of relationship has been widely reported in experimental and analytical studies on trabecular bone [20,21,22].
where, E is the elastic modulus, ρ is the ash density, a and b are material constants obtained through parameter calibration. In order to account for density-dependent viscoelastic behavior, the Kelvin-Voigt model's viscous coefficient was also defined as a linear function of bone density. The well-established relationship of trabecular bone mechanical characteristics on density shown in the literature [23,24,25,26,27] is consistent with this idea. The relationship is stated as follows,
where c and d are constants determined through the optimization procedure.
E = aρb
η = cρ + d
This formulation enables the analytical model to capture both the density dependence of bone stiffness and the strain-rate sensitivity associated with the viscoelastic behavior of trabecular bone.
2.5. Fracture Force Estimation
The compressive fracture force of each vertebral specimen was estimated using the effective stiffness predicted by the model. The effective Young’s modulus, which includes both elastic and viscous effects, was then used to estimate the corresponding stress response. The combined contribution of the cortical and trabecular regions was taken into account when calculating the effective modulus of the vertebral column. The effective modulus can be written as follows using the Kelvin–Voigt formulation:
where the cross-sectional areas of cortical bone, trabecular bone, and their total area are represented by Ac, At, and Atotal, respectively. Based on this, the effective modulus and the shape of the specimen were used to calculate the stiffness of each specimen. The compressive stress was calculated by assuming linear elastic behavior up to failure σ = Eeffε where Eeff represents the effective modulus derived from the analytical model. To estimate the fracture condition, a critical compressive strain of 10% was assumed for vertebral failure [28,29,30]. This assumption has been widely adopted in previous experimental and computational studies of vertebral compression behavior [28,29,30]. The corresponding fracture force was then calculated as Ffracture = σfATotal Where σf is the stress at the assumed failure strain.
2.6. Normalization of Specimen Geometry
Because vertebral specimens differ in size and geometry, the force–displacement data were normalized to remove geometric effects. The applied force was divided by the cross-sectional area of the vertebra, and the displacement was divided by the specimen height. This procedure yields a normalized stiffness that reflects intrinsic material behavior rather than geometric differences among specimens.
2.7. Parameter Calibration Identification
The experimental data used to calibrate the model were taken from a published study [18]. These data come from compression tests performed on human lumbar vertebral specimens under controlled loading conditions. The available dataset is somewhat sparse because of the inherent limits of experimental testing of biological tissues, such as restricted specimen availability, heterogeneity in bone quality, and testing complexity. However, the dataset reflects the general pattern of the mechanical response across the explored density range and offers a suitable basis for model calibration despite the small number of data points and inherent variability.
Optimization methods are widely used in structural and biomechanical engineering to identify parameters and improve design. For example, they have been used to find the best placement of piezoelectric patches to reduce stress in smart structures [31,32]. In the present study, an optimization procedure based on the Nelder–Mead algorithm was employed to identify the unknown material parameters of the proposed analytical model.
The unknown material constants a, b, c, and d, which define the density-dependent elastic and viscous relationships, were determined using the experimental data obtained from biomechanical testing. For each specimen, the analytical model was used to estimate the mechanical stiffness based on the specimen-specific geometric parameters and density measurements. The optimal parameters was obtained by minimizing the normalized sum of squared differences between the model predictions and the experimentally measured stiffness values across all specimens. The error function was defined as.
where kmodel,i, kexp,i denote the predicted and experimentally measured stiffness values for specimen i, respectively, represents the mean experimental stiffness across all specimens, and n is the total number of specimens. The experimental stiffness was determined by calculating the slope of the force-displacement curve, whereas the projected stiffness was achieved using the effective modulus obtained from the viscoelastic model. The Nelder–Mead optimization algorithm was used to determine the parameter values that minimize this objective function.
2.8. Evaluation of Model Predictions
The predictive ability of the analytical model was evaluated by comparing the model results with the experimental measurements. First, relationships between density and both the elastic modulus and viscous coefficient were obtained using the calibrated parameters. These relationships were used to estimate the mechanical behavior of each specimen. Effective stiffness and compressive fracture force of each vertebra were calculated using the predicted material properties and specimen geometry. The coefficient of determination (R²) was used to evaluate model performance, and scatter plots were used to visually compare the predicted and experimental values.
3. Results
3.1. Calibrated Density-Dependent Material Parameters
The optimization procedure determined the material constants appearing in Eqs. (4) and (5), which describe the density dependence of the elastic modulus and viscous coefficient of trabecular bone. The calibrated values are summarized in Table 2.
The identified parameters indicate that both elastic stiffness and viscous resistance increase with increasing bone density. This trend suggests that denser trabecular bone provides greater load-bearing capacity together with stronger resistance to rate-dependent deformation.
3.2. Stiffness Prediction
The accuracy of the proposed model was evaluated by comparing the predicted normalized stiffness values with those obtained from experimental force–displacement curves [18].
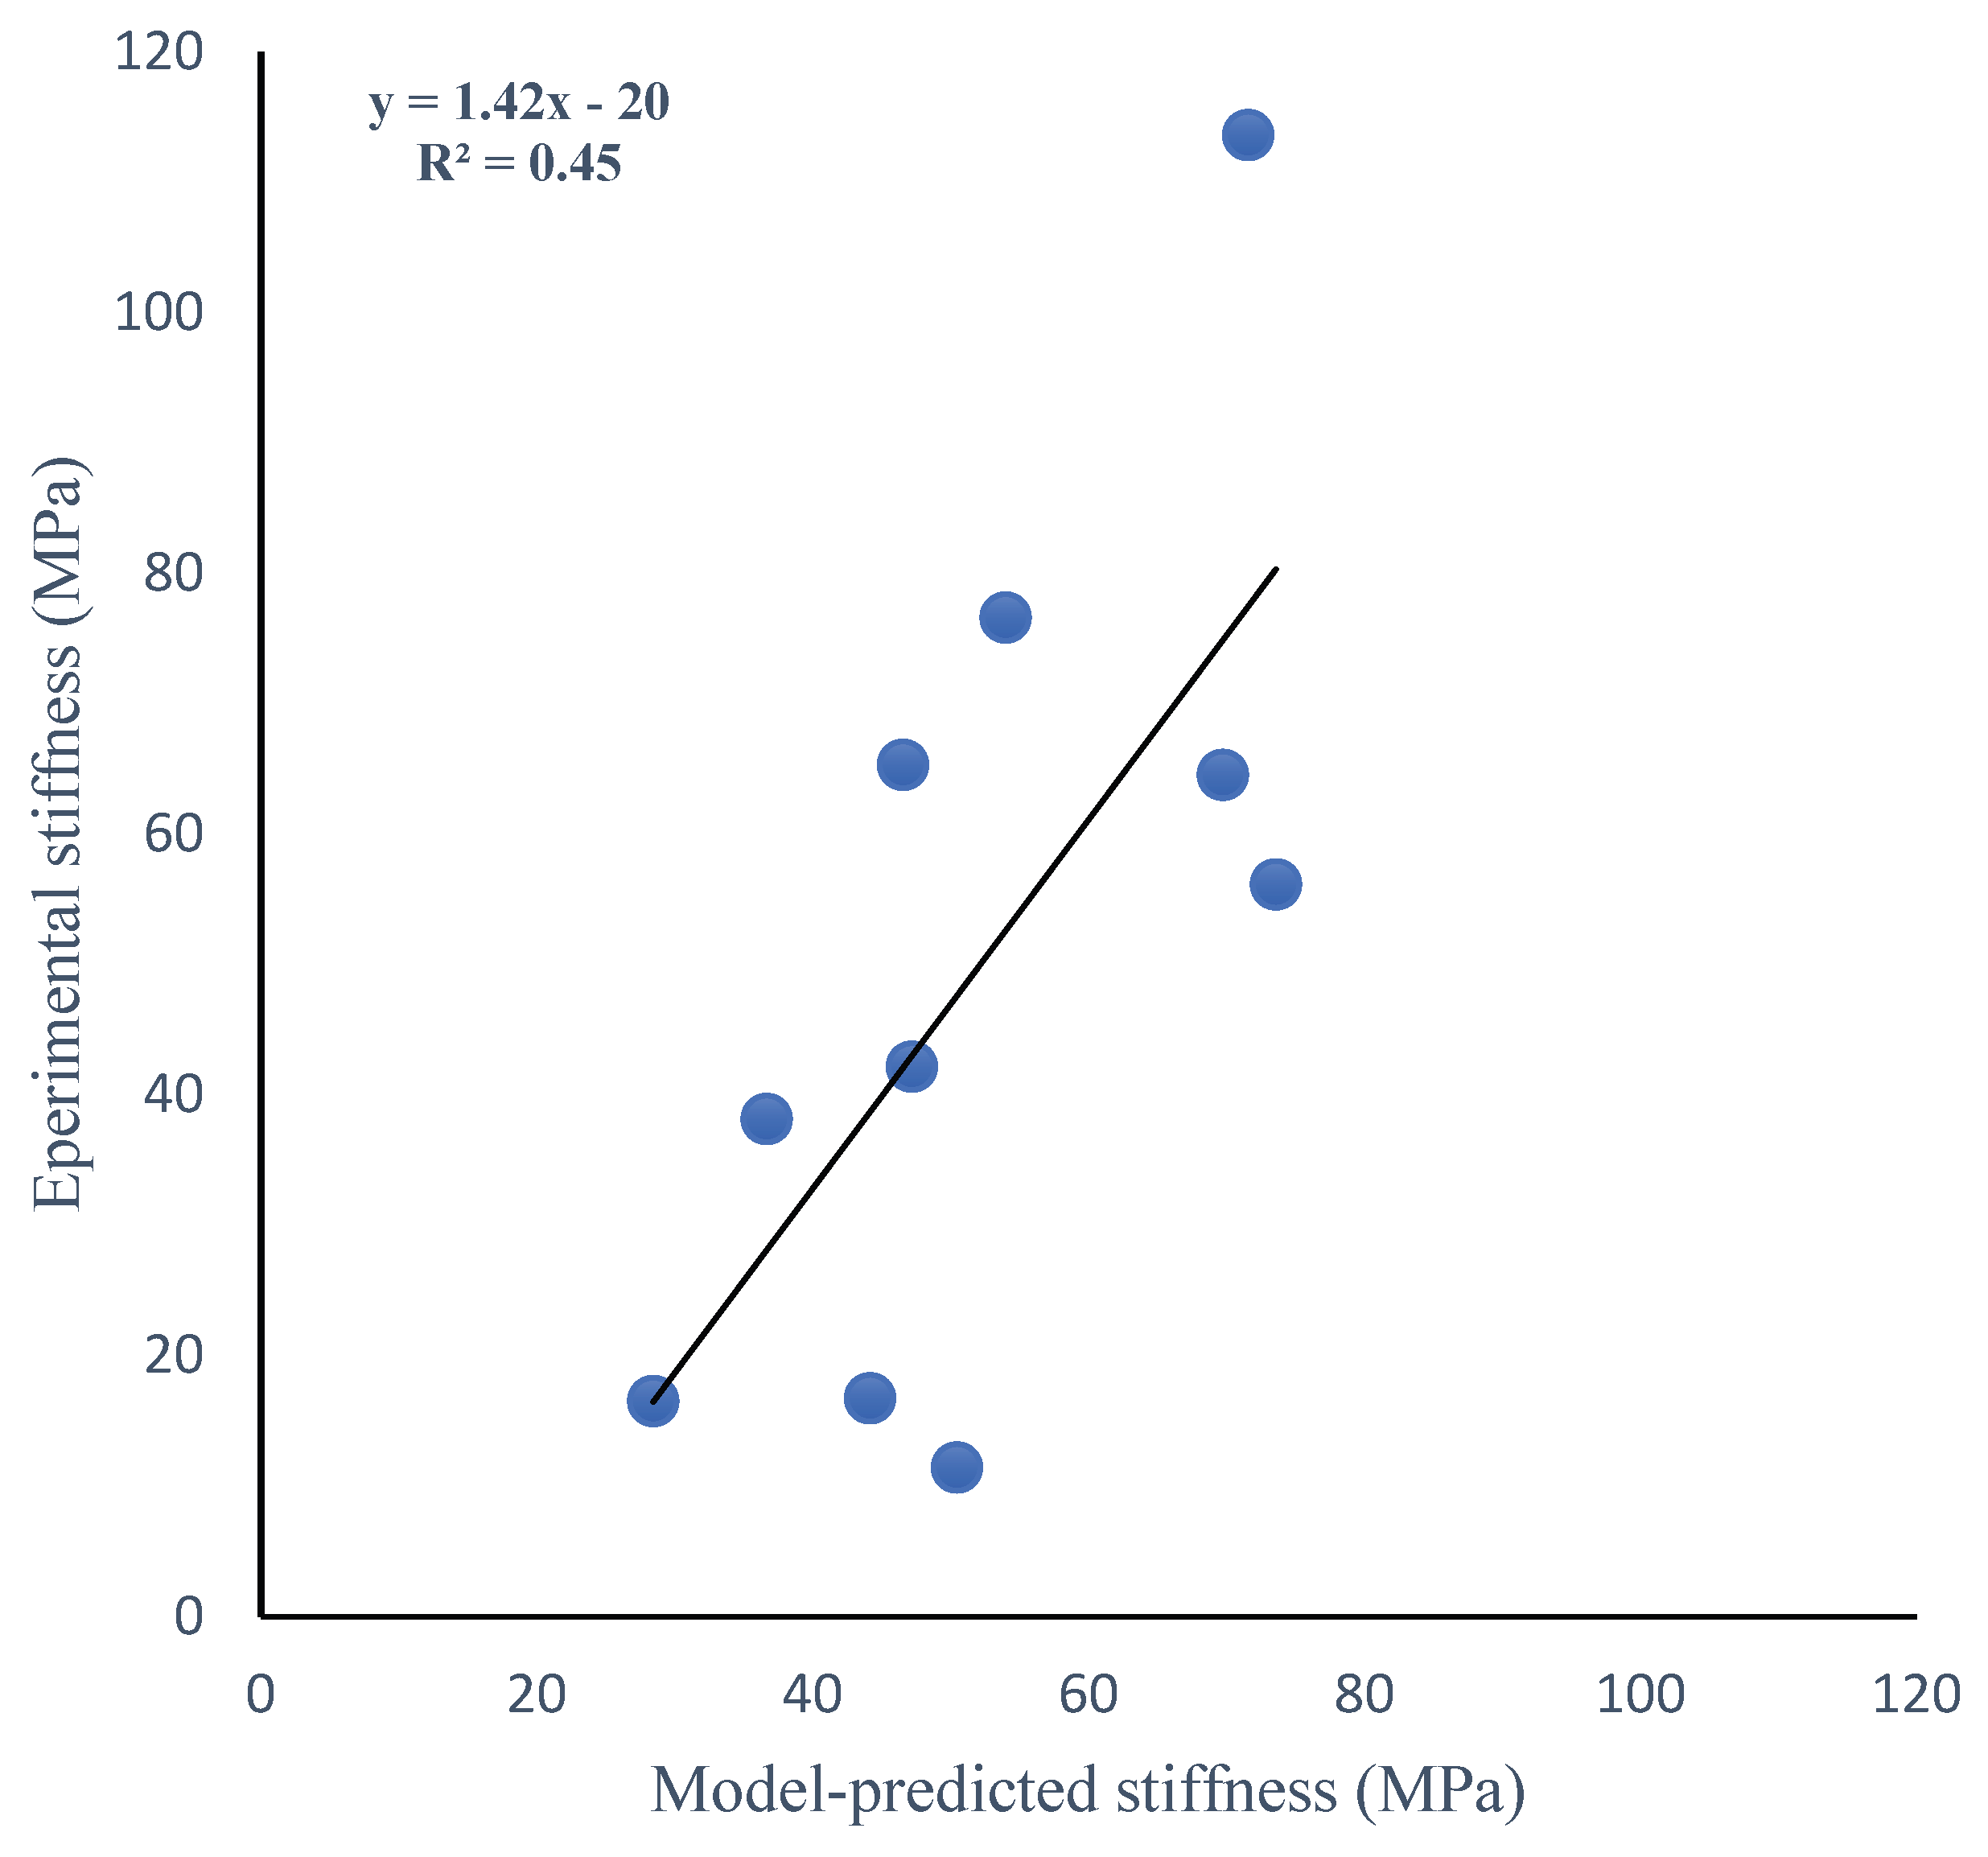
The predicted stiffness was calculated using the effective modulus from the Kelvin–Voigt model, which includes both elastic and viscous effects. The model gives an R² value of 0.45 for all samples (Figure 2), showing moderate agreement with the experimental results. In comparison, the purely linear elastic model gives a slightly lower R² value of about 0.42.
Table 3 summarizes the stiffness and fracture force values from the experiment and the model, together with the accompanying errors.
3.3. Fracture Force Prediction
As shown in Figure 3, the model predicts fracture force and compares it with experimental data. Peak forces were obtained from compression tests reported in a previous study [15], with fracture force defined as the maximum recorded load.
Overall, the comparison between model predictions and experimental results yields a coefficient of determination of R² = 0.47 (Figure 3a), indicating moderate agreement. In comparison, the purely linear elastic model yields a lower R² value of 0.35, highlighting a more pronounced improvement when viscoelastic effects are included. When only dynamically tested specimens are considered, the correlation improves to R² = 0.60 (Figure 3b). This improvement suggests that the viscoelastic formulation more effectively captures vertebral behavior under dynamic loading conditions.
3.4. Model Accuracy and Error Analysis
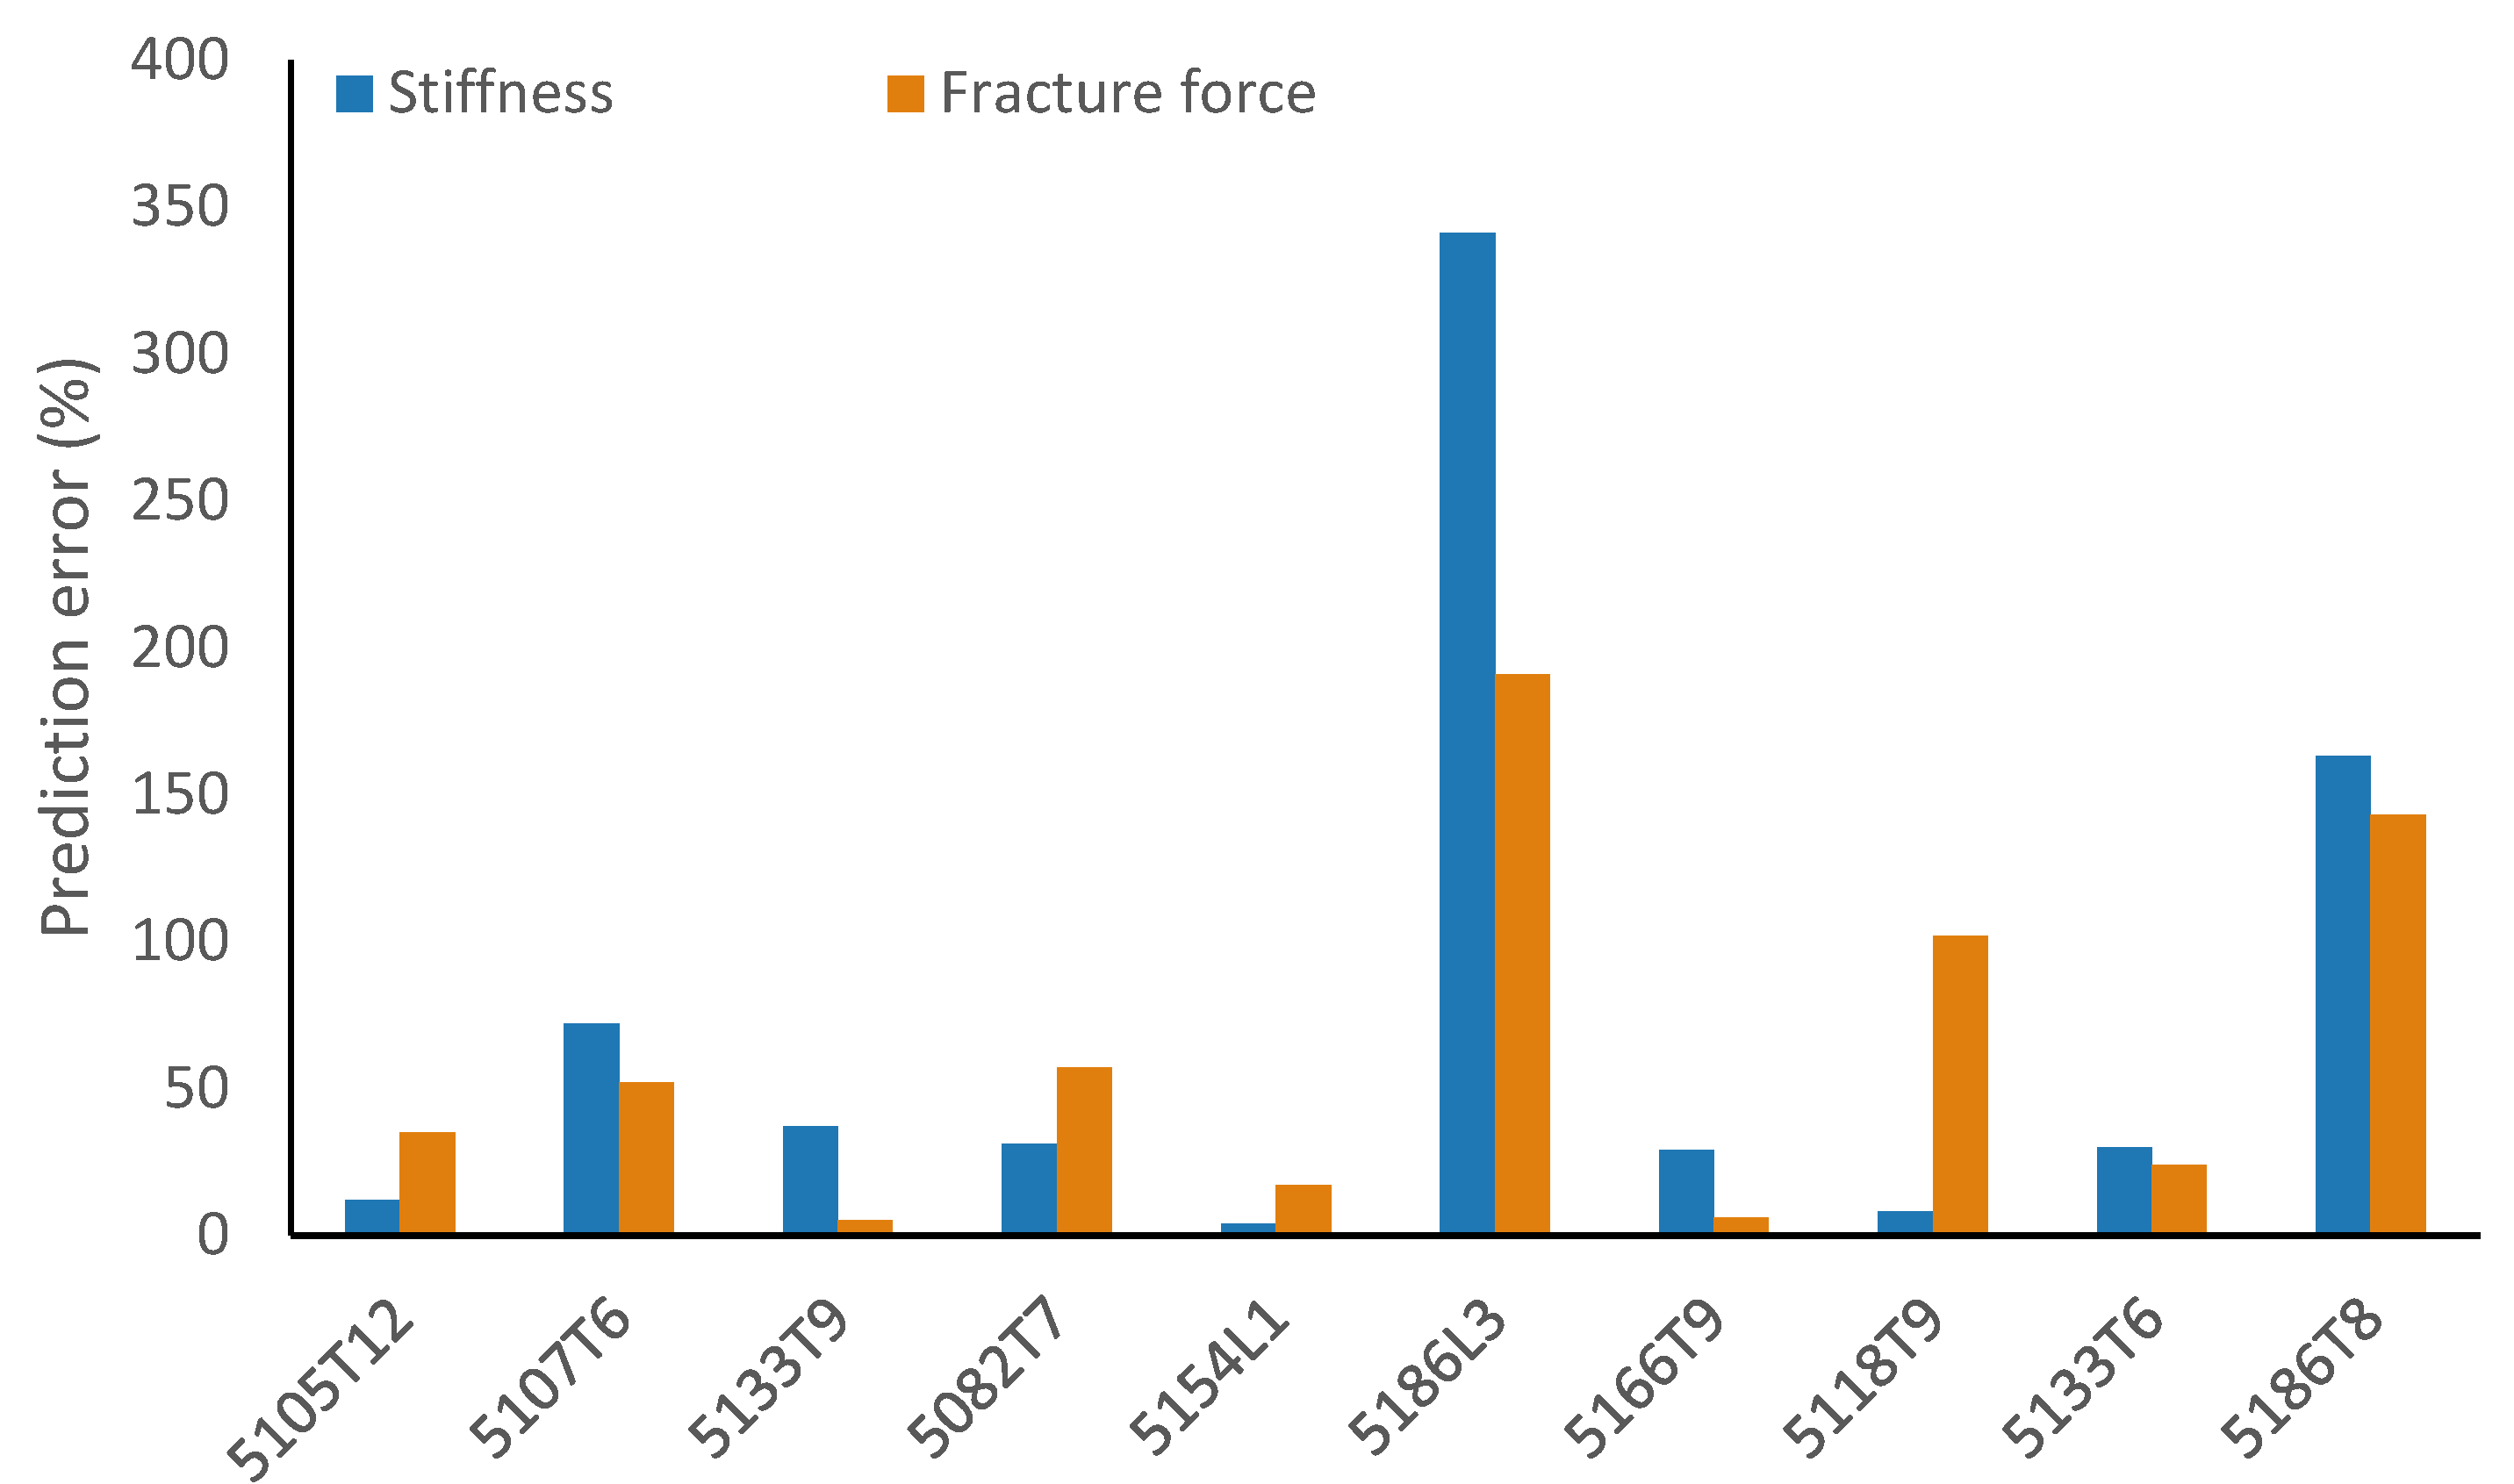
Prediction errors were examined to identify specimens with unusually large deviations between model predictions and experimental measurements. Grubbs’ test [33] identified specimen 5186L3 as a statistical outlier in both stiffness and fracture force prediction errors. A significance level of α = 0.05 was used. This specimen showed the largest errors in the dataset, with 341% error in stiffness and 219% error in fracture force. After excluding this outlier, the coefficient of determination increased from R² = 0.45 to R² = 0.53 for stiffness prediction and from R² = 0.47 to R² = 0.60 for fracture force prediction. For dynamically tested specimens, fracture force prediction improved more substantially, with R² increasing from 0.60 to 0.88 after exclusion of the outlier specimen.
Specimen 5186T8, obtained from the same donor, also showed a relatively high stiffness prediction error; however, it was not identified as a statistical outlier and was therefore retained in the primary analysis. These findings suggest that donor-specific factors and microstructural characteristics not captured by density alone may influence the mechanical response of the vertebrae.
It is worth noting that the predicted elastic modulus and fracture force (Figure 4) for two specimens from the same donor (5186L3 and 5186T8) showed large positive errors. In both cases, the model clearly overestimated the results. This suggests that something other than density is affecting the mechanical response of these samples. Density is important, but it does not fully describe the trabecular structure. Other factors, such as anisotropy, connectivity, cortical thickness, possible microdamage, and specimen geometry, may also influence the dynamic behavior of the vertebra.
If only density is used, the mechanical properties may be overestimated, especially when the internal structure of the bone is degraded.
To better understand the source of these errors, the relationship between the error in elastic modulus and different density measures (cortical, trabecular, and apparent density) was studied.
No clear relationship was found between the prediction errors and any of the density measures (R² ≈ 0), as shown in Figure 5. The errors are scattered over the whole range of density values. This shows that density alone cannot explain the differences between the model and the experimental results. This also suggests that other factors, such as trabecular structure, anisotropy, and specimen geometry, play an important role in the mechanical behavior of vertebral bone.
4. Discussion
In this study, a density-dependent viscoelastic model was used to describe the mechanical behavior of human vertebral bone. The model relates the elastic response to bone density and also includes time-dependent behavior using a Kelvin–Voigt model. The predicted stiffness values showed moderate agreement with the experimental data, which is reasonable because trabecular bone has high natural variability.
Samples with similar average density may still behave differently because their internal structures are not the same. Factors such as trabecular orientation, connectivity, and local density variations can strongly affect the mechanical response. Some variation in the data may also be related to the assumptions used in the model. In addition, the presence of an outlier specimen suggests that the model is sensitive to specimen-specific features that are not fully represented by density-based relationships. Although the Kelvin–Voigt model can represent rate-dependent behavior, it does not account for nonlinear behavior or damage. These effects may become more significant at higher loads and may explain some of the differences between the predicted and experimental results.
The relatively small improvement of the present model compared with the purely linear elastic model in stiffness prediction may be related to the limited effect of viscosity within the studied strain-rate range. Considering the natural variability of cadaveric bone and the assumptions used in the model, this level of agreement still indicates that the model can capture the general trend of stiffness across the specimens. In particular, the viscous coefficient increased with density, suggesting that denser trabecular bone may resist rate-dependent deformation more effectively. This observation is consistent with previous studies reporting that bone stiffness and strength increase with strain rate.
Additionally, in the present model, this behavior is represented through the viscous component, allowing the density-dependent viscous coefficient to reflect the combined effects of density and strain rate. A comparison with a purely linear elastic formulation showed that the viscoelastic model provided modest improvement in stiffness prediction and more pronounced improvement in fracture force prediction. Model performance also improved for specimens tested under dynamic loading conditions, indicating that the viscoelastic formulation became more important at higher strain rates.
For fracture force prediction, the model relies on an assumed failure strain. Although this is a common method, it introduces uncertainty because the actual failure strain may vary between specimens. Overall, the results suggest that density alone cannot fully explain variations in mechanical response. Microstructural characteristics and specimen-specific differences also appear to play an important role. Nevertheless, the model provides a useful representation of vertebral behavior under loading conditions related to spinal injury.
Compared with patient-specific finite element approaches, the present analytical framework has lower computational cost, requires fewer CT-based inputs, and avoids complex meshing and solver procedures. These features may make the model more suitable for rapid evaluation and wider clinical use.
Several limitations should be noted. First, the sample size is limited, which may contribute to the moderate agreement between the model predictions and the experimental data. Increasing the number of specimens could improve the results. Second, the vertebra was modeled as a cylinder, while real vertebrae have more complex and nonuniform geometries that can influence their mechanical behavior. Finally, the Kelvin–Voigt model does not account for nonlinear behavior or damage mechanisms, which may become important at higher load levels.
5. Conclusions
In this study, a density-dependent viscoelastic model was used to describe the mechanical behavior of human vertebral bone. The model combines a power-law relationship between elastic modulus and density with a density-dependent viscous term in a Kelvin–Voigt model. The results showed moderate agreement with the experimental data and improved prediction of mechanical response, especially under dynamic loading conditions. By including viscoelastic behavior, the model could represent the rate-dependent behavior of vertebral bone. The findings showed that although bone density is an important factor in the mechanical behavior of vertebral bone, it is not sufficient to fully explain the observed behavior. Other factors, such as bone microstructure, may also affect the behavior. Including these factors in the model may improve prediction accuracy. Overall, the model provides a useful approach for describing vertebral bone behavior under loading conditions related to spinal injury. The proposed model may also be a practical and computationally efficient alternative to more complex finite element models for preliminary assessment of vertebral strength.
References
- Johnell, O.; Kanis, J. An estimate of the worldwide prevalence and disability associated with osteoporotic fractures. Osteoporos. Int. 2006, 17, 1726–33. [Google Scholar] [CrossRef]
- MELTON, L.J., III; Kan, S.H.; Frye, M.A.; Wahner, H.W.; O'fallon, W.M.; Riggs, B.L. Epidemiology of vertebral fractures in women. Am. J. Epidemiol. 1989, 129, 1000–11. [Google Scholar] [CrossRef]
- Lips, P.; Cooper, C.; Agnusdei, D.; Caulin, F.; Egger, P.; Johnell, O.; et al. Quality of life in patients with vertebral fractures: validation of the quality of life questionnaire of the European Foundation for Osteoporosis (QUALEFFO). Osteoporos. Int. 1999, 10, 150–60. [Google Scholar] [CrossRef]
- Haj-Ali, R.; Massarwa, E.; Aboudi, J.; Galbusera, F.; Wolfram, U.; Wilke, H.-J. A new multiscale micromechanical model of vertebral trabecular bones. Biomech. Model. Mechanobiol. 2017, 16, 933–46. [Google Scholar] [CrossRef]
- Green, J.O.; Nagaraja, S.; Diab, T.; Vidakovic, B.; Guldberg, R.E. Age-related changes in human trabecular bone: Relationship between microstructural stress and strain and damage morphology. J. Biomech. 2011, 44, 2279–85. [Google Scholar] [CrossRef]
- Lim, T.-H.; Hong, J.H. Poroelastic model of trabecular bone in uniaxial strain conditions. J. Musculoskelet. Res. 1998, 2, 167–80. [Google Scholar] [CrossRef]
- Wang, J.; Parnianpour, M.; Shirazi-Adl, A.; Engin, A. Rate effect on sharing of passive lumbar motion segment under load-controlled sagittal flexion: viscoelastic finite element analysis. Theor. Appl. Fract. Mech. 1999, 32, 119–28. [Google Scholar] [CrossRef]
- Wang, J.-L.; Shirazi-Adl, A.; Parnianpour, M. Search for critical loading condition of the spine–a meta analysis of a nonlinear viscoelastic finite element model. Comput. Methods Biomech. Biomed. Eng. 2005, 8, 323–30. [Google Scholar] [CrossRef] [PubMed]
- Ojanen, X.; Tanska, P.; Malo, M.; Isaksson, H.; Väänänen, S.; Koistinen, A.; et al. Tissue viscoelasticity is related to tissue composition but may not fully predict the apparent-level viscoelasticity in human trabecular bone–An experimental and finite element study. J. Biomech. 2017, 65, 96–105. [Google Scholar] [CrossRef] [PubMed]
- Morgan, E.F.; Bayraktar, H.H.; Keaveny, T.M. Trabecular bone modulus–density relationships depend on anatomic site. J. Biomech. 2003, 36, 897–904. [Google Scholar] [CrossRef]
- Gibson, L. The mechanical behaviour of cancellous bone. J. Biomech. 1985, 18, 317–28. [Google Scholar] [CrossRef]
- Cowin, S.C. Bone mechanics handbook; CRC press, 2001. [Google Scholar]
- Goldstein, S.A. The mechanical properties of trabecular bone: dependence on anatomic location and function. J. Biomech. 1987, 20, 1055–61. [Google Scholar] [CrossRef]
- Wu, D.; Isaksson, P.; Ferguson, S.J.; Persson, C. Young’s modulus of trabecular bone at the tissue level: A review. Acta Biomater. 2018, 78, 1–12. [Google Scholar] [CrossRef]
- Lakes, R.S. Viscoelastic materials; Cambridge university press, 2009. [Google Scholar]
- Manda, K.; Xie, S.; Wallace, R.J.; Levrero-Florencio, F.; Pankaj, P. Linear viscoelasticity-bone volume fraction relationships of bovine trabecular bone. Biomech. Model. Mechanobiol. 2016, 15, 1631–40. [Google Scholar] [CrossRef]
- Manda, K.; Wallace, R.J.; Xie, S.; Levrero-Florencio, F.; Pankaj, P. Nonlinear viscoelastic characterization of bovine trabecular bone. Biomech. Model. Mechanobiol. 2017, 16, 173–89. [Google Scholar] [CrossRef] [PubMed]
- Rezaei, A.; Tilton, M.; Li, Y.; Yaszemski, M.J.; Lu, L. Single-level subject-specific finite element model can predict fracture outcomes in three-level spine segments under different loading rates. Comput. Biol. Med. 2021, 137, 104833. [Google Scholar] [CrossRef]
- Fung, Y-c. Biomechanics: mechanical properties of living tissues; Springer Science & Business Media, 2013. [Google Scholar]
- Fereydoonpour, M.; Rezaei, A.; Schreiber, A.; Lu, L.; Ziejewski, M.; Karami, G. Computational Assessment of Fracture Risk in Vertebral Bodies With Simulated Defects: The Role of Baseline Strength and Tumor Size. Int. J. Numer. Methods Biomed. Eng. 2025, 41, e70081. [Google Scholar] [CrossRef]
- Fereydoonpour, M.; Rezaei, A.; Lu, L.; Ziejewski, M.; Karami, G. Optimization of Bone Cement Stiffness in Metastatic Vertebral Augmentation: Balancing Strength Restoration and Stress Redistribution: M. Fereydoonpour et al. Ann. Biomed. Eng. 2025, 1–15. [Google Scholar] [CrossRef]
- Fereydoonpour, M.; Rezaei, A.; Schreiber, A.; Lu, L.; Ziejewski, M.; Karami, G. Prediction of vertebral failure under general loadings of compression, flexion, extension, and side-bending. J. Mech. Behav. Biomed. Mater. 2025, 162, 106827. [Google Scholar] [CrossRef] [PubMed]
- Carter, D.R.; Hayes, W.C. The compressive behavior of bone as a two-phase porous structure. JBJS 1977, 59, 954–62. [Google Scholar] [CrossRef]
- Ashby, M.F.; Gibson, L.J. Cellular solids: structure and properties; Press Syndicate of the University of Cambridge: Cambridge, UK, 1997; pp. 175–231. [Google Scholar]
- Morgan, E.F.; Keaveny, T.M. Dependence of yield strain of human trabecular bone on anatomic site. J. Biomech. 2001, 34, 569–77. [Google Scholar] [CrossRef]
- Keaveny, T.M.; Morgan, E.F.; Niebur, G.L.; Yeh, O.C. Biomechanics of trabecular bone. Annu. Rev. Biomed. Eng. 2001, 3, 307–33. [Google Scholar] [CrossRef]
- Rho, J.Y.; Ashman, R.B.; Turner, C.H. Young's modulus of trabecular and cortical bone material: ultrasonic and microtensile measurements. J. Biomech. 1993, 26, 111–9. [Google Scholar] [CrossRef] [PubMed]
- Eswaran, S.K.; Gupta, A.; Keaveny, T.M. Locations of bone tissue at high risk of initial failure during compressive loading of the human vertebral body. Bone 2007, 41, 733–9. [Google Scholar] [CrossRef] [PubMed]
- Fields, A.J.; Lee, G.L.; Liu, X.S.; Jekir, M.G.; Guo, X.E.; Keaveny, T.M. Influence of vertical trabeculae on the compressive strength of the human vertebra. J. Bone Mineral. Res. 2011, 26, 263–9. [Google Scholar] [CrossRef]
- Fields, A.J.; Nawathe, S.; Eswaran, S.K.; Jekir, M.G.; Adams, M.F.; Papadopoulos, P.; et al. Vertebral fragility and structural redundancy. J. Bone Mineral. Res. 2012, 27, 2152–8. [Google Scholar] [CrossRef] [PubMed]
- Allahyari, S.; Golabi, S. Reducing stress concentration around a hole in a thin-wall cylinder subjected to internal pressure using piezoelectric Patches. Iran. J. Sci. Technol. Trans. Mech. Eng. 2020, 44, 933–48. [Google Scholar] [CrossRef]
- Allahyari, S.M.; Si, Golabi. Reducing stress concentration around a hole in a plate subjected to biaxial tension. Iran. J. Sci. Technol. Trans. Mech. Eng. 2021, 45, 351–77. [Google Scholar] [CrossRef]
- Grubbs, F.E. Procedures for detecting outlying observations in samples. Technometrics 1969, 11, 1–21. [Google Scholar] [CrossRef]
Figure 1.
Illustrates the vertebral body cross-section (a), the equivalent mechanical model (b), and their physical interpretation (c).
Figure 1.
Illustrates the vertebral body cross-section (a), the equivalent mechanical model (b), and their physical interpretation (c).
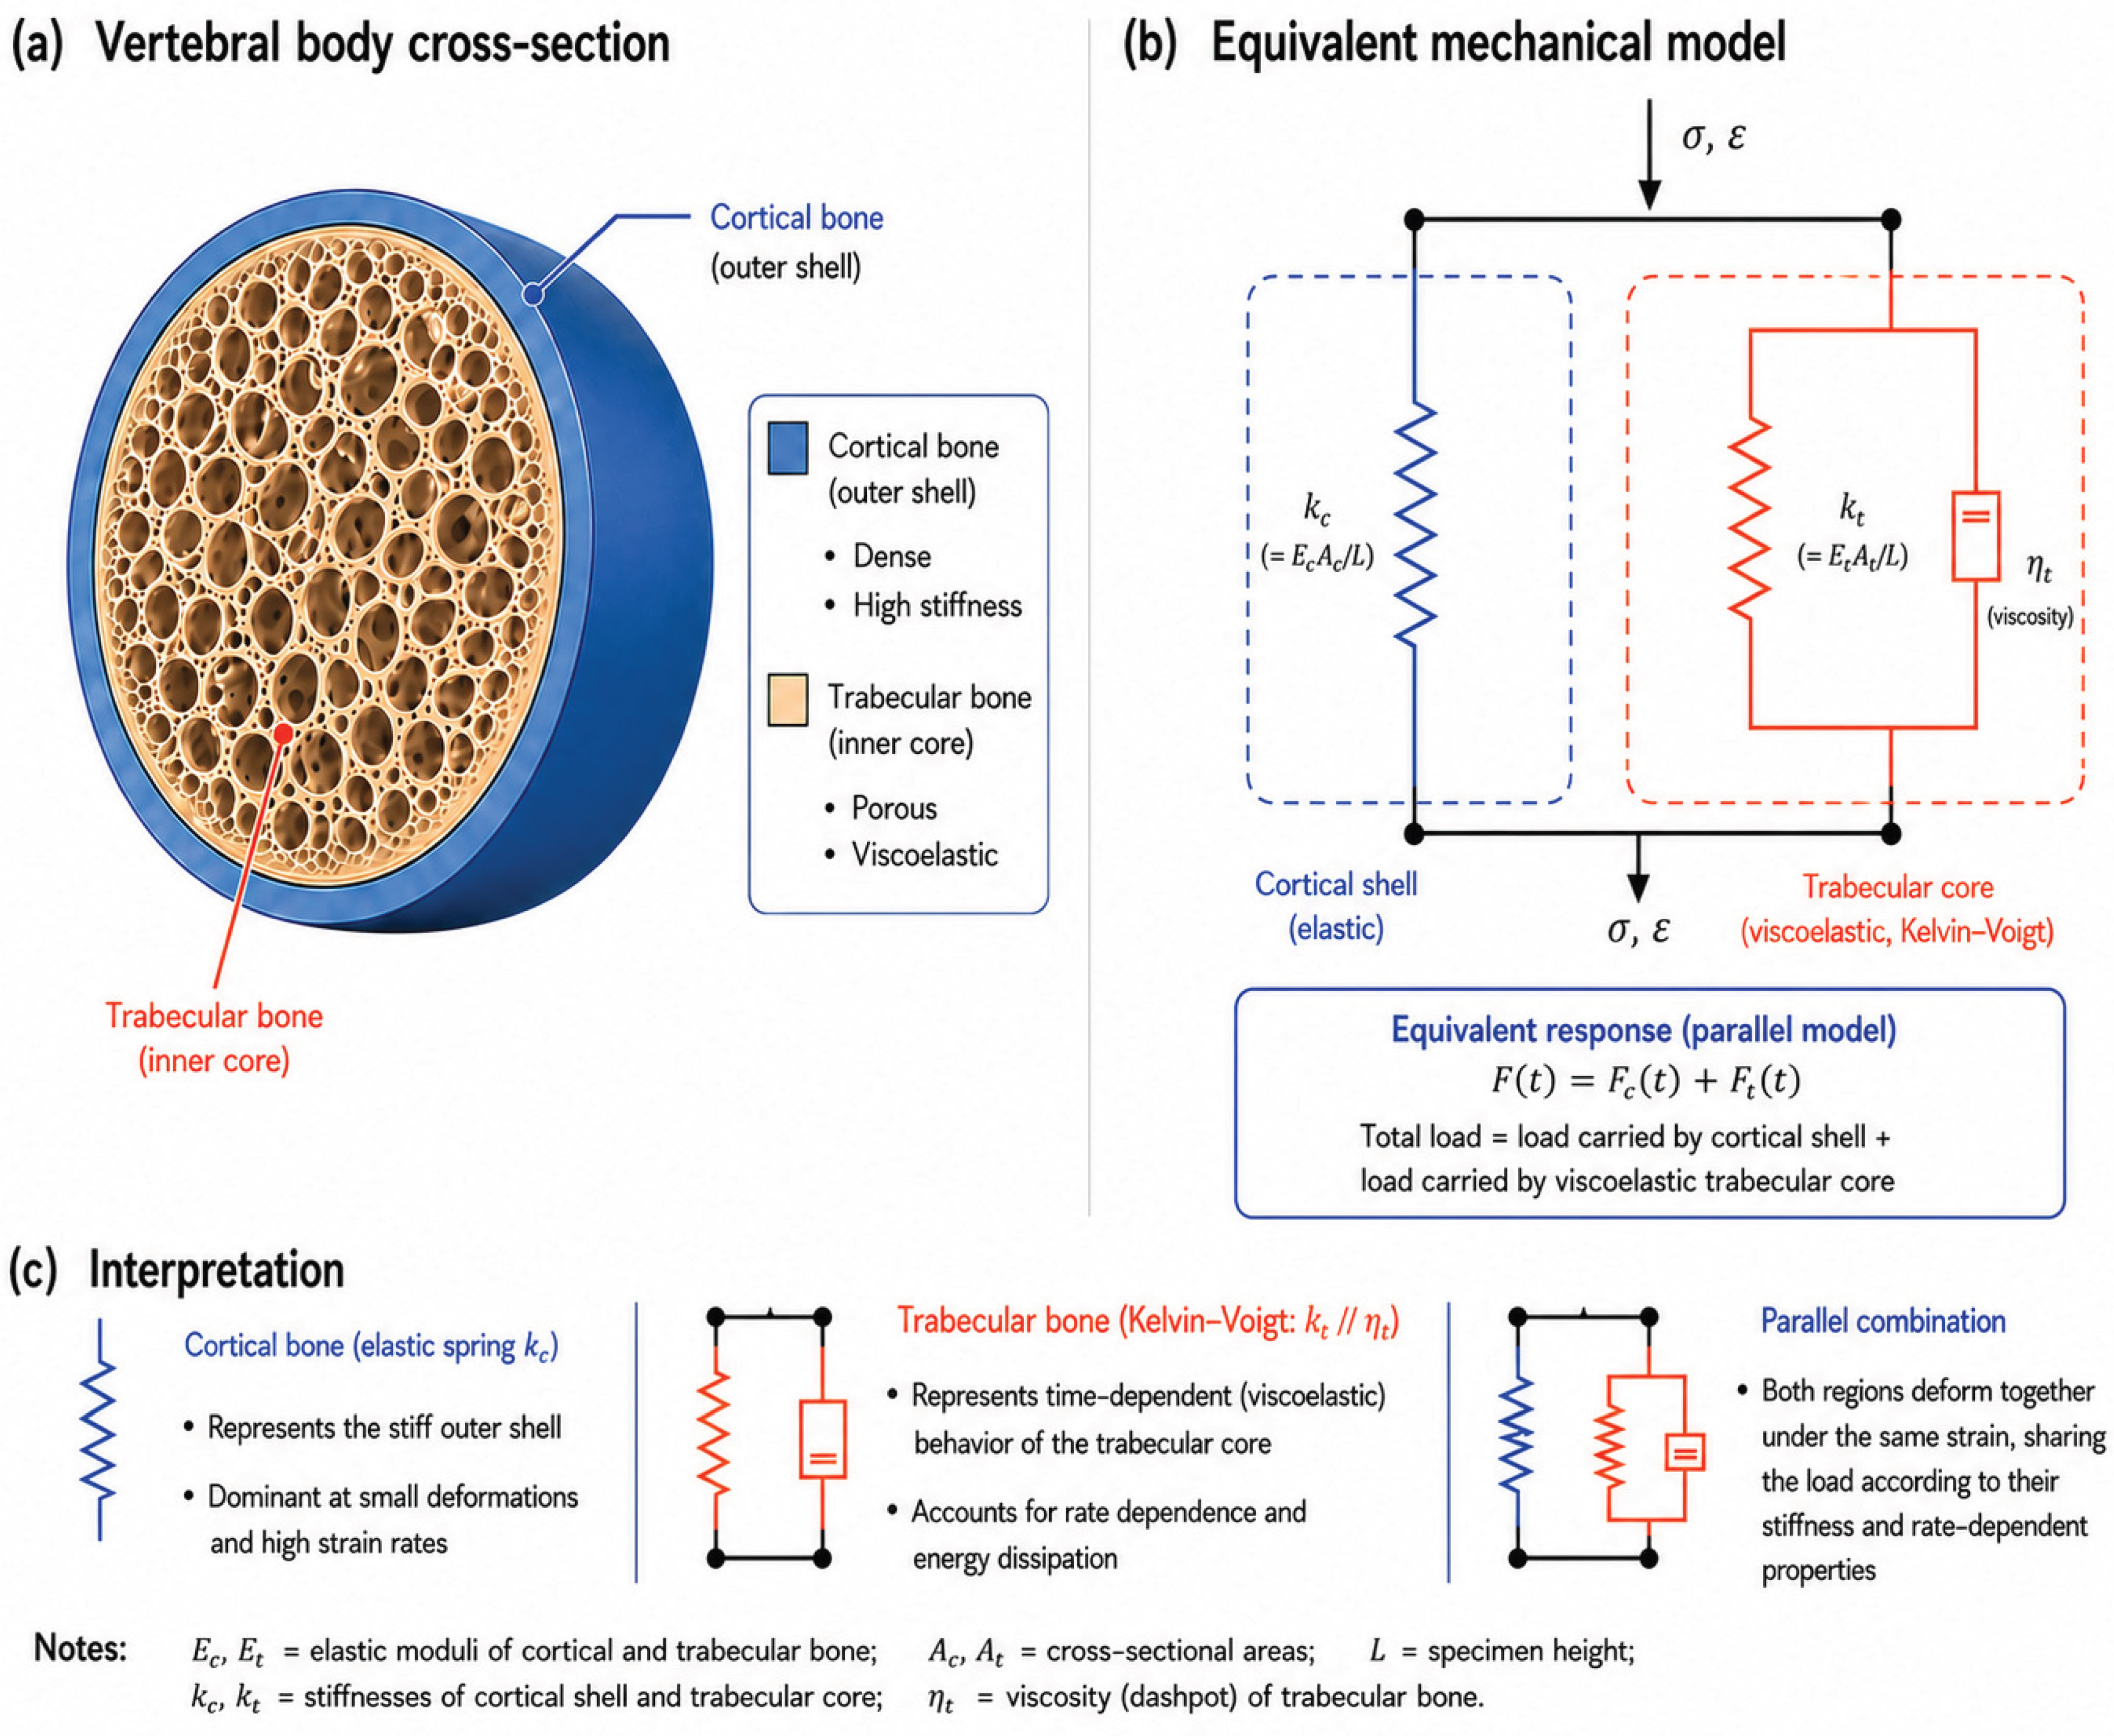
Figure 2.
Correlation between predicted and experimental normalized stiffness.
Figure 3.
Predicted versus experimental fracture force for (a) all specimens, including static and dynamic tests, and (b) dynamically loaded specimens.
Figure 3.
Predicted versus experimental fracture force for (a) all specimens, including static and dynamic tests, and (b) dynamically loaded specimens.
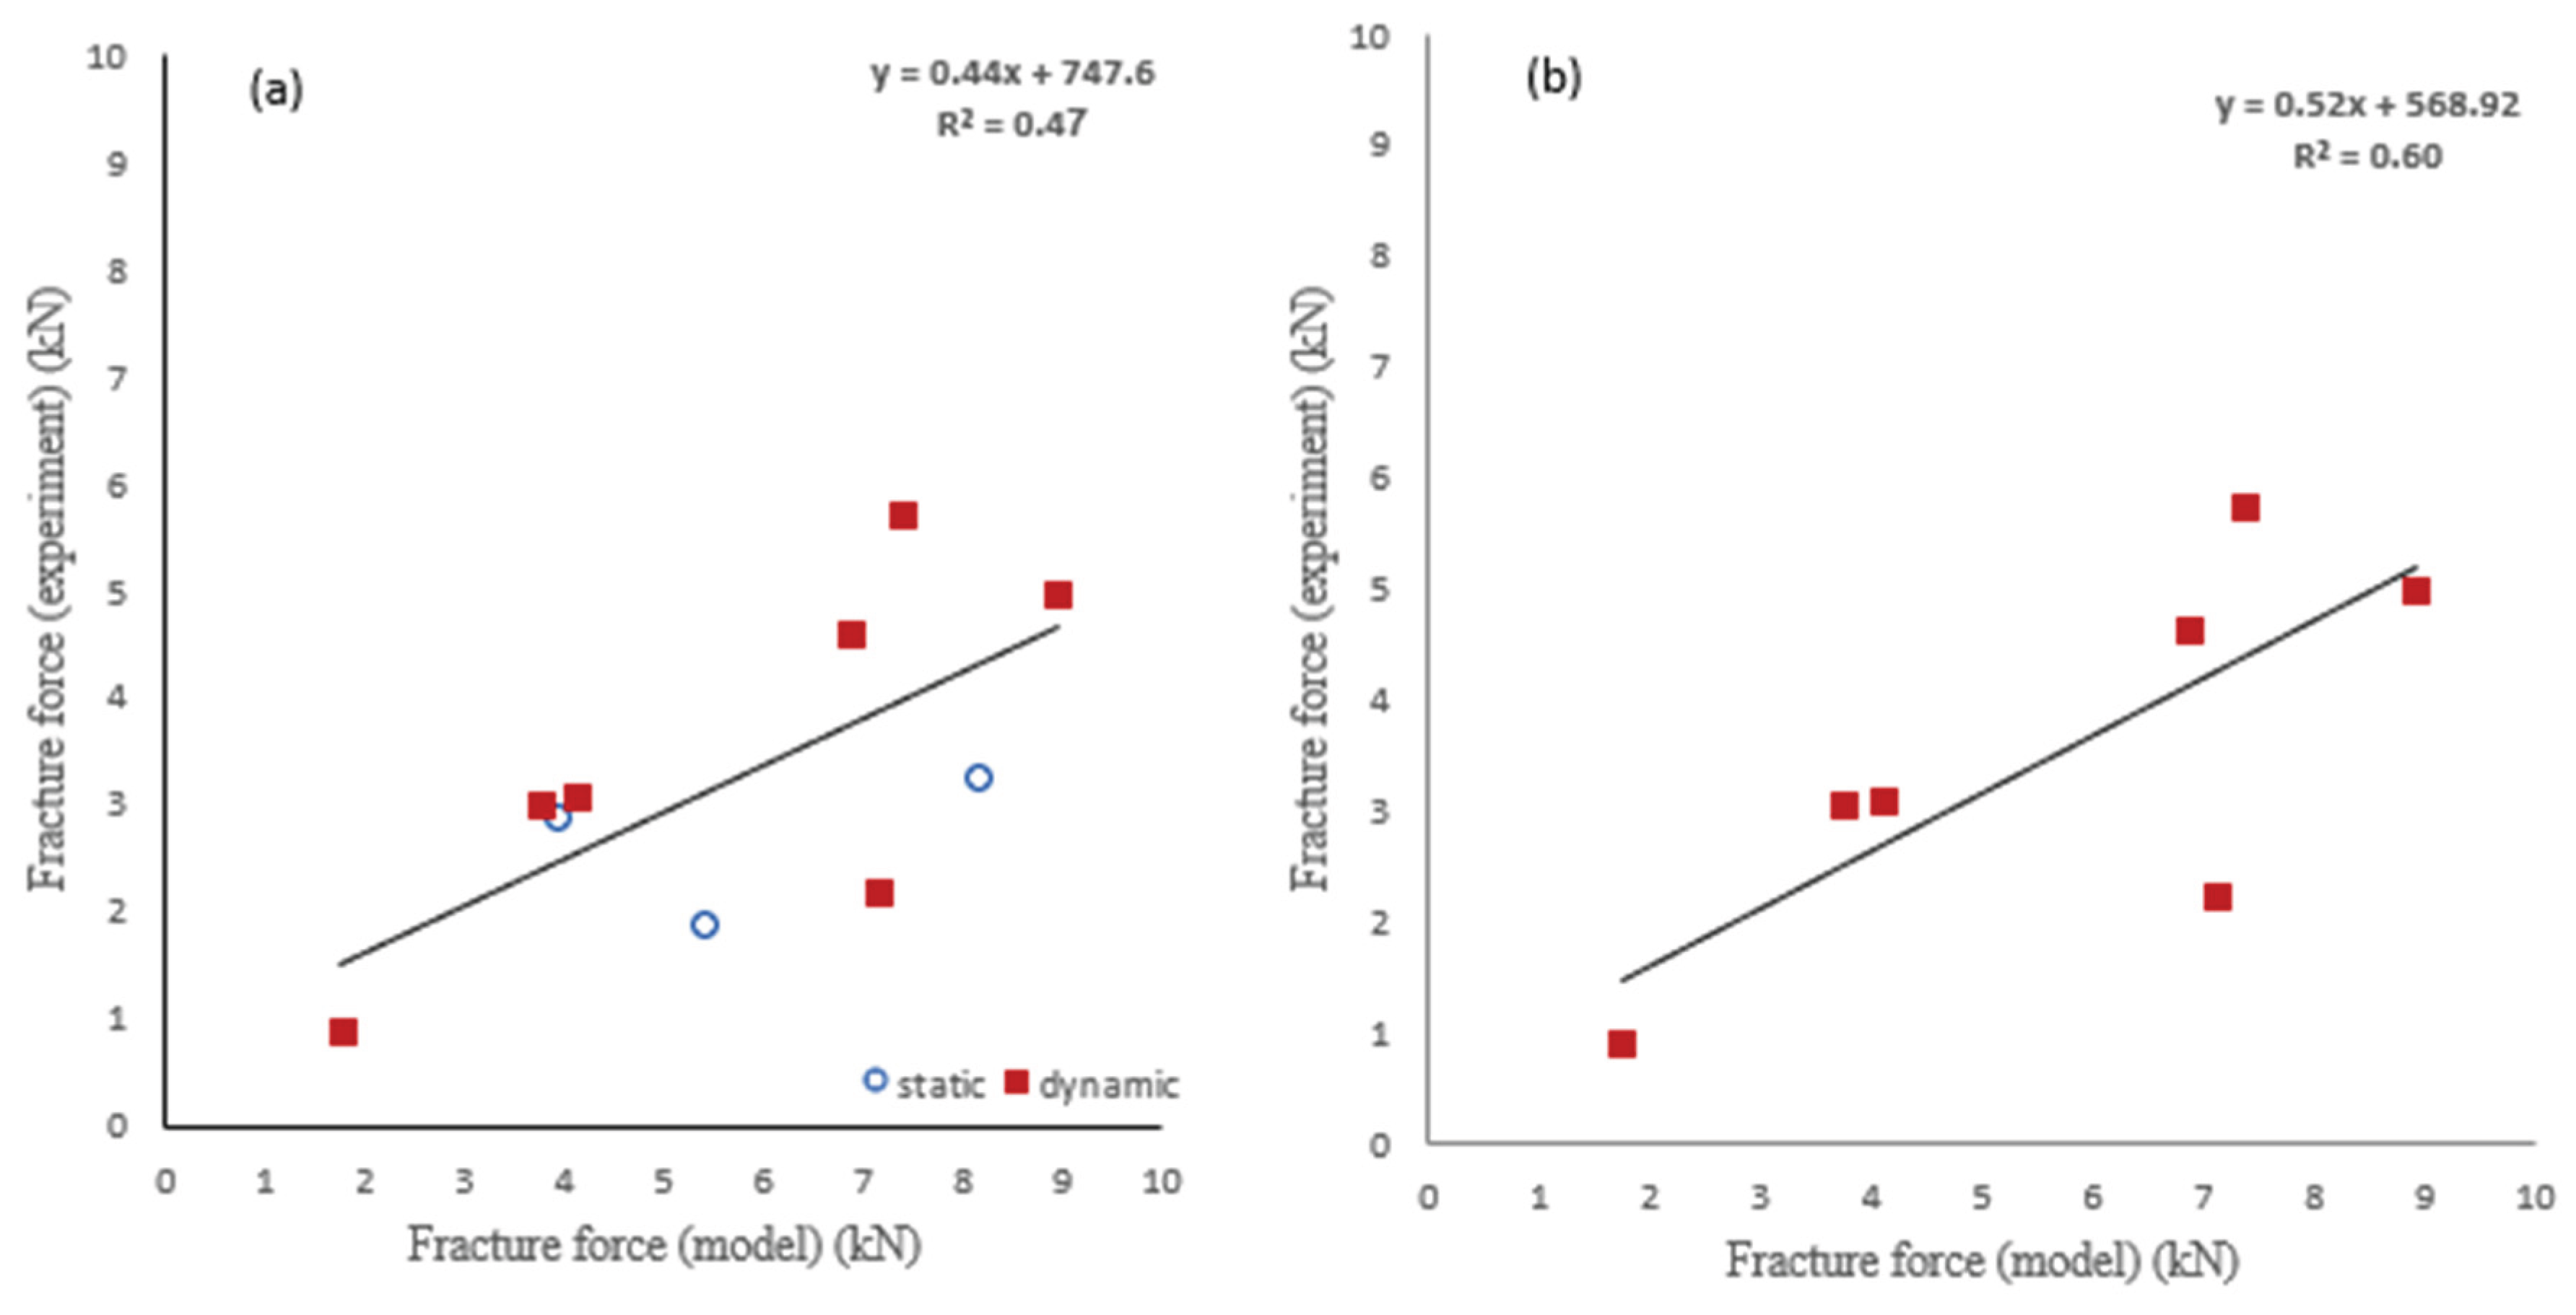
Figure 4.
Comparison of effective stiffness and fracture force prediction errors across all tested specimens. Values are presented in percentage (%).
Figure 4.
Comparison of effective stiffness and fracture force prediction errors across all tested specimens. Values are presented in percentage (%).
Figure 5.
Prediction error in (a) effective stiffness and (b) fracture force versus bone density for cortical, trabecular, and average density measures.
Figure 5.
Prediction error in (a) effective stiffness and (b) fracture force versus bone density for cortical, trabecular, and average density measures.
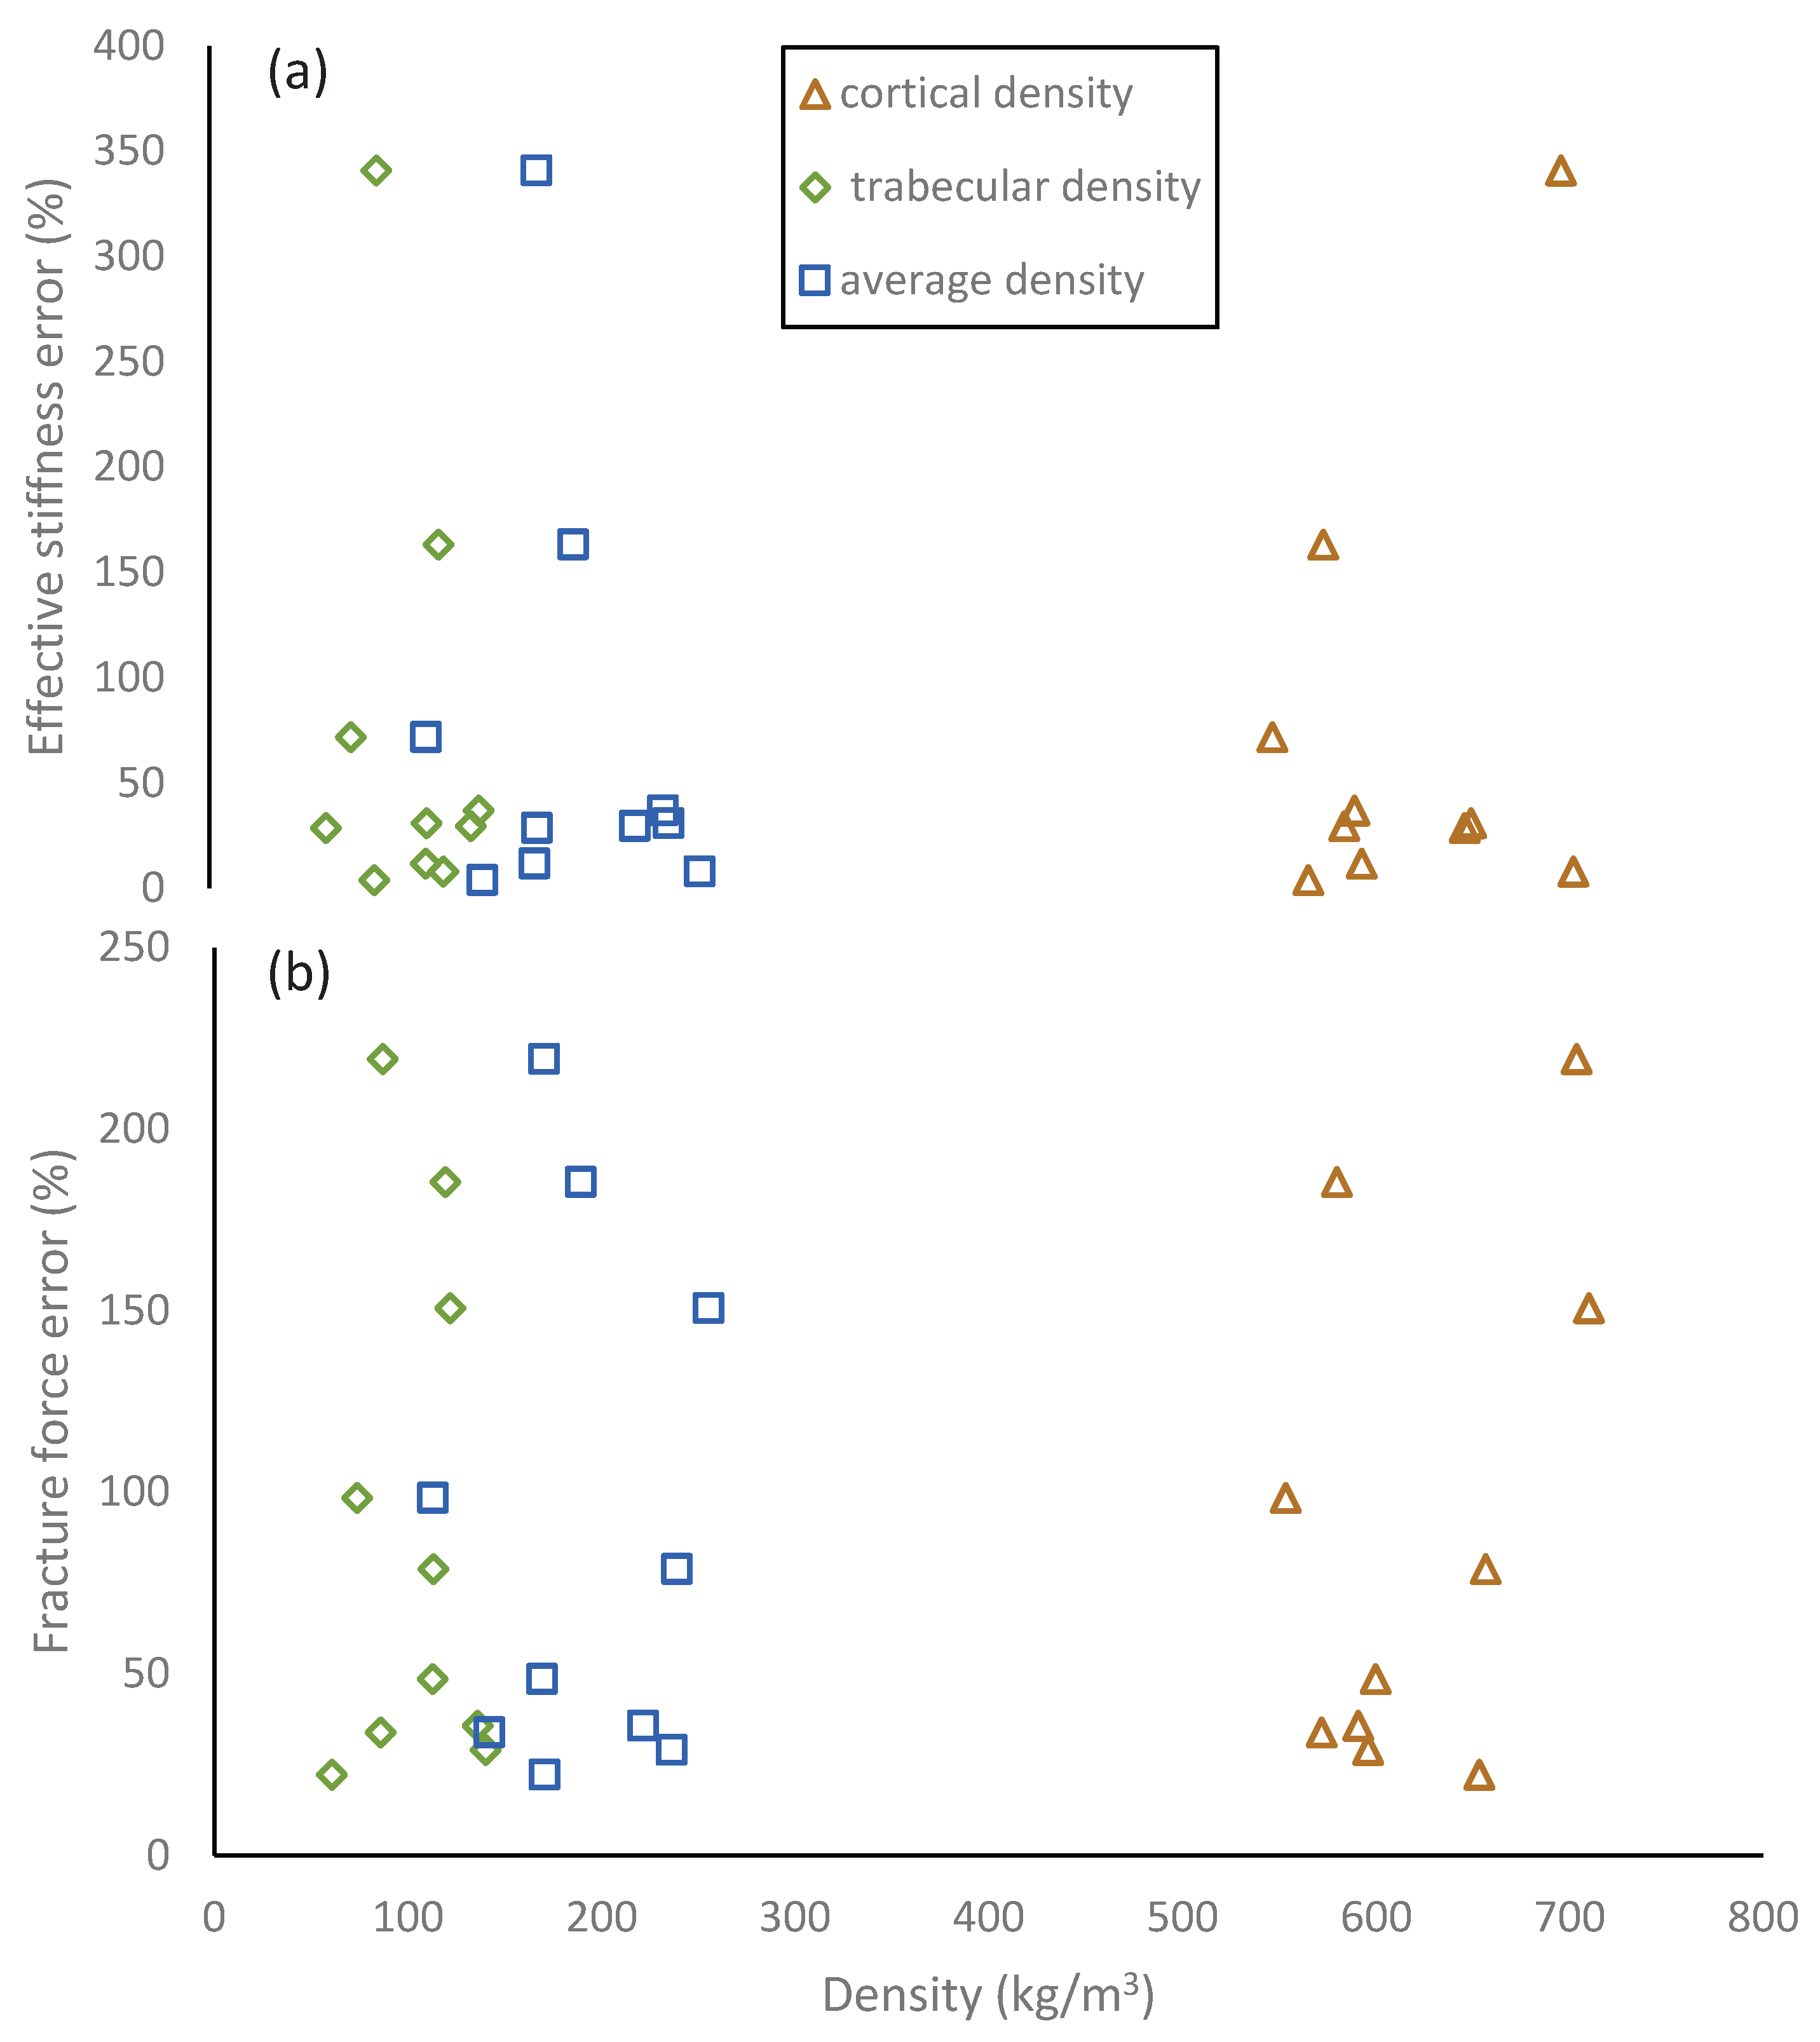

Table 1.
Geometric characteristics, loading conditions, and density properties of the tested vertebral specimens.
Table 1.
Geometric characteristics, loading conditions, and density properties of the tested vertebral specimens.
| Row | Bone ID | Loading Speed (mm/min) | Height (mm) | (s-1) | Cortical Area (mm²) | Trabecular Area (mm²) | Cortical Density (kg/m³) | Trabecular Density (kg/m³) |
| 1 | 5105T12 | 12,000 | 24.0 | 8.33 | 169 | 1287 | 599.8 | 112.6 |
| 2 | 5107T6 | 12,000 | 13.8 | 14.49 | 50 | 565 | 553.3 | 73.7 |
| 3 | 5133T9 | 12,000 | 22.8 | 8.77 | 218 | 815 | 595.9 | 140.1 |
| 4 | 5082T7 | 12,000 | 19.2 | 10.42 | 282 | 933 | 656.6 | 113.1 |
| 5 | 5154L1 | 12,000 | 22.8 | 8.77 | 130 | 995 | 571.9 | 86.0 |
| 6 | 5186L3 | 12,000 | 15.6 | 12.82 | 192 | 1222 | 703.4 | 86.9 |
| 7 | 5166T9 | 12,000 | 19.8 | 10.10 | 149 | 654 | 653.3 | 60.7 |
| 8 | 5118T9 | 5 | 19.8 | 0.004 | 266 | 904 | 709.9 | 121.8 |
| 9 | 5133T6 | 5 | 19.8 | 0.004 | 137 | 589 | 590.7 | 136.0 |
| 10 | 5186T8 | 5 | 15.0 | 0.006 | 187 | 1041 | 579.8 | 119.3 |
Strain rate was calculated as loading speed divided by specimen height.
Table 2.
Calibrated material parameters.
| Relationship | Parameter | Value | Unit |
| E = aρb | a | 25834 | Pa·(m³/kg)b |
| b | 1.39 | – | |
| η = cρ + d | c | 107.8 | Pa·s·m³/kg |
| d | -5938 | Pa·s |
Note: E = elastic modulus; ρ = density; η = viscous coefficient.
Table 3.
Comparison of experimental and model-predicted stiffness and fracture force.
| Row | Bone ID | Stiffness (Pa) | Fracture force (N) | ||||
| Experiment | Model | Error (%) | Experiment | Model | Error (%) | ||
| 1 | 5105T12 | 47,179,898 | 42,180,495 | 12 | 6,869 | 4,623 | 49 |
| 2 | 5107T6 | 28,440,747 | 16,548,570 | 72 | 1,749 | 881 | 98 |
| 3 | 5133T9 | 71,548,080 | 113,636,039 | 37 | 7,391 | 5,730 | 29 |
| 4 | 5082T7 | 73,553,063 | 56,176,909 | 31 | 8,937 | 4,997 | 79 |
| 5 | 5154L1 | 36,652,443 | 38,157,067 | 4 | 4,123 | 3,081 | 34 |
| 6 | 5186L3 | 50,453,129 | 11,444,487 | 341 | 7,134 | 2,234 | 219 |
| 7 | 5166T9 | 46,546,242 | 65,323,233 | 29 | 3,738 | 3,059 | 22 |
| 8 | 5118T9 | 69,706,787 | 64,562,385 | 8 | 8,156 | 3,253 | 151 |
| 9 | 5133T6 | 53,960,617 | 76,617,273 | 30 | 3,918 | 2,887 | 36 |
| 10 | 5186T8 | 44,134,980 | 16,762,866 | 163 | 5,420 | 1,899 | 185 |
Values are reported as experimental measurements, model predictions, and relative errors.
Disclaimer/Publisher’s Note: The statements, opinions and data contained in all publications are solely those of the individual author(s) and contributor(s) and not of MDPI and/or the editor(s). MDPI and/or the editor(s) disclaim responsibility for any injury to people or property resulting from any ideas, methods, instructions or products referred to in the content. |
© 2026 by the authors. Licensee MDPI, Basel, Switzerland. This article is an open access article distributed under the terms and conditions of the Creative Commons Attribution (CC BY) license (http://creativecommons.org/licenses/by/4.0/).
Copyright: This open access article is published under a Creative Commons CC BY 4.0 license, which permit the free download, distribution, and reuse, provided that the author and preprint are cited in any reuse.


