

Submitted:
15 May 2026
Posted:
18 May 2026
You are already at the latest version
Abstract
2,2′,4,4′-Tetrabromodiphenyl ether (BDE-47) is a persistent organic pollutant detected in coastal environments. The effects of BDE-47 on mangrove plants at the molecular and histological levels remain elusive. In this study, seedlings of the man-grove species Avicennia marina were exposed to BDE-47 at concentrations of 0, 1 and 10 ng L-1 for 20 days under hydroponic conditions. Leaf growth parameters, anatomical structures, and transcriptomic profiles were examined. At 1 ng L-1 BDE-47, no signif-icant changes were observed in leaf growth or vascular tissue morphology. However, transcriptome analysis showed significant enrichment of differentially expressed genes in the linoleic acid metabolism pathway, indicating that A. marina initiates early stress perception via enhanced stress perception and signal transduction, trigger adaptive defense responses to low-level BDE-47 exposure, and circumvent growth inhibition. At 10 ng L-1 BDE-47, leaf area, width, length, and fresh weight were all reduced. In addi-tion, histological examination revealed vascular bundle sheath atrophy, impaired xy-lem and phloem development, reduced parenchyma cell diameter, and a decreased proportion of intercellular space. Transcriptomic analysis at 10 ng L-1 exposure identi-fied significant enrichment of differentially expressed genes in the circadian rhythm and spliceosome pathways, indicating that the pollutant's toxicity has progressed from local metabolic disruption to perturbation of the plant's core regulatory network. Overall, our findings reveal distinct response patterns of A. marina leaves to BDE-47 exposure at environmentally relevant concentrations, initially elucidate the adaptive defense mechanism and underlying molecular basis of toxic effects in mangrove plants under low-concentration BDE-47 exposure, and provide critical scientific support for the ecological risk assessment and conservation of coastal mangrove wetlands.
Keywords:
Avicennia marina
; seedlings
; BDE-47
; growth
; leaf damage
; molecular mechanisms
1. Introduction
Mangroves are critical ecosystems found widely across intertidal zones on tropical and subtropical coasts. Their exceptionally high productivity and biodiversity are well recognized [1]. Globally, these systems cover roughly 145,068 km², with Asia alone accounting for about 39.2% of that area [2]. As a key component of the global carbon cycle, mangrove ecosystems store more carbon per unit area than any other ecosystem type—total storage can exceed 450 Mg C/ha. This makes them indispensable for regulating global climate and mitigating greenhouse gas effects [3,4]. The complex root systems and dense vegetation also offer essential habitats and nursery grounds for numerous fish, crustaceans, and bird species. Storm surge buffering and coastal erosion reduction are further services they provide, effectively acting as natural ecological barriers for coastal communities [5,6,7,8,9]. One dominant species in the Indo-Pacific region, Avicennia marina, often serves as a pioneer on newly formed muddy coasts, thanks to its strong tolerance to salinity and waterlogging. This species plays a fundamental role in the succession and stability of mangrove communities [10].
Over the past few decades, mangrove area has declined rapidly [11,12]. Expanding coastal aquaculture, accelerated urbanization, and increasing pollutant inputs appear to be the primary drivers behind this degradation [13]. Positioned at the land-sea interface, mangrove ecosystems are highly susceptible to becoming “biogeochemical sinks” for both terrestrial and marine pollutants. Among these pollutants, persistent organic pollutants (POPs) pose long-term, latent ecological risks [14]. BDE-47 (2,2′,4,4′-tetrabromodiphenyl ether) is a representative POP and a major component of commercial pentabromodiphenyl ether mixtures. Its chemical stability, strong lipophilicity, and resistance to degradation have led to its listing as a priority controlled substance under the Stockholm Convention [15]. As a widely used brominated flame retardant, BDE-47 is continuously released during production, application, and disposal; it has been extensively detected in aquatic systems. In marine environments, typical seawater concentrations range from sub-ng·L⁻¹ to several ng·L⁻¹, though levels can occasionally reach tens of ng·L⁻¹ in heavily impacted coastal regions [16,17,18]. Because of its pronounced hydrophobicity and persistence, BDE-47 readily partitions into suspended particles and biological tissues, promoting accumulation within coastal ecosystems [19]. In mangrove systems, BDE-47 has been found in plant tissues, especially leaves, at concentrations usually between about 0.1 and 1.0 ng·g⁻¹ dry weight, depending on species and environmental conditions [20,21]. Such accumulation, together with documented uptake, translocation, and trophic transfer of PBDEs, suggests that BDE-47 could exert long-term adverse effects on the stability and ecological functioning of coastal environments [22,23].
Toxicological studies in aquatic animals have shown that BDE-47 causes multiple effects: mortality, reduced movement, impaired photosynthesis, immune dysfunction, and abnormal reproduction and development [24,25,26,27]. For plants, however, research on BDE-47 toxicity is much less developed. Most existing work has focused on physiological and biochemical responses. The general view is that BDE-47 induces oxidative stress by promoting reactive oxygen species (ROS) production. For example, exposure to BDE-47 inhibits maize seed germination and raises malondialdehyde (MDA) levels and antioxidant enzyme activity in seedling roots [28]. Preliminary studies on mangroves also indicate that BDE-47 suppresses growth of Kandelia obovata seedlings and disrupts their glutathione–ascorbate cycle [29,30]. Yet nearly all published studies have described changes in physiological indicators under stress. What remains largely unknown is the molecular and cellular mechanisms behind BDE-47’s effects on mangrove plants.
High-throughput transcriptomics (RNA-seq) has been successfully used to decipher plant molecular responses to abiotic stresses such as salt and heavy metals, allowing comprehensive and efficient identification of differentially expressed genes (DEGs) and key regulatory networks [31,32]. To address the gaps noted above, the present study uses A. marina, a key mangrove species and integrates transcriptomics, physiology, and histological methods. The goal is to investigate how BDE-47 exposure affects leaf development, cellular ultrastructure, and gene expression profiles in this species. By revealing the underlying molecular regulatory mechanisms in response to BDE-47 stress, this work aims to provide a critical theoretical basis and scientific support for assessing the potential risks of POPs to mangrove ecosystems, as well as for formulating effective conservation and restoration strategies.
2. Materials and Methods
2.1. Plant Materials and Exposure Treatment
Insect-free and plump hypocotyls of A. marina were collected and subjected to graded selection on the basis of fresh weight to ensure consistent initial health status and biomass among the different experimental groups. The selected hypocotyls were individually transferred to ecological culture tanks for hydroponic culture. To investigate the stress effects of BDE-47 on A. marina seedlings, three concentration groups were set up: 0 ng L-1 (control group, CK), 1 ng L-1 (low concentration), and 10 ng L-1 (high concentration). BDE-47 was dissolved and prepared using chromatographically pure dimethyl sulfoxide (DMSO) as a solubilizer. A standard substance of BDE-47 with a purity of ≥99% was weighed and dissolved in DMSO to prepare a 10 mg/L stock solution, which was stored in sealed containers at ‒20℃ away from light. During the experiment, the stock solution was serially diluted and added to Hoagland’s nutrient mixture to reach the preset BDE-47 concentrations. To ensure BDE-47 was the only stressor, all seedlings were cultured in Hoagland’s nutrient solution (salinity 1.5‰) with corresponding BDE-47 concentrations. All the prepared culture tanks were subsequently transferred to an artificial climate incubator for 20 days of culture under controlled conditions: temperature 28±2℃; relative humidity, 60–70%; and light/dark cycle, 12 h/12 h. During this period, the growth status of the hypocotyls in each treatment group was observed and recorded daily. After the exposure period, the plants were dissected, and leaf samples from each hypocotyl were collected promptly. Following the determination of relevant physiological and ecological indicators, the leaf samples were quickly frozen in liquid nitrogen. Each treatment group included 3 biological replicates, and each replicate contained 20 hypocotyls. All quick-frozen samples were stored at −80 °C until use.
2.2. Microscopic Analysis
Leaf samples from A. marina were subjected to paraffin embedding, after which tissue sections were prepared for safranin O-fast green staining. The paraffin sections were first dewaxed and rehydrated. This involved sequential immersion in ethylene glycol monoethyl ether acetate (EGMEA) I for 6 h at 37 °C, followed by EGMEA II overnight at the same temperature, and then EGMEA III and IV for 10–15 min each at room temperature. Dehydration followed using a graded ethanol series: 100 % I, 100 % II, 95 %, 90 %, and 80 %, each for 10 min. A rinse with running water completed the rehydration step. For staining, sections were placed in safranin O solution (Servicebio, G1031, 0.1 % w/v) for 3–5 s. Excess dye was quickly removed by a tap-water wash. Differentiation was then carried out in 50 %, 70 %, and 80 % ethanol (3–8 s each) while monitoring under a microscope; the endpoint was when lignified cell walls appeared distinctively red and other tissues retained only a faint pink hue. Counterstaining used fast green solution (0.1 % w/v) for 4–6 s. Afterwards, sections were dehydrated in anhydrous ethanol (three times) and cleared in xylene for 5 min. Mounting was done with neutral balsam (SCRC, 10004160). Observations were made using a Nikon Eclipse E100 upright optical microscope equipped with a Nikon DS-U3 imaging system. The system uses a CFI optical design and a 6 V-20 W halogen light source, with magnification ranging from 40× to 1500×. Digital images were captured to allow quantitative analysis of two features: cell wall lignification (indicated by red staining) and cellulose-rich regions (green staining).
2.3. RNA Extraction and RNA-Sequencing
For RNA-seq analysis, leaf samples were collected after the exposure period. Total RNA extraction, library construction, and high-throughput sequencing were performed by Guangdong Meige Gene Technology Co., Ltd. (Guangzhou, China). Total RNA was extracted using a commercial kit, and its quality was assessed by 1% agarose gel electrophoresis, Qubit 4.0 Fluorometer (Thermo Fisher Scientific, MA, USA), Nanodrop One Spectrophotometer (Thermo Fisher Scientific, MA, USA), and Agilent 4200 System (Agilent Technologies, Waldbronn, Germany). Poly (A) RNA was isolated from total RNA using poly-T oligo-attached magnetic beads. Strand-specific cDNA libraries were constructed using the ALFA-SEQ RNA Library Prep Kit II. Briefly, mRNA was fragmented in RT Buffer, first-strand cDNA was synthesized using random hexamers and reverse transcriptase, and second-strand cDNA was synthesized using DNA polymerase I and RNase H. The double-stranded cDNA was subjected to end repair, 3’-end adenylation, and ligation of sequencing adapters. The second-strand cDNA was digested to retain strand orientation. Libraries were amplified by PCR using Hi-Fi PCR Mix and purified with purification beads. Library fragment size was evaluated using a Qsep400 High-Throughput Nucleic Acid Protein Analysis System (Houze Biology, Hangzhou, China), and library concentration was measured using a Qubit 4.0 (Thermo Fisher Scientific, Waltham, USA). Qualified libraries were sequenced on an Illumina sequencing platform, generating 150 bp sequencing reads. Raw sequencing data were quality-filtered using fastp (v0.23.2), and rRNA sequences were removed by aligning to the NCBI Rfam database using Bowtie2 (v2.4.5). The resulting clean data were used for subsequent bioinformatic analyses.
2.4. RNA-Seq Data Analysis
Raw reads were quality-controlled using fastp with the following criteria: bases with quality <15 ≤ 40%, sliding window (4 bp) average quality ≥20, read length ≥75 bp, and N bases ≤ 5. Ribosomal RNA reads were removed by alignment to the NCBI RefSeq and Rfam databases using Bowtie 2. Clean reads were aligned to the reference genome using Bowtie 2, and transcripts were assembled with StringTie using GTF/GFF annotations. Gene expression was quantified with Salmon, and transcript-level counts were summarized to gene-level counts using tximport in R. TPM and normalized counts were generated for downstream analysis. Differential expression analysis was performed with DESeq2 or edgeR. Genes were considered differentially expressed based on an adjusted p-value (FDR) < 0.05 and ∣log2FC∣>1. Additionally, SNP/InDel calling was conducted using GATK and annotated with ANNOVAR, while alternative splicing events were identified with rMATS.
2.5. Statistical Analysis
Differentially expressed genes (DEGs) were annotated using the GO, KEGG, and EggNOG databases. GO terms were categorized into Cellular Component (CC), Biological Process (BP), and Molecular Function (MF). Enrichment analysis for GO and KEGG pathways was performed using clusterProfiler with a hypergeometric test, and significance was defined as FDR < 0.05.
2.6. Quantitative Real-Time PCR Validation
To verify the reliability of the transcriptome results, this study randomly selected 3 differentially expressed genes in the leaves of A. marina from each exposure group for quantitative real-time PCR (qRT-PCR) validation. Both the control group and each exposure group included 3 biological replicates, and 3 technical replicates were performed for each sample. According to the instructions of the ChamQ SYBR qPCR Master Mix (Q341-02/03) kit, AmActin was used as the reference gene, and the relative quantification of gene expression was conducted using the 2−ΔΔCt method. Primers for the selected differentially expressed genes were designed with NCBI and then synthesized, and the primer sequences are shown in Table S1.
2.7. Statistical Analysis and Data Visualization
The data were processed and graphically visualized via Excel 2010 and GraphPad Prism 8.3.0, whereas one-way analysis of variance (ANOVA) followed by Duncan’s multiple range test was performed using IBM SPSS Statistics 23.0 to assess significant differences among treatments. All data are presented as mean ± standard error (Mean ± SEM), with different letters among treatment groups indicating significant differences (p < 0.05). Gene expression levels, detected via qRT-PCR, are also presented as mean ± SE, with statistical significance assessed using two-tailed Student’s t-tests (p < 0.05).
3. Results
3.1. Effects of BDE-47 on Apparent Leaf Growth
As shown in Figure 1, the effect of BDE-47 on leaf growth traits in A. marina depended on the concentration used. For plants exposed to 1 ng L⁻¹ BDE-47, none of the four measured parameters (leaf surface area, width, length, and fresh weight) showed a statistically significant difference from the control (all p > 0.05), though each trait did exhibit a slight, non-significant increase. At the higher concentration (10 ng L⁻¹), the picture changed completely: every one of those four growth indices was significantly suppressed relative to the control (all p < 0.05).
3.2. Histological Changes and Effects
Histological damage to leaf tissues of A. marina following BDE-47 exposure is documented in Figure 2. At 50× magnification (Figure 2A–C), leaves from the CK control group and the 1 ng L⁻¹ BDE-47 treatment showed no obvious tissue-level changes. Their vein structure remained clear, vascular bundle sheaths were well-developed and regular in shape, and both xylem and phloem appeared normally developed. A different picture emerged under the same magnification for leaves exposed to 10 ng L⁻¹ BDE-47. Here, pronounced tissue-level alterations were visible, vascular bundle sheaths were reduced in overall size, their structure compressed and deformed, and xylem and phloem development turned abnormal. Notably, phloem development was retarded and showed poor continuity.
Moving to higher magnifications (100× and above, Figure 2D–I), no significant cell-level changes were detected in the CK control or the 1 ng L⁻¹ BDE-47 group. In those samples, parenchyma cells surrounding the vascular bundles were plump, uniform in size, and separated by distinct intercellular spaces; xylem vessels and phloem were well-developed and highly continuous. At the high concentration (10 ng L⁻¹ BDE-47), however, distinct cellular abnormalities appeared in the leaf anatomical structure. Xylem development was retarded, with narrow lumens, and some vessels became distorted or even collapsed. Phloem cells were similarly underdeveloped and discontinuous. In addition, the parenchyma cells around the vascular bundles showed not only a marked reduction in diameter but also irregular shapes and disordered arrangement, leading to a sharp decrease or near disappearance of intercellular spaces.
Quantitative analysis (Figure 3) supported these morphological observations. Under 1 ng L⁻¹ BDE-47, no significant changes were found in any leaf anatomical parameter. These included vascular bundle sheath area and perimeter, xylem cell number and area, parenchyma cell diameter, and intercellular space proportion. All p values were >0.05. At 10 ng L⁻¹ BDE-47, every one of these indices decreased significantly (p < 0.05). The vascular bundle sheath became atrophic. Xylem development was inhibited, with fewer cells and smaller individual cell areas. Parenchyma cell diameter also decreased. Intercellular space proportion dropped as well. These quantitative microstructural changes matched the tissue-level observations. They histologically confirm severe leaf damage at 10 ng L⁻¹ BDE-47.
3.3. Quality Control of Transcriptome Sequencing Data
In this study, transcriptome analysis was performed on hypocotyl leaves of A. marina under BDE-47 stress at different concentrations. The quality of sequencing data is presented in Table S2 of Supplementary Materials, and the statistics of reads mapped to the reference gene are summarized in Table S3 of Supplementary Materials. A Q30 base quality value indicates a sequencing error rate of 0.1% for the corresponding base. In general, a sequencing error rate below 1% at individual base positions is sufficient for subsequent data analysis.
The results showed that the percentage of Q30 bases in all leaf samples was above 92.67%, and the GC content ranged from 44.63% to 48.84%. The mapping rates of all leaf samples aligned to the reference genome were higher than 88.74%, whereas the commonly accepted threshold is no less than 60%. Therefore, the sequencing data of samples in this study fully met the quality control criteria.
3.4. Effects of Different BDE-47 Concentrations on Gene Expression in A. marina Leaves
To evaluate gene expression differences among treatments, DEGs identified in the 1 ng L-1, 10 ng L-1, and CK (control) groups were subjected to pairwise comparisons on the basis of the filtering thresholds of p < 0.05 and |log₂(fold change, FC)| > 1. The results of gene expression between the BDE-47 stress treatment groups and the control group revealed the following: 3193 DEGs (1845 upregulated, 1348 downregulated) were detected between the 1 ng L-1 group and CK; 2203 DEGs (1383 upregulated, 820 downregulated) were detected between the 10 ng L-1 group and CK; and 1742 DEGs (1019 upregulated, 723 downregulated) were detected between the 1 ng L-1 and 10 ng L-1 groups (Figure 4). After BDE-47 exposure, the number of DEGs in A. marina leaves decreased with increasing BDE-47 concentration, whereas the number of upregulated DEGs was higher than that of downregulated DEGs in all pairwise comparisons. This finding indicates that under 1 ng L-1 BDE-47 stress, the transcriptional expression pattern was more active, and many DEGs were co-expressed in both the 1 ng L-1 and 10 ng L-1 groups, suggesting that A. marina leaves exhibit a high level of responsiveness to BDE-47 stress during development. Furthermore, the number of DEGs detected in both the intertreatment and treatment‒control comparisons corresponded with observed physiological responses.
3.5. GO Enrichment Analysis and KEGG Pathway Analysis of DEGs in A. marina Leaf Tissues
To gain deeper insights into the functions of the DEGs between the CK control group and experimental groups treated with different BDE-47 concentrations, GO enrichment analysis was performed on the DEGs identified from the “1 ng L-1 vs. CK” and “10 ng L-1 vs. CK” comparisons. Statistical classification of the relevant GO terms was subsequently conducted. The results revealed that the DEGs were involved mainly in functions such as rhythmic process and spliceosomal complex; notably, rhythmic process was the most significantly enriched function in both the “1 ng L-1 vs. CK” and “10 ng L-1 vs. CK” comparisons. Furthermore, across all pathways in these two comparisons, the number of upregulated genes was consistently higher than that of downregulated genes (Figure 5).
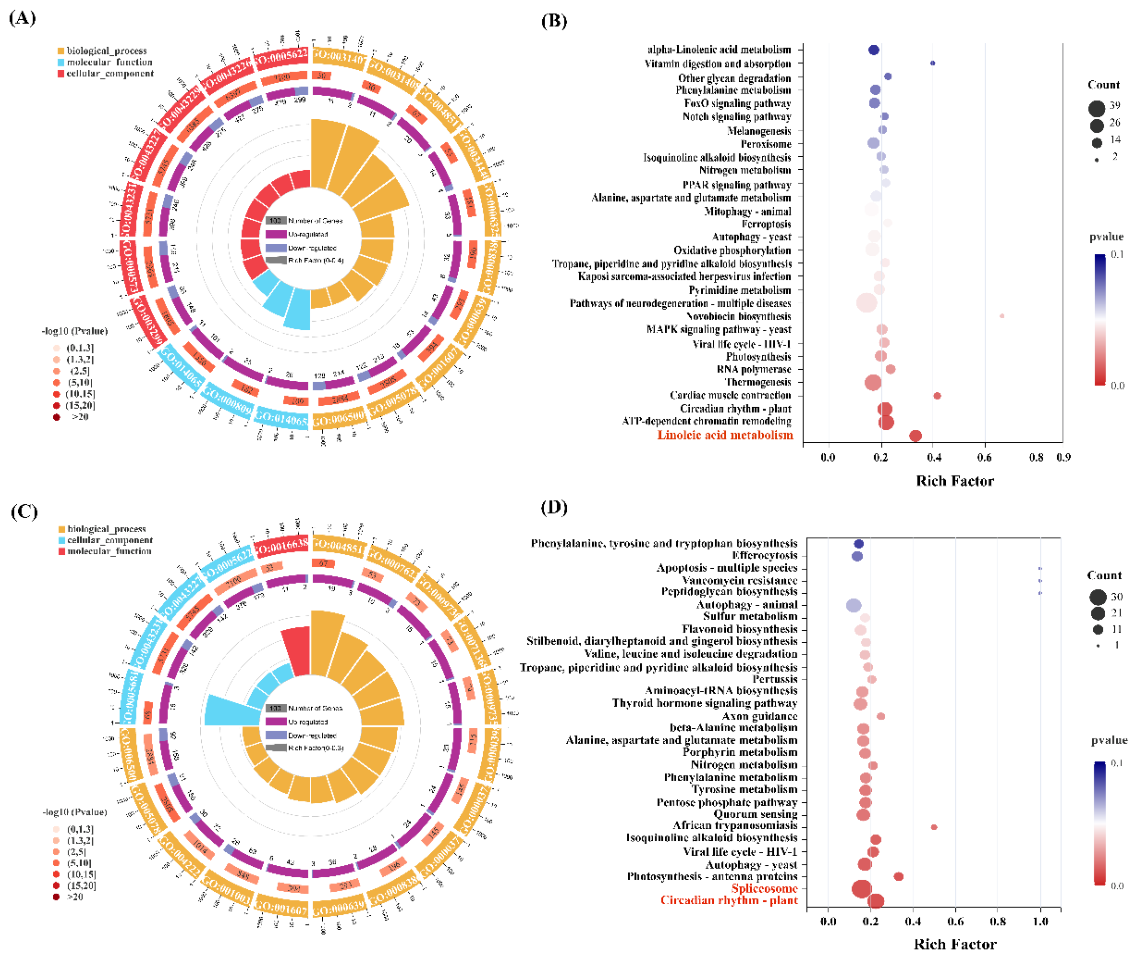
GO enrichment and KEGG pathway analyses further revealed distinct response patterns between exposures. Specifically, DEGs in the 1 ng L-1 vs. CK group were significantly enriched in GO terms related to cellular signal transduction and gene expression regulation, including lipid oxidation (GO:0034440), oxylipin metabolic process (GO:0031407), oxylipin biosynthetic process (GO:0031408), mRNA processing (GO:0006397), RNA splicing (GO:0008380), chromatin organization (GO:0006325), and ATP-dependent chromatin remodeler activity (GO:0140658) (Figure 6A). In the KEGG pathway analysis, the linoleic acid metabolism pathway (ko00591), a key pathway for the synthesis of the stress hormone jasmonic acid, was significantly enriched (Figure 6B). GO enrichment analysis of the 10 ng L-1 vs. CK group revealed that the basic cellular processes of the plants were significantly disrupted. On the one hand, terms related to growth-promoting hormone signaling, such as the cytokinin-activated signaling pathway (GO:0009736), response to cytokinin (GO:0009735), and cellular response to cytokinin stimulus (GO:0071368), were significantly enriched. On the other hand, terms related to systemic stress were also enriched, including rhythmic process (GO:0048511), circadian rhythm (GO:0007623), response to organic substance (GO:0010033), and response to chemical (GO:0042221); additionally, terms related to significant changes in posttranscriptional regulation, such as spliceosomal complex (GO:0005681), RNA splicing (GO:0008380), mRNA splicing via spliceosome (GO:0000398), and mRNA metabolic process (GO:0016071), were enriched (Figure 6C). In the KEGG pathway analysis, the plant circadian rhythm (ko04712) and spliceosome (ko03040) pathways were significantly enriched (Figure 6D). Furthermore, pathways related to the biosynthesis of defense compounds, such as tyrosine metabolism (ko00350), phenylalanine metabolism (ko00360), flavonoid biosynthesis (ko00941), and other alkaloid/stilbene-related pathways, also showed a strong enrichment trend.
3.6. qRT-PCR Validation
To verify the reliability of the transcriptome results, we randomly selected three differentially expressed genes for qRT-PCR validation. The results were consistent with those of transcriptome sequencing, further confirming the reliability of the transcriptome data (Figure S1.).
4. Discussion
This study demonstrated that environmentally relevant BDE-47 concentrations induced distinct phenotypic, anatomical and molecular responses in the mangrove A. marina, revealing a multi-level framework of adaptation and toxicity. At 1 ng L⁻¹, leaf growth parameters (area, width, length, weight) stayed unchanged, indicating maintenance of normal growth. At 10 ng·L⁻¹, every measured growth parameter declined significantly. This growth inhibition probably results from impaired cell division, reduced carbon assimilation, and a reallocation of energy. Comparable BDE-47-induced inhibition has been reported in Lemna minor and maize seedlings [28,33], consistent with oxidative stress and photosynthetic disruption described elsewhere [25,34].
Histological examination of the leaf midrib supported the observed growth impairment. At 1 ng·L⁻¹, vascular bundle sheath morphology, vascular tissue development, and parenchyma cell integrity all resembled those of the control, suggesting sufficient physiological buffering [35]. At 10 ng·L⁻¹, however, marked vascular abnormalities appeared. Xylem vessel number and cross-sectional area decreased substantially, vessels became distorted and occasionally collapsed, and the phloem showed poor cellular continuity. Because xylem hydraulic conductivity scales with the fourth power of vessel radius (Hagen-Poiseuille law), even a modest reduction in diameter can severely cut water supply [36]. In the high-salinity intertidal habitat where A. marina lives, the xylem must sustain considerable negative pressure [37]. BDE-47 likely interferes with lignin and cellulose deposition during secondary wall formation, weakening vessel walls and making them prone to collapse under transpirational tension—thereby worsening water stress [38]. Impaired phloem development would disrupt photosynthate transport to sink tissues, which directly explains the reduced biomass accumulation [39,40].
Other structural changes at 10 ng·L⁻¹ included smaller parenchyma cell diameters and reduced intercellular spaces around the midrib. Well-developed intercellular spaces are needed for efficient CO₂ diffusion from substomatal cavities to chloroplasts [41]; their loss increases internal diffusional resistance and imposes non-stomatal limits on photosynthesis [42]. This cell shrinkage and irregularity likely stem from oxidative stress: ROS accumulation promotes lipid peroxidation, membrane leakage, turgor loss, and aberrant cell wall cross-linking, while also inhibiting expansin-mediated wall loosening [28,43]. The accompanying reduction in vascular bundle sheath area and circumference further suggests a compromised selective barrier, which might facilitate the entry of BDE-47 and its metabolites into mesophyll cells [44].
Transcriptomic profiling gave us some insight into what was happening at the molecular level. At 1 ng·L⁻¹, the differentially expressed genes (DEGs) turned out to cluster around linoleic acid metabolism. This seemed to come from a coordinated up-regulation of several lipoxygenase (LOX) genes—9S- and 13S-lipoxygenase, for instance. It is fairly well established that LOX-derived oxylipins act as key signaling molecules when plants encounter abiotic stress; they help modulate defense transduction, membrane remodeling, and the redox balance [45,46]. Interestingly, no growth alterations were observed at this concentration. That might indicate that A. marina can maintain normal homeostasis through compensatory metabolic adjustments. This kind of response is actually typical for mild stress, where lipid signaling seems to function as a buffer [47]. So the enrichment of the linoleic acid pathway at 1 ng·L⁻¹ likely represents an adaptive, almost pre-emptive defense mechanism.
At 10 ng·L⁻¹, the enrichment shifted markedly toward circadian rhythm and spliceosome pathways. This shift signals an escalation from local metabolic adjustment to systemic regulatory disruption. Looking first at the circadian pathway: pseudo-response regulators, cryptochromes, and LOV-domain proteins were up-regulated, whereas core oscillator components such as phytochrome A and LHY were down-regulated. These non-uniform disturbances tend to disrupt both the phase and amplitude of circadian oscillations, thereby compromising the temporal coordination of photosynthesis, carbon allocation, and hormone signaling [48,49]. Meanwhile, the spliceosome pathway showed bidirectional expression changes. DEAD/DEAH-box helicases, SF3, CDC5-like proteins, and RNA-binding proteins were broadly up-regulated, while certain regulatory components declined. This pattern points more toward impaired spliceosome assembly and functional homeostasis than toward a global increase in splicing activity. Because alternative splicing is integral to stress adaptation and is functionally coupled to the circadian clock—a relationship characterized by splicing-dependent clock gene expression and the circadian oscillation of numerous splicing factors—the co-enrichment of these two pathways at 10 ng·L⁻¹ likely reflects a coordinated disruption of a regulatory network that is critical for maintaining transcriptional and physiological homeostasis [50,51,52,53,54,55].
5. Conclusions
Integrating these morphological and molecular observations, a hierarchical transition emerges in how A. marina responds to BDE-47 across a narrow, environmentally relevant concentration range (1–10 ng L⁻¹). At the lower exposure level, the plants appear to engage in localized metabolic reprogramming centered on LOX-mediated lipid signaling. This enables a degree of compensatory adaptation without compromising growth. At the higher exposure level, that compensatory capacity seems to become overwhelmed. The result is structural damage to vascular tissue, impaired gas exchange (likely driven by parenchyma cell shrinkage), and disruption of the coupled circadian–spliceosome regulatory network at the molecular level. Such a hierarchical response pattern highlights the differential sensitivity of various plant regulatory systems to BDE-47. It also offers a mechanistic framework for understanding how an organic pollutant might shift from eliciting adaptive metabolic adjustments at lower levels to causing systemic regulatory collapse and growth inhibition at higher levels. These findings help address a notable gap in our understanding of the molecular toxicity mechanisms of persistent organic pollutants in mangrove plants. At the same time, they provide a scientific basis for ecological risk assessment and for the conservation of coastal mangrove ecosystems.
Supplementary Materials
The following supporting information can be downloaded at: Table S1 Primer sequences for qRT-PCR; Table S2 Statistical Table of Quality Control Results for A. marina Leaves; Table S3 Statistics of Mapping Results Between A. marina Leaf Samples and Reference Genome; Figure S1. RT-PCR validations of DEGs. (A) KAI3448374.1 (B) KAI3468315.1 (C) XP_011094969.1
Author Contributions
Conceptualization, Ji-liang Zhang; methodology, Xu-ming Qi and Ji-liang Zhang; formal analysis, Chunlai Yu and Yuxing Ma; investigation, Chunlai Yu and Xiangyu Ou; data curation, Chunlai Yu and Xiangyu Ou; writing—original draft preparation, Chunlai; writing—review and editing, Haihua Wang, YuYuxing Ma, Xu-ming Qi and Ji-liang Zhang; supervision, Ji-liang Zhang and Yuxing Ma; project administration, Ji-liang Zhang; funding acquisition, Ji-liang Zhang. All authors have read and agreed to the published version of the manuscript.
Funding
This study was supported by the Key Research and Development Project of Hainan Province, China (ZDYF2024SHFZ075).
Institutional Review Board Statement
Not applicable.
Informed Consent Statement
Not applicable.
Data Availability Statement
Data will be made available upon request. Should you require the data, please contact the corresponding author.
Acknowledgments
Thanks are extended to College of Life Sciences, Hainan Normal University; Key Laboratory of Tropical Island Ecology, Ministry of Education; and Hainan Provincial Key Laboratory of Tropical Animal and Plant Ecology. We sincerely thank the anonymous reviewers for their helpful suggestions and comments.
Conflicts of Interest
The authors declare no conflicts of interest.
References
- Kathiresan, K.; Bingham, B. L. Biology of mangroves and mangrove Ecosystems [M]; 2001; pp. 81–251. [Google Scholar]
- Jia, M.; Wang, Z.; Mao, D.; et al. Mapping global distribution of mangrove forests at 10-m resolution [J]. Sci. Bull. 2023, 2 68(12), 1306–1316. [Google Scholar] [CrossRef] [PubMed]
- Meng, Y.; Gou, R.; Bai, J.; et al. Spatial patterns and driving factors of carbon stocks in mangrove forests on Hainan Island, China [J]. Glob. Ecol. Biogeogr. 2022, 3 31(9), 1692–1706. [Google Scholar] [CrossRef]
- Alongi, D. M. Global Significance of Mangrove Blue Carbon in Climate Change Mitigation (Version 1) [J]. Sci 2020, 4 2(3). [Google Scholar] [CrossRef]
- Lee, S. Y.; Primavera, J. H.; Dahdouh-Guebas, F.; et al. Ecological role and services of tropical mangrove ecosystems: a reassessment [J]. Glob. Ecol. Biogeogr. 2014, 5 23(7), 726–743. [Google Scholar] [CrossRef]
- Arceo-Carranza, D.; Chiappa-Carrara, X.; Chávez López, R.; et al. Mangroves as feeding and breeding grounds [M]. In Mangroves: Ecology, biodiversity and management; Springer, 2021; Volume 6, pp. 63–95. [Google Scholar]
- Haseeba, K. P.; Aboobacker, V. M.; Vethamony, P.; et al. Significance of Avicennia Marina in the Arabian Gulf Environment: A Review [J]. Wetlands 2025, 7 45(1). [Google Scholar] [CrossRef]
- Osborne, D. J.; Berjak, P. The making of mangroves: the remarkable pioneering role played by seeds of Avicennia marina [J]. Endeavour 1997, 8 21(4), 143–147. [Google Scholar] [CrossRef]
- Temmerman, S.; Horstman, E. M.; Krauss, K. W.; et al. Marshes and mangroves as nature-based coastal storm buffers [J]. Annu. Rev. Mar. Sci. 2023, 15(1), 95–118. [Google Scholar] [CrossRef]
- Triest, L.; Del Socorro, A.; Gado, V. J.; et al. Avicennia Genetic Diversity and Fine-Scaled Structure Influenced by Coastal Proximity of Mangrove Fragments [J]. Front. Mar. Sci. 2021, 10 8. [Google Scholar] [CrossRef]
- Valiela, I.; Bowen, J. L.; York, J. K. Mangrove Forests: One of the World’s Threatened Major Tropical Environments [J]. BioScience 2001, 11 51(10). [Google Scholar] [CrossRef]
- Fu, X.-M.; Tang, H.-Y.; Liu, Y.; et al. Resource status and protection strategies of mangroves in China [J]. J. Coast. Conserv. 2021, 12 25(4). [Google Scholar] [CrossRef]
- Goldberg, L.; Lagomasino, D.; Thomas, N.; et al. Global declines in human-driven mangrove loss [J]. Glob. Chang Biol. 2020, 13 26(10), 5844–5855. [Google Scholar] [CrossRef]
- Sundaramanickam, A.; Nithin, A.; Balasubramanian, T. Role of mangroves in pollution abatement [M]. In Mangroves: Ecology, Biodiversity and Management; Springer, 2021; Volume 14, pp. 257–278. [Google Scholar]
- Miglioranza, K. S.; Ondarza, P. M.; Grondona, S. I.; et al. Persistent organic contaminants [M]. In Marine Analytical Chemistry; Springer, 2022; pp. 275–306. [Google Scholar]
- Feng, H.; Cheng, Y.; Ruan, Y.; et al. Occurrence and spatial distribution of legacy and novel brominated flame retardants in seawater and sediment of the South China sea [J]. Environ. Pollut. 2021, 16 271, 116324. [Google Scholar] [CrossRef]
- Zhen, X.; Li, Y.; Tang, J.; et al. Decabromodiphenyl ether versus decabromodiphenyl ethane: source, fate, and influencing factors in a coastal sea nearing source region [J]. Environ. Sci. Technol. 2021, 17 55(11), 7376–7385. [Google Scholar] [CrossRef]
- Li, Q.; Yan, C.; Luo, Z.; et al. Occurrence and levels of polybrominated diphenyl ethers (PBDEs) in recent sediments and marine organisms from Xiamen offshore areas, China [J]. Mar. Pollut. Bull. 2010, 18 60(3), 464–469. [Google Scholar] [CrossRef]
- Napierska, D.; Sanseverino, I.; Loos, R.; et al. Modes of action of the current Priority Substances list under the Water Framework Directive and other substances of interest [J]. Publ. Off. Eur. Union Doi 2018, 19 10, 226911. [Google Scholar]
- Espinosa-Reyes, G.; González-Mille, D.; Ilizaliturri-Hernández, C.; et al. Exposure assessment to persistent organic pollutants in wildlife: the case study of coatzacoalcos, Veracruz, Mexico[C]. Organic pollutants ten years after the Stockholm Convention-Environmental and analytical update 2012, 20, 113–134. [Google Scholar]
- Wang, Y.; Du, Y.-T.; Tam, N. F.-Y. Effects of decabromodiphenyl ether (BDE-209) on a mangrove plant, Kandelia obovata and the uptake, translocation and accumulation of BDE-209 [J]. Front. Mar. Sci. 2022, 9, 955770. [Google Scholar] [CrossRef]
- Qiu, Y.-W.; Qiu, H.-L.; Zhang, G.; et al. Bioaccumulation and cycling of polybrominated diphenyl ethers (PBDEs) and dechlorane plus (DP) in three natural mangrove ecosystems of South China [J]. Sci. Total Environ. 2019, 22 651, 1788–1795. [Google Scholar] [CrossRef]
- Sun, Y.-X.; Zhang, Z.-W.; Xu, X.-R.; et al. Bioaccumulation and biomagnification of halogenated organic pollutants in mangrove biota from the Pearl River Estuary, South China [J]. Mar. Pollut. Bull. 2015, 23 99(1-2), 150–156. [Google Scholar] [CrossRef] [PubMed]
- Chen, X.; Huang, C.; Wang, X.; et al. BDE-47 disrupts axonal growth and motor behavior in developing zebrafish [J]. Aquat. Toxicol. 2012, 24 120-121, 35–44. [Google Scholar] [CrossRef]
- Liu, Q.; Tang, X.; Zhang, X.; et al. Evaluation of the toxic response induced by BDE-47 in a marine alga, Phaeodactylum tricornutum, based on photosynthesis-related parameters [J]. Aquat. Toxicol. 2020, 25 227, 105588. [Google Scholar] [CrossRef]
- Xue, J.; Xiao, Q.; Zhang, M.; et al. Toxic Effects and Mechanisms of Polybrominated Diphenyl Ethers [J]. Int. J. Mol. Sci. 2023, 26 24(17). [Google Scholar] [CrossRef] [PubMed]
- Xue, M.; Shi, Y.; Xiang, J.; et al. 2,2’,4,4’-Tetrabromodiphenyl Ether (BDE-47) at Environmental Levels Influenced Photosynthesis in the Mangrove Species Kandelia obovata [J]. Toxics 2024, 27 12(7). [Google Scholar] [CrossRef]
- Xu, X.; Huang, H.; Wen, B.; et al. Phytotoxicity of brominated diphenyl ether-47 (BDE-47) and its hydroxylated and methoxylated analogues (6-OH-BDE-47 and 6-MeO-BDE-47) to maize (Zea mays L.) [J]. Chem. Res. Toxicol. 2015, 28 28(3), 510–517. [Google Scholar] [CrossRef]
- Wang, Y.; Zhu, H.; Tam, N. F. Effect of a polybrominated diphenyl ether congener (BDE-47) on growth and antioxidative enzymes of two mangrove plant species, Kandelia obovata and Avicennia marina, in South China [J]. Mar. Pollut. Bull. 2014, 85(2), 376–384. [Google Scholar] [CrossRef] [PubMed]
- Wang, Y.; Tam, N. F. Y. Glutathione-Ascorbate Cycle Is an Early Warning Indicator of Toxicity of BDE-47 in Mangroves [J]. J. Env. Qual. 2018, 47(2), 212–220. [Google Scholar] [CrossRef]
- Janz, D.; Behnke, K.; Schnitzler, J. P.; et al. Pathway analysis of the transcriptome and metabolome of salt sensitive and tolerant poplar species reveals evolutionary adaption of stress tolerance mechanisms [J]. BMC Plant Biol. 2010, 31 10, 150. [Google Scholar] [CrossRef]
- Wu, X.; Chen, L.; Lin, X.; et al. Integrating physiological and transcriptome analyses clarified the molecular regulation mechanism of PyWRKY48 in poplar under cadmium stress [J]. Int. J. Biol. Macromol. 2023, 32 238, 124072. [Google Scholar] [CrossRef] [PubMed]
- Qiu, N.; Wang, R.; Sun, Y.; et al. Toxic effects and mechanism of 2, 2′, 4, 4′-tetrabromodiphenyl ether (BDE-47) on Lemna minor [J]. Chemosphere 2018, 33 193, 711–719. [Google Scholar] [CrossRef]
- Deng, D.; Chen, H. X.; Wong, Y. S.; et al. Physiological response and oxidative transformation of 2, 2′, 4, 4′-tetrabromodiphenyl ether (BDE-47) by a Chlorella isolate [J]. Sci. Total Environ. 2020, 34 744, 140869. [Google Scholar] [CrossRef]
- Sun, Y.; Wang, C.; Xu, X.; et al. Responses of plants to polybrominated diphenyl ethers (PBDEs) induced phytotoxicity: a hierarchical meta-analysis [J]. Chemosphere 2020, 240, 124865. [Google Scholar] [CrossRef]
- Bettiati, D.; Petit, G.; Anfodillo, T. Testing the equi-resistance principle of the xylem transport system in a small ash tree: empirical support from anatomical analyses [J]. Tree Physiol. 2012, 32(2), 171–177. [Google Scholar] [CrossRef] [PubMed]
- Nguyen, H. T.; Stanton, D. E.; Schmitz, N.; et al. Growth responses of the mangrove Avicennia marina to salinity: development and function of shoot hydraulic systems require saline conditions [J]. Ann. Bot. 2015, 115(3), 397–407. [Google Scholar] [CrossRef] [PubMed]
- Cochard, H.; Froux, F.; Mayr, S.; et al. Xylem wall collapse in water-stressed pine needles [J]. Plant Physiol. 2004, 134(1), 401–408. [Google Scholar] [CrossRef]
- Savage, J. A.; Clearwater, M. J.; Haines, D. F.; et al.; 39 Allocation, stress tolerance and carbon transport in plants: how does phloem physiology affect plant ecology? [J]. Plant Cell Environ. 2016, 39(4), 709–725. [Google Scholar] [CrossRef]
- Sharma, A.; Thakur, S.; Sharma, S. Phloem Transport: Source and Sink [M]. Advances in Growth Regulation of Fruit Crops; CRC Press, 2025; pp. 21–31. [Google Scholar]
- Jahan, E.; Sharwood, R. E.; Tissue, D. T. Effects of leaf age during drought and recovery on photosynthesis, mesophyll conductance and leaf anatomy in wheat leaves [J]. Front. Plant Sci. 2023, 14, 1091418. [Google Scholar] [CrossRef]
- Yavas, I.; Jamal, M. A.; Din, K. U.; et al. Drought-induced changes in leaf morphology and anatomy: overview, implications and perspectives [J]. Pol. J. Environ. Stud. 2024, 33(2), 1517–1530. [Google Scholar] [CrossRef]
- Gapper, C.; Dolan, L. Control of plant development by reactive oxygen species [J]. Plant Physiol. 2006, 43 141(2), 341–345. [Google Scholar] [CrossRef] [PubMed]
- Li, B.; Shao, Y.; Liu, C.; et al. Toxicological Effects and Mechanisms of 2,2’,4,4’-Tetrabromodiphenyl Ether (BDE-47) on Marine Organisms [J]. Toxics 2024, 44 12(10). [Google Scholar] [CrossRef]
- Howe, G. A.; Schilmiller, A. L. Oxylipin metabolism in response to stress [J]. Curr. Opin. Plant Biol. 2002, 5(3), 230–236. [Google Scholar] [CrossRef]
- Wasternack, C.; Feussner, I. The oxylipin pathways: biochemistry and function [J]. Annu. Rev. Plant Biol. 2018, 46 69, 363–386. [Google Scholar] [CrossRef]
- Okazaki, Y.; Saito, K. Roles of lipids as signaling molecules and mitigators during stress response in plants [J]. Plant J. 2014, 79(4), 584–596. [Google Scholar] [CrossRef]
- Greenham, K.; McClung, C. R. Integrating circadian dynamics with physiological processes in plants [J]. Nat. Rev. Genet. 2015, 48 16(10), 598–610. [Google Scholar] [CrossRef] [PubMed]
- Dodd, A. N.; Salathia, N.; Hall, A.; et al. Plant circadian clocks increase photosynthesis, growth, survival, and competitive advantage [J]. Science 2005, 309(5734), 630–633. [Google Scholar] [CrossRef] [PubMed]
- Reddy, A. S.; Marquez, Y.; Kalyna, M.; et al.; 50 Complexity of the alternative splicing landscape in plants [J]. Plant Cell 2013, 25(10), 3657–3683. [Google Scholar] [CrossRef]
- Staiger, D.; Brown, J. W. Alternative splicing at the intersection of biological timing, development, and stress responses [J]. Plant Cell 2013, 25(10), 3640–3656. [Google Scholar] [CrossRef]
- James, A. B.; Syed, N. H.; Bordage, S.; et al. Alternative splicing mediates responses of the Arabidopsis circadian clock to temperature changes [J]. Plant Cell 2012, 52 24(3), 961–981. [Google Scholar] [CrossRef] [PubMed]
- Mateos, J. L.; De Leone, M. J.; Torchio, J.; et al. Beyond transcription: fine-tuning of circadian timekeeping by post-transcriptional regulation [J]. Genes 2018, 9(12), 616. [Google Scholar] [CrossRef]
- Romanowski, A.; Yanovsky, M. J. Circadian rhythms and post-transcriptional regulation in higher plants [J]. Front. Plant Sci. 2015, 6, 437. [Google Scholar] [CrossRef]
- Fan, T.; Aslam, M. M.; Zhou, J.-L.; et al.; 55 A crosstalk of circadian clock and alternative splicing under abiotic stresses in the plants [J]. Front. Plant Sci. 2022, 13, 976807. [Google Scholar] [CrossRef]
Figure 1.
Effects of different BDE-47 concentrations on the growth parameters of A. marina leaves. (A) Leaf surface area (cm²). (B) Leaf width (cm). (C) Leaf length (cm). (D) Leaf weight (g). Data are presented as mean ± S.E. (n = 20 biologically independent samples). Different letters indicate significant statistical differences (p < 0.05) as determined by ANOVA followed by Duncan’s multiple range test.
Figure 1.
Effects of different BDE-47 concentrations on the growth parameters of A. marina leaves. (A) Leaf surface area (cm²). (B) Leaf width (cm). (C) Leaf length (cm). (D) Leaf weight (g). Data are presented as mean ± S.E. (n = 20 biologically independent samples). Different letters indicate significant statistical differences (p < 0.05) as determined by ANOVA followed by Duncan’s multiple range test.
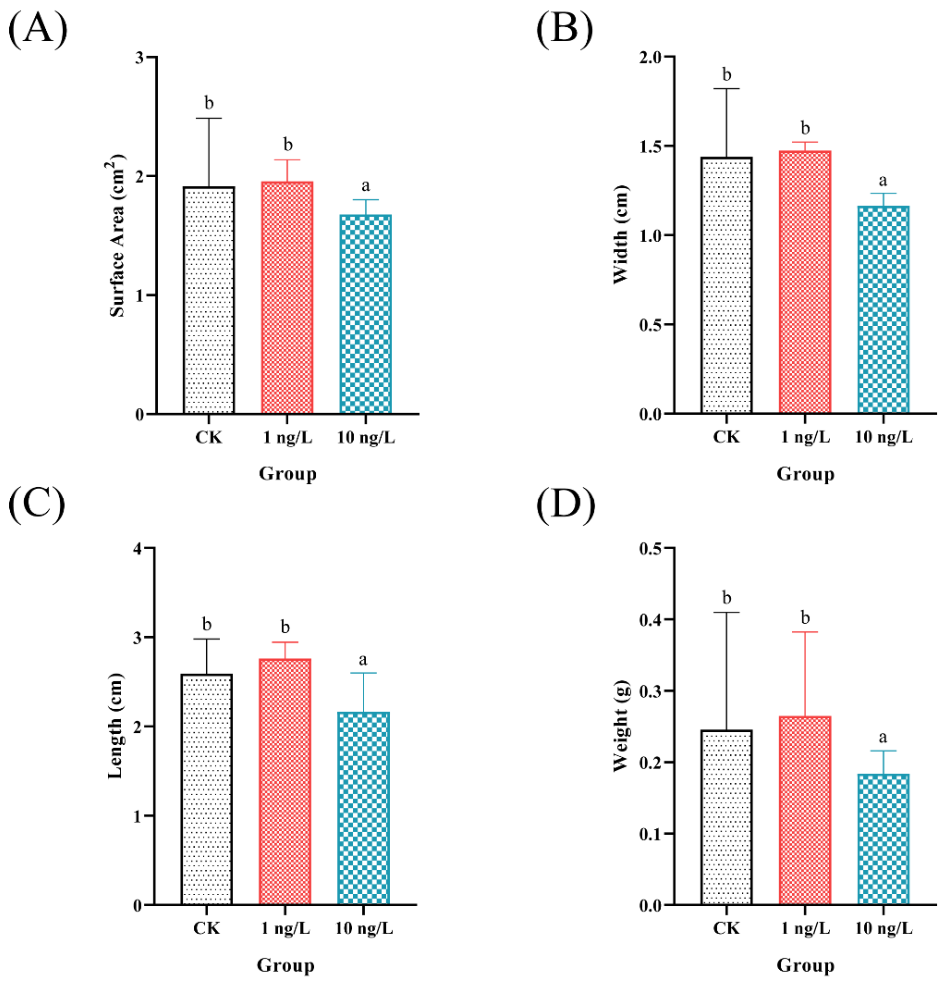
Figure 2.
Effects of different concentrations of BDE-47 stress on leaf tissues of A. marina. (A) CK, 50× magnification (B) 1 ng L-1, 50× magnification (C) 10 ng L-1, 50× magnification (D) CK, 100× magnification (E) 1 ng L-1, 100× magnification (F) 10 ng L-1, 100× magnification (G) CK, 119× magnification (H) 1 ng L-1, 176× magnification (I) 10 ng L-1, 146× magnification
Figure 2.
Effects of different concentrations of BDE-47 stress on leaf tissues of A. marina. (A) CK, 50× magnification (B) 1 ng L-1, 50× magnification (C) 10 ng L-1, 50× magnification (D) CK, 100× magnification (E) 1 ng L-1, 100× magnification (F) 10 ng L-1, 100× magnification (G) CK, 119× magnification (H) 1 ng L-1, 176× magnification (I) 10 ng L-1, 146× magnification
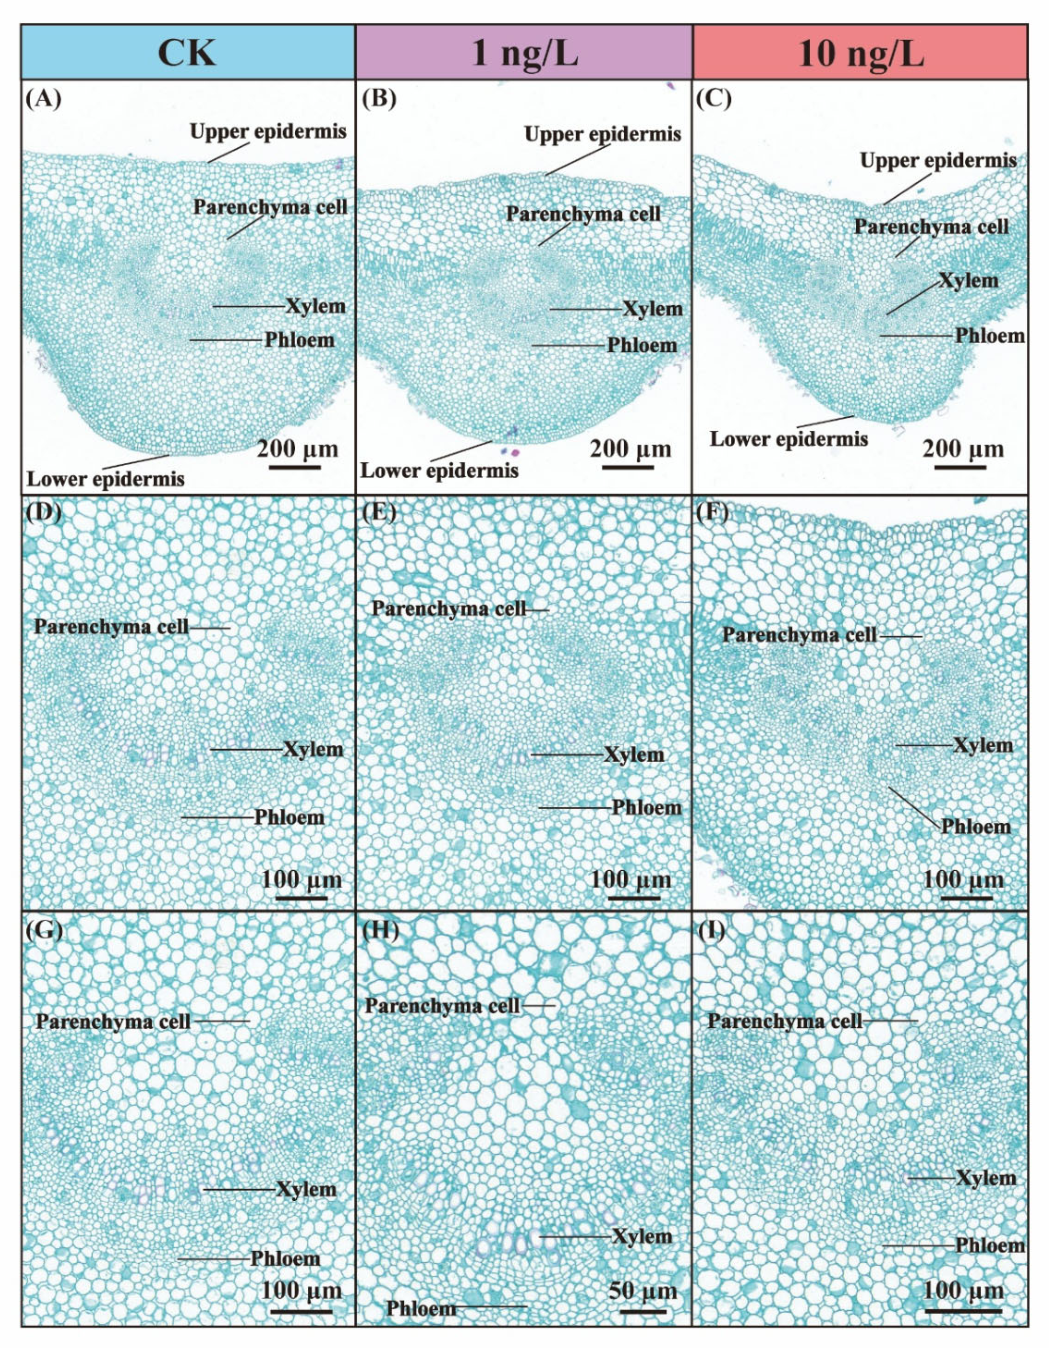
Figure 3.
Quantitative analysis of leaf anatomical parameters of A. marina under different concentrations of BDE-47 exposure. (A) Area of vascular bundle (B) Perimeter of vascular bundle (C) Cell area of xylem (D) Number of xylem cell (E) Diameter of parenchyma cell (F) Proportion of intercellular space.
Figure 3.
Quantitative analysis of leaf anatomical parameters of A. marina under different concentrations of BDE-47 exposure. (A) Area of vascular bundle (B) Perimeter of vascular bundle (C) Cell area of xylem (D) Number of xylem cell (E) Diameter of parenchyma cell (F) Proportion of intercellular space.
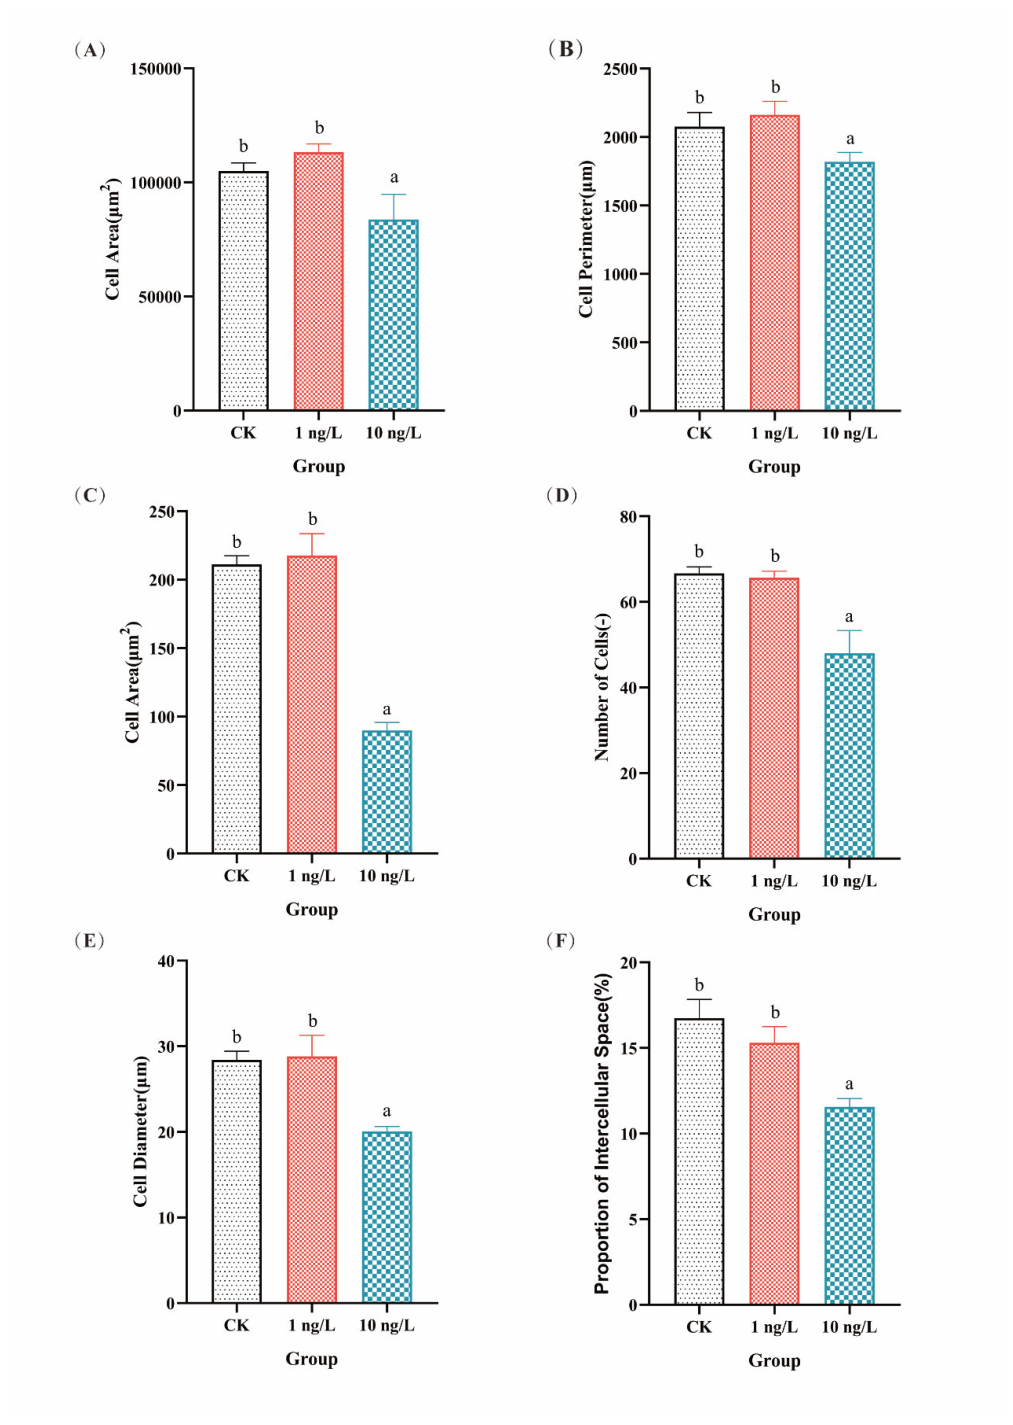
Figure 4.
Differences in DEGs in A. marina leaf tissues under different BDE-47 concentrations. (A) Statistics of upregulated and downregulated DEGs under different treatments. (B) Venn diagram of DEGs among different treatment groups.
Figure 4.
Differences in DEGs in A. marina leaf tissues under different BDE-47 concentrations. (A) Statistics of upregulated and downregulated DEGs under different treatments. (B) Venn diagram of DEGs among different treatment groups.
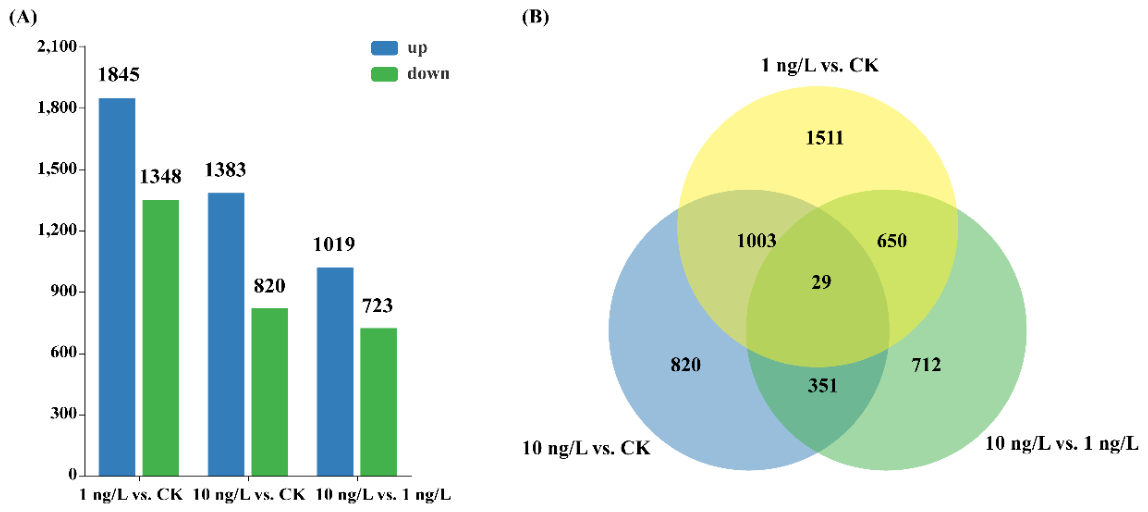
Figure 5.
GO enrichment classification of DEGs in A. marina leaf tissues from the (A) 1 ng L-1 vs. CK and (B) 10 ng L-1 vs. CK comparisons.
Figure 5.
GO enrichment classification of DEGs in A. marina leaf tissues from the (A) 1 ng L-1 vs. CK and (B) 10 ng L-1 vs. CK comparisons.
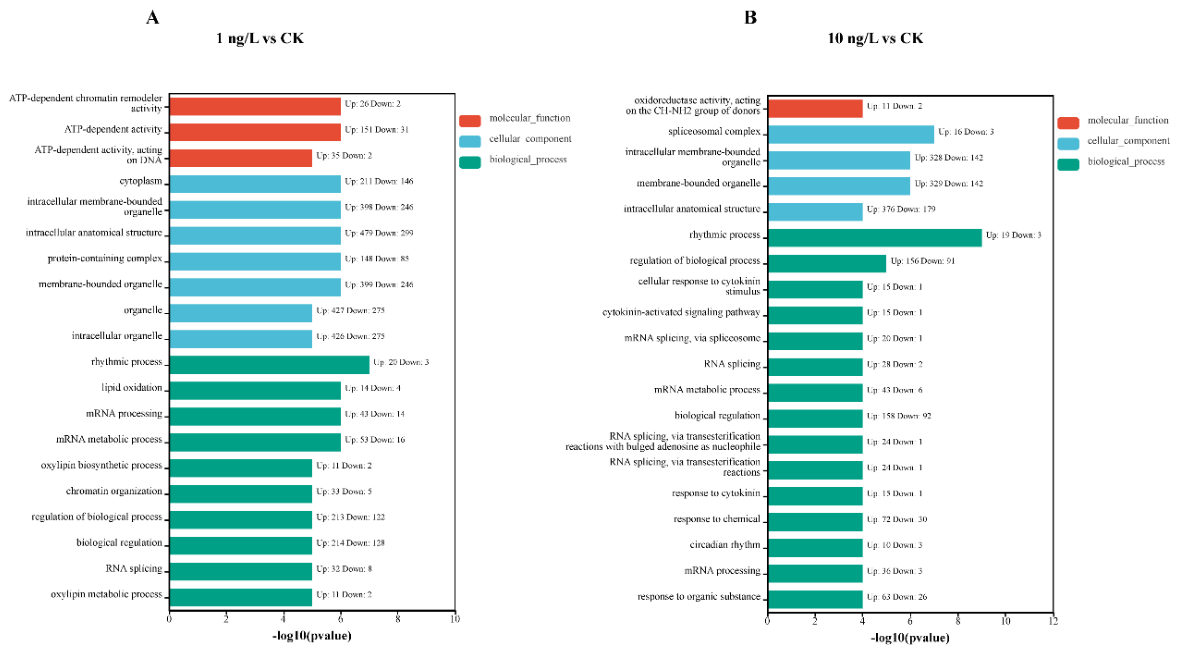
Figure 6.
Enrichment analysis of the top 20 GO terms and 30 KEGG pathways for DEGs in A. marina leaf tissues. (A-B) 1 ng L-1 vs. CK; (C-D) 10 ng L-1 vs. CK.
Figure 6.
Enrichment analysis of the top 20 GO terms and 30 KEGG pathways for DEGs in A. marina leaf tissues. (A-B) 1 ng L-1 vs. CK; (C-D) 10 ng L-1 vs. CK.
Disclaimer/Publisher’s Note: The statements, opinions and data contained in all publications are solely those of the individual author(s) and contributor(s) and not of MDPI and/or the editor(s). MDPI and/or the editor(s) disclaim responsibility for any injury to people or property resulting from any ideas, methods, instructions or products referred to in the content. |
© 2026 by the authors. Licensee MDPI, Basel, Switzerland. This article is an open access article distributed under the terms and conditions of the Creative Commons Attribution (CC BY) license (http://creativecommons.org/licenses/by/4.0/).
Copyright: This open access article is published under a Creative Commons CC BY 4.0 license, which permit the free download, distribution, and reuse, provided that the author and preprint are cited in any reuse.