

Submitted:
15 May 2026
Posted:
18 May 2026
You are already at the latest version
Abstract
The dynamics of organic matter, nitrogen status, and biological activity in soils in southern Kazakhstan under various land-use systems were studied. A key feature of the research is the comprehensive comparison of humus status, nitrogen state, and biological activity of virgin and arable dark Kastanozem, Gleyic Calcisol, and Haplic Calcisol, as well as identification of their correlation with signs of functional depletion of organic component. The assessment was conducted using set of agrochemical and biological methods, including determination of humus content, available nitrogen forms, C/N ratio, microbial population, and enzymatic activity.
It has been determined that the highest humus content is typical for dark chestnut soils under natural vegetation, while plowing of them is accompanied by decrease in humus content due to increased mineralization processes. Gleyic Calcisol - are characterized by more stable humus state, in some cases with increased organic matter content under arable conditions. Minimum humus values were found in Haplic Calcisol, due to arid conditions and limited supply of organic residues.
It is shown that arable soils are characterized by a decreased C/N ratio and increased rates of organic matter transformation. Soil biological activity is linked to mineralization processes, as confirmed by microbial population dynamics and enzymatic activity. Additional assessment using digital tools reveals signs of functional depletion of organic component in agrocenoses.
The obtained results indicate the need to consider biological indicators when assessing soil conditions and developing sustainable land management systems in arid climates.
Keywords:
Haplic Calcisols
; Gleyic Calcisol
; Haplic Kastanozem
; humus
; nitrogen
; C/N ratio
; soil biological activity
1. Introduction
Degradation of arable soils in many regions of the world has reached the level that reduces productivity of agroecosystems, sustainability of agriculture, and the ability of soils to perform key ecological functions [1,2,3,4]. The most common manifestations of agrogenic degradation include decrease in organic matter content, deterioration of aggregate state, disruption of nitrogen regime, and weakening of soil biological activity [5,6,7,8].
These processes are particularly pronounced in arid and semi-arid regions, where high anthropogenic loads are combined with natural limitations in moisture availability [9].
Intensive agricultural land use under irrigated farming conditions and high climatic contrasts contributes to accelerated transformation of soil organic matter, decreased humus content, deterioration of structure, development of secondary salinization, deflation, and water erosion [14]. As a result, agrochemical status of soils and their ability to support sustainable functioning of agroecosystems deteriorates.
In this regard, assessing changes in soil organic matter and nitrogen status during transition from natural (virgin) soil to arable use is particularly important. These indicators reflect the direction of agrogenic soil transformation and degree of fertility impairment. However, for the southern regions of Kazakhstan, data on interrelated dynamics of humus, nitrogen status, and soil biological activity depending on nature of agricultural use remain limited.
The Zhambyl region is a model example for studying these processes. Its boundaries combine flat, arid territories with mountainous regions with pronounced vertical zonation, resulting in diversity of natural conditions and soil surface [15]. In the region Haplic Calcisol, Gleyic Calcisol, and Haplic Kastanozem are spread, which are formed under conditions of sharply continental climate and insufficient moisture. These soils are characterized by relatively low humus content, limited availability of mineral nutrients, and high sensitivity to anthropogenic impacts.
Comprehensive assessment of the current state of soil fertility should be based on analysis of organic matter, nitrogen content, and biological activity as interrelated components of soil health. This approach allows to identify the consequences of agrogenic soil transformation and determine the most informative indicators of their change.
The aim of this study is to assess changes in organic matter, nitrogen content, and biological activity of the main soil types in the Zhambyl region during transition from virgin soil to agricultural use.
2. Materials and Methods
The objects of the study were Haplic Calcisol, Gleyic Calcisol, and Haplic Kastanozem.
Haplic Calcisol are widespread in the region, occupying a significant portion of the foothill plains and forming under ephemeral wormwood vegetation. Agriculturally, they are primarily used under irrigated conditions. In dryland farming, crop productivity is significantly dependent on moisture availability: in years with sufficient moisture, these soils produce satisfactory and high yields of dryland grain crops.
Gleyic Calcisol are common on foothill plains and on river terraces above floodplains. These soils are typically saline with easily soluble salts. A sharp decline in humus content is observed along the soil profile. Gleyic Calcisol are good arable lands and are used for grain crops and sugar beets.
Haplic Kastanozem within the Zhambyl region are confined to the northern dry steppe zone and form on flat watershed surfaces under conditions of insufficient moisture, under feather grass and fescue vegetation. These soils have a well-developed profile, clearly differentiated into genetic horizons. These soils are widely used in rainfed and irrigated agriculture.
Field soil studies were conducted using the route/transect method [16] to clarify the characteristics of the identified contours and boundaries of soil zones. The methodology was based on visual analysis of deciphering materials and the use of traditional soil mapping techniques [17] (Figure 1).
Soil samples were collected on virgin and arable lands to the depth of the arable horizon. Representative observation points were identified for each soil type; their coordinates are provided in Table 1.
The methods used to analyze soil material composition are described in detail in the manual on general soil analysis. Humus was determined according to the method of Tyurin I.V. [18], water-soluble humus from water extracts using the Kubel–Timan method, and easily hydrolyzed nitrogen according to the Tyurin–Kononova method [19].
Statistical processing of the obtained data was carried out using generally accepted methods of mathematical statistics using Microsoft Excel and AtteStat software packages [20]. For each indicator, the arithmetic mean (M), standard error of the mean (m), standard deviation (SD), minimum and maximum values were determined.
To assess the degree of variability of parameters, the coefficient of variation (V, %) was calculated using the formula: V = SD/M × 100, where SD is the standard deviation and M is the mean value of the parameter.
The degree of variability was assessed using the following scale: up to 10%–low variability, 10–20%–moderate variability, 20–33%–increased variability, and more than 33%–high variability.
The significance of differences between mean values was assessed using Student's t-test at a significance level of p ≤ 0.05. The accuracy of determining mean values was characterized by the 95% confidence interval.
Soil biological activity (SBA) was studied using methods accepted in soil microbiology [21].
Total number of microorganisms was determined by the method of limiting dilutions of soil suspension on Petri dishes with nutrient agar produced by HiMedia Laboratories Pvt. Limited (India). Sowing according to the experimental variants was carried out on an EasySpiral Pro® automatic plater from Interscience Int.(France). After sowing, the dishes were kept in a thermostat at 27 °C for two days, after which the grown colonies were counted on an automatic colony counter Scan 500 from Interscience Int. (France).
The number of micromycetes was counted on Sabouraud medium; actinomycetes were counted on CAA, nitrogen-fixing microorganisms on Ashby medium, cellulolytic microorganisms on a medium with CMC, and microorganisms growing on mineral nitrogen on starch-ammonia agar (CAA).
Assessment of general biological activity of soils (FDA test) and the Pfeiffer test were also carried out [22]. Soil respiration (CO₂ emission) was recorded in the morning from 9 to 11 a.m. on a Biobase SRM-3051T respirometer for 30 minutes on an area of 10 cm² [23].
The virgin plots were represented by wormwood-grass plant communities typical of southern Kazakhstan. The arable lands included cereal crops (wheat and barley) grown on dry land (Haplic Kastanozem and Haplic Calcisol), and onions grown on Gleyic Calcisol with drip irrigation.
3. Results
Organic matter content and stocks are among the main criteria used to assess soil fertility; in recent years, these indicators have increasingly been considered in terms of the ecological sustainability of soils as a component of the biosphere [24].
The root residues of cultivated cereal crops are generally smaller in mass than root biomass of natural cereal vegetation; in the 0-20 cm layer, the mass of root residues of many agricultural crops is significantly lower than that of wild species. This reduces the supply of organic matter to the soil and, in terms of other equal conditions, leads to more pronounced reduction in humus reserves in arable land compared to virgin soil. Consequently, maintaining the original (virgin) humus level during long-term agricultural use without compensating organic matter inputs (including organic fertilizers and/or the return of plant residues) is difficult.
The obtained data for Haplic Kastanozem soils confirm this pattern: humus content in virgin soil is higher than in arable land, amounting to 1.9% and 1.48%, respectively (Figure 2). This indicates mineralization of organic matter during agricultural use. A similar trend persisted during the summer observation period as well.
The opposite picture is observed for other variants: in soils of virgin soil variants of irrigated Gleyic Calcisol (1.51%) and Haplic Calcisol (1.23%), humus content was lower than in the arable land, where 1.66% and 1.31% humus were found, respectively (Figure 1). This is explained by the fact that on virgin soils, natural vegetation cover forms organic matter with a more complex structure and a slower entry into the soil due to root residues, sod, and sparse herbaceous vegetation. In arable soils, on the contrary, after harvesting, plant residues of crops are often ploughed into the soil, which increases the entry of organic material into the arable layer and can cause a higher measured humus content compared to the surface horizon of virgin land, which is poorly supplied with organic matter [25].
In summer, the total humus content of Haplic Kastanozem and Gleyic Calcisol virgin soils was higher than in spring. This is explained by the fact that soil temperature and moisture during this period create favorable conditions for accumulation of organic compounds, especially in the upper layer (0–10 cm). These conditions simultaneously accelerate the processing of organic matter, but with sufficient supply, new organic matter can accumulate faster than it de-composes [26].
Research also shows that proportion of soluble organic carbon (DOC) and other soluble humus components varies seasonally, often reaching a maximum in summer due to high bio-logical activity and migration of organic compounds within soil profile [27].
In Haplic Calcisols soils, both on virgin and arable land, the content of this form of humus in soil was slightly lower in summer, with the difference only 0.2% and 0.1%, respectively.
The reduction in humus content in the arable layer after plowing continues until new quasi-equilibrium state is reached, in which the intensity of humus formation corresponds to the supply of organic residues under the conditions of the adopted agricultural system [28].
The increase in humus under the influence of crop, for example, up to 1.66% in arable irrigated Gleyic Calcisol versus 1.51% in virgin soil variants, 1.31% versus 1.23% in Haplic Calcisol soil, indicates the possibility of managing humus status of these types of soils with the help of agrotechnique [29], where the key factor influencing humus status is plant residues and quality of organic matter.
Also, with introduction of an additional factor–irrigation–into the agricultural system, soil-forming processes change compared to rainfed soils. Firstly, with increased crop productivity under irrigation, the amount of removed organic matter increases, and secondly, the soil water regime changes. Under irrigation, two trends in humus content and reserves are observed compared to rainfed soils: a decrease in the initial period of irrigation followed by stabilization [30,31].
The humus status of irrigated soils depends on agricultural practices and chemical composition of irrigation water. With high-quality irrigation water, the presence of perennial grasses, especially legumes, in crop rotation, and the application of organic fertilizers, organic matter content of irrigated soils does not decrease [32].
Thus, the highest humus content was observed in virgin Haplic Kastanozem, reaching 2.6% in summer, while cultivated soils showed lower values (1.4–1.6%). Seasonal dynamics indicate an increase in humus content in summer, likely due to increased plant biomass production and accumulation of organic residues. In contrast, arable soils show decreased humus levels due to the intensification of mineralization processes caused by agricultural activity.
Organic matter contains the main reserve of nitrogen; therefore, soils with a higher content of organic matter are characterized by higher nitrogen content, as evidenced by data on total nitrogen content of these soils (Figure 3).
During agricultural development of virgin and fallow Haplic Kastanozem soils, humus and nitrogen reserves (main components of fertility) in their upper horizons have significantly decreased. This is due both to disappearance of natural cover of perennial herbaceous vegetation, which annually enriches the soil with organic matter, and to the removal of large quantities of biophilic elements by agricultural crops. The reduction in humus and nitrogen reserves will occur to a certain level, the magnitude of which depends on soil and climatic conditions of the zone and the duration and persistence of anthropogenic impact on the soil, as evidenced by their increase in arable land on Gleyic Calcisol and Gleyic Calcisol during irrigation and fertilization.
As shown by the data in Figure 2, the highest nitrogen content is observed in Haplic Kastanozem virgin soils (0.149–0.196%), while Gleyic Calcisol soils have moderate nitrogen content (0.103–0.154%), and northern Haplic Calcisol soils are characterized by the lowest nitrogen level (0.075–0.098%).
During the summer, nitrogen content increased significantly in virgin dark chestnut soils by 0.047, while it decreased in arable land. In Gleyic Calcisol, this form of nitrogen also increased, although slightly. Total nitrogen content was equal in virgin soils and arable land of northern Haplic Calcisol, while a decrease was observed in arable land.
Thus, soil type determines the baseline nitrogen level, with Haplic Kastanozem providing the highest total nitrogen levels and Haplic Calcisol soils providing the lowest. Arable soils also show decreased nitrogen, confirming soil depletion during cultivation. The exception is Gleyic Calcisol croplands in summer, where soil type and fertilizer use were positive factors. Seasonal dynamics show that total nitrogen peaks in virgin soils in summer and declines in autumn, which is related to natural biogeochemical processes and plant uptake.
We also determined the content of easily hydrolysable nitrogen, the content of which is the most dynamic indicator and depends on mineralization of organic matter, nitrogen immobilization (temporary binding of nitrogen by microorganisms), nitrification and denitrification (processes of nitrogen conversion in soil), application of fertilizers (organic and mineral fertilizers increase its content), and weather conditions (high temperature and humidity promote mineralization, but too high humidity can lead to denitrification and loss of nitrogen).
As can be seen from Figure 4, according to the classification by content of easily hydrolysable nitrogen in the spring in the upper horizon, dark chestnut and Gleyic Calcisol are characterized by an average degree of provision both on arable land (45.4 mg/kg and 44.6 mg/kg, respectively) and on virgin soil (43.87 mg/kg and 49.47 mg/kg, respectively), while Haplic Calcisol on virgin soil have very low provision (24.27 mg/kg), and on arable land have low provision (37.33 mg/kg of soil).
The increase in easily hydrolyzable nitrogen content in summer in both virgin and arable lands across all soil types is due to active microbiological activity, which converts hard-to-reach nitrogen forms into easily available ones. Virgin soils undergo a natural cycle of organic matter synthesis and decomposition, but the rate of this process is lower in summer than in arable land, where favorable conditions for microorganisms are created. This is clearly visible in the graph: in Gleyic Calcisol and Haplic Calcisol soils, this increase is higher than in virgin soils, due to application of fertilizers and organic matter, and, as mentioned above, to active microbiological processes, which convert hard-to-reach nitrogen forms into easily available ones, while in virgin soils this process occurs more slowly due to the lack of anthropogenic influence. The latter includes mechanical tillage and other agricultural practices that accelerate mineralization of organic matter, which leads to the increased content of this form of nitrogen, which cannot be said about dark chestnut soils.
Virgin soils are not intensively cultivated or enriched with fertilizers, which leads to slower mineralization of organic matter and, consequently, lower levels of easily hydrolyzable nitrogen compared to arable land.
In arable soils, microbiological activity is also activated due to the impact of fertilizers and organic matter. During their life processes, microorganisms decompose complex organic compounds (such as proteins) into simpler ones, such as ammonium, which is easily hydrolyzable.
The important indicator of soil fertility is the C/N ratio, which affects the rate of decomposition of labile organic matter. The C/N ratio in soils is an indicator of relative richness of humus in nitrogen. The narrow C/N ratio in Haplic Calcisol is possibly the result of the high microbial population of these soils, which contributes to the enrichment of soil humus with microbial protein.
It is known that the C:N ratio differs depending on humus type; as a rule, it is in the range of 8–30. From the graph (Figure 5) it is evident that the following trend was observed in the carbon to nitrogen ratio in the spring: Haplic Calcisol arable land > Haplic Kastanozem virgin soil > Haplic Calcisol and Gleyic Calcisol virgin soil > Gleyic Calcisol arable land > Haplic Kastanozem arable land.
As shown by the obtained data, the highest C:N ratio in virgin Gleyic Calcisols is in summer (9.6), which is an indicator of the high-quality humification process in this period of the year and high content of humic acids in humus of virgin Gleyic Calcisol [33]. The C/N = 7.3 ratio in spring indicates a fairly balanced correlation between humus formation and mineralization processes. The lowest C:N ratio is characteristic of arable and virgin northern Haplic Calcisol (6.1). This corresponds to literature data that humus of Haplic Calcisol is richer in nitrogen than in humus [34]. The C/N ratio decreased to 6.4 in arable dark chestnut soils, which also indicates more intensive decomposition of organic matter and acceleration of mineralization processes.
The variability of the presented parameters in Haplic Kastanozem virgin soils was low or medium. The coefficient of variation (V) for most parameters was within 5.4–15.3%, which corresponds to a low to medium degree of variability and indicates a relatively stable state of soil organic matter. The confidence intervals (95%) for the main parameters were: total humus: ±0.72%, total nitrogen: ±0.020%, easily hydrolyzable nitrogen: ±10.62 mg/kg, and C/N: ±1.89. The t-test values (7.0–17.8) significantly exceed critical values, which confirms the reliability of the average parameters at a significance level of 0.05.
On arable Haplic Kastanozem soils, the coefficient of variation for most parameters was low (2.3–6.0%), indicating a relatively uniform state of the arable horizon due to agrotechnical practices. However, highly variable values for easily hydrolyzable nitrogen (V = 35.0%) were observed, reflecting the dynamic nature of this form of nitrogen.
The coefficient of variation for most parameters on Gleyic Calcisol virgin soils was low (6.5–10.8%), while for the C/N ratio and nitrogen content in humus it was minimal (1.6%), indicating high stability of soil humus status in virgin soils.
In Gleyic Calcisol arable soils, the coefficient of variation for most parameters is low (2.0–16.7%), indicating a relatively stable state of arable soils. However, easily hydrolyzable nitrogen is characterized by high variability (V = 40.2%), indicating instability of the mineral nitrogen regime.
In virgin northern Haplic Calcisol, the coefficient of variation for most parameters ranges from 7.4–29%, corresponding to a medium to high degree of variability and indicating heterogeneity of the soil surface. The C/N = 7.3 ratio indicates a balanced organic matter composition.
The coefficient of variation for most parameters of arable northern Haplic Calcisol soils ranges from 4.9% to 12.7%, indicating moderate spatial heterogeneity of the soil surface.
Correlation analysis was conducted to identify correlations between key indicators of soil organic matter and the nitrogen regime.

Table 2.
Correlation between indicators.
| Indicators | r | Strength of connection |
|---|---|---|
| Humus -total nitrogen | 0,92 | very strong positive |
| Humus - carbon | 0,98 | functional dependence |
| Humus - easily hydrolyzable nitrogen | 0,64 | moderate positive |
| Humus solubility- easily hydrolyzable nitrogen | 0,71 | strong positive |
| C/N – nitrogen content in humus | -0,83 | strong negative |
The data obtained show a very close correlation between humus and total nitrogen, due to the organic nature of soil nitrogen. A practically functional correlation is observed between humus and carbon. The positive correlation between humus solubility and easily hydrolyzable nitrogen indicates the impact of humic compound mineralization processes, while the negative correlation between the C/N ratio and nitrogen content in humus reflects the intensity of organic matter decomposition.
Soil biological activity is considered one of the most important characteristics of soil health. To assess it, we conducted a set of soil biological activity (SBA) tests related to the dynamics of organic matter. In the first stage of the study, the content of mobile carbon was determined using the POXC method, which is part of the Cornell University soil health test system [35]. Mobile carbon represents a pool of organic matter available to microbiota and therefore plays an important role in maintaining the intensity of soil biological and biochemical processes and in assessing soil fertility [36]. In the studied soils, the content of mobile carbon (POXC) varied within the range of 0.27–1.20%, which indicates high sensitivity of this indicator to soil type, land use regime, and seasonal conditions (Figure 6).
The maximum value was observed for Gleyic Calcisol on virgin soil in spring (1.20%), and the minimum for Haplic Kastanozem on virgin soil in spring (0.27%). For Haplic Calcisol, the range of values was 0.57–0.76% on virgin soil and 0.53–0.72% on arable land, while for Haplic Kastanozem, the ranges were 0.27–0.93% and 0.47–0.62%, respectively.
Overall, higher POXC values were more frequently recorded in virgin soils, which may be related to more favorable conditions for accumulation and transformation of labile forms of organic matter. However, the magnitude of differences between virgin and arable soils depended on soil genetic characteristics and conditions of their use. Seasonal dynamics of this indicator were not strictly unidirectional: elevated values, depending on soil type, were observed in spring, summer, or fall. This indicates the complex nature of intraseasonal variability in mobile carbon, determined by the total impact of the hydrothermal regime, intensity of microbiological processes, and the input of fresh organic matter.
The obtained results confirm that mobile carbon is an informative indicator of biological activity and can be used to assess soil health in various agroecological conditions and under different land-use regimes.
The biogenicity of the studied soils was assessed using total microbial count (TMC) by inoculating soil suspension on nutrient media. This indicator characterizes the overall level of soil microbiological activity and reflects the current state of soil in terms of its "comfort" for microorganisms.
According to the data presented in Figure 7, microbial counts in the studied soils varied seasonally and depended on both hydrothermal conditions and soil type. Higher total microbial counts were typically observed in spring and fall: for example, in Haplic Calcisol (virgin soil), the count reached 173.67×10⁵ CFU/g in spring, while it decreased to 127.67×10⁵ CFU/g in summer. A similar trend was observed in other soils, likely due to a more favorable moisture and temperature balance.
In summer, microbial counts decreased, which can be explained by drying of the upper soil horizon and rising temperatures.
A comparative analysis revealed that total microbial count was higher in Haplic Calcisol and Gleyic Calcisol soils than in Haplic Kastanozem: in Haplic Kastanozem (arable land), the TMC values were 77.33–136.00×10⁵ CFU/g, which is generally lower than in calcisol. This may indicate more favorable conditions for microflora development, including due to improved moisture availability and more active organic matter transformation.
It should be noted that this test is sensitive to the effects of organic and bacterial fertilizers, and its informative value for soil monitoring in organic farming has been demonstrated in the work [37].
Bacteria measured on starch-ammonia agar (SAA) play a significant role in soil biochemical processes. This indicator reflects the activity of the microbial community involved in the transformation of mineral forms of nitrogen in soil. Figure 8 shows seasonal dynamics of bacterial numbers growing on SAA, depending on soil type and soil management regime. The data obtained generally demonstrate patterns similar to those observed for total microbial counts and micromycetes. In most cases, higher values were observed in spring and autumn, while a decrease was observed in summer. Thus, in Haplic Calcisol (virgin land), the number of bacteria varied from 93.00 to 135.67×10⁵ CFU/g, and in Haplic Calcisol (arable land) from 106.33 to 108.00×10⁵ CFU/g.
In Gleyic Calcisol (virgin soil), the values varied within the range of 59.67–113.00×10⁵ CFU/g, while in Irrigated Gleyic Calcisol (arable land), they ranged from 61.67 to 77.67×10⁵ CFU/g. Haplic Kastanozem (virgin soil) was characterized by the highest values, reaching 200.67×10⁵ CFU/g, decreasing to 151.00×10⁵ CFU/g in less favorable periods. In Haplic Kas-tanozem (arable land), bacterial count was within the range of 75.00–96.67×10⁵ CFU/g.
A distinctive feature is Gleyic Calcisol arable soil variant, where, due to irrigation, the maximum bacterial counts were recorded in the spring. This indicates a significant influence of water regime on the activity of microorganisms utilizing mineral nitrogen.
Thus, bacterial counts measured by the CAA are characterized by pronounced seasonal and typological variability and reflect characteristics of soil's nitrogen regime, as well as its moisture and organic matter supply. This indicator can be used as informative indicator of biological activity and direction of microbiological processes in soil.
The overall biological activity of soils was assessed using the results of the FDA test, soil respiration (CO₂ emission rate), organic matter decomposition, and the Pfeiffer test.
According to the data in Figure 9, soil hydrolytic activity (FDA test), which reflects total activity of hydrolases, was characterized by pronounced seasonal dynamics: higher values were observed in spring and summer, while they decreased towards autumn.
Differences between soil types were consistent: dark chestnut soils demonstrated maximum activity, sierozem soils demonstrated minimum activity, and Gleyic Calcisol occupied an intermediate position. Moreover, in the spring-summer period, differences between soils reached approximately 1.5–2 times, while by autumn the values converged. In some cases, arable soils showed increased activity compared to virgin soils, indicating increased hydrolytic processes under agrogenic influence. Such dynamics can be explained by the fact that Gleyic Calcisol , despite favorable conditions, may have a limited amount of available organic matter necessary for hydrolysis processes. According to Diallo-Diagne et al. (2016), FDA activity depends more on content of organic substrate and microbial biomass than on general soil characteristics [38]. In the spring-summer period, activity can increase due to plant growth and the influx of root secretions [39], whereas in autumn, decrease in temperature and decrease in the influx of organic matter, according to Mills et al. (2026), leads to general decrease in activity [40].
Soil respiration (CO2 emission from soil) occurs during mineralization of OM by soil biota, mainly heterotrophs [41]. Soil respiration correlates well with the SOM content and microbial biomass and is therefore one of the important methods for assessing soil biological activity [42]. The respiration rate in the studied soils depended significantly on the season and land use patterns. In general, the highest CO2 emission values were observed in spring and summer, while they decreased sharply in autumn. The most intense respiration was recorded in Haplic Calcisol on virgin land in spring – 586 ppm in 30 min, and in Irrigated Gleyic Calcisol on arable land in summer – 714.3 ppm (Table 3).
In contrast, the lowest values were observed in autumn in Gleyic Calcisols: 87.3 ppm in virgin soils and 85.5 ppm in arable land. Overall, the table data indicate that mineralization processes were most active during the spring–summer period, while their intensity significantly weakened by autumn. Higher summer values in arable and, especially, irrigated soils are likely related to increased microbiological activity due to improved moisture, the influx of root exudates, and active mineralization of organic matter. Overall, the intensity of carbon dioxide emission from soils was very high for all studied soil types, except for meadow soils in autumn. Such respiration rates indicate a high degree of soil organic matter destruction.
The results of plant residue decomposition, presented in Figure 10, show that in most cases, organic matter degradation varied significantly depending on soil type and soil management regime. In virgin soils, the rates were significantly higher than in arable soils: for example, in Haplic Calcisol, the decomposition rate was 39.96% in virgin soils versus 9.25% in arable soils, and in Gleyic Calcisol, it was 64.1% (Figure 10).
The highest values were recorded in Irrigated Gleyic Calcisol (arable land) – 74.37%, demonstrating the decisive role of irrigation in activating organic matter degradation processes. In Haplic Kastanozem, decomposition reached 62.95% on virgin soil and decreased to 7.28% in the arable variant, indicating a sharp reduction in cellulolytic activity under rainfed conditions.
Under our conditions, the rate of organic matter decomposition is determined primarily by the water regime and availability of organic matter in the soil. Under conditions of low moisture (rainfed arable land), degradation processes slow down sharply, while under irrigation, on the contrary, they reach their maximum values.
Pfeiffer chromatograms provide additional characteristics of soil functional states, which are a simple and informative test of soil biological activity and health [43] and allow for visual assessment of soil quality and distribution characteristics of organic and mineral components. The presented chromatograms show that the maximum diameter and color intensity were generally observed in the summer, and in arable soils these characteristics were more pronounced than in virgin soils. According to the degree of expression of chromatographic characteristics, the studied soils were arranged in the following order: Haplic Calcisol → Gleyic Calcisol → Haplic Kastanozem (Figure 11).
In addition to overall color intensity, chromatogram morphology was also significant. According to Kokornaczyk et al. [44], an increased number of radial elements–spikes, channels, and other structures–indicates higher soil quality and biological fitness. Taking these characteristics into account, dark chestnut and Gleyic Calcisols can be classified as more favorable, while Haplic Calcisol soils were characterized by less pronounced structural complexity of chromatograms.
Figure 12 shows the sum of radii of the middle and outer zones of the Pfeiffer chromatogram, reflecting the content of organic matter, including humus.
According to the data obtained, this indicator decreased from spring to fall. In the more fertile soils– Gleyic Calcisol and Haplic Kastanozem –virgin soils had higher values compared to arable soils, indicating better preservation of organic matter under natural conditions. The opposite trend was observed in Haplic Calcisol. Overall, the highest organic matter content was characteristic of dark chestnut soils, followed by Gleyic Calcisols .
Based on the results of soil biological activity tests, the biogenicity index, organic matter transformation coefficient, and integrated indicator of soil biological status (IIBS) were calculated. The biogenicity index was defined as the ratio of bacterial and fungal populations. IBS was calculated as the sum of the relative values of individual indicators, expressed as a percentage of their maximum: B1 = B/Bmax × 100%. The results of the biogenicity index calculation are presented in Table 4.
According to the data in Table 4, the biogenicity coefficient was generally higher in arable soils than in their virgin counterparts. The highest total value for the season was observed in Irrigated Gleyic Calcisol (arable land) – 61.29, while in Haplic Calcisol (virgin land) and Haplic Kastanozem (virgin land) it was 22.46 and 23.67, respectively. In Gleyic Calcisol (virgin land), this indicator reached 39.01, and in Haplic Calcisol (arable land) it was 38.44. The obtained data indicate a more pronounced shift in the microbial community in arable soils, which may be associated with increased micromycete load in agrocenoses and, probably, a higher phytopathogenic potential. In this regard, dark chestnut soils were characterized by a more balanced state of the microbial complex.
It should be noted that methodological differences must be taken into account when comparing data with literature. For example, in a study by N.D. Ananyeva et al., conducted on materials of 47 biomes in the European part of Russia, the ratio of fungi to bacteria was analyzed rather than the ratio of their biomass. The authors demonstrated that natural ecosystems are characterized by a higher F/B ratio compared to agricultural lands, which is generally consistent with the concept of greater stability of natural soil microbial communities [45].
Table 5 shows the results of calculating the coefficient of transformation of soil organic matter based on the ratio of CAA/MPA. The predominance of microorganisms that assimilate mineral forms of nitrogen over microorganisms that utilize organic nitrogen-containing compounds indicates a high intensity of microbiological mineralization of organic matter [46].
The obtained data show that in the spring, the mineralization type of organic matter transformation predominated in most variants. The exception was the virgin Haplic Kastanozem variant, where the CAA/MPA ratio reached 1.79, corresponding to the accumulative type. In the summer, a transition to the accumulative type of transformation was observed in a number of soil variants: for example, in Haplic Calcisol (arable land), the ratio was 1.15, in Gleyic Calcisol (virgin land) – 1.14, and in Haplic Kastanozem (arable land) – 1.12. Meanwhile, in Irrigated Gleyic Calcisol (arable land), the mineralization type of transformation was maintained in all seasons, and ratio values varied from 0.72 to 0.92. In autumn, processes again shifted towards mineralization, with the exception of Haplic Kastanozem, where the accumulative type (1.09) was retained in the arable variant. This seasonal dynamic is likely related to changes in the intensity of plant vegetation, influx of root exudates, and transformation of nitrogen-containing compounds in soil.
Based on the results of the comprehensive assessment, the integrated indicator of the biological state of soil (IIBS) was calculated [47], the results of which are presented in Table 6.
The maximum total values of IIBS were determined for Haplic Calcisol (virgin land) – 292.67 and Haplic Calcisol (arable land) – 269.08. They were lower in Haplic Kastanozem (virgin land) – 248.39. The minimum values were obtained for Irrigated Gleyic Calcisol (arable land) – 203.74 and Gleyic Calcisol (virgin land) – 217.22. In general, this indicates that the greatest expression of biological activity was characteristic of sierozems, dark chestnut soils were inferior to them, while Gleyic Calcisols occupied an intermediate position.
Calculation of correlation coefficients between total carbon, readily hydrolyzable nitrogen, total microbial counts, micromycete counts, bacteria counts on CAA, and hydrolysis activity according to FDA revealed close links between these indicators. Depending on variant and season, correlation coefficients varied from 0.64 to 0.99, confirming the consistency of biological activity indicators and their correlation with soil organic matter status.
For a more in-depth assessment of the studied soils, the iAgroInnApp platform [48] was used. It integrates data from remote sensing, global soil and climate databases, geomorphological factors, and local field observations. Based on a comprehensive analysis, the platform generates applied agroecological characteristics of the territories and identifies zones of potential and limitations related to physical, chemical, and water properties of soils.
According to the data in Table 7, the integrated assessment of the studied soils according to the CASH system ranged from 43 to 52 points.
The highest values were obtained for Haplic Kastanozem: 52 points in virgin soil and 51 points in arable land. For Haplic Calcisol, the values were 46 and 43 points, respectively, and for Gleyic Calcisol, 47 points in both use cases. On average, the scores of virgin and arable soils were similar, amounting to approximately 48 and 47 points, respectively. However, despite the similarity in total scores, differences in the nature of limitations were revealed. For virgin soils, the main limiting factors were low SOC content, low water capacity, and, in some cases, slope, whereas for arable soils, the risks of erosion, dehumification, and degradation under anthropogenic load are more pronounced. Overall, the obtained values correspond to satisfactory soil condition, but indicate the presence of pronounced limitations in key functions.
Summarizing the results of soil biological activity assessment, a number of consistent patterns can be identified. All studied soils are characterized by a limited supply of organic matter, a key factor determining their structural stability, water regime, and biological activity. Virgin soils, despite the absence of mechanical impact, represent systems with vulnerable ecological stability: despite a relatively intact structure, they are characterized by low organic carbon content, weak aggregate stability, and limited water holding capacity. This defines their state as a fragile equilibrium, capable of quickly transitioning to a degradation regime during plowing.
Arable soils, on the other hand, exhibit signs of functional depletion of the organic component, manifested by decreased humus content, increased mineralization processes, and changes in the structure of the microbial community. Irrigated Gleyic Calcisol exhibit a different type of instability, linked to moisture regime dependence and accompanied by fluctuations in the intensity of biological processes, nutrient losses, and accelerated organic matter transformation.
4. Discussion
The obtained results show that the humus and nitrogen status of the studied soils is determined by both their genetic characteristics and land use patterns. The highest humus content was found in Haplic Kastanozem, where organic matter accumulates under natural vegetation conditions. In arable soils of these soils, humus content decreases due to increased mineralization of organic compounds.
Gleyic Calcisol soils are characterized by a more stable humus status. In some cases, a slight increase in humus content is observed in arable soils, which may be due to the influx of plant residues from cultivated crops and specific agricultural practices. Haplic Calcisol are characterized by the lowest humus content, which corresponds to the natural conditions of their formation, determined by the limited influx of organic residues and arid climate.
Analysis of the soil nitrogen regime is particularly important. The data obtained show that easily hydrolyzable nitrogen is highly variable, which is associated with intensive organic compound mineralization processes. Gleyic Calcisol have the highest content of available nitrogen forms, indicating favorable conditions for the biological nitrogen cycle. The C/N ratio in all studied soils is within the range characteristic of soils with active humus–nitrogen metabolism. Lower C/N values in arable soils indicate accelerated organic matter decomposition and enhanced mineralization processes.
Our data on soil organic matter (SOM) depletion and changes in biological activity parameters in arable soils are consistent with data for semi-arid and arid regions, where long-term soil cultivation leads to accelerated SOM turnover and reduced soil quality. In general, biological activity tests are successfully used to assess soil fertility, effectiveness of agricultural technologies, reclamation and melioration measures, diagnosis of degradation processes, and assessment of the effects of soil pollution [49,50].
Biological activity indicators, along with physicochemical parameters, are widely used for comprehensive soil quality assessments. Thus, for integrated assessment of soil condition, indicators of respiration, moisture, mobile carbon content, and enzyme activity, including dehydrogenase, are used [51,52,53].
There are studies in which biological activity tests are used to evaluate the direction of organic matter transformation based on enzyme activity and mineralization indices [54].
Our study is one of the first attempts in Kazakhstan to determine the correlation between soil biological activity indicators and carbon content. The results obtained showed that the studied soils were characterized by a relatively low microbial population: TMC values did not exceed 10⁵ CFU/g of soil, while micromycetes predominated in the microbial community, and organic matter transformation processes were primarily mineralization-based. Pfeiffer chromatograms also indicate high humus mobility, which varies seasonally.
Hydrolysis of fluorescein diacetate is carried out by living cells with the participation of various enzymes (proteases, lipases, esterases); therefore, this indicator is considered an integral indicator of microbial activity and soil quality [55]. It has been determined that the activity of FDA hydrolysis is closely related to the intensity of soil respiration. Our studies also noted increased FDA activity in arable soils compared to virgin soils during the summer–autumn period.
The data obtained indicate high soil biological activity, accompanied by accelerated organic matter transformation and humus loss, particularly pronounced in Haplic Calcisol. Using the iAgroInnApp platform further confirmed that the region's arable soils are in a state of functional organic matter depletion, while traditional agrochemical indicators (pH, CFU) may mask the early stages of degradation.
5. Conclusions
The conducted research has shown that the humus–nitrogen status of soils is determined by a combination of natural factors and land use patterns. Haplic Kastanozem show the most favorable conditions for organic matter accumulation, while Calcisol have minimal organic matter content.
Arable soils are characterized by accelerated organic matter mineralization, reduced humus content, and altered microbial community structure. Gleyic Calcisol takes an intermediate position and demonstrate relative stability due to their water regime.
High biological activity in arable soils with limited supply of organic matter indicates accelerated transformation of humus and decreased fertility, which is especially characteristic of arid conditions.
Overall, the studied soils are characterized by limited ecological stability due to deficiency of organic carbon and moisture. Virgin soils represent vulnerable-stable systems, while arable soils are in a state of functional depletion. If current land use trends and climate aridization continue, soils transition to a persistent degradation state is possible.
Author Contributions
Conceptualization, R.R.; methodology, M.I.; validation, M.I.; formal analysis, S.T.; investigation, A.S., A.K., R.A., S. Y., A.Am.; data curation, M.I., A.S., and A.K.; visualization, A.A.; field research, A.S., A.A.; writing–original draft preparation, R.R.; writing–review and editing, M.I. and A.K.; supervision, S.T.; project administration, S.T.; correspondence with the journal, R.R., S.T. and A.K. All authors have read and agreed to the published version of the manuscript.
Funding
This research was funded by the Ministry of Agriculture of the Republic of Kazakhstan, scientific and technical program BR22885097 “Ensuring rational use of agricultural lands in intensive farming based on new approaches to preservation and reproduction of soil fertility”.
Data Availability Statement
The data presented in this study are available from the corresponding author upon reasonable request.
Acknowledgments
The authors gratefully acknowledge O. Zhanybekov, developer of the iAgroInnApp platform, for providing access to the platform and for the valuable support.
Conflicts of Interest
The authors declare no conflict of interest.
References
- Kopittke, P.M.; Harper, S.M.; Asio, L.G.; et al. Soil degradation: An integrated model of the causes and drivers. Int. Soil. Water Conserv. Res. 2025, 13, 744–755. [Google Scholar] [CrossRef]
- Borrelli, P.; Robinson, D.A.; Fleischer, L.R.; et al. Land use and climate change impacts on global soil erosion by water. Proc. Natl. Acad. Sci. USA 2017, 114, 9644–9649. [Google Scholar]
- Bhaduri, D.; et al. A review on effective soil health bio-indicators for ecosystem restoration and sustainability. Front. Soil. Sci. 2022. [Google Scholar] [CrossRef]
- Hu, Y.; et al. Land desertification and its influencing factors in Kazakhstan. J. Arid Environ. 2020. [Google Scholar] [CrossRef]
- Liptzin, D.; et al. An evaluation of nitrogen indicators for soil health in long-term agricultural experiments. Soil. Sci. Soc. Am. J. 2023. [Google Scholar] [CrossRef]
- Santos, F.C.; et al. Organic matter: a critical soil health indicator in agricultural systems. Front. Soil. Sci. 2025. [Google Scholar] [CrossRef]
- Sommer, R.; De Pauw, E. Organic carbon in soils of Central Asia: Status quo and potentials for sequestration. Plant Soil. 2011, 338, 273–288. [Google Scholar] [CrossRef]
- Pankova, E.I.; Yamnova, I.A.; Gerasimova, M.I.; Targulian, V.O. Soils of Central Asia: Formation, Properties and Degradation Processes; GEOS: Moscow, Russia, 2019. [Google Scholar]
- Saparov, A. Soil resources of the Republic of Kazakhstan: Current status, problems and solutions. In Novel Measurement and Assessment Tools for Monitoring and Management of Land and Water Resources in Agricultural Landscapes of Central Asia; 2013; pp. 61–73. [Google Scholar]
- Pankova, E.I.; Yamnova, I.A.; Gerasimova, M.I.; Targulian, V.O. Soils of Central Asia: Formation, Properties and Degradation Processes; GEOS: Moscow, Russia, 2019; 304. [Google Scholar]
- Soil salinization and its impact on the degradation of agricultural landscapes of the Talas district, Kazakhstan. 2025.
- Review on land degradation and desertification processes in Kazakhstan. Bulletin of NAS. RK 2021.
- Suska-Malawska, M.; et al. Spatial and In-Depth Distribution of Soil Salinity and Heavy Metals in Irrigated Arable Soils of Southern Kazakhstan. Agronomy 2022, 12, 1207. [Google Scholar] [CrossRef]
- FAO. Global Map of Salt-Affected Soils, Version 1.0. FAO: Rome, Italy, 2021.
- Soils of the Kazakh SSR. Issue 7: Dzhambul Region; Nauka: Alma-Ata, USSR, 1967; 366. [Google Scholar]
- Yashin, I.M.; Shishov, L.L.; Raskatov, V.A. Soil and Ecological Studies in Landscapes; MSHA Publishing House: Moscow, Russia, 2000; 558. [Google Scholar]
- Methodology for conducting large-scale soil surveys of land. Information and Legal System of Normative Legal Acts of the Republic of Kazakhstan. 2023. Available online: https://adilet.zan.kz/kaz.
- GOST 26213-91; Determination of Humus According to Tyurin Method.
- Arinushkina, E.P. Guide to Chemical Analysis of Soils; Moscow State University Publishing House: Moscow, Russia, 1977; 489. [Google Scholar]
- Dmitriyev, Ye.A. Mathematical Statistics in Soil Science; MSU Publishing House: Moscow, Russia, 1995; 320. [Google Scholar]
- Kozlov, A.V. Methods of Soil Microbiology and Enzymology in Ecosystem Studies: Teaching Manual; Plodorodiye: Moscow, Russia, 2023; 152 p. [Google Scholar]
- Schnurer, J.; Rosswall, T. Fluorescein diacetate hydrolysis as a measure of total microbial activity in soil and litter. Appl. Environ. Microbiol. 1982, 43, 1256–1261. [Google Scholar] [CrossRef]
- Kurganova, I.N.; Goncharova, O.Yu.; Zamolodchikov, D.G.; et al. Determination of CO₂ Emission by Chamber Method in Various Ecosystems; Pero Publishing House: Moscow, Russia, 2024; 28. [Google Scholar]
- Shishlov, L.L.; Karmanov, I.I.; Durmanov, D.N. Criteria and Models of Soil Fertility; Agropromizdat: Moscow, Russia, 1987; 184 p. [Google Scholar]
- Bot, A.; Benites, J. The Importance of Soil Organic Matter: Key to Drought-Resistant Soil and Sustained Food Production; FAO: Rome, Italy, 2005; Available online: https://www.fao.org/4/a0100e/a0100e04.html.
- Kravchenko, Y.S.; Zhang, X.; Zhang, X.; et al. Seasonal dynamics of organic carbon and nitrogen in biomasses of microorganisms in arable Mollisols affected by different tillage systems. Land 2022, 11, 486. [Google Scholar] [CrossRef]
- Seasonal dynamics of soil labile organic carbon and enzyme activities in relation to vegetation types in Hangzhou Bay tidal flat wetland. PLoS ONE 2015, 10, e0142677. [CrossRef]
- Hermle, S.; Anken, T.; Leifeld, J.; Weisskopf, P. The effect of the tillage system on soil organic carbon content under moist, cold-temperate conditions. Soil. Tillage Res. 2008, 98, 94–105. [Google Scholar] [CrossRef]
- Orlov, D.S.; Anikanova, V.A.; Markin, V.A. Features of organic matter of irrigated soils. In Problems of Soil Irrigation in the South of the Chernozem Zone; Nauka: Moscow, USSR, 1980; pp. 35–61. [Google Scholar]
- Baranovskaya, V.A.; Azovtsev, V.I. The influence of irrigation on carbonate migration in soils of the Volga region. Soil. Sci. 1981, 10, 17–26. [Google Scholar]
- Baranovskaya, V.A.; Azovtsev, V.I. The influence of irrigation on carbonate migration in soils of the Volga region. Soil. Sci. 1981, 10, 17–26. [Google Scholar]
- Kononova, M.M. Soil Organic Matter: Its Nature, Properties and Methods of Study; USSR Academy of Sciences: Moscow, USSR, 1964; 314. [Google Scholar]
- Aliyev, S.A. Conditions of Accumulation and Nature of Organic Matter in Soils; Academy of Sciences of the Azerbaijan SSR: Baku, USSR, 1966; 256. [Google Scholar]
- Glazovskaya, M.A. General Soil Science and Soil Geography; Vysshaya Shkola: Moscow, USSR, 1981; 400 p. [Google Scholar]
- Moebius-Clune, B.N.; Moebius-Clune, D.J.; Gugino, B.K.; Idowu, O.J.; Schindelbeck, R.R.; Ristow, A.J.; van Es, H.M.; Thies, J.E.; Shayler, H.A.; McBride, M.B.; et al. Comprehensive Assessment of Soil Health–The Cornell Framework, Edition 3.2; Cornell University: Geneva, NY, USA, 2016; 124. [Google Scholar]
- Weil, R.R.; Islam, K.R.; Stine, M.A.; Gruver, J.B.; Samson-Liebig, S.E. Estimating active carbon for soil quality assessment: A simplified method for laboratory and field use. Am. J. Altern. Agric. 2003, 18, 3–17. [Google Scholar] [CrossRef]
- Kulagina, V.I.; Sungatullina, L.M.; Ryazanov, S.S.; Shagidullin, R.R.; Andreeva, A.A. Information content of microbiological and biochemical parameters for soil monitoring in organic farming. Reg. Geosyst. 2021, 45, 459–470. [Google Scholar] [CrossRef]
- Diallo-Diagne, N.H.; Assigbetse, K.; Sall, S.; Masse, D.; Bonzi, M.; Ndoye, I.; Chotte, J.L. Response of soil microbial properties to long-term application of organic and inorganic amendments in a tropical soil (Saria, Burkina Faso). Open J. Soil. Sci. 2016, 6, 21–33. [Google Scholar] [CrossRef]
- Kuzyakov, Y. Factors affecting rhizosphere priming effects. J. Plant Nutr. Soil. Sci. 2002, 165, 382–396. [Google Scholar] [CrossRef]
- Mills, S.A.; Alster, C.J.; Moir, J.L. Seasonal dynamics outweigh management effects on microbial enzyme activity and stoichiometry in regenerative and conventional dryland pastures. Soil. Adv. 2026, 5, 100106. [Google Scholar] [CrossRef]
- Zadorozhniy, A.N.; Semenov, M.V.; Khodzhaeva, A.K.; Semenov, V.M. Soil processes of production, consumption, and emission of greenhouse gases. Agrochemistry 2010, 10, 75–92. [Google Scholar]
- Ananyeva, N.D.; Sushko, S.V.; Ivaschenko, K.V.; Vasenev, V.I. Microbial respiration of subtaiga and forest-steppe soils in the European part of Russia: field and laboratory approaches. Soil. Sci. 2020, 10, 1276–1286. [Google Scholar] [CrossRef]
- Graciano, I.; Matsumoto, L.S.; Demétrio, G. Evaluating Pfeiffer chromatography for its validation as an indicator of soil quality. J. Agric. Stud. 2020, 8, 420. [Google Scholar] [CrossRef]
- Kokornaczyk, M.; Primavera, F.; Luneia, R.; Baumgartner, S.; Betti, L. Analysis of soils by means of Pfeiffer’s circular chromatography test and comparison to chemical analysis results. Biol. Agric. Hortic. 2016, 33, 1–15. [Google Scholar] [CrossRef]
- Ananyeva, N.D.; Castaldi, S.; Stolnikova, E.V.; Kudeyarov, V.N.; Valentini, R. Fungi-to-bacteria ratio in soils of European Russia. Arch. Agron. Soil. Sci. 2015, 61, 427–446. [Google Scholar] [CrossRef]
- Gordeeva, T.Kh.; Malyuta, O.V.; Gavritskova, N.N. Microbiological indication of soil-ecological conditions when using non-traditional ameliorants. Bull. Perm. State Tech. Univ. 2013, 1, 81–91. [Google Scholar]
- Kazeev, K.Sh.; Kolesnikov, S.I.; Valkov, V.F. Biological Diagnostics and Indication of Soils: Methodology and Research Methods; RSU Publishing House: Rostov-on-Don, Russia, 2003; 204. [Google Scholar]
- iAgroInnApp–Personal Digital Agronomist-Soil Scientist. Available online: https://iagroinnapp.com.
- Stenberg, B. Monitoring soil quality of arable land: Microbiological indicators. Acta Agric. Scand. Sect. B Soil. Plant Sci. 1999, 49, 1–24. [Google Scholar] [CrossRef]
- Wołejko, E.; Jabłońska-Trypuć, A.; Wydro, U.; Butarewicz, A.; Łozowicka, B. Soil biological activity as an indicator of soil pollution with pesticides–A review. Appl. Soil. Ecol. 2019, 147, 103356. [Google Scholar] [CrossRef]
- Semenov, M.V.; Ksenofontova, N.A.; Nikitina, D.A.; Tkhakakhova, A.K.; Lukin, S.M. Microbiological indicators of sod-podzolic soil and its rhizosphere in a half-century field experiment using different fertilization systems. Soil. Sci. 2023, 6, 715–729. [Google Scholar]
- Gedgafova, F.V.; Gorobtsova, O.N.; Uligova, T.S.; Tsepkova, N.L.; Khakunova, E.M.; Daova, K.Kh.; Tembotova, R.Kh. Soil degradation, restoration and protection: Assessment of changes in biological activity of mountain meadow-steppe soils of pastures at different stages of degradation in the Central Caucasus. Soil. Sci. 2023, 6, 787–798. [Google Scholar]
- Zavyalova, N.E.; Vasbieva, M.T.; Fomina, D.S. Microbial biomass, respiratory activity, and nitrogen fixation in sod-podzolic soil of the Cis-Urals under different agricultural uses. Soil. Sci. 2020, 3, 372–378. [Google Scholar]
- Lapa, V.V.; Mikhailovskaya, N.A.; Ivakhnenko, N.N.; Kasyanchik, S.A.; Pogirnitskaya, T.V. Influence of fertilization systems on the biological activity of sod-podzolic sandy loam soil. Bull. Natl. Acad. Sci. Belarus Agrar. Sci. 2014, 2, 61–67. [Google Scholar]
- Green, V.S.; Stott, D.E.; Diack, M. Assay for fluorescein diacetate hydrolytic activity: Optimization for soil samples. Soil. Biol. Biochem. 2006, 38, 693–701. [Google Scholar] [CrossRef]
Figure 1.
Map of soil sampling points: (a) general view; (b) sampling points.
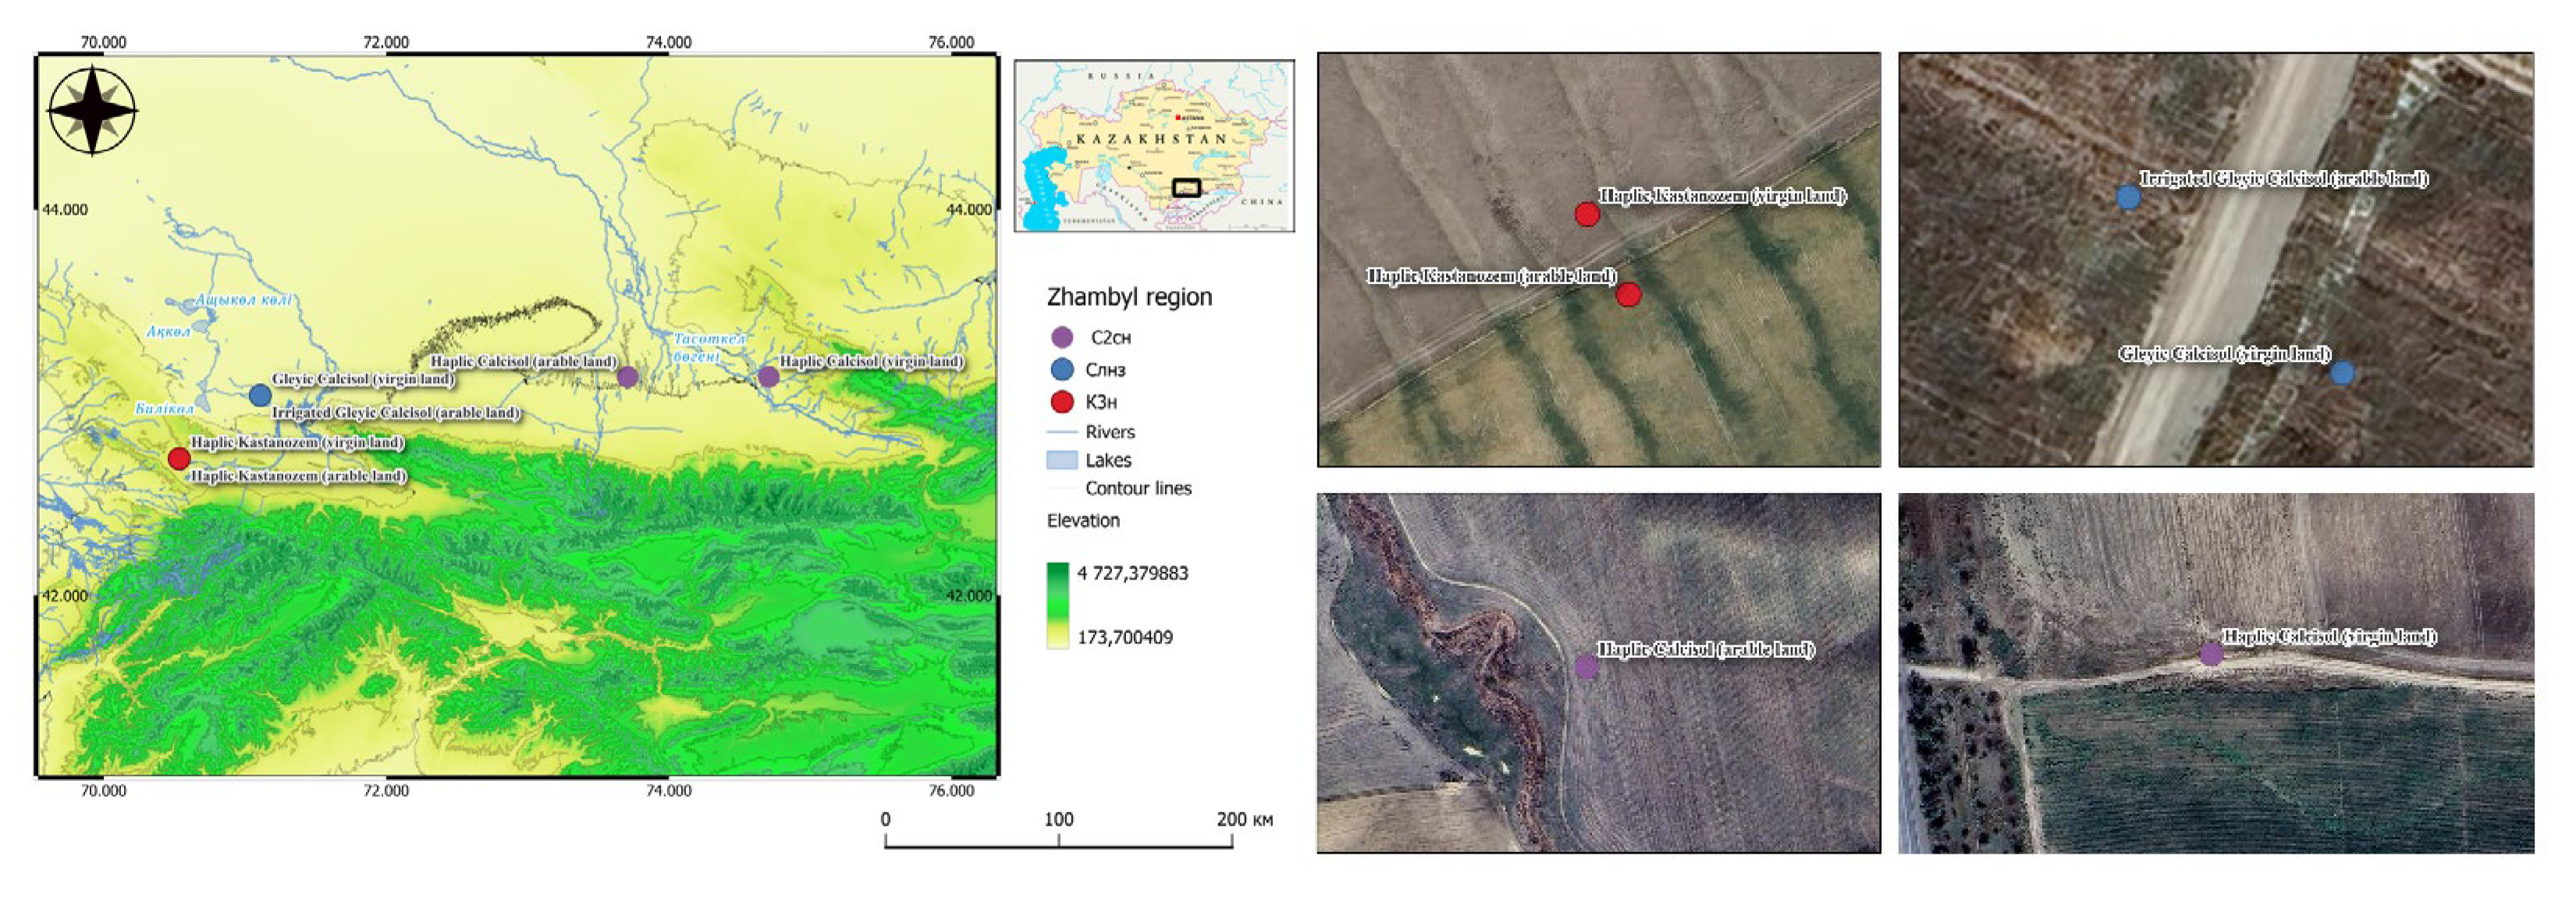
Figure 2.
Seasonal dynamics of total humus content (%) in studied soils under virgin and arable conditions (mean ± SD, n = 3).
Figure 2.
Seasonal dynamics of total humus content (%) in studied soils under virgin and arable conditions (mean ± SD, n = 3).
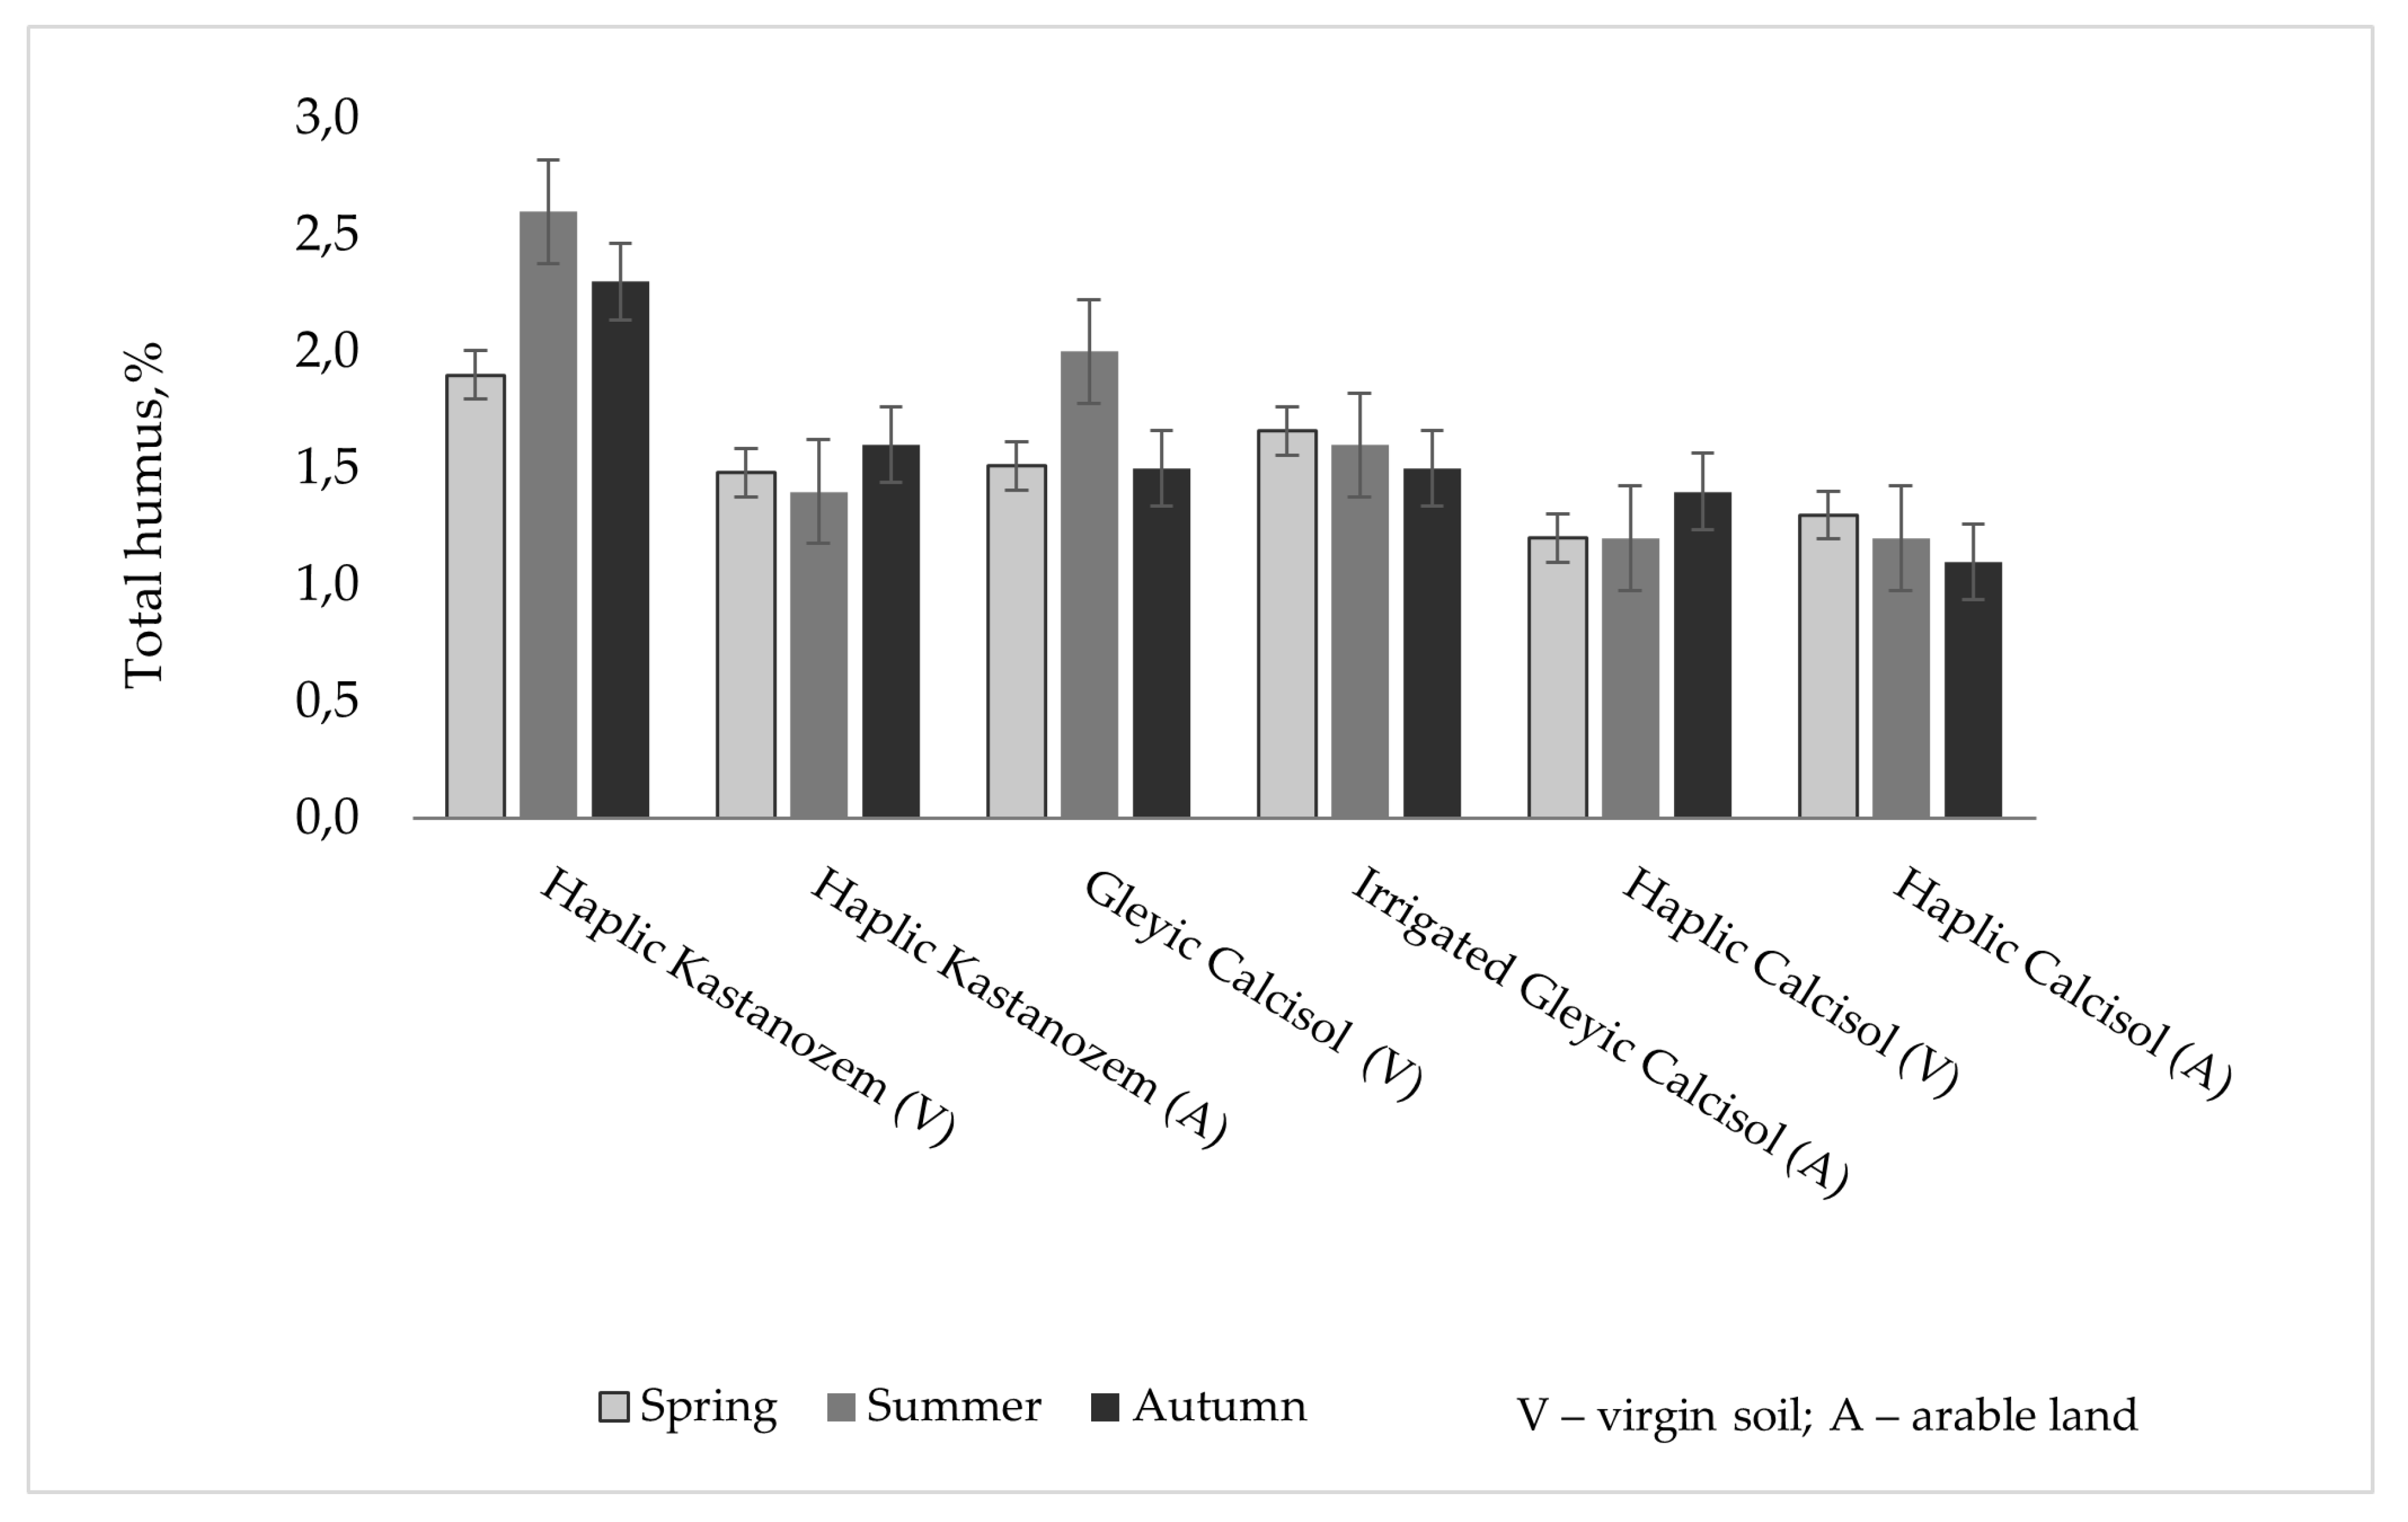
Figure 3.
Seasonal dynamics of total nitrogen content (%) in studied soils under virgin and arable conditions (mean ± SD, n = 3).
Figure 3.
Seasonal dynamics of total nitrogen content (%) in studied soils under virgin and arable conditions (mean ± SD, n = 3).
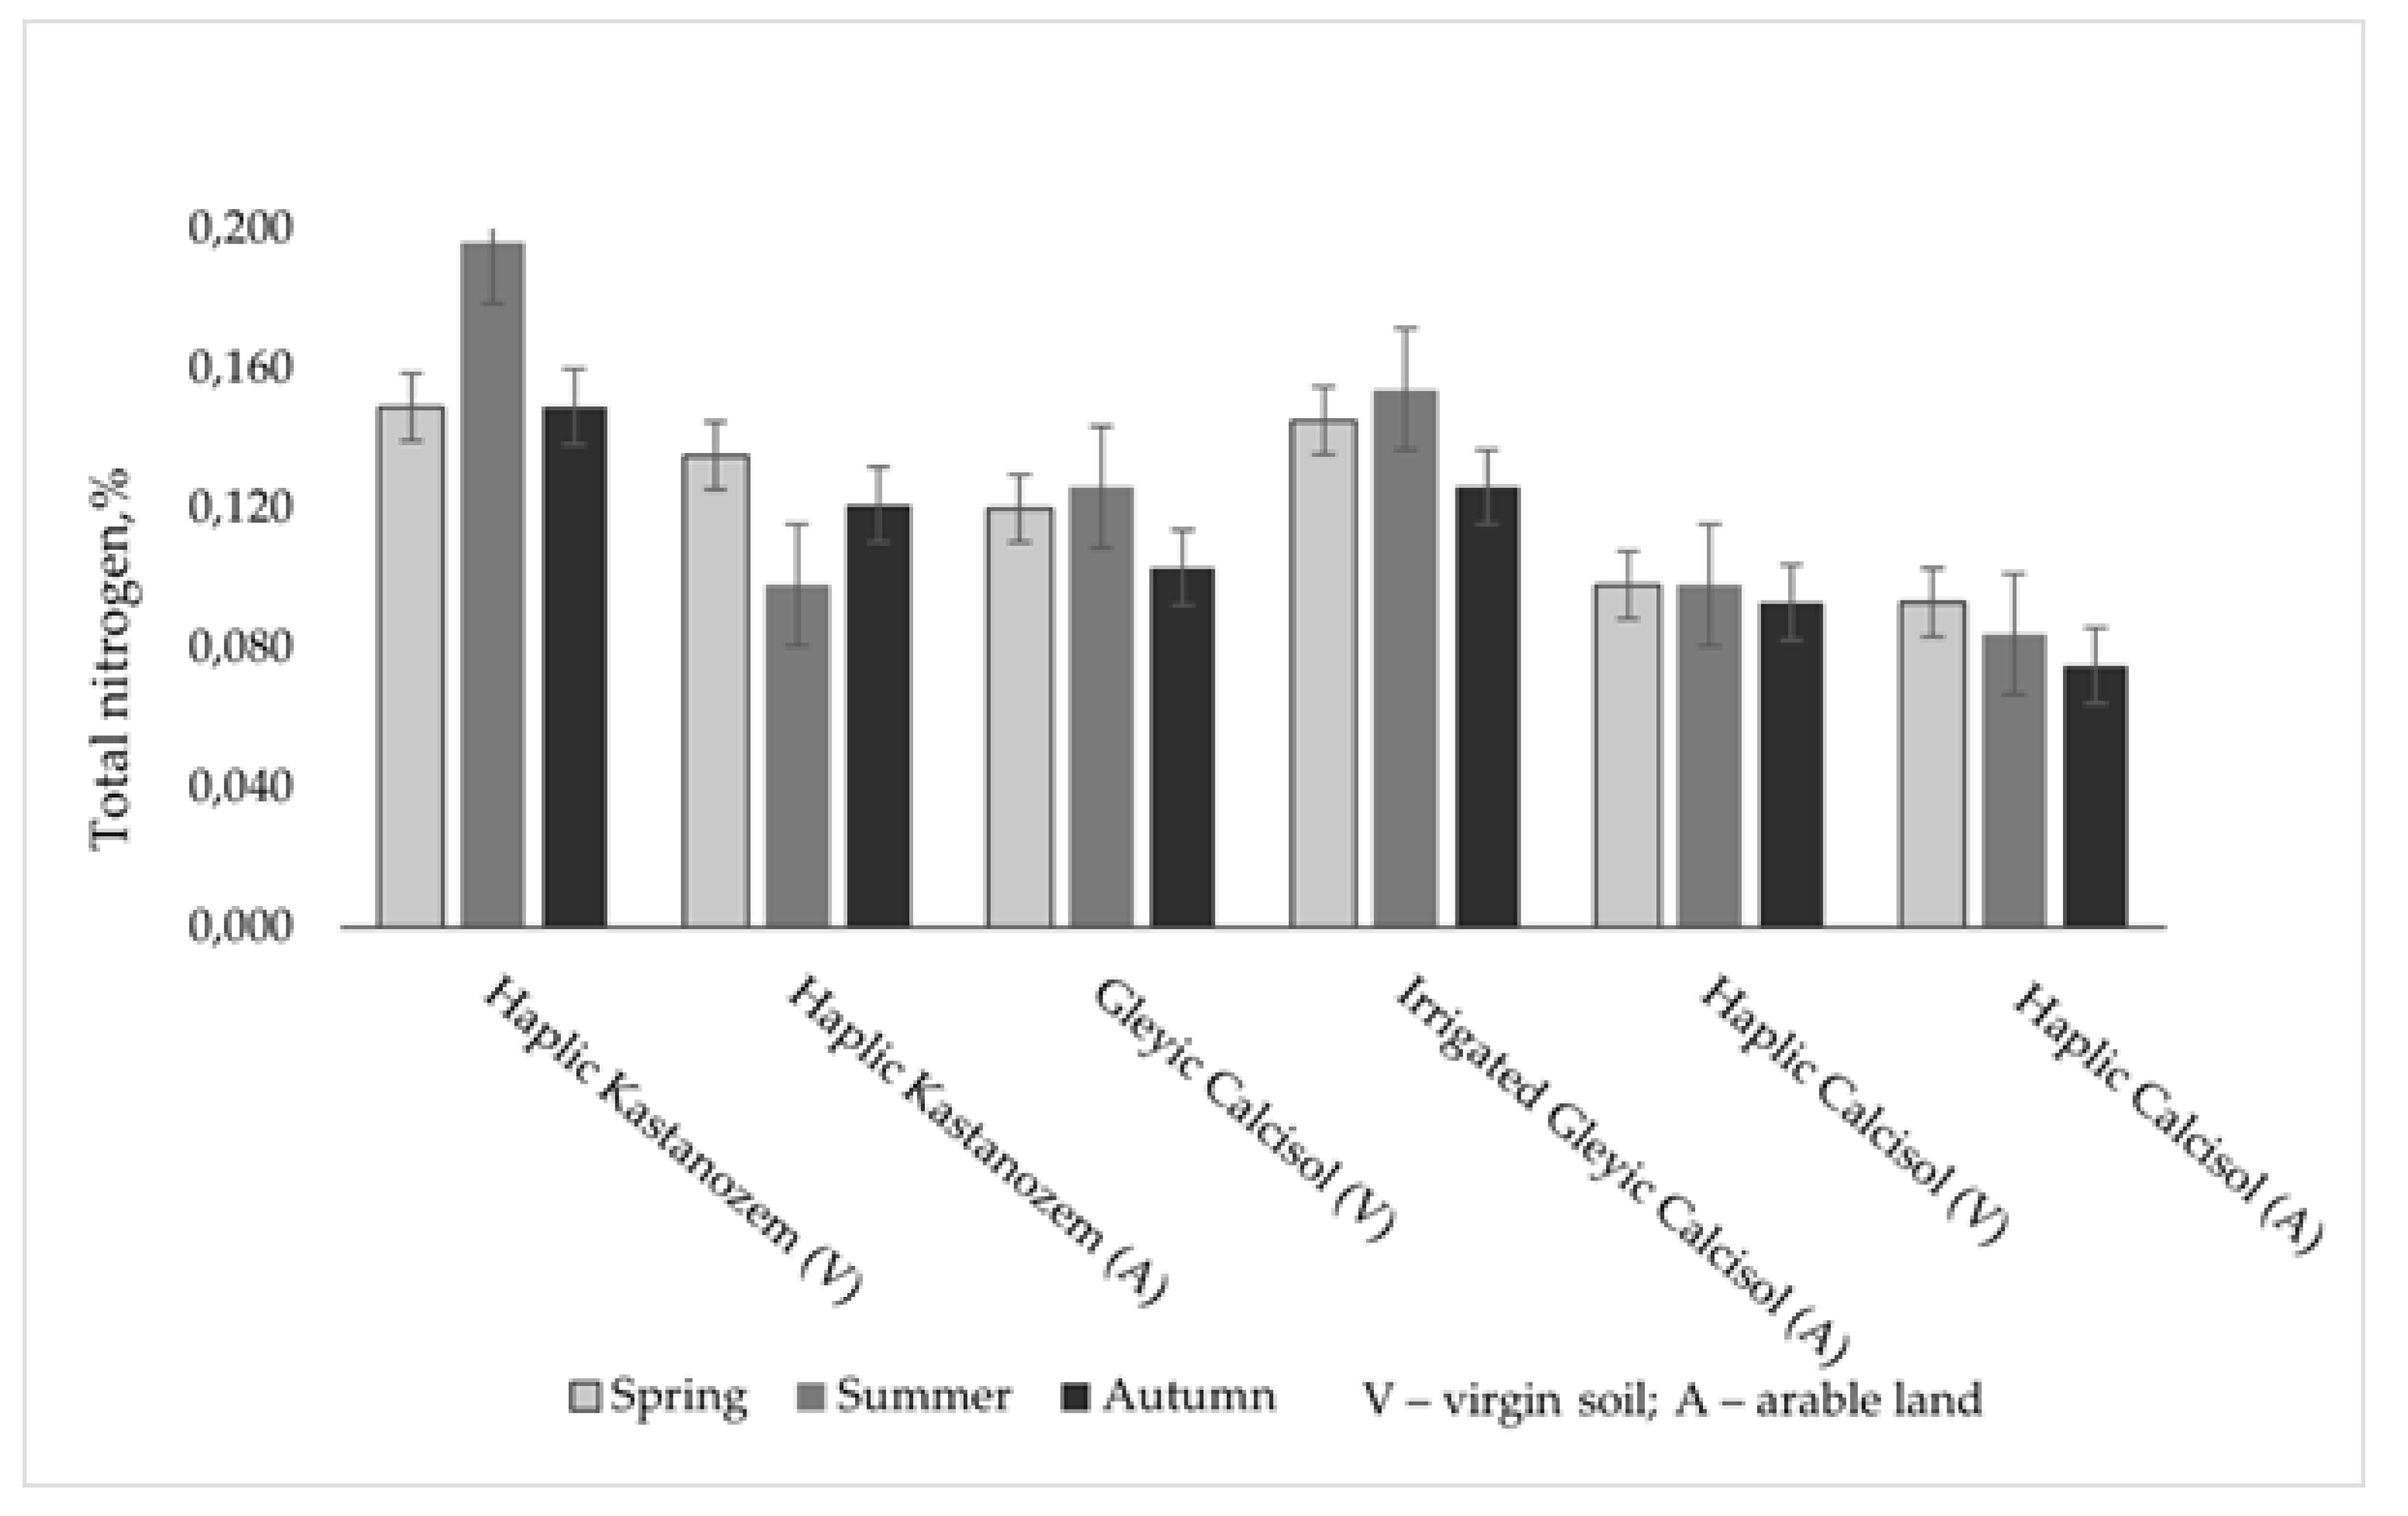
Figure 4.
Seasonal dynamics of easily hydrolyzable nitrogen content (mg/kg) in studied soils under virgin and arable conditions (mean ± SD, n = 3).
Figure 4.
Seasonal dynamics of easily hydrolyzable nitrogen content (mg/kg) in studied soils under virgin and arable conditions (mean ± SD, n = 3).
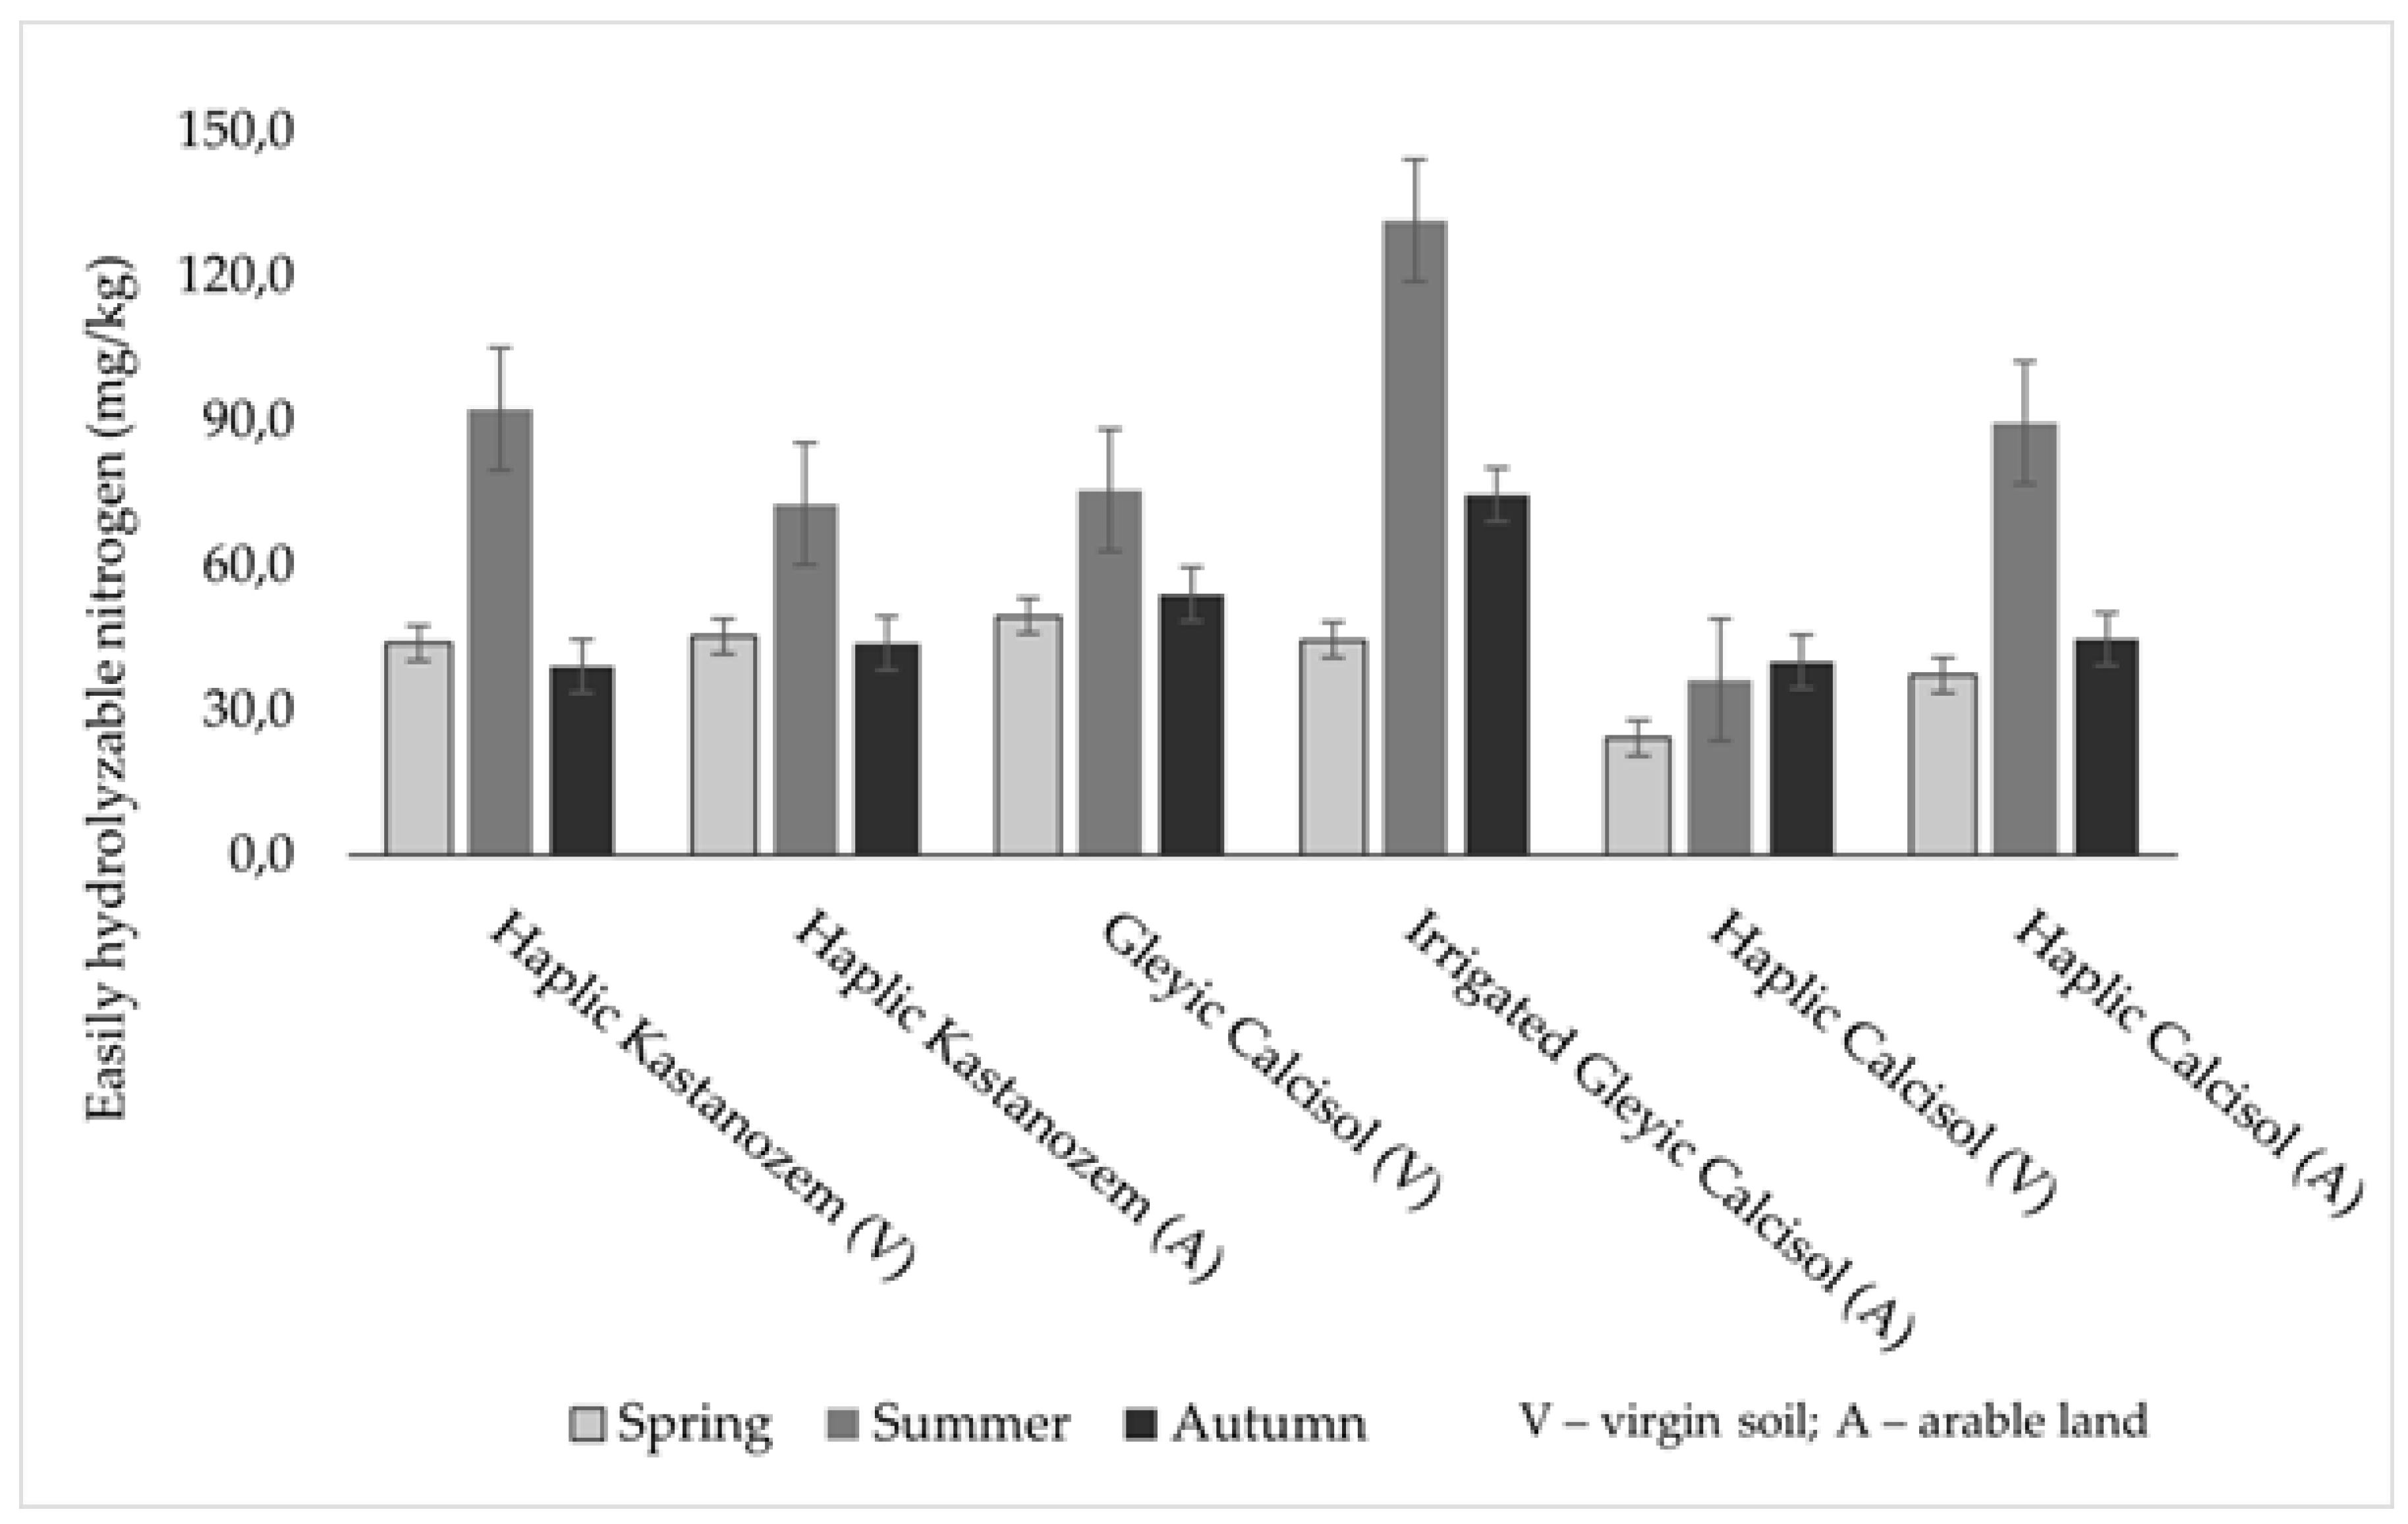
Figure 5.
Seasonal dynamics of carbon-to-nitrogen ratio (C:N) in studied soils under virgin and arable conditions (mean ± SD, n = 3).
Figure 5.
Seasonal dynamics of carbon-to-nitrogen ratio (C:N) in studied soils under virgin and arable conditions (mean ± SD, n = 3).
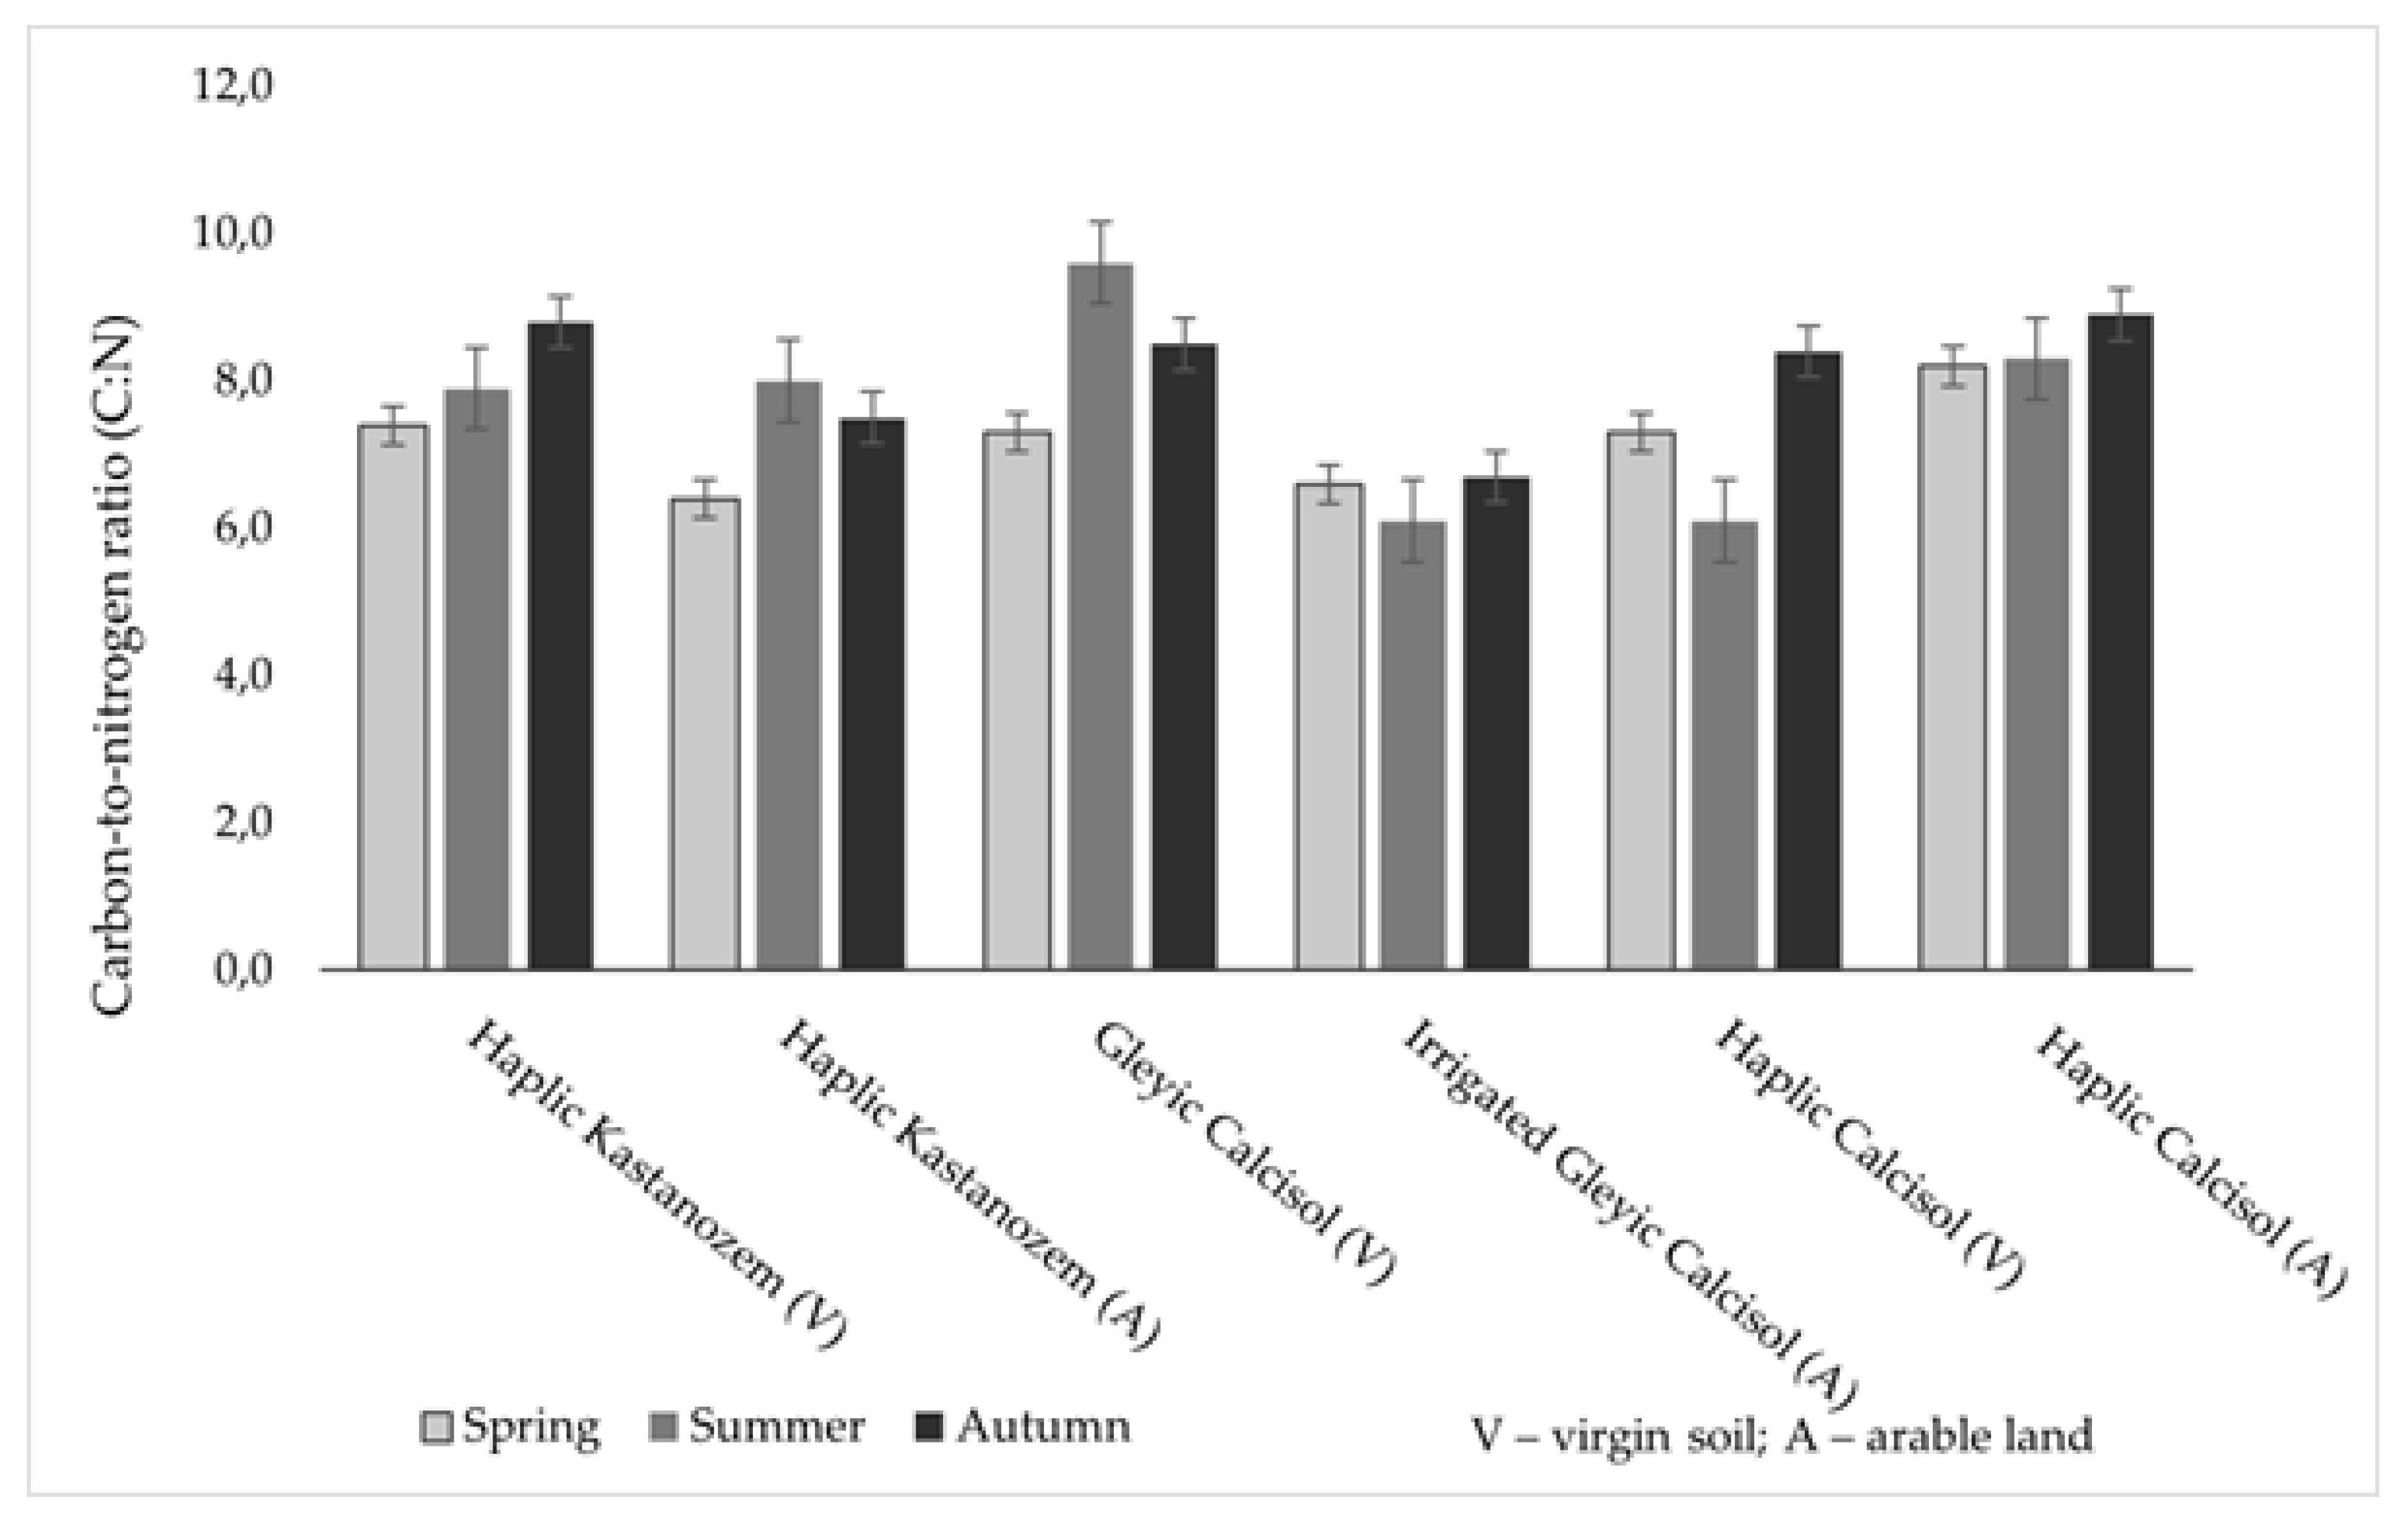
Figure 6.
Seasonal dynamics of mobile carbon (POXC) in studied soils under virgin and arable conditions (mean ± SD).
Figure 6.
Seasonal dynamics of mobile carbon (POXC) in studied soils under virgin and arable conditions (mean ± SD).
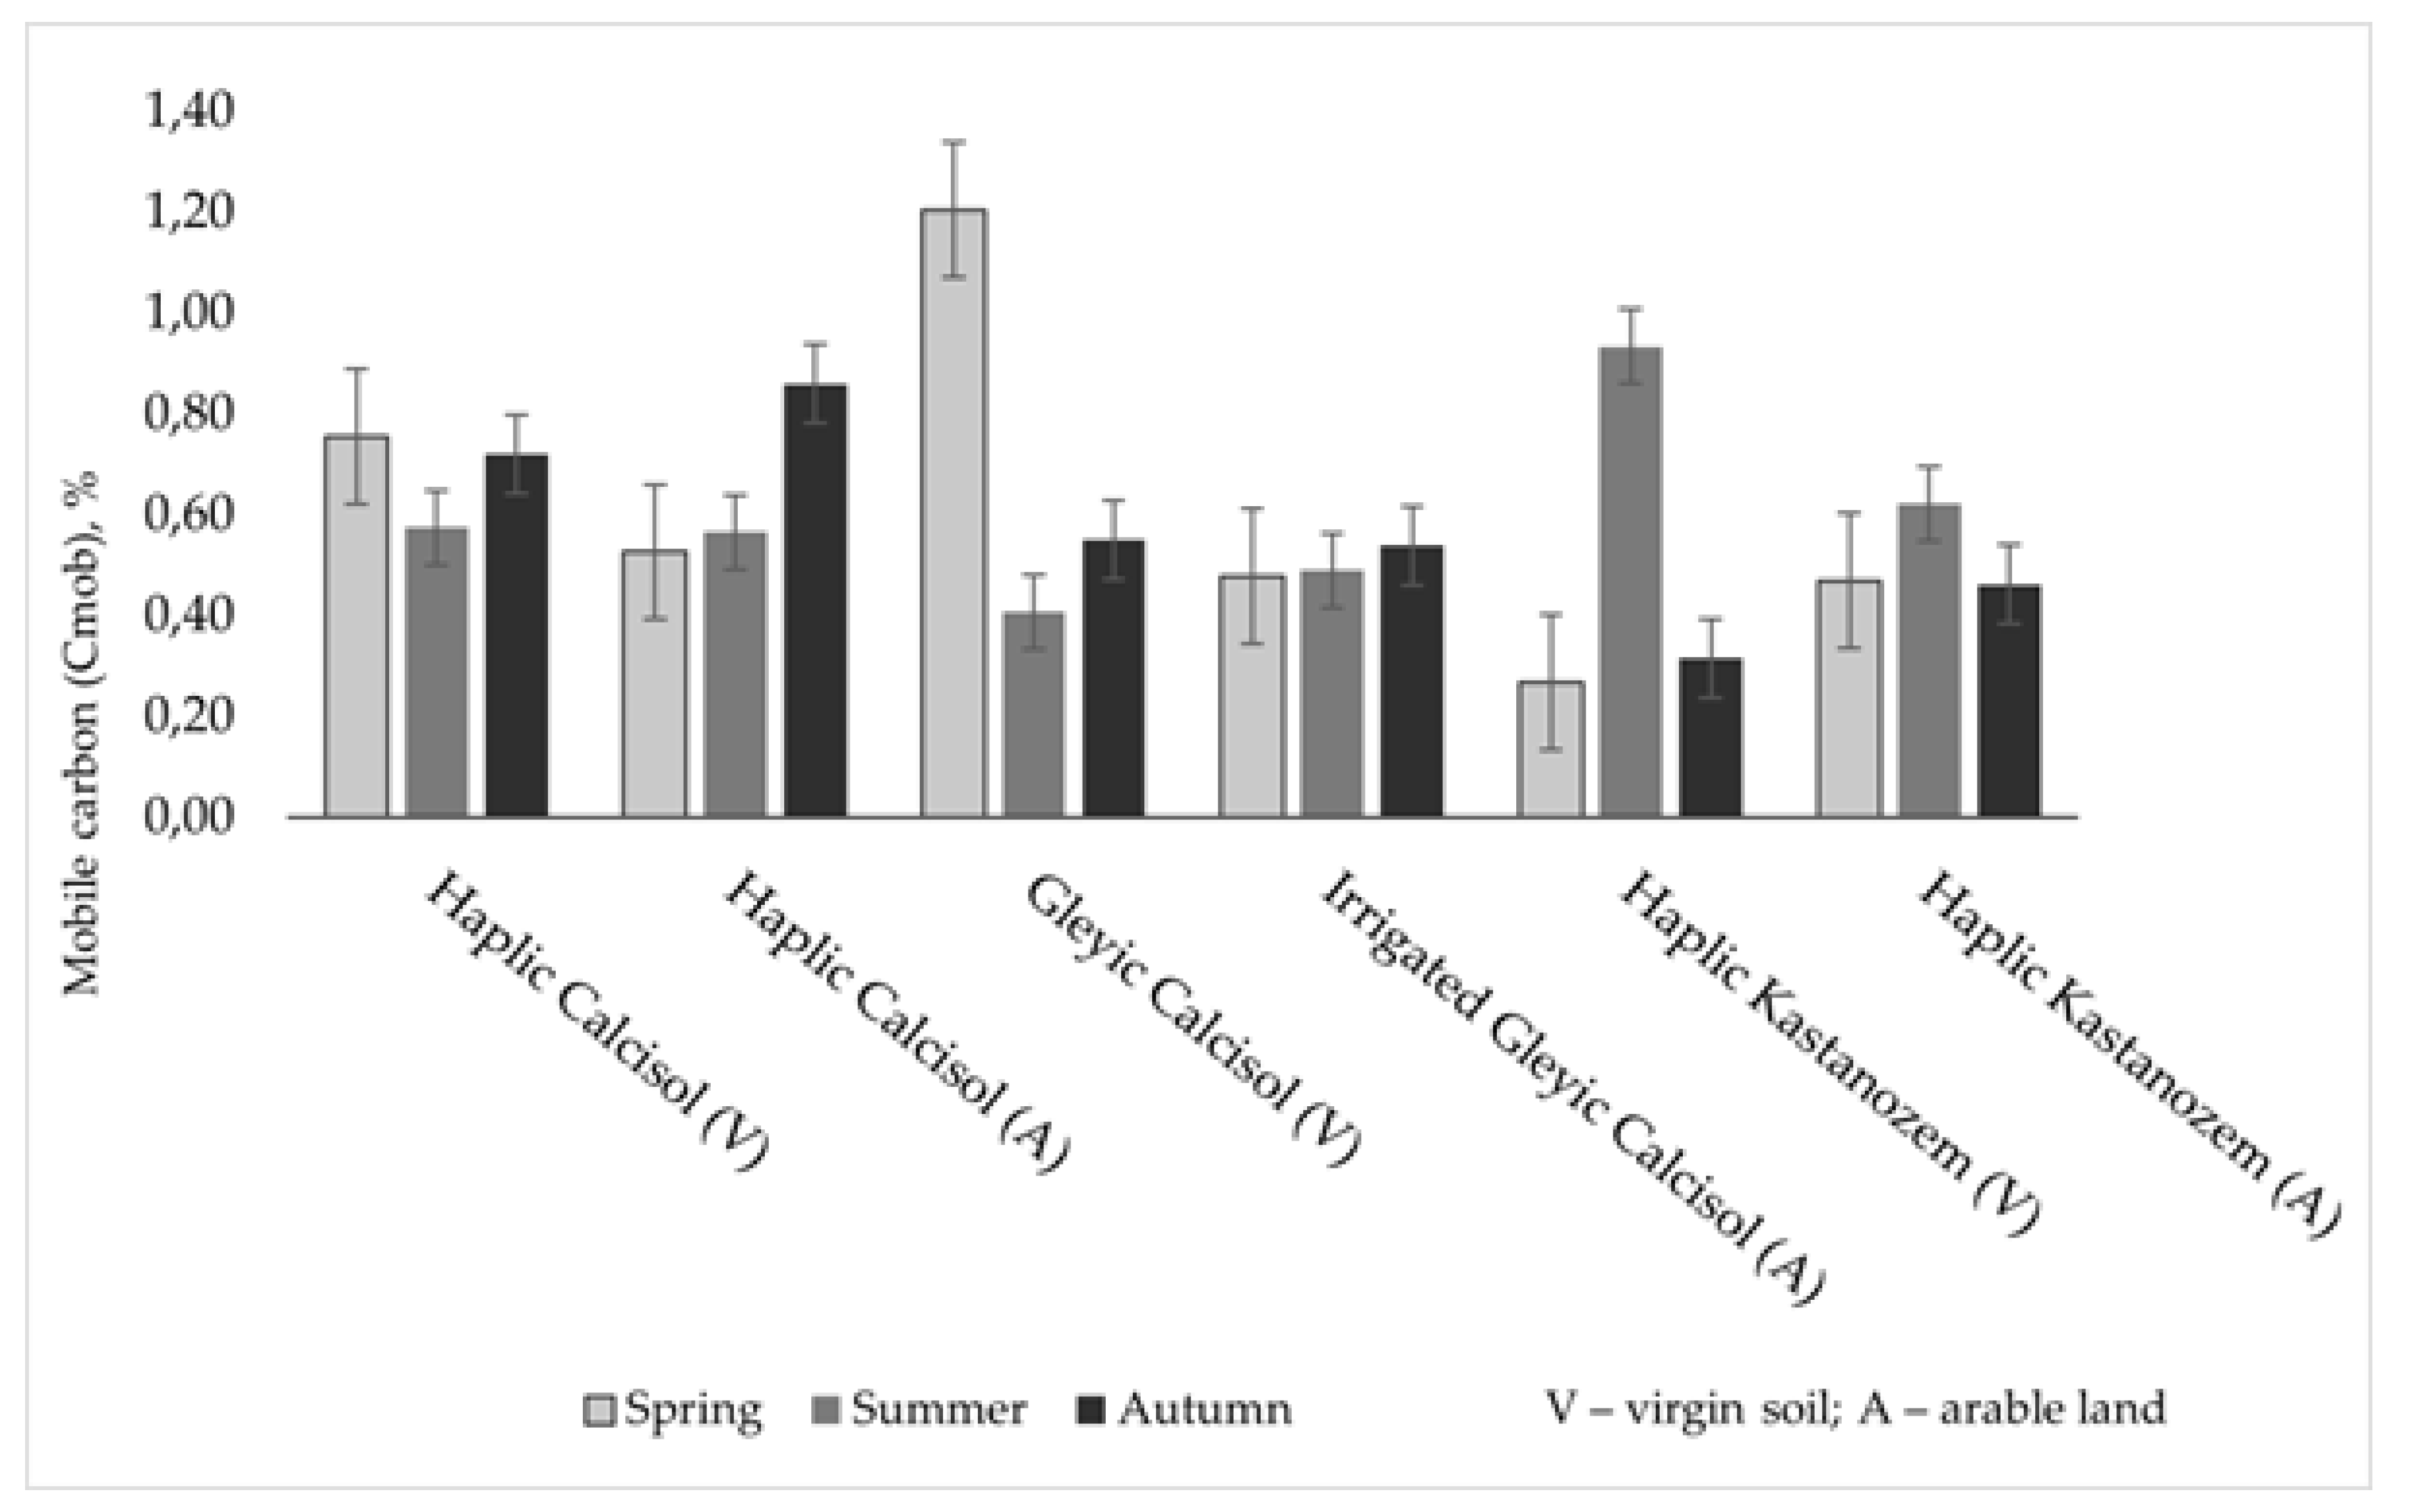
Figure 7.
Seasonal dynamics of total microbial count in studied soils under virgin and arable conditions (mean ± SD).
Figure 7.
Seasonal dynamics of total microbial count in studied soils under virgin and arable conditions (mean ± SD).
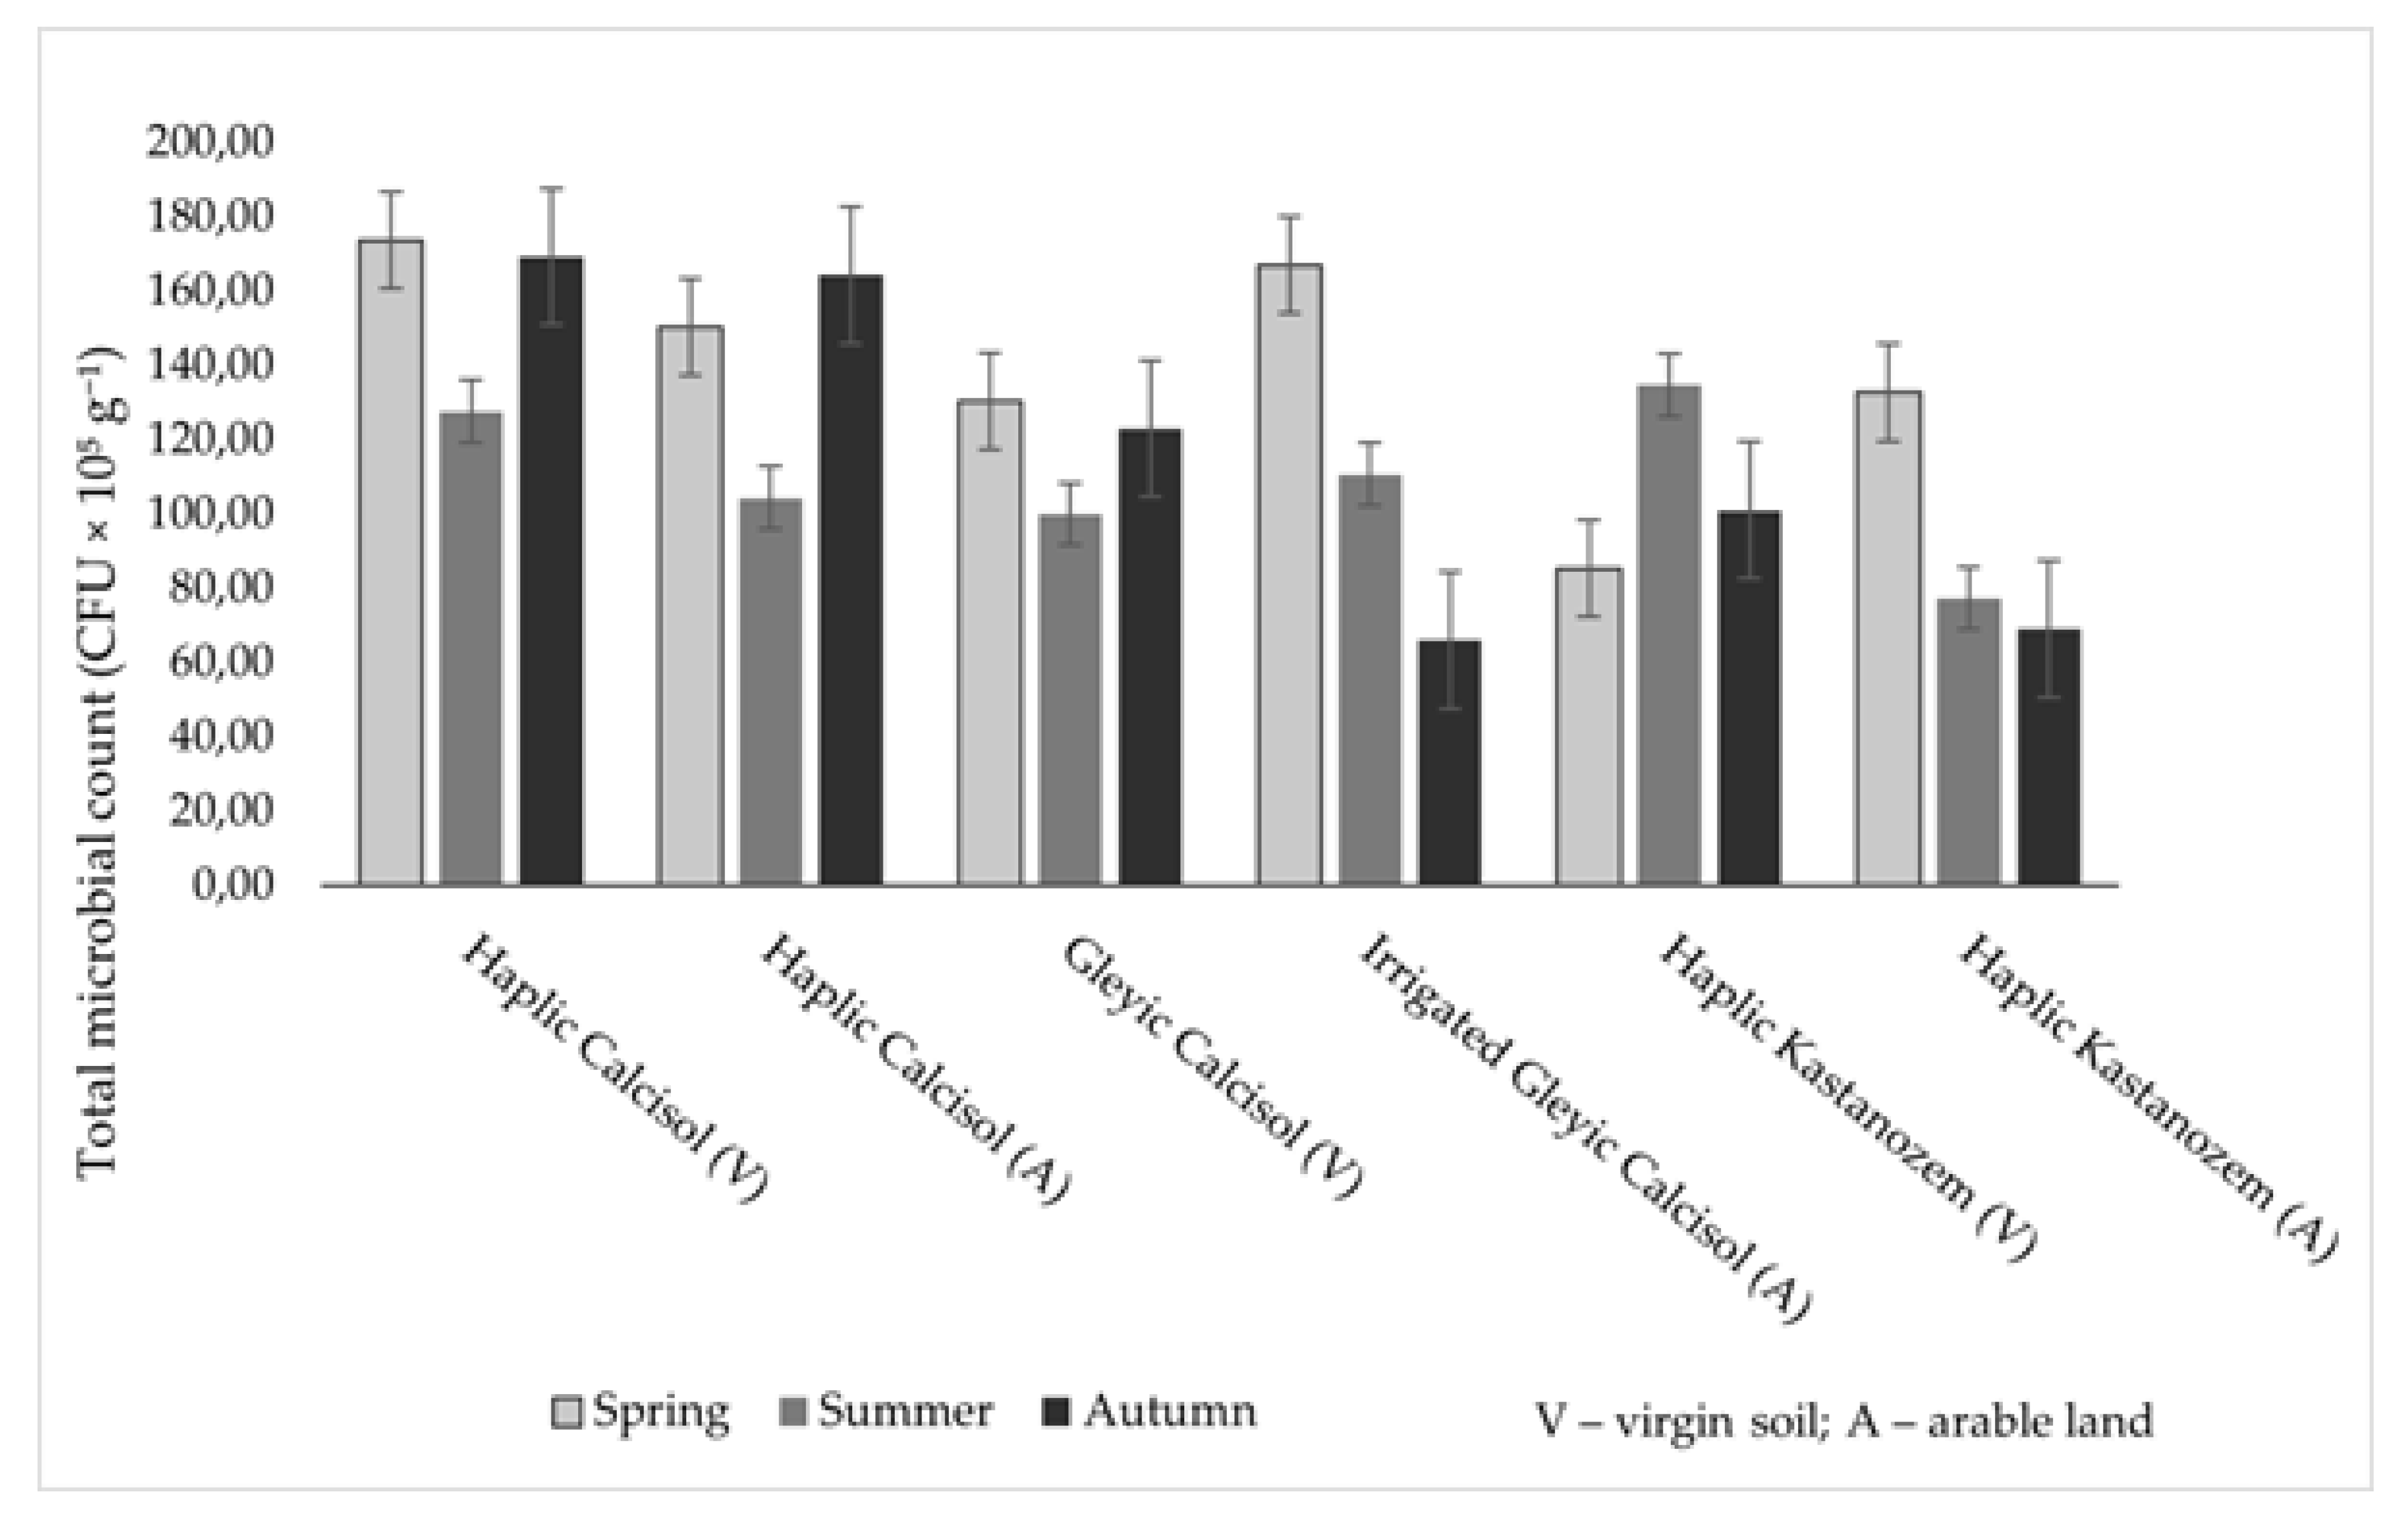
Figure 8.
Seasonal dynamics of bacterial counts on starch-ammonia agar (SAA) in studied soils under virgin and arable conditions (mean ± SD).
Figure 8.
Seasonal dynamics of bacterial counts on starch-ammonia agar (SAA) in studied soils under virgin and arable conditions (mean ± SD).
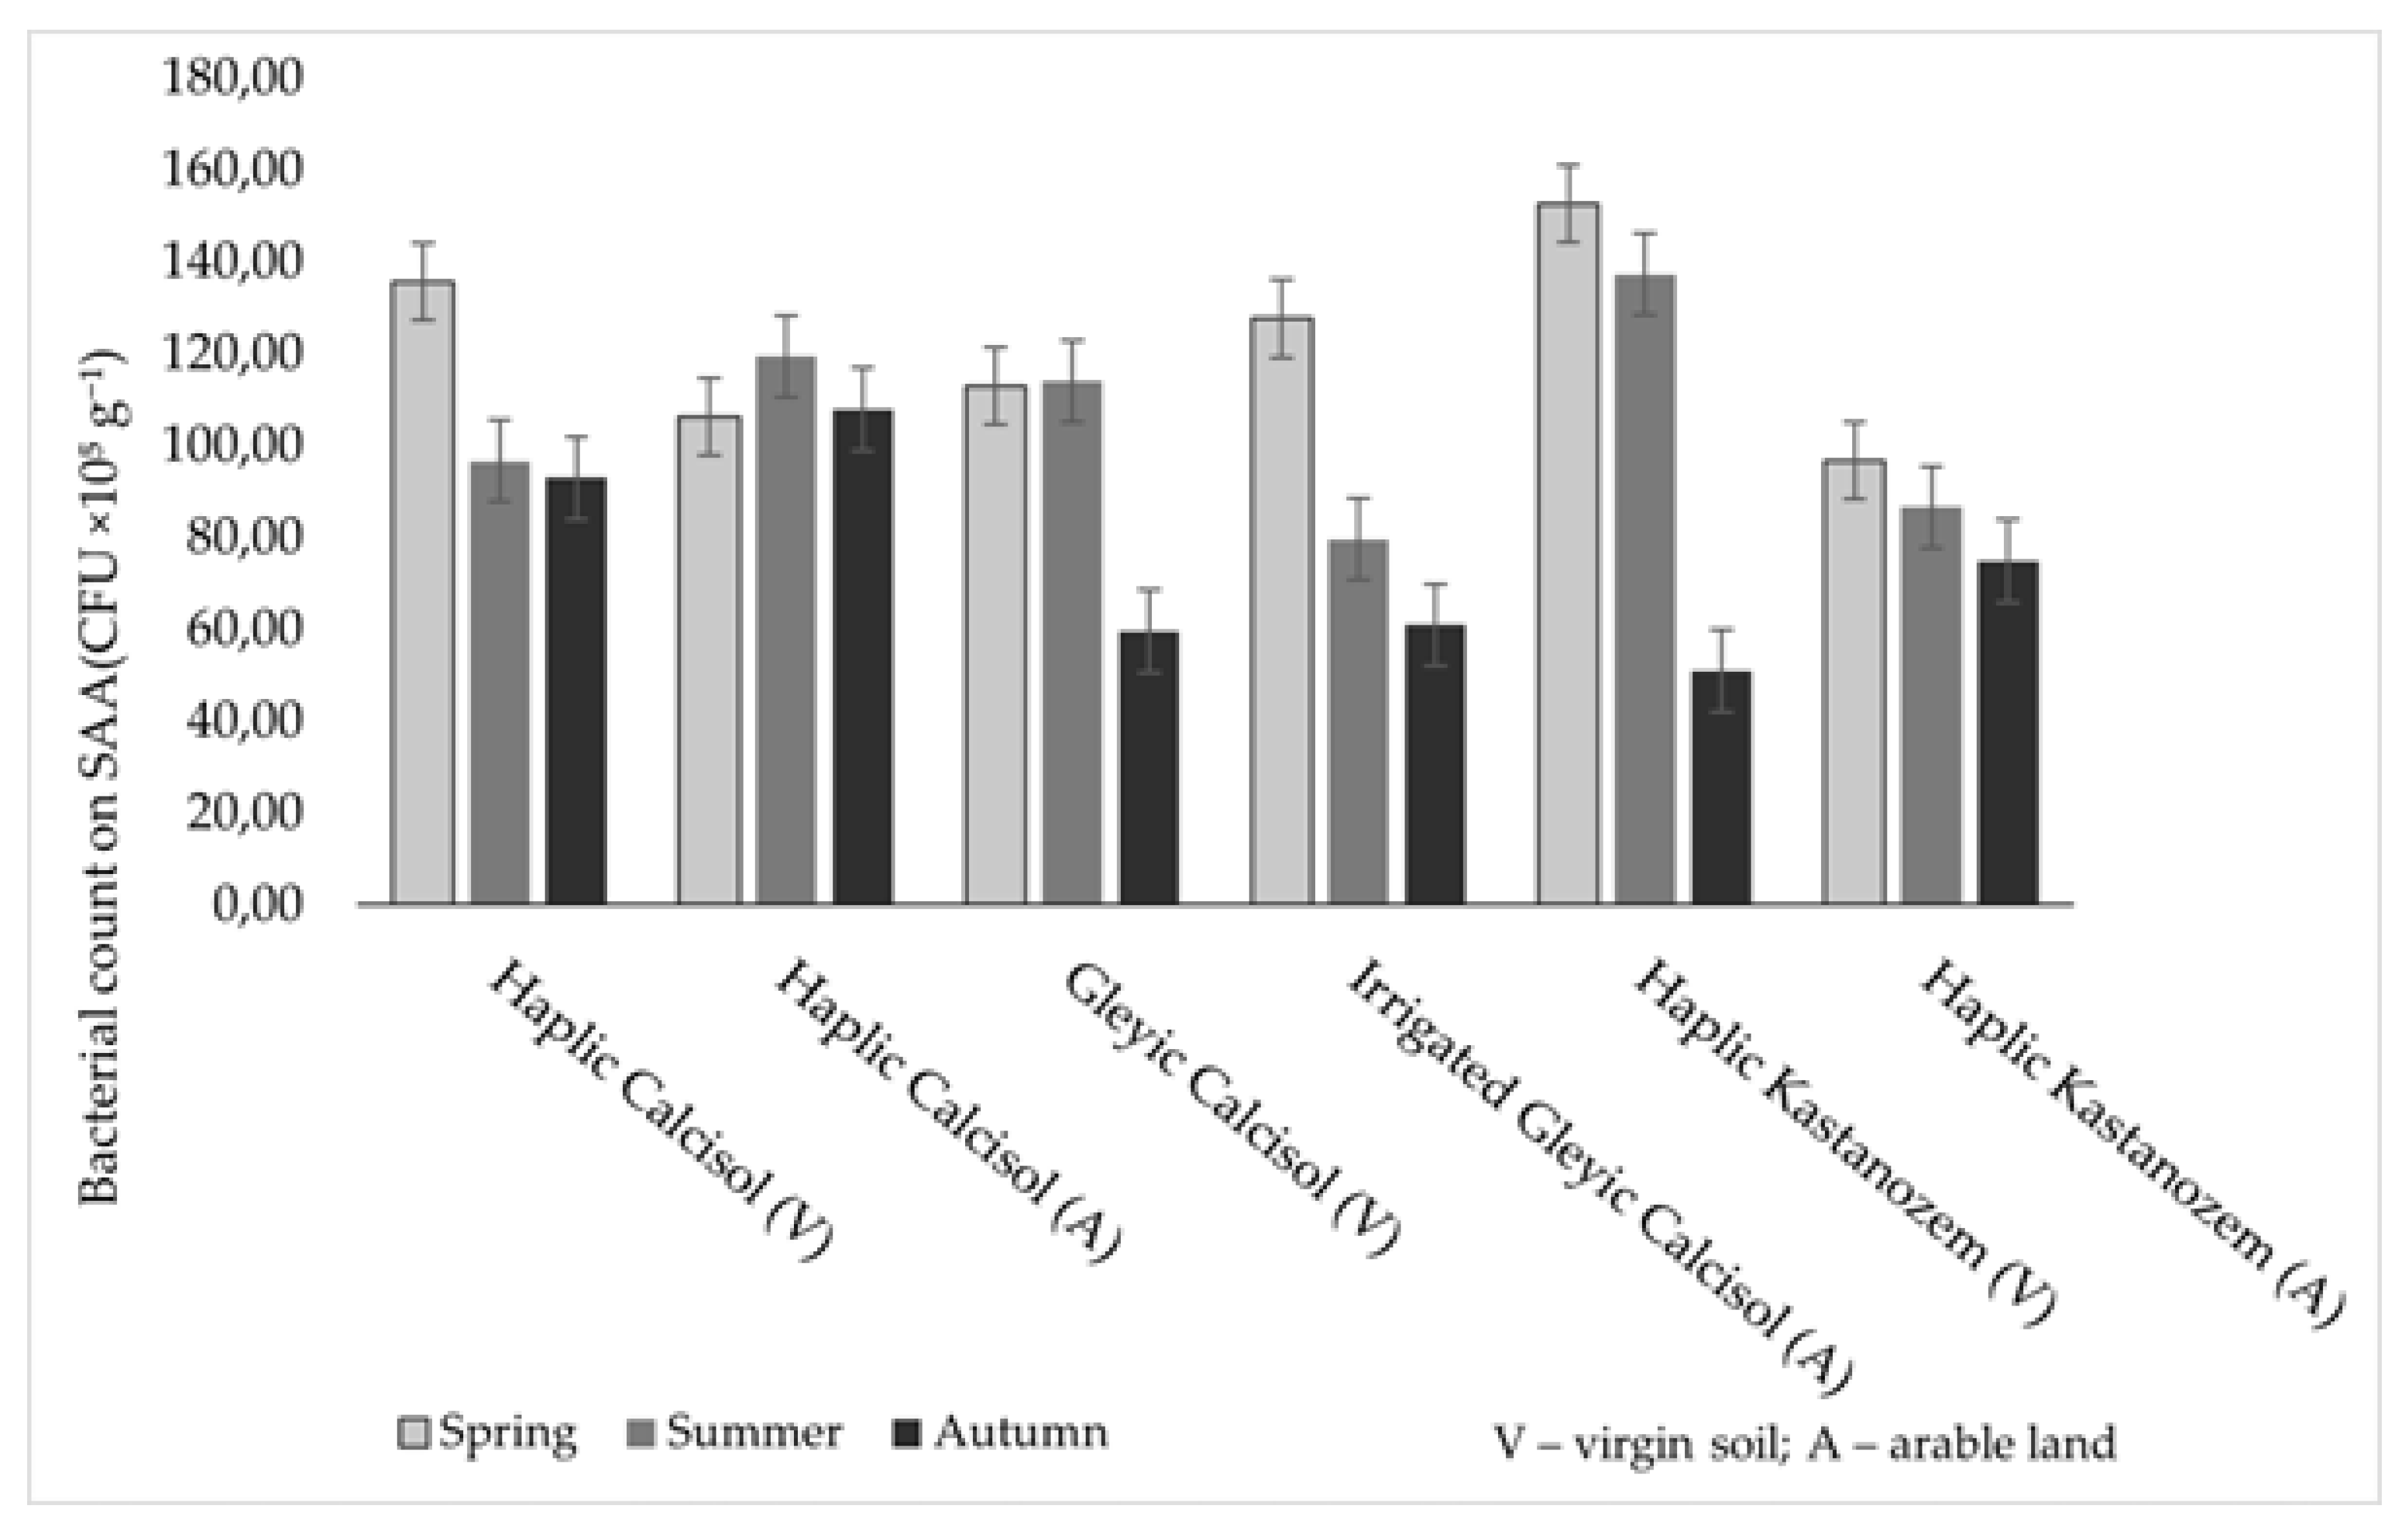
Figure 9.
Seasonal dynamics of fluorescein diacetate (FDA) hydrolytic activity in studied soils under virgin and arable conditions (mean ± SD).
Figure 9.
Seasonal dynamics of fluorescein diacetate (FDA) hydrolytic activity in studied soils under virgin and arable conditions (mean ± SD).
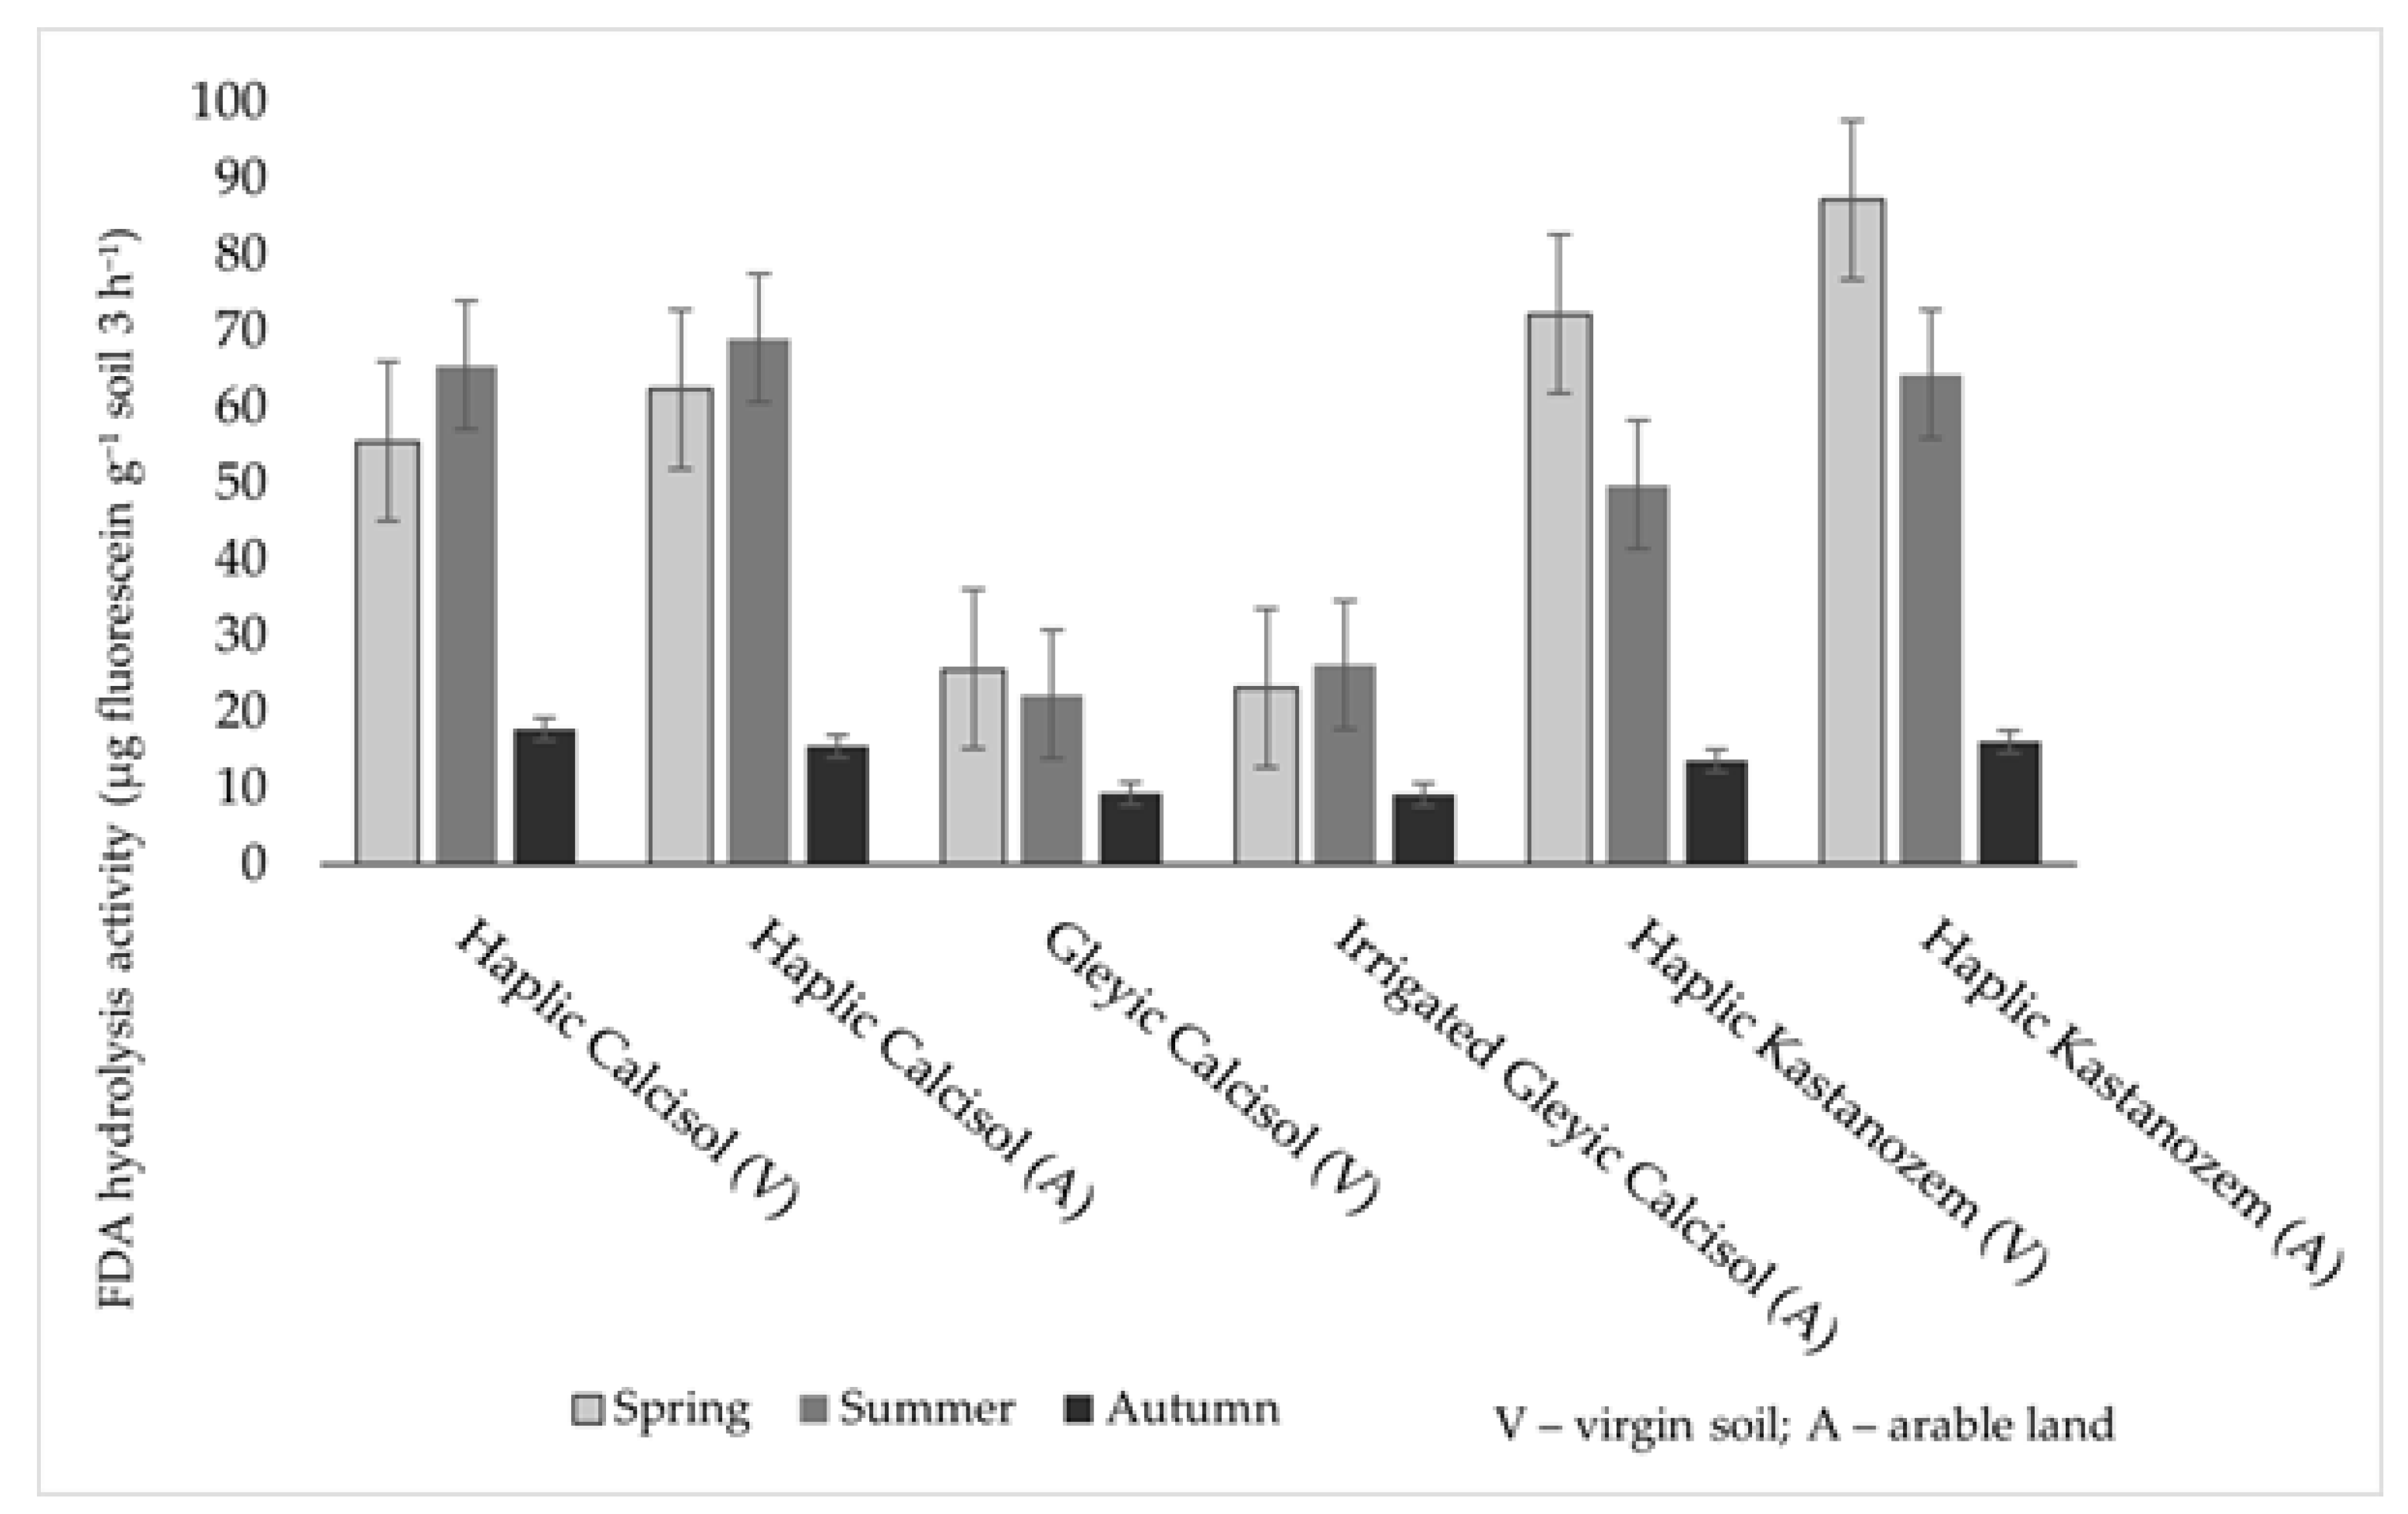
Figure 10.
Plant residue decomposition rates in studied soils under virgin and arable conditions (mean ± SD).
Figure 10.
Plant residue decomposition rates in studied soils under virgin and arable conditions (mean ± SD).
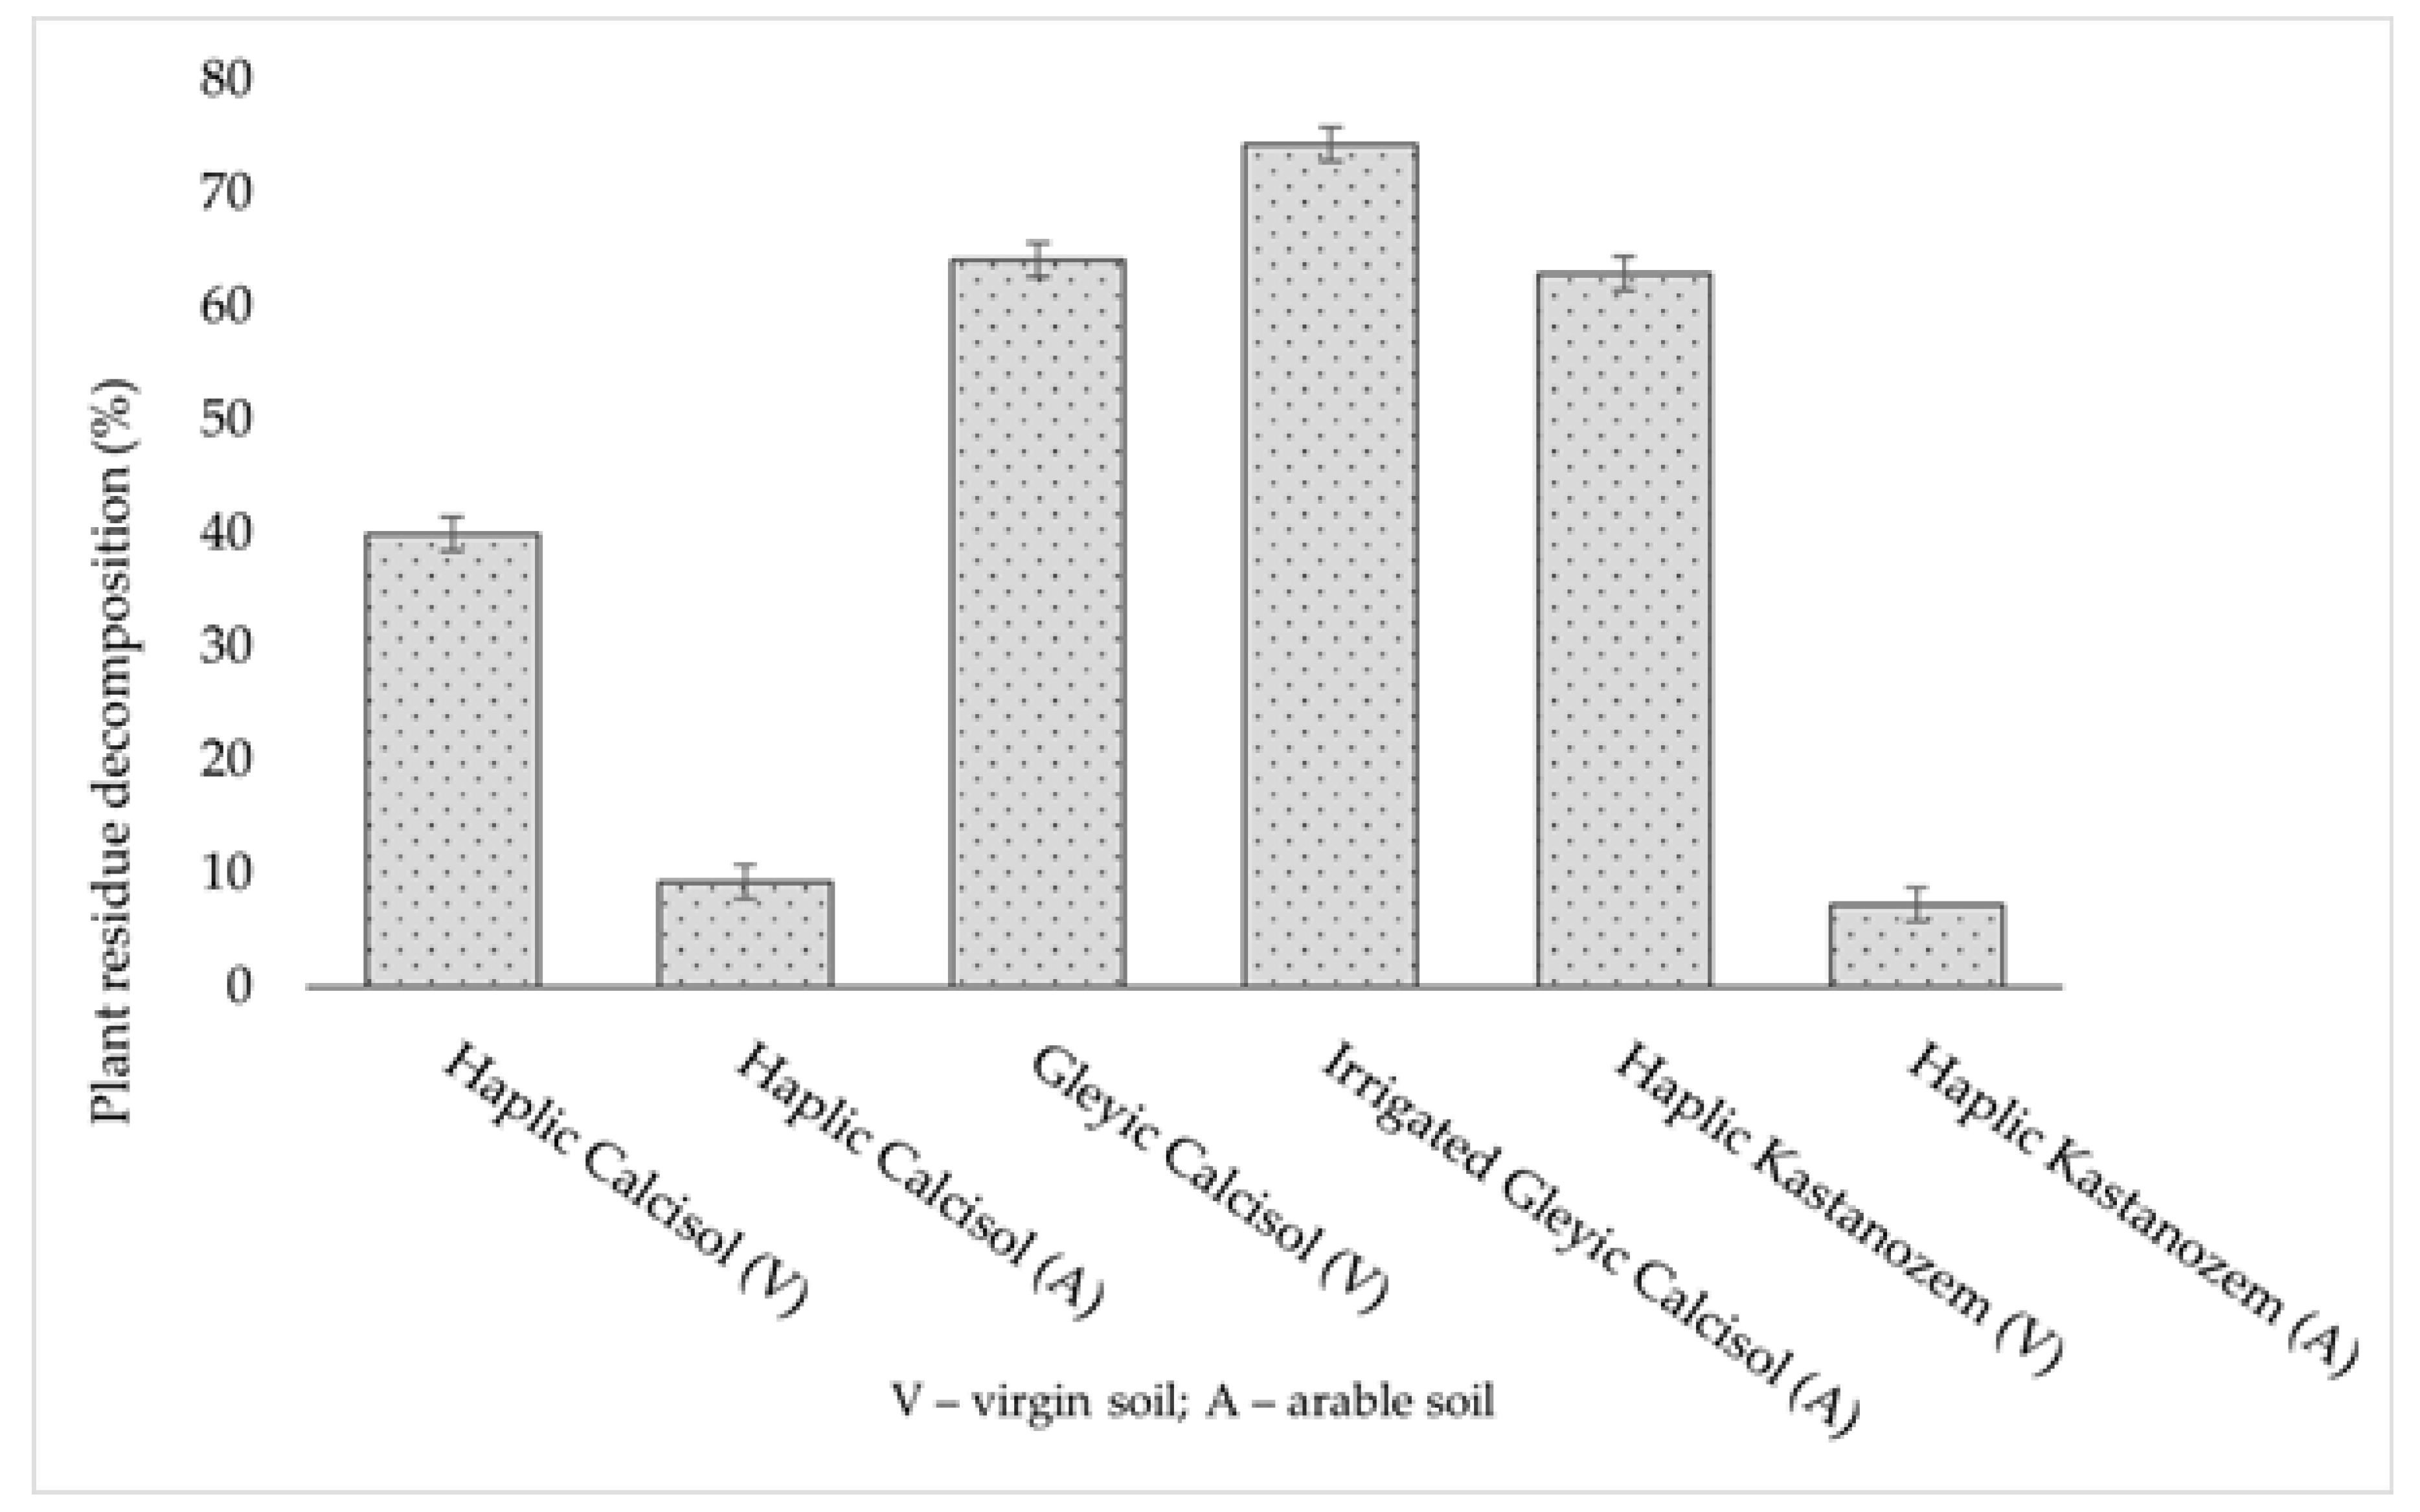
Figure 11.
Pfeiffer chromatograms of soils by season.
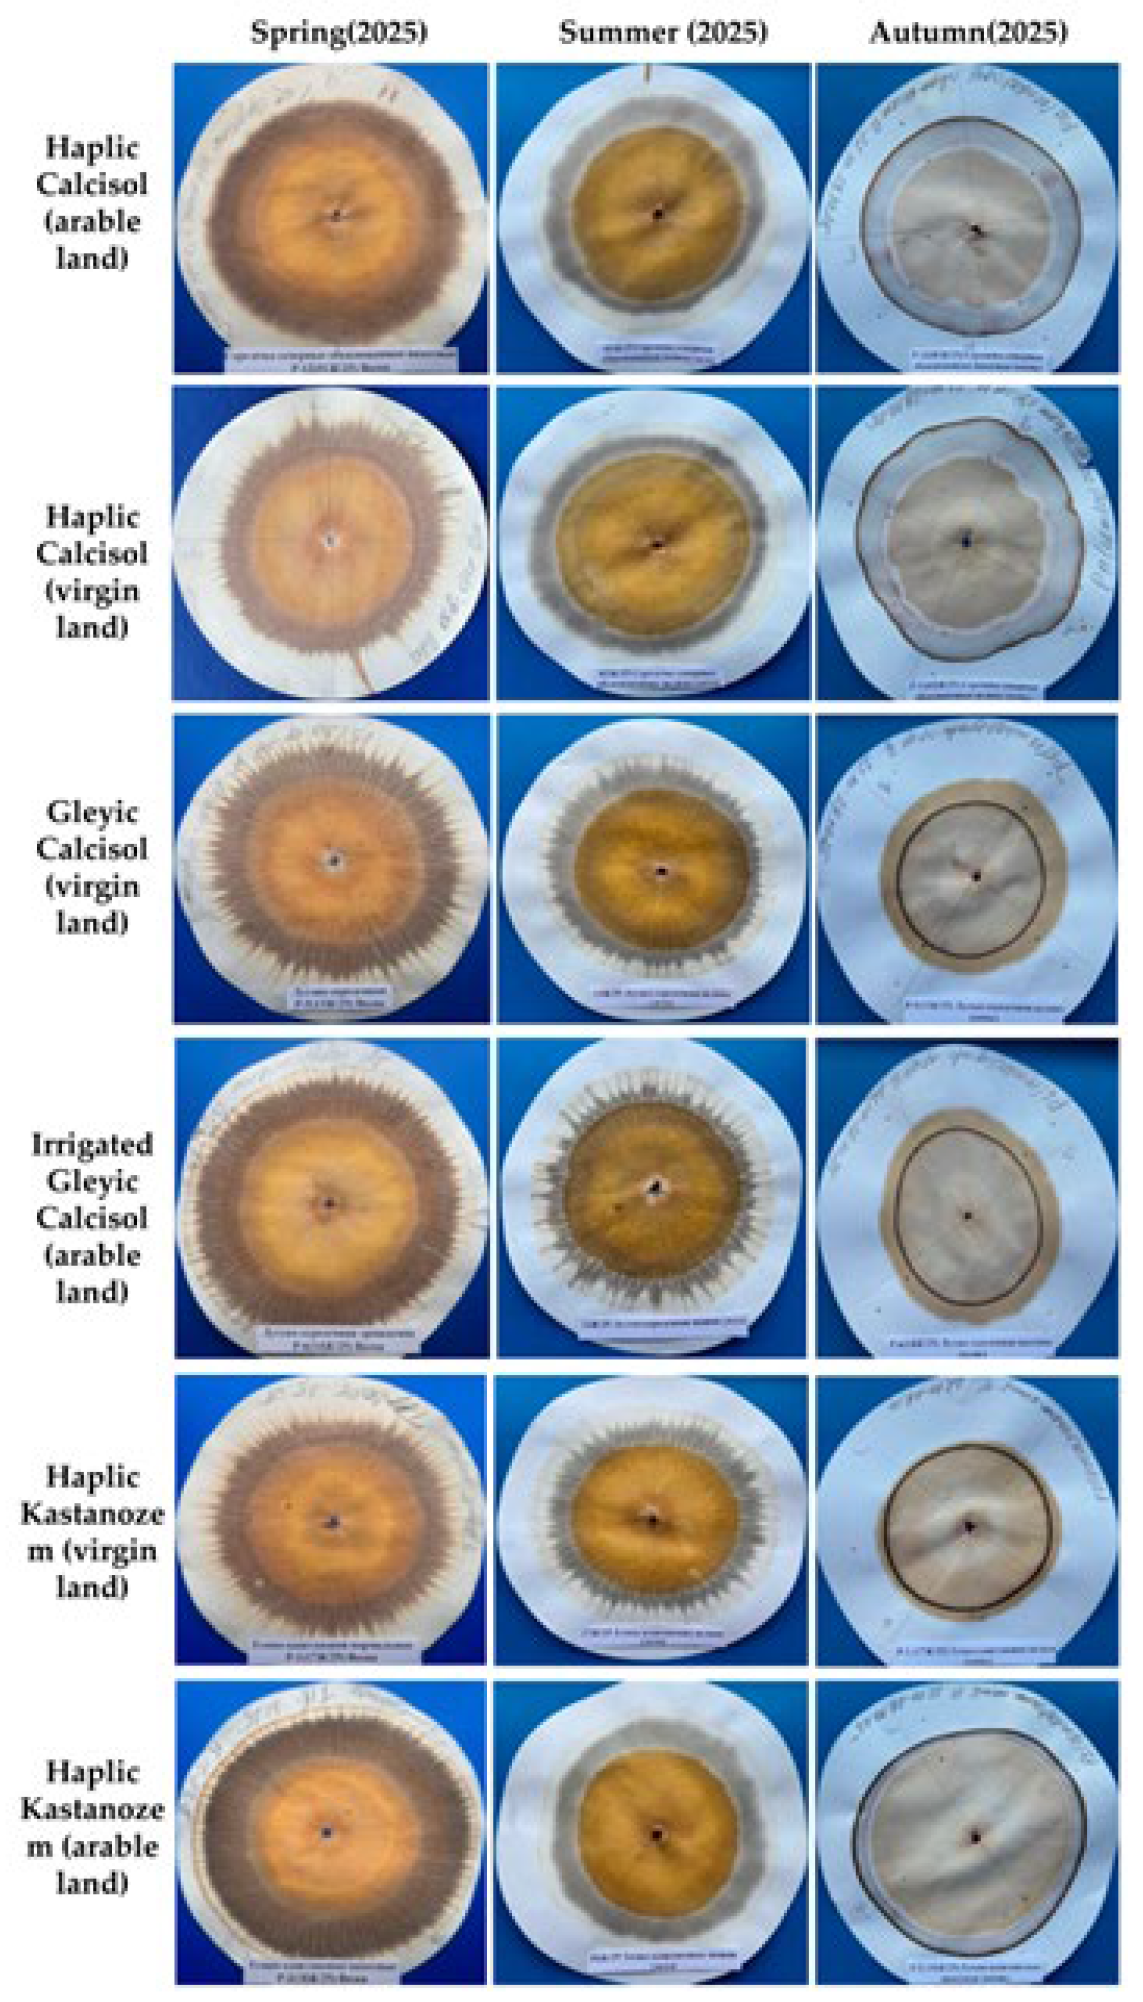
Figure 12.
Seasonal dynamics of the sum of radii of the middle and outer zones of the Pfeiffer chromatogram (mean ± SD).
Figure 12.
Seasonal dynamics of the sum of radii of the middle and outer zones of the Pfeiffer chromatogram (mean ± SD).
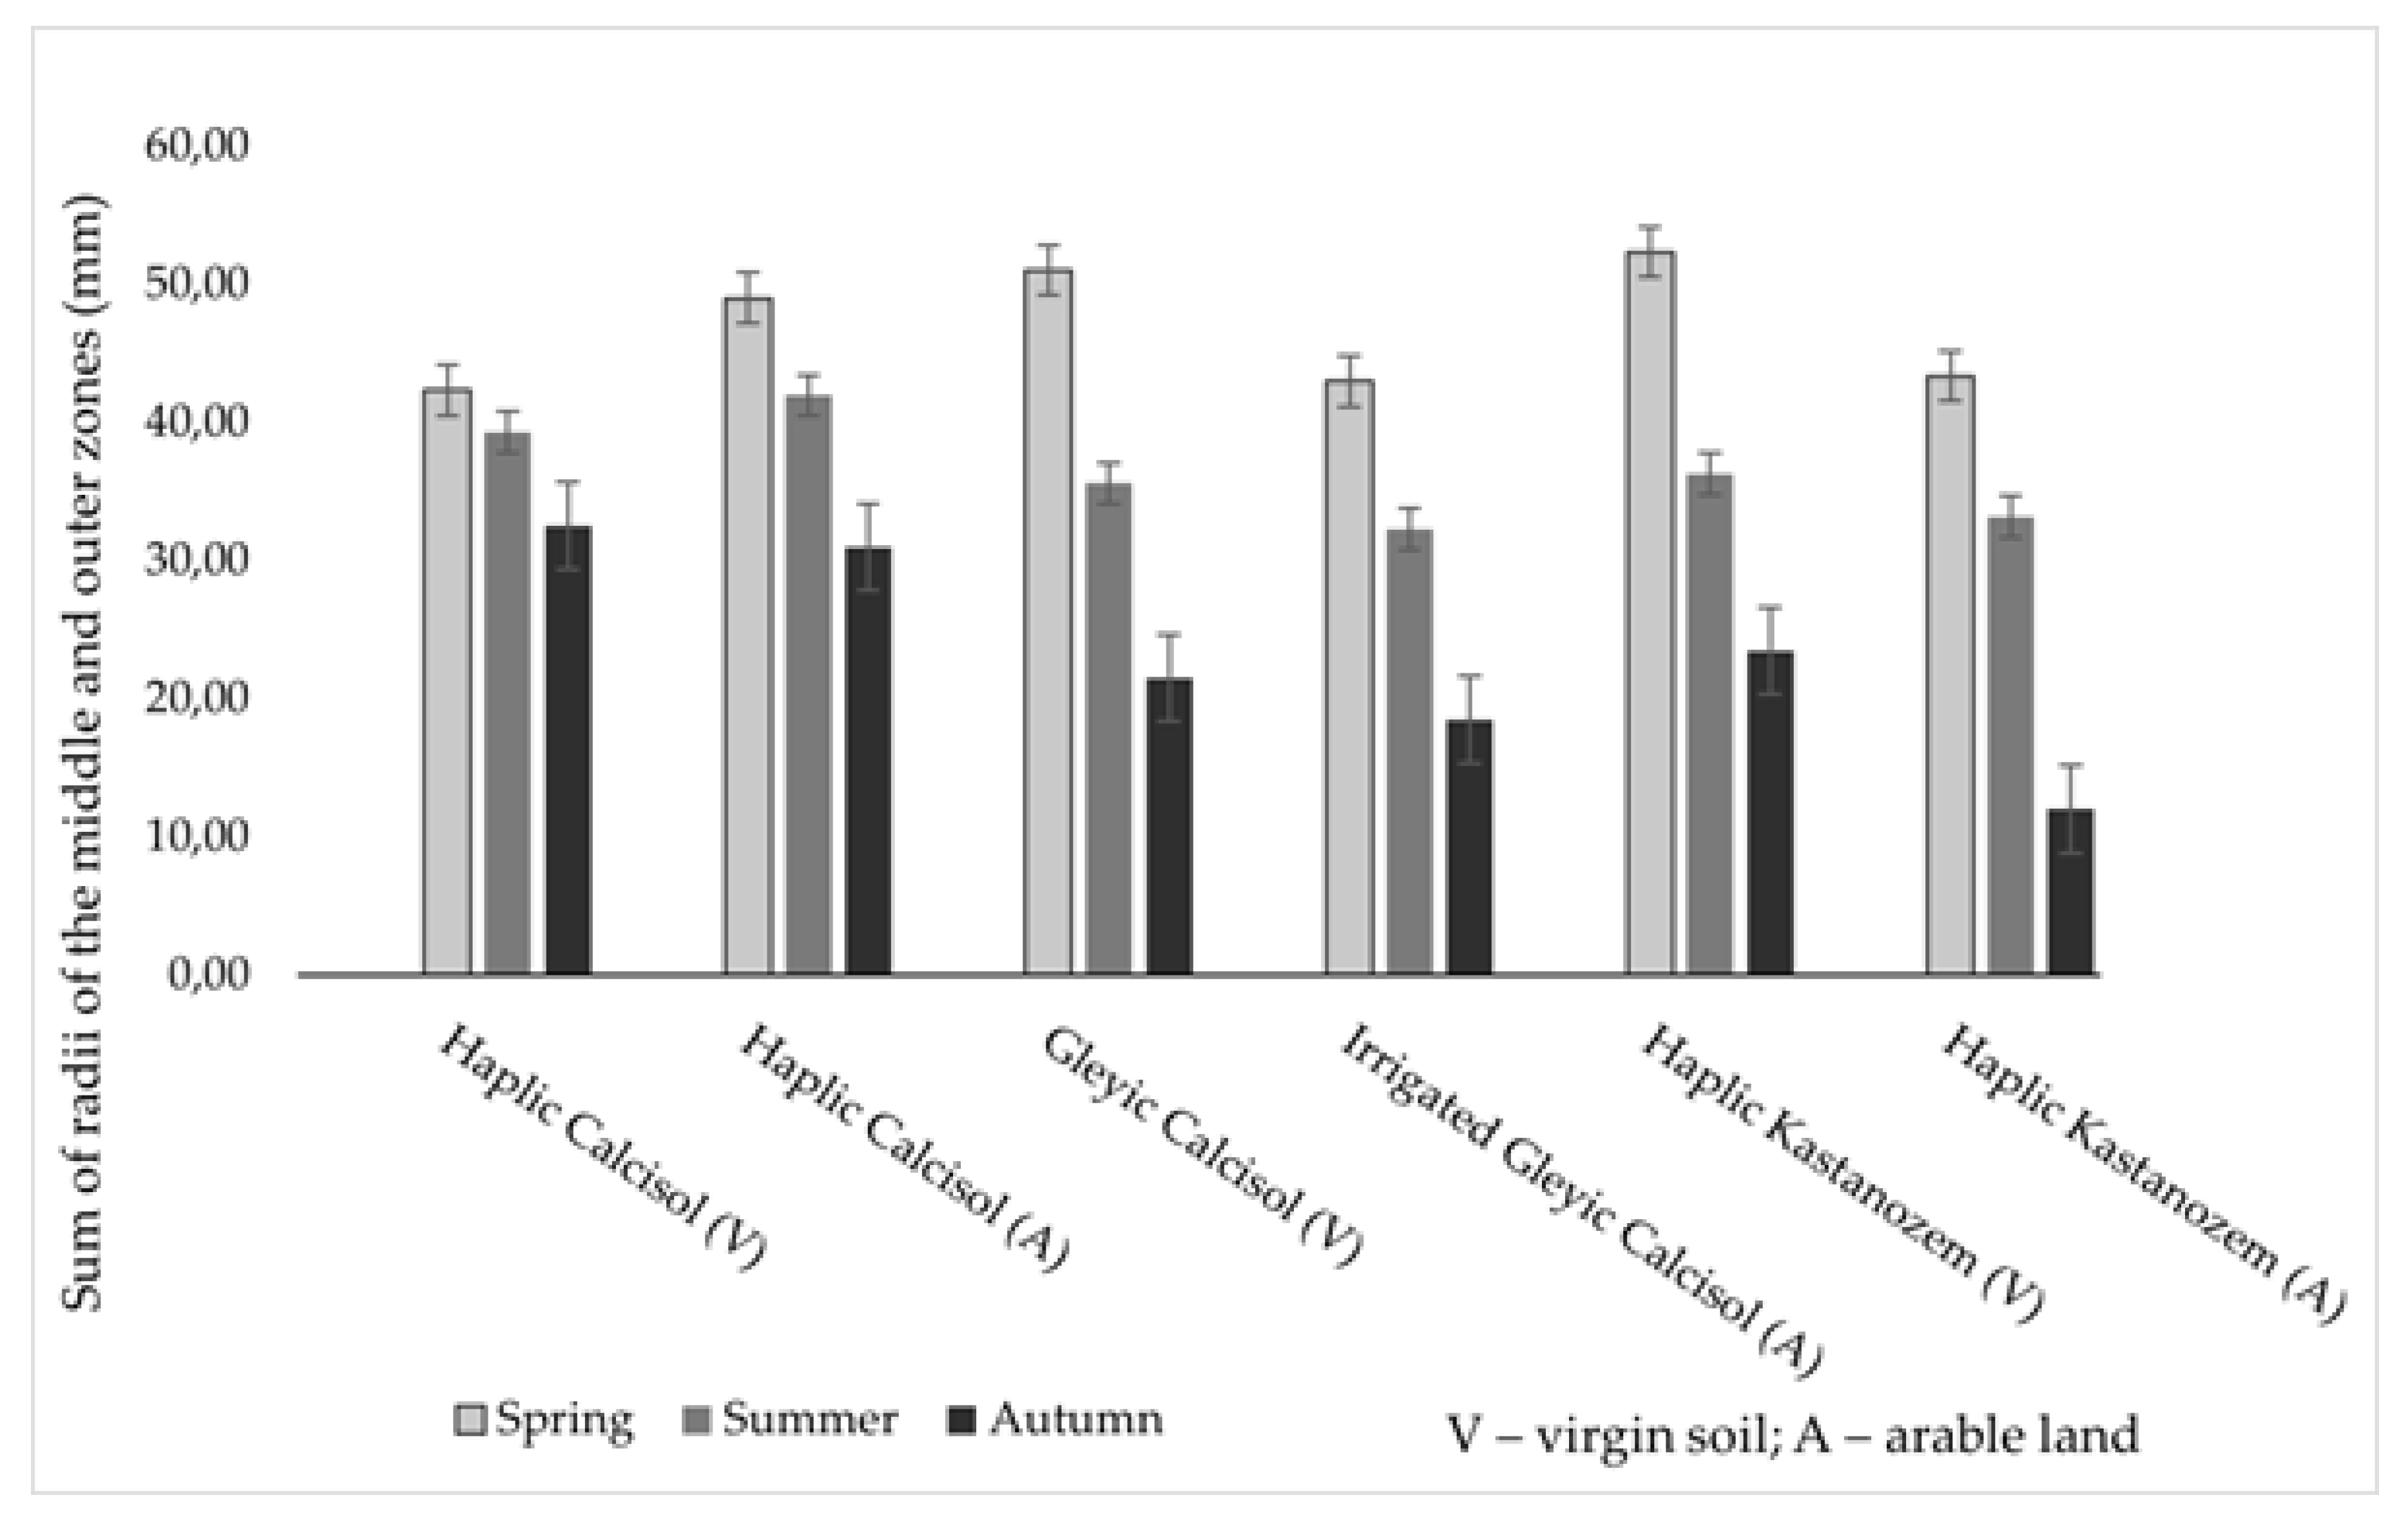
Table 1.
List of investigated soils.
| Type of soil | Coordinates: latitude/longitude |
|---|---|
| Haplic Calcisol (virgin land) | 43,14090796°/ 74,70745697° |
| Haplic Calcisol (arable land) | 43,14045198°/ 73,70786003° |
| Gleyic Calcisol (virgin land) | 43,04450601°/ 71,10864816° |
| Irrigated Gleyic Calcisol (arable land) | 43,04467399°/ 71,10836799° |
| Haplic Kastanozem (virgin land) | 42,71675097°/ 70,53462999° |
| Haplic Kastanozem (arable land) | 42,71657696°/ 70,53475203° |
Table 3.
Correlation between indicators.
| Soil variants | Soil respiration in 30 min, CO2, ppm | ||
|---|---|---|---|
| Spring | Summer | Autumn | |
| Haplic Calcisol (virgin land) | 586 | 425,0 | 143,3 |
| Haplic Calcisol (arable land) | 446 | 464,3 | 115,7 |
| Gleyic Calcisol (virgin land) | 430 | 489,7 | 87,3 |
| Irrigated Gleyic Calcisol (arable land) | 414 | 714,3 | 85,5 |
| Haplic Kastanozem (virgin land) | 423 | 443,3 | 178,8 |
| Haplic Kastanozem (arable land) | 381 | 464,3 | 155,7 |
Table 4.
Assessment of soil biogenecity by k biogenecity.
| Variant | Spring | Summer | Autumn | For the season |
|---|---|---|---|---|
| Haplic Calcisol (virgin land) | 4,87 | 7,82 | 9,77 | 22,46 |
| Haplic Calcisol (arable land) | 12,88 | 14,23 | 11,33 | 38,44 |
| Gleyic Calcisol (virgin land) | 5,84 | 8,57 | 24,60 | 39,01 |
| Irrigated Gleyic Calcisol (arable land) | 38,57 | 13,29 | 9,43 | 61,29 |
| Haplic Kastanozem (virgin land) | 3,01 | 8,78 | 11,88 | 23,67 |
| Haplic Kastanozem (arable land) | 7,24 | 15,47 | 4,60 | 27,31 |
Table 5.
Coefficient of transformation of soil organic matter, (n=3).
| Variants | spring | summer | autumn | |||
|---|---|---|---|---|---|---|
| CAA/ MPA/ |
Type of OM transformation | CAA/ MPA/ |
Type of OM transformation | CAA/ MPA/ |
Type of OM transformation | |
| Haplic Calcisol (virgin land) | 0,78 | Mineralization | 0,76 | Mineralization | 0,55 | Mineralization |
| Haplic Calcisol (arable land) | 0,71 | Mineralization | 1,15 | accumulative | 0,66 | Mineralization |
| Gleyic Calcisol (virgin land) | 0,87 | Mineralization | 1,14 | accumulative | 0,49 | Sharply mineralized |
| Irrigated Gleyic Calcisol (arable land) | 0,76 | Mineralization | 0,72 | Mineralization | 0,92 | Mineralization |
| Haplic Kastanozem (virgin land) | 1,79 | accumulative | 1,02 | accumulative | 0,50 | Mineralization |
| Haplic Kastanozem (arable land) | 0,73 | Mineralization | 1,12 | accumulative | 1,09 | accumulative |
Table 6.
Coefficient of transformation of soil organic matter, (n=3).
| Soil types | spring | summer | autumn | amount |
|---|---|---|---|---|
| Haplic Calcisol (virgin land) | 100,00 | 96,24 | 96,42 | 292,67 |
| Haplic Calcisol (arable land) | 74,68 | 94,40 | 99,99 | 269,08 |
| Gleyic Calcisol (virgin land) | 78,81 | 84,95 | 53,47 | 217,22 |
| Irrigated Gleyic Calcisol (arable land) | 74,27 | 80,56 | 48,91 | 203,74 |
| Haplic Kastanozem (virgin land) | 81,95 | 100,00 | 66,44 | 248,39 |
| Haplic Kastanozem (arable land) | 66,54 | 72,31 | 78,50 | 217,34 |
Table 7.
Comparative agroecological characteristics of virgin and arable soils according to the iAgroInnApp platform.
Table 7.
Comparative agroecological characteristics of virgin and arable soils according to the iAgroInnApp platform.
| Soil type (WRB) | Use | Score in CASH system | Key limitations | The main risk |
|---|---|---|---|---|
| Haplic Calcisol | virgin land | 46 | Low SOC, low AWC, compaction | Deflation, de-humification |
| Gleyic Calcisol | 47 | Aridity, low SOC, low AWC | Biological exhaustion | |
| Haplic Kastanozem (slope) | 52 | Slope, medium SOC, unstable moisture | Water erosion | |
| Haplic Calcisol | arable land | 43 | Very low SOC, erosion, low AWC | Erosion + dehu-mification |
| Gleyic Calcisol | 47 | Low SOC, unstable water regime | Degradation under load | |
| Haplic Kastanozem (slope) | 51 | AWC Low SOC, slope, low AWC |
Erosive degradation |
Disclaimer/Publisher’s Note: The statements, opinions and data contained in all publications are solely those of the individual author(s) and contributor(s) and not of MDPI and/or the editor(s). MDPI and/or the editor(s) disclaim responsibility for any injury to people or property resulting from any ideas, methods, instructions or products referred to in the content. |
© 2026 by the authors. Licensee MDPI, Basel, Switzerland. This article is an open access article distributed under the terms and conditions of the Creative Commons Attribution (CC BY) license (http://creativecommons.org/licenses/by/4.0/).
Copyright: This open access article is published under a Creative Commons CC BY 4.0 license, which permit the free download, distribution, and reuse, provided that the author and preprint are cited in any reuse.