

Submitted:
14 May 2026
Posted:
15 May 2026
You are already at the latest version
Abstract
We studied the Stokes signals generated by the Raman photoexcitation of dissolved oxygen in water. When a water sample is pumped with intense nanosecond radiation, Stokes signals of different origins are generated. These signals form a characteristic nonlinear diffraction pattern, exhibiting a central spot and concentric rings whose radii depend on the Stokes wavelengths. Most of the Stokes signals correspond to the stretching vibrations of water molecules. However, we also observed a small contribution from dissolved oxygen molecules. This contribution can be separated from the others using appropriate spectroscopic filters and analyzed with a spectrometer. We report on Stokes components assigned to singlet oxygen excitation detected in the central spot, as well as in the diffraction pattern’s ring structure. The signal detected from the ring exhibits a single peak, while that from the ring itself shows a two-peak structure. The two observed peaks are interpreted as Stokes signals corresponding to Raman transitions to the two lowest vibrational sublevels of the singlet-oxygen electronic state. We also report exponential growth in the Stokes signal, in agreement with the standard stimulated Raman theoretical model.
Keywords:
Raman spectroscopy
; singlet oxygen photoexcitation
; singlet oxygen Raman spectrum
1. Introduction
Singlet oxygen (1O2) is a reactive oxygen species (ROS) widely used in photochemistry, photobiology, and photomedicine [1,2,3,4,5,6]. It corresponds to the lowest excited electronic level of the oxygen molecule. 1O2 excitation by direct photon absorption is not effective since the dipolar transition from ground to the 1O2 state is heavily forbidden by quantum mechanics selection rules. Photosensitizing is the commonly accepted 1O2 excitation method [7,8]. A large molecule that can absorb visible photons accumulates part of the absorbed energy in a metastable triplet state; from there, the energy can be transferred to oxygen molecules for 1O2 excitation. We have reported a new Raman-based, photosensitizer-free method for 1O2 photoexcitation [9]. A pumping photon generates a Stokes photon of lower energy, inducing the transition from the ground state to the 1O2 level. The energy difference between the two photons corresponds to the 1O2 energy level. We demonstrated the Raman character of the observed 1O2 Stokes signal, measured the 1O2 phosphorescence at 1270 nm, and determined the efficiency of the 1O2 Raman photoexcitation [10,11,12]. In stimulated Raman experiments on liquids such as water, the Stokes signals exhibit a characteristic diffraction pattern with a central spot and a system of rings [10,13]. Stokes signals corresponding to the solvent’s vibration modes overlap with the 1O2 Stokes in both parts of the diffraction pattern, making detection difficult. However, Stokes photons from water usually have lower energy than those from 1O2, making it possible to separate the contributions using long-pass spectroscopic filters. Furthermore, the oxygen Stokes peaks are of electronic origin and exhibit a wide spectral width of tens of nanometers. Meanwhile, the solvent Stokes peaks have a spectral width one order of magnitude smaller [9]. This significant difference helps identify peaks and separate them from one another.
The spectral response of molecular oxygen’s lowest electronic levels has been studied in detail for over a century. Analyzing the atmospheric absorption of solar radiation, Herzberg reported peaks at 1268 and 1067 nm [14,15]. The peaks were assigned to the absorption bands corresponding to transitions from the ground state to the two lowest vibrational modes of the 1O2 state. The results were confirmed by Ellis and Kneser in their study of the absorption of light by liquid oxygen [16]. Details of molecular oxygen spectra were discussed in later reviews [17,18]. More recent studies have reported the same spectral absorption peaks for molecular oxygen dissolved in solvents [19,20,21].
The aim of the present study was to demonstrate that examining the spectral properties of the Raman diffraction pattern enables access to details of the Raman photoexcitation of oxygen molecules. In particular, we observed Stokes components corresponding to the excitation of the two lowest vibrational sublevels of the 1O2 state in agreement with previous absorption studies. The novelty lies in the fact that the peaks are Stokes signals in the visible spectrum, generated during the excitation of molecular oxygen via a stimulated Raman process. The presence of both peaks confirms the oxygen origin of the reported Stokes signals, since only the oxygen molecule can exhibit such a spectral response.
2. Theoretical Considerations
Figure 1 shows the schematic of the first two vibrational sublevels, 1O2(0) and 1O2(1), of the 1O2 electronic state, as established by the studies cited above. 1O2(0) lies 0.97 eV from the ground, which corresponds to the energy of a photon of 1270 nm in wavelength. 1O2(1) is at 1.16 eV, which corresponds to the energy of a photon of wavelength 1067 nm. Both states have rotational sub-levels that are not indicated in the figure. Raman excitation generates Stokes signals for these two levels. For example, when pumping at 411 nm, Stokes signals at 607 and 668 nm are expected. Anti-Stokes components are also generated in the ultraviolet (UV) region of the spectrum, but this contribution is generally small for the pulse energies used in the experiments.
Stimulated Raman corresponds to the interaction between Stokes and anti-Stokes photons with molecular involvement. Basic theory of the effect shows that there are two kinds of stimulated Raman scattering signals: one set of signals propagates in the direction of the excitation beam, and another set forms an angle with respect to this direction [24,25]. As a result, the stimulated Raman interaction-induced diffraction pattern shows a central spot and concentric rings [14].
As discussed in the Introduction, the Stokes signal experiences exponential gain with increasing propagation distance, while the anti-Stokes beam exhibits losses. In the approximation of a large constant pump field, the gain is [25]
where is the Stokes wavelength, is the third-order Raman susceptibility at , is the refraction index at , is the pump intensity, is the speed of light, and is the vacuum permittivity.
The ring Raman diffraction pattern ring’s structure corresponds to the phase-matching condition given by the following equation [13]
where , , and are the wavevectors of the pump, Stokes, and anti-Stokes fields, respectively, and are the pump and anti-Stokes wavelengths, respectively, and , , and are the refraction indexes at , , and , respectively. Equation (2) defines the propagation angle of these Stokes components. Additional deviation can take place due to the nonlinear refraction induced by the same Raman effect [13]. As indicated by equation (2), the radii of the rings depend on the wavelength of each of the fields. Thanks to this, the procedure for separating and identifying different Stokes components becomes less cumbersome. In the Experimental Section, we take advantage of this fact, allowing us to identify the Stokes signals corresponding to the Raman transition to the 1O2 electronic state vibrational sublevels (0) and (1).
3. Materials and Methods
Figure 2 shows a schematic of the experimental setup. An optical parametric oscillator (OPO, OPOTEK, Carlsbad, CA, USA) provides the pump beam. The device generates 5-nanosecond pulses with an average energy of 20 mJ at 10 Hz. We used a pump wavelength of 411 nm. A 20-cm-focal-length lens focused the pumping light onto the sample. We estimated a waist beam radius of 5.2 mm and a Rayleigh range of 20 cm. The sample was distilled water in a 20-cm path-length glass cuvette. A long-pass filter (LPF) selects light matching the 1O2 Stokes contribution. We used an LPF with a cut-off wavelength of 600 nm. The filter removed all Stokes contributions from the solvent molecules, leaving only those from dissolved oxygen molecules [9,10]. As a result, a red-colored Raman diffraction pattern with a central spot and a ring appeared at the cuvette’s exit. Neutral density filters (NDFs) were used to control the intensity of this light and prevent saturation of the detection system. The pattern was analyzed using a spectrometer (Ocean Optics USB 2000, Orlando, FL, USA) connected to an optical fiber (OF). We placed the optical fiber’s entrance coupler 12 cm from the pump waist position. At that distance, the ring’s radius was about 11 mm and the coupler’s entrance diameter 1 mm.
We collected spectra from different parts of the diffraction pattern by scanning the fiber’s coupler along the center of the pattern in 1-mm steps. We also measured the signals’ pump-energy dependence at the central spot and the ring, using a diode detector (DET100 A2, Thorlabs, Newton, NJ, USA) and varying the pump energy with neutral density filters placed in front of the cuvette. We used a set of filters with optical densities from 0.1 to 1.9. Pump pulse energy was calibrated using a pulse energy detector (Pulsar-1, Newport Corporation, Ophir, North Logan, UT, USA).
4. Results and Discussion
Figure 3a shows a photograph of the diffraction pattern observed when pumping at 411 nm and using a long-pass filter with a cut-off wavelength at 600 nm. The pattern shows the central spot and the ring structure. Previous experiments demonstrated that the observed signal corresponds to the Stokes signal generated by the Raman oxygen excitation toward the 1O2 level [9,10,11,12]. Using the spectrometer, we collected spectra along the direction indicated by the white arrow as we scanned the optical fiber coupler with 1-mm steps. For each spectrum, we determined the Stokes signal amplitude as a function of the positions at 607 and 668 nm.
Figure 3b shows this dependence on a semi-logarithmic scale. The blue crossed squares correspond to the signal at 607 nm, while the red crossed circles refer to that at 668 nm. The signal at 668 nm is generally smaller than that at 607 nm, particularly for the central spot (point “A”). In some points closer to the ring - indicated by “B” and “C”- the signals become comparable. Figure 3b shows that the ring radii depend slightly on wavelength, allowing separation of Stokes components with slightly different wavelengths.
Figure 4 shows the spectra measured on all three points “A”, “B”, and “C” (Figure 4a, Figure 4b and Figure 4c, respectively). All signal amplitudes are in the same arbitrary units. The signal at point “A” is more than two orders of magnitude larger than that at “B” and “C”. The most important feature is that the central spot exhibits a single peak centered around 607 nm, while that at “B” and “C” shows a double-peak structure with peaks around 607 and 668 nm. The spectra confirm the generation of Stokes signals corresponding to Raman transitions from the ground state to the 1O2(0) and 1O2(1) levels. Only the oxygen molecule can exhibit the double-peak response in the Stokes signal spectrum, as shown in Figure 4b and Figure 4c. For the central spot, the contribution at 668 nm is more than one order of magnitude smaller than the Stokes signal at 607 nm. Some spectral asymmetry toward longer red wavelengths is evident in Figure 4a due to the contribution at 668 nm.
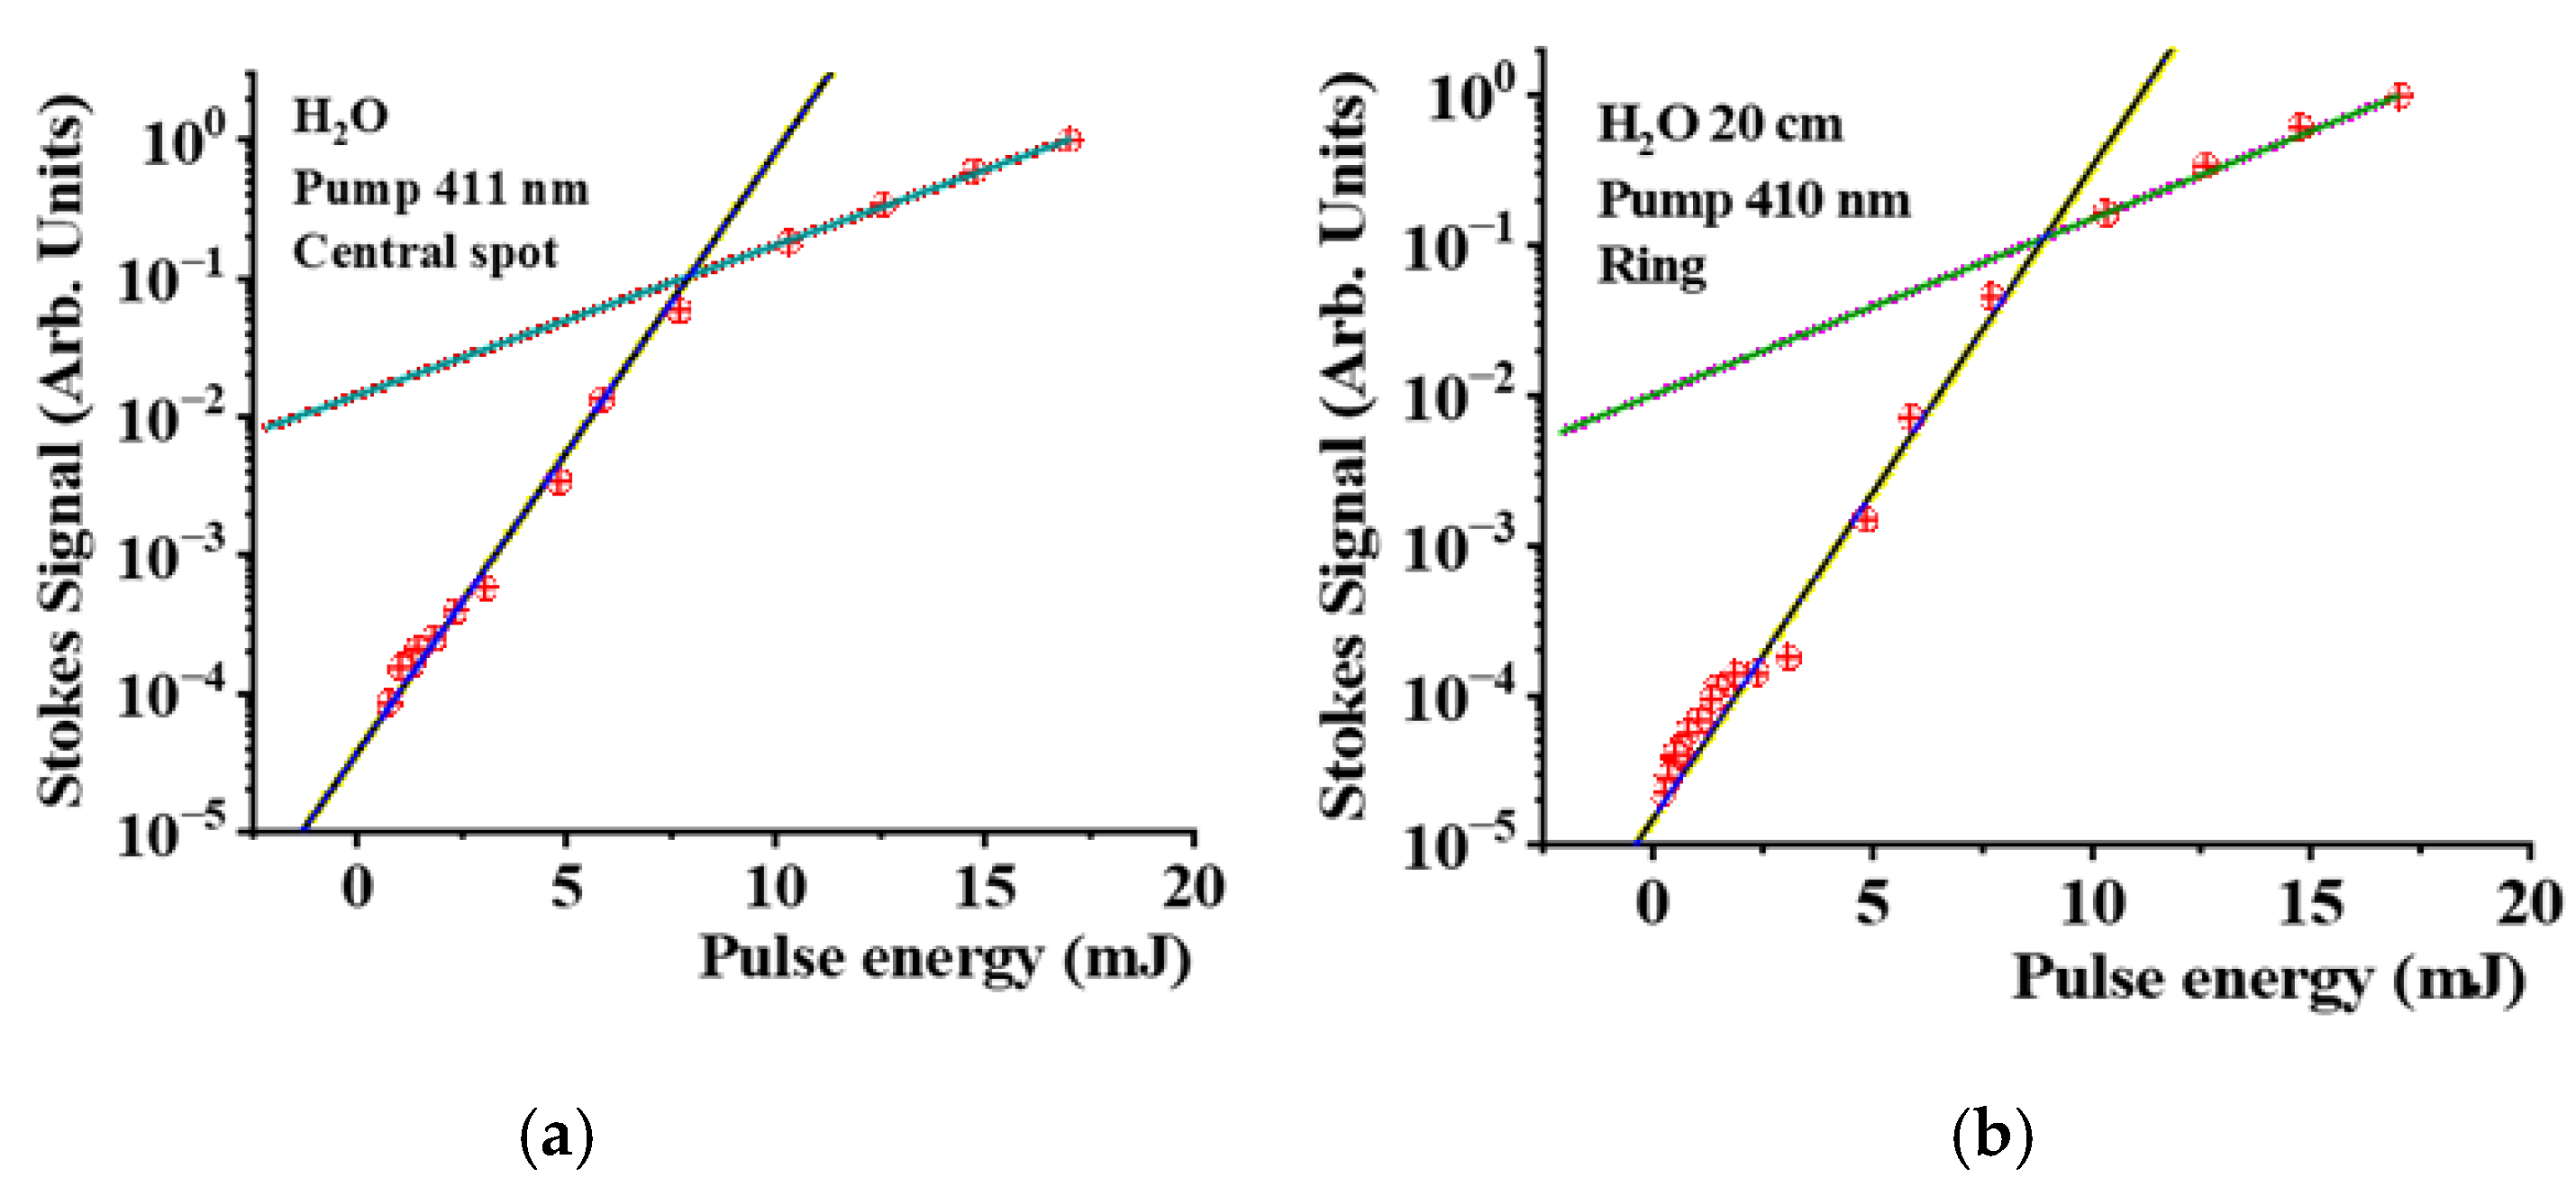
We also studied the dependence of the Stokes signal on the pump energy. We used the set of neutral optical filters to change the pump energy. Figure 5 shows this dependence on a semi-logarithmic scale measured for the central spot (5a) and the ring structure (5b). Both dependencies are similar. The pulse energy changes by a factor of 20, while the Stokes signal changes by 5 orders of magnitude, indicating exponential growth.
There is a reduction in exponential growth for energies above 8 mJ. The blue solid line in both plots, Figure 5a and Figure 5b, corresponds to exponential growth with a gain of 85 m-1, while the green line corresponds to an energy gain of 21 m-1. At high intensity, the coupling between Stokes and anti-Stokes components increases. Because the anti-Stokes components exhibit absorption, an additional loss channel for the Stokes component limits the gain. For the conditions of our experiments and the maximal pulse energy of (17±2) mJ, we estimate an average pump intensity of (1.5±0.2) 1016 W/m2. Using equation (1), we determined a 1O2 Raman susceptibility of (0.42 ± 0.05) × 10-24 m2 V-2.
Conclusions
We measured the Raman 1O2 photoexcitation spectra upon 411 nm pumping. As predicted by basic stimulated Raman excitation theory, we observed two kinds of Stokes signals. The first one propagates in the direction of the pumping beam, forming a central spot in the Raman diffraction pattern. The second contribution forms an angle with respect to the pump direction, creating a ring structure. We analyzed the spectral properties of the Raman diffraction pattern. The central spot exhibits a single-peak structure centered around 607 nm, corresponding to a transition from the ground state to the 1O2(0) state. At some points of the ring structure, it becomes possible to detect a two-peaks structure containing contributions at 607 nm and 668 nm, with the latter corresponding to the transition toward the 1O2(1) state. We have also provided evidence of the exponential growth in Stokes signals, as predicted by early theoretical models of the stimulated Raman process.
Author Contributions
A.M.O. conceptualization, methodology, validation, data collection, formal analysis, writing, review and editing of the manuscript, funding acquisition and administration. W.R. validation, data collection, formal analysis, and investigation. S.W. validation, data collection, formal analysis, and investigation. All authors have read and agreed with the publishing version of the manuscript.
Funding
The research was sponsored by the Air Force Office of Scientific Research and was accomplished under grant number W911NF-23-1-0245. The views and conclusions are those of the authors and should not be interpreted as representing the official policies, either expressed or implied, of the Air Force Office of Scientific Research or the US Government. The US Government is authorized to reproduce and distribute reprints for Government purposes, notwithstanding any copyright notation herein.
Data Availability Statement
The raw data supporting the conclusions of this article will be made available by the authors on request.
Acknowledgments
During the preparation of this manuscript, the authors used “Grammarly Pro for Windows” software for editing it. We also used MDPI editing services for the same purpose. The authors have reviewed and edited the output and take full responsibility for the content of this publication.
Conflicts of Interest
The authors declare no conflicts of interest.
Abbreviations
The following abbreviations are used in this manuscript:
| 1O2 | Singlet oxygen electronic level |
| 1O2(0) | Singlet oxygen lowest vibration sublevel |
| 1O2(1) | Singlet oxygen first excited vibration sublevel |
| LPF | Long-pass filter |
| NDF | Neutral density filter |
| OPO | Optical parametric oscillator |
| OF | Optical fiber |
References
- Flors, C.; Griesbeck, A.G.; Vassilikogiannakis, G. Singlet Oxygen: Chemistry, Applications and Challenges Ahead. ChemPhotoChem 2018, 2, 510–511. [Google Scholar] [CrossRef]
- Curieles Andrés, C.M.; Pérez de la Lastra, J.M.; Juan, C.A.; Plou, F.J.; Pérez-Lebeña, E. Reactivity and Applications of Singlet Oxygen Molecule. In Reactive Oxygen Species – Advances and Development; Editor Rizwan Ahmad; Publisher: IntechOpen, 2024. [CrossRef]
- Wang, Y.; Lin, Y.; He, S.; Wu, S.; Yang, C. Singlet Oxygen: Properties, Generation, Detection, and Environmental Applications. J. Haz. Mat. 2024, 5, 132538. [Google Scholar] [CrossRef] [PubMed]
- Nidheesh, P.V.; Boczkaj, G.; Ganiyu, S.O.; Oladipo, A.A.; Fedorov, K.; Xiao, R.; Dionysiou, D.D. Generation, properties, and applications of singlet oxygen for wastewater treatment: A review. Environ. Chem. Lett. 2025, 23, 195–240. [Google Scholar] [CrossRef]
- Singlet Oxygen: Applications in Biosciences and Nanosciences, Volume 2—Comprehensive Series in Photochemical & Photobiological Sciences, Volume 14, 1st ed.; S. Nonell, C. Flors, editors. Cambridge, UK: Royal Society of Chemistry, Thomas Graham House, 2016.
- Pibiri, I.; Buscemi, S.; Palumbo Piccionello, A.; Pace, A. Photochemically Produced Singlet Oxygen: Applications and Perspectives. ChemPhotoChem 2018, 2, 535–547. [Google Scholar] [CrossRef]
- Michelin, C.; Hoffmann, N. Photosensitization and Photocatalysis—Perspectives in organic Chemistry. ACS Catal. 2018, 8, 12046–12055. [Google Scholar] [CrossRef]
- Frank Kino, F.; Medeiros Silva, G.T. The Photophysics of Photosensitization: A brief overview. J. Photochem. Photobiol. 2021, 7, 100042. [Google Scholar] [CrossRef]
- Marcano Olaizola, A.; Kingsley, D.; Kuis, R.; Johnson, A.A. Stimulated Raman Generation of Aqueous Singlet Oxygen without Photosensitizers. J. Photochem. Photobio. B Bio 2022, 235, 112562. [Google Scholar] [CrossRef] [PubMed]
- Marcano Olaizola, A.; Zerrad, A.; Jenneto, F.; Kingsley, D. Confirming the Stimulated Raman Origin of Singlet-Oxygen Photogeneration. J. Raman Spectros. 2024, 55, 58–64. [Google Scholar] [CrossRef]
- Marcano Olaizola, A. Near-Infrared Phosphorescence of Raman Photogenerated Singlet Oxygen. Photochem 2025, 5, 7–14. [Google Scholar] [CrossRef]
- Marcano Olaizola, A. Measuring the efficiency of using Raman photoexcitation to generate singlet oxygen in distilled water. Photochem. 2025, 5, 24–32. [Google Scholar] [CrossRef]
- Arbatskaya, A.N. Investigation of the Angular Distribution of Stimulated Raman Scattering of Light. In Stimulated Raman Scattering, Proceedings of the P.N. Lebedev Physics Institute, Vol. 99; Editor Basov, N.G. Springer Science +Business Media. LLC. New York, US, 1982, pp. 1–36.
- Herzberg, G. Photography of the Infra-Red Solar Spectrum to Wave-length 12,900 A. Nature 1934, 133, 759. [Google Scholar] [CrossRef]
- Herzberg, L.; Herzberg, G. Fine Structure of the Atmospheric Oxygen Bands. Astrophys. J. 1947, 105, 353–359. [Google Scholar] [CrossRef] [PubMed]
- Ellis, J.W.; Kneser, H.O. Combination relations in the Absorption Spectrum of Liquid Oxygen. Z. Phys. 1933, 86, 583–591. [Google Scholar] [CrossRef]
- Krupenie, P.H. The Spectrum of Molecular Oxygen. J. Phys. Chem. Ref. Data 1972, 1, 423–534. [Google Scholar] [CrossRef]
- Meckler, A. Electronic Energy Levels of Molecular Oxygen. J. Chem. Phys. 1953, 21, 1750–1762. [Google Scholar] [CrossRef]
- Bachilo, S.M.; Nichiporovich, I.N.; Losev, A.P. Registration of Absorption of
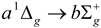 Oxygen in Solutions. J. Appl. Spektrosk. 1998, 65, 811–816. [CrossRef]
 - Weldon, D.; Ogilby, P.R. Time-Resolved Absorption Spectrum of Single Oxygen in Solution. J. Am. Chem. Soc. 1998, 120, 12978–12979. [Google Scholar] [CrossRef]
- Krasnovsky, A.A., Jr.; Kozlov, A.S.; Roumbal, Y.V. Photochemical Investigation of the IR Absorption Bands of Molecular Oxygen in Organic and Aqueous Environment. Photochem. Photobiol. Sci. 2012, 11, 988–997. [Google Scholar] [CrossRef] [PubMed]
- Hellwarth, R.W. Theory of Stimulated Raman Scattering. Phys. Rev. 1963, 130, 1850–1852. [Google Scholar] [CrossRef]
- Garmire, E.; Panderese, F.; Townes, C.H. Coherently Driven Molecular Vibrations and Light Modulation. Phys. Rev. Lett. 1963, 11, 160–162. [Google Scholar] [CrossRef]
- Bloembergen, N. Nonlinear Optics, 4th ed.; World Scientific: Singapore, 1996; pp. 102–120. [Google Scholar]
- Boyd, R.W. Nonlinear Optics, 3rd ed.; Academic Press: Amsterdam, The Netherlands, 2008; pp. 473–509. [Google Scholar]
Figure 1.
Schematic of the Raman excitation of the two lowest vibrational levels of the 1O2 electronic state.
Figure 1.
Schematic of the Raman excitation of the two lowest vibrational levels of the 1O2 electronic state.
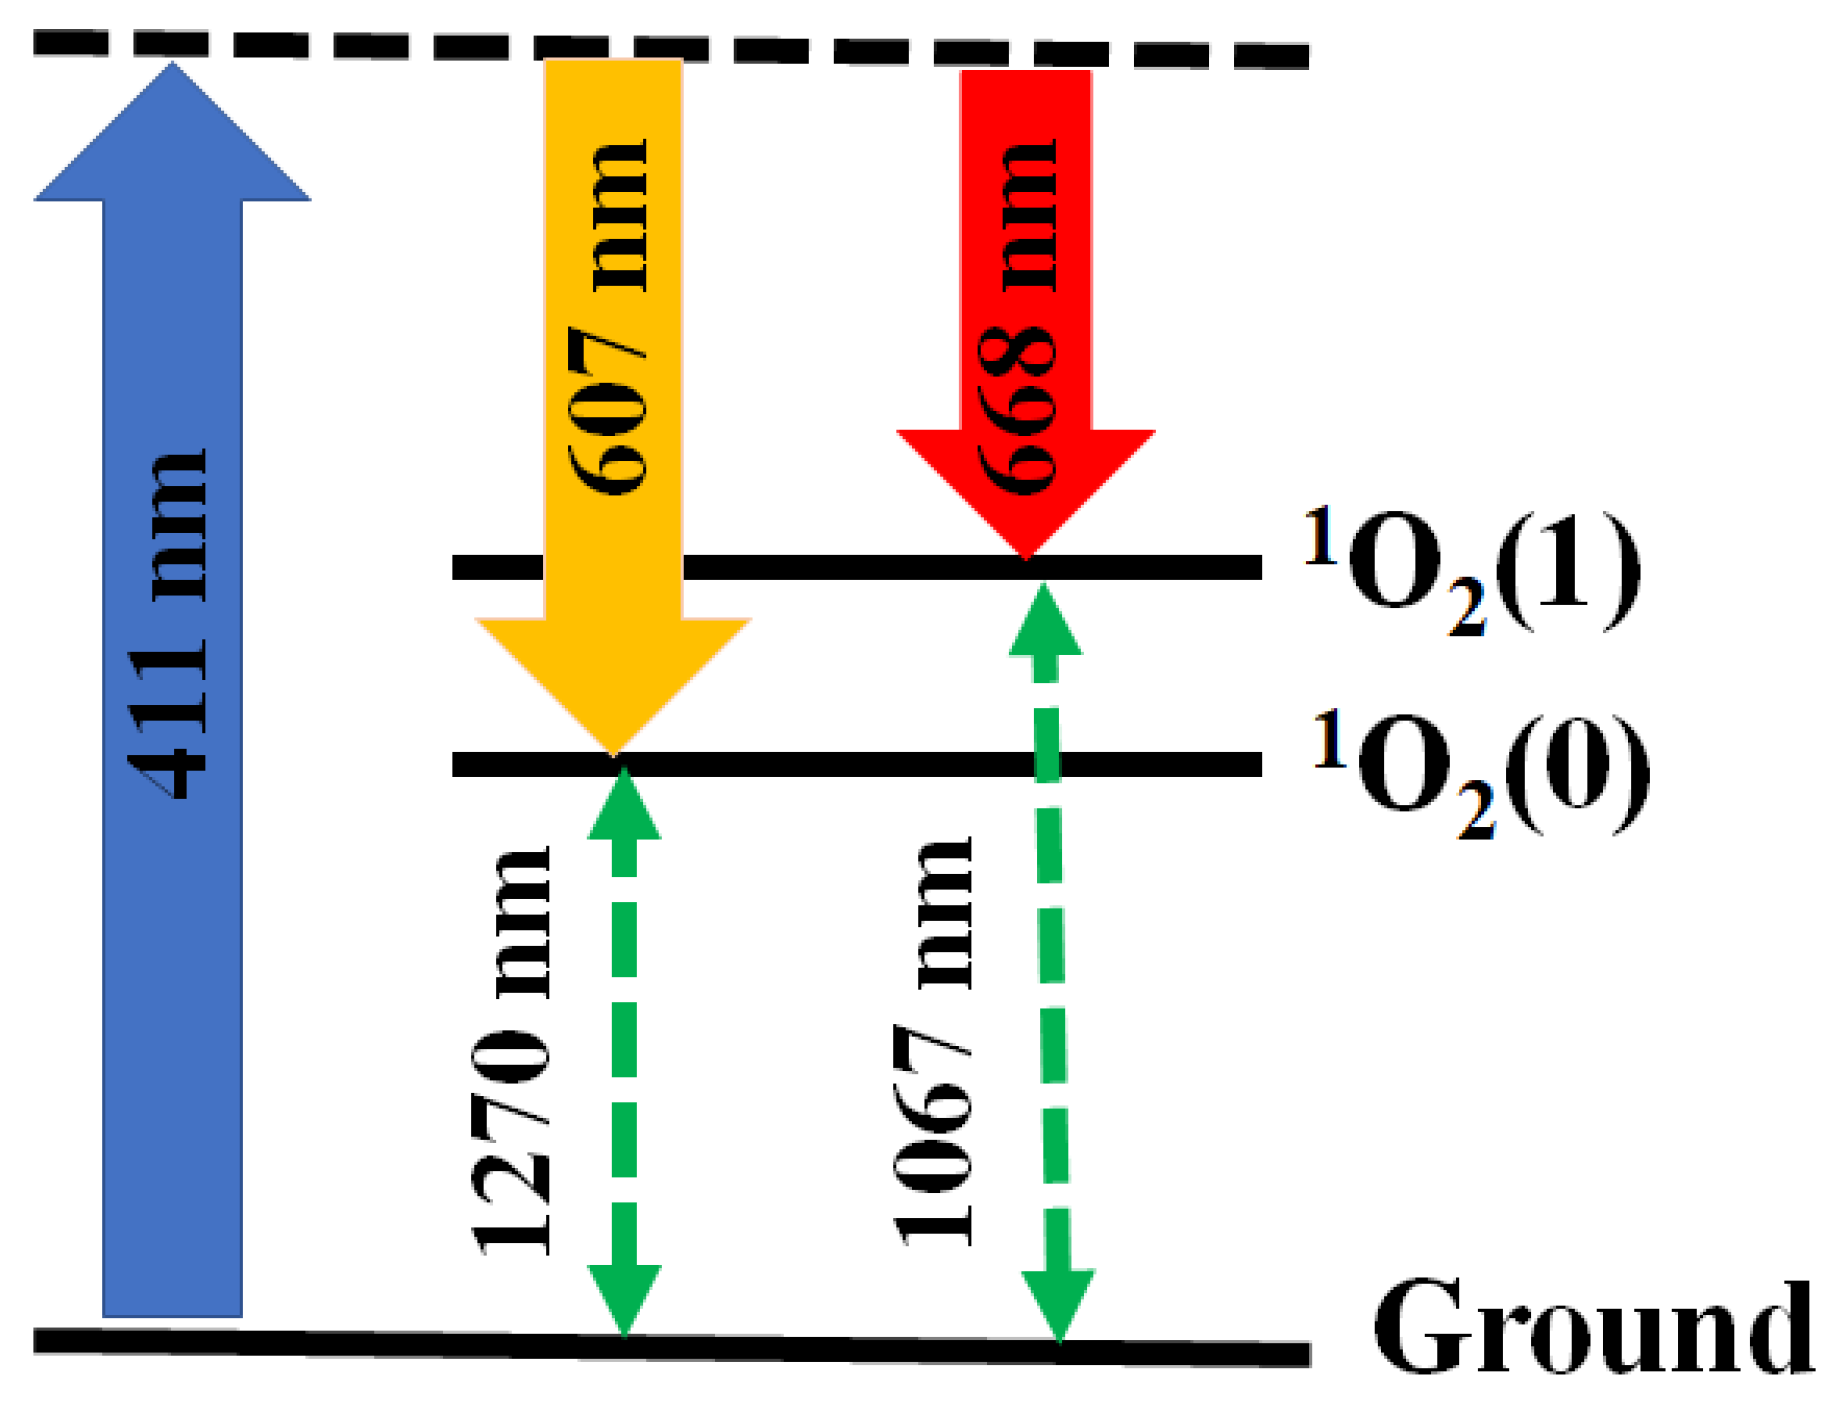
Figure 2.
Schematic of experimental setup showing the optical parametric oscillator (OPO), a focusing lens (L), the glass cuvette containing water, the long-pass filter (LPF), the neutral density filter (NDF), an optical fiber (OF). and a spectrometer.
Figure 2.
Schematic of experimental setup showing the optical parametric oscillator (OPO), a focusing lens (L), the glass cuvette containing water, the long-pass filter (LPF), the neutral density filter (NDF), an optical fiber (OF). and a spectrometer.
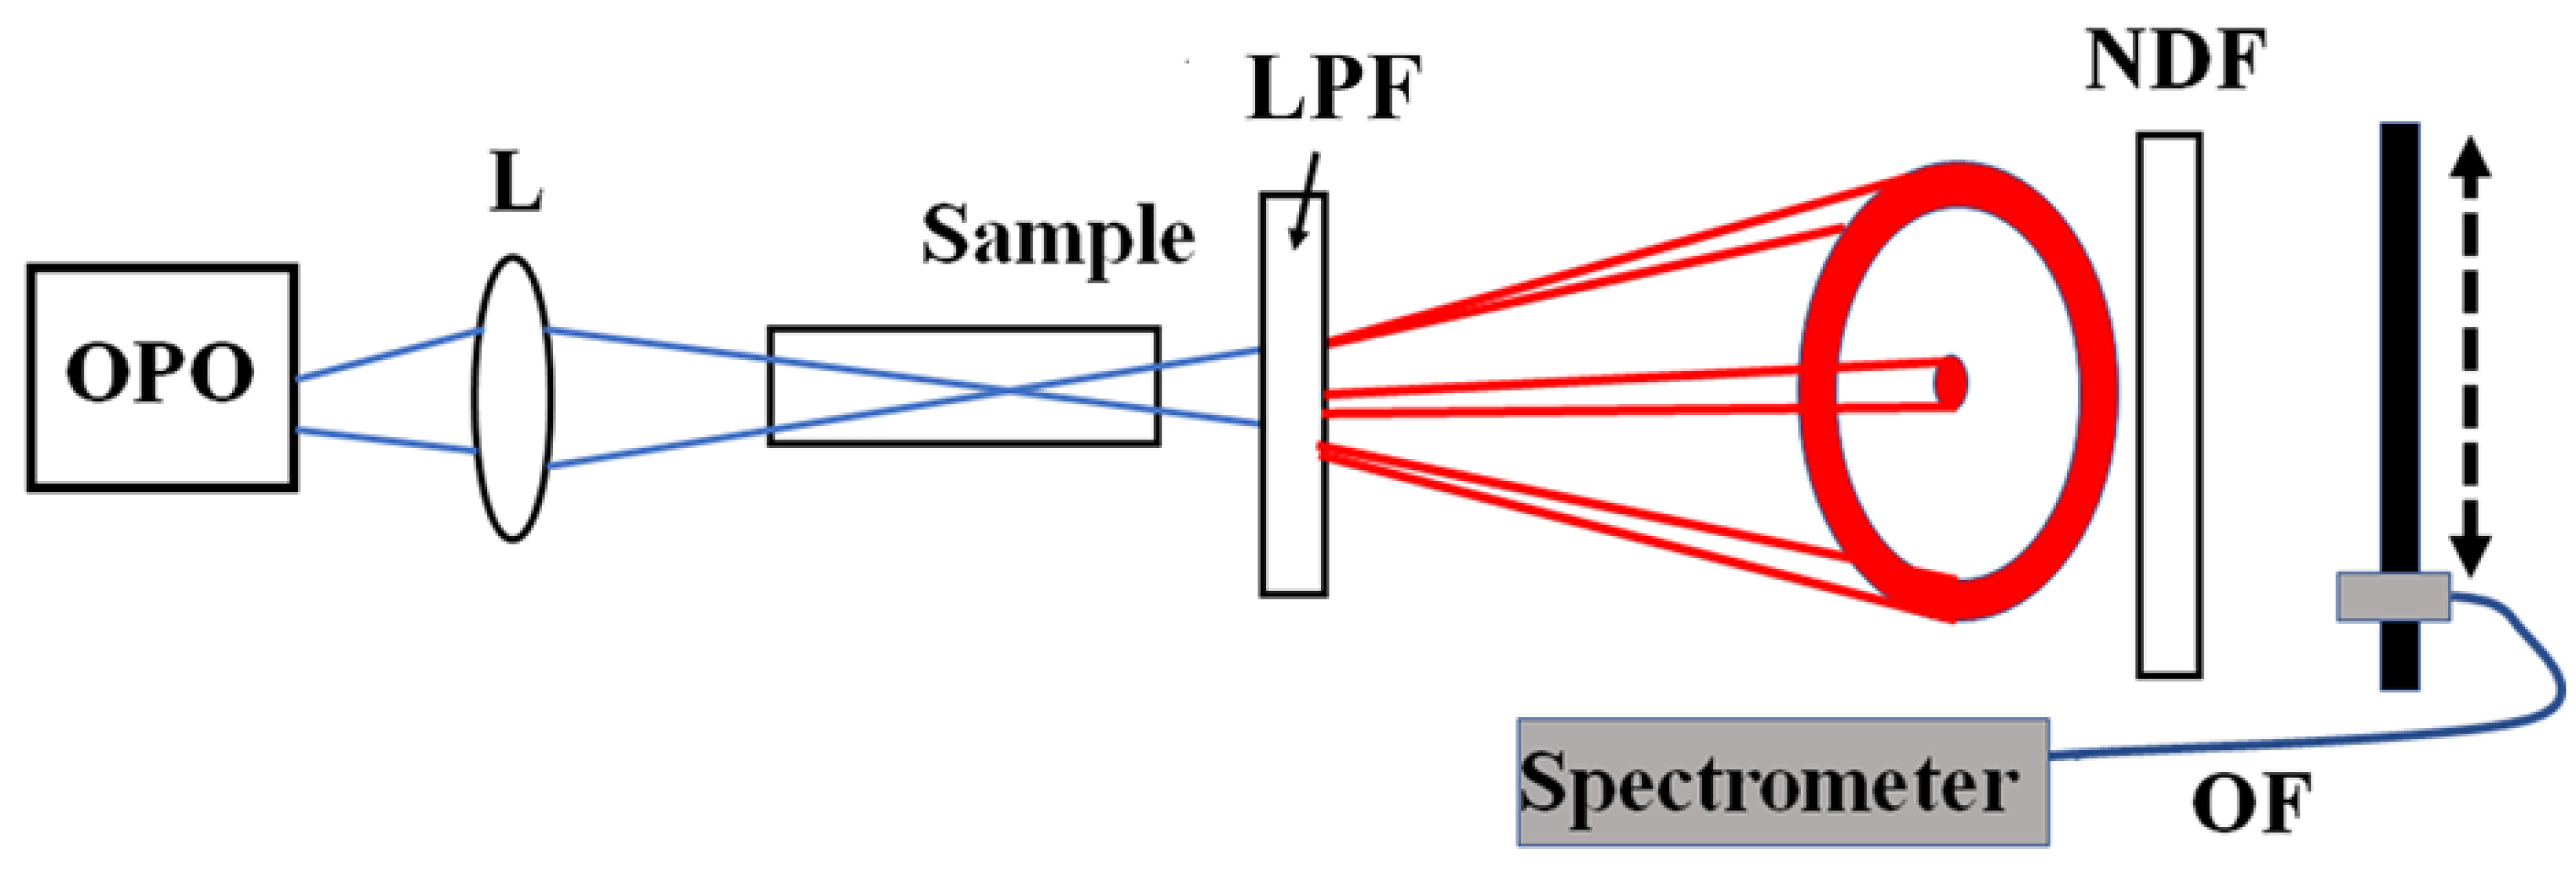
Figure 3.
(a) Raman diffraction pattern observed at a distance of 12 cm from the pump waist when pumping at 411 nm and using an LPF at 600 nm. (b) Stokes signal amplitudes at 607 nm (blue crossed squares) and 668 nm (red crossed circles) as a function of the position in the Raman diffraction pattern. The points indicated by letters “A”, “B”, and “C” are the same in both figures.
Figure 3.
(a) Raman diffraction pattern observed at a distance of 12 cm from the pump waist when pumping at 411 nm and using an LPF at 600 nm. (b) Stokes signal amplitudes at 607 nm (blue crossed squares) and 668 nm (red crossed circles) as a function of the position in the Raman diffraction pattern. The points indicated by letters “A”, “B”, and “C” are the same in both figures.
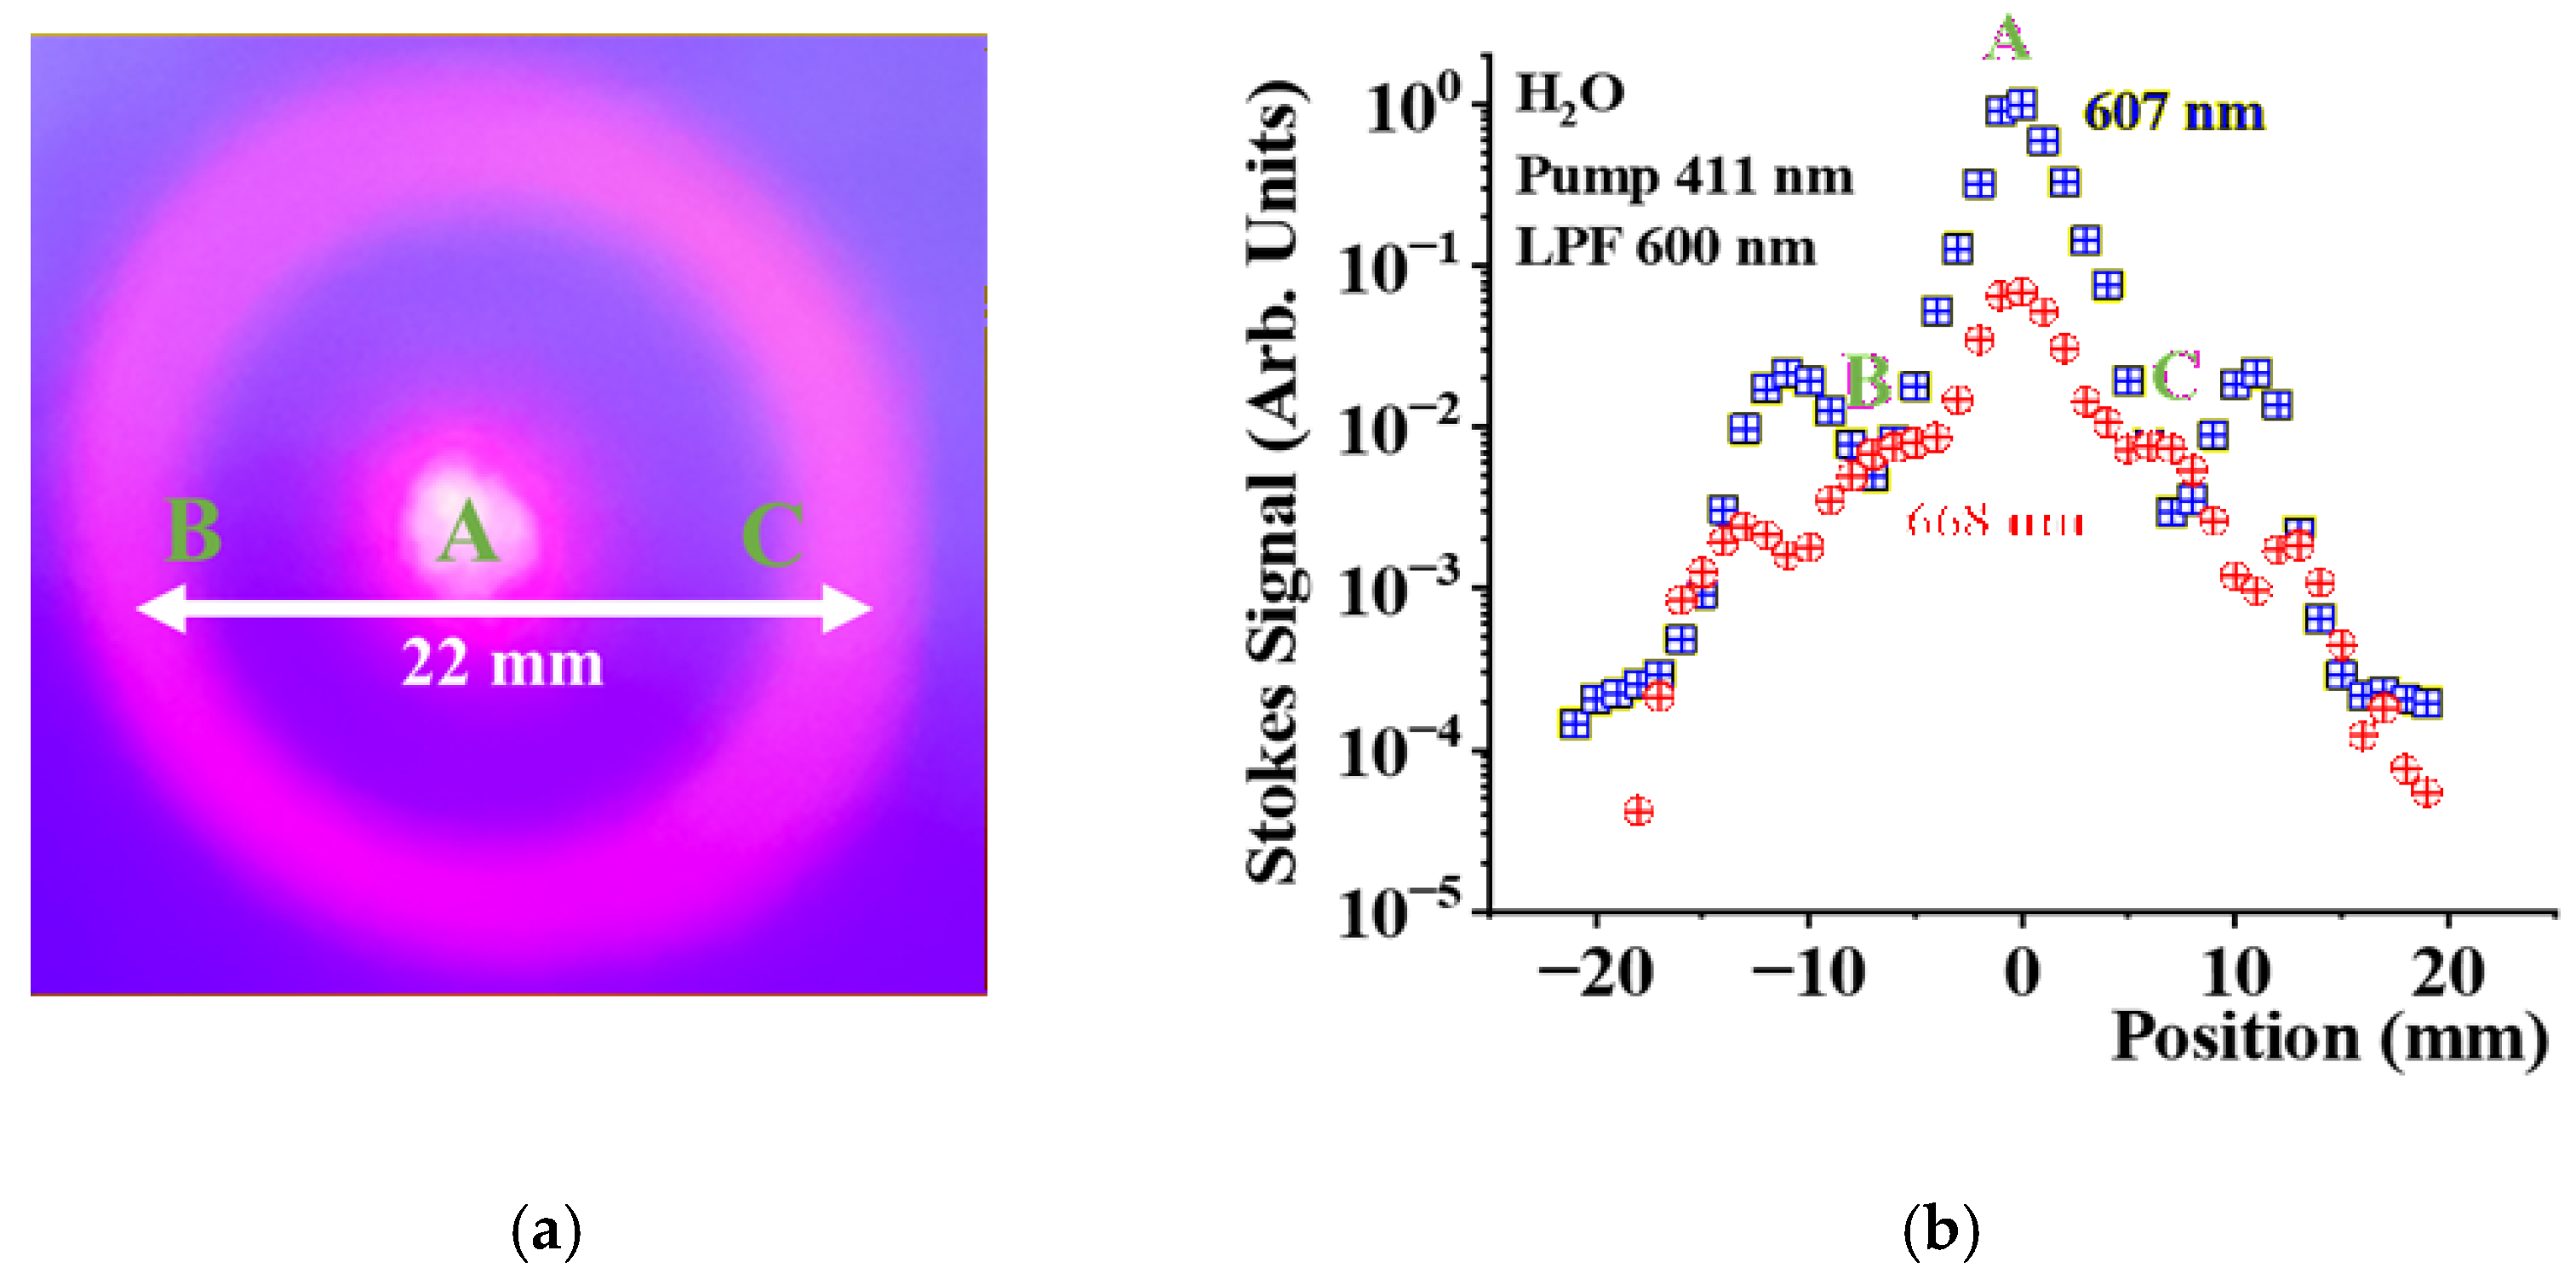
Figure 4.
(a) Stokes spectra collected at the central spot at position “A” (z=0), (b) “B” (z=-8 mm), and (c) “C” (z=+8 mm) shown in Figure 3. We used a pump wavelength of 411 nm and a long-pass filter with a cut-off at 600 nm.
Figure 4.
(a) Stokes spectra collected at the central spot at position “A” (z=0), (b) “B” (z=-8 mm), and (c) “C” (z=+8 mm) shown in Figure 3. We used a pump wavelength of 411 nm and a long-pass filter with a cut-off at 600 nm.
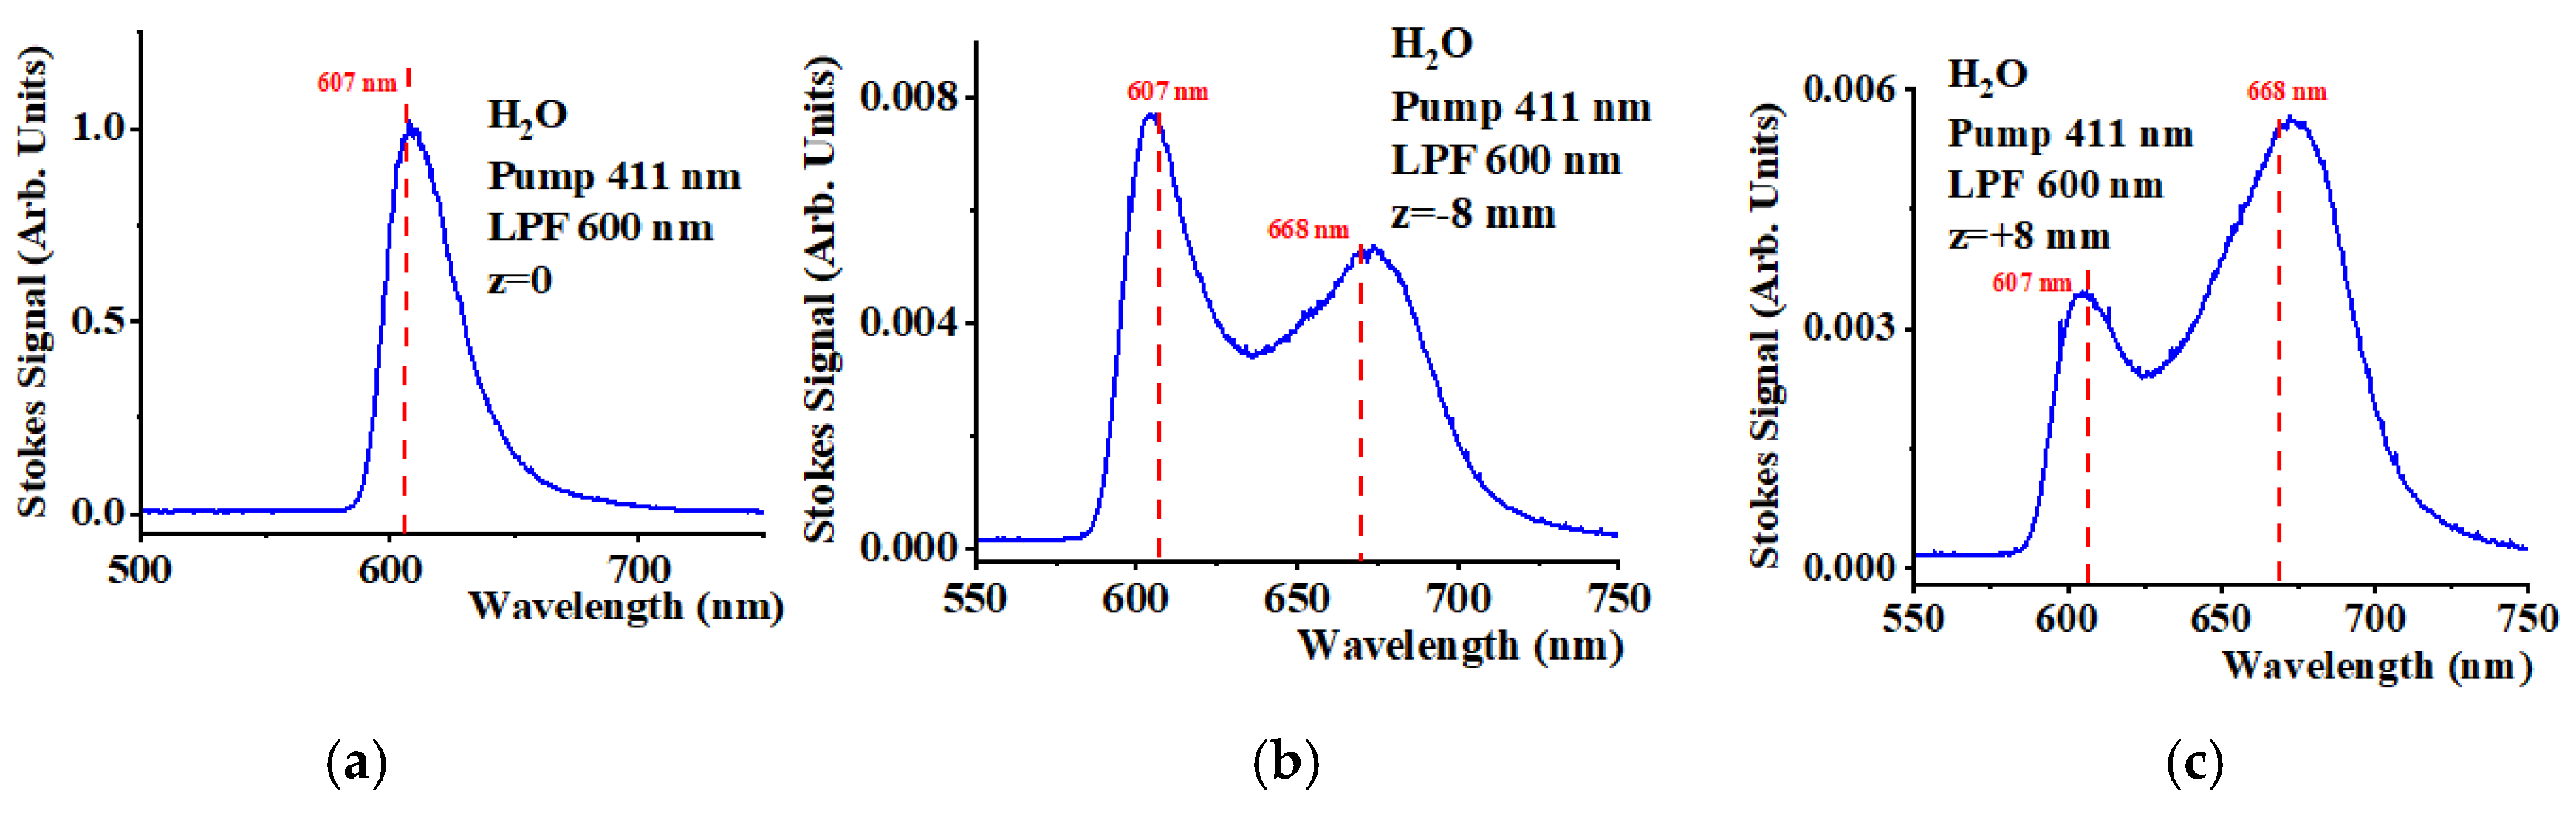
Figure 5.
(a) Stokes signal’s pump pulse energy dependence from the central spot and (b) from the ring. We used a pump wavelength at 411 nm and a long-pass filter with a cut-off wavelength at 600 nm.
Figure 5.
(a) Stokes signal’s pump pulse energy dependence from the central spot and (b) from the ring. We used a pump wavelength at 411 nm and a long-pass filter with a cut-off wavelength at 600 nm.
Disclaimer/Publisher’s Note: The statements, opinions and data contained in all publications are solely those of the individual author(s) and contributor(s) and not of MDPI and/or the editor(s). MDPI and/or the editor(s) disclaim responsibility for any injury to people or property resulting from any ideas, methods, instructions or products referred to in the content. |
© 2026 by the authors. Licensee MDPI, Basel, Switzerland. This article is an open access article distributed under the terms and conditions of the Creative Commons Attribution (CC BY) license (http://creativecommons.org/licenses/by/4.0/).
Copyright: This open access article is published under a Creative Commons CC BY 4.0 license, which permit the free download, distribution, and reuse, provided that the author and preprint are cited in any reuse.


