

Submitted:
14 May 2026
Posted:
15 May 2026
You are already at the latest version
Abstract
Under global climate change, shifts in the suitable distribution of forest vegetation have become an important issue in ecology and biogeography. Birch forests are widely distributed across cold-temperate, temperate, and montane regions in China, but different birch forest types may vary in their environmental adaptations and spatial responses to climate change. In this study, three representative birch forest vegetation types in China, namely Betula utilis forest, Betula albosinensis forest, and Betula ermanii krummholz, were selected for comparative analysis. Based on vegetation distribution records and environmental variables, an optimized MaxEnt model was constructed using ENMeval to identify current suitable distribution patterns, key environmental drivers, and future habitat changes under climate change scenarios.The results showed that the three birch forest types differed markedly in current suitable distribution patterns. Betula utilis forest was mainly concentrated in the Qinling Mountains, Betula albosinensis forest showed a broader montane distribution pattern, and Betula ermanii krummholz was restricted to high-altitude or high-latitude cold habitats. Climatic factors were the dominant drivers of suitability, but the key environmental variables differed among the three vegetation types, indicating niche differentiation along temperature, precipitation, and elevation gradients. Under future climate scenarios, the suitable habitats of the three types showed type-specific changes in area, spatial stability, and centroid migration. Betula utilis forest and Betula albosinensis forest mainly exhibited regional spatial adjustment and partial expansion, whereas Betula ermanii krummholz showed stronger dependence on high-elevation cold habitats and more limited spatial adjustment capacity.
These findings indicate that different birch forest vegetation types in China do not respond uniformly to climate change. The study provides a vegetation-type-specific basis for identifying stable suitable areas, potential expansion areas, and climate-sensitive habitats, and can support adaptive management and conservation planning for montane forest vegetation under future climate change.
Keywords:
birch forest
; MaxEnt model
; climate change
; suitable distribution
; niche differentiation
; centroid migration
1. Introduction
Global climate change is continuously reshaping the geographical distribution of terrestrial vegetation. Its impact is not only manifested in the expansion, contraction and spatial migration of suitable ranges, but also interacts with habitat fragmentation, thereby affecting biodiversity, ecosystem processes, and the structural and functional stability of forest ecosystems[1,2,3]. Exploring the reorganization mechanism of the distribution pattern of forest vegetation under climate change has become the key to predicting the dynamic evolution of ecosystems. It has been widely shown that global warming drives many terrestrial species and forest plants to shift toward higher latitudes and higher elevations [4,5].However, whether this response is generally consistent among different vegetation types or even different formations within the same genus still needs to be systematically verified.
Birch forest is an important part of forest vegetation in cold temperate zone, temperate zone and mountainous areas of China, and plays an irreplaceable role in community succession, soil and water conservation and regional ecological security maintenance [6]. However, most existing Species Distribution Models (SDMs) focus primarily on the ‘species’ level. While this single-species approach reveals individual physiological tolerances, it often overlooks the fact that forest vegetation responds to climate change as an integrated community. In phytosociology and ecology, a ‘formation’ (vegetation type) is a macro-ecological unit representing a climax or sub-climax community with consistent dominant species and similar physiognomy[7,8]. Compared with species, formations can more accurately reflect the holistic adaptation strategies and structural niche characteristics of a plant community in a specific habitat. Therefore, shifting the analytical unit from ‘species’ to ‘formation’ and evaluating the differences among different formations within the same genus provides a critical yet missing perspective in current SDM research. This ‘formation comparison’ approach constitutes the core incremental contribution of our study. Birch forest is an important part of forest vegetation in cold temperate zone, temperate zone and mountainous areas of China, and plays an irreplaceable role in community succession, soil and water conservation and regional ecological security maintenance[9,10].Compared with the study of single species distribution, the spatial analysis of vegetation types (formations) can more accurately reflect the environmental adaptation strategies and niche characteristics at the community level. As three typical types of birch forests in China, Birch betulaeformis forest, Betula albo-sinensis forest and Betula ermanii elfin forest occupy different geographical units, climatic backgrounds and topographic positions. Most of the existing studies focus on the distribution evolution or stress resistance physiology of Betula plants such as single Betula platyphylla forest[11,12], and there has been no systematic comparison of the environmental driving mechanism and climate change responses of different Betula forest vegetation types at the macro scale. The absence of this perspective limits our in-depth understanding of the type-specific responses of this widespread group of birch forests to climate stress.
Species distribution models ( SDMs ) provide a core tool for quantifying the relationship between vegetation distribution and environmental factors. Among them, the MaxEnt model is widely used due to its good adaptability to ‘ Presence-only ‘ data and high prediction accuracy[13]. Given that MaxEnt with default parameter settings is prone to overfitting and can reduce spatial migration ability, in recent years, combining MaxEnt with ENMeval tuning parameters has become a standard paradigm to improve model robustness [14]. Based on this, this paper selects the birch forest, red birch forest and birch dwarf forest as the research object, and uses the optimized MaxEnt model to address the following core questions : ( 1 ) What are the differences in the potential suitable patterns and dominant driving factors of the three typical birch forests in the current environment ? ( 2 ) In the future climate scenarios, do their suitable area evolution and centroid migration trajectories show different ecological response strategies ? This study aims to reveal the differential response mechanism of birch forests to climate change through a comparison of forest types and to provide scientific support for the formulation of targeted forest conservation and adaptive management strategies.
2. Materials and Methods
2.1. Study Objects and Vegetation Classification
We selected three representative birch forest vegetation types in China: Betula utilis forest, Betula albosinensis forest, and Betula ermanii krummholz. These three vegetation types differ markedly in geographic distribution, elevational range, and ecological adaptation, and therefore provide an appropriate basis for comparative analysis of vegetation-type-specific responses to climate change [12,13,14,15,16].
Ecologically, Betula utilis forest is mainly distributed in the Qinling Mountains and adjacent high-elevation areas, commonly occurring in montane or subalpine forest belts at elevations of approximately 2450–3050 m. It usually forms relatively concentrated mountain forest patches and often occurs together with subalpine coniferous forests. Betula albosinensis forest has the broadest distribution among the three types and is mainly found in the Longdong region, Qinling Mountains, and Daba Mountains, generally at elevations of 2200–2800 m. It represents a typical montane broadleaved forest type with a comparatively wide ecological niche. In contrast, Betula ermanii krummholz is restricted to alpine timberline environments in Northeast China, especially in the Ying’erling–Weihu Ling–Longgang Mountain region, where it is mainly distributed at elevations of 1800–2100 m. Owing to long-term exposure to low temperature, strong wind, and harsh alpine conditions, this vegetation type typically shows dwarf and shrub-like growth forms.

Table 1.
Ecological Characteristics and Sampling Site Information for Three Types of Birch Forests.
| Vegetation Type | Main Distribution Areas | Province | Elevation Range (m) | Number of Thinning Sampling Sites |
| Birch forests | Qinling Mountains region | Shaanxi, Gansu, etc. | 2,450–3,050 | 137 |
| Red birch forests | Longdong, Qinling, Daba Mountains, etc. | Gansu, Shaanxi, Sichuan, etc. | 2,200–2,800 | 3529 |
| Dwarf mountain birch groves | Ying’erling–Weihu Ling–Longgang Mountain | Jilin, Heilongjiang | 1,800–2,100 | 6 |
2.2. Occurrence Data Sourcing and Processing
The datasets used in this study included vegetation distribution records, administrative boundary data, current and future climatic variables, topographic data, soil data, human disturbance data, and land-use data. Administrative boundary data of China were obtained from the Resource and Environment Science and Data Center, Chinese Academy of Sciences (RESDC; accessed on 5 April 2025). Distribution records of three types of birch forest were extracted from the Vegetation Atlas of China at a scale of 1:1,000,000, published by Science Press in 2001. Current bioclimatic variables and elevation data were downloaded from the WorldClim database, while soil data were obtained from the Harmonized World Soil Database (HWSD). Human activity intensity was represented by the human footprint dataset obtained from the Socioeconomic Data and Applications Center (SEDAC). Land-use data, including the baseline year of 2020 and projected land-use patterns for 2050 and 2090 under SSP126, SSP370, and SSP585 scenarios, were derived from Zhang et al. (2023). Future climate projections were obtained from the BCC-CSM2-MR model under the CMIP6 framework.
All spatial datasets were projected to the WGS 84 coordinate system and resampled to a consistent spatial resolution before model construction. The vegetation distribution records were checked to remove duplicate, erroneous, and spatially ambiguous records. To reduce the influence of spatial autocorrelation and sampling bias, occurrence records were spatially thinned using a 5 km × 5 km grid. Only one occurrence record was retained within each grid cell. After filtering, the final occurrence dataset was used for MaxEnt model construction and subsequent spatial analysis.
Table 2.
Data sources used in this study.
| Data type | Data content | Source | Acquisition date / period |
| Boundary data | Administrative boundary of China | RESDC | 5 April 2025 |
| Occurrence data | Distribution records of three types of birch forest | Vegetation Atlas of China, Science Press, 2001 | — |
| Current climate and elevation | Bioclimatic variables and DEM | WorldClim | 5 April 2025 |
| Soil data | Soil moisture / soil attributes | HWSD | 5 April 2025 |
| Human activity | Human footprint index | SEDAC | 5 April 2025 |
| Land use | 2020 baseline and 2050/2090 SSP126, SSP370, SSP585 projections | Zhang et al. (2023) | — |
| Future climate | CMIP6 BCC-CSM2-MR projections | WorldClim / CMIP6 | — |
2.3. Environmental Variables and Multicollinearity Screening
An initial set of environmental variables was compiled to characterize the climatic, topographic, edaphic, anthropogenic, and land-use conditions influencing the potential distribution of the target vegetation type. Climatic predictors included 19 bioclimatic variables representing temperature and precipitation conditions. Topographic predictors included elevation, slope, and aspect. Soil conditions were represented by soil moisture, and anthropogenic disturbance was represented by the human footprint index. Land-use variables were incorporated to reflect the potential effects of land-cover change on habitat suitability under current and future scenarios.
To reduce multicollinearity among predictors, Pearson correlation analysis was performed based on environmental values extracted from the occurrence records. When the absolute value of the correlation coefficient between two variables exceeded 0.8, only the variable with clearer ecological interpretation and stronger preliminary explanatory power was retained. The final set of variables was then used as input predictors for MaxEnt model construction.
2.4. MaxEnt Model Optimization and Evaluation
MaxEnt modeling was performed using occurrence records and the selected environmental variables. To reduce overfitting and improve model transferability, model complexity was optimized using the ENMeval package. Regularization multiplier values were set from 0.5 to 4.0 at intervals of 0.5, and six feature-class combinations were tested, including L, LQ, H, LQH, LQHP, and LQHPT. A total of 54 parameter combinations were evaluated. The optimal parameter combination was selected according to the lowest corrected Akaike Information Criterion value, thereby balancing model goodness-of-fit and complexity.
The optimized MaxEnt model was run using 10 bootstrap replicates. For each replicate, 75% of the occurrence records were randomly selected for model training and the remaining 25% were used for model testing. The model output format was set to logistic, which directly represents habitat suitability probability. The maximum number of iterations was set to 500 or 1000 according to model convergence. Jackknife tests and response curves were generated to evaluate the relative importance of environmental variables and the ecological response relationships between suitability and key predictors.
Model performance was evaluated using multiple indicators, including the area under the receiver operating characteristic curve, the true skill statistic, and the omission rate. The use of multiple metrics avoided relying solely on AUC and provided a more comprehensive assessment of model discrimination ability, threshold-dependent classification performance, and prediction stability.
2.5. Future Projection and Suitability-Area Classification
The optimized MaxEnt model constructed under current environmental conditions was projected onto future climate and land-use scenarios to predict potential changes in habitat suitability. Future projections were conducted for the 2050s and 2090s under SSP126, SSP370, and SSP585 scenarios using the BCC-CSM2-MR climate model. To ensure comparability among periods and scenarios, the same environmental variable set, spatial resolution, and classification thresholds were used for both current and future predictions.
The logistic outputs of MaxEnt were imported into ArcGIS and classified into four suitability levels: unsuitable habitat, low-suitability habitat, moderate-suitability habitat, and high-suitability habitat. The thresholds were set as follows: unsuitable, 0–0.1; low suitability, 0.1–0.3; moderate suitability, 0.3–0.5; and high suitability, 0.5–1.0. The areas of different suitability classes were calculated for the current period and each future scenario. The rate of change in suitable habitat area was calculated as the percentage difference between future and current suitable areas relative to the current area.
2.6. Spatial Dynamics, Centroid Migration and Elevational Shift Analysis
To identify spatial changes in suitable habitats under future climate and land-use scenarios, binary overlay analysis was conducted between the current and future suitability maps. Areas with suitability values above the defined threshold were classified as suitable, whereas areas below the threshold were classified as unsuitable. By overlaying current and future binary maps, suitable habitats were divided into three types: gain areas, stable areas, and loss areas. Gain areas referred to regions that were unsuitable under current conditions but became suitable in the future; stable areas referred to regions that remained suitable across both periods; and loss areas referred to regions that were suitable under current conditions but became unsuitable in the future.
The centroid migration of suitable habitats was analyzed using the Mean Center Method. Suitable habitat rasters were converted into spatial objects, and the geometric centroid coordinates were calculated for the current period and each future scenario. The direction and distance of centroid shifts were then used to characterize the horizontal migration trajectory of suitable habitats under future environmental change.
To further assess vertical redistribution, high-suitability areas were overlaid with DEM data. Elevation values within high-suitability zones were extracted, and the mean elevation, elevation range, and area distribution across elevation bands were calculated. Changes in the elevation distribution of high-suitability habitats were used to determine whether the potential suitable range exhibited upward, downward, or relatively stable vertical shifts.
By combining gain-stable-loss analysis, centroid migration, and elevational redistribution, this study quantified both horizontal and vertical components of habitat reorganization, thereby providing a spatial basis for interpreting the response mechanisms of the target vegetation type under climate change..
3. Results
Based on the optimized MaxEnt model, this study conducted a comparative analysis of Betula utilis forest, Betula albosinensis forest, and Betula ermanii krummholz across six aspects: sample size and model optimization results, current distribution patterns, key environmental factors, response curves, future habitat changes, and centroid migration. Overall, although the three types of birch forests belong to the same birch forest vegetation type, they exhibit significant differences in sample size, model complexity, dominant environmental factors, and future spatial response trends. This indicates that there is no unified suitability control pattern across different birch forest types; rather, they exhibit strong type-specific characteristics.
3.1. Sampling Points and Model Optimization Results
Sampling Points and Model Optimization Results Distribution information for the three birch forest vegetation types was extracted from China’s vegetation patch data and associated vegetation atlas records. After spatial thinning to a uniform resolution, the numbers of occurrence points used for model construction were 137 for Betula utilis forest, 3529 for Betula albosinensis forest, and 6 for Betula ermanii krummholz, respectively.
Model complexity and fitting performance varied markedly among different combinations of regularization multiplier (RM) and feature class (FC) (Figure 1). The low-ΔAICc region was mainly concentrated under moderate RM settings. Combined with the optimization results, the optimal parameter combinations determined by ENMeval for Betula utilis forest, Betula albosinensis forest, and Betula ermanii krummholz were LQH-1.5, LQHPT-2.0, and L-1.0, respectively.
Specifically for Betula ermanii krummholz, the evaluation of the 54 parameter combinations revealed that complex feature classes (e.g., LQH, LQHPT) universally produced excessively high ΔAICc values. This was due to the heavy AICc penalty imposed on model complexity under the extreme small sample size (n=6). The L-1.0 combination achieved the absolute lowest AICc score (ΔAICc = 0). Notably, all candidate models falling within the high-confidence interval (ΔAICc < 2) exclusively utilized linear (L) features. This strictly validates that L-1.0 is mathematically the most parsimonious and statistically supported choice among all combinations for this specific vegetation type.
3.2. Current Suitable Distribution Patterns and Their Spatial Variations
The current suitable distribution patterns of the three birch forest vegetation types showed clear spatial differentiation across China. Betula utilis forest was mainly concentrated in the Qinling Mountains, with a relatively compact and clustered distribution pattern. Betula albosinensis forest occupied a much broader spatial range, extending across the Longdong region, Qinling Mountains, and Daba Mountains, and therefore represented a typical widespread montane expansion type. In contrast, Betula ermanii krummholz was mainly restricted to high-altitude areas in Northeast China and exhibited the narrowest suitable range and the strongest local concentration. These differences in present-day distribution provided a clear empirical basis for further analysis of niche differentiation and future spatial responses under climate change.
As shown in Figure 2, the current suitable pattern of Betula utilis forest was characterized by obvious montane clustering, with core suitable areas centered on the Qinling Mountains. This suggests that the species is strongly associated with specific mountain environments and has a relatively concentrated ecological niche. The suitable areas of Betula albosinensis forest were more widely distributed and displayed stronger regional continuity, indicating a broader environmental tolerance and a larger suitable niche space. By contrast, the suitable distribution of Betula ermanii krummholz was strongly constrained by alpine conditions in Northeast China, and its suitable habitat was confined to a limited high-elevation range near the timberline, reflecting the typical characteristics of a cold-limited and altitude-restricted vegetation type[12,13,14,15,16].
Overall, the three birch forest vegetation types occupied clearly differentiated positions within China’s mountain eco-geographical pattern. Betula utilis forest tended to represent a concentrated montane distribution type, Betula albosinensis forest corresponded to a broad montane expansion type, and Betula ermanii krummholz represented a high-altitude or high-latitude cold-habitat-limited type. This current spatial divergence indicates that, even within the same genus, different birch forest vegetation types are subject to substantially different environmental constraints and adaptive strategies. Such differences are also likely to shape their contrasting responses to future climate change.
3.3. Key Environmental Factors and Their Driving Roles
Figure 3 and Figure 4 show that the dominant environmental factors for the three types of birch forests are not consistent. Variable contribution rates and jackknife test results indicate that the environmental factors influencing the suitable distribution of the three types of birch forests are generally dominated by climatic factors, with topographic factors playing an important synergistic role in some types, while soil factors and anthropogenic disturbance factors primarily manifest as local moderating effects. Similar studies indicate that temperature, precipitation, and elevation are typically the core factors determining plant suitability patterns, though the combinations of dominant factors vary among different vegetation types.
Examining the relative relationships among the three sub-figures: for the left-hand type, the high-contribution variables are primarily precipitation-related factors and DEM, suggesting that this type is more sensitive to regional moisture conditions and topographic background; the high-contribution variables for the middle type are more concentrated on temperature factors and DEM, indicating that its suitability pattern is primarily controlled by thermal conditions and simultaneously reinforced by mountainous topography; the high-altitude type on the right exhibits higher contributions from DEM and low-temperature-related factors, suggesting that its distribution is more strongly dependent on high-altitude, cool environments. The Jackknife test further indicates that when certain key variables are used individually, they provide significant training gains; however, when these variables are removed, the model’s performance drops markedly, suggesting that they not only have high contribution but also possess strong independent explanatory power.
From an ecological perspective, this result implies that the three types of birch forests are not controlled by the same set of environmental factors in the same way. For the type centered on the Qinling Mountains, the combined influence of water and heat conditions and topographic constraints is more pronounced; for the type with a broader distribution range, temperature and precipitation jointly shape its wider suitable range; whereas for the northeastern alpine dwarf birch forest, the importance of altitude and low-temperature factors is more prominent, which aligns with its actual distribution characteristics near the tree line in a high-altitude, cold, and windy environment.
3.4. Response Curves and Ecological Niche Differentiation Characteristics
To further elucidate the adaptive ranges of the three types of birch forests to dominant environmental factors, this study combines response curve analysis to determine the suitability thresholds of key variables and compares the niche differences among the different types along temperature, moisture, and elevation gradients. Following common practices in recent literature, environmental intervals where the probability of suitability is greater than or equal to 0.5 are considered the relative suitability range, and the suitability thresholds of key variables are extracted based on this.
Figure 5 further illustrates the niche differences among the three types of birch forests along key environmental gradients. First, on the annual mean temperature (Bio1) response curve, one type exhibits a peak clearly shifted toward the low-temperature zone, with the optimal range roughly located around 0–2 °C; the other two types, however, reach a higher occurrence probability around 9–10 °C. This indicates a distinct stratification in heat requirements among the three types of birch forests. The type with the lowest optimal temperature corresponds to the alpine cold-adapted type, namely the dwarf birch forest, while the other two types are better adapted to the milder environments of the mid-mountain or subalpine zones.
Second, on the annual precipitation (Bio12) response curve, there are significant differences in the width of the curves among the different types. Some types exhibit a distinct peak around 600–800 mm, indicating a clearly defined suitable range for moist conditions; others have flatter curves and a broader suitable range, suggesting greater tolerance to moisture conditions. From this perspective, red birch forests are more likely to exhibit a wider moisture niche, whereas types with more concentrated distributions and stronger dependence on mountainous terrain often have a more concentrated suitable range for precipitation.
Third, vertical differentiation among the three types is even more pronounced in the response curves for the coldest monthly minimum temperature (Bio6) and DEM. In Figure 5, one type exhibits its strongest peak near an DEM of approximately 2,000 m and demonstrates greater tolerance for colder conditions, which is highly consistent with the high-altitude, cold-adapted characteristics of dwarf mountain birch forests; The other two types exhibit lower elevation peaks, indicating that they primarily correspond to the mid-mountain or subalpine zones, rather than the upper limit of the tree line. In other words, Figure 5 effectively illustrates the ecological niche differentiation among the three birch forest types: one type favors low temperatures and high elevations, another favors moderate temperatures with a wider range of moisture tolerance, and the third is characterized by moderate heat and specific mountainous environments acting as co-determinants.
3.5. Changes in Suitable Habitats Under Future Climate Change Scenarios
Figure 6 shows that the changes in suitable habitats for the three types of birch forests under future climate scenarios do not simply involve overall expansion or contraction, but rather exhibit a common pattern characterized by “stable zones as the main component, with concurrent increases and decreases at the edges.” Regardless of the specific type, stable zones still account for a large proportion overall, indicating that existing core suitable areas will not completely disappear in the future; however, in the peripheral zones of suitable areas, both gain and loss zones coexist, suggesting that the future pattern of birch forests will undergo significant spatial reorganization.
As shown in the left sub-figure of Figure 6, the future gain for this type is significantly greater than the loss; the figure directly presents the change data as a gain of +15.3% and a loss of -5.1%, indicating an overall expansion trend. The bar chart for the middle type shows that high-suitability zones gradually increase from the 2050s to the 2090s, suggesting that its suitable range may continue to expand in the future; Although the right-hand type also exhibits an overall expansion trend, the changes in gain and loss are more concentrated in the peripheral zones, and the spatial adjustment characteristics are more pronounced than the overall expansion. In other words, the response patterns of the three types of birch forests to future climate change are not entirely consistent: some are characterized by peripheral expansion, others by the strengthening of high-suitability zones, and still others by localized restructuring based on a stable core area.
3.6. Characteristics of Center-of-Mass Shift and Their Ecological Implications
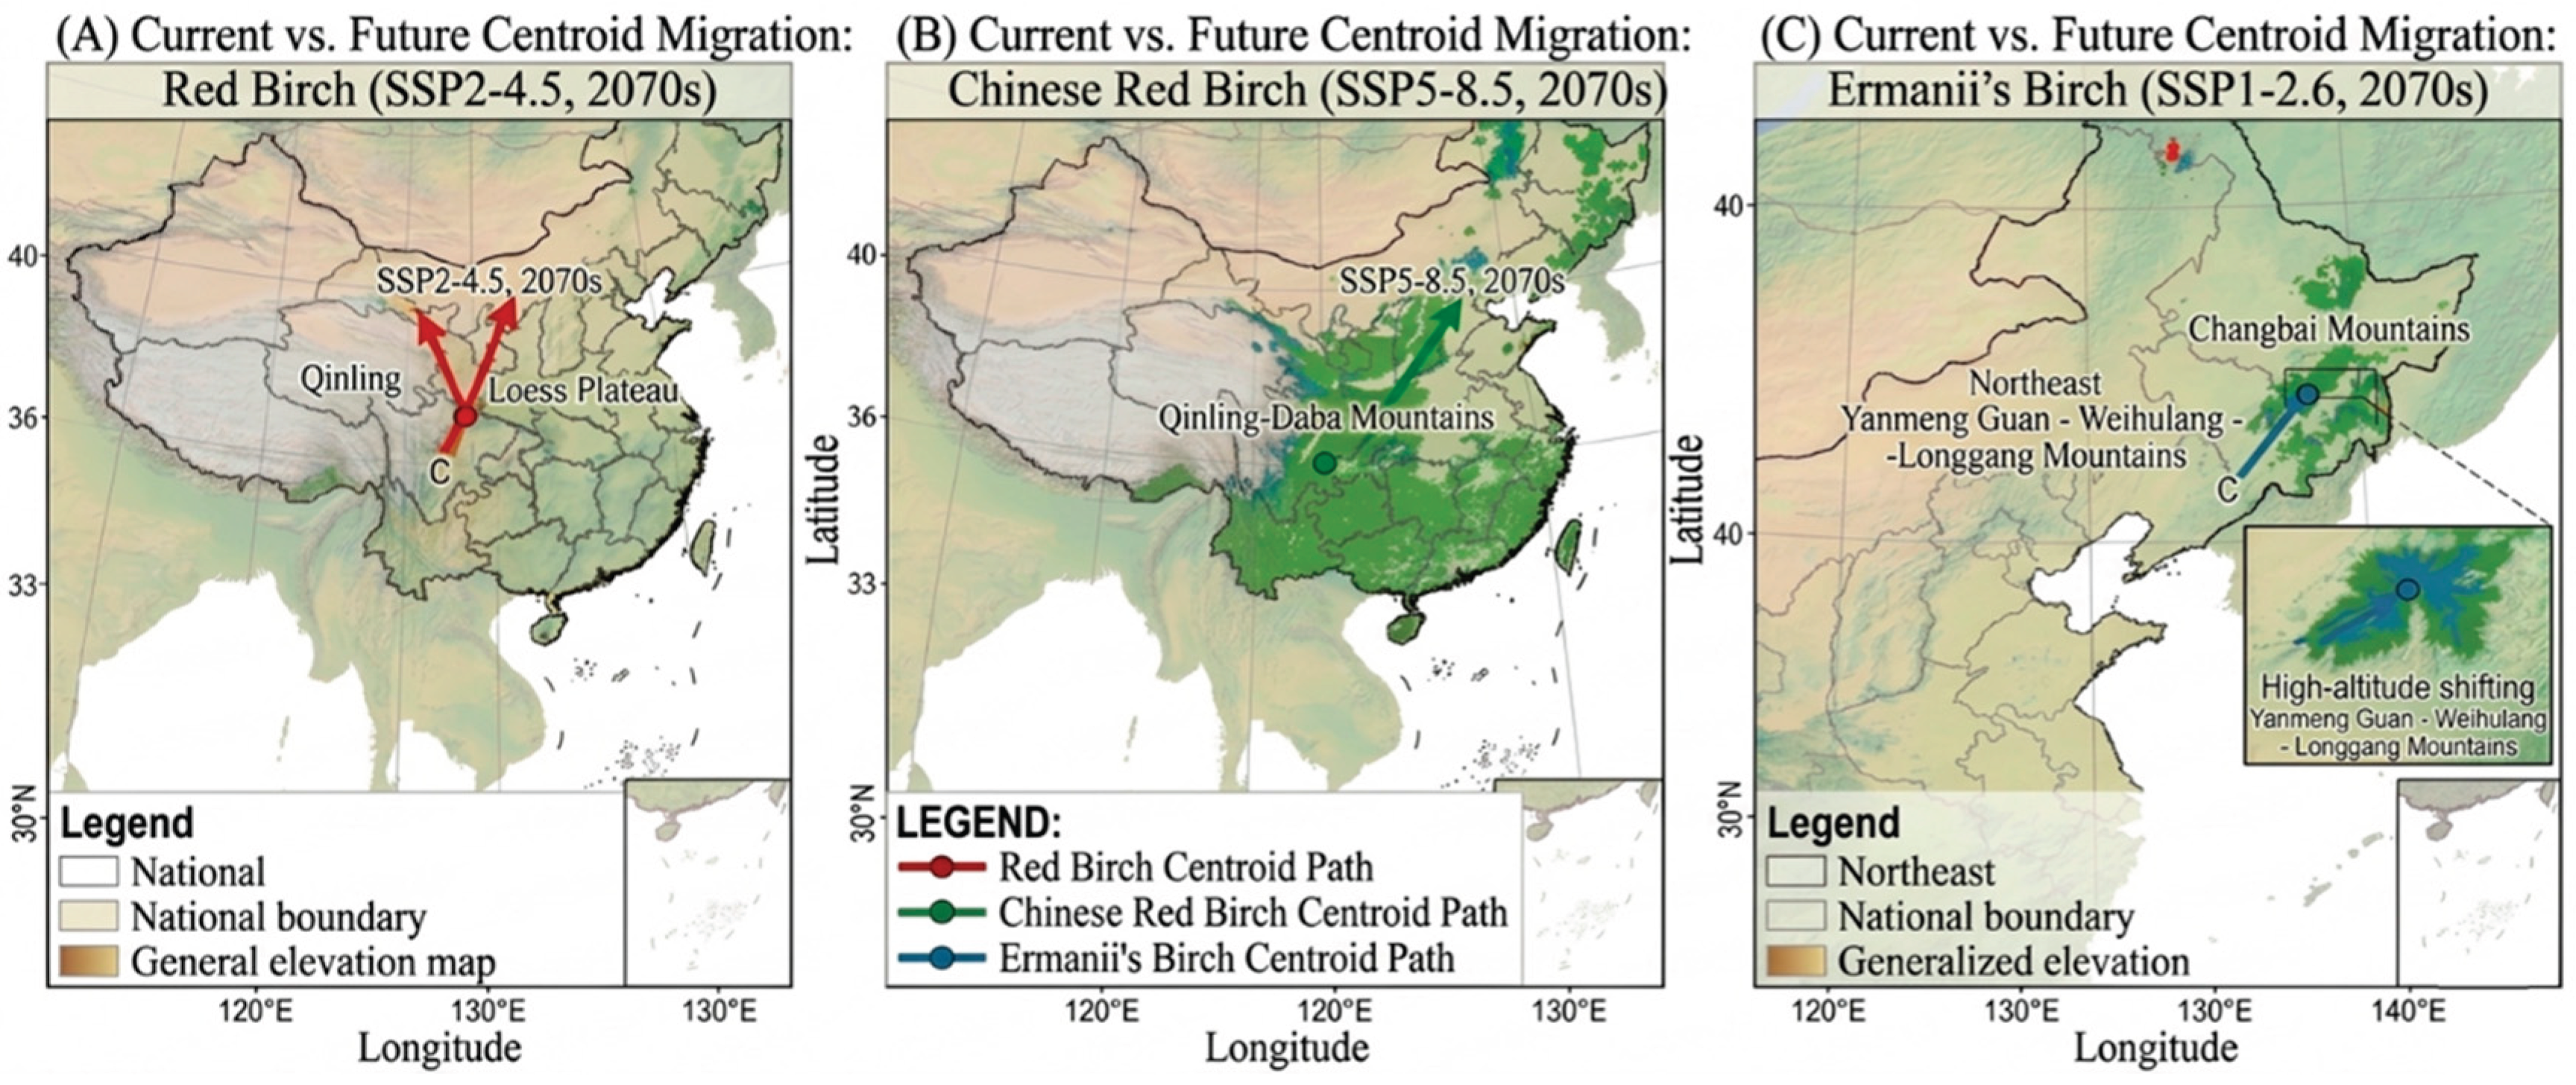
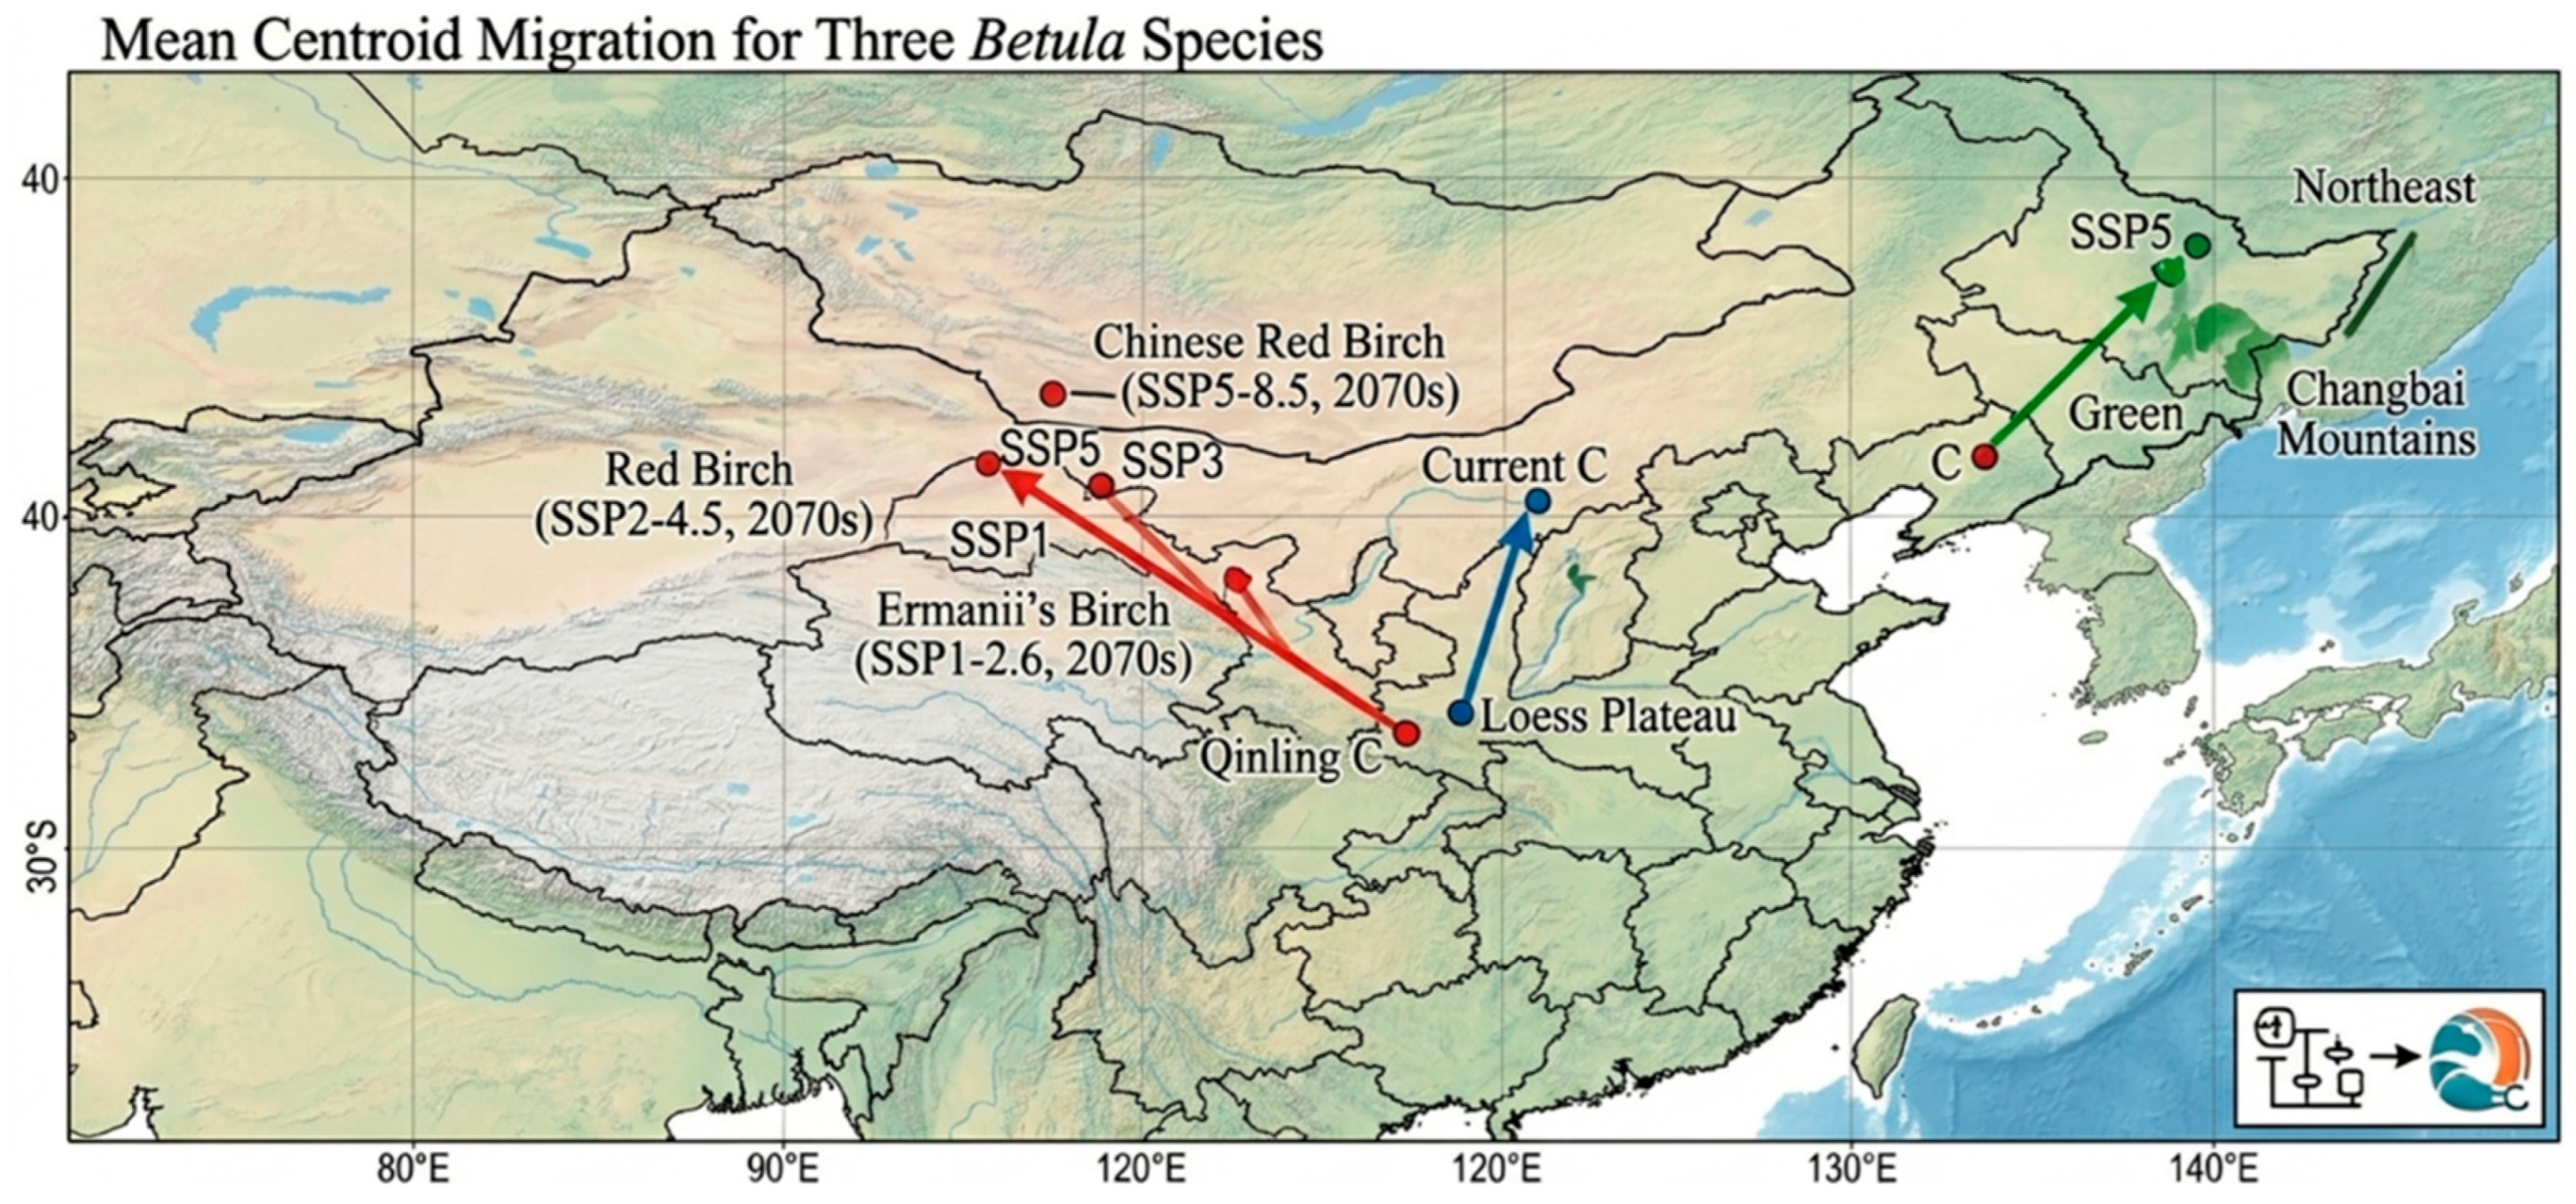
Analysis of center-of-mass shifts indicates (Figure 7)that all three types of birch forests undergo shifts of varying degrees under future climate scenarios, but the directions and patterns of these shifts are not consistent. Overall, all three types exhibit a certain trend toward shifting toward higher latitudes or northeastward. This indicates that, under future climate change, the potential centers of suitability for China’s typical birch forest vegetation types are not static but rather undergo a distinct process of regional redistribution.
Differences in migration direction and distance among the types suggest that their spatial adaptation strategies to future climate change are not identical. Types with larger shifts indicate that their current centers of suitability are more strongly affected by climate change and may undergo significant regional reorganization in the future; types with smaller shifts suggest that their core distribution areas will remain relatively stable for a certain period. If the cow-bark birch or red birch forests primarily exhibit horizontal shifts in the future, this suggests they may maintain their suitable habitats through spatial adjustments at the regional scale; if dwarf birch forests exhibit a more pronounced tendency to concentrate at higher elevations, this reflects a stronger vertical migration tendency.
Combining these findings with the results on changes in the elevation of suitable habitats reveals that if the average suitable elevation of dwarf birch forests continues to rise, it implies that their suitable centers are shifting upward to higher mountainous areas. For alpine vegetation, while this upward shift may help maintain cool habitats in the short term, it also implies that these species may face the problem of “limited space at the alpine summit” in the future—that is, there is limited space for the suitable habitat zone to shift further upward, posing a potential risk of having “nowhere to retreat.” In contrast, if red birch and cowhide birch forests retain some room for horizontal expansion, their future adaptive capacity may be relatively stronger.
From an ecological perspective, the shift in the center of gravity essentially reflects the reconfiguration of potential suitable habitats. This shift represents not only an adaptive adjustment by the three types of birch forests to future climate change but also suggests that the spatial pattern of China’s mountainous birch forests may undergo significant restructuring at the regional scale. The co-authored paper you provided also combines the discussion of future changes in suitable habitats with the shift in the center of gravity, thereby elevating “areal changes” to the level of “spatial restructuring.”
Figure 8.
Trajectories of center-of-gravity shifts for different birch forest vegetation types under future climate change scenarios.
Figure 8.
Trajectories of center-of-gravity shifts for different birch forest vegetation types under future climate change scenarios.
4. Discussion
4.1. Ecological Differentiation Among Birch Forest Vegetation Types
The results showed that the three birch forest vegetation types differed in current suitable distribution patterns, dominant environmental factors, and future spatial changes. This indicates that birch forests in China should not be treated as a single homogeneous vegetation group when assessing climate change responses. Instead, vegetation-type-level analysis can reveal differences that may be obscured in species-level or genus-level assessments[15].
The concentrated suitable distribution of Betula utilis forest in the Qinling Mountains reflects its close association with montane environmental conditions in central China. The broader distribution of Betula albosinensis forest indicates a wider range of suitable environmental conditions across montane regions. In contrast, the restricted distribution of Betula ermanii krummholz in Northeast China reflects its association with cold and high-elevation habitats[16]. These differences provide the basis for interpreting their divergent responses under future climate scenarios.
The results of this study suggest that although the three birch forest types belong to the same genus, they are not controlled by the same set of environmental factors in a uniform manner, reflecting deep ecological niche differentiation[17]. The current spatial divergence indicates that Betula utilis forest corresponds to a concentrated montane distribution type strongly associated with specific mountain environments (such as the Qinling Mountains) where water, heat, and topographic constraints jointly dictate its niche. Betula albosinensis forest represents a broad montane expansion type, indicating broader environmental tolerance and a wider moisture and thermal niche space. By contrast, Betula ermanii krummholz represents a typical cold-limited and altitude-restricted vegetation type. Its dependence on high-altitude (e.g., >2000m) and low-temperature environments aligns perfectly with its actual distribution near the alpine timberline, where harsh winds and extreme cold shape its characteristic dwarf morphology[18]. Figure 5 effectively illustrates this ecological niche differentiation: one type favors low temperatures and high elevations, another favors moderate temperatures with broad moisture tolerance, and the third relies on specific mid-mountain topo-climates.
4.2. Environmental Controls and Niche Differentiation
The contribution rates, Jackknife results, and response curves showed that climatic variables were the main determinants of habitat suitability for the three birch forest types. However, the dominant variables differed among types, suggesting that their suitable habitats are controlled by different combinations of temperature, precipitation, and elevation.
For Betula utilis forest, precipitation-related variables and elevation contributed strongly to model prediction, indicating that its suitable distribution is influenced by both moisture conditions and mountain topography[19]. For Betula albosinensis forest, the combined contribution of temperature, precipitation, and elevation reflects its broad montane distribution. For Betula ermanii krummholz, the high contribution of elevation and low-temperature-related variables is consistent with its distribution near alpine timberline environments[20].
This pattern is consistent with previous studies showing that temperature, precipitation, and elevation are key factors shaping the distribution of forest vegetation. However, the present study further shows that the relative importance and combination of these factors differ among birch forest vegetation types[21]. Therefore, the ecological response of birch forests to climate change should be understood from the perspective of vegetation-type-specific niche differentiation rather than as a uniform response of the genus Betula.
Type-specific Responses and Spatial Restructuring under Climate Change Under future climate change scenarios, the potential centers of suitability for China’s typical birch forest vegetation types are not simply expanding or shrinking uniformly, but undergoing distinct regional spatial restructuring[22] The differences in migration direction and distance suggest highly type-specific spatial adaptation strategies. Betula albosinensis and Betula utilis forests mainly demonstrate horizontal expansions and regional spatial adjustments. Their shift trajectories suggest that they may maintain or even expand their suitable habitats through spatial expansion toward higher latitudes or northeastward regions[23] Conversely, Betula ermanii krummholz exhibits a pronounced tendency to shift toward higher elevations, reflecting a strong vertical migration strategy. For alpine-restricted vegetation, while this upward shift may temporarily help track required cool habitats, it implies a critical ecological risk: “mountain-top extinction”. As the suitable habitat zone is forced further upward, the physical landmass available at mountain summits diminishes.[17] Eventually, this species faces the danger of having nowhere to retreat as its extreme-cold niche disappears from the landscape.
4.3. Type-Specific Responses to Future Climate Change
The future projections showed that changes in suitable habitat area, spatial stability, and centroid migration differed among the three birch forest types. This result suggests that climate change will not produce a single distributional response pattern for birch forests in China. Instead, each vegetation type shows a specific pattern of spatial adjustment.
For Betula utilis forest and Betula albosinensis forest, future changes were mainly expressed as regional spatial adjustment and partial expansion of suitable habitats[17]. Their centroid shifts indicate that these two vegetation types may track future environmental changes through horizontal redistribution across montane regions. By contrast, Betula ermanii krummholz showed a stronger association with high-elevation cold habitats[24]. If future high-suitability areas become increasingly concentrated at higher elevations, this type may face greater spatial restriction than the other two birch forest types.
The comparison between horizontal centroid migration and elevational redistribution is important for understanding the spatial response mechanisms of montane vegetation. Horizontal shifts reflect changes in the geographic center of suitable habitats, whereas elevational changes reflect redistribution along vertical environmental gradients[25]. The combination of these two analyses provides a more complete basis for evaluating climate-driven changes in montane forest vegetation.
Research Limitations and Model Uncertainty It is necessary to acknowledge the limitations of this study, particularly regarding the dataset and model constraints for rare habitat types. Due to its highly restricted alpine habitat and naturally fragmented distribution, Betula ermanii krummholz only had 6 independent occurrence records after rigorous spatial thinning[25]. We addressed this statistically by explicitly restricting the MaxEnt model to the ENMeval-optimized L-1.0 parameter combination.
While L-1.0 consistently ranked first among the 54 combinations (ΔAICc = 0), evaluating parameter stability under such an extreme small-sample condition is critical. The exclusive reliance on linear features (FC=L) serves as a necessary “double-edged sword”. On one hand, it effectively prevents the model from fitting spurious environmental noise, thereby mitigating severe overfitting and providing the maximum mathematical stability achievable for this dataset. On the other hand, this strict simplification means the model inevitably under-represents complex, non-linear ecological responses. Consequently, while the L-1.0 setting guarantees theoretical reliability and prevents extreme prediction bias, its overall predictive robustness and parameter stability remain inherently lower than those of the other two widely distributed species[26、33]. Therefore, the future spatial modeling results for Betula ermanii krummholz should be interpreted cautiously as a macroscopic indicator of ecological vulnerability and an upward contraction trend, rather than as precise quantitative geographic boundaries.
For Betula ermanii krummholz, the projected concentration of suitable habitats in high-elevation cold environments should be interpreted as a tendency toward elevational range contraction rather than direct evidence of extinction. Elevational range contraction refers to the narrowing of the vertical distribution range when the lower elevational limit shifts upward faster than the upper elevational limit[27]. In montane systems, such contraction may be further constrained by limited land area at higher elevations, more broadly, the “escalator to extinction” mechanism. However, because the present study is based on habitat suitability modeling rather than long-term population monitoring, the results indicate potential spatial restriction and habitat compression, rather than confirmed mountaintop extinction.
4.4. Conservation and Management Implications
The spatial classification of gain, stable, and loss areas provides useful information for conservation planning. Stable suitable areas can be regarded as priority areas for in situ conservation and long-term monitoring because they represent habitats that remain suitable under both current and future scenarios. Gain areas can be considered as potential regions for future habitat expansion, restoration planning, and ecological corridor construction[28]. Loss areas require attention because they indicate regions where habitat suitability may decline under future climate scenarios.
Management strategies should differ among vegetation types. For Betula utilis forest and Betula albosinensis forest, conservation should focus on maintaining the connectivity between current core suitable areas and potential future gain areas. For Betula ermanii krummholz, more attention should be given to high-elevation suitable habitats and their spatial continuity[29]. Because this vegetation type is more restricted in distribution, monitoring of high-altitude habitats is particularly important for assessing future habitat changes.
4.5. Limitations and Future Research
This study has several limitations. First, the number of occurrence records differed greatly among the three birch forest vegetation types, especially for Betula ermanii krummholz[30]. The small sample size may affect model stability and should be considered when interpreting its predicted suitable distribution. Future studies should improve occurrence records through field surveys, herbarium data, and high-resolution vegetation mapping.
this study mainly used climatic, topographic, soil, human disturbance, and land-use variables to predict suitable habitats. However, species interactions, dispersal limitation, regeneration capacity, and disturbance history were not explicitly incorporated into the model. These factors may also influence the realized distribution of birch forest vegetation[31,32,33,34].
future projections were based on selected climate scenarios and a single climate model. Although the selected model provides a consistent basis for comparison, future studies should incorporate multiple global climate models and compare uncertainty among models and scenarios[32,33,34,35]. In addition, combining species distribution models with landscape connectivity analysis, demographic models, or field validation would further improve the ecological interpretation of future habitat changes.
5. Conclusions
This study identified clear differences in the current suitable distribution patterns of the three birch forest vegetation types in China. Betula utilis forest was mainly concentrated in the Qinling Mountains, Betula albosinensis forest showed a broader montane distribution pattern, and Betula ermanii krummholz was restricted to high-altitude or high-latitude cold habitats. These distribution patterns indicate distinct spatial differentiation among the three vegetation types.
The dominant environmental factors differed among the three birch forest types. Climatic variables were the primary determinants of habitat suitability, while topographic factors, especially elevation, further contributed to the differentiation of suitable habitats. Response curves showed that the three vegetation types occupied different positions along temperature, precipitation, and elevation gradients, confirming niche differentiation among typical birch forest vegetation types.
Future projections revealed type-specific changes in suitable habitat area, spatial stability, and centroid migration. Betula utilis forest and Betula albosinensis forest mainly exhibited regional spatial adjustment and partial expansion of suitable habitats, whereas Betula ermanii krummholz was more closely associated with high-elevation cold habitats and showed a more restricted potential for spatial adjustment. These results demonstrate that the responses of birch forest vegetation to climate change vary among vegetation types rather than following a uniform pattern.
Stable suitable areas identified in this study can be regarded as priority areas for in situ conservation and long-term monitoring. Potential gain areas may serve as candidate regions for future habitat expansion and restoration planning. For alpine-restricted vegetation types such as Betula ermanii krummholz, conservation strategies should focus on high-elevation suitable habitats and their spatial connectivity.
Author Contributions
Conceptualization, H.Z.; methodology, H.Z.; software, R.S.; validation, H.Z., Z.W. and Y.Z.; formal analysis, R.S.; investigation, H.Z. and R.S.; resource, H.Z.; data curation, R.S.; writing-original draft preparation, H.Z. and R.S.; writing-review and editing, H.Z., R.S., Z.W.,Y.Z. and Z.L.; visualization, R.S.; supervision, H.Z.; project administration, H.Z. and Z.L.; funding acquisition, H.Z. All authors have read and agreed to the published version of the manuscript..
Funding
This research was funded by the National Water Pollution Control and Treatment Science and Technology Major Project (2017ZX07101) and the Discipline Construction Program of Huayong Zhang, Distinguished Professor of Shandong University, School of Life Sciences (61200082363001).
Institutional Review Board Statement
Not applicable.
Informed Consent Statement
Not applicable.
Data Availability Statement
All links to input data are reported in the manuscript and all output data are available upon request to the authors.
Conflicts of Interest
The authors declare no conflicts of interest.
References
- Parmesan, C.; Yohe, G. A globally coherent fingerprint of climate change impacts across natural systems[J]. nature 2003, 421(6918), 37–42. [Google Scholar] [CrossRef]
- Guisan, A.; Thuiller, W. Predicting species distribution: offering more than simple habitat models[J]. Ecol. Lett. 2005, 8, 993–1009. [Google Scholar] [CrossRef]
- Opdam, P.; Wascher, D. Climate change meets habitat fragmentation: linking landscape and biogeographical scale levels in research and conservation[J]. Biol. Conserv. 2004, 117(3), 285–297. [Google Scholar] [CrossRef]
- Elith, J.; Leathwick, J. R. Species distribution models: ecological explanation and prediction across space and time[J]. Annu. Rev. Ecol. Evol. Syst. 2009, 40, 677–697. [Google Scholar] [CrossRef]
- Elith, J.; Phillips, S. J.; Hastie, T.; et al. A statistical explanation of MaxEnt for ecologists[J]. Divers. Distrib. 2011, 17, 43–57. [Google Scholar] [CrossRef]
- Warren, D. L.; Seifert, S. N. Ecological niche modeling in Maxent: the importance of model complexity and the performance of model selection criteria[J]. Ecol. Appl. 2011, 21, 335–342. [Google Scholar] [CrossRef]
- Lenoir, J.; Gégout, J. C.; Marquet, P. A.; et al. A significant upward shift in plant species optimum elevation during the 20th century[J]. science 2008, 320(5884), 1768–1771. [Google Scholar] [CrossRef] [PubMed]
- Haddad, N. M.; Brudvig, L. A.; Clobert, J.; et al. Habitat fragmentation and its lasting impact on Earth’s ecosystems[J]. Sci. Adv. 2015, 1(2), e1500052. [Google Scholar] [CrossRef]
- Muscarella, R.; Galante, P. J.; Soley-Guardia, M.; et al. ENMeval: an R package for conducting spatially independent evaluations and estimating optimal model complexity for Maxent ecological niche models[J]. Methods Ecol. Evol. 2014, 5, 1198–1205. [Google Scholar] [CrossRef]
- Li, G.; Liu, C.; Liu, Y.; et al. Research progress on theoretical issues of species distribution models [J]. Acta Ecol. Sin. 2013, 33, 4827–4835. [Google Scholar]
- Wu, T.; Lu, Y.; Fang, Y.; et al. The Beijing Climate Center Climate System Model (BCC-CSM): the main progress from CMIP5 to CMIP6[J]. Geosci. Model Dev. 2019, 12, 1573–1600. [Google Scholar] [CrossRef]
- Li, Y.; Li, M.; Li, C.; et al. Optimized Maxent model predictions of climate change impacts on the suitable distribution of Cunninghamia lanceolata in China[J]. Forests 2020, 11, 302. [Google Scholar] [CrossRef]
- Zhao, Y.; Deng, X.; Xiang, W.; et al. Predicting potential suitable habitats of Chinese fir under current and future climatic scenarios based on Maxent model[J]. Ecol. Inform. 2021, 64, 101393. [Google Scholar] [CrossRef]
- Faber-Langendoen D, Keeler-Wolf T, Meidinger D, et al. Classification and description of world formation types. Part II (Description of formation types)[J]. Faber-Langendoen, D.; Keeler-Wolf, T.; Meidinger, D.; Josse, C.; Weakley, A.; Tart, D.; Navarro, G.; Hoagland, B.; Ponomarenko, S.; Saucier, JP; Fults, G.; Helmer, E. 2012. Classification and description of world formation types. Part II (Description of formation types). Hierarchy Revisions Working Group, Federal Geographic Data Committee, FGDC Secretariat, US Geological Survey and NatureServe, Reston, VA and Arlington, VA., 2012.
- He, Y.; Xiong, Q.; Yu, L.; et al. Impact of climate change on potential distribution patterns of alpine vegetation in the Hengduan Mountains region, China[J]. Mt. Res. Dev. 2020, 40, R48–R54. [Google Scholar] [CrossRef]
- Zhang, H.; Zhou, Y.; Ji, X.; Wang, Z.; Liu, Z. Climate change drives the adaptive distribution and habitat fragmentation of Betula albosinensis forests in China[J]. Forests 2025, 16, 184. [Google Scholar] [CrossRef]
- Zhang, H.; Ma, L.; Zhang, Y.; Wang, Z.; Liu, Z. Climate change drives adaptive distribution and corridor identification of the endangered Rhodiola species on the Tibetan Plateau[J]. Forests 2025, 16, 1865. [Google Scholar] [CrossRef]
- Zhang, H.; Liu, J.; Zhang, Y.; Wang, Z.; Liu, Z. Global warming drives the adaptive distribution and landscape fragmentation of Neosinocalamus affinis forests in China[J]. Forests 2026, 17: 84. [Google Scholar] [CrossRef]
- Townsend, P. A.; Walsh, S. J. Remote sensing of forested wetlands: application of multitemporal and multispectral satellite imagery to determine plant community composition and structure in southeastern USA[J]. Plant Ecol. 2001, 157(2), 129–149. [Google Scholar] [CrossRef]
- Chen, I. C.; Hill, J. K.; Ohlemüller, R.; et al. Rapid range shifts of species associated with high levels of climate warming[J]. Science 2011, 333(6045), 1024–1026. [Google Scholar] [CrossRef]
- Zhang, H.; Zhao, B.; Huang, T.; et al. Responses of the distribution pattern of the suitable habitat of Juniperus tibetica Komarov to climate change on the Qinghai-Tibet Plateau[J]. Forests 2023, 14, 434. [Google Scholar] [CrossRef]
- Radosavljevic, A.; Anderson, R. P. Making better Maxent models of species distributions: complexity, overfitting and evaluation[J]. J. Biogeogr. 2014, 41(4), 629–643. [Google Scholar] [CrossRef]
- Zhang, H.; Zhang, B.; Zhang, Y.; et al. Climate change drives shifts in suitable habitats of three Stipa purpurea alpine steppes on the western Tibetan Plateau[J]. Diversity 2025, 17, 145. [Google Scholar] [CrossRef]
- Ritonga, F. N.; Ngatia, J. N.; Song, R. X.; et al. Abiotic stresses induced physiological, biochemical, and molecular changes in Betula platyphylla: A review[J]. Silva Fenn. 2021, 55(3). [Google Scholar] [CrossRef]
- Xie, B.; Zhang, H.; Ji, X.; Zhao, B.; Wei, Y.; Peng, Y.; Liu, Z. Corridors of Suitable Distribution of Betula platyphylla Sukaczev Forest in China Under Climate Warming[J]. Sustainability 2025, 17(15), 6937. [Google Scholar] [CrossRef]
- Warren, D. L.; Beaumont, L. J.; Dinnage, R.; Baumgartner, J. B. New methods for measuring ENM breadth and overlap in environmental space[J]. Ecography 2019, 42(3), 444–446. [Google Scholar] [CrossRef]
- Xie, B.; Zhang, H.; Ji, X.; et al. Corridors of Suitable Distribution of Betula platyphylla Sukaczev Forest in China Under Climate Warming[J]. Sustainability 2025, 17(15), 6937. [Google Scholar] [CrossRef]
- Radosavljevic, A.; Anderson, R. P. Making better Maxent models of species distributions: complexity, overfitting and evaluation[J]. J. Biogeogr. 2014, 41(4), 629–643. [Google Scholar] [CrossRef]
- Yang, W. J.; Sun, S. X.; Wang, N. X.; Fan, P. X.; You, C.; Wang, R. Q.; Zheng, P. M.; Wang, H. Dynamics of the distribution of invasive alien plants (Asteraceae) in China under climate change[J]. Sci. Total Environ. 2023, 903, 166260. [Google Scholar] [CrossRef]
- Radosavljevic, A.; Anderson, R. P. Making better Maxent models of species distributions: complexity, overfitting and evaluation[J]. J. Biogeogr. 2014, 41(4), 629–643. [Google Scholar] [CrossRef]
- Elith, J.; Phillips, S. J.; Hastie, T.; et al. A statistical explanation of MaxEnt for ecologists[J]. Divers. Distrib. 2011, 17(1), 43–57. [Google Scholar] [CrossRef]
- Phillips, S. J.; Anderson, R. P.; Schapire, R. E. Maximum entropy modeling of species geographic distributions[J]. Ecol. Model. 2006, 190(3-4), 231–259. [Google Scholar] [CrossRef]
- Peterson, A. T.; Cohoon, K. P. Sensitivity of distributional prediction algorithms to geographic data completeness[J]. Ecol. Model. 1999, 117(1), 159–164. [Google Scholar] [CrossRef]
- Elith, J.; Leathwick, J. R. Species distribution models: ecological explanation and prediction across space and time[J]. Annu. Rev. Ecol. Evol. Syst. 2009, 40(1), 677–697. [Google Scholar] [CrossRef]
- Yang, M.; Zhao, H. X.; Xian, X. Q.; Liu, H.; Li, J. Y.; Chen, L.; Liu, W. X. Potential global geographical distribution of Lolium temulentum L. under climate change[J]. Front. Plant Sci. 2022, 13, 1024635. [Google Scholar] [CrossRef] [PubMed]
Figure 1.
ENMeval parameter optimization results.
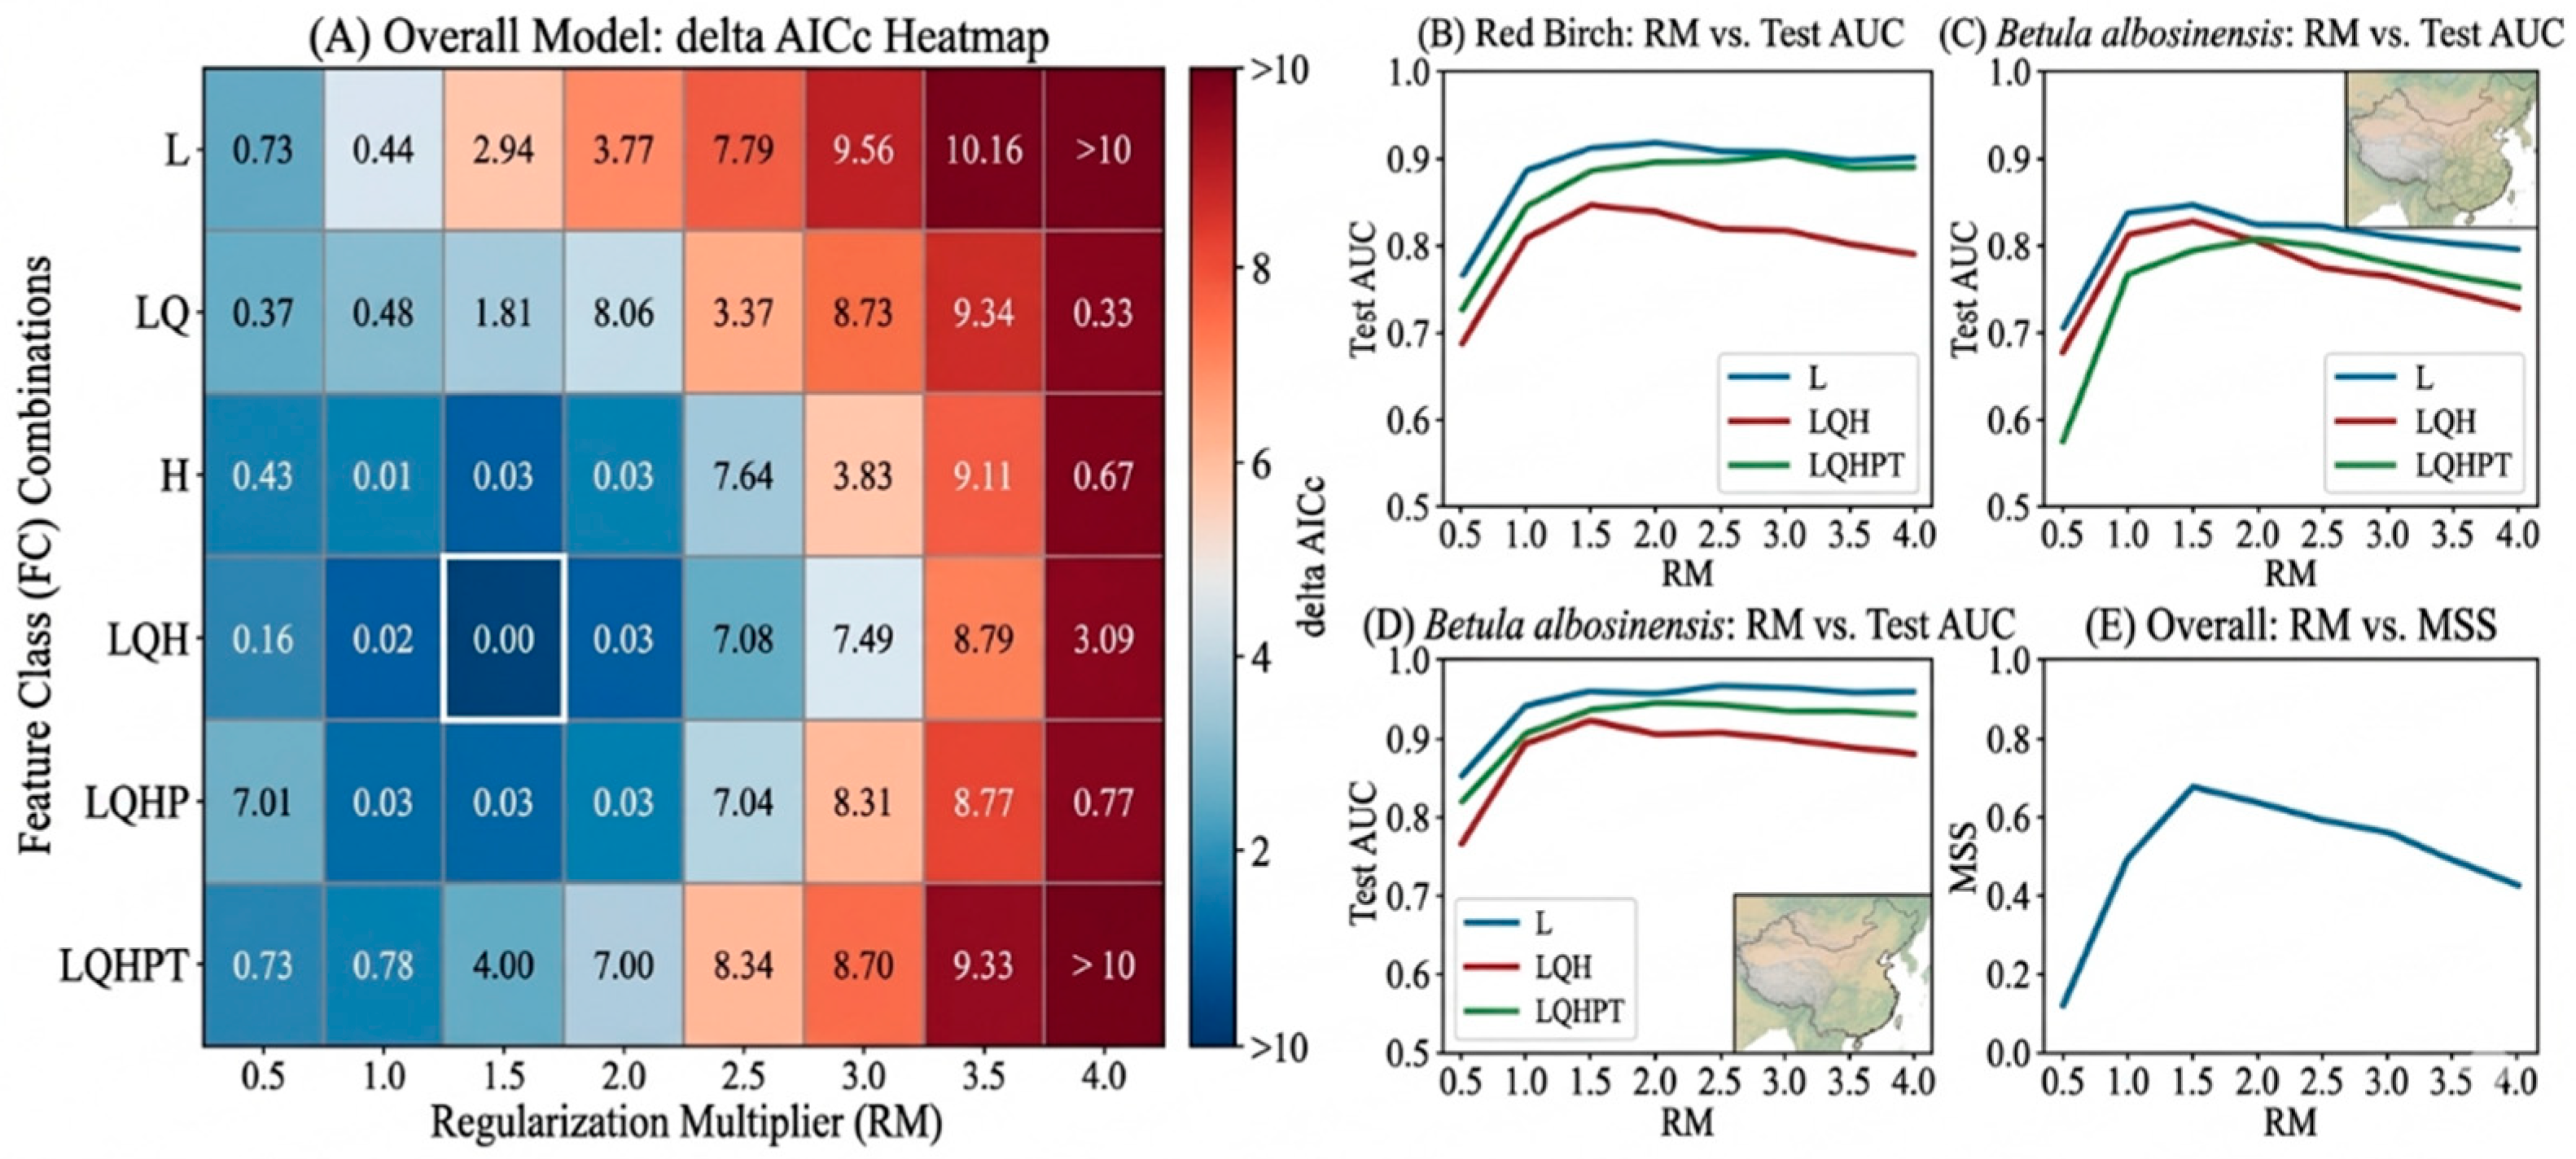
Figure 2.
Current potential suitable distribution patterns of the three birch forest vegetation types in China: (a) Betula utilis forest; (b) Betula albosinensis forest; (c) Betula ermanii krummholz.
Figure 2.
Current potential suitable distribution patterns of the three birch forest vegetation types in China: (a) Betula utilis forest; (b) Betula albosinensis forest; (c) Betula ermanii krummholz.
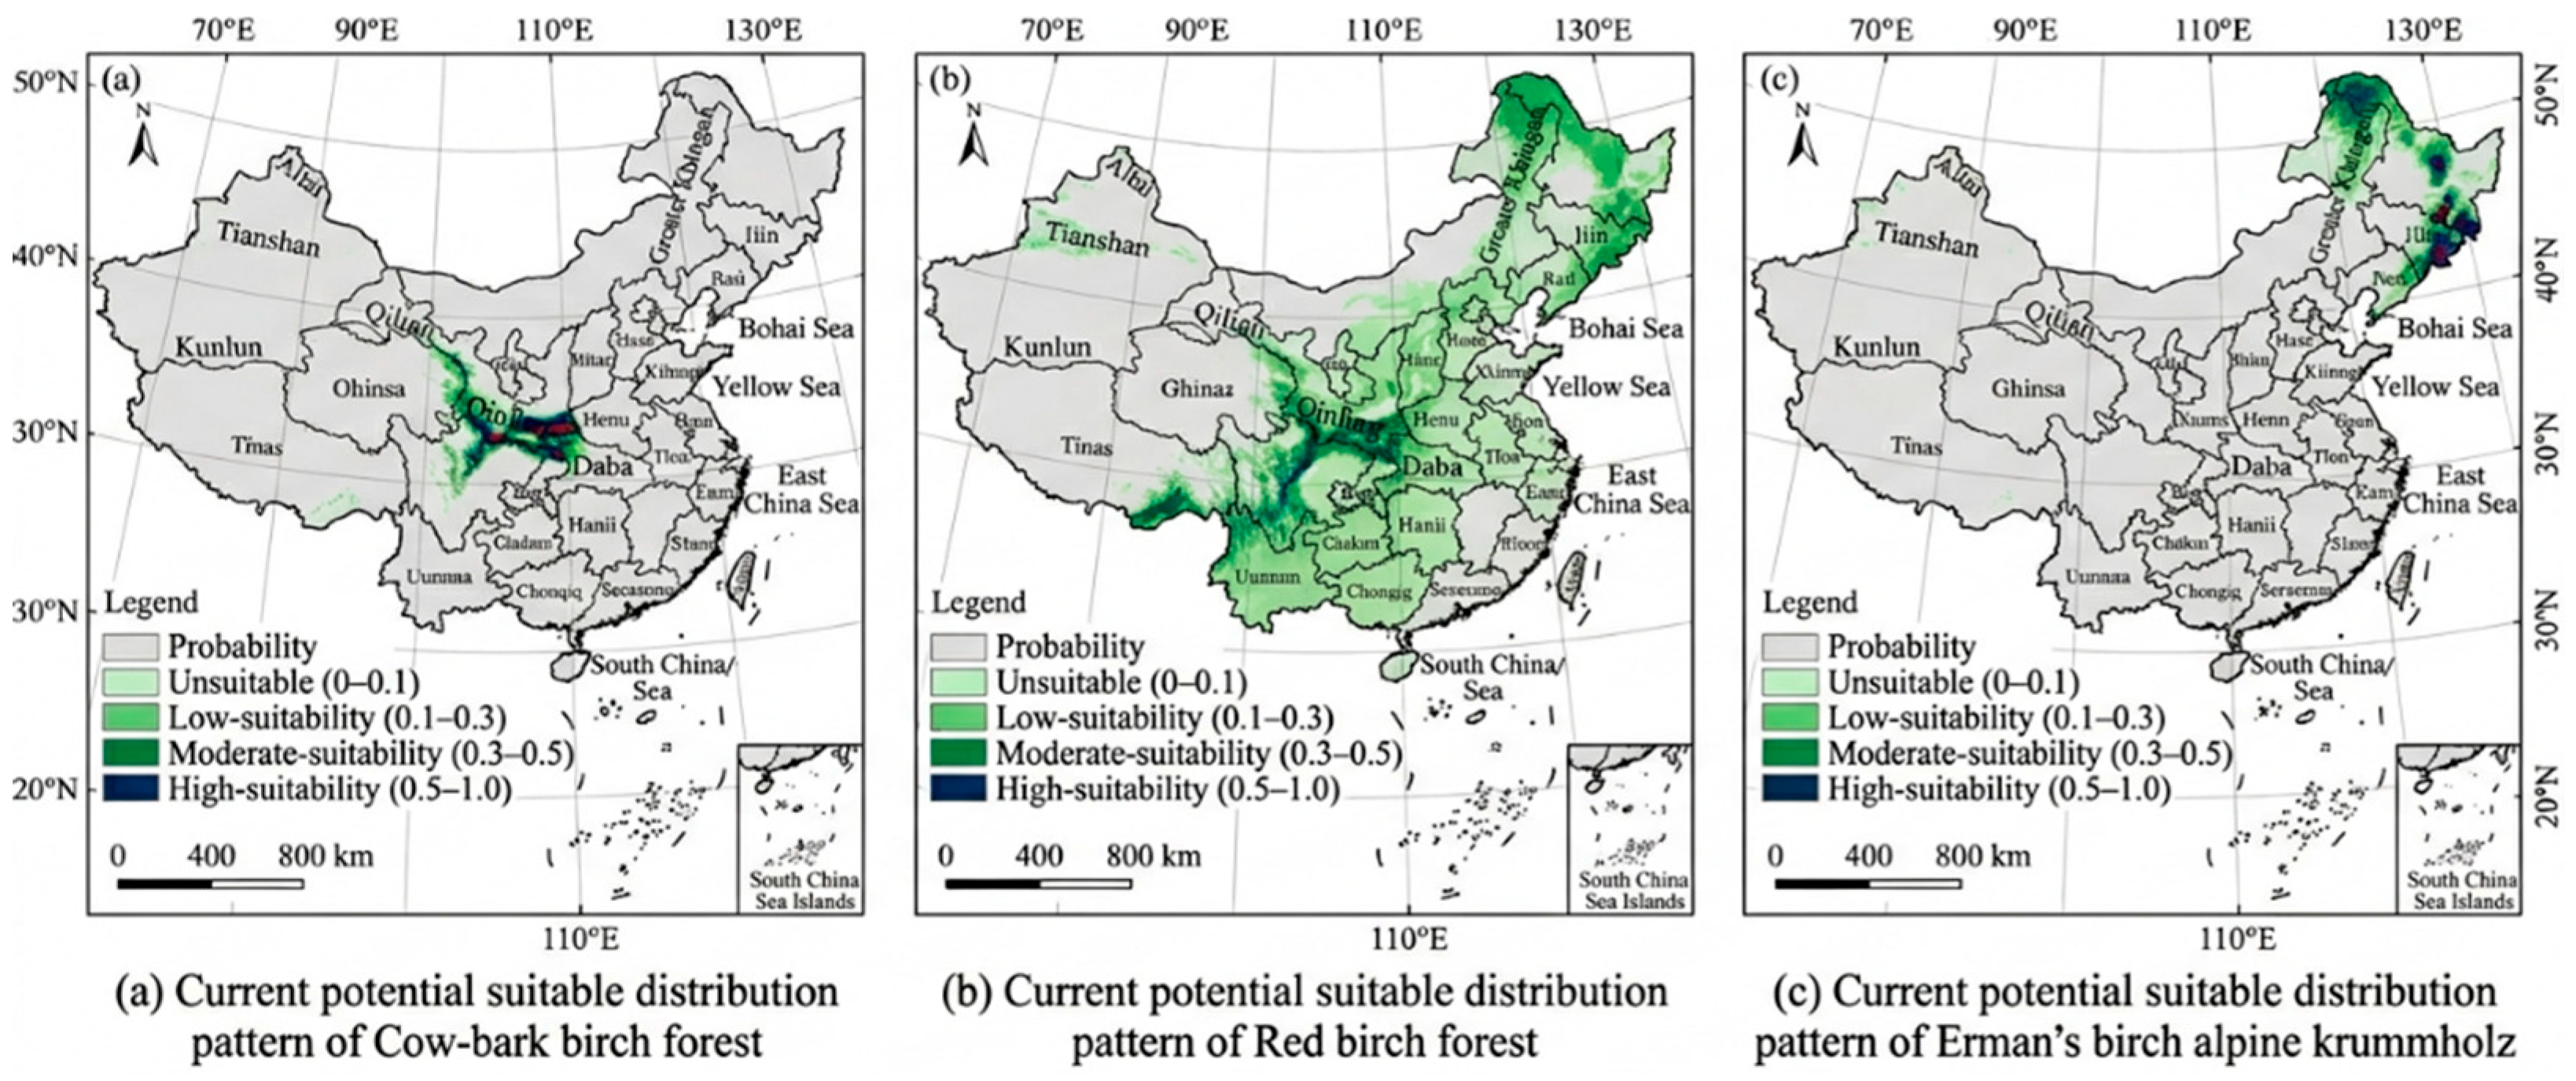
Figure 3.
Comparison of environmental variable contribution rates.
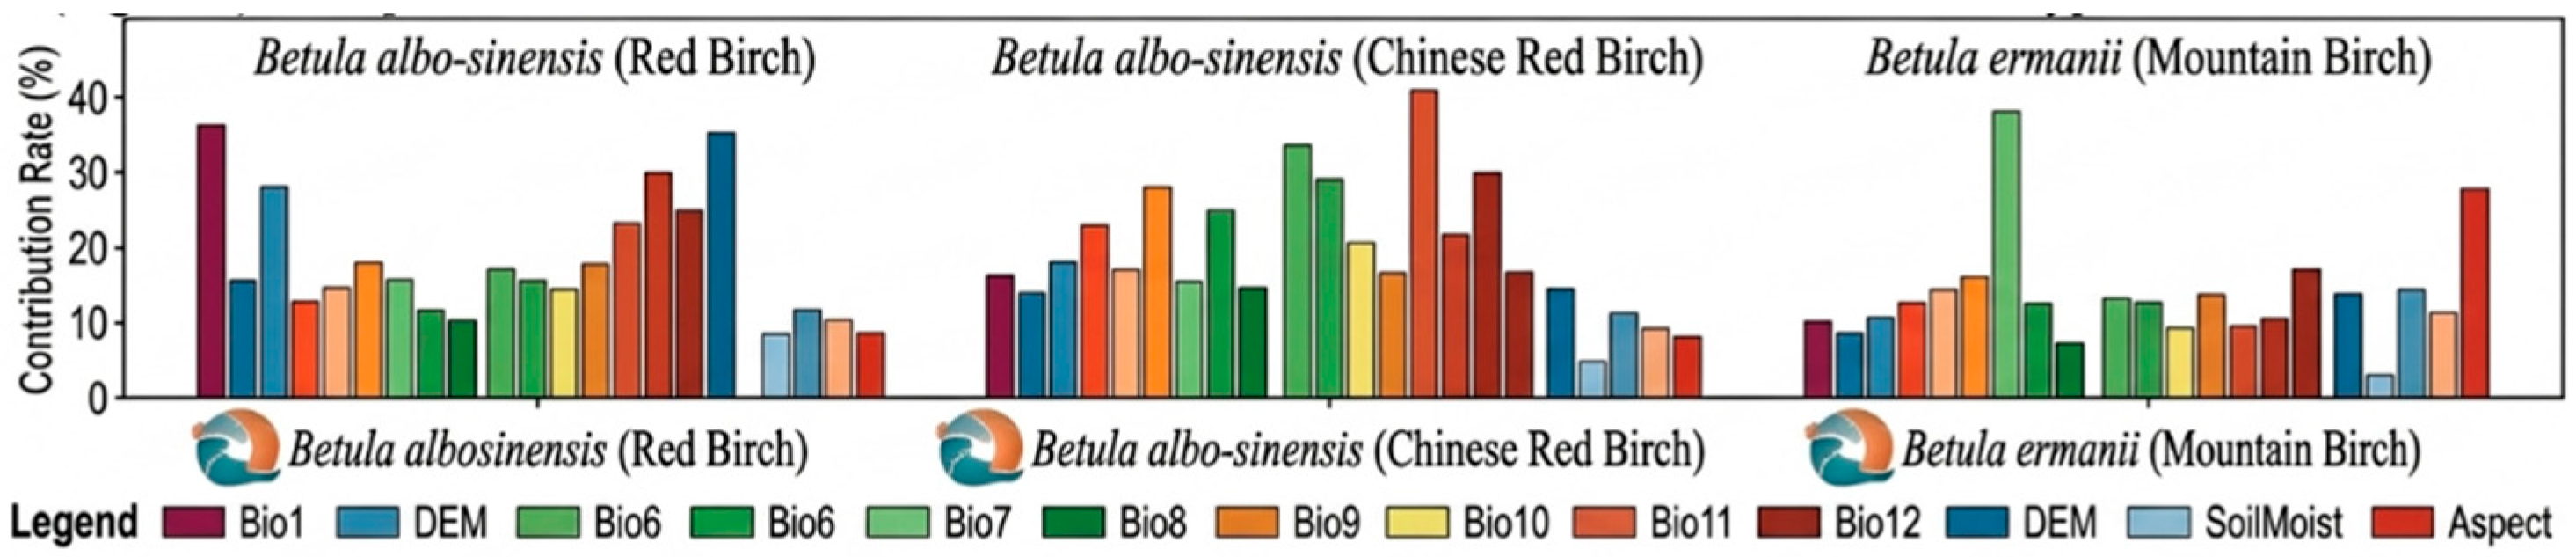
Figure 4.
Jackknife test plot.
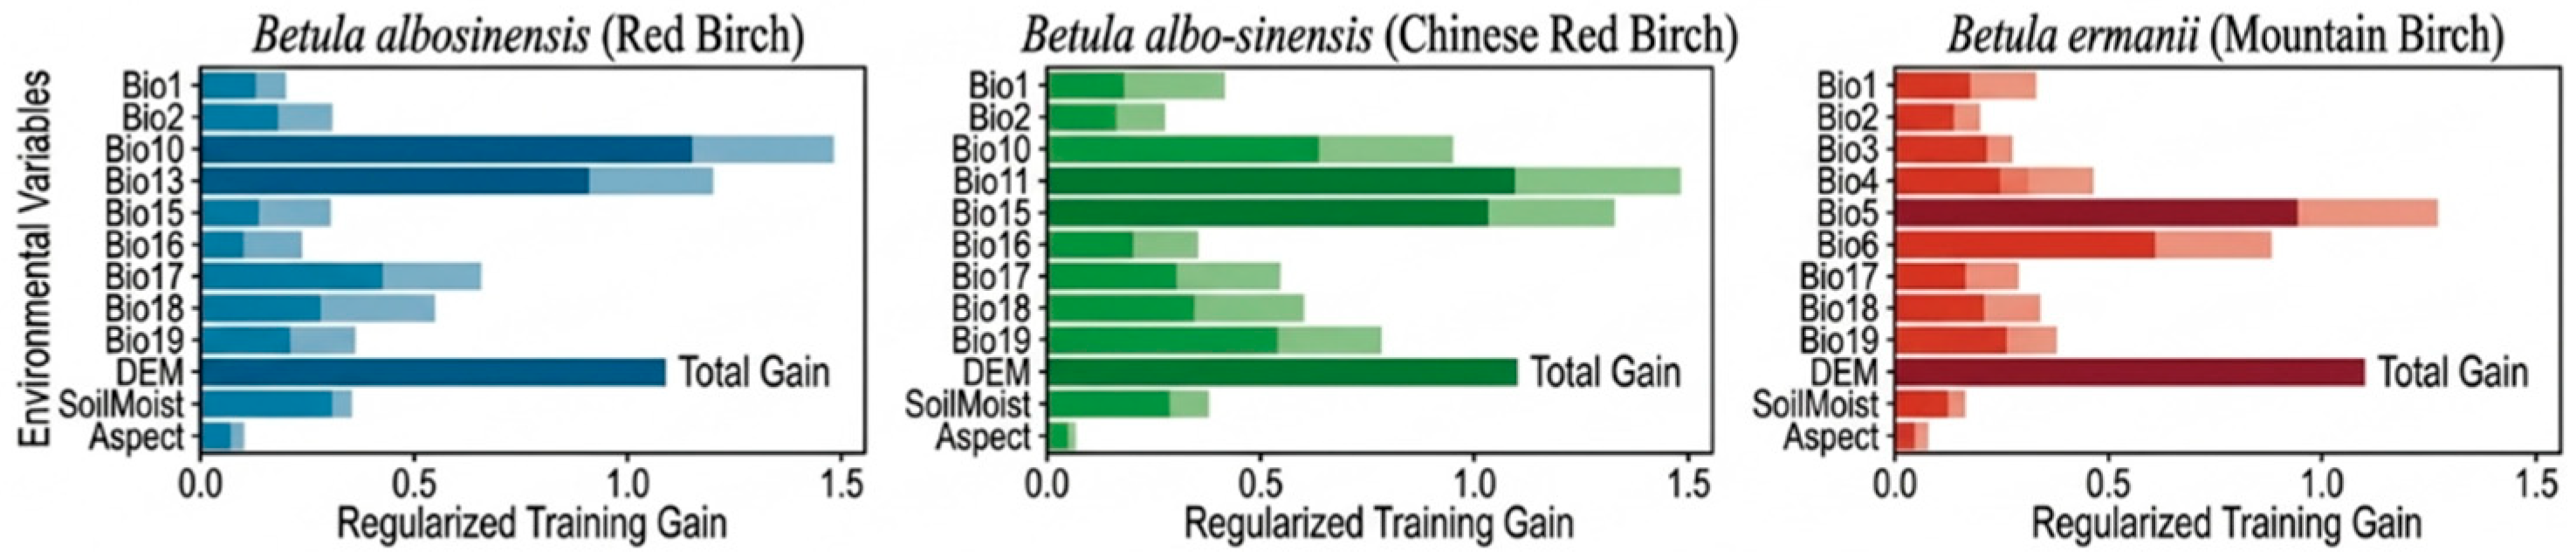
Figure 5.
“Response Curves of Key Environmental Factors for Different Birch Forest Vegetation Types”.
Figure 5.
“Response Curves of Key Environmental Factors for Different Birch Forest Vegetation Types”.
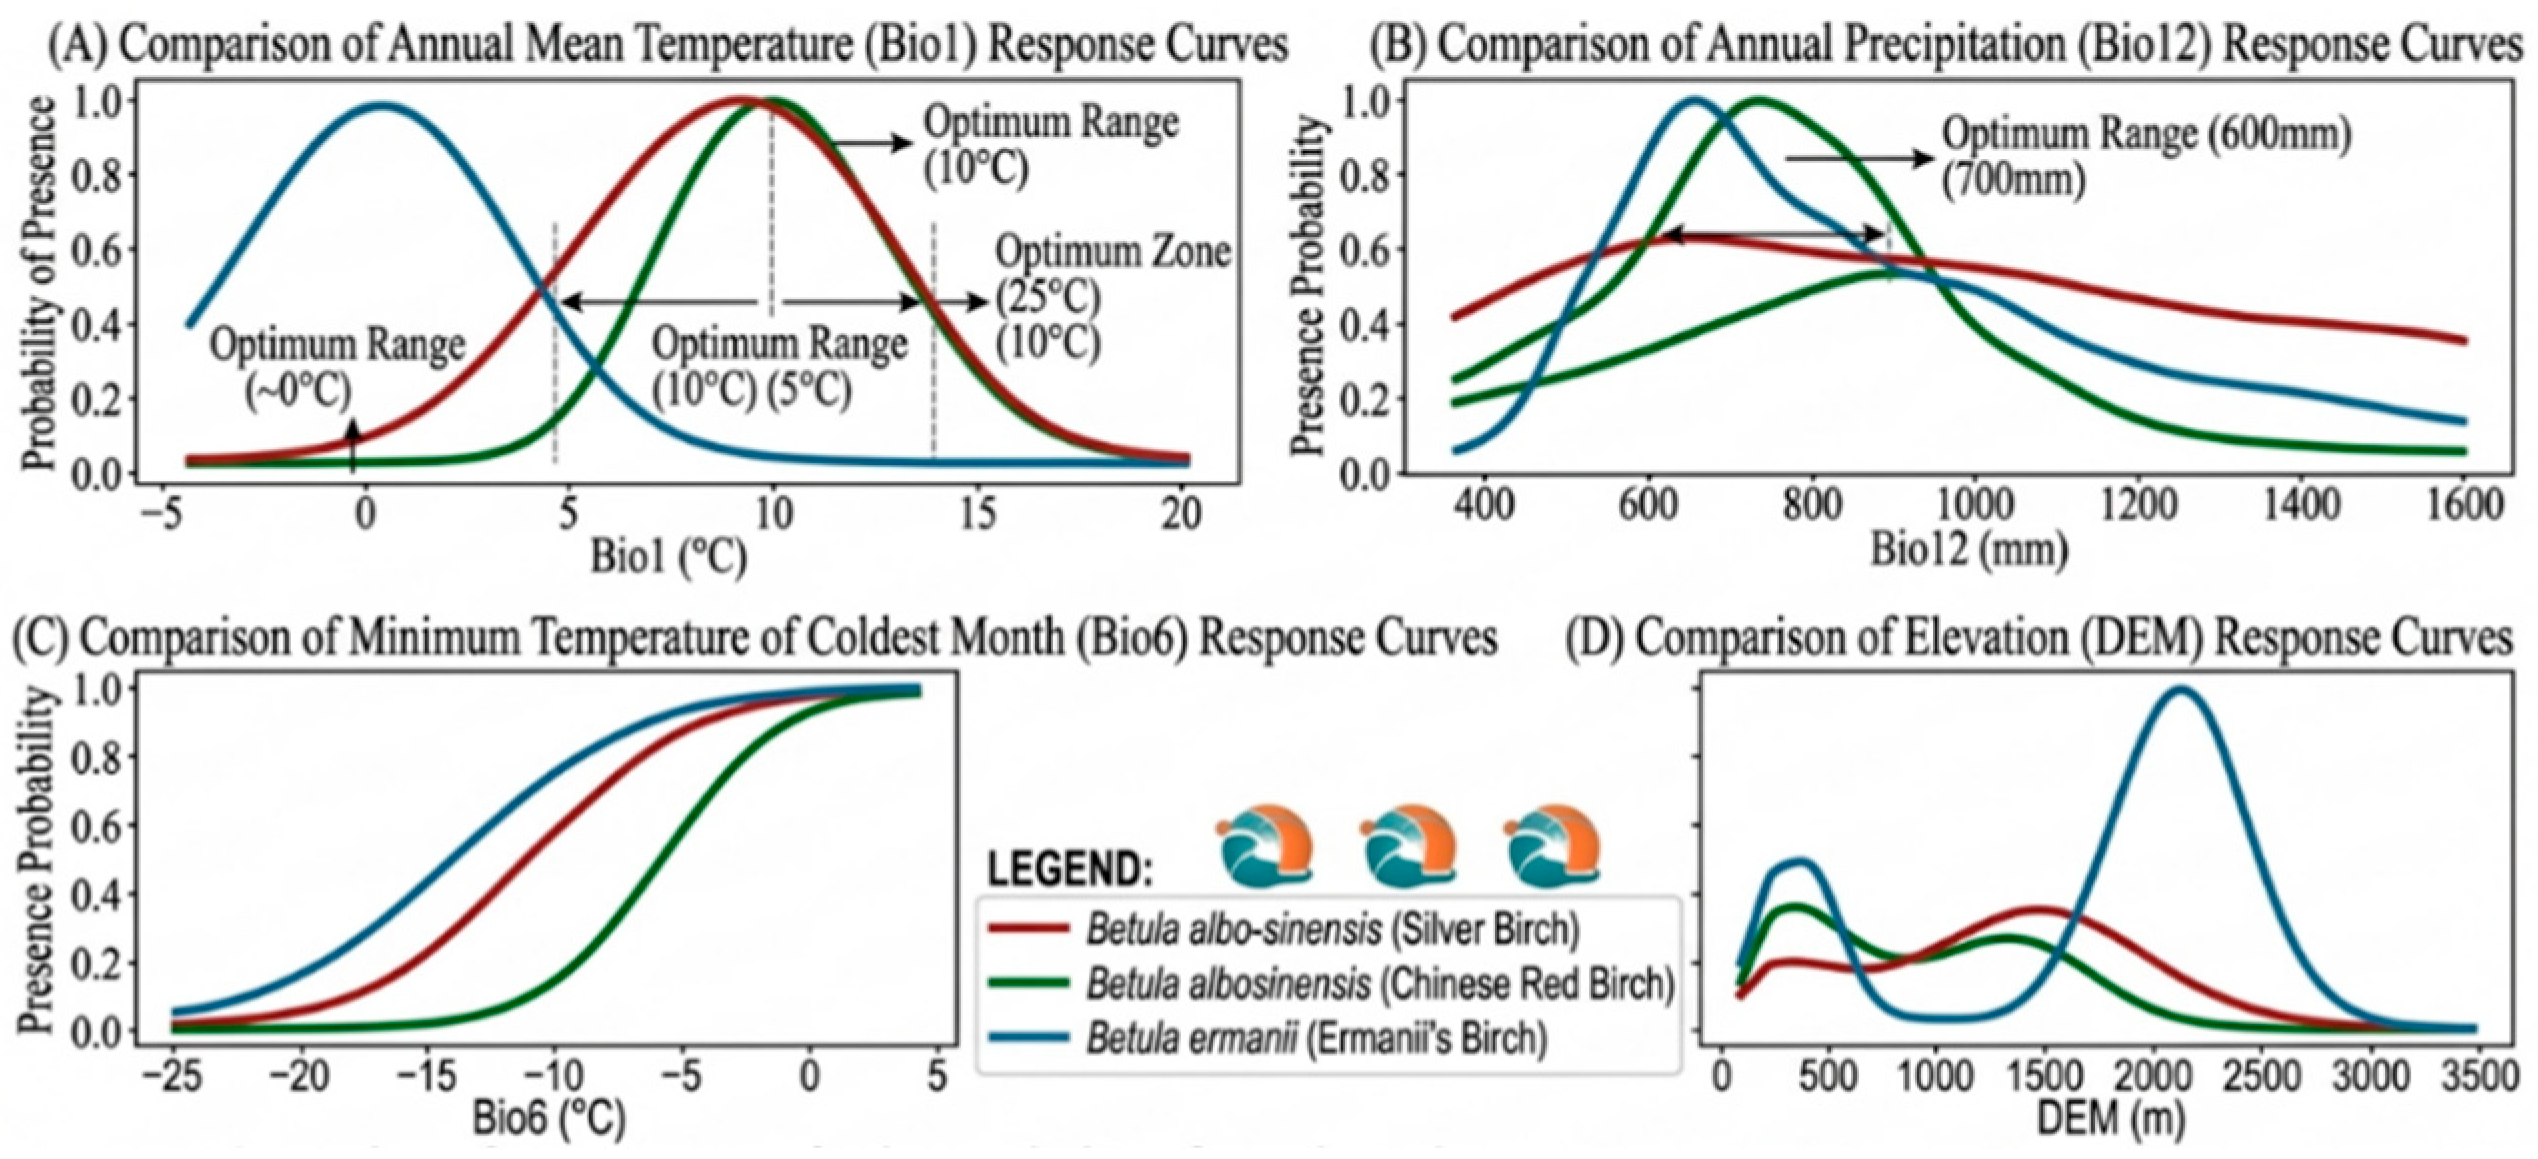
Figure 6.
Map of suitable habitat changes under future scenarios.
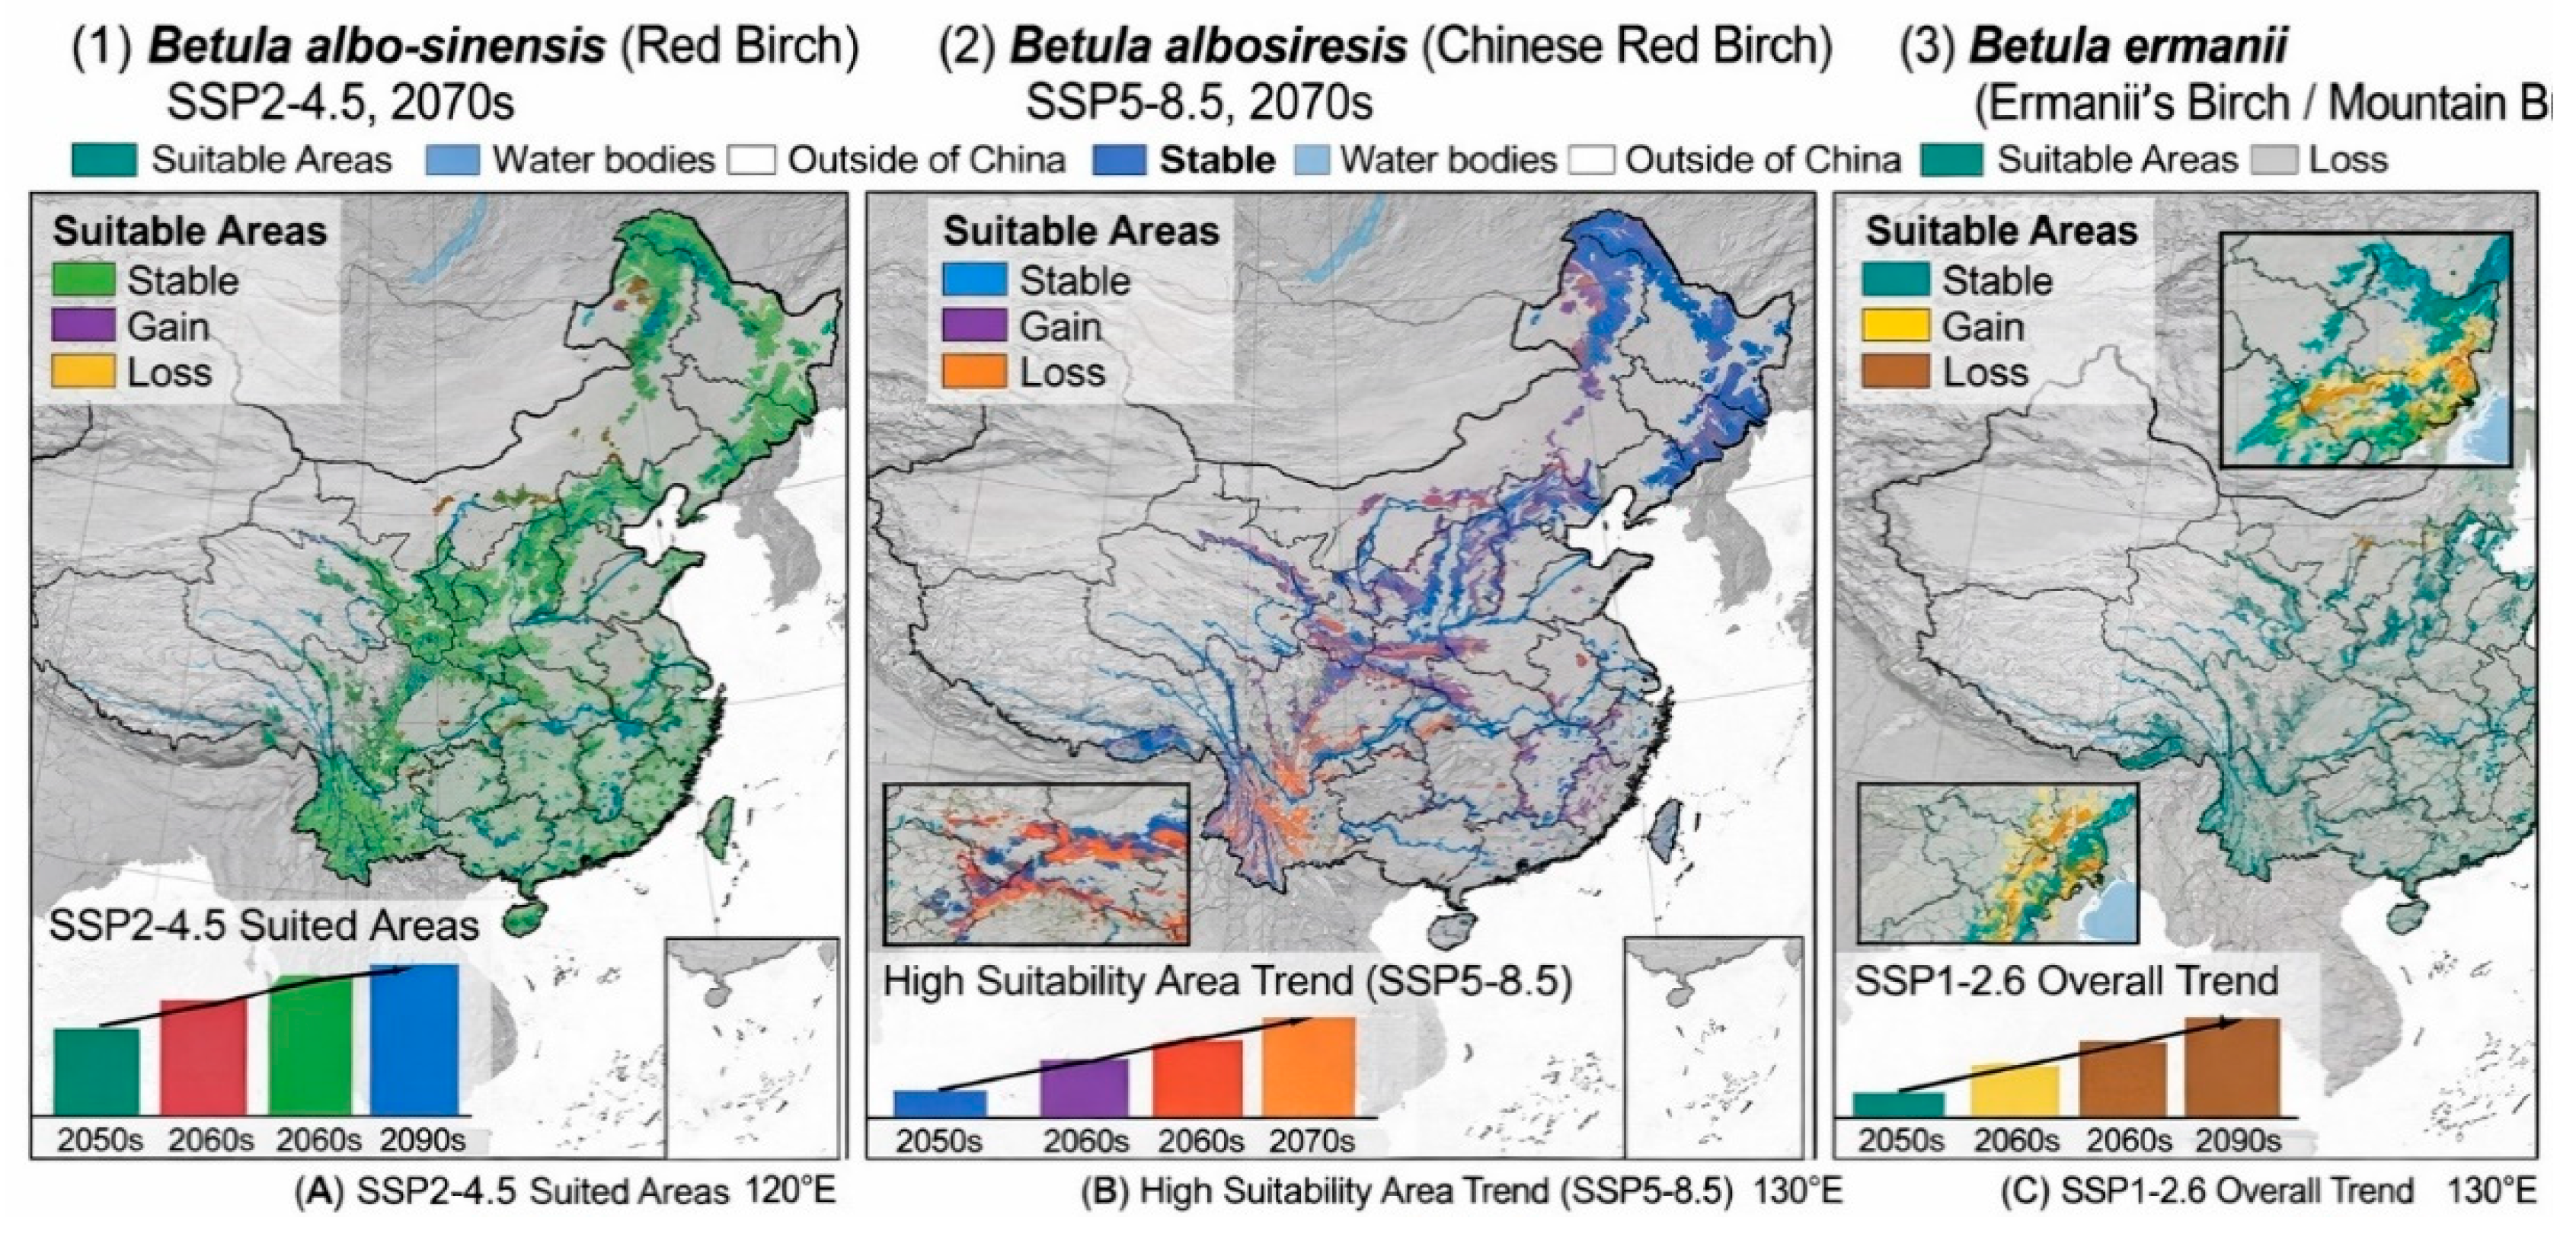
Figure 7.
Trajectory of center-of-mass shift.
Disclaimer/Publisher’s Note: The statements, opinions and data contained in all publications are solely those of the individual author(s) and contributor(s) and not of MDPI and/or the editor(s). MDPI and/or the editor(s) disclaim responsibility for any injury to people or property resulting from any ideas, methods, instructions or products referred to in the content. |
© 2026 by the authors. Licensee MDPI, Basel, Switzerland. This article is an open access article distributed under the terms and conditions of the Creative Commons Attribution (CC BY) license (http://creativecommons.org/licenses/by/4.0/).
Copyright: This open access article is published under a Creative Commons CC BY 4.0 license, which permit the free download, distribution, and reuse, provided that the author and preprint are cited in any reuse.


