

Submitted:
13 May 2026
Posted:
15 May 2026
You are already at the latest version
Abstract
Tropospheric ozone (O3) is a phytotoxic air pollutant that can impair visible foliar injury (O3 VFI) and reduces photosynthesis in sensitive forest species. Viburnum lantana L. has been widely used as an in situ bioindicator of O3 pollution in mountainous areas of Europe; however, field-observed O3-induced VFI as well as critical levels (CLs) established to protect forests, have not been validated. This study validated field-observed O3 effects in V. lantana through experiments carried out in a Free-air O3 eXposure infrastructure (FO3X) and determined which O3 metric (exposure-based—AOT40 or flux-based—POD1) best explains O3 effect on leaf physiology and VFI. V. lantana saplings were subjected to ambient air (AA) conditions and elevated O3 levels at 1.5× and 2.0× AA. Throughout the experimental period (T1: 2-month and T2: 3.5-month O3 exposure) measurements were taken for the Plant Injury Index (PII), light-saturated net photosynthetic rate (Asat), stomatal conductance (gs), leaf color index (SPAD), and the maximum photochemical efficiency of photosystem II (Fv/Fm). O3 VFI was first observed in 2.0× after 16 days. As a result, O3 treatment influenced PII, which was significantly higher in the 2.0× (9.06 ± 3.24) than in the 1.5× and AA treatments (1.31 ± 0.62 and 1.29 ± 0.71) at T2. The Asat, SPAD, and Fv/Fm were significantly affected by O3 treatments; no significant difference in gs was found. POD1 better explained variability in O3 VFI and physiological parameters, with CLs proposed for V. lantana of 1.61 mmol m–2 and 1.22 mmol m–2 for a 4% reduction of Asat and gs, and a CL of 7.82 mmol m–2 for the onset of O3 VFI.
Keywords:
ozone visible foliar injury
; photosynthesis
; bioindicator
; wayfaring tree
; stomatal ozone flux
1. Introduction
Tropospheric ozone (O3) is an oxidative atmospheric pollutant that negatively affects forest health. Despite regulatory efforts to reduce precursor emissions, O3 concentrations across much of Europe continue to exceed the thresholds established for protecting ecosystems [1,2].
Upon entry into the leaves via the stomata, O3 interacts with the mesophyll, triggering production of reactive oxygen species (ROS), which subsequently cause physiological impairment, visible foliar injury (O3 VFI), and finally growth loss [3,4,5,6] while leaf phenotypic plasticity modulates plant sensitivity [7]. To investigate tree responses to O3, several metrics have been developed, including the exposure-based index Accumulated Exposure Over a Threshold of 40 ppb (AOT40) [8]. However, flux-based indices, such as the phytotoxic O3 dose above a flux threshold of Y nmol m–2 s–1 (PODY), have been proven to be more reliable [9] and account for the actual O3 dose determined by cumulative O3 uptake over the growing season [10].
O3 VFI serves as a forest-health biomarker within monitoring initiatives, e.g., the International Co-operative Program on assessment and monitoring of air pollution effects on Forests (ICP Forests) [11]. This is because the O3 VFI assessment is practical for evaluating O3 impact on forests in the field without specialized equipment, making it suitable for long-term monitoring. Therefore, scientific efforts have been made to establish O3 Critical Levels (CLs) for forest protection based on the assessment of O3 VFI for some dominant tree species (e.g., Fagus sylvatica L., Pinus halepensis Mill., Picea abies L. Karst.) [12,13] and other forest tree or shrub species (e.g., Betula pendula Roth, Larix decidua Mill., Populus tremula L., Salix caprea L., Rubus sp., Vaccinium myrtillus L.) [14]. However, validation of O3 VFI using manipulative experiments is still required to establish an appropriate CL for forest protection [15].
In the last decades, Viburnum lantana L. has been proposed as an in situ bioindicator of O3 damage due to its foliar sensitivity and wide distribution in European forests. Field studies in the Italian Alps found “O3-like” VFI (red stippling and leaf reddening), which was correlated with high O3 levels (AOT40 > 30 ppm h), though symptom severity also reflected microclimatic conditions, indicating that the CL for O3 VFI in this species is around 12 ppm h AOT40 [16]. Follow-up research confirmed these patterns, highlighting inter-annual variability likely linked to climate-driven differences in O3 uptake [17]. Long-term monitoring through the ViburNeT network [18,19] further supported these findings, documenting a consistent relationship between regional O3 concentrations and O3 VFI frequency in V. lantana, with 20.7% to 50.6% of individuals exhibiting O3 VFI frequency, depending on the year. More recently, Faralli et al. [20] demonstrated that symptom severity showed a significant association with lower specific leaf area (SLA) and higher trichome density, especially under high light exposure and in the upper canopy. These findings, although valuable, are based on field observations, where site-specific susceptibility of V. lantana to local environmental conditions can influence stomatal O3 uptake and thus alter the response to O3. To date, there has been no study evaluating O3 damage to V. lantana on the basis of stomatal O3 flux. Therefore, to fully understand and validate its biomonitoring potential for setting the biological O3 standard, it is essential to investigate the species’ O3 response under controlled conditions, such as through Free-Air Controlled Exposure (FACE) systems, aiming to establish a flux-based CL for this bioindicator species.
The present study induced O3 VFI in the forest bioindicator species V. lantana plants exposed at the Free-Air O3 eXposure (FO3X) facility to compare these observations with those reported previously at natural forest sites (e.g., Gottardini et al. [16]), with the primary aim of validating field-based observations under controlled conditions.
In addition, the study aimed to determine which indices between exposure-based (AOT40) and flux-based (POD1) more accurately capture the effects and incidence of O3-related VFI and photosynthetic impairment in the bioindicator species V. lantana.
2. Materials and Methods
2.1. Experimental Site and Plant Material
Ozone exposure experiments were conducted at the FO3X facility situated within the experimental garden of the National Research Council of Italy (Sesto Fiorentino, Italy: 43°48′59″ N, 11°12′01″ E, 55 m above sea level). The fumigation system details are provided in Paoletti et al. [21]. In December 2023, three-year-old Viburnum lantana L. saplings, raised in Santa Giustina in Colle (Padova, Veneto, Italy), were obtained from a local nursery (Vivai Guagno). At the time of transplantation, the plants, grown in 18 cm pots, had an average height of 74.7 cm and a stem diameter of 13.5 mm. Each plant was transplanted into a 9 L plastic pot (24 cm diameter) containing a uniform mixture of sand, peat, and soil in equal parts (v:v:v). This substrate composition was selected to ensure adequate drainage, nutrient availability, and root aeration during the subsequent growth period. All plants were watered daily to prevent water stress. From 17th May to 16th October 2024 (152 days), three levels of O3 concentration treatments (ambient O3 concentration [AA], 1.5 times ambient O3 concentration [1.5×], and doubled ambient O3 concentration [2.0×]) were applied using three replicated plots (dimension of 5 m × 5 m × 2 m) and 1- 2 plants were assigned for each plot.
The average hourly O3 concentrations in the AA, 1.5×, and 2.0× treatments were 38.0 ppb, 48.6 ppb, and 61.3 ppb, respectively. Figure 1 shows the seasonal patterns of solar irradiance, precipitation, and mean daily temperature, based on hourly meteorological data collected throughout the growing season.
2.2. Assessment and Quantification of Visible Foliar Injury
Visible foliar injury attributable to O3 was monitored at 2- or 3-week intervals throughout the exposure period. Assessments were carried out independently by two trained observers with ICP Forests Intercalibration experience [11]. For each plant, we recorded the proportion of leaves showing symptoms (SL) and, within symptomatic leaves, the mean affected leaf area (SA), using a ×10 hand lens and published photographic references [22]. To quantify the injury at the plant level, the Plant Injury Index (PII) was calculated by combining the two parameters [22,23] as follows:
To describe, classify, and standardize O3 VFI, color composition was assessed based on the methodology suggested by Moura et al. [15]. Three pictures showing a range of injuries (expert visual assessment from 0 to 70% SL) were taken under natural lighting conditions, all on the same day (9–10 a.m.), using a digital camera (Cyber-shot DSC-H300, Sony, Tokyo, Japan). The photos were combined into a single RGB figure, subsequently processed using the indexed color mode. Following this, both a Local (Perceptual) and a 64-colour image were produced. Subsequently, all the tissue exhibiting greenish and the vein-related colors were extracted from the image, leaving only potential O3 VFI colors visible [15].
2.3. Assessment of Photosynthetic Parameters
Measurements of photosynthetic parameters (i.e., SPAD, chlorophyll a fluorescence, and leaf gas exchange) were conducted three times (time zero—T0: 13th May [before O3 exposure], T1: 11th July [55 days exposure], and T2: 8th September [114 days exposure]). Leaf gas exchange rates were measured using a portable photosynthesis measurement system (LI-6800, Li-Cor instruments, Lincoln, NE, USA). Measurements were carried out between 8 and 12 a.m. CET for one to two plants per plot per treatment. For each plant, three to five leaves with 4th to 6th order from the tip of the shoot were targeted. During the measurement, the parameters within the LI-6800 leaf cuvette were established as follows: CO2 concentration (420 ppm), leaf temperature (25 °C), photosynthetic photon flux density (PPFD, 1500 μmol m–2 s–1, utilizing an LED light source of 10% blue and 90% red light), and relative humidity (50%). From these measurements, light-saturated net photosynthetic rate (Asat) and stomatal conductance (gs) were determined.
A SPAD meter (Konica Minolta, Tokyo, Japan) was utilized to measure leaf greenness as a proxy of chlorophyll content. In addition, a HandyPEA fluorimeter (Hansatech Instruments, Pentney, Norfolk, UK) was used to measure the chlorophyll a fluorescence. In order to measure the chlorophyll a fluorescence, after 40 min of dark adaptation, leaves were subjected to a 1 second saturating pulse of red light (peak wavelength: 650 nm) at an intensity of 3,000 μmol photons m–2 s–1 to determine the fluorescence yields in the dark (F0) and those with a saturating pulse (Fm). The maximum quantum yield (Fv/Fm) was calculated as Fv/Fm = 1 − (F0/Fm).
2.4. Modeling of Stomatal Conductance
In order to estimate stomatal O3 flux, it is essential to parameterize the gs model. A measurement campaign of gs for 4th to 6th ordered leaves of all target plants using an open flow-through differential porometer (LI-600, Lincoln, NE, USA) was conducted. Stomatal conductance was measured on 19 sampling days, scheduled at approximately monthly intervals and covering a range of environmental conditions. The resulting dataset, comprising 593 measurements, was used to parameterize the multiplicative gs model [24,25], as described below:
where gmax is the maximum stomatal conductance (mol O3 m–2 Projected Leaf Area [PLA] s–1). All other functions are expressed in relative terms and scaled from 0 to 1. The model incorporates minimum stomatal conductance (fmin), and it adjusts gs based on PPFD (flight), temperature (ftemp), and vapor pressure deficit (VPD) (fVPD). The details of the model functions are available in the Supplementary file (Appendix Method S1). In this study, the function of soil water content (fSWC) was not included because plants did not receive any soil water stress. The model was parameterized using the boundary line approach [26,27]. The gmax and fmin values were set as the 95th and 5th percentiles of all gs data, respectively, following the methodology of Bičárová et al. [28] and Hoshika et al. [25].
2.5. Calculation of Ozone Indices
For daylight periods, identified by shortwave radiation exceeding 50 W m–2, AOT40 was obtained by summing the hourly exceedance of O3 concentrations above the 40 ppb threshold, following CLRTAP [29]. It is defined as:
where [O3]i represents the measured hourly O3 concentration (ppb), with i ranging from 1 to n in the integral, where n is the total number of hours in the calculation period.
According to CLRTAP [29], stomatal O3 flux (Fst; nmol m–2 s–1) can be given as:
where [O3] (ppb) is the hourly O3 concentration, rc is the surface resistance of leaf (= 1/(gs + gext); s m–1), gs is the cuticular conductance (m s–1), and rb is the boundary layer resistance of the leaf (s m–1) calculated as rb = 1.3 ×150 ×(Ld / u) 0.5 where u is the wind speed (m s–1), Ld is the cross-wind leaf dimension (0.05 m for broadleaves, [29]).
PODY (mmol m–2) was calculated as the sum of hourly Fst data as:
where Fst_i is the hourly stomatal O3 uptake (nmol m–2 s–1), n is the number of hours included in the calculation period. Y is a species-specific threshold of stomatal O3 uptake (nmol m–2 s–1). In the mapping manual [29], Y = 1 nmol m–2 s–1 is recommended to assess the negative O3 effects on woody plant species. Therefore, we utilized POD1 to establish dose-response relationships with O3 VFI and physiological parameters.
2.6. Data Analysis
To assess treatment effects, PII and physiological parameters (Asat, gs, SPAD, and Fv/Fm) were analyzed on absolute values by two-way ANOVA with O3 treatment and time as fixed factors, including their interaction, after verifying normality and homogeneity of variances. When significant effects were detected (p ≤ 0.05), differences among levels were evaluated using Tukey’s HSD post hoc test.
Dose–response relationships were analyzed separately by expressing each response variable as a relative change from an operational baseline, defined by the mean value measured under AA at T0 (considered as the reference condition in which features were unaffected by O3). Exposure- and flux-based dose–response functions were then fitted using AOT40 or POD1 as predictors, comparing (i) a linear model and (ii) a non-linear polynomial model (proposed for O3 risk assessment applications by Hoshika et al. [30]). Model selection was primarily based on the Akaike Information Criterion (AIC), which balances goodness-of-fit and model complexity; the coefficient of determination (R2) was used to quantify the proportion of variance explained.
A sensitivity scenario analysis was also conducted to quantify how assumptions on stomatal regulation affect flux-based estimates. Specifically, when AOT40 reached 12 ppm h (as suggested by Gottardini et al. [16]), POD1 was recalculated under a set of imposed stomatal-closure scenarios (0–50% closure, 10% increments) to simulate additional environmental stress (e.g., drought).
For VFI, CLs were defined as the exposure/uptake at which symptoms first occurred, operationally identified as the point at which PII became > 0 (PII = 0.01). For physiological parameters, the CL was defined as the dose corresponding to a 4% reduction relative to the baseline, following Hoshika et al. [30]. All statistical analyses were performed using OriginPro 2025 (OriginLab Corporation, Northampton, MA).
3. Results
3.1. Ozone Visible Foliar Injury and the Number of Leaves
The first O3 VFI for the plants treated with 2.0× O3 exposure were observed after 16 days of exposure (on 14th June). Subsequently, the symptoms emerged in the other two O3 treatments (i.e., AA and 1.5×) 32 days after the beginning of the exposure (on 2nd July). The O3 VFI are characterized by interveinal stippling on the adaxial leaf surface, with a reddish to dark brown coloration (Figure 2). These stipples were localized between the veins, often sparing the vein tissue itself, and did not show signs of tissue necrosis or insect damage.
Color-composition analysis identified 16 perceptual colors that captured the main chromatic features of O3 VFI in V. lantana (Figure 2). The selected palette described a gradual shift from light to dark brownish tones, with reddish intermediates, consistent with the visual progression of injury.
The PII was significantly affected by the interaction between treatment and time (p < 0.05, Table 1, Table S1). Across all O3 treatments, PII values increased over time, with O3 VFI already evident but not statistically significant at T1. At this stage, mean PII values exceeded 1.5 in the two elevated O3 treatments (2.03 ± 1.11 in 1.5× and 2.12 ± 1.41 in 2.0×), reaching maximum values of 0.61 in AA, 3.83 in 1.5×, and 4.79 in 2.0×. Injury became even more pronounced at T2, with a statistical difference under the 2.0× treatment. At T2, while the AA showed modest increases (mean values were 1.29 ± 0.71), the 1.5× O3 treatment showed a decrease, justified by leaf senescence in this treatment (1.31 ± 0.62), and a significant rise in PII was observed in the 2.0× treatment at T2 (9.06 ± 3.24). Variability in PII was high across treatments; the lowest PII value was 0.1, recorded in the 1.5× at T1 (i.e., 1.00% of SL and 10% of SA), and the highest recorded value of 14.13 was in 2.0× T2 (i.e., 41.3% of SL and 34.21% of SA).
3.2. Ozone Effects on Photosynthetic Parameters
The Asat was significantly affected by both treatment (p < 0.05) and time (p < 0.001) (Table 1, Table S1). Across treatment, a consistent decline was observed from AA to 2.0×, with AA presenting an average Asat of 10.45 ± 1.10 µmol m–2 s–1, 1.5× an intermediate value of 9.07 ± 1.09 µmol m–2 s–1, and 2.0× an average of 8.16 ± 1.38 µmol m–2 s–1. Across time, Asat at T1 (7.81 ± 0.45 µmol m–2 s–1) and T2 (6.34 ± 0.76 µmol m–2 s–1) were statistically lower than the baseline (T0: 13.54 ± 0.53 µmol m–2 s–1).
Regarding the gs, there was only a statistically significant influence of time (p < 0.0001) (Table 1, Table S1), with mean values decreased from 0.172 ± 0.014 mol m –2 s–1 at T0 to 0.091 ± 0.007 mol m –2 s–1 at T1 and remained at a similar level at T2 (0.091 ± 0.006 mol m –2 s–1).
SPAD values, indicative of relative chlorophyll content, were significantly affected by the O3 treatment (p < 0.05, Table 1, Table S1). Across all timepoints, the AA plants showed the highest mean SPAD values (50.42 ± 1.76), which were significantly higher than those observed in the 1.5× treatment (42.22 ± 2.12). In contrast, the 2.0× treatment group exhibited intermediate SPAD values (42.82 ± 6.62), which did not differ significantly from either AA or 1.5× due to the high within-group variability.
Fv/Fm was significantly affected by the interaction between treatment and time (p < 0.01; Table 1, Table S1). Across all three O3 treatments, Fv/Fm values remained stable throughout the experiment, with mean values of 0.72 ± 0.01, indicating limited temporal variation in PSII photochemical efficiency. A notable exception, however, was observed in the 2.0× treatment, which showed a significant decrease in Fv/Fm during mid-summer (T1: 0.64 ± 0.01), followed by a recovery at T2. This transient reduction was not observed at the other two exposure levels, which maintained consistent Fv/Fm values across all time points.
3.3. Parameterization of the Stomatal Conductance Model
The gmax value found for V. lantana was 0.158 mol O3 m–2 PLA s–1, whereas fmin was set to 0.06. The limitations of gs due to environmental factors are shown in Figure 3. With increasing light intensity, a sharp increase in gs was observed, even under a relatively low PPFD (200 μmol m–2 s–1), as shown by flight (flight_a = 0.0163). The optimal temperature for stomatal opening (Topt) was 24 °C, while Tmax and Tmin were set to 41 and 0 °C, respectively. In addition, a high air VPD observed in the afternoon caused stomatal closure, as confirmed by the fVPD function (VPDmax: 1.8 kPa, VPDmin: 6.4 kPa).
3.4. The Relation of O3 Indices, Plant Injury Index (PII), and Plant Physiological Responses
The results of the linear and polynomial regression models examining the relationships between PII and the physiological parameters (Asat, gs, SPAD, and Fv/Fm) and the two indices (POD1 and AOT40) showed varying levels of model fit and explanatory power (Table S2). All the regressions were statistically significant except for SPAD and Fv/Fm, thus will not be discussed in the study.
For the PII, the polynomial model performed better than the linear one, and the AOT40 (Figure 4A inset) performed slightly better than POD1 (Figure 4A). As it was clear that the PII response remained flat across time of exposure and then sharply rose over a narrow interval at the end of the exposure period, we considered both polynomial models (with AOT40 and POD1) as suitable for representing the species response (Figure 4A).
The best-fit model for physiological parameters was the polynomial, performed with POD1 (Figure 4 B,C). The Asat declined rapidly at low POD1, then approached a stable lower plateau at higher POD1. However, Asat remained well below its initial level across the higher POD1 values, especially at the end of the exposure period, indicating reduced leaf photosynthetic capacity with increasing accumulated O3 uptake (Figure 4B).
For gs, the polynomial function using POD1 also provided the best fit, showing a lower AIC compared to all the other tested functions (Table S2). The fitted curve was similar to that for Asat, with gs decreasing sharply at low POD1, then stabilizing, when gs had already declined substantially from its initial levels, and continued to decrease gradually as POD1 increased (Figure 4C).
3.5. Critical Levels
The exposure- or flux-based CLs were calculated for all significant regressions (Table S2), and Table 2 reports only the CLs of the chosen best-fit functions.
Comparing the CLs calculated for the PII, the values were considerably higher with the polynomial function (7.82 mmol m–2 for POD1 and 4.42 ppm h for AOT40, Table 2) than with the linear regressions (0.54 mmol m–2 for POD1 and 0.81 ppm h for AOT40; Table S2).
In contrast, for the physiological parameters, the polynomial fits produced lower CLs than the linear fits, and gs consistently showed lower CLs than Asat, indicating an earlier response of stomatal conductance to O3 (POD1: 1.22 vs 1.61 mmol m–2; AOT40: 1.31 vs 2.27 ppm h, respectively; Table 2).
4. Discussion
The manipulative experimental approach adopted in our study for the first time enabled the following new findings on O3 effect on both O3 VFI and the physiological features of the important bioindicator species, V. lantana, filling a significant knowledge gap regarding the integrated response of the species to O3 stress.
4.1. Validation of Ozone Visible Foliar Injury Based on Free-Air Experiments
The appearance and progression of O3 VFI observed in V. lantana under elevated O3 treatments confirmed that this species is sensitive to O3 exposure. Plants exposed to 2.0× developed VFI two weeks earlier than those at lower treatment levels, following a clear dose-dependent pattern. This observation aligns with previous experimental studies on O3 VFI for this species, which found that higher AOT40 levels were associated with more frequent VFI [23]. Previous studies suggest that the onset timing of O3 VFI shows species-specific dependency; for instance, the O3-sensitive deciduous species, Alnus glutinosa and Vaccinium myrtillus, showed early-season symptom development, whereas the O3-tolerant Mediterranean shrub, Arbutus unedo, exhibited a delayed onset of O3 VFI, appearing only in the late growing season [11,15,31]. In our study, although the O3 VFI onset was found in the early summer, PII values at 2.0× treatment became significantly higher than in the AA treatment only at T2, likely reflecting the slow development of O3 damage in V. lantana throughout the growing season.
The symptoms consisted of small reddish-brown spots distributed on the upper leaf surface, mainly in the interveinal areas. Veins were generally unaffected, and the leaves did not show necrotic patches or damage patterns attributable to insects or pathogens [11]. The color analysis (Figure 2) supported this pattern, showing a chromatic gradient from light grey to dark brown, indicative of increasing tissue alteration, similar to the colors observed in previous field assessments [17,31]. These colorimetric patterns not only reflect the severity of foliar damage but may also serve as a diagnostic tool for O3 injury under field conditions. As demonstrated by Moura et al. [15], the color components observed in experimental manipulations are comparable in many species to those detected in field samples, confirming the comparability between controlled and natural environments. This suggests that the color profiles documented in our study could be effectively used for quality control and support field-based O3 VFI assessments, enhancing the accuracy of visual diagnosis in biomonitoring applications.
Despite the clear development of O3 VFI, the correspondence with systemic eco-physiological responses was only partial, highlighting the complexity of O3–plant interactions. While PII increased significantly with O3 exposure and Asat showed a marked decline, the response of gs was more limited. The decrease of Asat in the absence of gs reduction in O3-exposed leaves was similarly found in Japanese Siebold’s beech [32] and I-214 poplar clone [33]. Since the rates of damage to photosynthesis and stomatal conductance do not always coincide, O3 exposure can decouple gs from Asat [25,34]. In fact, O3 impairs stomatal function, leading to reduced stomatal responsiveness to environmental stimuli, i.e., stomatal sluggishness [35,36]. The remaining open stomata reduce water-use efficiency, increasing the risk of other climate crisis factors, such as drought [37].
In our study, this partial decoupling between O3 VFI and physiological impairment may be linked to ‘invisible’ damage and physiological modifications, including repair processes, before visible signs of injury appear [38]. A recent study applied Terahertz (THz) imaging analysis and revealed that the negative effect of O3 on leaf water status was associated with cell damage before the onset of VFI in Carpinus betulus L. and Ostrya carpinifolia Scop. plants [39]. In fact, in our experiment, the marked reduction in Asat was already found at T1, even though PII was still relatively low. Moreover, a significant decline in Fv/Fm was observed at 2.0× only at the early time point (T1), suggesting an initial impairment of PSII photochemical efficiency. The absence of sustained effects at later stages may indicate a partial recovery over time or a localized, non-systemic damage response. Similar dynamics were reported by Bussotti et al. [40] in a field-based study on V. lantana, in which chlorophyll fluorescence measurements under high O3 exposure showed a marked reduction in parameters related to electron transport efficiency. These converging observations confirm the moderate physiological sensitivity of V. lantana to O3, with photochemical alterations detectable even before O3 VFI becomes widespread, consistent with findings from both field and controlled studies.
4.2. Flux-Based Assessment of Ozone Visible Injury and Physiological Parameters
This study also aimed to evaluate whether O3-induced effects on V. lantana are better captured by the flux-based index (POD1) rather than the exposure-based index (AOT40). Regression analyses confirmed that POD1 was a superior metric for capturing the physiological response, with the polynomial model fitting better than the linear regression, specifically, for Asat and gs. While both O3 indices were significantly related to PII, the polynomial model with POD1 again showed a tendency toward a better fit and better represented the biological process (Figure 4A inset, Table S2).
The stronger association between POD1 can be attributed to its physiological basis. Unlike exposure-based metrics such as AOT40, which rely solely on ambient O3 concentrations, POD1 estimates the actual O3 dose absorbed through stomata. This flux-based approach is widely recognized as the primary driver of O3-induced phytotoxicity [4,6], as it accounts for plant-specific factors such as stomatal regulation under varying environmental conditions (e.g., water availability). Furthermore, we recommend using non-linear models for dose-response relationships, as emphasized by Hoshika et al. [30], particularly when they outperform linear regression.
4.3. Critical Levels
The use of the PII offers an integrated measure of O3 VFI damage by combining both the proportion of symptomatic leaves per plant (SL) and the average affected area within those leaves (SA). This dual-component approach provides a more realistic representation of total O3 VFI than frequency-based metrics alone. In our study, we proposed that the CL for PII should be calculated when the PII value reaches 0.1, indicating the onset of damage (i.e., 1% SL and 10% SA), which, in the case of V. lantana, using the polynomial regression as the best fit (Table S2), occurred when POD1 reached 7.82 mmol m–2 (Table 2).
If calculated using the exposures-based index AOT40, the polynomial regression fit better, and the CL for the PII was determined to be 4.42 ppm h. In the past, a threshold of 12 ppm h was proposed for the species to indicate injury onset based on field observations in the Mediterranean Alps [18]. The discrepancy between the calculated CL presented here and previous literature may result from differences in environmental conditions affecting stomatal O3 uptake between natural forests and the FO3X experimental facility. In fact, during summer-time, drought often limits stomatal O3 uptake for trees at the natural forest sites in the Mediterranean Alps (–31% due to soil water deficit, [14]), whereas, at the FO3X, plants were well-irrigated and any water stress was not expected to reduce gs for V. lantana and thus enhancing stomatal O3 uptake. A sensitivity analysis revealed that, if the 30% hypothetical stomatal closure occurred at the FO3X, the values of POD1 at the field-observed threshold 12 ppm h AOT40 would be 5.9 to 9.9 mmol m–2, which agrees with the flux-based CL (7.82 mmol m–2) (Table S3). The results indicate that the AOT40-based CL may vary across the target regions due to insufficient consideration of the biological processes underlying O3 uptake. Given that stomata are the primary interface for O3 entry into plants, a stomatal flux-based approach should be recommended for a proper setting of CL in forest protection against O3 pollution.
Interestingly, although a flux-based POD1 CL for PII was identified as 7.82 mmol m–2 POD1, physiological thresholds for a 4% reduction in Asat and gs were observed at lower POD1 values (1.61 mmol m–2 and 1.22 mmol m–2, respectively). This suggests that physiological alterations begin before the manifestation of visible injury, supporting the use of combined indicators for a comprehensive assessment. Therefore, a multi-indicator framework combining morphological and physiological indicators is recommended to detect early stress signals and assess cumulative O3 impact more accurately [41]. This approach improves detection sensitivity, enhances inter- and intra-species comparisons in biomonitoring, and underscores the importance of flux-based metrics in O3 risk assessment. Low POD values as CLs for physiological parameters were also found in other sensitive species, where the CLs for Asat were suggested to be 1.9 to 3.5 mmol m–2 POD0 for O3-sensitive deciduous poplars and hornbeam species [39]; therefore, V. lantana can be identified as a sensitive species to O3.
5. Conclusions
This study examined O3 effects on V. lantana under open-air experimental conditions. Results showed a dose-dependent pattern, with O3 VFI appearing first in plants exposed to a higher O3 environment (2.0× treatment). These visual injuries matched field symptoms and were confirmed by colorimetric analysis.
At the same time, physiological responses revealed a more complex pattern. While Asat and Fv/Fm declined under elevated O3, gₛ and SPAD were less responsive, suggesting that physiological alterations can occur with a different pattern. Notably, thresholds for a 4% reduction in Asat and gₛ were reached at POD1 levels below those needed to induce VFI, highlighting the importance of combining visual and functional indicators to avoid underestimating damages. The dose–response analysis also showed that the flux-based metric POD1 better explained variability in physiological parameters than the exposure-based AOT40, supporting the actual consensus that stomatal uptake is a more accurate predictor of plant damage. Thus, we suggested CLs of 1.61 mmol m–2 and 1.22 mmol m–2 POD1 for Asat and gs, respectively, and a CL of 7.82 mmol m–2 for the onset of O3 VFI.
In conclusion, this study provides the first detailed eco-physiological characterization of the O3 effect in V. lantana under controlled and realistic exposure conditions. It confirms the species’ moderate sensitivity to O3 and refines critical thresholds for O3 risk assessment. V. lantana is confirmed as an auspicious bioindicator for integrated O3 impact monitoring, particularly when physiological and morphological parameters complement visual assessments.
Supplementary Materials
The following supporting information can be downloaded at the website of this paper posted on Preprints.org, Method S1: Model functions of stomatal conductance model; Table S1. Two-way ANOVA test on physiological parameters, Table S2. Regression models evaluating the relation between Plant Injury Index (PII) and the physiological parameters, Table S3. Sensitivity analysis of POD1.
Author Contributions
Elena Marra: Writing—original draft, Investigation, Formal analysis, Validation, Conceptualization. Barbara Baesso Moura: Writing—review & editing, Formal analysis, Validation. Elena Paoletti: Writing—review & editing, Conceptualization, Resources, Project administration. Andrea Viviano: Writing—review & editing, Investigation. Jacopo Manzini: Writing—review & editing, Investigation. Ryoji Tanaka: Writing—review & editing. Yasutomo Hoshika: Conceptualization, Resources, Project administration, Investigation, Supervision. All authors have read and agreed to the published version of the manuscript.
Funding
This study was supported by Fondazione Cassa di Risparmio di Firenze (2013/7956), LIFE project AIRFRESH (LIFE19 ENV/FR/000086) and MODERn NEC (LIFE20GIE / IT / 000091) of the European Commission, @CNR project 4ClimAir (SAC.AD002.173.019), PNRR for Mission 4 (Component 2, Notice 3264/2021, IR0000032)—ITINERIS—Italian Integrated Environmental Research Infrastructure System CUP B53C22002150006; and Project funded under the National Recovery and Resilience Plan (NRRP), Mission 4 Component 2 Investment 1.4—Call for tender No. 3138 of 16 December 2021, rectified by Decree n.3175 of 18 December 2021 of Italian Ministry of University and Research funded by the European Union—NextGenerationEU, Award Number: Project code CN_00000033, Concession Decree No. 1034 of 17 June 2022 adopted by the Italian Ministry of University and Research, CUP, H43C22000530001 Project title “National Biodiversity Future Center—NBFC” (Spoke 3 and 5).
Data Availability Statement
All raw datasets generated or analyzed in this study can be provided by the corresponding author upon reasonable request.
Acknowledgments
We thank Alessandro Materassi, Gianni Fasano, and Francesco Sabatini for maintenance of the ozone FACE; Moreno Lazzara and Leonardo Lazzara for support during field work.
Conflicts of Interest
The authors declare no conflicts of interest.
Abbreviations
The following abbreviations are used in this manuscript:
| AA | Ambient air |
| AIC | Akaike Information Criterion |
| ANOVA | Analysis of variance |
| AOT40 | Accumulated Ozone Exposure Over a Threshold of 40 ppb |
| Asat | Light-saturated net photosynthetic rate |
| CET | Central European Time |
| CL | Critical level |
| CLRTAP | Convention on Long-range Transboundary Air Pollution |
| CNR | National Research Council of Italy |
| DOY | Day of year |
| EEA | European Environment Agency |
| FACE | Free-Air Controlled Exposure |
| FO3X | Free-air O3 eXposure facility |
| F0 | Minimum fluorescence yield in dark-adapted leaves |
| Fm | Maximum fluorescence yield after a saturating light pulse |
| Fst | Stomatal ozone flux |
| Fv/Fm | Maximum photochemical efficiency of photosystem II |
| gext | External or cuticular conductance |
| gmax | Maximum stomatal conductance |
| gs | Stomatal conductance |
| HSD | Honestly significant difference |
| ICP Forests | International Co-operative Program on Assessment and Monitoring of Air Pollution Effects on Forests |
| LED | Light-emitting diode |
| NBFC | National Biodiversity Future Center |
| NRRP | National Recovery and Resilience Plan |
| O3 | Ozone |
| PII | Plant Injury Index |
| PLA | Projected leaf area |
| POD1 | Phytotoxic Ozone Dose above a threshold of 1 nmol m−2 s−1 |
| PODY | Phytotoxic Ozone Dose above a flux threshold of Y nmol m−2 s−1 |
| PPFD | Photosynthetic photon flux density |
| PSII | Photosystem II |
| R2 | Coefficient of determination |
| rb | Boundary layer resistance |
| rc | Surface resistance of leaf |
| RGB | Red, green, blue color model |
| ROS | Reactive oxygen species |
| SA | Percentage of affected area on symptomatic leaves |
| SE | Standard error |
| SL | Percentage of symptomatic leaves per plant |
| SLA | Specific leaf area |
| SPAD | Soil Plant Analysis Development leaf color index, used as a proxy for chlorophyll content |
| SWC | Soil water content |
| T0 | Time zero, before ozone exposure |
| T1 | First measurement time, 55 days exposure |
| T2 | Second measurement time, 114 days exposure |
| THz | Terahertz |
| Tmax | Maximum temperature parameter for stomatal response |
| Tmin | Minimum temperature parameter for stomatal response |
| Topt | Optimum temperature for stomatal opening |
| Treat. | Treatment |
| UNECE | United Nations Economic Commission for Europe |
| VFI | Visible foliar injury |
| VPD | Vapor pressure deficit |
References
- European Environment Agency Assessment of Ground-Level Ozone in EEA Member Countries, with a Focus on Long-Term Trends; Publications Office: LU, 2009.
- Mills, G.; Pleijel, H.; Malley, C.S.; Sinha, B.; Cooper, O.R.; Schultz, M.G.; Neufeld, H.S.; Simpson, D.; Sharps, K.; Feng, Z.; et al. Tropospheric Ozone Assessment Report: Present-Day Tropospheric Ozone Distribution and Trends Relevant to Vegetation. Elem. Sci. Anthr. 2018, 6, 47. [Google Scholar] [CrossRef]
- Vollenweider, P.; Ottiger, M.; Günthardt-Goerg, M.S. Validation of Leaf Ozone Symptoms in Natural Vegetation Using Microscopical Methods. Environ. Pollut. 2003, 124, 101–118. [Google Scholar] [CrossRef]
- Paoletti, E. Ozone Impacts on Forests. In CABI Reviews; 2007. [Google Scholar] [CrossRef]
- Dusart, N.; Gandin, A.; Vaultier, M.-N.; Joffe, R.; Cabané, M.; Dizengremel, P.; Jolivet, Y. Importance of Detoxification Processes in Ozone Risk Assessment: Need to Integrate the Cellular Compartmentation of Antioxidants? Front. For. Glob. Change 2019, 2, 45. [Google Scholar] [CrossRef]
- Grulke, N.E.; Heath, R.L. Ozone Effects on Plants in Natural Ecosystems. Plant Biol. J. 2020, 22, 12–37. [Google Scholar] [CrossRef]
- Moura, B.B.; Alves, E.S. Climatic Factors Influence Leaf Structure and Thereby Affect the Ozone Sensitivity of Ipomoea Nil ‘Scarlet O’Hara. Environ. Pollut. 2014, 194, 11–16. [Google Scholar] [CrossRef]
- Lefohn, A.S.; Malley, C.S.; Smith, L.; Wells, B.; Hazucha, M.; Simon, H.; Naik, V.; Mills, G.; Schultz, M.G.; Paoletti, E.; et al. Tropospheric Ozone Assessment Report: Global Ozone Metrics for Climate Change, Human Health, and Crop/Ecosystem Research. Elem. Sci. Anthr. 2018, 6, 27. [Google Scholar] [CrossRef]
- Paoletti, E.; Sicard, P.; Hoshika, Y.; Fares, S.; Badea, O.; Pitar, D.; Popa, I.; Anav, A.; Moura, B.B.; De Marco, A. Towards Long-Term Sustainability of Stomatal Ozone Flux Monitoring at Forest Sites. Sustain. Horiz. 2022, 2, 100018. [Google Scholar] [CrossRef]
- Sicard, P.; De Marco, A.; Carrari, E.; Dalstein-Richier, L.; Hoshika, Y.; Badea, O.; Pitar, D.; Fares, S.; Conte, A.; Popa, I.; et al. Epidemiological Derivation of Flux-Based Critical Levels for Visible Ozone Injury in European Forests. J. For. Res. 2020, 31, 1509–1519. [Google Scholar] [CrossRef]
- Schaub, M.; Calatayud, V.; Ferretti, M.; Brunialti, G.; Lövblad, G.; Krause, G.; Sanz, M.J. Part VIII: Monitoring of Ozone Injury. In Manual on Methods and Criteria for Harmonized Sampling, Assessment, Monitoring and Analysis of the Effects of Air Pollution on Forests; Thünen Institute of Forest Ecosystems: Eberswalde, 2016; Vol. 85. [Google Scholar]
- Sicard, P.; De Marco, A.; Dalstein-Richier, L.; Tagliaferro, F.; Renou, C.; Paoletti, E. An Epidemiological Assessment of Stomatal Ozone Flux-Based Critical Levels for Visible Ozone Injury in Southern European Forests. Sci. Total Environ. 2016, 541, 729–741. [Google Scholar] [CrossRef] [PubMed]
- Sicard, P.; Hoshika, Y.; Carrari, E.; De Marco, A.; Paoletti, E. Testing Visible Ozone Injury within a Light Exposed Sampling Site as a Proxy for Ozone Risk Assessment for European Forests. J. For. Res. 2021, 32, 1351–1359. [Google Scholar] [CrossRef]
- Marra, E.; De Marco, A.; Ebone, A.; Ferrara, A.M.; Giannetti, F.; Tagliaferro, F.; Sicard, P.; Popa, A.; Popa, I.; Paoletti, E.; et al. Flux-Based Assessment of Ozone Visible Foliar Injury in Southern Alps. J. For. Res. 2025, 36, 124. [Google Scholar] [CrossRef]
- Baesso Moura, B.; Carrari, E.; Dalstein-Richier, L.; Sicard, P.; Leca, S.; Badea, O.; Pitar-Silaghi, D.; Shashikumar, A.; Ciriani, M.-L.; Paoletti, E.; et al. Bridging Experimental and Monitoring Research for Visible Foliar Injury as Bio-Indicator of Ozone Impacts on Forests. Ecosyst. Health Sustain 2022, 8, 2144466. [Google Scholar] [CrossRef]
- Gottardini, E.; Cristofori, A.; Cristofolini, F.; Bussotti, F.; Ferretti, M. Responsiveness of Viburnum Lantana L. to Tropospheric Ozone: Field Evidence under Contrasting Site Conditions in Trentino, Northern Italy. J. Environ. Monit. 2010, 12, 2237. [Google Scholar] [CrossRef]
- Gottardini, Elena. Risposte Morfologiche, Fisiologiche e Geniche All’ozono Della Specie Arbustiva Viburnum Lantana L. PhD thesis, Università degli Studi di Firenze, 2012. [Google Scholar]
- Gottardini, E.; Cristofolini, F.; Cristofori, A.; Ferretti, M. Ozone Risk and Foliar Injury on Viburnum Lantana L.: A Meso-Scale Epidemiological Study. Sci. Total Environ. 2014, 493, 954–960. [Google Scholar] [CrossRef]
- Gottardini, E.; Cristofolini, F.; Ferretti, M. Foliar Symptoms on Viburnum Lantana Reflect Annual Changes in Summer Ozone Concentration in Trentino (Northern Italy). Ecol. Indic. 2017, 78, 26–30. [Google Scholar] [CrossRef]
- Faralli, M.; Cristofolini, F.; Cristofori, A.; Ferretti, M.; Gottardini, E. Leaf Trait Plasticity and Site-Specific Environmental Variability Modulate the Severity of Visible Foliar Ozone Symptoms in Viburnum Lantana. PLoS ONE 2022, 17, e0270520. [Google Scholar] [CrossRef] [PubMed]
- Paoletti, E.; Materassi, A.; Fasano, G.; Hoshika, Y.; Carriero, G.; Silaghi, D.; Badea, O. A New-Generation 3D Ozone FACE (Free Air Controlled Exposure). Sci. Total Environ. 2017, 575, 1407–1414. [Google Scholar] [CrossRef] [PubMed]
- Paoletti, E.; Ferrara, A.M.; Calatayud, V.; Cerveró, J.; Giannetti, F.; Sanz, M.J.; Manning, W.J. Deciduous Shrubs for Ozone Bioindication: Hibiscus Syriacus as an Example. Environ. Pollut. 2009, 157, 865–870. [Google Scholar] [CrossRef] [PubMed]
- Calatayud, V.; Cerveró, J.; Sanz, M.J. Foliar, Physiologial and Growth Responses of Four Maple Species Exposed to Ozone. Water Air Soil. Pollut. 2007, 185, 239–254. [Google Scholar] [CrossRef]
- JARVISt, P.G. The Interpretation of the Variations in Leaf Water Potential and Stomatal Conductance Found in Canopies in the Field.
- Hoshika, Y.; Fares, S.; Pellegrini, E.; Conte, A.; Paoletti, E. Water Use Strategy Affects Avoidance of Ozone Stress by Stomatal Closure in Mediterranean Trees—A Modelling Analysis. Plant Cell Environ. 2020, 43, 611–623. [Google Scholar] [CrossRef]
- Braun, S.; Schindler, C.; Leuzinger, S. Use of Sap Flow Measurements to Validate Stomatal Functions for Mature Beech (Fagus Sylvatica) in View of Ozone Uptake Calculations. Environ. Pollut. 2010, 158, 2954–2963. [Google Scholar] [CrossRef]
- Hoshika, Y.; Paoletti, E.; Omasa, K. Parameterization of Zelkova Serrata Stomatal Conductance Model to Estimate Stomatal Ozone Uptake in Japan. Atmos. Environ. 2012, 55, 271–278. [Google Scholar] [CrossRef]
- Bičárová, S.; Sitková, Z.; Pavlendová, H.; Fleischer, P.; Fleischer, P.; Bytnerowicz, A. The Role of Environmental Factors in Ozone Uptake of Pinus Mugo Turra. Atmos. Pollut. Res. 2019, 10, 283–293. [Google Scholar] [CrossRef]
- CLRTAP Mapping Critical Levels for Vegetation, Chapter III. In Manual on Methodologies and Criteria for Modelling and Mapping Critical Loads and Levels and Air Pollution Effects, Risks and Trends; Geneva, Switzerland, 2017.
- Hoshika, Y.; Moura, B.B.; Cotrozzi, L.; Nali, C.; Alfarraj, S.; Rennenberg, H.; Paoletti, E. An Assessment of Ozone Risk for Date Palm Suggests That Phytotoxic Ozone Dose Nonlinearly Affects Carbon Gain. Environ. Pollut. 2024, 342, 123143. [Google Scholar] [CrossRef]
- Novak, K.; Skelly, J.M.; Schaub, M.; Kräuchi, N.; Hug, C.; Landolt, W.; Bleuler, P. Ozone Air Pollution and Foliar Injury Development on Native Plants of Switzerland. Environ. Pollut. 2003, 125, 41–52. [Google Scholar] [CrossRef]
- Yamaguchi, M.; Watanabe, M.; Iwasaki, M.; Tabe, C.; Matsumura, H.; Kohno, Y.; Izuta, T. Growth and Photosynthetic Responses of Fagus Crenata Seedlings to O3 under Different Nitrogen Loads. Trees 2007, 21, 707–718. [Google Scholar] [CrossRef]
- Hoshika, Y.; Paoletti, E.; Pisuttu, C.; Cotrozzi, L.; Haworth, M.; Pellegrini, E.; Nali, C.; Ribeiro, R.V.; Mayer, J.L.S.; Moura, B.B. Leaf Phenology Determines the Response of Poplar Genotypes to O3 through Mesophyll Conductance. Plant J. 2025, 121, e70091. [Google Scholar] [CrossRef] [PubMed]
- Lombardozzi, D.; Sparks, J.P.; Bonan, G.; Levis, S. Ozone Exposure Causes a Decoupling of Conductance and Photosynthesis: Implications for the Ball-Berry Stomatal Conductance Model. Oecologia 2012, 169, 651–659. [Google Scholar] [CrossRef] [PubMed]
- Paoletti, E. Ozone Slows Stomatal Response to Light and Leaf Wounding in a Mediterranean Evergreen Broadleaf, Arbutus Unedo. Environ. Pollut. 2005, 134, 439–445. [Google Scholar] [CrossRef] [PubMed]
- Hoshika, Y.; De Carlo, A.; Baraldi, R.; Neri, L.; Carrari, E.; Agathokleous, E.; Zhang, L.; Fares, S.; Paoletti, E. Ozone-Induced Impairment of Night-Time Stomatal Closure in O3-Sensitive Poplar Clone Is Affected by Nitrogen but Not by Phosphorus Enrichment. Sci. Total Environ. 2019, 692, 713–722. [Google Scholar] [CrossRef] [PubMed]
- Hoshika, Y.; Katata, G.; Deushi, M.; Watanabe, M.; Koike, T.; Paoletti, E. Ozone-Induced Stomatal Sluggishness Changes Carbon and Water Balance of Temperate Deciduous Forests. Sci. Rep. 2015, 5, 9871. [Google Scholar] [CrossRef]
- Agrawal, S.B.; Agrawal, M.; Singh, A. Tropospheric Ozone A Hazard for Vegetation and Human Health; Cambridge Scholars Publishing, 2021. [Google Scholar]
- Pagano, M.; Hoshika, Y.; Gennari, F.; Manzini, J.; Marra, E.; Viviano, A.; Paoletti, E.; Sultana, S.; Tredicucci, A.; Toncelli, A. Probing Ozone Effects on European Hornbeam (Carpinus Betulus L. and Ostrya Carpinifolia Scop.) Leaf Water Content through THz Imaging and Dynamic Stomatal Response. Sci. Total Environ. 2024, 956, 177358. [Google Scholar] [CrossRef]
- Bussotti, F.; Agati, G.; Desotgiu, R.; Matteini, P.; Tani, C. Ozone Foliar Symptoms in Woody Plant Species Assessed with Ultrastructural and Fluorescence Analysis. New Phytol. 2005, 166, 941–955. [Google Scholar] [CrossRef] [PubMed]
- Bussotti, F.; Pollastrini, M. Observing Climate Change Impacts on European Forests: What Works and What Does Not in Ongoing Long-Term Monitoring Networks. Front. Plant Sci. 2017, 8, 629. [Google Scholar] [CrossRef] [PubMed]
Figure 1.
Seasonal patterns of solar irradiance, precipitation, and temperature by day of year (DOY) during the experiment. Color gradients illustrate the magnitude of each variable, with daily rainfall totals (B), average hourly data shown as dots, and monthly averages depicted as smoothed lines for solar irradiance (A) and mean temperature (C).
Figure 1.
Seasonal patterns of solar irradiance, precipitation, and temperature by day of year (DOY) during the experiment. Color gradients illustrate the magnitude of each variable, with daily rainfall totals (B), average hourly data shown as dots, and monthly averages depicted as smoothed lines for solar irradiance (A) and mean temperature (C).
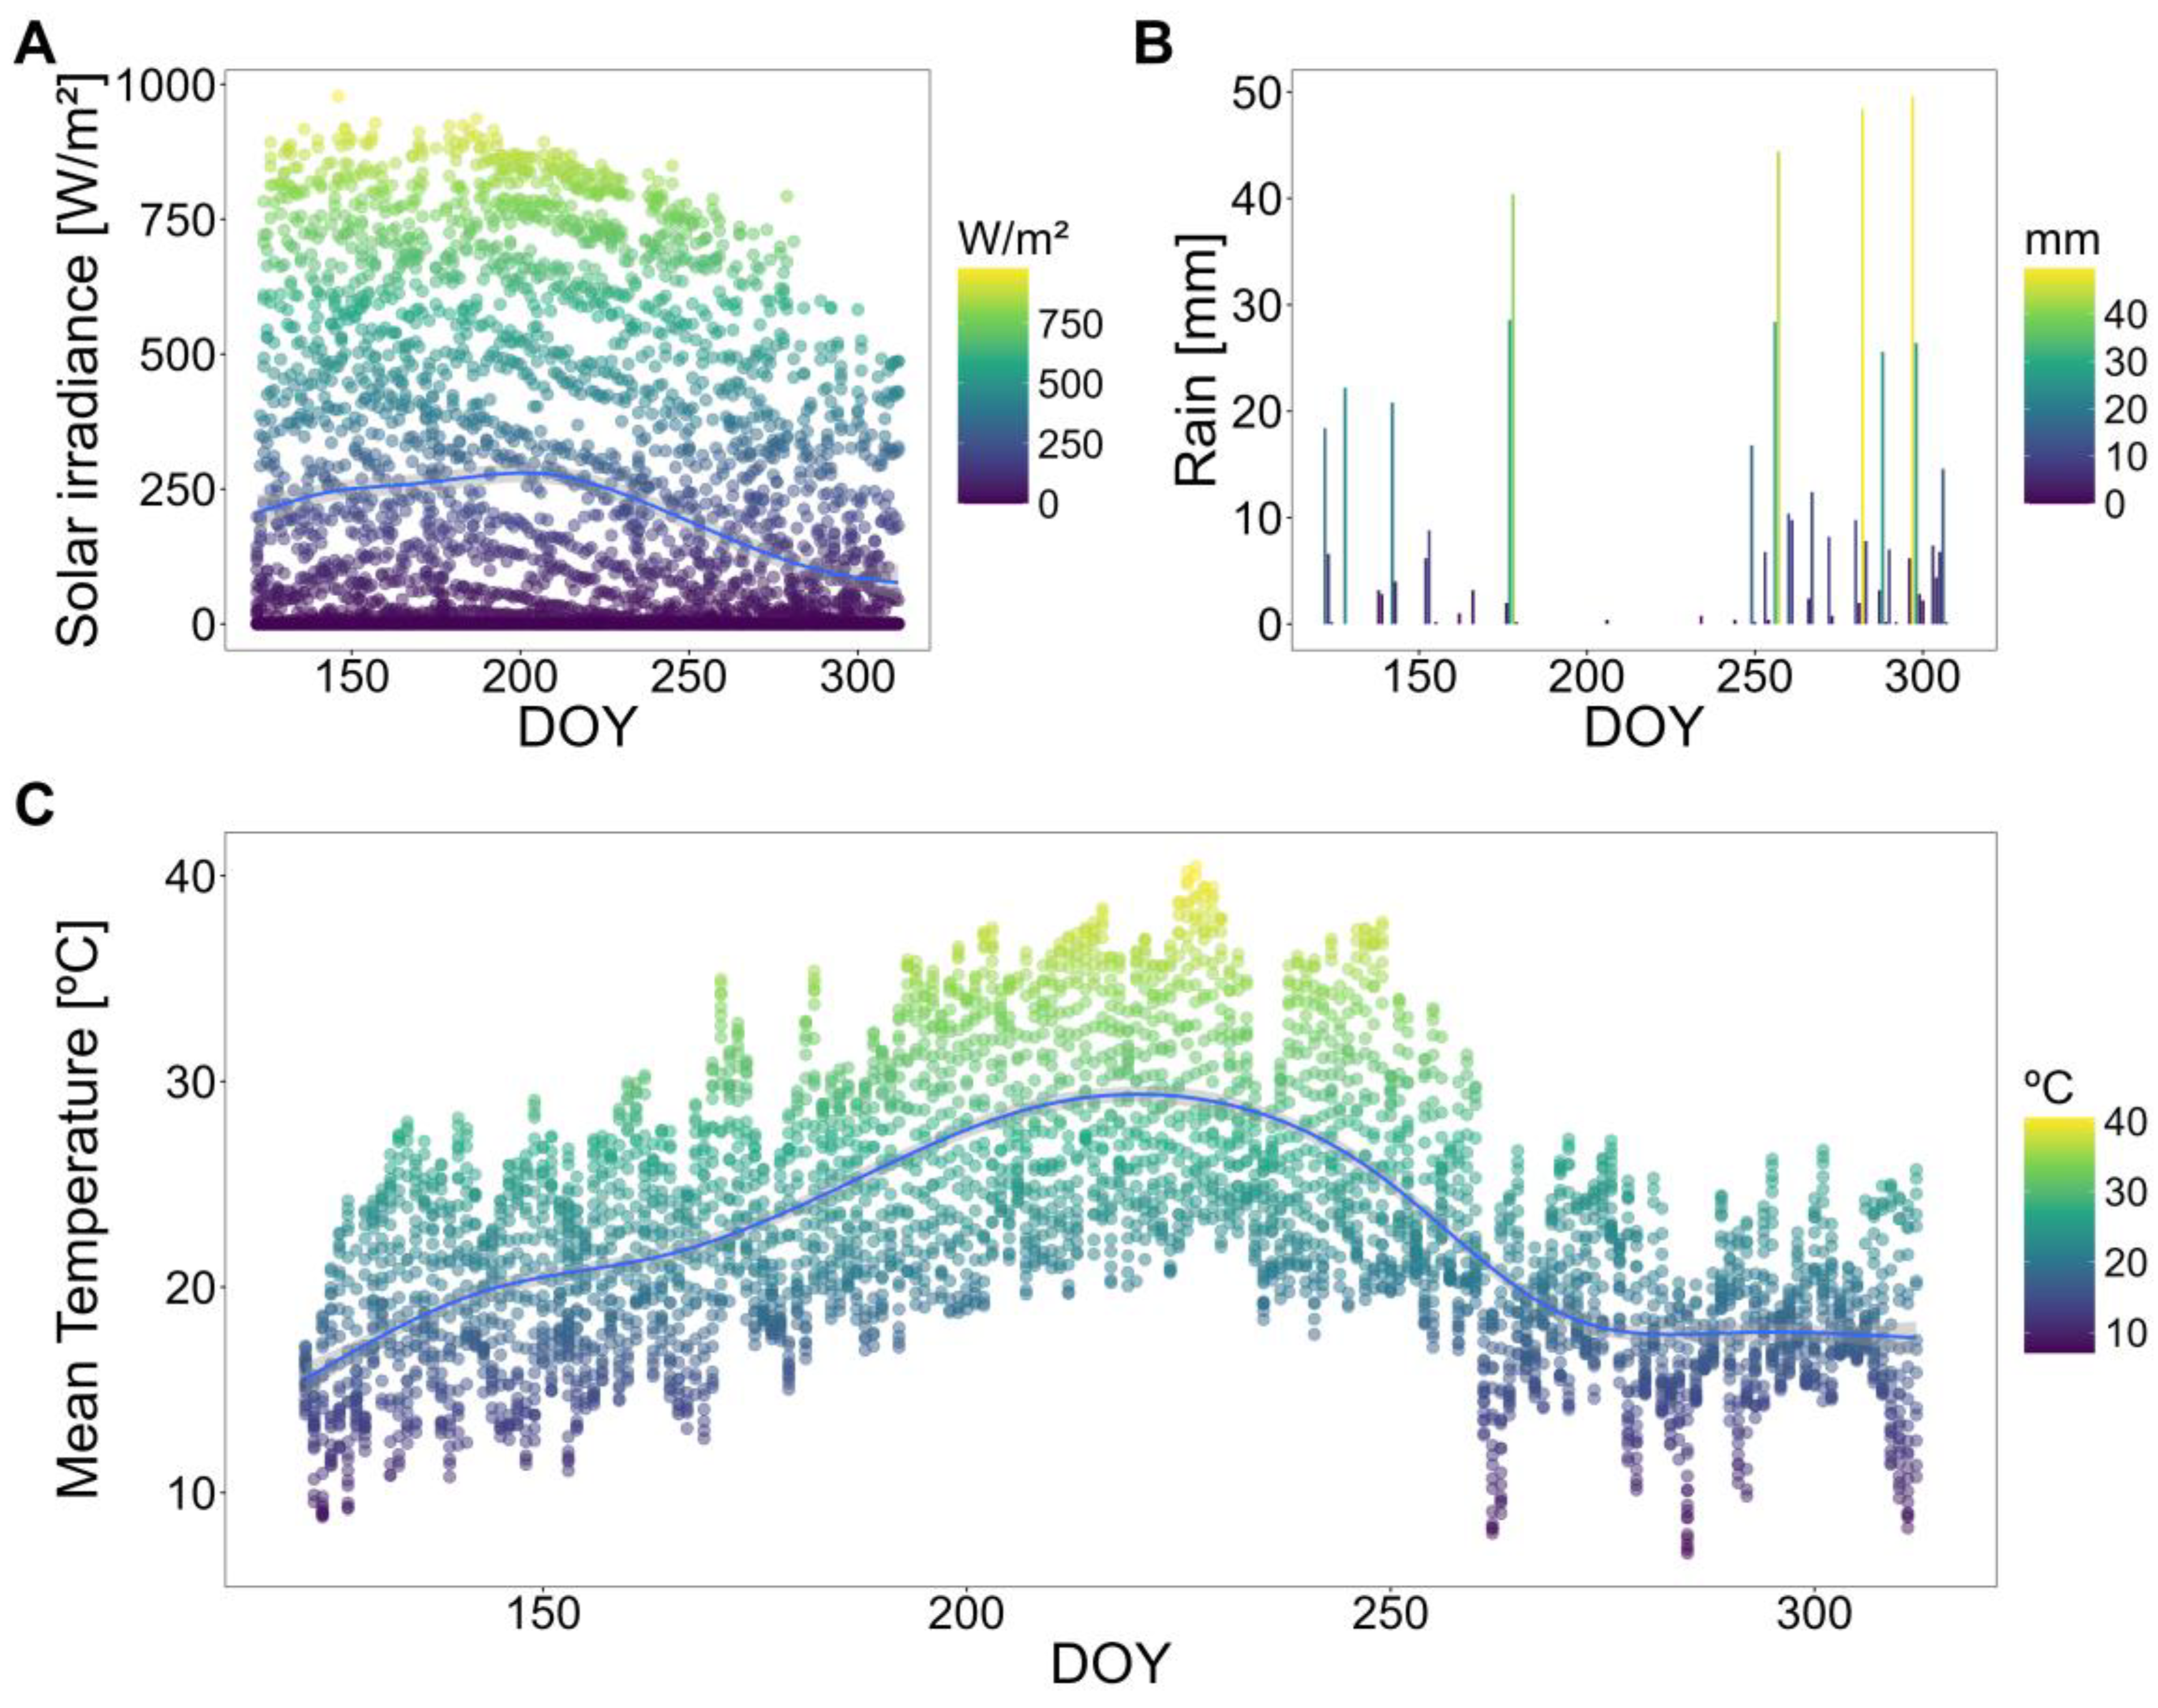
Figure 2.
Perceptual color composition of the O3 VFI (visible foliar injury) in Viburnum lantana. The 16 selected colors illustrate the gradient of O3 VFI development, ranging from light to dark brownish hues (darker colors correspond to higher levels of alteration, indicating more severe damage—e.g., light grey = low damage; dark brown = high damage) with intermediate reddish tones.
Figure 2.
Perceptual color composition of the O3 VFI (visible foliar injury) in Viburnum lantana. The 16 selected colors illustrate the gradient of O3 VFI development, ranging from light to dark brownish hues (darker colors correspond to higher levels of alteration, indicating more severe damage—e.g., light grey = low damage; dark brown = high damage) with intermediate reddish tones.
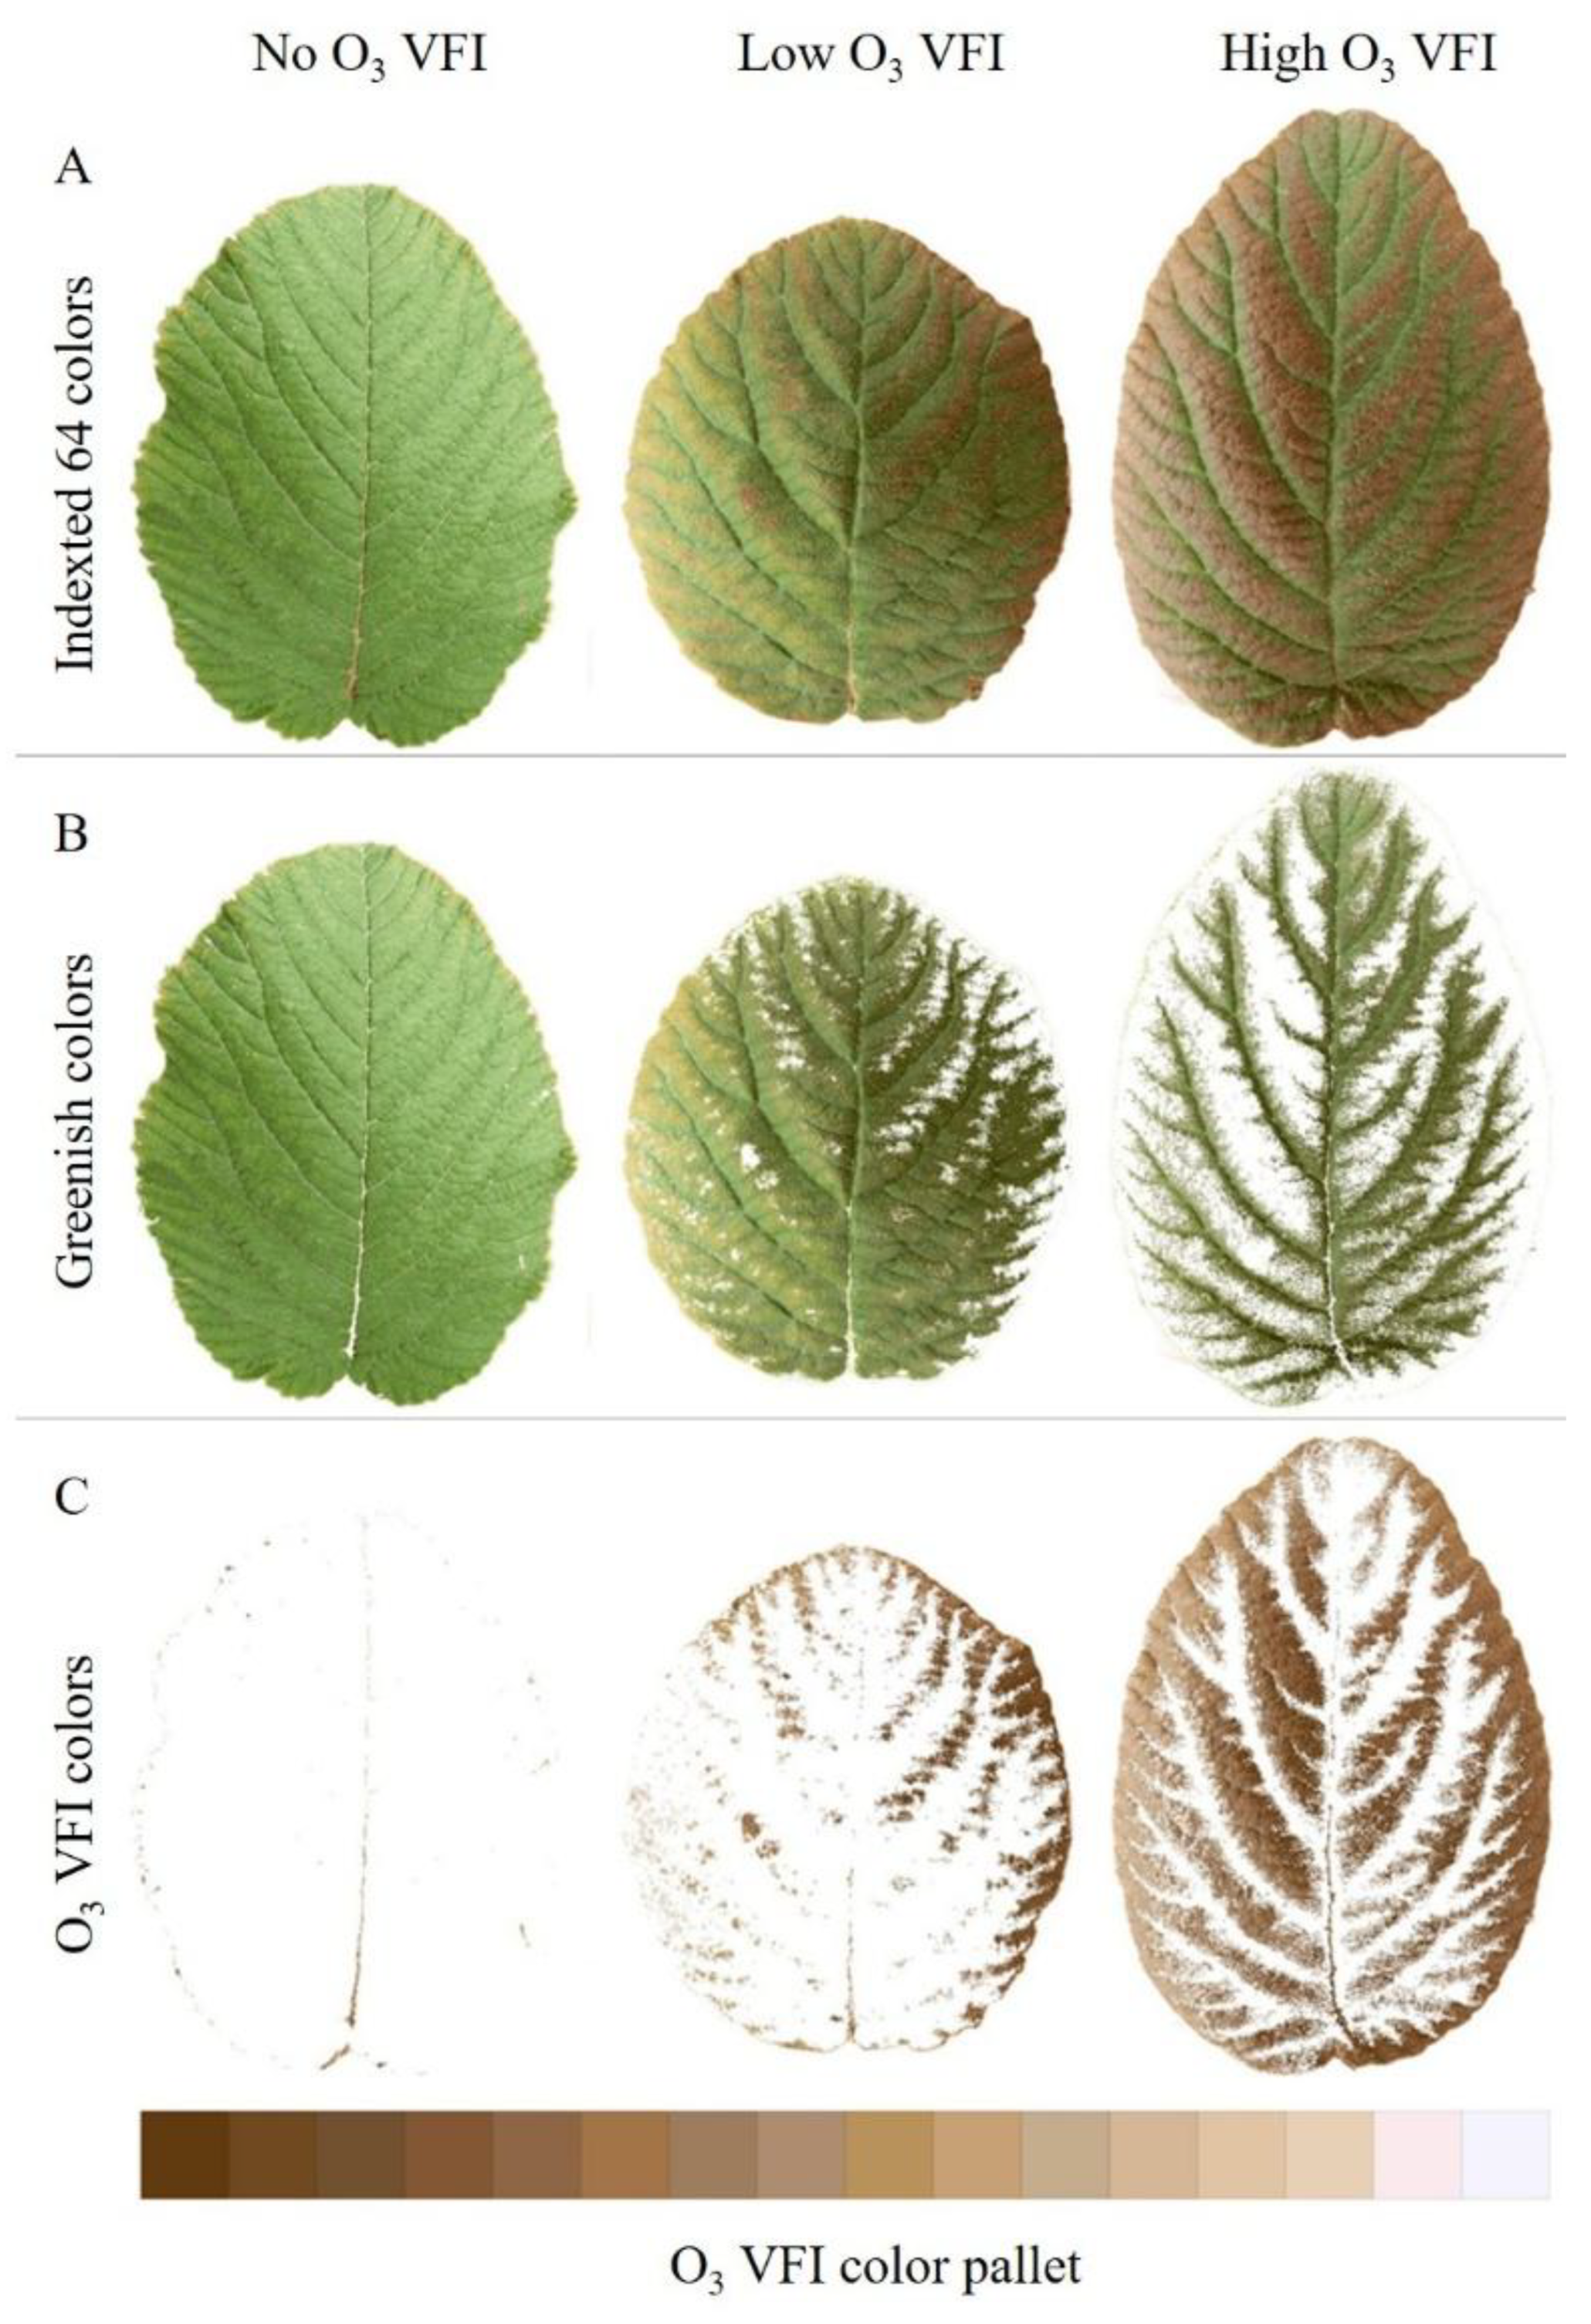
Figure 3.
Parameterization of stomatal response functions (flight, ftemp, and fVPD) for Viburnum lantana. The fitted stomatal response functions are shown as red curves, with measured stomatal conductance values (gs) plotted as black points.
Figure 3.
Parameterization of stomatal response functions (flight, ftemp, and fVPD) for Viburnum lantana. The fitted stomatal response functions are shown as red curves, with measured stomatal conductance values (gs) plotted as black points.
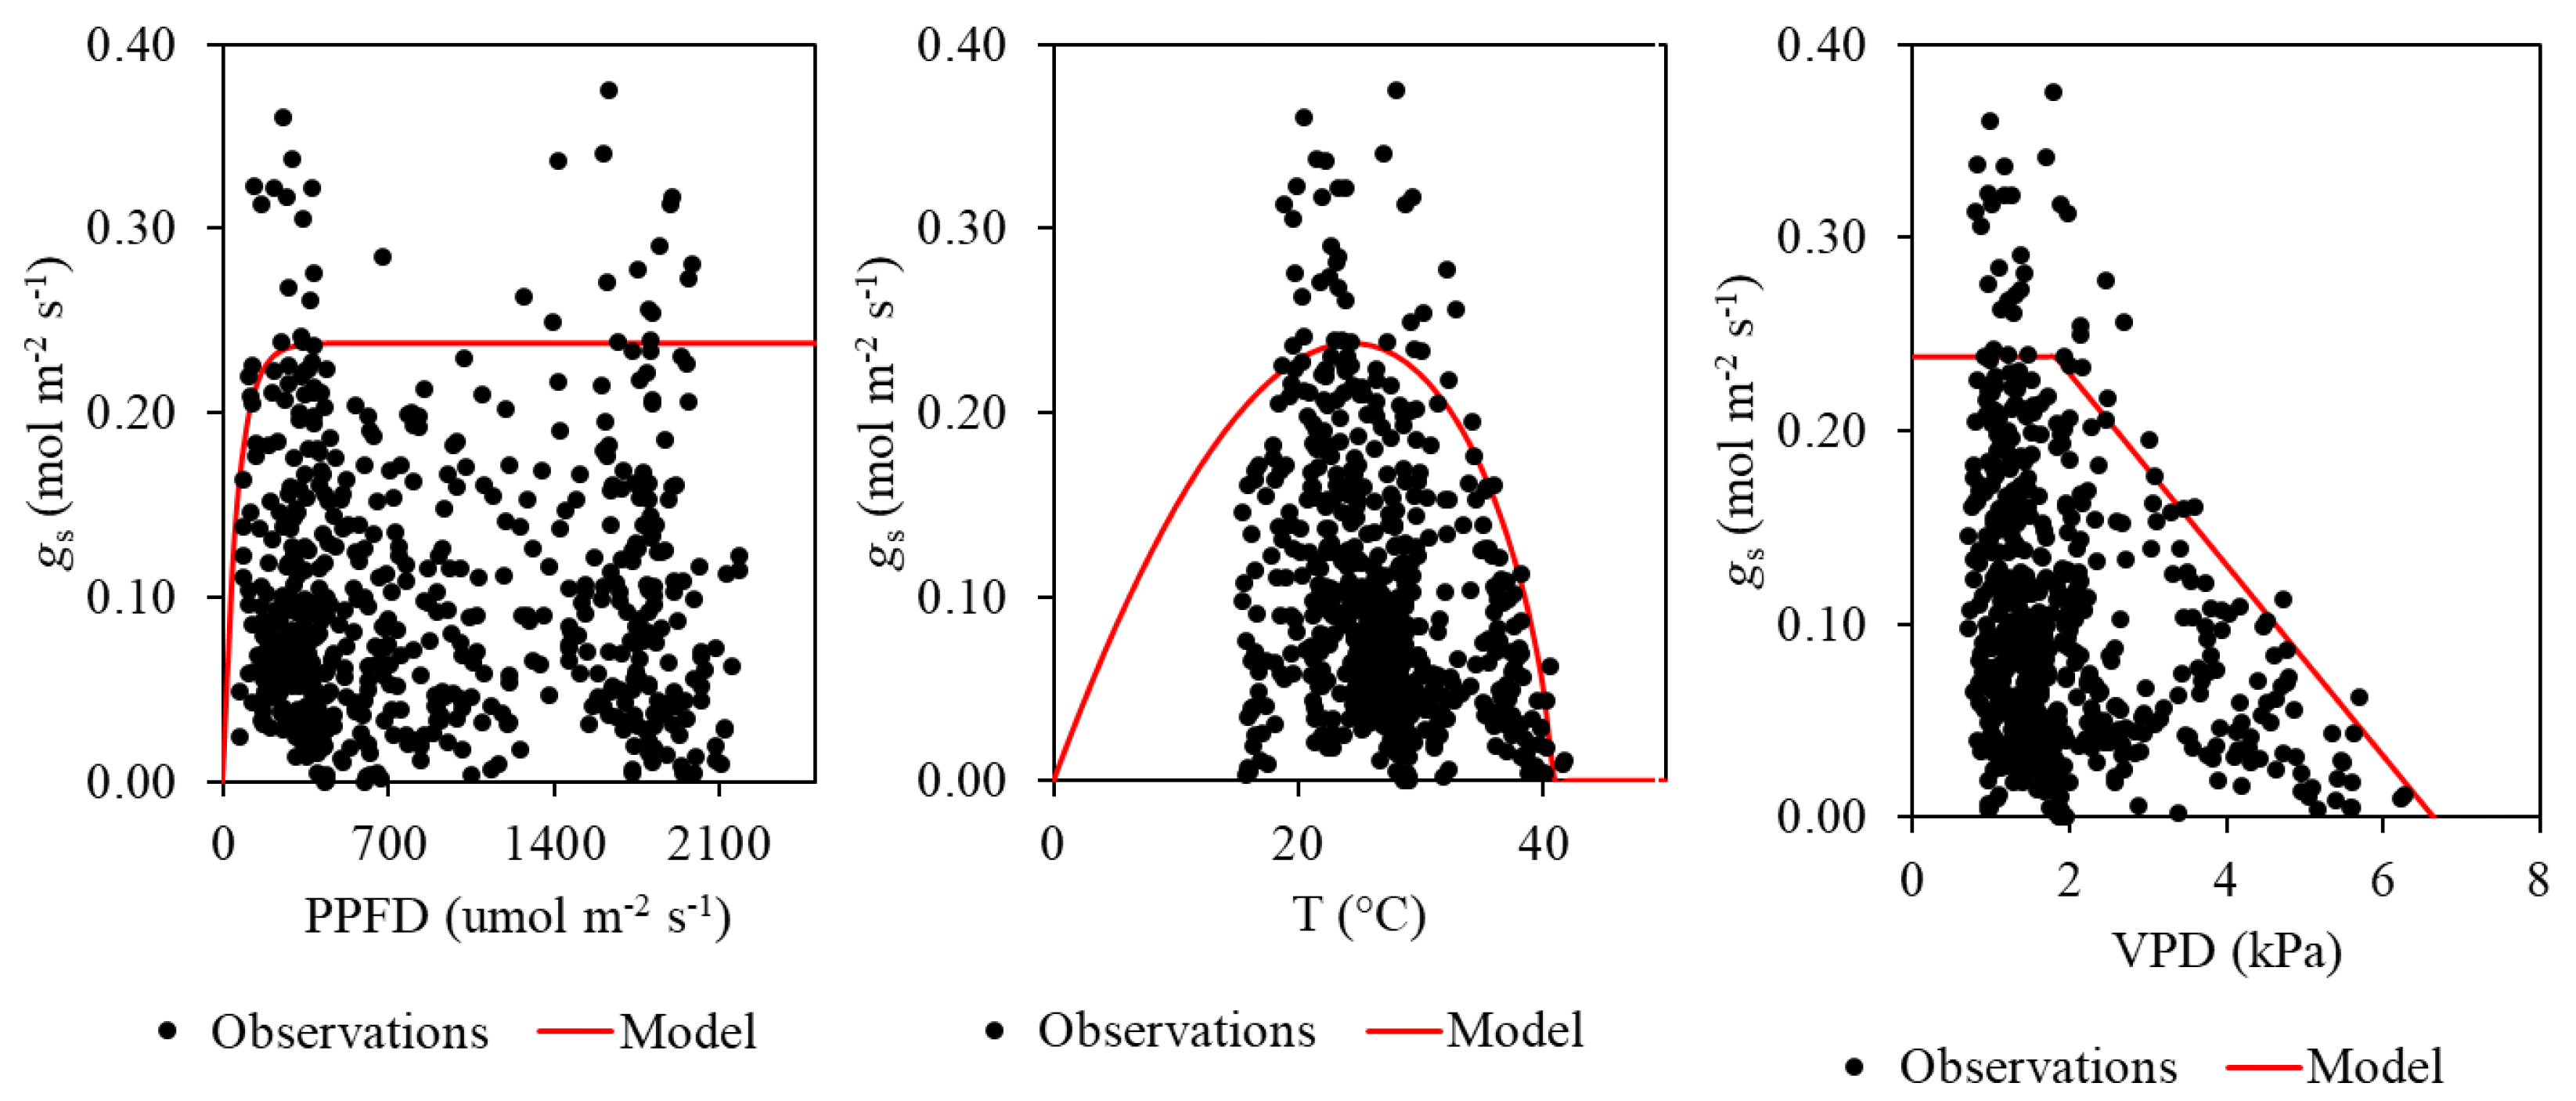
Figure 4.
Regression models between the selected features of Viburnum lantana: (A) Relative Plant Injury Index (PII), (B) Relative light-saturated net photosynthetic rate (Asat), (C) Relative stomatal conductance (gs) and ozone exposure metrics (Phytotoxic Ozone Dose above a threshold of 1 nmol m–2 s–1—POD1 (A–C) or the Accumulated Ozone Exposure Over a Threshold of 40 ppb—AOT40 [A-inset]. Each graph reports the regression line, corresponding coefficient of determination (R2), and Akaike Information Criterion (AIC). Statistical significance of the regression is indicated as: ** p ≤ 0.01, * p ≤ 0.05.
Figure 4.
Regression models between the selected features of Viburnum lantana: (A) Relative Plant Injury Index (PII), (B) Relative light-saturated net photosynthetic rate (Asat), (C) Relative stomatal conductance (gs) and ozone exposure metrics (Phytotoxic Ozone Dose above a threshold of 1 nmol m–2 s–1—POD1 (A–C) or the Accumulated Ozone Exposure Over a Threshold of 40 ppb—AOT40 [A-inset]. Each graph reports the regression line, corresponding coefficient of determination (R2), and Akaike Information Criterion (AIC). Statistical significance of the regression is indicated as: ** p ≤ 0.01, * p ≤ 0.05.
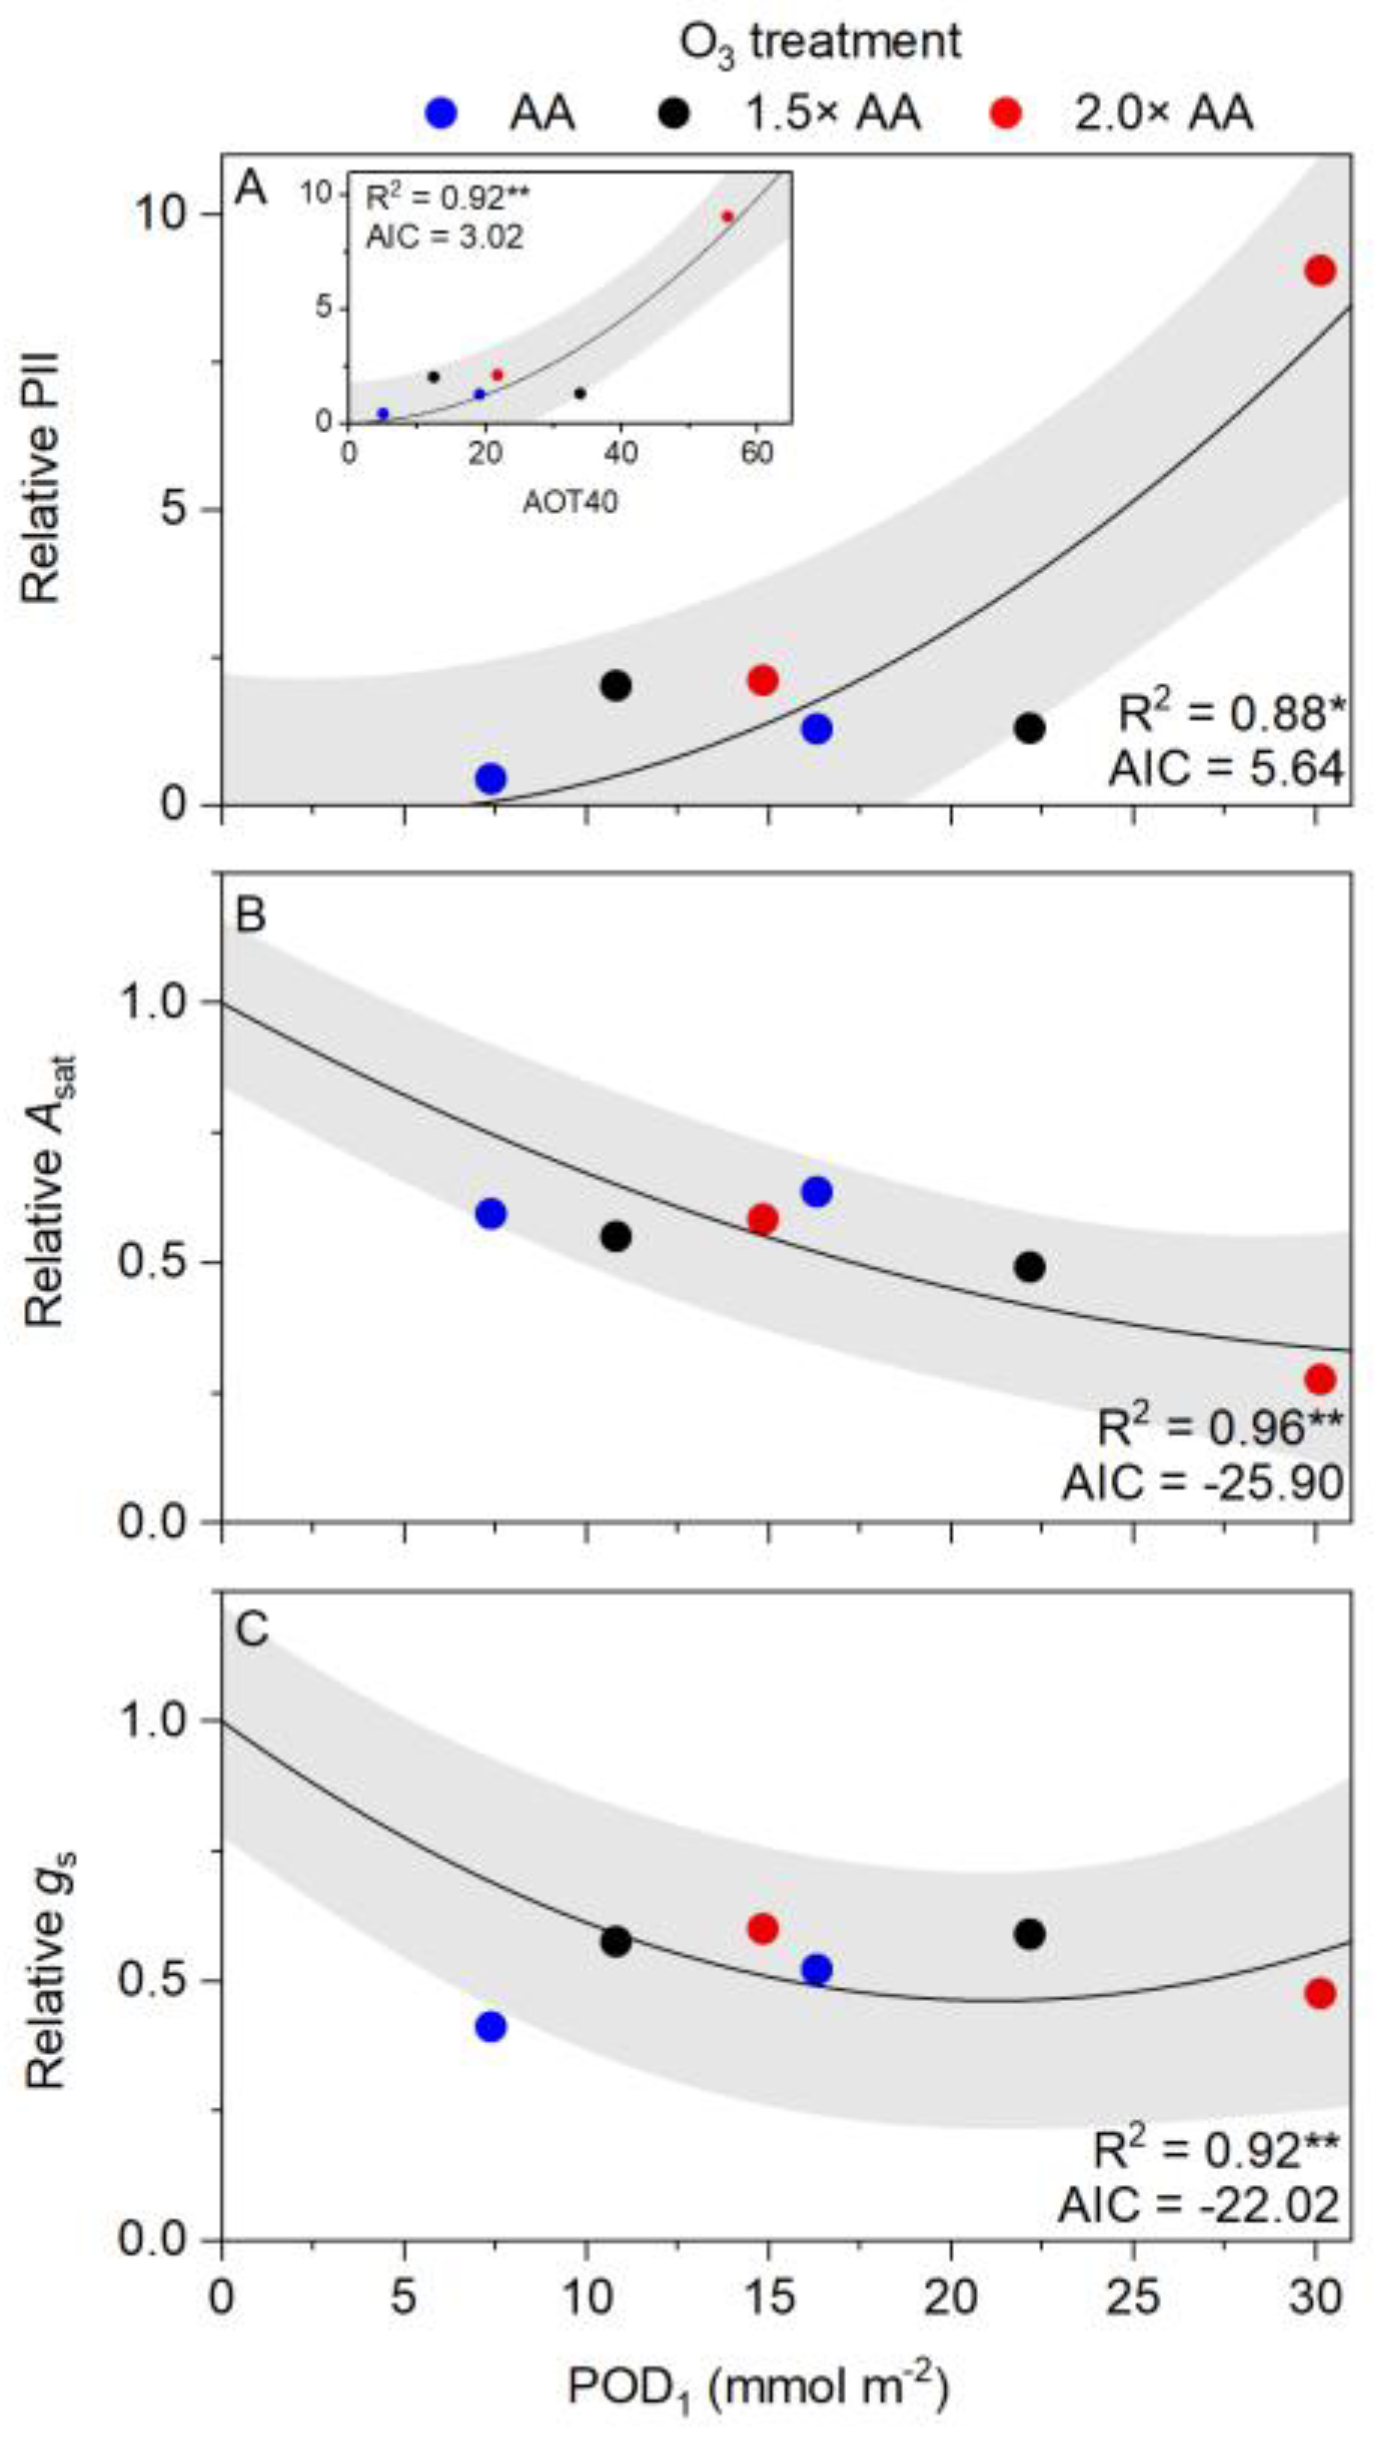

Table 1.
Plant Injury Index (PII) and physiological traits measured (light-saturated net photosynthetic rate [Asat], stomatal conductance [gs], SPAD, the maximum photochemical efficiency of PSII [Fv/Fm]) in Viburnum lantana sampling under ambient air (AA), 1.5×AA, and 2.0×AA O3 treatments. Measurements were taken before exposure (T0, 13th May), after 55 days (T1, 11th July) and after 114 days (T2, 8th September). Values are reported as plot means ± SE (n = 3). Significance levels from two-way ANOVA are indicated as *** p ≤ 0.001, ** p ≤ 0.01, * p ≤ 0.05, and—= not significant. Different letters denote significant differences among O3 and time interactions based on Tukey’s HSD test.
Table 1.
Plant Injury Index (PII) and physiological traits measured (light-saturated net photosynthetic rate [Asat], stomatal conductance [gs], SPAD, the maximum photochemical efficiency of PSII [Fv/Fm]) in Viburnum lantana sampling under ambient air (AA), 1.5×AA, and 2.0×AA O3 treatments. Measurements were taken before exposure (T0, 13th May), after 55 days (T1, 11th July) and after 114 days (T2, 8th September). Values are reported as plot means ± SE (n = 3). Significance levels from two-way ANOVA are indicated as *** p ≤ 0.001, ** p ≤ 0.01, * p ≤ 0.05, and—= not significant. Different letters denote significant differences among O3 and time interactions based on Tukey’s HSD test.
| O3 × Time | PII |
Asat µmol m–2 s–1 |
gs µmol m–2 s–1 |
SPAD | Fv/Fm | |
| T0 | AA | 0.00 ± 0.00a | 14.68 ± 1.03 | 0.20 ± 0.03 | 44.40 ± 1.15 | 0.75 ± 0.00a |
| 1.5× | 0.00 ± 0.00a | 13.08 ± 0.75 | 0.14 ± 0.01 | 43.77 ± 1.37 | 0.73 ± 0.01a | |
| 2.0× | 0.00 ± 0.00a | 12.85 ± 0.91 | 0.17 ± 0.01 | 40.43 ± 3.17 | 0.75 ± 0.01a | |
| T1 | AA | 0.44 ± 0.12a | 8.05 ± 0.22 | 0.07 ± 0.00 | 52.10 ± 0.64 | 0.73 ± 0.01a |
| 1.5× | 2.03 ± 1.11a | 7.47 ± 1.13 | 0.10 ± 0.01 | 39.90 ± 3.55 | 0.71 ± 0.02a | |
| 2.0× | 2.12 ± 1.41a | 7.92 ± 1.02 | 0.10 ± 0.01 | 41.27 ± 5.78 | 0.64 ± 0.01b | |
| T2 | AA | 1.29 ± 0.71a | 8.62 ± 0.32 | 0.09 ± 0.01 | 54.77 ± 2.54 | 0.74 ± 0.01a |
| 1.5× | 1.31 ± 0.62a | 6.68 ± 0.65 | 0.10 ± 0.01 | 42.97 ± 5.49 | 0.75 ± 0.02a | |
| 2.0× | 9.06 ± 3.24b | 3.73 ± 0.60 | 0.08 ± 0.02 | 46.77 ± 5.20 | 0.72 ± 0.01a | |
| ANOVA | O3 | * | ** | – | * | ** |
| Time | ** | *** | *** | – | ** | |
| O3 × Time | * | – | – | – | ** | |
Table 2.
Ozone critical levels (CLs) for visible foliar injury and physiological responses in Viburnum lantana were estimated through the Plant Injury Index (PII), light-saturated net photosynthetic rate (Asat), and stomatal conductance (gs). Two metrics of ozone exposure were examined and tested using the polynomial model: the stomatal flux-based Phytotoxic Ozone Dose above a threshold of 1 nmol m–2 s–1 (POD1), and the exposure-based AOT40 (Accumulated Ozone Exposure Over a Threshold of 40 ppb). The CLs for PII were calculated considering the injury onset (PII = 0.01), and for the photosynthetic parameters were derived as 4% reduction from the baseline value.
Table 2.
Ozone critical levels (CLs) for visible foliar injury and physiological responses in Viburnum lantana were estimated through the Plant Injury Index (PII), light-saturated net photosynthetic rate (Asat), and stomatal conductance (gs). Two metrics of ozone exposure were examined and tested using the polynomial model: the stomatal flux-based Phytotoxic Ozone Dose above a threshold of 1 nmol m–2 s–1 (POD1), and the exposure-based AOT40 (Accumulated Ozone Exposure Over a Threshold of 40 ppb). The CLs for PII were calculated considering the injury onset (PII = 0.01), and for the photosynthetic parameters were derived as 4% reduction from the baseline value.
| Variable / O3 index | AOT40 (ppm h) | POD1 (mmol m–2) |
| PII | 4.42 | 7.82 |
| Asat | 2.27 | 1.61 |
| gs | 1.31 | 1.22 |
Disclaimer/Publisher’s Note: The statements, opinions and data contained in all publications are solely those of the individual author(s) and contributor(s) and not of MDPI and/or the editor(s). MDPI and/or the editor(s) disclaim responsibility for any injury to people or property resulting from any ideas, methods, instructions or products referred to in the content. |
© 2026 by the authors. Licensee MDPI, Basel, Switzerland. This article is an open access article distributed under the terms and conditions of the Creative Commons Attribution (CC BY) license (http://creativecommons.org/licenses/by/4.0/).
Copyright: This open access article is published under a Creative Commons CC BY 4.0 license, which permit the free download, distribution, and reuse, provided that the author and preprint are cited in any reuse.


