

Submitted:
13 May 2026
Posted:
13 May 2026
You are already at the latest version
Abstract
Forest edge effects are commonly interpreted as radial gradients from the edge toward the interior, but this assumption may oversimplify the spatial organization of heterogeneous tropical forest fragments. Here, we integrated field-based phytosociological data with Sentinel-2 spectral indices to evaluate whether edge-effect interpretation depends on analytical scale in Semideciduous Seasonal Forest fragments embedded in the Brazilian Cerrado. Five fragments were analyzed using transect-based plots and continuous pixel-level modeling. Basal area showed a strong positive correlation with NDVI (r = 0.95), supporting its use as the main spectral proxy for vegetation structure. Plot-level segmented regression detected edge-to-interior transitions, with breakpoints ranging from approximately 13 to 39 m. However, pixel-level modeling revealed scale-dependent responses, including shallow gradients in IF and AC, an intermediate transition in CN, a deeper gradient in IP, and high internal heterogeneity without a single dominant radial transition in Panga. The first two PCA axes explained approximately 81% of the total variance, reinforcing the structural–spectral correspondence. These findings show that edge effects are detectable but not adequately represented by fixed radial zones alone. Pixel-level Sentinel-2 modeling improves the spatial interpretation of fragmented tropical forests.
Keywords:
edge effects
; Sentinel‐2
; NDVI
; pixel‐level modeling
; scale dependence
; forest fragmentation
; structural heterogeneity
; Semideciduous Seasonal Forest
; Brazilian Cerrado
1. Introduction
Forest fragmentation alters ecological processes by creating edges between native vegetation and surrounding anthropogenic matrices. Studies on edge effects in forest ecosystems are largely based on the premise that their ecological responses are organized along monotonic and radial gradients from the edge towards the interior of the fragments [1,2,3,4]. This approach has been fundamental to the conceptual advancement of fragmentation ecology, but it tends to oversimplify the spatial complexity of natural systems, especially in heterogeneous tropical landscapes [5,6]. Forest edges represent transition zones between natural vegetation and anthropogenic areas, and are associated with microclimatic changes, reduced humidity, increased light incidence, and greater exposure to disturbances [7,8,9].
These changes directly affect the structure, composition, and biodiversity of ecosystems [3,10], favoring degradation processes, increasing the occurrence of fires, and limiting natural regeneration [11]. On a global scale, it is estimated that approximately 70% of remaining forests are located less than 1 km from an edge, which reinforces the centrality of these processes in the organization of contemporary landscapes [10].
In the Brazilian Cerrado, this problem takes on particular relevance in the Semideciduous Seasonal Forests (SSF), communities of Atlantic origin inserted in a context of intense agricultural expansion [12,13,14]. In these systems, proximity to agricultural matrices increases exposure to disturbances and imposes abrupt transitions between native vegetation and anthropogenic land uses, making it essential to distinguish intrinsic structural variations in vegetation from those induced by fragmentation [15]. Evidence suggests that fragmentation can reduce biodiversity, alter floristic composition, and promote progressive declines in biomass and carbon stocks [3,5], but the way these effects are spatially distributed within the fragments remains insufficiently understood.
Remote sensing offers a scalable approach to investigating spatial patterns of vegetation at multiple scales [16,17]. Spectral indices derived from orbital images, such as NDVI, EVI, NDMI, and vegetation fraction (VF), provide complementary metrics related to the structural and functional condition of the canopy [18,19,20,21]. However, the isolated use of these indices may be limited, since their responses are influenced by seasonality, spectral saturation, and the intrinsic heterogeneity of the vegetation [22,23,24], requiring integrated approaches and validation with field data.
A recurring additional limitation in landscape ecology studies relates to the treatment of spatial scale. Aggregating data into discrete units can introduce biases associated with the Modifiable Area Unit Problem (MAUP), influencing the detection and interpretation of ecological patterns [25,26]. In the case of the edge effect, this limitation is particularly critical, as the structure of the fragments may not be adequately represented by average values or fixed distance classes. Instead, the edge effect may emerge as a continuous gradient embedded in heterogeneous structural mosaics, in which the distance to the edge is only one of the factors explaining the vegetation organization [6,27].
In this study, we integrated structural data obtained in the field with high-resolution spectral information derived from Sentinel-2 images to investigate the edge effect in fragments of Semideciduous Seasonal Forest in the Brazilian Cerrado. Through vegetation indices, principal component analysis, segmented regression, bootstrap uncertainty estimation, and pixel-level spatial modeling, we evaluated the ability of spectral responses to represent structural variations along the edge-to-interior gradient. Unlike conventional approaches, this strategy allows us not only to estimate the depth of the edge effect but also to characterize the internal structural heterogeneity of the fragments, highlighting spatial patterns that do not necessarily follow a radial behavior.
We formulated the following hypotheses: (i) vegetation indices selected by multivariate criteria show a strong correspondence with structural field metrics, especially basal area; (ii) the edge effect manifests itself as a continuous and detectable spectral gradient; (iii) the integration of multiple indices expands the ability to discriminate structural and functional variations in vegetation; (iv) the estimation of the depth of the edge effect is dependent on the scale of analysis, being influenced by spatial aggregation processes; and (v) the internal heterogeneity of fragments plays a central role in the spatial organization of vegetation, not being explained exclusively by the distance to the edge.
By explicitly integrating scale, spatial heterogeneity, and structural attributes of vegetation, this study advances the understanding of the expression of the edge effect in fragmented landscapes, proposing an approach that surpasses interpretation based exclusively on radial gradients and contributes to the development of more robust metrics for assessing forest structural integrity.
2. Materials and Methods
2.1. Study Area
The study was conducted in five fragments of Semideciduous Seasonal Forest (SSF) embedded within the Cerrado biome in central Brazil. These formations represent forest enclaves of Atlantic origin inserted in a predominantly agricultural matrix [28], where fragmentation imposes marked environmental and structural gradients from the edge toward the forest interior.
Four fragments are located in the municipality of Ipameri, Goiás, in a landscape dominated by intensive agriculture: IP (15.2 ha), AC (21.5 ha), IF (8.8 ha), and CN (12.2 ha). These fragments are relatively small and isolated, representing typical conditions of forest remnants in anthropogenic areas of the Cerrado [29]. The fifth fragment corresponds to the Panga Private Natural Heritage Reserve (Panga), located in Uberlândia, Minas Gerais, with an area of 403.85 ha.
The inclusion of Panga provides a structural reference due to its larger size, greater internal continuity, and protection history since 1997. This contrast between small, more disturbed fragments and a larger fragment allows us to evaluate how edge effects and internal heterogeneity are expressed under different structural contexts.
The analyses were conducted at two complementary spatial scales: (i) a local scale, based on sampling along the edge–interior gradient, and (ii) a continuous spatial scale, considering the entire area of each fragment. The location of the study areas is shown in Figure 1, and their spatial characteristics are summarized in Table 1.
2.2. Sampling Design
In each fragment, three parallel transects were established perpendicular to the forest edge and spaced 50 m apart. Each transect extended 100 m toward the interior of the fragment, starting at the outer contact line with the adjacent matrix.
Along each transect, ten permanent 10 × 10 m plots were systematically established at 10 m intervals, totaling 30 plots (3,000 m²) per fragment and 150 plots across the entire study. This design allowed the edge–interior gradient to be represented from 0 to 100 m in a standardized manner among fragments. The spatial arrangement of the plots was designed to ensure direct correspondence between field sampling positions and spatial units used in remote sensing analyses, using the center of each plot as the reference point for integrating structural and spectral data. The sampling design is shown in Figure 2.
2.3. Vegetation Structural Data
Phytosociological surveys were conducted in the plots to characterize the structure of the tree vegetation, following procedures widely adopted for seasonal tropical forests [13,28]. All live tree individuals with circumference at breast height (CBH) ≥ 15 cm were sampled.
For each individual, circumference at breast height and total height were recorded, allowing structural metrics to be obtained at the plot level. Individual basal area was estimated assuming a circular cross-section of the trunk and was subsequently aggregated by plot and standardized per hectare.
Basal area per plot was adopted as the main structural metric of vegetation because it integrates tree density and individual size, and is widely used as a proxy for canopy structure in ecological and remote sensing studies [30].
2.4. Remote Sensing Data
Sentinel-2 Level-2A images acquired between 2016 and 2019 were used, selected with cloud cover lower than 1%. The images have a spatial resolution of 10 m in the visible and near-infrared bands, allowing detailed spatial analysis of vegetation in the studied fragments. From these images, the following spectral indices were derived: Normalized Difference Vegetation Index (NDVI), Enhanced Vegetation Index (EVI), Normalized Difference Moisture Index (NDMI), and vegetation fraction (VF) [18,21,22,31].
NDVI and EVI were calculated from bands with 10 m spatial resolution, whereas NDMI was derived from the shortwave infrared band (SWIR, B11), which has an original spatial resolution of 20 m. To allow spatial integration among indices and correspondence with the 10 × 10 m sample plots, NDMI was resampled to 10 m. This step ensured geometric compatibility among datasets; however, the effective resolution of NDMI remains conditioned by its original scale and should therefore be interpreted as a complementary functional indicator of canopy structure.
Vegetation fraction (VF) was estimated from NDVI using linear normalization between minimum and maximum reference values (NDVImax = 0.95 and NDVImin = 0.05), defined from the empirical distribution of the sample set [18],
The resulting VF layer was kept at 10 m spatial resolution and geometrically compatible with the other indices derived from higher-resolution bands. The centers of the sample plots were georeferenced in the field and used as spatial references for extracting spectral values, ensuring direct correspondence between vegetation structural measurements and observed spectral responses. Spectral extraction was performed by spatial overlay between vector plot data and spectral-index raster layers. The formulas used to calculate the spectral indices are provided in the Supplementary Materials.
2.5. Structural–Spectral Integration
The integration between vegetation structure and spectral response was performed by analyzing the relationship between basal area per plot and vegetation indices derived from Sentinel-2 imagery. Plots were considered independent sampling units, with basal area values associated with the respective spectral values extracted from plot centers.
Pearson correlation coefficients were calculated to quantify the linear association between basal area and the NDVI, EVI, NDMI, and VF indices. This approach allowed us to assess the ability of each index to represent structural variation in vegetation along the edge–interior gradient.
Based on the obtained coefficients, NDVI was selected as the index with the strongest correspondence with vegetation structure and was therefore adopted as the main variable in subsequent edge-effect analyses. Additionally, NDMI was used as a complementary metric to characterize variation in canopy water condition, especially in pixel-level spatial analyses. This choice is justified by the recognized sensitivity of NDVI to biomass and canopy structure, particularly in studies integrating field data and remote sensing [16].
2.6. Local-Scale Structural Threshold Detection
Structural thresholds along the edge–interior gradient were detected using segmented regression applied to mean basal area and NDVI values organized into distance classes from 0–10 m to 90–100 m. Initially, simple linear models were fitted relating structural and spectral variables to distance from the edge. Segmented regression was then applied to estimate the breakpoint, representing the transition between zones under stronger edge influence and conditions closer to the forest interior.
The models were fitted in the R environment using the segmented package, allowing estimation of the breakpoint and its respective confidence intervals [32]. The analyses were conducted considering the sampling extent corresponding to the transects (0–100 m), so that the estimated values represent the depth of the edge effect at the discrete plot scale.
2.7. Continuous Pixel-Level Spatial Modeling
Continuous-scale edge-effect modeling was performed at the pixel level using Sentinel-2 imagery with 10 m spatial resolution. For each fragment, a distance-to-edge raster was generated from the vector boundary of the forest area, considering only pixels located inside the fragments.
NDVI values were associated with each pixel and related to the respective distance from the edge, forming a continuous spatial observation dataset. All spectral indices used in the analyses were previously harmonized to 10 m spatial resolution, ensuring geometric consistency in the pixel-by-pixel analysis. This approach allowed the edge–interior gradient to be analyzed continuously, overcoming limitations associated with discretization into distance classes.
Based on this dataset, a segmented regression model was fitted to estimate the breakpoint along the spatial gradient, using NDVI as the response variable and distance from the edge as the explanatory variable. The models were fitted in the R environment using the segmented package [32], considering a single breakpoint.
To evaluate the quality and uncertainty of the estimates, a bootstrap resampling procedure with 2000 iterations was applied, allowing the empirical distribution of breakpoints and their respective confidence intervals to be obtained. This approach allows the edge effect to be represented as a continuous spatial gradient, reducing potential biases associated with the aggregation of discrete sampling units, known as the Modifiable Areal Unit Problem (MAUP).
2.8. Spatial Heterogeneity and Structural Classification
The internal structural heterogeneity of the fragments was evaluated by classifying NDVI values at the pixel level, allowing the discrimination of different levels of vegetation vigor and density. Five structural classes were defined based on fixed NDVI thresholds (<0.20; 0.20–0.35; 0.35–0.45; 0.45–0.55; ≥0.55), representing degraded areas, herbaceous vegetation, intermediate vegetation, dense vegetation, and vegetation with greater canopy structural development, respectively.
The definition of spectral classes based on NDVI thresholds is a widely used approach in remote sensing studies applied to landscape ecology and vegetation monitoring [22,33,34]. The area occupied by each class was estimated by pixel counting, considering the 10 m spatial resolution of Sentinel-2 imagery, followed by conversion to hectares.
To complement the structural interpretation provided by NDVI, NDMI was incorporated as an indicator of the relative water condition of the canopy. The analysis was conditioned on the NDVI structural classes, allowing the identification of canopy moisture variation among pixels with similar structural conditions. This approach made it possible to evaluate the internal organization of fragments beyond the edge–interior gradient, revealing spatial heterogeneity patterns that are not explained exclusively by distance from the edge.
3. Results
3.1. Tree Community Structure and Edge-to-Interior Gradient Detection
The similarity dendrograms showed a consistent organization of the tree community along the edge-to-interior gradient in the analyzed fragments (Figure 3 and Figure 4).
Both the groupings based on the presence/absence of species, represented by the Jaccard coefficient, and those based on relative abundance, represented by the Morisita–Horn index, showed concordant patterns, indicating robustness in the detection of floristic structure.
In fragments IP, AC, IF, and CN, the formation of two main groups was observed, corresponding to plots located near the edge and those located in the interior of the fragments (Figure 3A–D and A–D). The consistency between the coefficients used indicates that the separation is not only a result of species composition, but also reflects differences in abundance structure, suggesting ecological reorganization along the gradient. The position of the transition between groupings varied among fragments. In fragments IP and AC, this change occurred approximately 30 m from the edge, whereas in fragment IF the transition was observed between approximately 30 and 40 m. In fragment CN, the separation occurred closer to the edge, around 20 m. In the control area, represented by the Panga fragment, segregation between edge and interior plots was also observed (Figure 5).
The transition estimates were approximately 40 m based on the Jaccard coefficient and approximately 30 m considering the Morisita–Horn index. The convergence between different metrics reinforces the consistency of the identified pattern, even in a fragment with greater extent and structural complexity.
In general, the results demonstrate that the structure of the tree community is organized along a continuous spatial gradient associated with distance from the edge, with detectable transitions predominantly within the first 20 to 50 m from the forest boundary. This pattern indicates that the edge effect manifests as a zone of ecological reorganization, in which changes in species composition and abundance reflect variations in environmental conditions imposed by the adjacent matrix.
3.2. Structural–Spectral Correspondence
The relationship between vegetation structure and spectral indices was evaluated through the correlation between average basal area per plot (BA) and the NDVI, EVI, NDMI, and VF indices (n = 150 plots) (Table 2).
Basal area showed a very high positive correlation with NDVI (r = 0.950; p < 0.001), indicating a strong correspondence between the structural variation of vegetation and the spectral response captured by this index (Table 2). Positive correlations were also observed between BA and NDMI (r = 0.803; p < 0.001) and between BA and VF (r = 0.728; p < 0.001), although with lower magnitude. In contrast, EVI showed a weak correlation with basal area (r = 0.178; p = 0.029), suggesting lower sensitivity of this index to structural variation in the studied fragments (Table 2).
The observed pattern indicates that NDVI was the index that best represented structural variation in vegetation along the edge-to-interior gradient and was therefore selected as the main variable for subsequent edge-effect modeling analyses. Additionally, NDMI showed a high correlation with basal area and was used as a complementary metric in spatial analyses, especially to characterize variation in canopy water condition and internal heterogeneity of the fragments.
3.3. Multivariate Field–Remote Sensing Integration
The multivariate relationship between vegetation structure and spectral indices was evaluated using Principal Component Analysis (PCA), employing a standardized correlation matrix constructed from basal area values and NDVI, EVI, NDMI, and VF indices extracted from the centers of the 150 plots (Figure 6).
The first two principal components explained most of the total variance in the data (81.4%), with 56.0% attributed to PC1 and 25.4% to PC2 (Figure 6). PC1 showed higher loadings associated with NDVI, NDMI, and VF, indicating that this component synthesizes structural variation in vegetation related to green biomass and canopy cover. In contrast, PC2 was predominantly influenced by EVI, suggesting greater sensitivity of this index to specific variations in reflectance in environments with higher leaf density.
The projection of plots in multivariate space showed consistent separation along the edge-to-interior gradient previously identified in the phytosociological analyses (Figure 6). Plots classified as edge were concentrated in a distinct region of the ordination space, whereas interior plots showed greater cohesion and association with higher values of the structural indices. Transition plots occupied an intermediate position, indicating continuity of the gradient. This pattern demonstrates that the combined variation of spectral indices reproduces the structural organization observed in the field, reinforcing the consistency of the integration between field data and remote sensing and indicating that vegetation structure can be captured in a multivariate space.
3.4. Plot-Scale Gradient Detection
Segmented regression applied to average profiles by distance classes from 0–10 m to 90–100 m indicated the presence of breakpoints for both basal area (BA) and NDVI along the edge-to-interior gradient (Table 3).
Breakpoint estimates varied among fragments, with NDVI values ranging from 15.8 m to 35.0 m and basal area values ranging from 17.1 m to 35.0 m (Table 3). Overall, the results indicate that the structural transition associated with the edge effect occurs predominantly within the first 20 to 40 m from the edge, in agreement with the patterns detected in the phytosociological analyses.
Despite the overall consistency of the estimated values, the 95% confidence intervals showed wide variation among fragments, including, in some cases, values close to or below 0 m (Table 3). This uncertainty reflects limitations inherent to the spatial discretization of plots and structural variability along the transects. The comparison among fragments shows differences in the depth of the edge effect, but with overlapping confidence intervals, indicating that the plot-based approach, while informative for detecting the presence of the gradient, has limitations in accurately estimating the position of the transition point at the fragment level.
These results indicate that, although plot-scale analysis can capture the occurrence of the edge effect, the estimation of its depth is subject to uncertainty associated with sample resolution. Therefore, continuous-scale modeling was performed to evaluate the edge-to-interior gradient with greater spatial resolution and precision.
3.5. Pixel-Scale Gradient Detection
Pixel-scale segmented modeling revealed a continuous and spatially detailed edge-to-interior gradient in the five fragments analyzed, overcoming the limitations associated with discretizing the sampling into plots (Table 4).
By representing NDVI variation continuously along the distance-to-edge gradient, the pixel-by-pixel approach reduced spatial gaps and allowed breakpoint estimation with greater consistency, including the quantification of uncertainty through bootstrap resampling (Table 4).
Breakpoint estimates varied among fragments, with lower values in smaller and more exposed areas, such as IF and AC (~13–14 m), intermediate values in CN (~22 m), and higher values in IP (~39 m) (Table 4). In the Panga fragment, the point estimate was substantially higher and accompanied by a wide confidence interval, reflecting the greater spatial extent and internal structural heterogeneity of this fragment.
The comparison between approaches highlights relevant differences in the estimation of edge-effect depth. While the plot-based analysis indicated more restricted values with high uncertainty (Table 3), continuous modeling revealed greater spatial variability and allowed more complex gradients to be captured, especially in larger fragments. Overall, the pixel-scale estimates differentiated fragments with shallow, intermediate, and deeper edge responses, while also revealing that the Panga fragment does not conform to a single, well-defined transition pattern.
3.6. Fragments with Shallow Edge Effects: IF and AC
The IF and AC fragments presented the lowest breakpoint values in the pixel-scale modeling, with estimates close to 13–14 m, indicating that the structural transition associated with the edge effect occurs in the first few meters from the forest boundary (Table 4). In both fragments, the relationship between NDVI and distance from the edge showed an initial increase in NDVI within the first meters of the gradient, followed by stabilization after the breakpoint estimated by the segmented model (Figure 7 and Figure 8).
This pattern indicates that edge influence is restricted to a relatively narrow band, beyond which vegetation structure shows less variation along the gradient. In fragment IF, a reduction in the variability of NDVI values was observed after the breakpoint, suggesting spectral stabilization in the internal portions of the fragment (Figure 7). Similarly, fragment AC showed a consistent pattern of stabilization after the breakpoint, with the distribution of NDVI values indicating lower structural heterogeneity compared to fragments with more extensive gradients (Figure 8).
Taken together, these results characterize IF and AC as fragments with shallow edge effects, in which the influence of the adjacent matrix dissipates rapidly, resulting in a spatially limited transition zone and greater structural homogeneity within the fragments.
3.7. Fragment with Intermediate Edge Effect: CN
In fragment CN, the estimated breakpoint (~22 m) indicates a more extensive structural transition compared to fragments with shallow edge effects, suggesting greater depth of edge influence (Table 4). The relationship between NDVI and distance from the edge shows a less abrupt pattern, with a gradual increase in index values along the gradient and greater dispersion of points along the fitted curve (Figure 9).
This behavior indicates greater structural variability along the fragment, in contrast to the faster stabilization observed in IF and AC. In addition to the general transition pattern, local variations in NDVI values were observed along the edge-to-interior gradient, suggesting the occurrence of internal structural heterogeneity. This variability is expressed as dispersion of spectral values, indicating that areas with similar structure may occur at different distances from the edge. Thus, CN occupies an intermediate position along the edge-effect gradient, with a transition zone broader than those observed in IF and AC but less prolonged than that detected in IP.
3.8. Fragment with the Deepest Edge Effect: IP
The IP fragment presented the highest breakpoint value among the Ipameri fragments, with an estimate close to 39 m, indicating a more prolonged structural transition along the edge-to-interior gradient (Table 4). The relationship between NDVI and distance from the edge reveals a gradual transition pattern, with high dispersion of spectral values, especially in the first meters of the gradient (Figure 10).
Unlike fragments with shallow and intermediate edge effects, the increase in NDVI over distance does not occur abruptly, but rather as a continuous process, with local variations throughout the gradient.
The pixel distribution indicates greater structural variability, with contrasting NDVI values throughout the fragment, suggesting the occurrence of internal vegetation mosaics associated with different developmental stages and structural conditions. This pattern shows that, in fragments with greater extent and complexity, the edge effect is not restricted to a well-defined strip, but manifests as a more diffuse gradient, influenced both by distance from the edge and by the internal spatial organization of vegetation.
3.9. Large and Highly Heterogeneous Fragment: Panga
The Panga fragment showed a distinct pattern compared to the other fragments, with a substantially higher point estimate of the breakpoint and wide bootstrap uncertainty (Table 4). This pattern reflects the greater spatial extent of the fragment and the higher structural heterogeneity captured by continuous-scale modeling. The distribution of NDVI values as a function of distance from the edge did not indicate a single, well-defined transition zone. Instead, high spectral variability was observed along the gradient, with pixels showing different NDVI values distributed across multiple positions within the fragment.
In this context, the single-breakpoint estimate for Panga carries greater uncertainty and should be interpreted as an average synthesis of a more heterogeneous spatial pattern. Thus, unlike the smaller fragments, in which the edge-to-interior transition was more clearly delimited, Panga showed a more diffuse response, consistent with its larger area and internal structural complexity [3,17,35].
3.10. Internal Structural Heterogeneity of Fragments beyond the Edge-to-Interior Gradient
Classification of NDVI values at the pixel scale allowed characterization of the internal structural organization of the fragments, complementing the estimate of edge-effect depth obtained by segmented modeling (Figure 11).
The spatial distribution of structural classes revealed intra-fragment heterogeneity patterns that are not exclusively restricted to the edge-to-interior gradient. Areas with different levels of vegetation vigor and density were observed throughout the fragment, including internal regions with reduced NDVI values and areas near the edge with high values. In fragment CN, used as a representative example of an intermediate pattern, there was a predominance of classes associated with intermediate and dense vegetation, while classes with lower vegetation cover occurred in a more localized manner (Figure 11A). The incorporation of NDMI as an indicator of canopy water condition revealed that structurally similar pixels can present different states of relative humidity, evidencing a partial dissociation between structure and functional condition of vegetation (Figure 11B).
Together, the NDVI and NDMI classifications show that spectral variability is expressed not only along the edge-to-interior gradient but also as internal vegetation mosaics. This pattern suggests that the structural organization of the fragments results from the interaction between edge influence and internal processes associated with vegetation dynamics. Therefore, the pixel-level classification complements the breakpoint analyses by showing where structural variation is spatially concentrated within the fragments. These results indicate that vegetation variation is not explained exclusively by distance from the edge, but also by the internal arrangement of canopy structure and relative moisture conditions.
4. Discussion
4.1. The Edge Effect as a Structural Gradient in Fragmented Forests
The results of this study demonstrate the occurrence of an edge-to-interior gradient in the analyzed fragments, evidenced by the convergence between multiple independent approaches [13,20,31,36]. The organization of the tree community into distinct edge and interior groups, detected by similarity analyses based on presence/absence and abundance, associated with the separation observed in the multivariate analysis and the strong correspondence between basal area and NDVI, consistently indicates that vegetation structure reorganizes along the spatial gradient. This pattern converges with classic studies on fragmentation ecology, which demonstrate that forest edges modify the structure, composition, and functioning of ecosystems through microclimatic and biotic changes that propagate from the matrix to the interior of fragments [1,4,37].
NDVI modeling reinforced this evidence by identifying breakpoints along the edge-to-interior gradient. The estimates obtained indicate that the structural transition occurs predominantly between approximately 13 and 39 m from the edge, supporting the occurrence of detectable structural transition zones among fragments. These values converge with studies that record microclimatic and structural changes in the first tens of meters from the edge [38,39,40], as well as with evidence in tropical and seasonal forests that point to structural responses concentrated in the first 20–50 m [13,41,42].
The variation observed among fragments reinforces the consistency of the pattern, while also highlighting differences in gradient intensity. Smaller and more homogeneous fragments, such as IF and AC, showed shallower gradients (~13–14 m), while CN (~22 m) and IP (~39 m) exhibited more extensive transitions. This behavior is consistent with studies indicating that the magnitude of the edge effect varies depending on fragment structure and landscape context [2,4,43].
The Panga fragment showed greater variability in the estimates, indicating a less abrupt transition along the gradient, but still consistent with the occurrence of the edge effect. This pattern is compatible with studies showing that larger and structurally complex fragments can exhibit greater internal variation in vegetation response [3,35,44]. In this case, the observed variability does not invalidate the gradient, but indicates greater complexity in its spatial expression. The agreement among phytosociological, structural, and spectral metrics indicates that the detected pattern does not depend on a single method, but represents a consistent property of vegetation organization along space. Overall, the results support the hypothesis that the edge effect manifests as a continuous and detectable gradient (hypothesis ii), while also indicating that its spatial expression varies among fragments.
4.2. Limitations of the Radial Model and Evidence of Spatial Heterogeneity
Although analysis based on plots and phytosociological metrics identified an edge-to-interior gradient consistent with the classic literature, pixel-level modeling demonstrated that this pattern represents a simplification of the spatial organization of the fragments. This result indicates that the radial model adequately describes average trends, but not necessarily the actual structure of vegetation. Traditional approaches assume relatively well-defined zones along the gradient [1,4,39], but this structure does not remain uniform at higher spatial resolution.
Pixel-by-pixel analysis showed that the organization of fragments does not follow a simple radial pattern. In the more homogeneous fragments, such as IF and AC, there was convergence between approaches, with well-defined gradients, consistent with the literature [13,38,40]. In contrast, in CN and IP, the transition was more diffuse, indicating that distance to the edge does not explain vegetation structure in isolation, but interacts with the internal heterogeneity of the system [5,10].
This contrast is most evident in the Panga fragment. While the plot analysis indicates a breakpoint consistent with classic studies, the pixel-level analysis reveals a more diffuse NDVI distribution, without an abrupt transition. This result suggests that the observed radial pattern may reflect the sampling design more than the ecological organization of the fragment. In larger fragments, processes such as gap dynamics, edaphic variation, and disturbance history generate internal mosaics that modulate structure independently of distance to the edge [3,9,10,35].
The spatial distribution of NDVI at the pixel level revealed areas with different levels of canopy density throughout the fragment, including less dense regions and possible areas of disturbance both at the edge and in the interior. This pattern indicates that the edge effect acts on an intrinsically heterogeneous system, in which multiple ecological processes operate simultaneously. The results indicate that the radial model, although useful for describing average trends, has limitations in representing the spatial complexity of forest fragments. High-resolution modeling highlights this limitation by revealing patterns that remain hidden in discrete approaches, demonstrating that vegetation structure results from the overlap between the edge effect and processes internal to the fragment.
4.3. Spectral Integration and Scale Effect
The analysis at different scales showed that the interpretation of the edge effect is strongly dependent on the spatial unit considered. While the plot-based approach reproduced patterns consistent with the classic radial model, pixel-level modeling revealed a more complex spatial organization, in which structural variation is not distributed exclusively as a function of distance from the edge, but as a continuous response along the fragment. In the more homogeneous fragments, IF and AC, there was convergence between the approaches, with well-defined gradients and relatively abrupt transitions. In contrast, in CN and, above all, in IP and Panga, the continuous analysis indicated greater spatial dispersion of NDVI and the absence of a single dominant transition, showing that distance to the edge explains only part of the structural variability. This pattern is consistent with the idea that internal processes, such as gap dynamics, edaphic variation, and local disturbances, modulate canopy structure independently of the relative position to the edge [9,10].
The difference between results obtained from plots and pixels reflects a classic scale effect. Spatial aggregation tends to smooth internal variability and reinforce average gradients, potentially shifting or simplifying the position of structural transitions—a behavior associated with the Modifiable Areal Unit Problem (MAUP) [25,26]. Thus, the breakpoint estimated from plots represents a spatial synthesis of the sampled system, while continuous modeling allows the representation of the complete distribution of responses across the fragment.
These results converge with approaches in landscape ecology that emphasize scale dependence and the nonlinear nature of ecological responses in heterogeneous systems [2,17,43,45]. From a remote sensing perspective, the use of high-resolution spectral indices allows field–structure relationships to be extended to the entire surface of the fragments, expanding the ability to detect fine spatial patterns [8,16,21,33,46]. Together, the integration between field data and continuous spectral modeling indicates that the edge effect should be interpreted as a scale-dependent response, in which spatial aggregation and continuous modeling produce distinct readings of the same ecological system. This approach allows the explicit incorporation of spatial variability into the interpretation of edge effects, providing a more robust basis for analyzing fragmented landscapes.
4.4. Ecological Implications and Synthesis
The results indicate that the edge effect cannot be adequately described by radial models based solely on distance to the edge. Although these approaches capture average trends, the integration between field data and high-resolution spectral modeling shows that vegetation structure results from the interaction between edge influences and processes internal to the fragment, confirming that the edge-to-interior gradient is detectable, but dependent on analytical scale (hypotheses ii and iv). The observed spatial heterogeneity, especially in more complex fragments, indicates that non-radial patterns are an intrinsic characteristic of fragmented systems, reflecting the overlap of multiple ecological processes, such as gap dynamics, edaphic variation, and disturbance history, in addition to microclimatic gradients [9,10,35,47]. This pattern reinforces that distance to the edge does not, by itself, explain the structural organization of vegetation, in agreement with the proposed scale dependence (hypothesis iv).
From an analytical point of view, the correspondence between spectral indices and structural field metrics, coupled with the greater capacity of continuous modeling to represent internal spatial variations, highlights the informational gain from integrating remote sensing and field ecology (hypotheses i and iii). The difference between discrete and continuous approaches indicates that spatial aggregation simplifies internal variability, while continuous modeling allows the ecological response to be represented as a heterogeneous surface [8,16,17,43].
Taken as a whole, our findings reposition the edge effect as a detectable but scale-dependent spatial process, rather than as a fixed radial zone. By integrating different scales of analysis, this study shows that the structural organization of vegetation results from the overlap between edge gradients and internal heterogeneity, allowing a more robust, continuous, and ecologically realistic interpretation of the structure and functioning of fragmented ecosystems.
5. Conclusions
This study demonstrates that edge effects, although detectable as edge-to-interior gradients, are not adequately described by radial models based solely on distance from the forest edge. The integration of field data and high-resolution remote sensing shows that vegetation structure results from the overlap between edge influence and internal heterogeneity, whose expression depends on the analytical scale. Continuous pixel-level modeling revealed spatial patterns that remain hidden in discrete approaches, indicating that the gradient observed at the plot scale represents a simplification of ecological reality. In this context, the radial model should be interpreted as a methodological approximation rather than as a faithful representation of fragment organization.
These findings shift the interpretation of edge effects from a strictly radial perspective toward a continuous, spatially explicit, and scale-dependent framework. By integrating phytosociological data, Sentinel-2 spectral indices, and pixel-level modeling, this study contributes to the conceptual and methodological advancement of landscape ecology and remote sensing applied to fragmented tropical forests.
Supplementary Materials
The following supporting information can be downloaded at the website of this paper posted on Preprints.org, Table S1: Spectral indices and formulas used in the study; Table S2: NDVI structural classes and area estimates by fragment; Supplementary Text S1: Reproducible methodological protocol for field–remote sensing integration and pixel-level edge-effect modeling.
Author Contributions
Conceptualization, V.D.O.J. and J.A.A.M.-N.; methodology, V.D.O.J., J.A.A.M.-N. and V.S.V.; software, V.D.O.J., J.E.C. and R.G.G.; validation, V.D.O.J., J.A.A.M.-N. and V.S.V.; formal analysis, V.D.O.J., J.A.A.M.-N., V.S.V., J.E.C. and R.G.G.; investigation, V.D.O.J., V.S.V., J.E.C. and R.G.G.; resources, V.D.O.J. and J.A.A.M.-N.; data curation, V.D.O.J.; writing—original draft preparation, V.D.O.J.; writing—review and editing, V.D.O.J., J.A.A.M.-N., V.S.V., N.T.S., F.M.S.S., A.J.P.C., R.G.G., J.E.C. and M.T.R.; visualization, V.D.O.J.; supervision, J.A.A.M.-N. and V.S.V.; project administration, V.D.O.J. and J.A.A.M.-N.; funding acquisition, V.D.O.J. All authors have read and agreed to the published version of the manuscript.
Funding
This study was supported by the Coordenação de Aperfeiçoamento de Pessoal de Nível Superior—Brasil (CAPES), through the PDPG-FAP Program—Support for Emerging and Consolidating Graduate Programs in Priority Areas in the States, Call No. 18/2020, process number 88887.637294/2021-00.
Data Availability Statement
The processed field–spectral datasets and R scripts supporting the analyses are available from the corresponding author upon reasonable request. The methodological protocol used for field–remote sensing integration, spectral index extraction, segmented regression, bootstrap uncertainty estimation, and pixel-level structural classification is provided in the Supplementary Materials.
Acknowledgments
The authors thank the Federal University of Viçosa, the State University of Goiás, the Laboratory of Plant Ecology and Evolution, the Laboratory of Forest Inventory and Ecology (LIFE), and ProBiodiversa Brazil for institutional, technical, and logistical support during the development of this study. The authors also acknowledge the use of ArcGIS Pro, Google Earth Engine, Python, R, and Zotero for geospatial processing, statistical analysis, data organization, and reference management. During the preparation of this manuscript, the authors used ChatGPT (OpenAI) to assist with language editing, translation, formatting, editorial organization, and support in reviewing and debugging analytical scripts developed by the authors. No artificial intelligence tools were used to generate research data, perform autonomous statistical analyses, produce results, or interpret the findings. All datasets, scripts, geospatial procedures, statistical analyses, and scientific interpretations were developed, checked, and validated by the authors. The authors reviewed and edited all AI-assisted outputs and take full responsibility for the content of this publication.
Conflicts of Interest
The authors declare no conflicts of interest. The funder had no role in the design of the study; in the collection, analyses, or interpretation of data; in the writing of the manuscript; or in the decision to publish the results.
Abbreviations
The following abbreviations are used in this manuscript:
BA Basal area
BP Breakpoint
CAPES Coordenação de Aperfeiçoamento de Pessoal de Nível Superior
CBH Circumference at breast height
CI Confidence interval
EVI Enhanced Vegetation Index
L2A Level-2A
MAUP Modifiable Areal Unit Problem
NDMI Normalized Difference Moisture Index
NDVI Normalized Difference Vegetation Index
PCA Principal Component Analysis
PDPG-FAP Programa de Desenvolvimento da Pós-Graduação—Fundação de Amparo à Pesquisa
SSF Semideciduous Seasonal Forest
SWIR Shortwave infrared
UPGMA Unweighted Pair Group Method with Arithmetic Mean
VF Vegetation fraction
References
- Murcia, C. Edge Effects in Fragmented Forests: Implications for Conservation. Trends Ecol. Evol. 1995, 10, 58–62. [Google Scholar] [CrossRef]
- Ewers, R.M.; Didham, R.K. Continuous Response Functions for Quantifying the Strength of Edge Effects. J. Appl. Ecol. 2006, 43, 527–536. [Google Scholar] [CrossRef]
- Magnago, L.F.S.; Magrach, A.; Barlow, J.; Schaefer, C.E.G.R.; Laurance, W.F.; Martins, S.V.; Edwards, D.P. Do Fragment Size and Edge Effects Predict Carbon Stocks in Trees and Lianas in Tropical Forests? Funct. Ecol. 2017, 31, 542–552. [Google Scholar] [CrossRef]
- Harper, K.A.; Macdonald, S.E.; Burton, P.J.; Chen, J.; Brosofske, K.D.; Saunders, S.C.; Euskirchen, E.S.; Roberts, D.; Jaiteh, M.S.; Esseen, P.-A. Edge Influence on Forest Structure and Composition in Fragmented Landscapes. Conserv. Biol. 2005, 19, 768–782. [Google Scholar] [CrossRef]
- Fahrig, L. Effects of Habitat Fragmentation on Biodiversity. Annu. Rev. Ecol. Evol. Syst. 2003, 34, 487–515. [Google Scholar] [CrossRef]
- Kupfer, J.A.; Malanson, G.P.; Franklin, S.B. Not Seeing the Ocean for the Islands: The Mediating Influence of Matrix-based Processes on Forest Fragmentation Effects. Glob. Ecol. Biogeogr. 2006, 15, 8–20. [Google Scholar] [CrossRef]
- Ries, L.; Fletcher, R.J.; Battin, J.; Sisk, T.D. Ecological Responses to Habitat Edges: Mechanisms, Models, and Variability Explained. Annu. Rev. Ecol. Evol. Syst. 2004, 35, 491–522. [Google Scholar] [CrossRef]
- Wulder, M.A.; Loveland, T.R.; Roy, D.P.; Crawford, C.J.; Masek, J.G.; Woodcock, C.E.; Allen, R.G.; Anderson, M.C.; Belward, A.S.; Cohen, W.B.; et al. Current Status of Landsat Program, Science, and Applications. Remote Sens. Environ. 2019, 225, 127–147. [Google Scholar] [CrossRef]
- Cadenasso, M.L.; Pickett, S.T.A.; Weathers, K.C.; Bell, S.S.; Benning, T.L.; Carreiro, M.M.; Dawson, T.E. An Interdisciplinary and Synthetic Approach to Ecological Boundaries. BioScience 2003, 53, 717–722. [Google Scholar] [CrossRef]
- Haddad, N.M.; Brudvig, L.A.; Clobert, J.; Davies, K.F.; Gonzalez, A.; Holt, R.D.; Lovejoy, T.E.; Sexton, J.O.; Austin, M.P.; Collins, C.D.; et al. Habitat Fragmentation and Its Lasting Impact on Earth’s Ecosystems. Sci. Adv. 2015, 1, e1500052. [Google Scholar] [CrossRef]
- Cochrane, M.A.; Laurance, W.F. Fire as a Large-Scale Edge Effect in Amazonian Forests. J. Trop. Ecol. 2002, 18, 311–325. [Google Scholar] [CrossRef]
- Gomes, L.; Simões, S.; Dalla Nora, E.; De Sousa-Neto, E.; Forti, M.; Ometto, J. Agricultural Expansion in the Brazilian Cerrado: Increased Soil and Nutrient Losses and Decreased Agricultural Productivity. Land 2019, 8, 12. [Google Scholar] [CrossRef]
- Mariano, G.V.P.; Barboza, F.S.; Brito, A.P.D.; Oliveira Júnior, V.D.D.; Santos, A.F.C.; Padilha, R.C.; Souza, F.M.D.S.; Silva Junior, W.O.D.; Rocha, E.C.; Vale, V.S.D. Efeito de Borda Em Florestas Estacionais Semideciduais Do Cerrado. Ciênc. Florest. 2024, 34, e67155. [Google Scholar] [CrossRef]
- Pio, A.D.P.D.; Vale, V.S.D.; Spinola, C.M. Estrutura da vegetação de três áreas de floresta estacional nos estados de Goiás, Minas Gerais e Tocantins. MSJ 2017, 1, 34. [Google Scholar] [CrossRef]
- Ceaușu, S.; Leclère, D.; Newbold, T. Geography and Availability of Natural Habitat Determine Whether Cropland Intensification or Expansion Is More Detrimental to Biodiversity. Nat. Ecol. Evol. 2025. [Google Scholar] [CrossRef] [PubMed]
- Pettorelli, N.; Vik, J.O.; Mysterud, A.; Gaillard, J.-M.; Tucker, C.J.; Stenseth, N.Chr. Using the Satellite-Derived NDVI to Assess Ecological Responses to Environmental Change. Trends Ecol. Evol. 2005, 20, 503–510. [Google Scholar] [CrossRef]
- Turner, M.G.; Gardner, R.H. Landscape Ecology in Theory and Practice: Pattern and Process; Springer New York: New York, NY, 2015; ISBN 978-1-4939-2793-7. [Google Scholar]
- Carlson, T.N.; Ripley, D.A. On the Relation between NDVI, Fractional Vegetation Cover, and Leaf Area Index. Remote Sens. Environ. 1997, 62, 241–252. [Google Scholar] [CrossRef]
- Purevdorj, Ts.; Tateishi, R.; Ishiyama, T.; Honda, Y. Relationships between Percent Vegetation Cover and Vegetation Indices. Int. J. Remote Sens. 1998, 19, 3519–3535. [Google Scholar] [CrossRef]
- Jiang, R.; Liang, J.; Zhao, Y.; Wang, H.; Xie, J.; Lu, X.; Li, F. Assessment of Vegetation Growth and Drought Conditions Using Satellite-Based Vegetation Health Indices in Jing-Jin-Ji Region of China. Sci. Rep. 2021, 11, 13775. [Google Scholar] [CrossRef]
- Zhao, Z.; Lu, C.; Tonooka, H.; Wu, L.; Lin, H.; Jiang, X. Dynamic Monitoring of Vegetation Phenology on the Qinghai-Tibetan Plateau from 2001 to 2020 via the MSAVI and EVI. Sci. Rep. 2025, 15. [Google Scholar] [CrossRef]
- Huete, A.; Didan, K.; Miura, T.; Rodriguez, E.P.; Gao, X.; Ferreira, L.G. Overview of the Radiometric and Biophysical Performance of the MODIS Vegetation Indices. Remote Sens. Environ. 2002, 83, 195–213. [Google Scholar] [CrossRef]
- Gitelson, A.A. Wide Dynamic Range Vegetation Index for Remote Quantification of Biophysical Characteristics of Vegetation. J. Plant Physiol. 2004, 161, 165–173. [Google Scholar] [CrossRef]
- Sims, D.A.; Gamon, J.A. Relationships between Leaf Pigment Content and Spectral Reflectance across a Wide Range of Species, Leaf Structures and Developmental Stages. Remote Sens. Environ. 2002, 81, 337–354. [Google Scholar] [CrossRef]
- Jelinski, D.E.; Wu, J. The Modifiable Areal Unit Problem and Implications for Landscape Ecology. Landsc. Ecol. 1996, 11, 129–140. [Google Scholar] [CrossRef]
- Dark, S.J.; Bram, D. The Modifiable Areal Unit Problem (MAUP) in Physical Geography. Prog. Phys. Geogr. Earth Environ. 2007, 31, 471–479. [Google Scholar] [CrossRef]
- Zellweger, F.; De Frenne, P.; Lenoir, J.; Rocchini, D.; Coomes, D. Advances in Microclimate Ecology Arising from Remote Sensing. Trends Ecol. Evol. 2019, 34, 327–341. [Google Scholar] [CrossRef]
- The Cerrados of Brazil: Ecology and Natural History of a Neotropical Savanna; Oliveira, P.S., Marquis, R.J., Eds.; Columbia University Press: New York, 2002; ISBN 978-0-231-12042-5. [Google Scholar]
- Mariano, G.V.P.; Rios, J.M.; Rocha, G.T.; Silva, V.G.; Santos, L.C.S.; Oliveira Junior, V.D.; Vale, V.S. Quais variáveis ambientais melhor explicam a diferenciação estrutural e florística de cerrado stricto sensu e floresta estacional semidecidual? ADV. FOR. SCI. 2020, 7, 1153–1169. [Google Scholar] [CrossRef]
- Chave, J.; Réjou-Méchain, M.; Búrquez, A.; Chidumayo, E.; Colgan, M.S.; Delitti, W.B.C.; Duque, A.; Eid, T.; Fearnside, P.M.; Goodman, R.C.; et al. Improved Allometric Models to Estimate the Aboveground Biomass of Tropical Trees. Glob. Change Biol. 2014, 20, 3177–3190. [Google Scholar] [CrossRef]
- Del Nero Velasco, G.; Lordello Polizel, J.; Pereira Coltri, P.; Liner Pereira Lima, A.M.; Ferreira Da Silva Filho, D. Aplicação do índice de vegetação NDVI (Normalized Difference Vegetation Index) em imagens de alta resolução no município de São Paulo e suas limitações. revsbau 2019, 2, 1. [Google Scholar] [CrossRef]
- Muggeo, V.M.R. Testing with a Nuisance Parameter Present Only under the Alternative: A Score-Based Approach with Application to Segmented Modelling. J. Stat. Comput. Simul. 2016, 86, 3059–3067. [Google Scholar] [CrossRef]
- Colman, C.B.; Guerra, A.; Almagro, A.; De Oliveira Roque, F.; Rosa, I.M.D.; Fernandes, G.W.; Oliveira, P.T.S. Modeling the Brazilian Cerrado Land Use Change Highlights the Need to Account for Private Property Sizes for Biodiversity Conservation. Sci. Rep. 2024, 14, 4559. [Google Scholar] [CrossRef]
- Rex, F.E.; Silva, C.A.; Broadbent, E.N.; Dalla Corte, A.P.; Leite, R.; Hudak, A.; Hamamura, C.; Latifi, H.; Xiao, J.; Atkins, J.W.; et al. Spatial Characterization of Woody Species Diversity in Tropical Savannas Using GEDI and Optical Data. Sensors 2025, 25, 308. [Google Scholar] [CrossRef]
- Laurance, W.F.; Laurance, S.G.; Ferreira, L.V.; Rankin-de Merona, J.M.; Gascon, C.; Lovejoy, T.E. Biomass Collapse in Amazonian Forest Fragments. Science 1997, 278, 1117–1118. [Google Scholar] [CrossRef]
- Júnior, V.D.D.O.; Souza, A.G.V.; Padilha, R.C.; Vale, V.S. Meta-análise em diferentes fitofisionomias do Cerrado e áreas da Mata Atlântica. ADV. FOR. SCI. 2021, 8, 1445–1453. [Google Scholar] [CrossRef]
- Laurance, W.F.; Lovejoy, T.E.; Vasconcelos, H.L.; Bruna, E.M.; Didham, R.K.; Stouffer, P.C.; Gascon, C.; Bierregaard, R.O.; Laurance, S.G.; Sampaio, E. Ecosystem Decay of Amazonian Forest Fragments: A 22-Year Investigation. Conserv. Biol. 2002, 16, 605–618. [Google Scholar] [CrossRef]
- Chen, J.; Franklin, J.F.; Spies, T.A. Growing-Season Microclimatic Gradients from Clearcut Edges into Old-Growth Douglas-Fir Forests. Ecol. Appl. 1995, 5, 74–86. [Google Scholar] [CrossRef]
- Matlack, G.R. Microenvironment Variation within and among Forest Edge Sites in the Eastern United States. Biol. Conserv. 1993, 66, 185–194. [Google Scholar] [CrossRef]
- Young, A.; Mitchell, N. Microclimate and Vegetation Edge Effects in a Fragmented Podocarp-Broadleaf Forest in New Zealand. Biol. Conserv. 1994, 67, 63–72. [Google Scholar] [CrossRef]
- Ferreira, T.D.S.; Marcon, A.K.; Salami, B.; Chini, C.C.; Mendes, A.R.; Carvalho, A.F.; Missio, F.D.F.; Pscheidt, F.; Guidini, A.L.; Dornelles, R.D.S.D.; et al. Composição florístico-estrutural ao longo de um gradiente de borda em fragmento de Floresta Ombrófila Mista Alto-Montana em Santa Catarina. Ciênc. Florest. 2016, 26, 123–134. [Google Scholar] [CrossRef]
- Paciencia, M.L.B.; Prado, J. Efeitos de borda sobre a comunidade de pteridófitas na Mata Atlântica da região de Una, sul da Bahia, Brasil. Rev. bras. Bot. 2004, 27, 641–653. [Google Scholar] [CrossRef]
- Gustafson, E.J. Minireview: Quantifying Landscape Spatial Pattern: What Is the State of the Art? Ecosystems 1998, 1, 143–156. [Google Scholar] [CrossRef]
- Magnago, L.F.S.; Rocha, M.F.; Meyer, L.; Martins, S.V.; Meira-Neto, J.A.A. Microclimatic Conditions at Forest Edges Have Significant Impacts on Vegetation Structure in Large Atlantic Forest Fragments. Biodivers. Conserv 2015, 24, 2305–2318. [Google Scholar] [CrossRef]
- Quesada, H.B.; Redondo, G.; Gimenes Vernasqui, L.; Jandreice Magnoni, P.H.; Arantes, E.J. Analysis of riparian vegetation in a watershed using NDVI index in Maringá-PR. Geo UERJ 2017, 0, 439–455. [Google Scholar] [CrossRef]
- Asner, G.P.; Powell, G.V.N.; Mascaro, J.; Knapp, D.E.; Clark, J.K.; Jacobson, J.; Kennedy-Bowdoin, T.; Balaji, A.; Paez-Acosta, G.; Victoria, E.; et al. High-Resolution Forest Carbon Stocks and Emissions in the Amazon. Proc. Natl. Acad. Sci. U.S.A. 2010, 107, 16738–16742. [Google Scholar] [CrossRef]
- Arroyo-Rodríguez, V.; Saldaña-Vázquez, R.A.; Fahrig, L.; Santos, B.A. Does Forest Fragmentation Cause an Increase in Forest Temperature? Ecol. Res. 2017, 32, 81–88. [Google Scholar] [CrossRef]
Figure 1.
Location of the Semideciduous Seasonal Forest (SSF) fragments analyzed in the Brazilian Cerrado: IP (Ipameri), IF (rural area of Ipameri), AC (Campo Alegre de Goiás), CN (Caldas Novas), and Panga (Panga Reserve, Uberlândia, Minas Gerais, Brazil). The inset shows the relative position of the study region within Brazil. Projection: SIRGAS 2000 / UTM Zone 22S.
Figure 1.
Location of the Semideciduous Seasonal Forest (SSF) fragments analyzed in the Brazilian Cerrado: IP (Ipameri), IF (rural area of Ipameri), AC (Campo Alegre de Goiás), CN (Caldas Novas), and Panga (Panga Reserve, Uberlândia, Minas Gerais, Brazil). The inset shows the relative position of the study region within Brazil. Projection: SIRGAS 2000 / UTM Zone 22S.
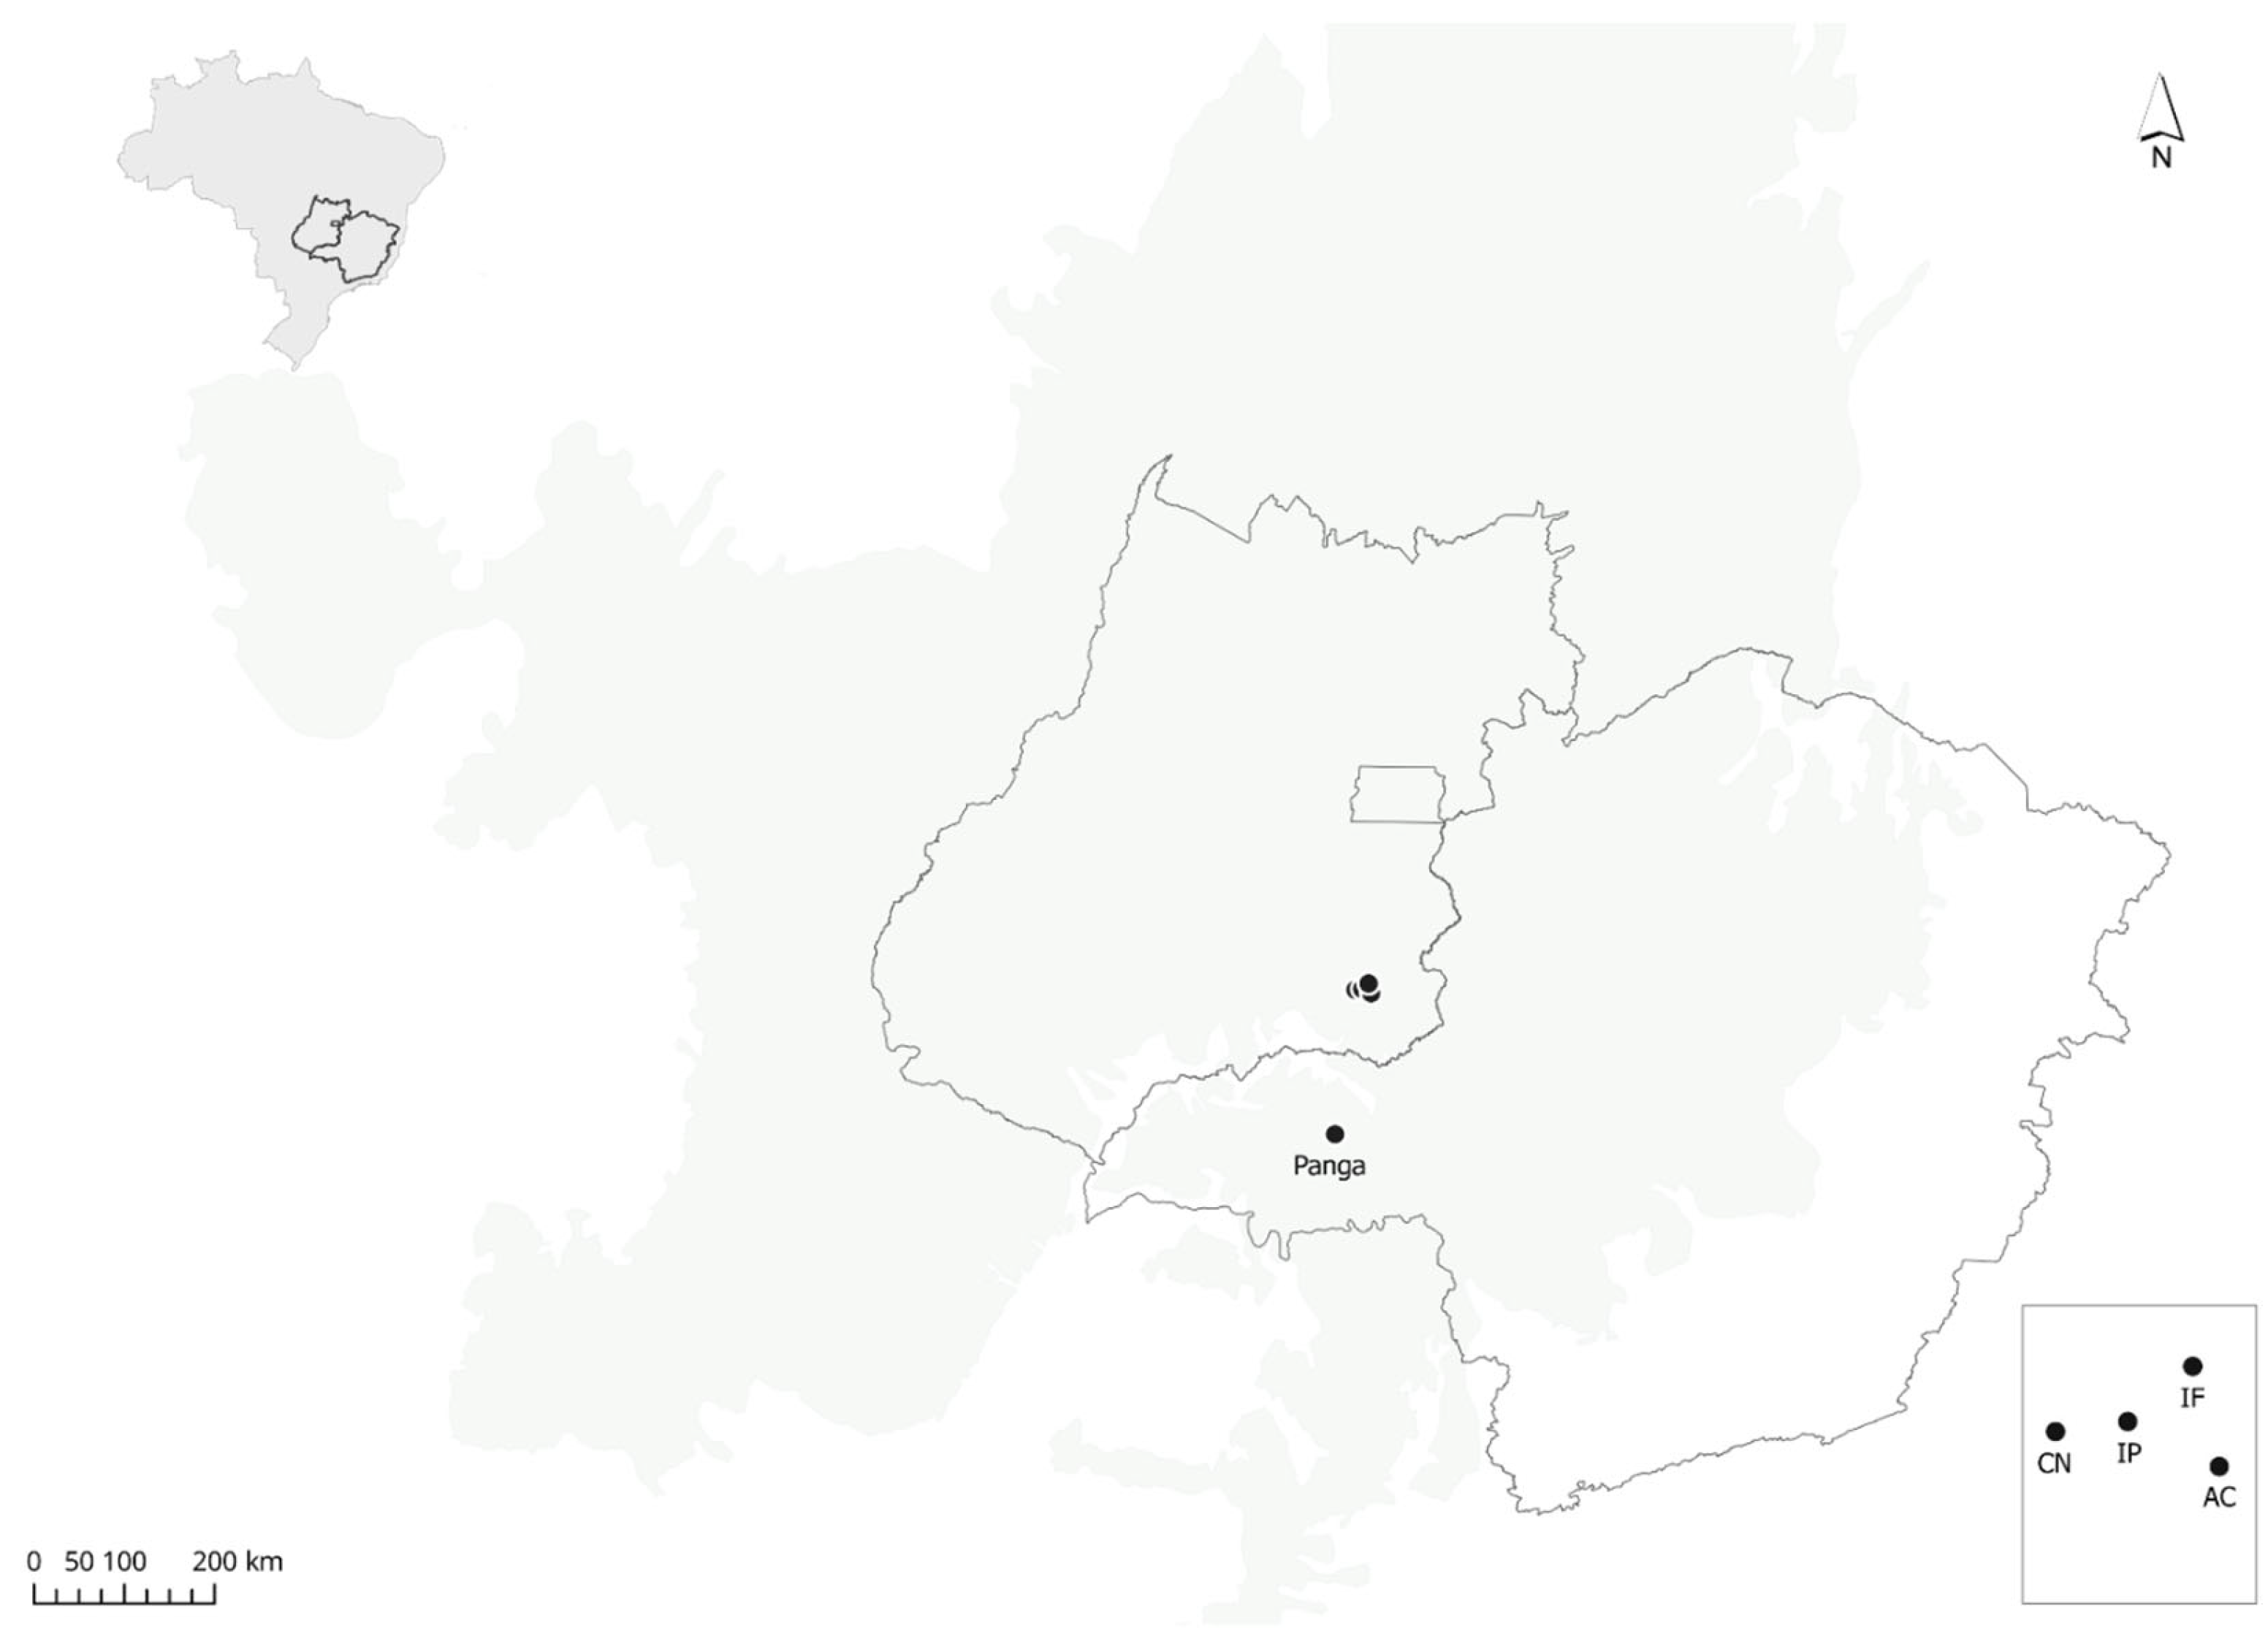
Figure 2.
Sampling design and integration between field and remote sensing data in Semideciduous Seasonal Forest fragments in the Brazilian Cerrado. (A) Arrangement of transects and 10 × 10 m plots along the edge-to-interior gradient within a forest fragment. (B) Conceptual representation of the spatial correspondence between field plot centers and Sentinel-2 pixels (10 m), used to integrate structural and spectral data.
Figure 2.
Sampling design and integration between field and remote sensing data in Semideciduous Seasonal Forest fragments in the Brazilian Cerrado. (A) Arrangement of transects and 10 × 10 m plots along the edge-to-interior gradient within a forest fragment. (B) Conceptual representation of the spatial correspondence between field plot centers and Sentinel-2 pixels (10 m), used to integrate structural and spectral data.
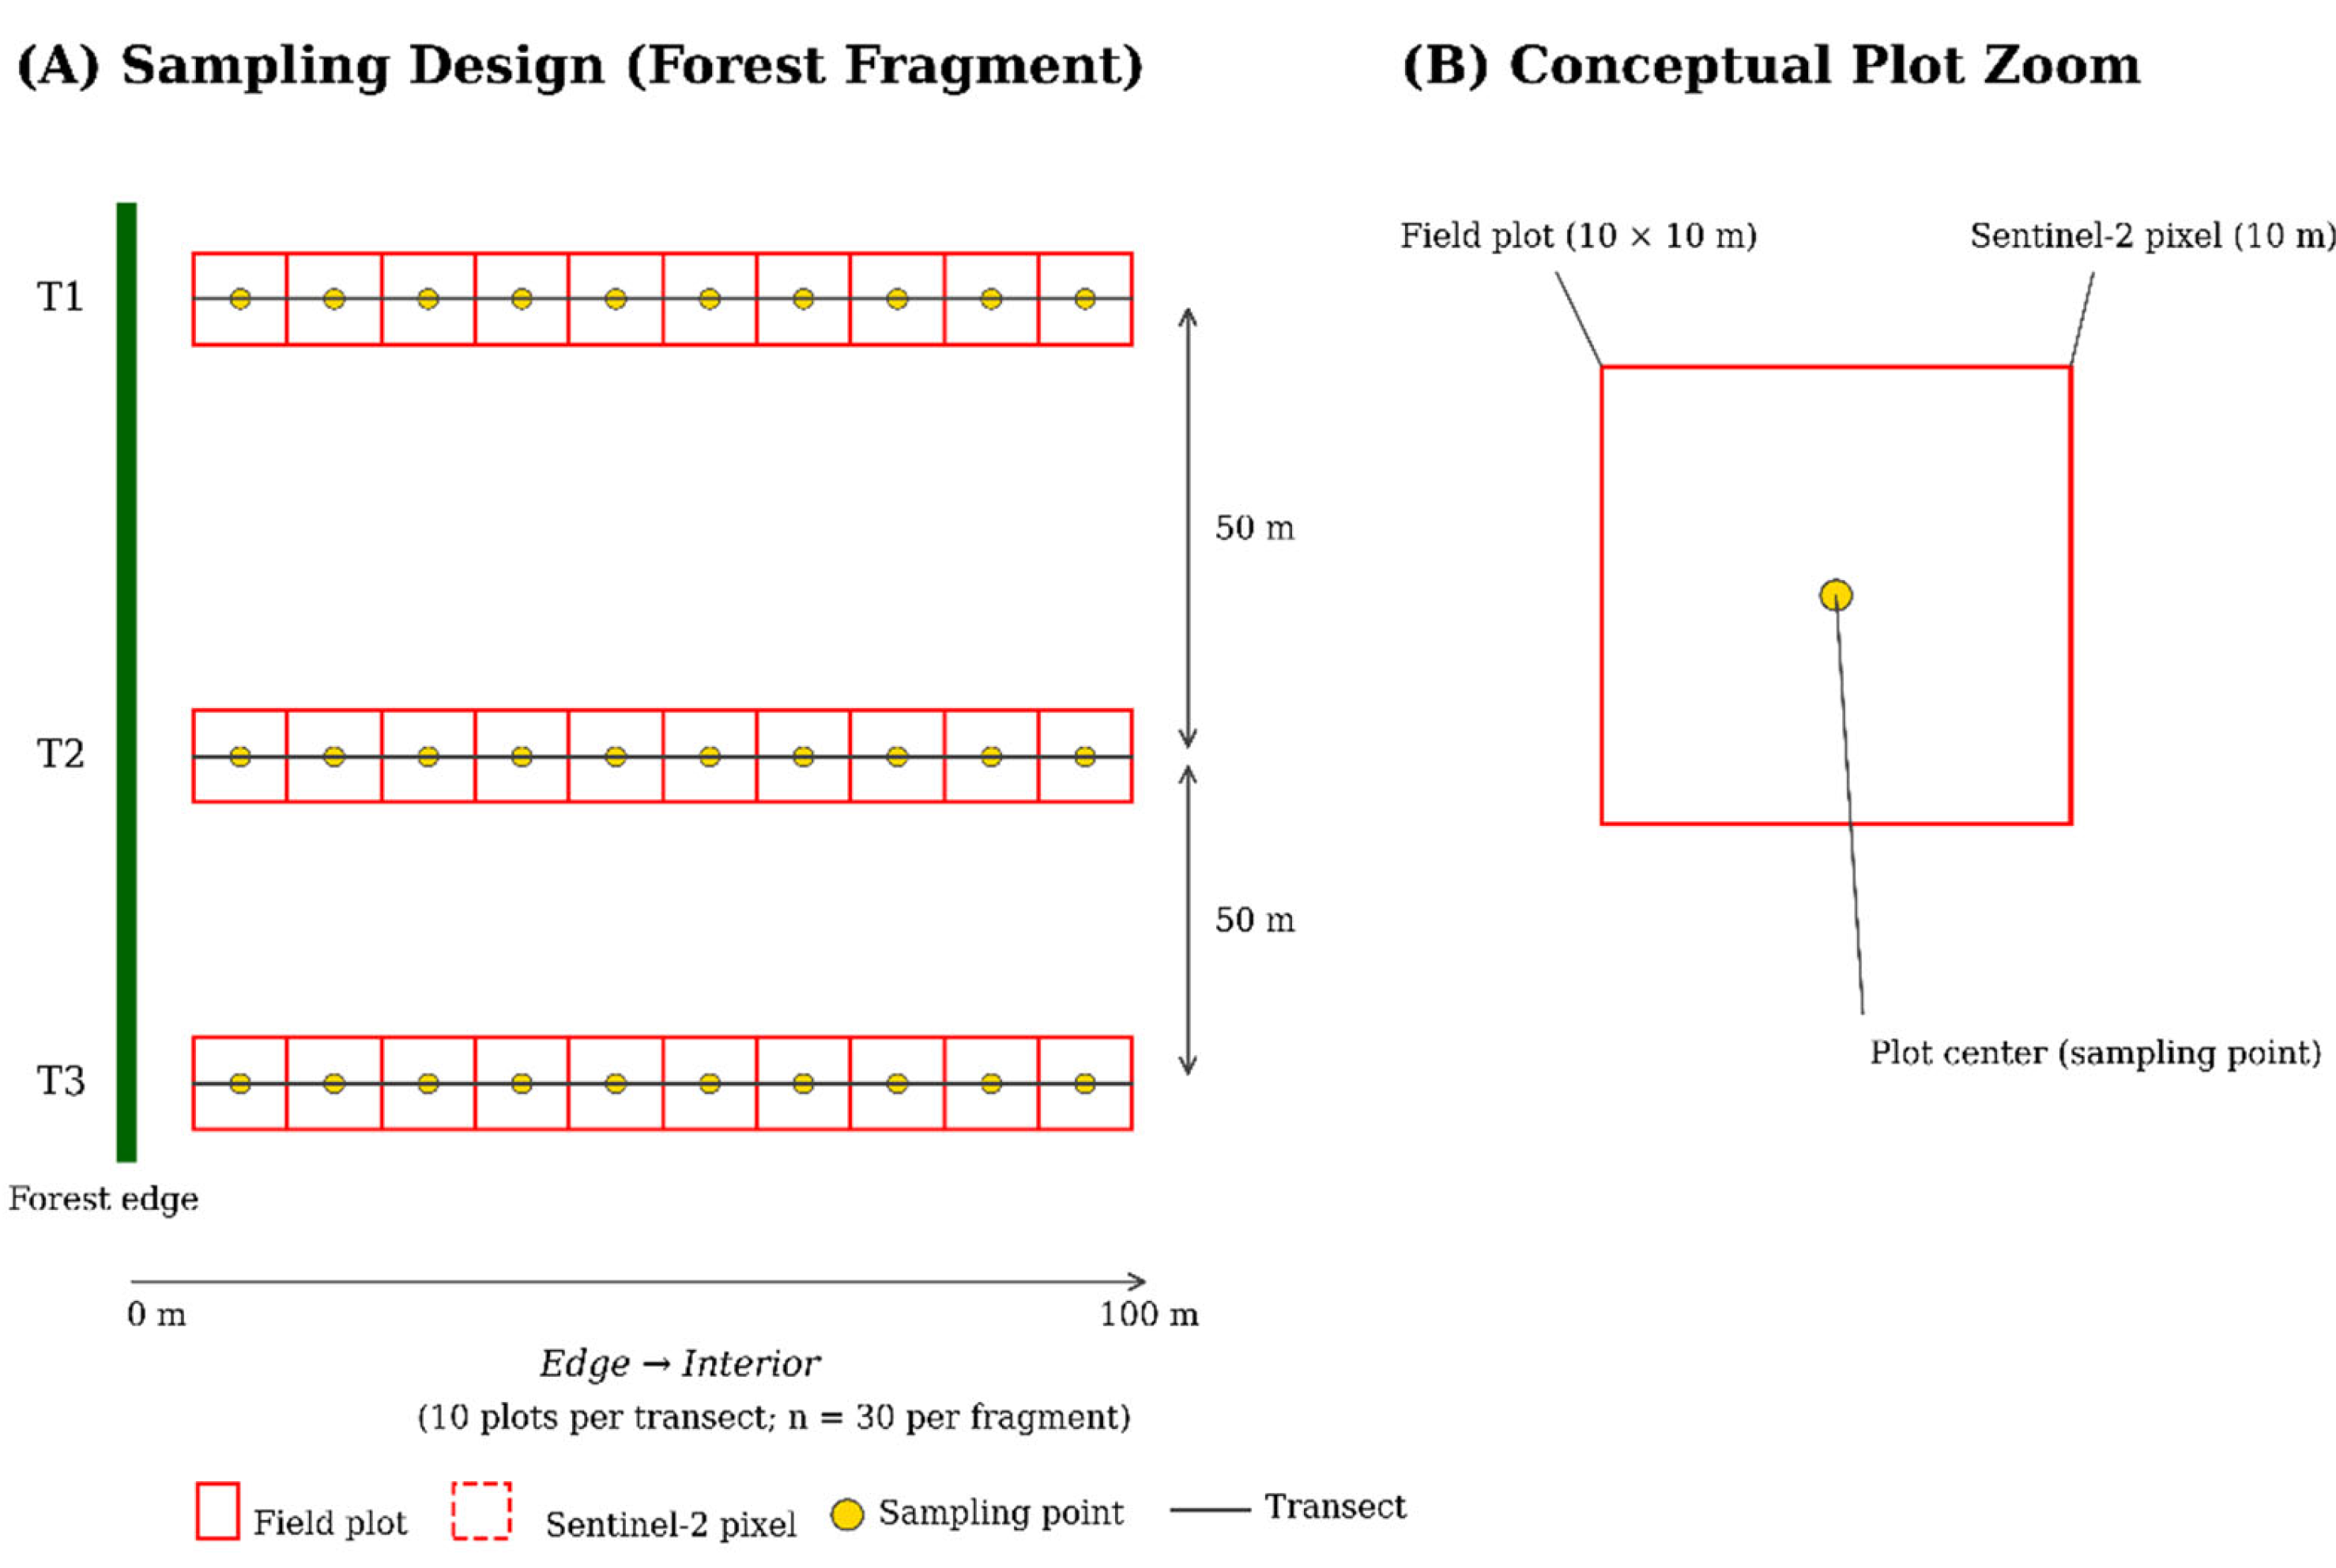
Figure 3.
Similarity dendrograms based on the Jaccard coefficient for four fragments of Semideciduous Seasonal Forest in southeastern Goiás. The clusters were generated from the presence/absence of species in the plots along the edge-to-interior gradient, using the UPGMA clustering technique: (A) IP, (B) AC, (C) IF, and (D) CN.
Figure 3.
Similarity dendrograms based on the Jaccard coefficient for four fragments of Semideciduous Seasonal Forest in southeastern Goiás. The clusters were generated from the presence/absence of species in the plots along the edge-to-interior gradient, using the UPGMA clustering technique: (A) IP, (B) AC, (C) IF, and (D) CN.
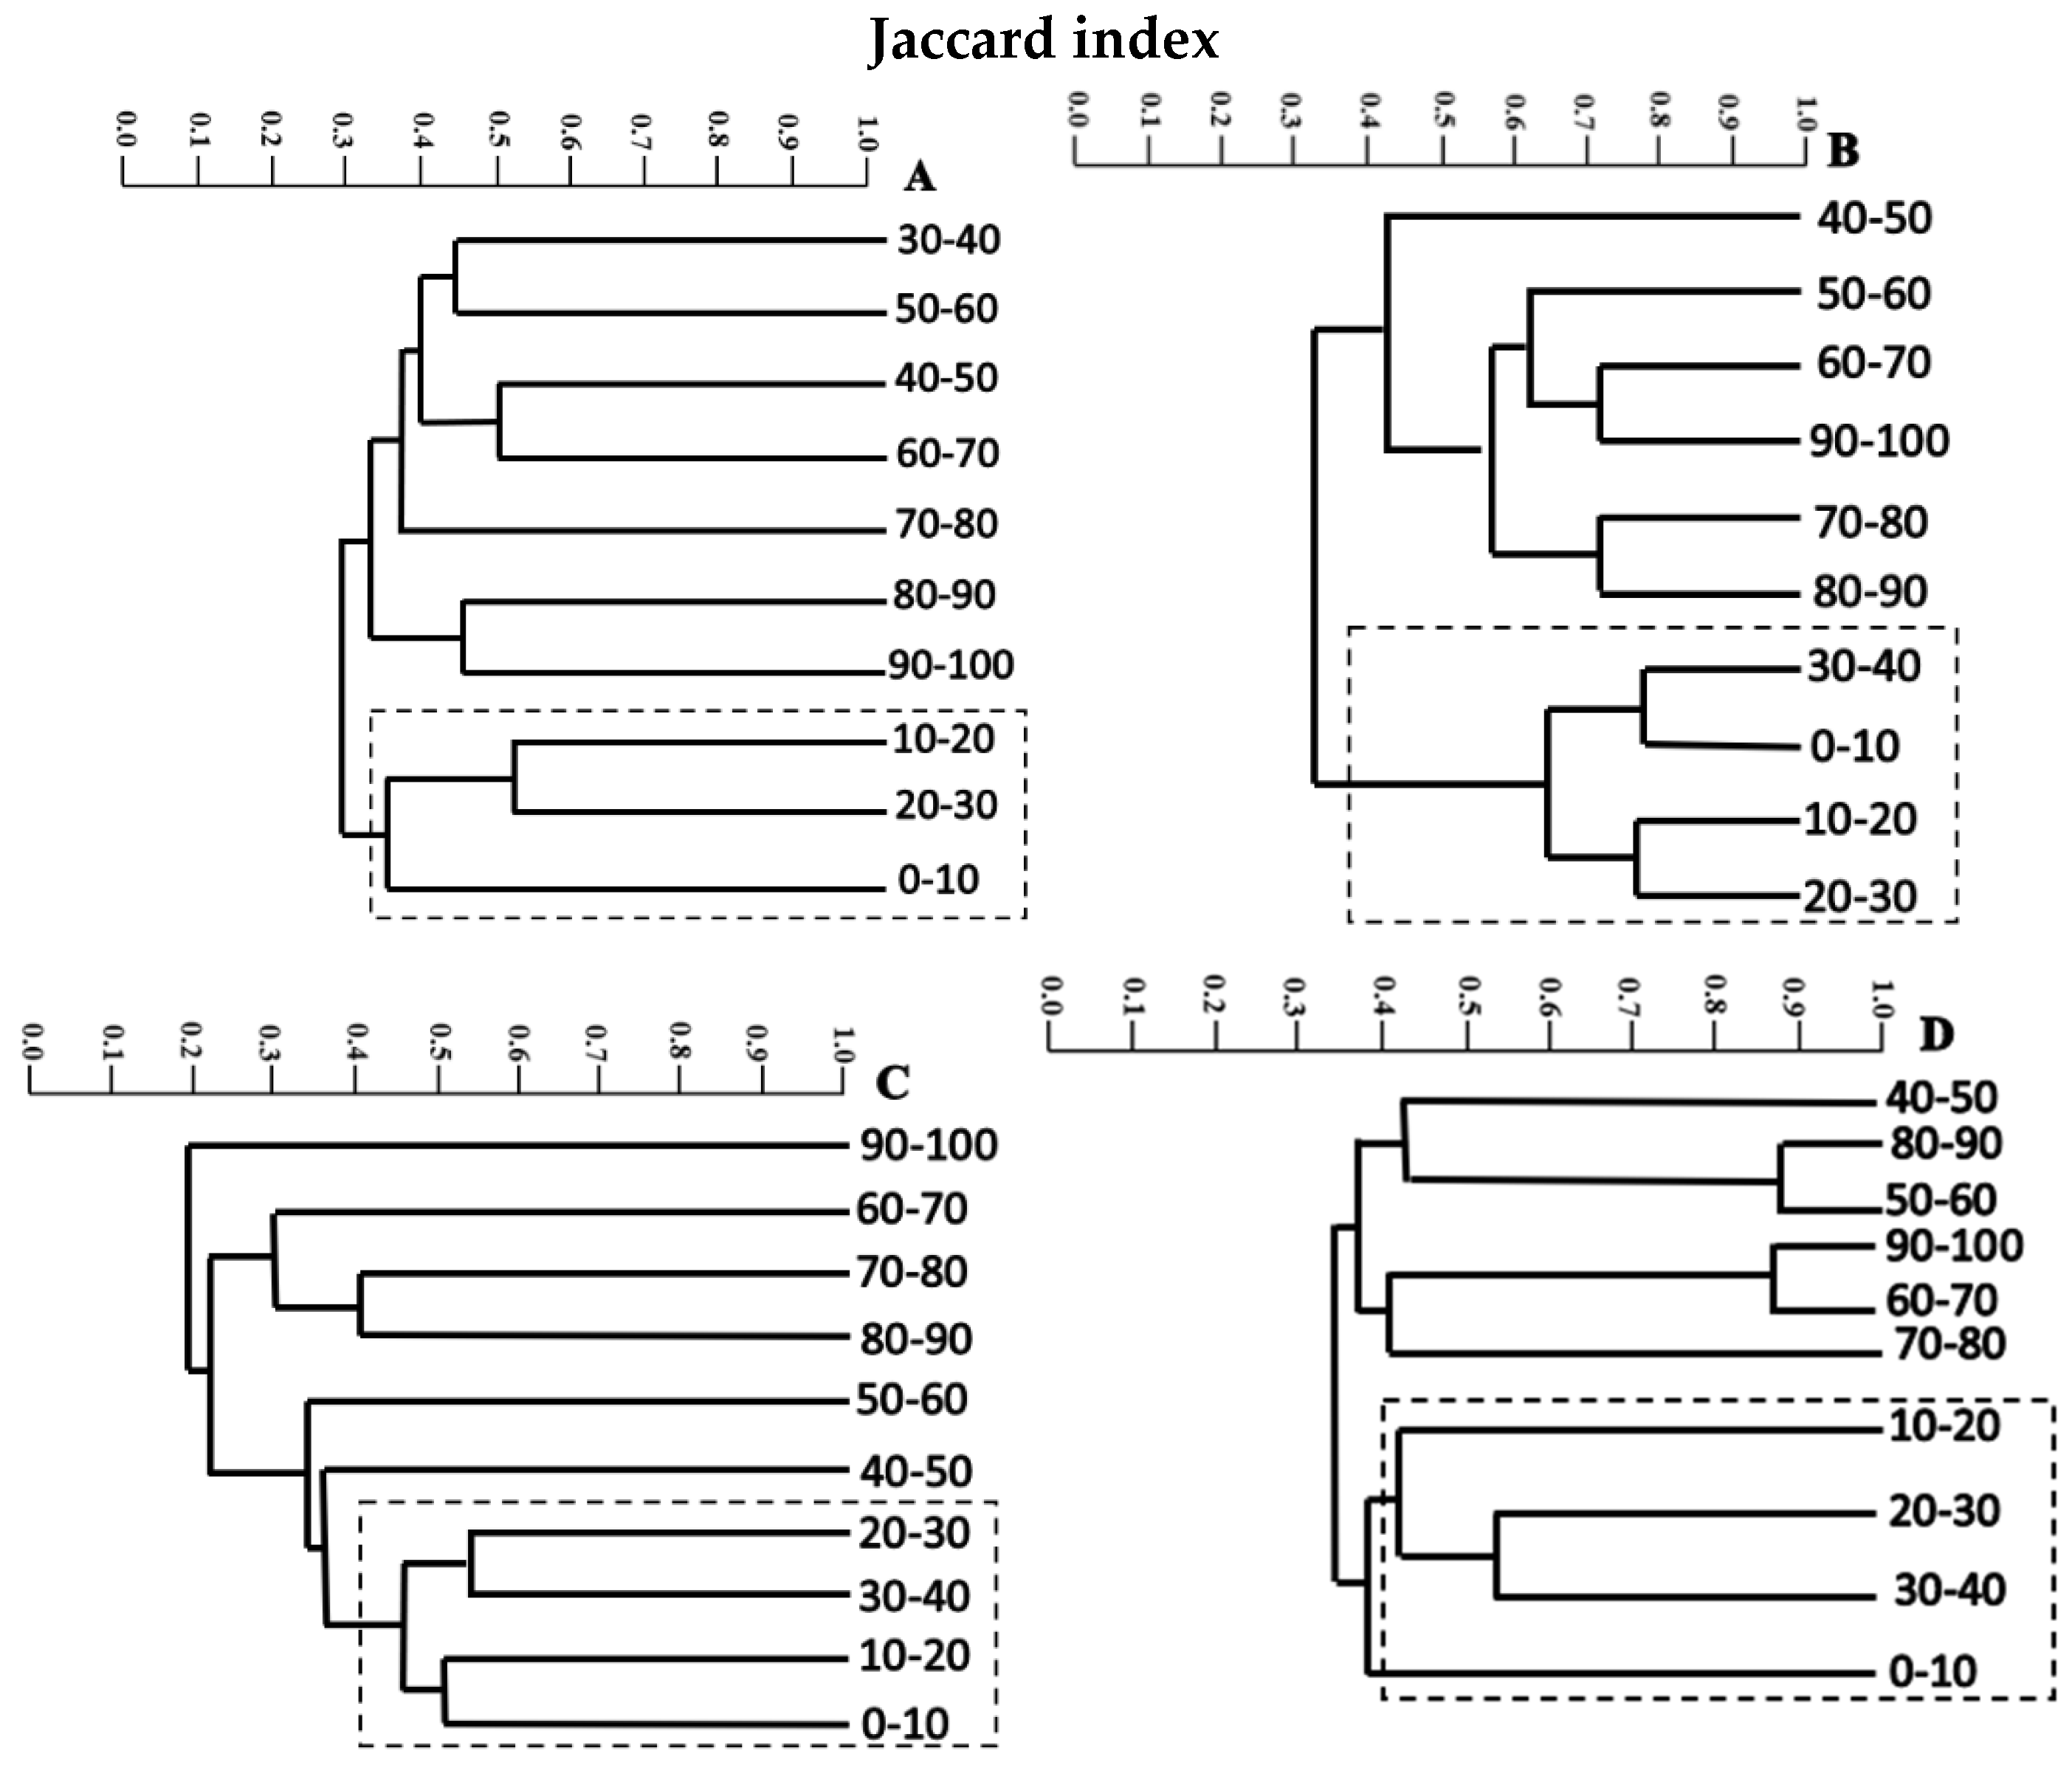
Figure 4.
Similarity dendrograms based on the Morisita–Horn index for the same fragments shown in Figure 3. The groupings consider the relative abundance of species in the plots, using the UPGMA technique: (A) IP, (B) AC, (C) IF, and (D) CN.
Figure 4.
Similarity dendrograms based on the Morisita–Horn index for the same fragments shown in Figure 3. The groupings consider the relative abundance of species in the plots, using the UPGMA technique: (A) IP, (B) AC, (C) IF, and (D) CN.
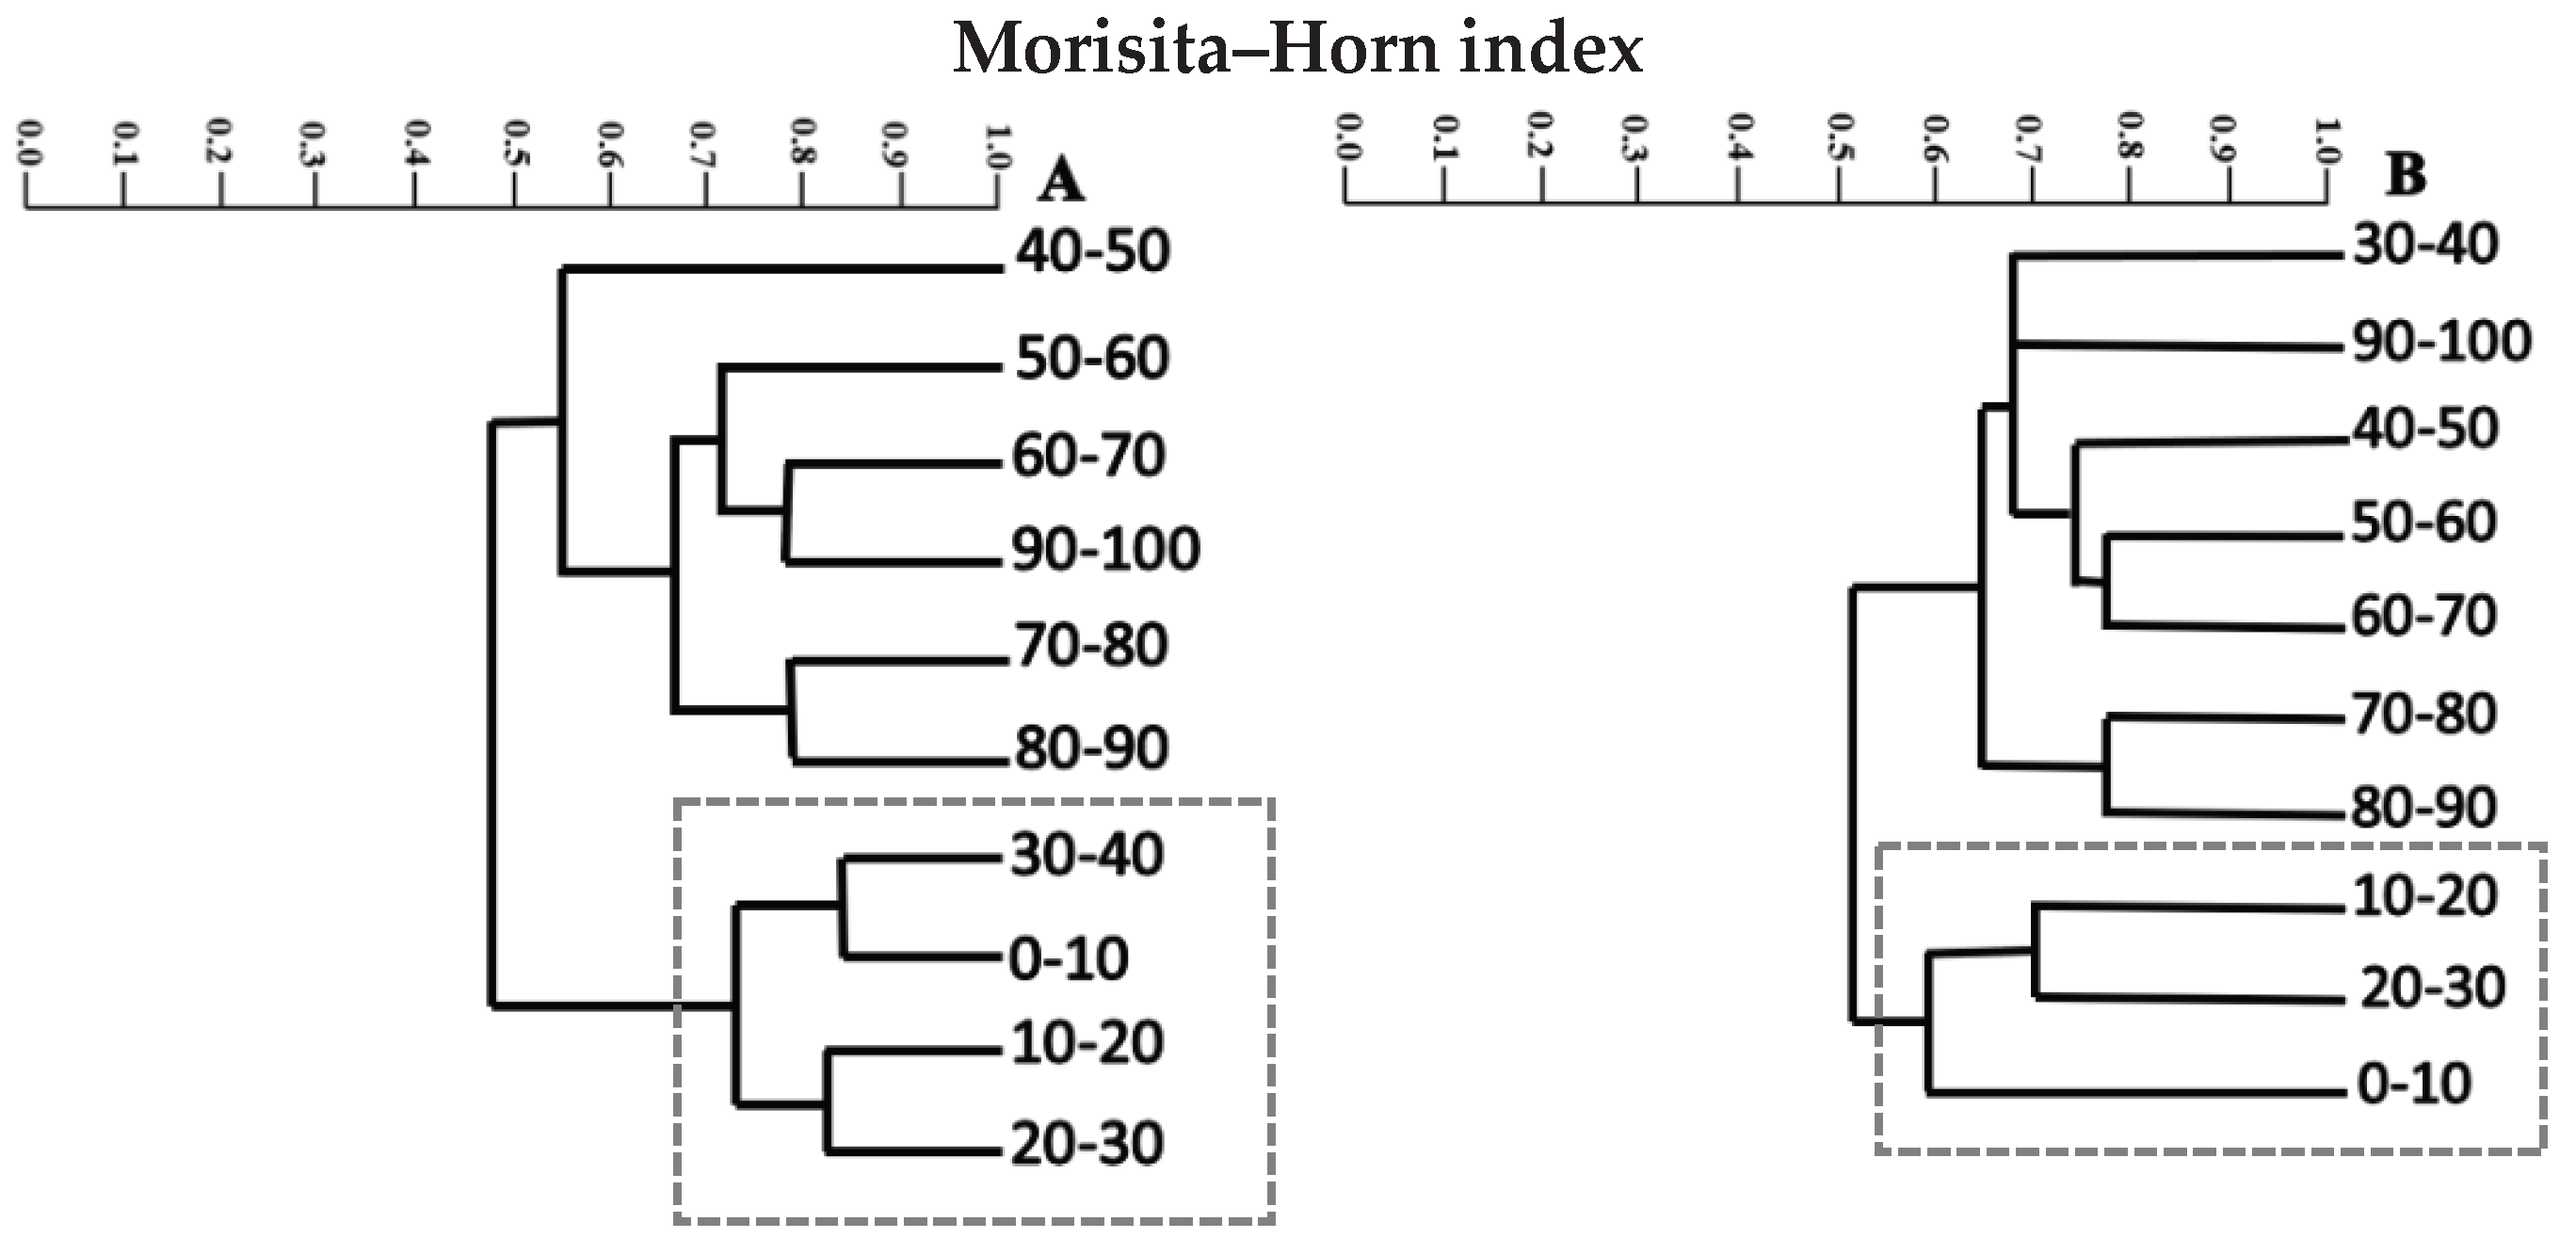
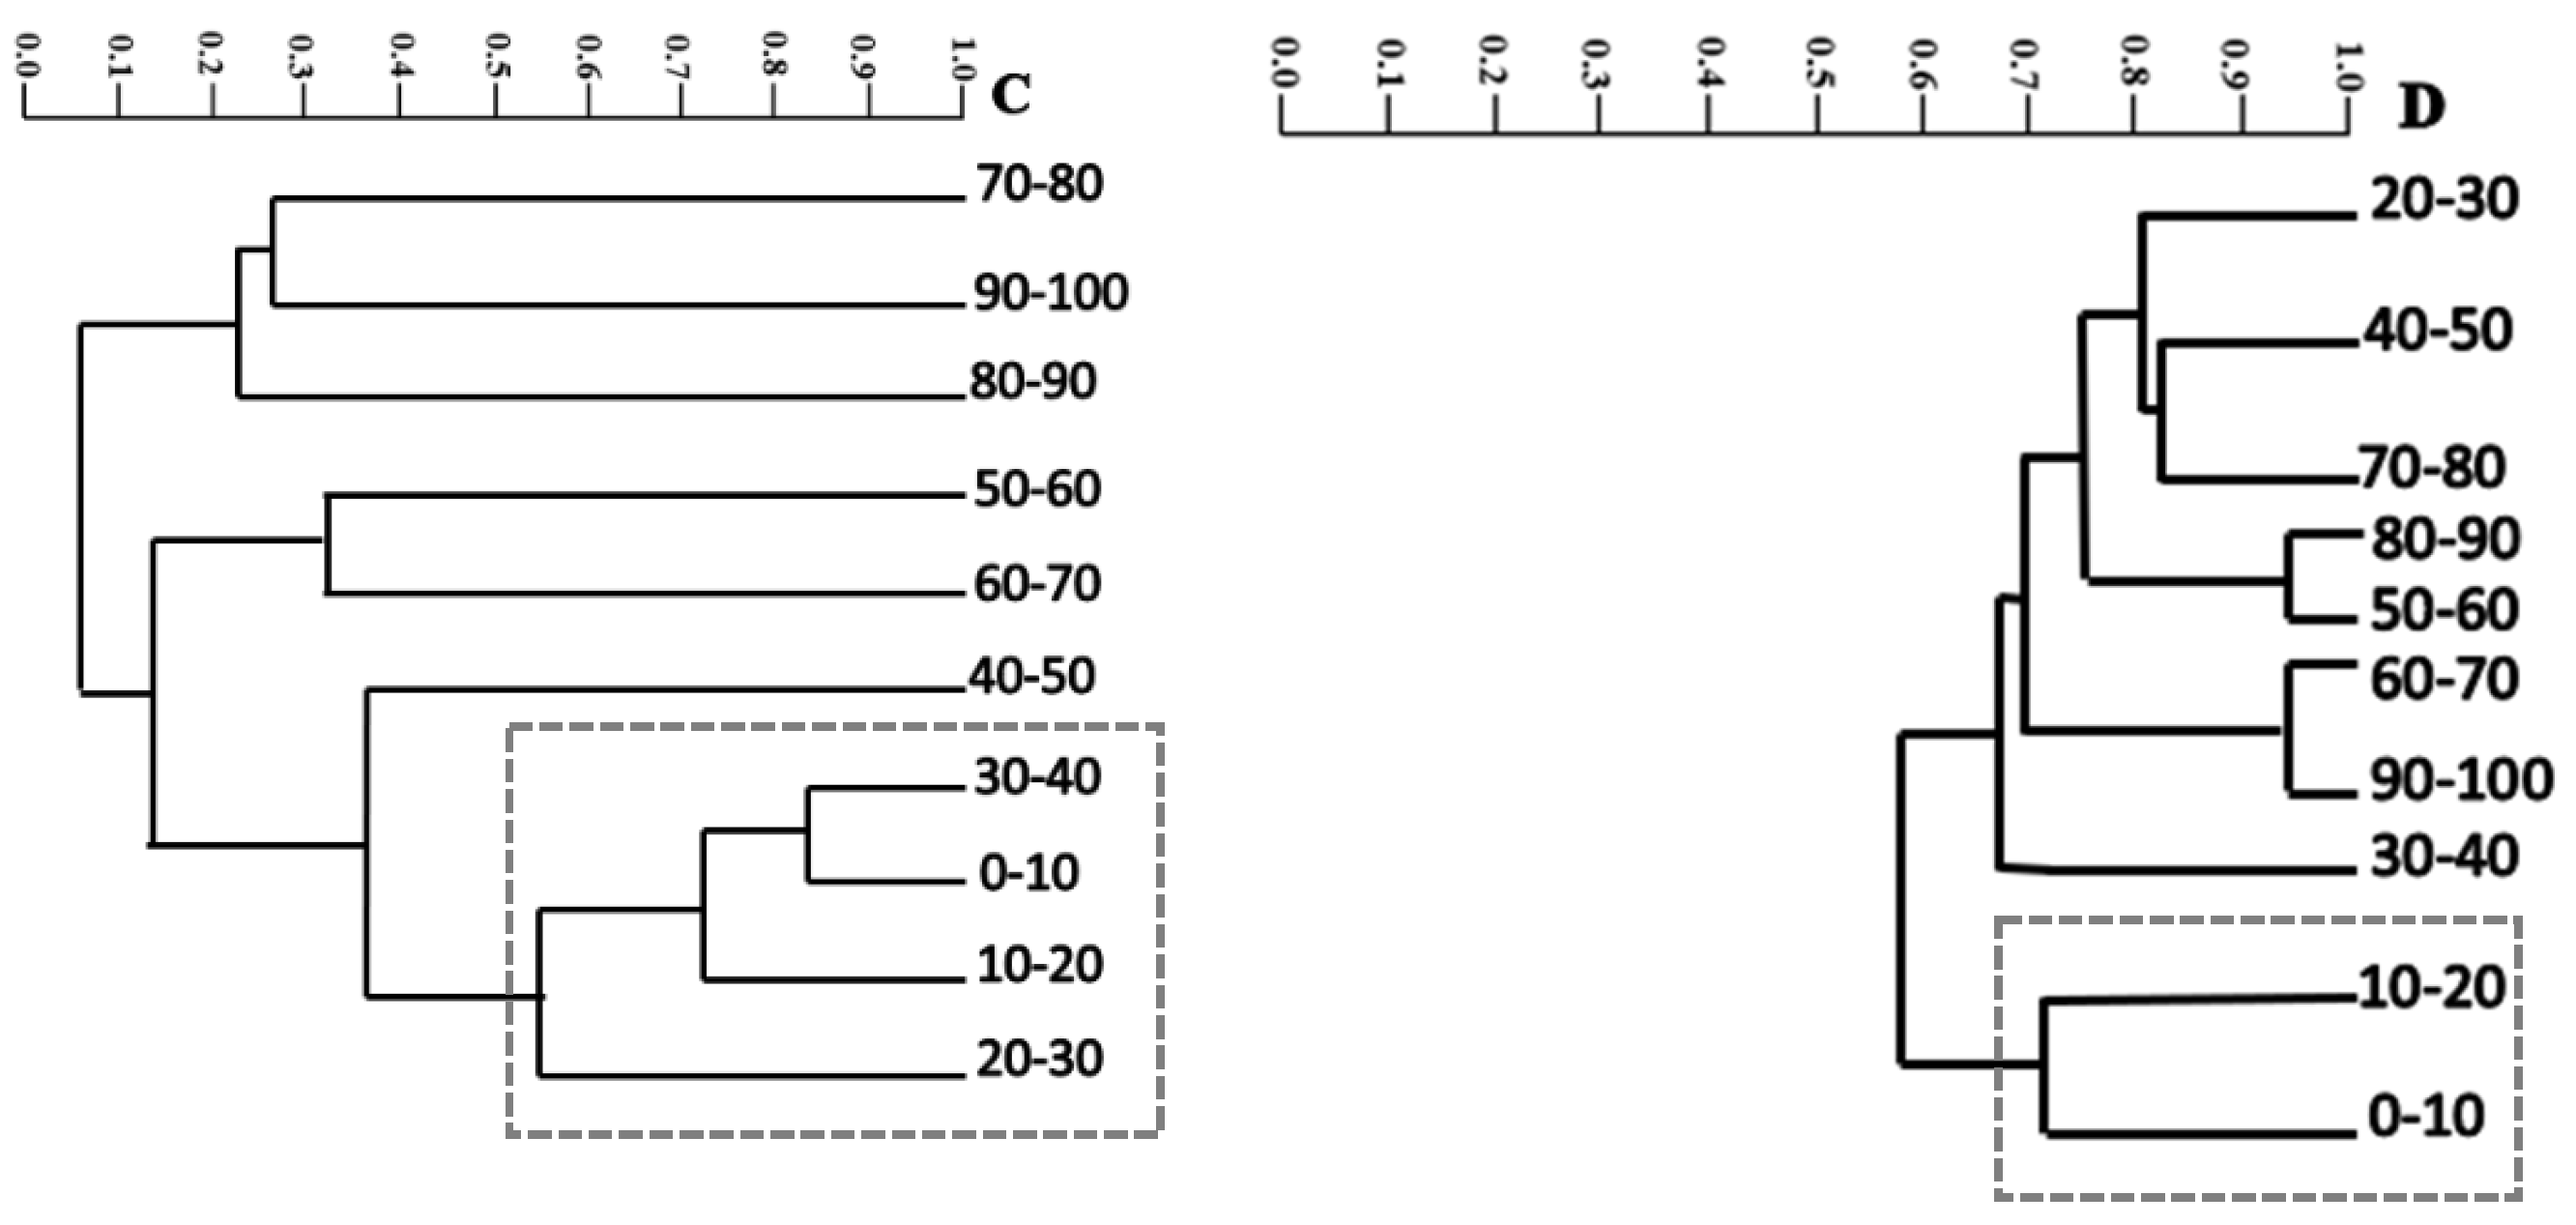
Figure 5.
Similarity dendrograms for the Panga fragment, located in the Panga Reserve, Uberlândia, Minas Gerais. (A) Jaccard coefficient based on species presence/absence; (B) Morisita–Horn index based on relative abundance.
Figure 5.
Similarity dendrograms for the Panga fragment, located in the Panga Reserve, Uberlândia, Minas Gerais. (A) Jaccard coefficient based on species presence/absence; (B) Morisita–Horn index based on relative abundance.
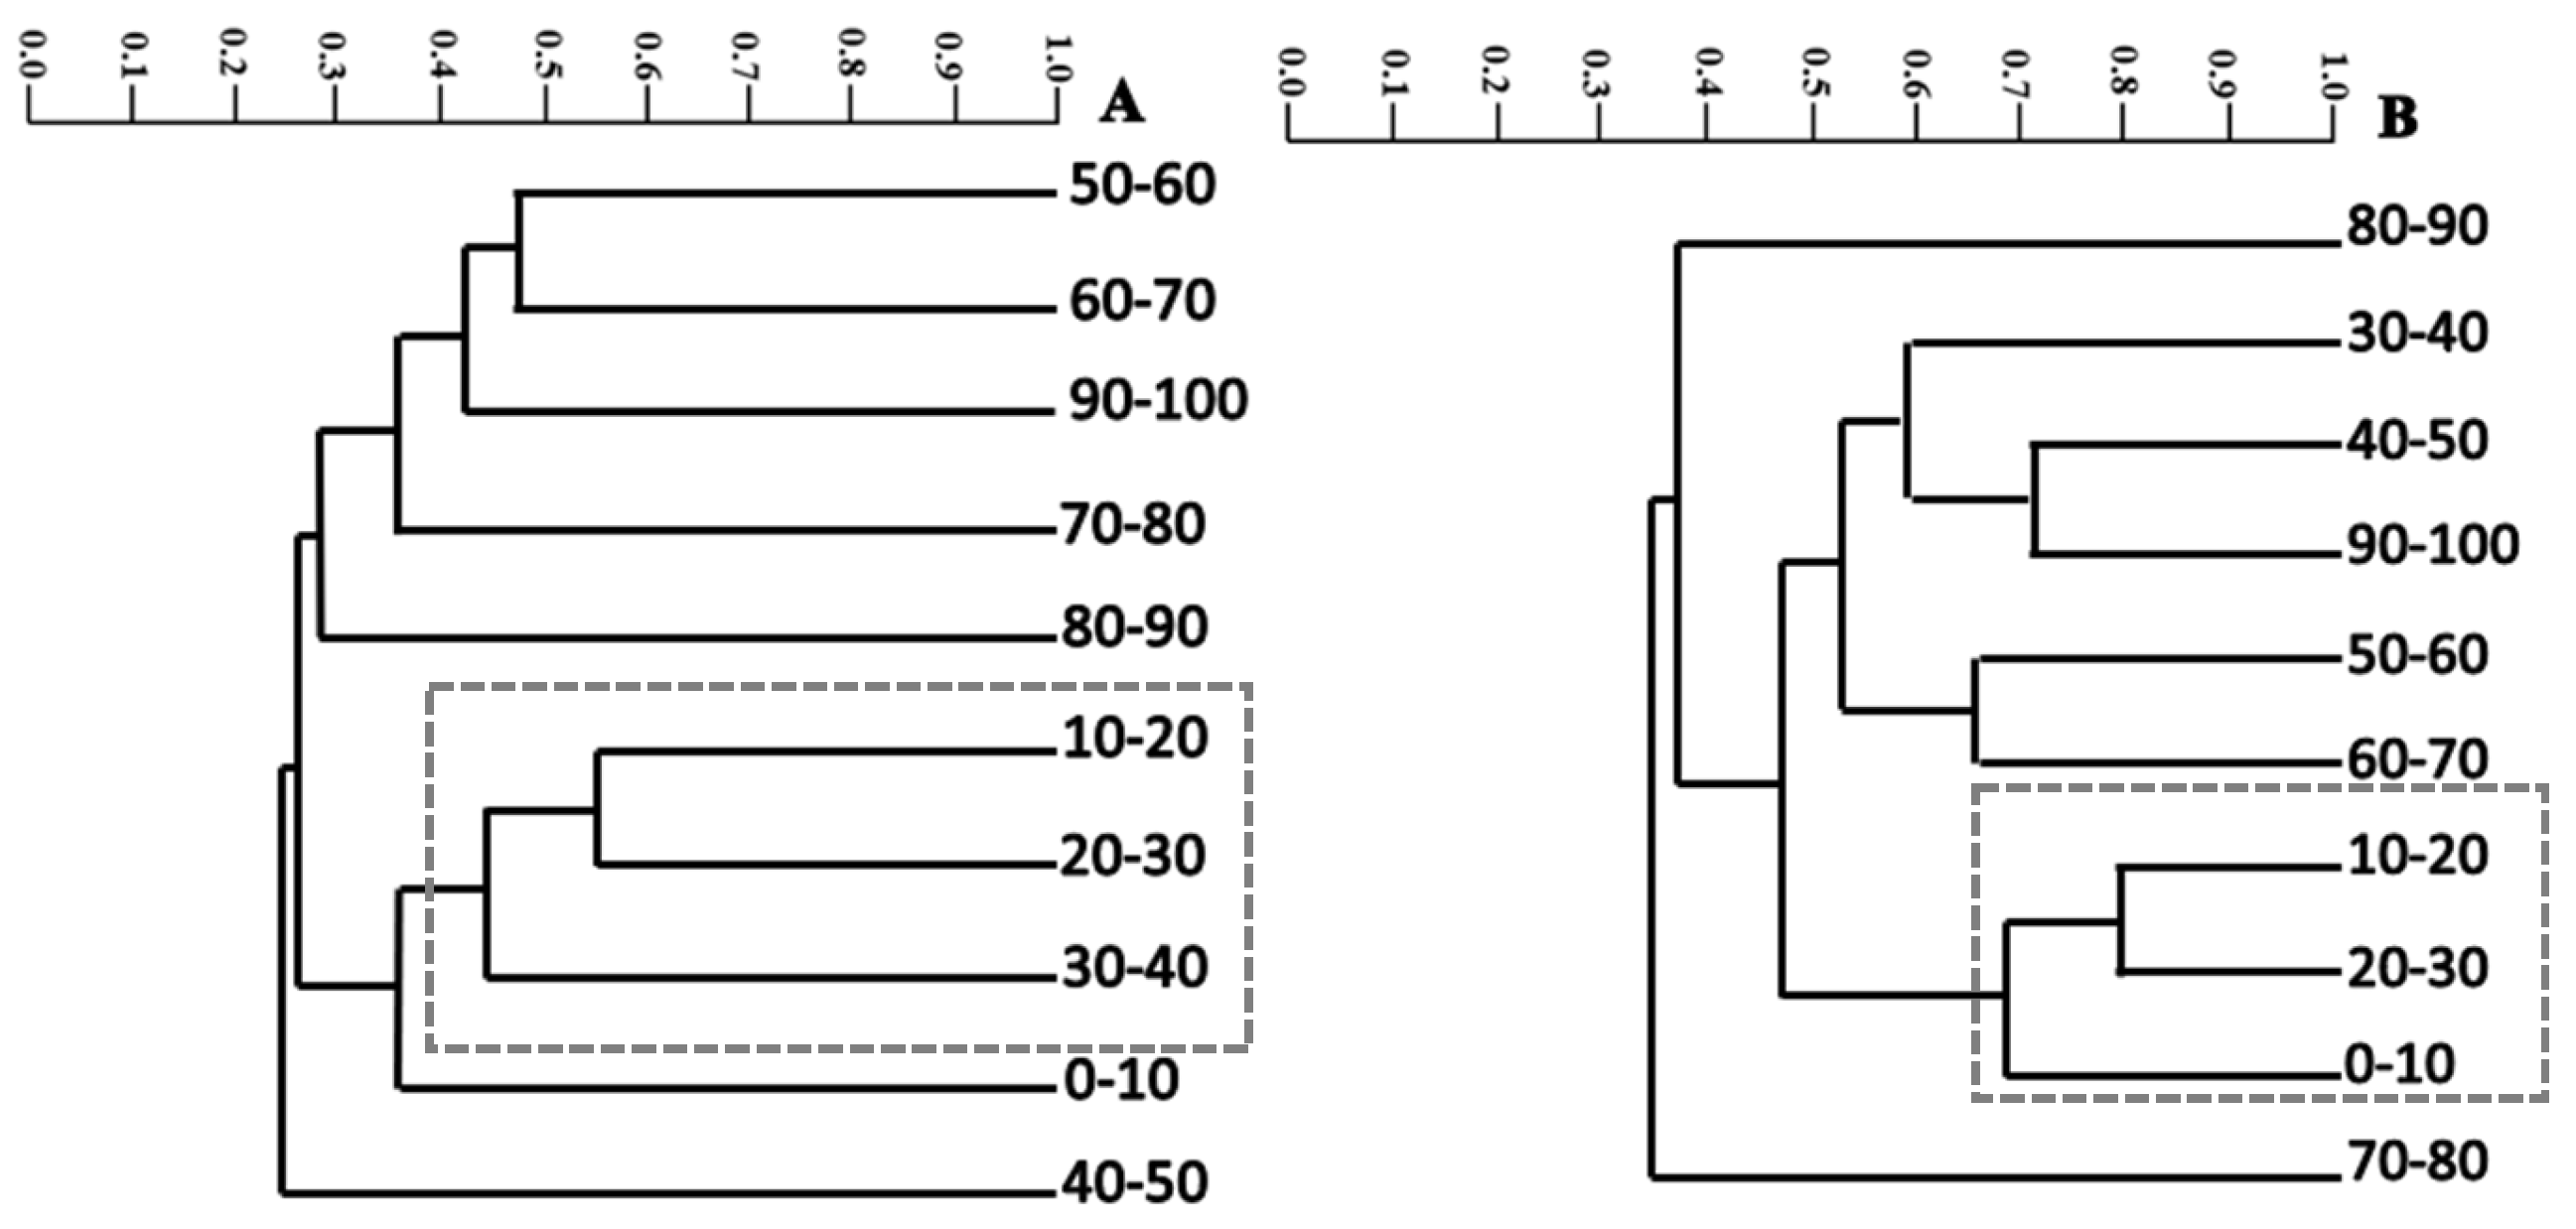
Figure 6.
Biplot of the Principal Component Analysis (PCA) integrating basal area (BA) and spectral indices (NDVI, EVI, NDMI, and VF), calculated from a standardized correlation matrix (n = 150 plots). PC1 explains 56.0% and PC2 explains 25.4% of the total variance, totaling 81.4% cumulative variance. Points represent sample plots classified phytosociologically as forest edge, transition zone, and forest interior.
Figure 6.
Biplot of the Principal Component Analysis (PCA) integrating basal area (BA) and spectral indices (NDVI, EVI, NDMI, and VF), calculated from a standardized correlation matrix (n = 150 plots). PC1 explains 56.0% and PC2 explains 25.4% of the total variance, totaling 81.4% cumulative variance. Points represent sample plots classified phytosociologically as forest edge, transition zone, and forest interior.
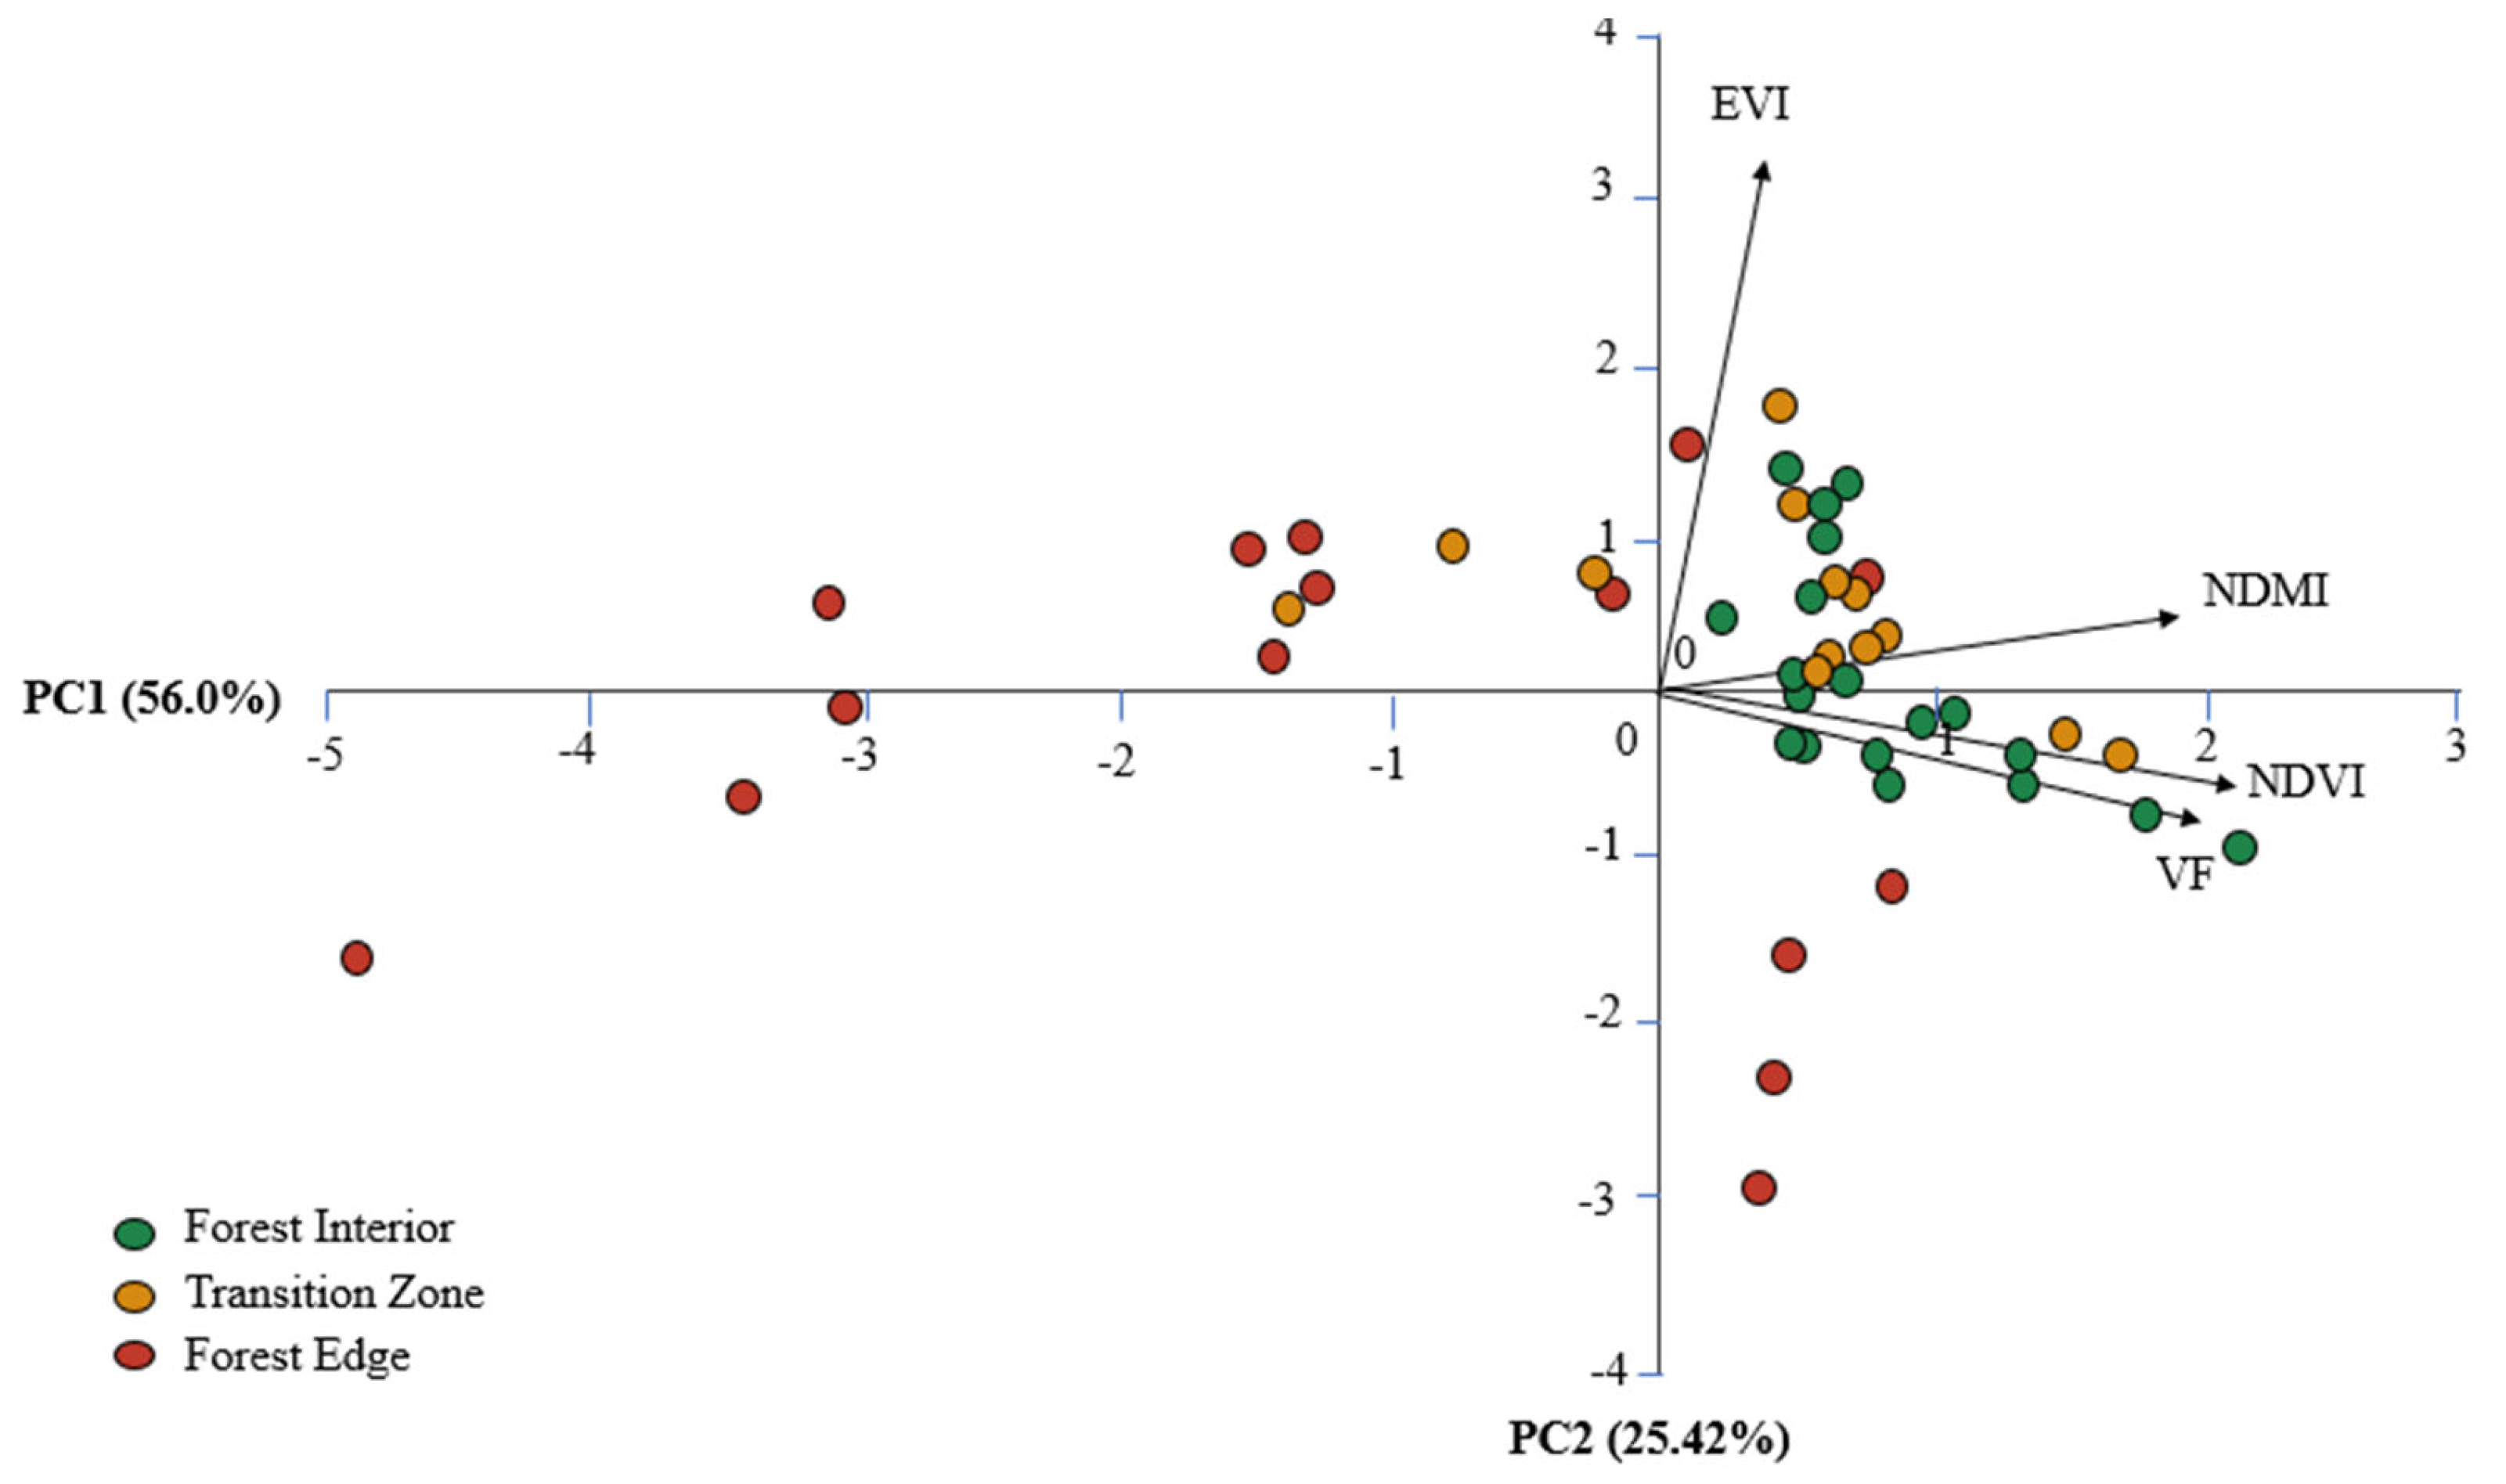
Figure 7.
Pixel-by-pixel segmented modeling of the relationship between NDVI and distance from the edge in the IF fragment. Each point represents a 10 m pixel distributed along the edge-to-interior gradient. The solid line corresponds to the segmented model fit, while the dashed vertical line indicates the estimated breakpoint (13.6 m), interpreted as the depth of the edge effect. NDVI values tend to stabilize beyond the estimated breakpoint.
Figure 7.
Pixel-by-pixel segmented modeling of the relationship between NDVI and distance from the edge in the IF fragment. Each point represents a 10 m pixel distributed along the edge-to-interior gradient. The solid line corresponds to the segmented model fit, while the dashed vertical line indicates the estimated breakpoint (13.6 m), interpreted as the depth of the edge effect. NDVI values tend to stabilize beyond the estimated breakpoint.
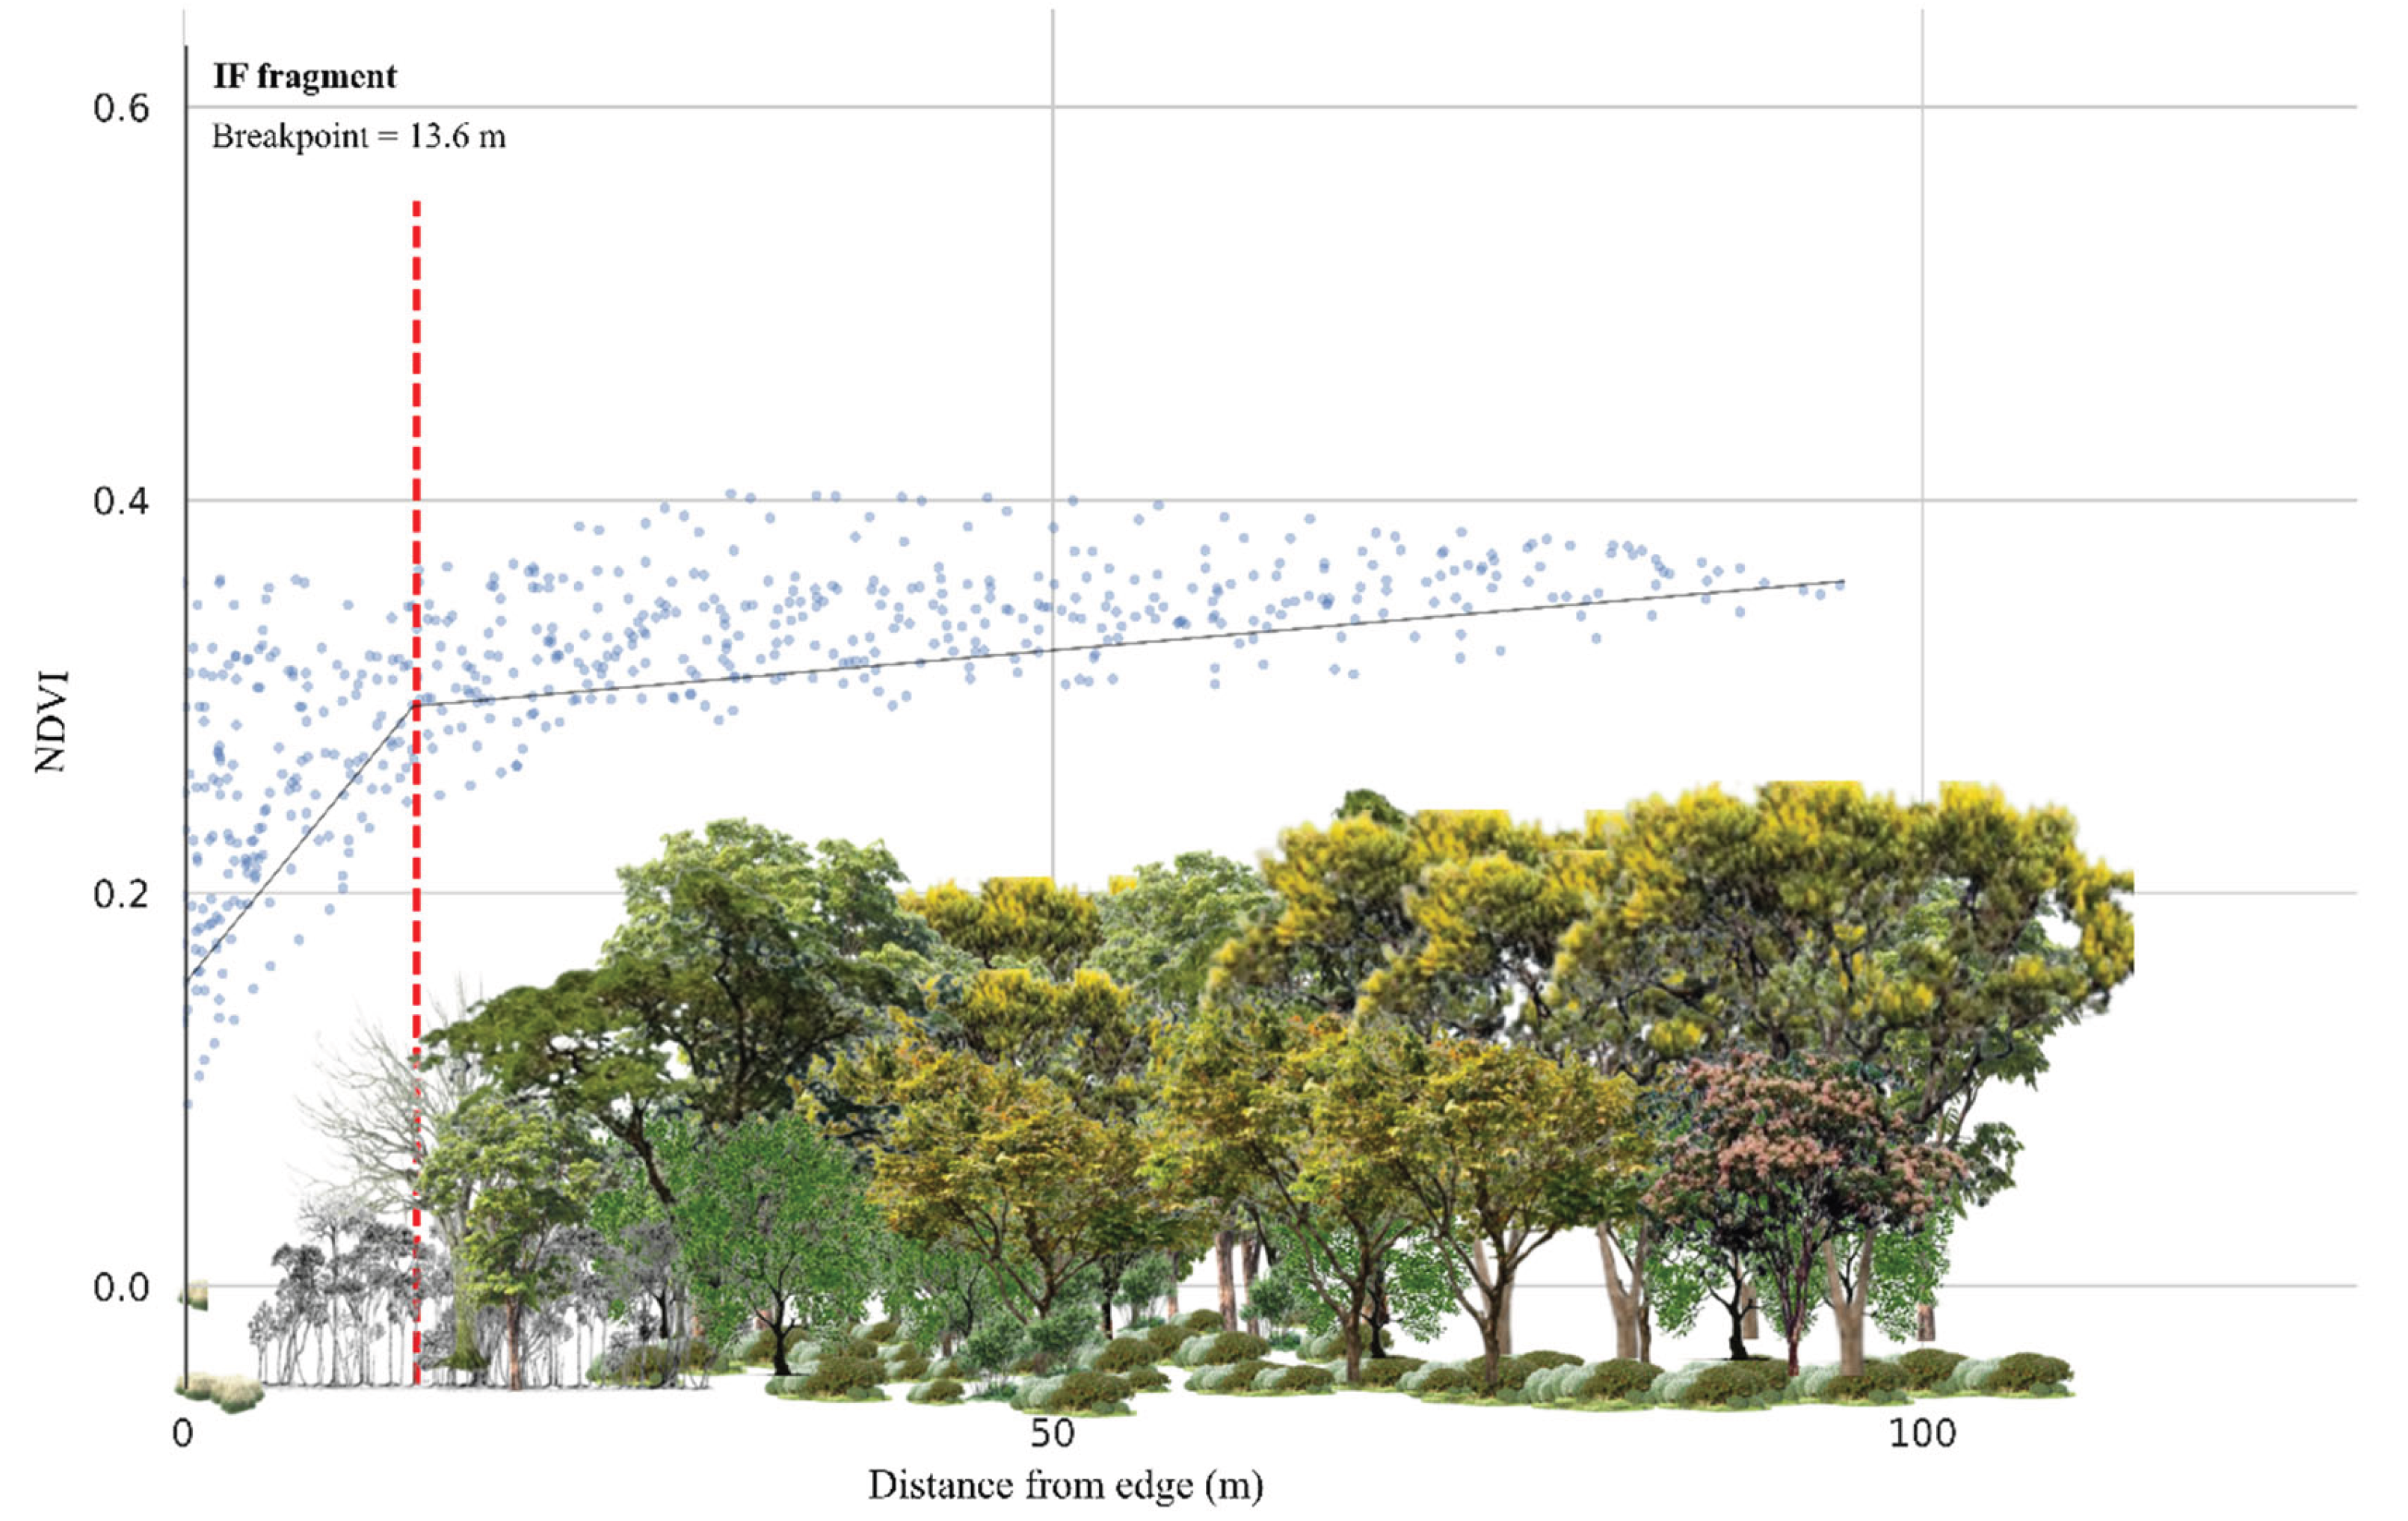
Figure 8.
Pixel-by-pixel segmented modeling of the relationship between NDVI and distance from the edge in the AC fragment. Each point represents a 10 m pixel distributed along the edge-to-interior gradient. The solid line corresponds to the segmented model fit, while the dashed vertical line indicates the estimated breakpoint (14.0 m), interpreted as the depth of the edge effect. NDVI values tend to stabilize beyond the estimated breakpoint, characterizing a shallow edge-effect pattern.
Figure 8.
Pixel-by-pixel segmented modeling of the relationship between NDVI and distance from the edge in the AC fragment. Each point represents a 10 m pixel distributed along the edge-to-interior gradient. The solid line corresponds to the segmented model fit, while the dashed vertical line indicates the estimated breakpoint (14.0 m), interpreted as the depth of the edge effect. NDVI values tend to stabilize beyond the estimated breakpoint, characterizing a shallow edge-effect pattern.
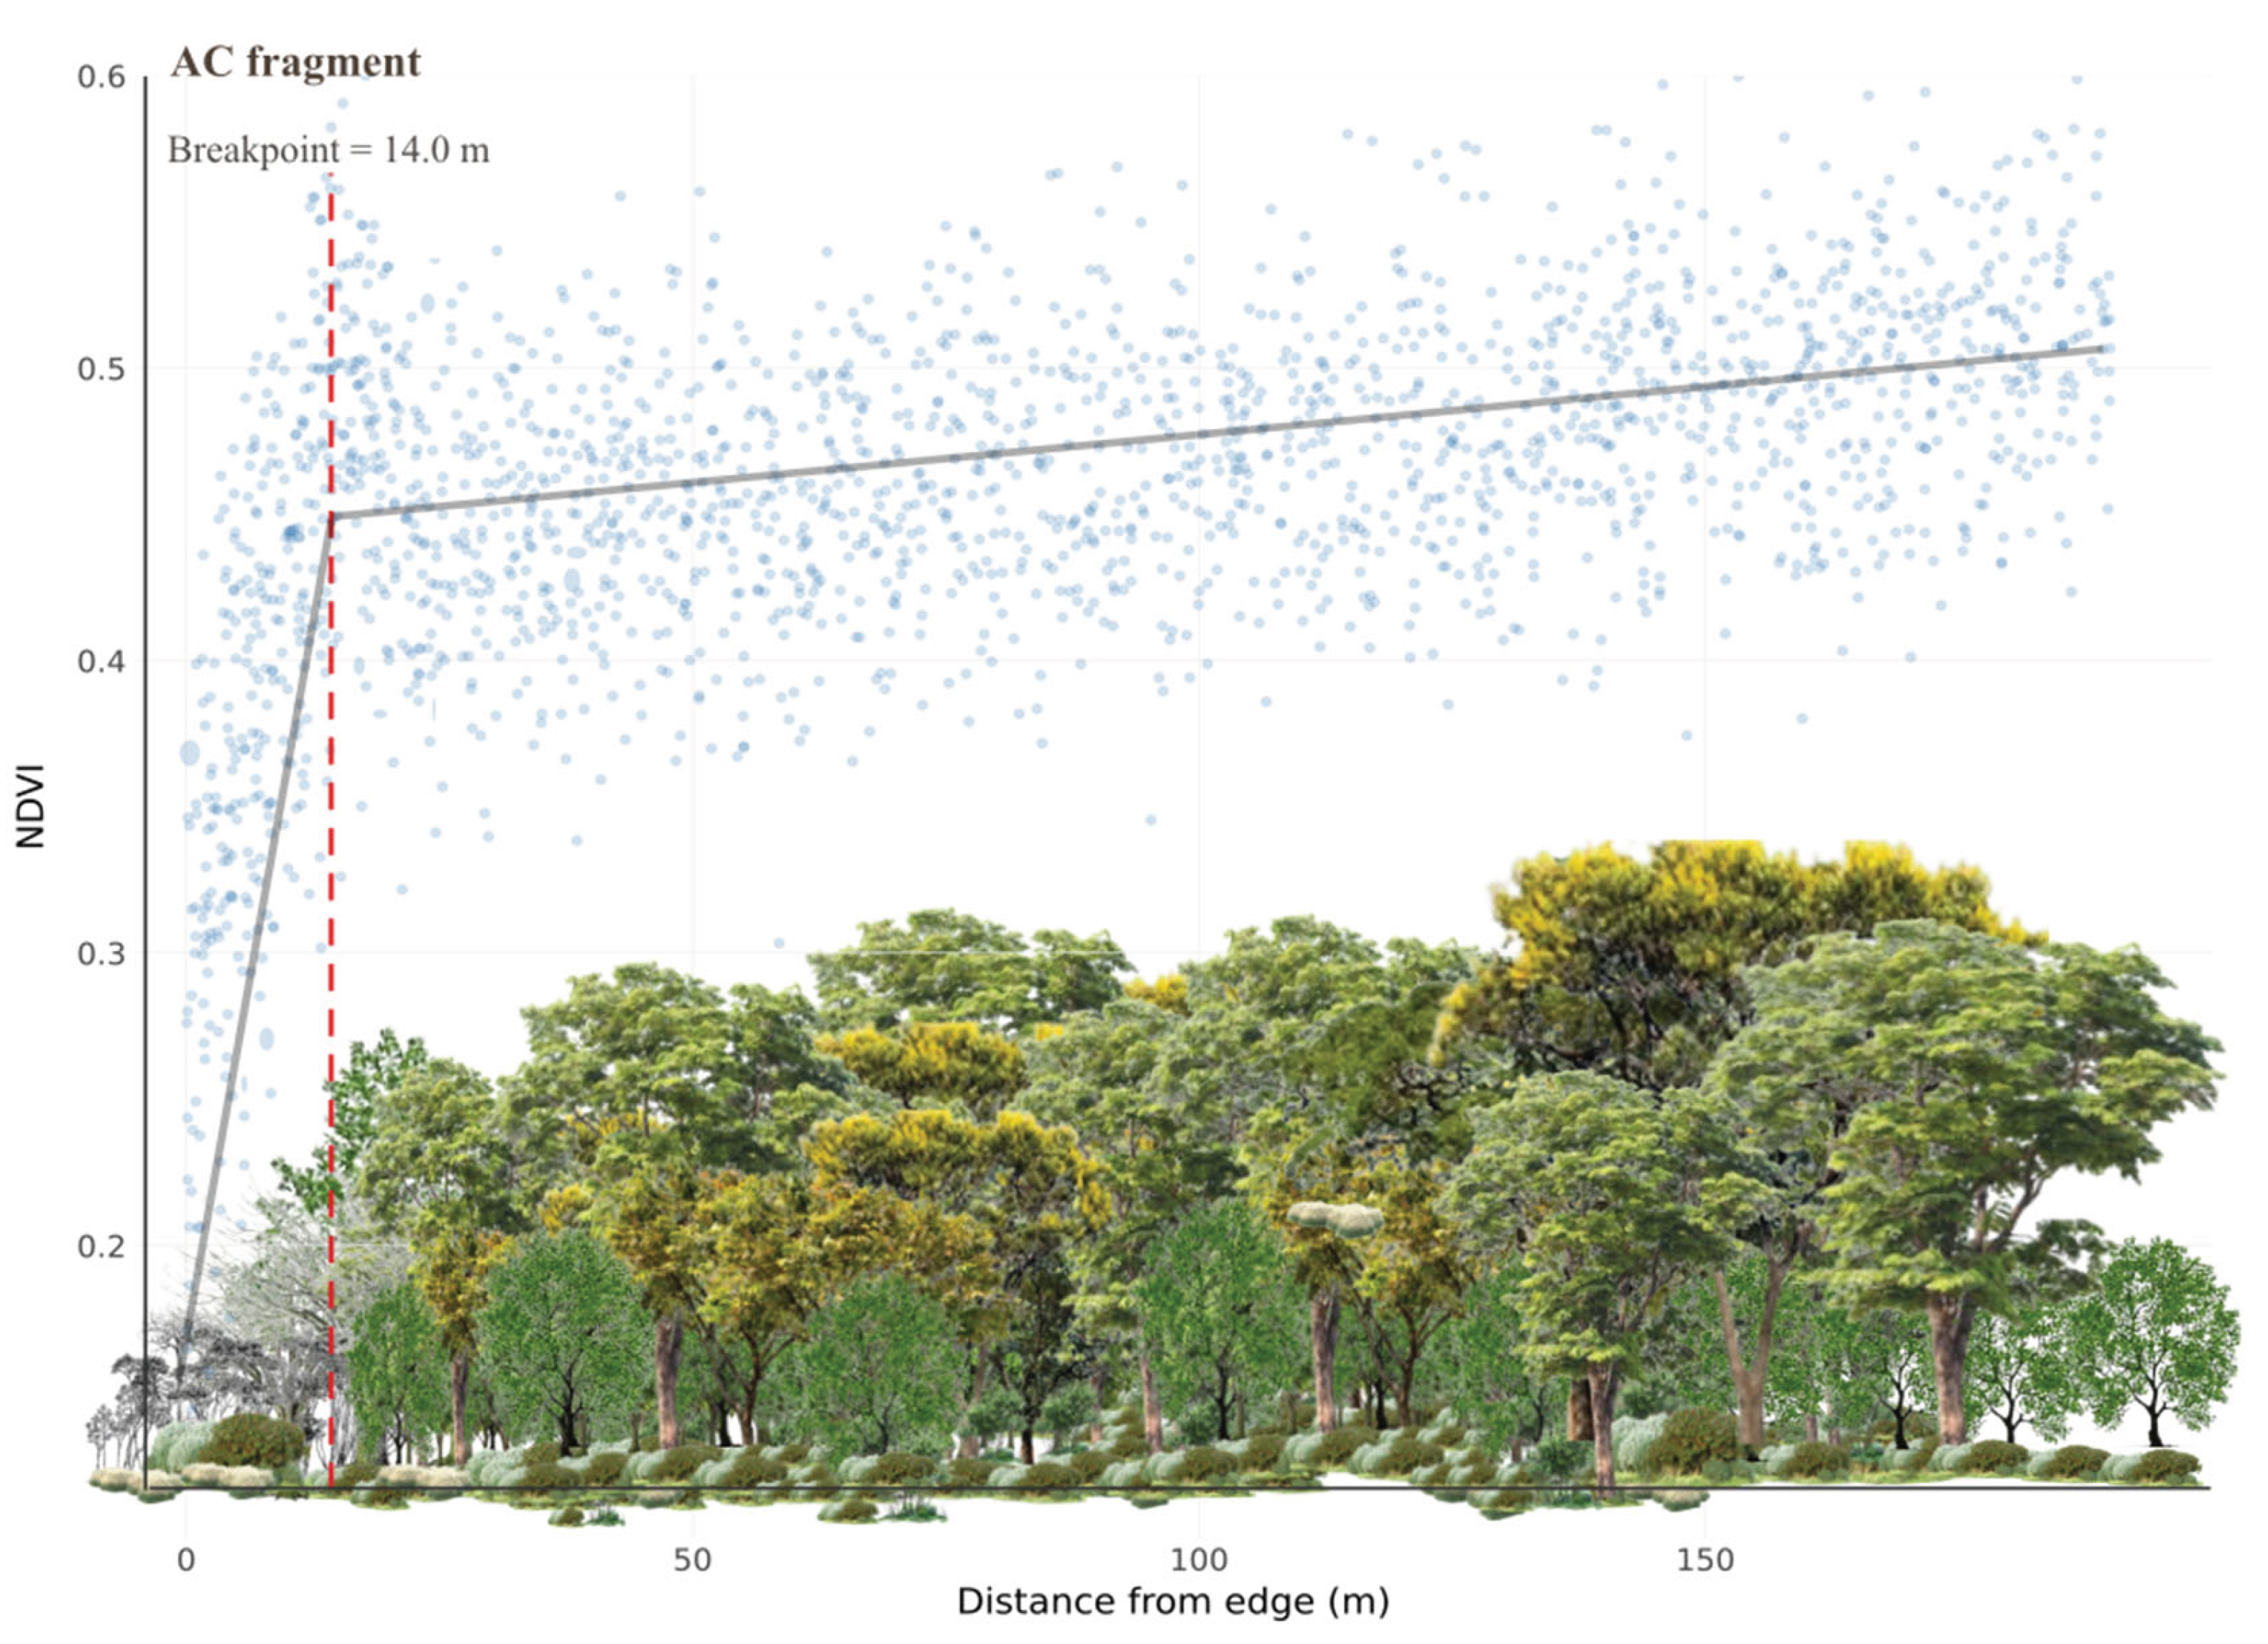
Figure 9.
Pixel-by-pixel segmented modeling of the relationship between NDVI and distance from the edge in the CN fragment. Each point represents a 10 m pixel distributed along the edge-to-interior gradient. The solid line corresponds to the segmented model fit, while the dashed vertical line indicates the estimated breakpoint (22.1 m), interpreted as the average depth of the edge effect. The broader dispersion of NDVI values indicates an intermediate and more gradual edge-response pattern compared to IF and AC.
Figure 9.
Pixel-by-pixel segmented modeling of the relationship between NDVI and distance from the edge in the CN fragment. Each point represents a 10 m pixel distributed along the edge-to-interior gradient. The solid line corresponds to the segmented model fit, while the dashed vertical line indicates the estimated breakpoint (22.1 m), interpreted as the average depth of the edge effect. The broader dispersion of NDVI values indicates an intermediate and more gradual edge-response pattern compared to IF and AC.
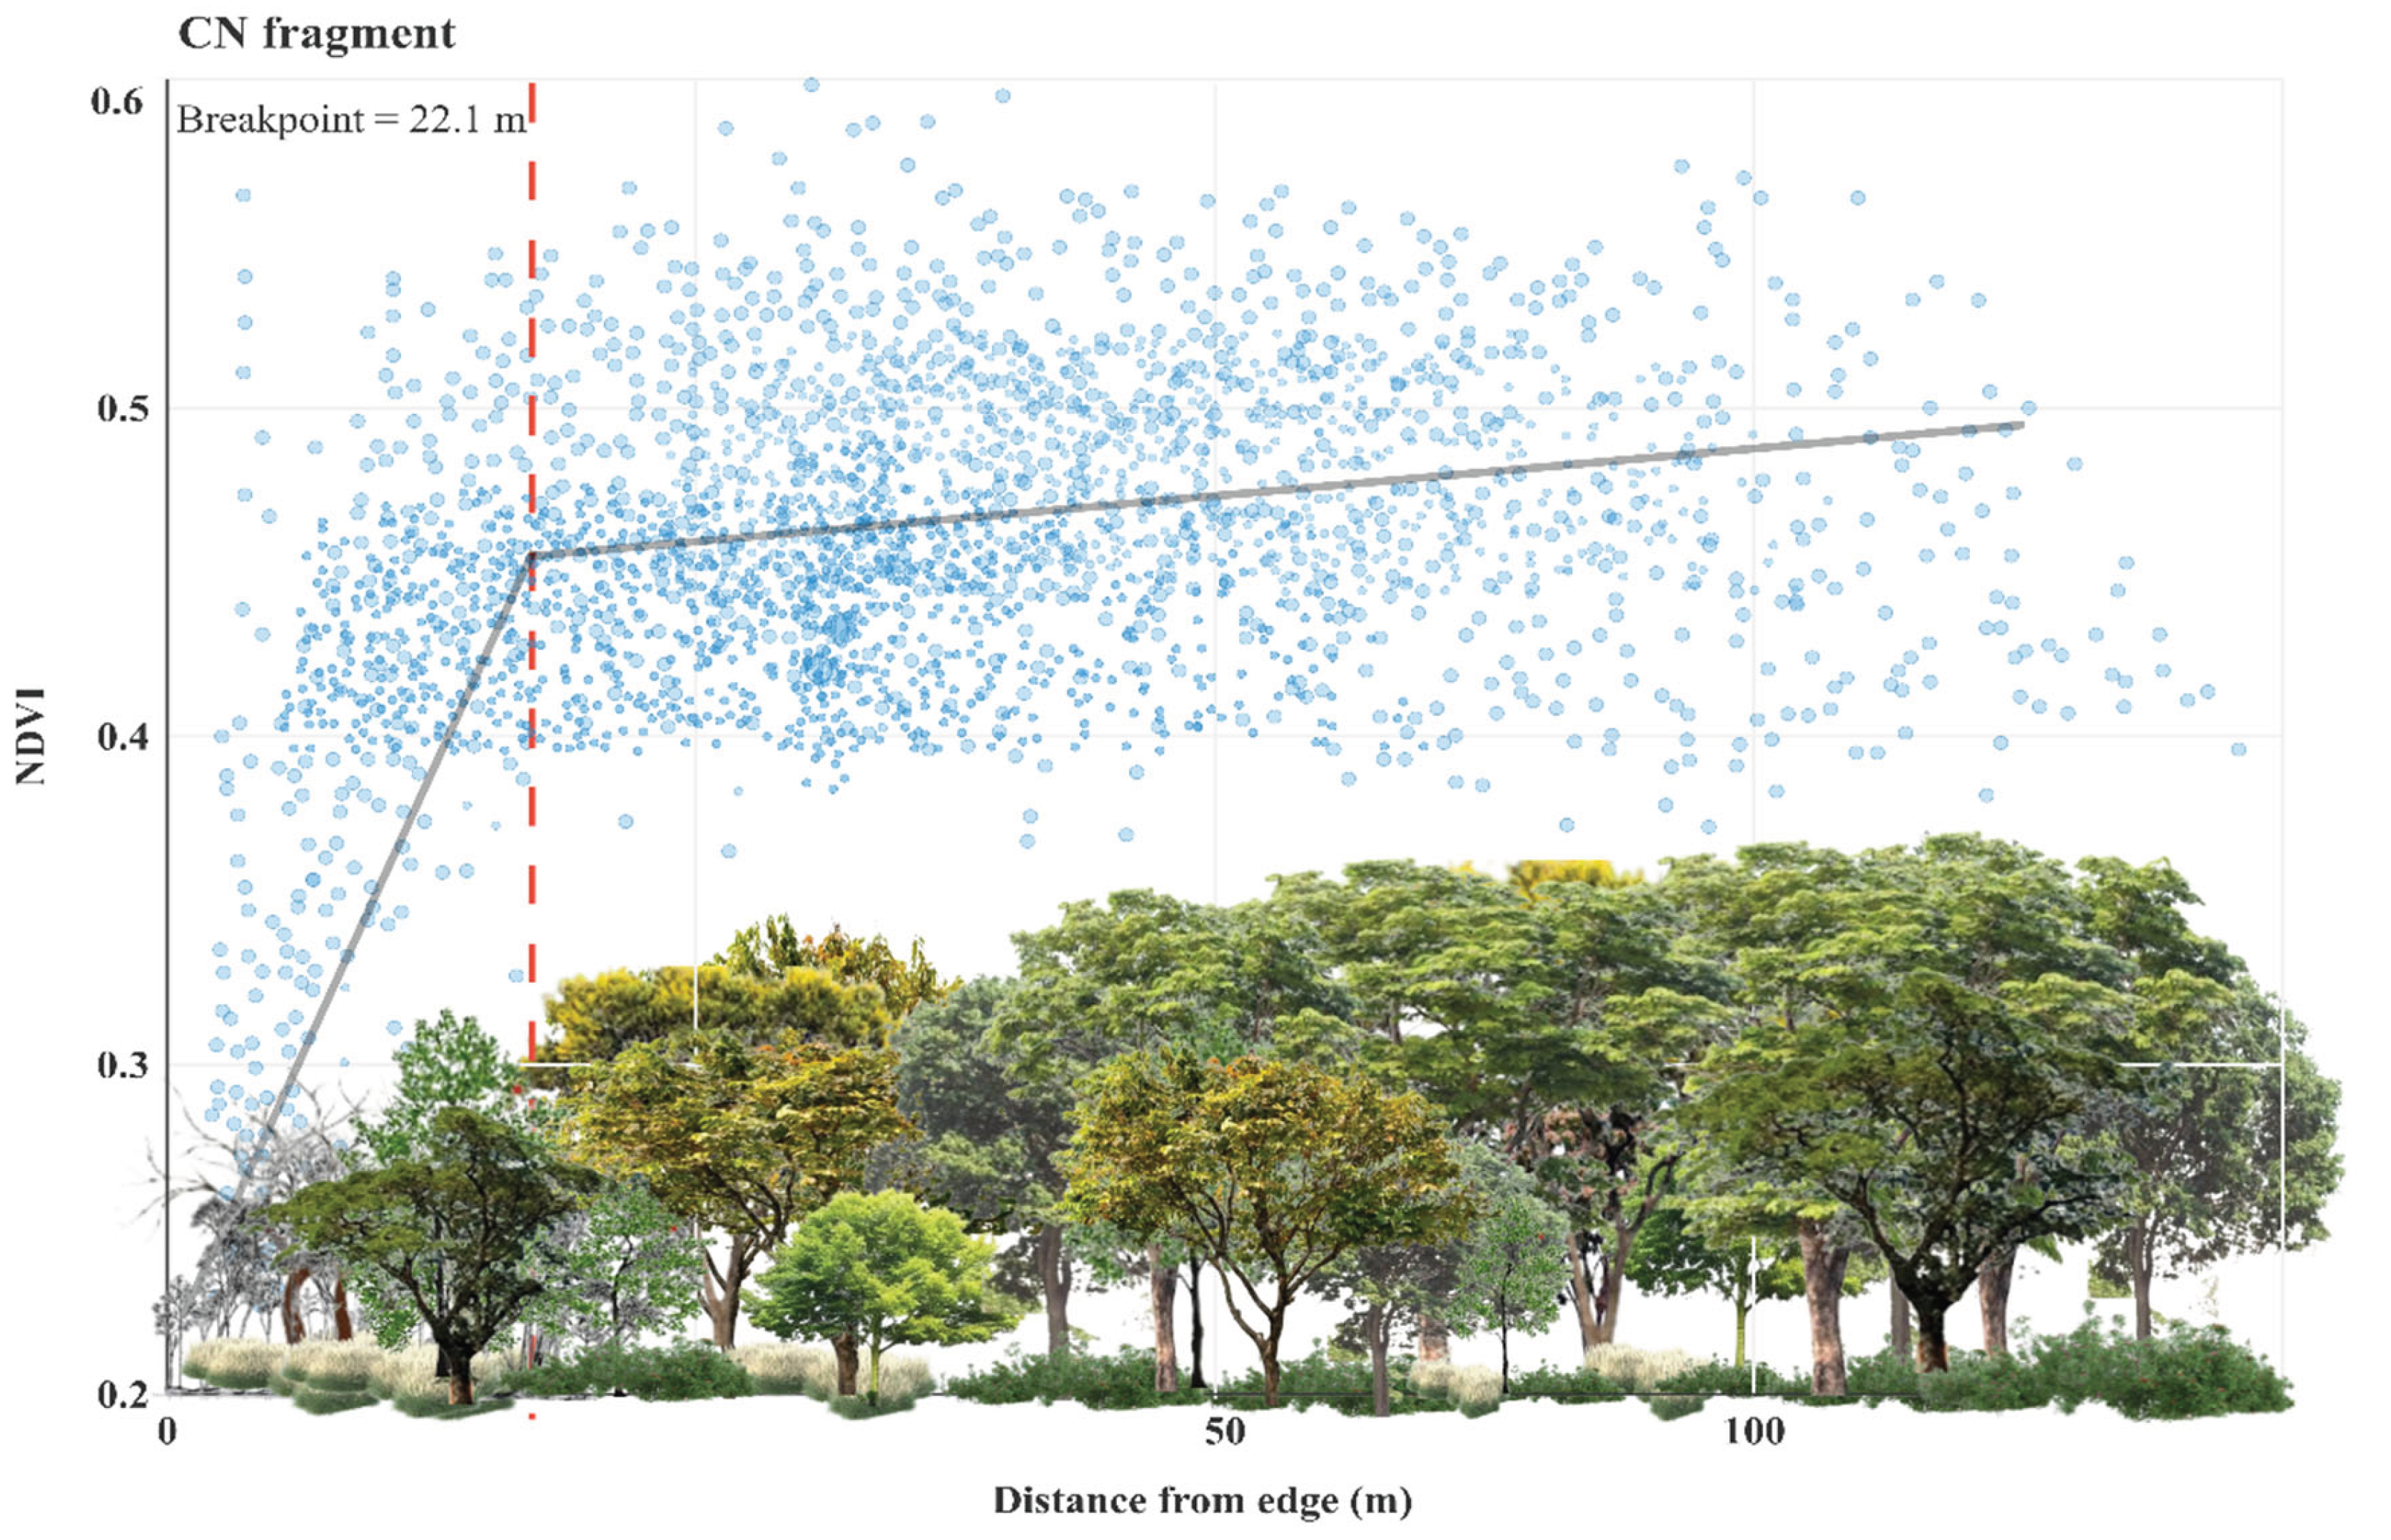
Figure 10.
Pixel-by-pixel segmented modeling of the relationship between NDVI and distance from the edge in the IP fragment. Each point represents a 10 m pixel distributed along the edge-to-interior gradient. The solid line corresponds to the segmented model fit, while the dashed vertical line indicates the estimated breakpoint (38.9 m), interpreted as the average depth of the edge effect. The distribution of points indicates a more gradual structural transition along the edge-to-interior gradient compared to fragments with shallower edge effects.
Figure 10.
Pixel-by-pixel segmented modeling of the relationship between NDVI and distance from the edge in the IP fragment. Each point represents a 10 m pixel distributed along the edge-to-interior gradient. The solid line corresponds to the segmented model fit, while the dashed vertical line indicates the estimated breakpoint (38.9 m), interpreted as the average depth of the edge effect. The distribution of points indicates a more gradual structural transition along the edge-to-interior gradient compared to fragments with shallower edge effects.
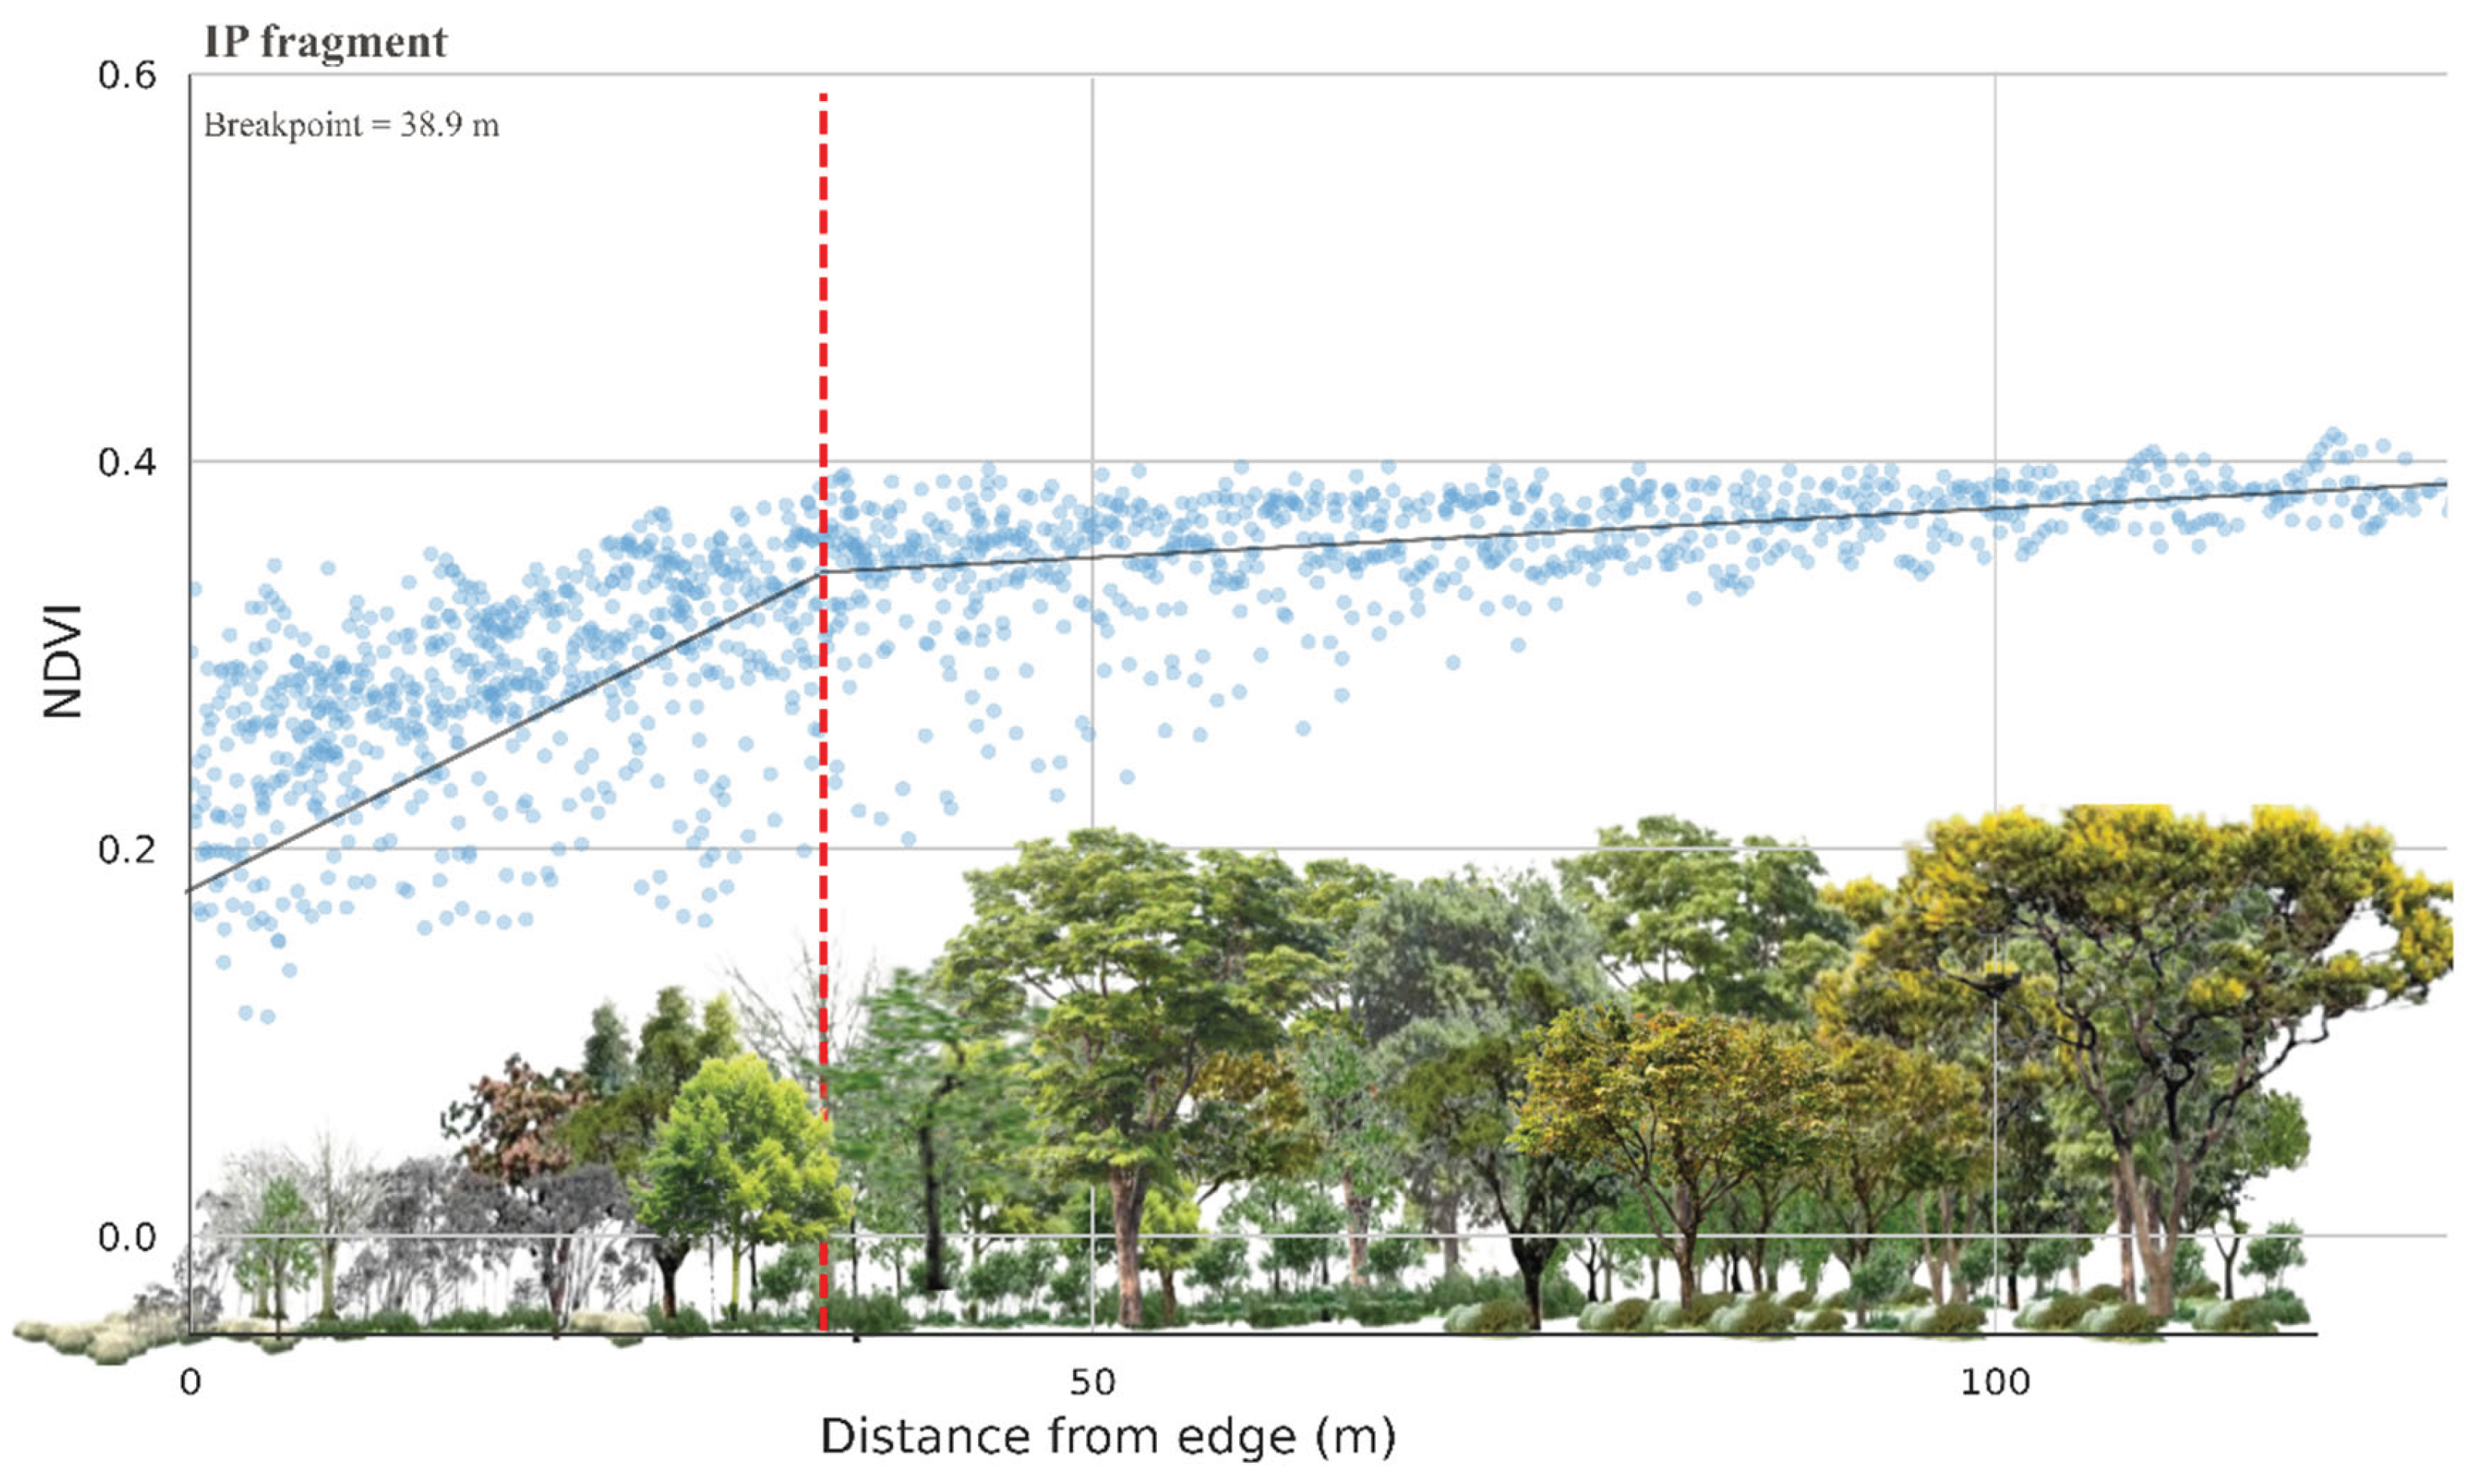
Figure 11.
Internal structural heterogeneity in the CN fragment based on NDVI and NDMI pixel-level classification. (A) NDVI-based vegetation structure classes: degraded area, herbaceous vegetation, intermediate vegetation, dense vegetation, and mature vegetation. (B) NDMI-based relative canopy moisture conditions: drier, typical, and wetter.
Figure 11.
Internal structural heterogeneity in the CN fragment based on NDVI and NDMI pixel-level classification. (A) NDVI-based vegetation structure classes: degraded area, herbaceous vegetation, intermediate vegetation, dense vegetation, and mature vegetation. (B) NDMI-based relative canopy moisture conditions: drier, typical, and wetter.
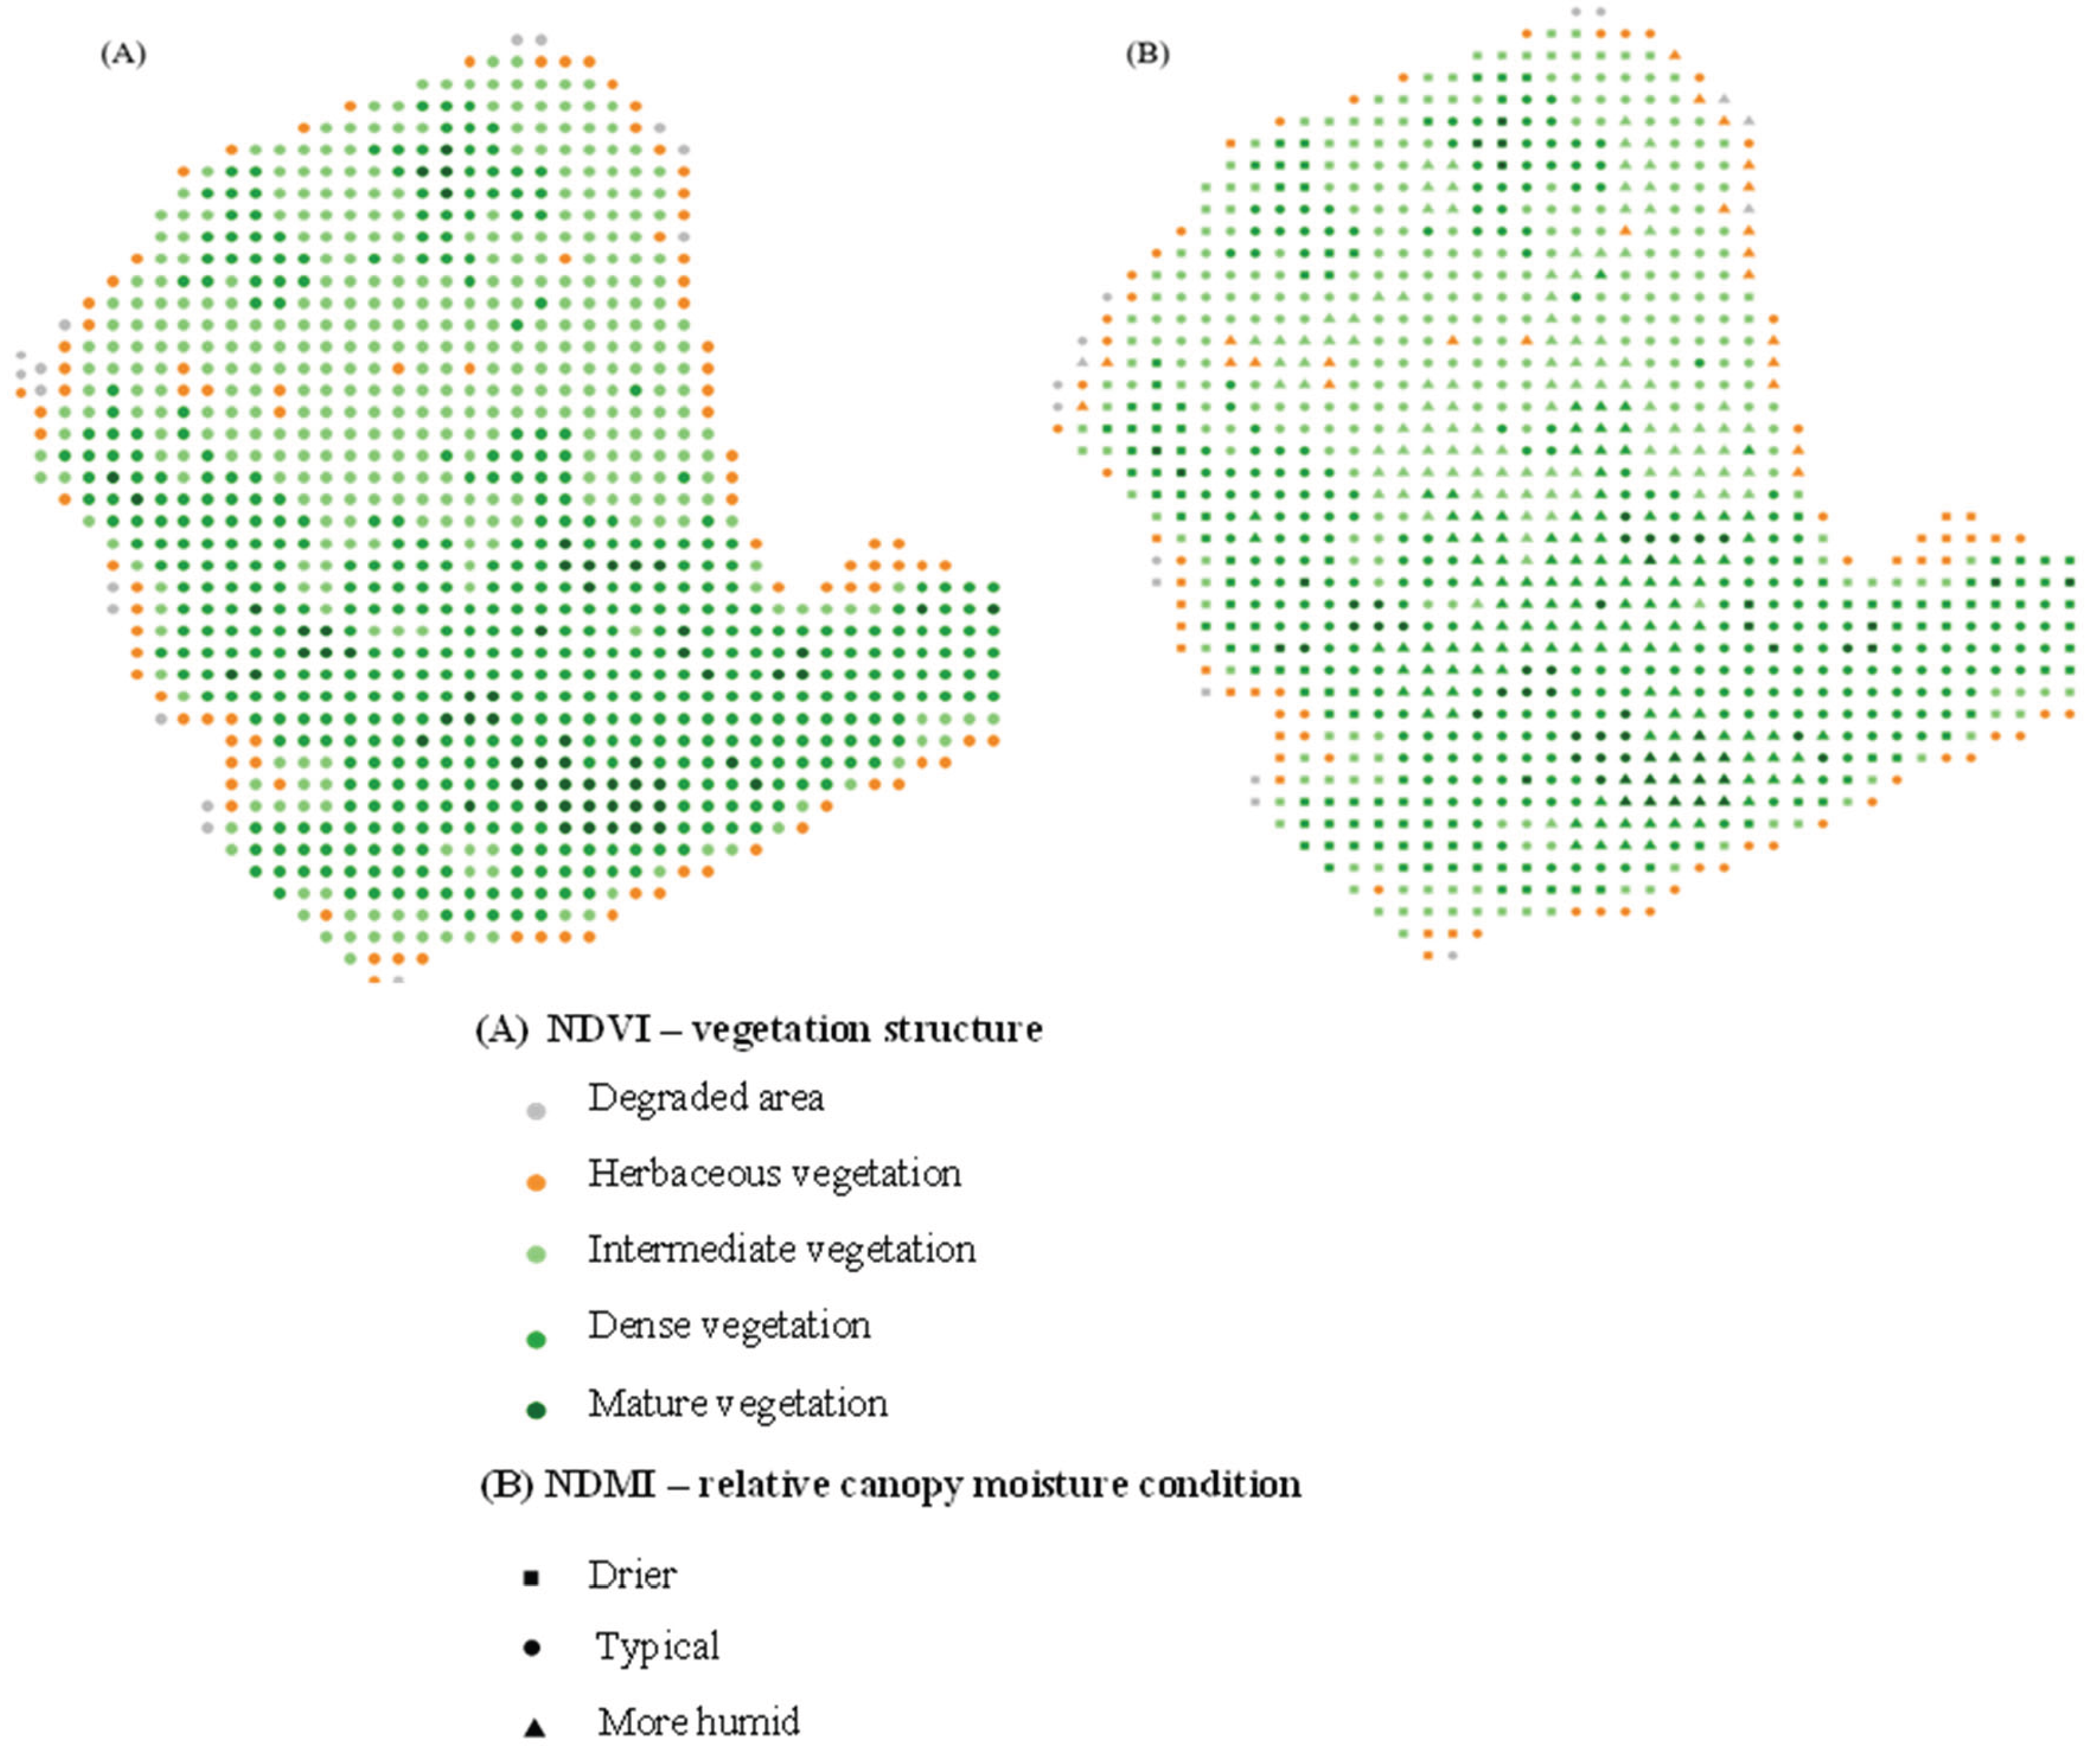

Table 1.
Spatial characterization of the Semideciduous Seasonal Forest (SSF) fragments analyzed in the Brazilian Cerrado.
Table 1.
Spatial characterization of the Semideciduous Seasonal Forest (SSF) fragments analyzed in the Brazilian Cerrado.
| Site code | Location | Area (ha) |
| IP | UEG—Ipameri (GO) | 15.2 |
| AC | Campo Alegre de Goiás (GO) | 21.5 |
| IF | Rural area of Ipameri (GO) | 8.8 |
| CN | Caldas Novas (GO) | 12.2 |
| Panga | Uberlândia (MG) | 403.85 |
Table 2.
Pearson correlation between average basal area per plot (BA) and spectral indices (n = 150).
Table 2.
Pearson correlation between average basal area per plot (BA) and spectral indices (n = 150).
| Spectral Index | r (BA × index) | p-value |
| NDVI | 0.950 | < 0.001 |
| EVI | 0.178 | 0.029 |
| NDMI | 0.803 | < 0.001 |
| VF | 0.728 | < 0.001 |
Note: Pearson correlation coefficients (r) were calculated for n = 150 plots. p-values refer to two-tailed tests. NDMI = Normalized Difference Moisture Index; VF = vegetation fraction.
Table 3.
Breakpoints estimated by segmented regression for basal area (BA) and NDVI at the plot level.
Table 3.
Breakpoints estimated by segmented regression for basal area (BA) and NDVI at the plot level.
| Fragment | Variable | BP (m) | 95% CI (m) |
| AC | BA | 17.1 | 13.3–17.1 |
| AC | NDVI | 15.8 | 14.1–15.8 |
| CN | BA | 29.2 | 14.3–29.2 |
| CN | NDVI | 29.1 | 14.4–29.1 |
| IF | BA | 20.1 | 15.8–21.0 |
| IF | NDVI | 20.4 | 16.2–20.4 |
| IP | BA | 35.0 | 13.1–35.0 |
| IP | NDVI | 35.0 | 4.4–35.0 |
| Panga | BA | 29.3 | −42.2–29.3 |
| Panga | NDVI | 19.2 | −22.6–19.2 |
Note: BP = estimated breakpoint distance; 95% CI = 95% confidence interval. Negative lower confidence limits reflect model uncertainty and should not be interpreted as ecologically meaningful distances.
Table 4.
Pixel-by-pixel breakpoints estimated per fragment with 95% confidence intervals.
| Fragment | Original BP (m) | Bootstrap mean (m) | Standard error | Lower 95% CI | Upper 95% CI |
| IF | 13.57 | 13.05 | 4.40 | 4.78 | 21.66 |
| AC | 14.01 | 13.81 | 1.22 | 10.65 | 15.65 |
| CN | 22.10 | 21.63 | 1.73 | 18.43 | 24.38 |
| IP | 38.85 | 39.64 | 4.26 | 33.48 | 48.74 |
| Panga | 398.01 | 173.71 | 176.45 | 21.16 | 442.39 |
Note: BP = breakpoint. Values indicate the original breakpoint estimate, bootstrap mean, standard error, and 95% confidence interval obtained from 2000 bootstrap iterations. Breakpoints represent the estimated depth of the edge effect from the outer forest edge in each fragment.
Disclaimer/Publisher’s Note: The statements, opinions and data contained in all publications are solely those of the individual author(s) and contributor(s) and not of MDPI and/or the editor(s). MDPI and/or the editor(s) disclaim responsibility for any injury to people or property resulting from any ideas, methods, instructions or products referred to in the content. |
© 2026 by the authors. Licensee MDPI, Basel, Switzerland. This article is an open access article distributed under the terms and conditions of the Creative Commons Attribution (CC BY) license (http://creativecommons.org/licenses/by/4.0/).
Copyright: This open access article is published under a Creative Commons CC BY 4.0 license, which permit the free download, distribution, and reuse, provided that the author and preprint are cited in any reuse.