

Submitted:
11 May 2026
Posted:
12 May 2026
You are already at the latest version
Abstract
Urban mobility planning in smart cities requires sophisticated simulation tools, yet their complexity often creates a technical barrier for non-expert stakeholders. This paper presents a novel architecture that integrates generative artificial intelligence with digital twin technology to create an accessible and robust decision-support system. The framework employs a conversational AI agent based on Gemini 2.5 Flash Lite to interpret natural language intentions and translate them into validated simulation parameters. A critical safety layer, built using Pydantic, ensures that the agent’s stochastic outputs adhere to strict technical schemas and urban logic before execution. The underlying digital twin, developed with SimPy, NetworkX, and OSMnx, features a multi-source data integration strategy that includes demographic density (INE), tourism activity (ISTAC), and high-resolution traffic statistics (TomTom) to calibrate vehicle behavior. The architecture was validated through a Technology Readiness Level (TRL) 4 proof-of-concept in Las Palmas de Gran Canaria, simulating multimodal scenarios including buses, the future MetroGuagua (BRT), and pedestrian flows. Results demonstrate a 95.99% success rate in intent recognition and configuration mapping, with end-to-end execution times under 20 minutes for a 19-hour simulated day. This study demonstrates that LLM-driven orchestration, coupled with automated data pipelines and a decoupled microservice architecture, can democratize access to urban simulation, fostering more inclusive, agile, and evidence-based smart city governance.
Keywords:
smart cities
; digital twin
; generative AI
; urban mobility
; decision support system
; conversational AI
; sustainable mobility
; urban planning
1. Introduction
1.1. Context and Motivation
Urban mobility represents one of the most critical challenges faces by smart cities. As urban populations continue to grow, with projections indicating that 68% of the world’s population will reside in urban areas by 2050 [1], cities face unprecedented pressures on their transportation infrastructure. Traffic congestion, air pollution and energy consumption issues constitute persistent challenges that demand innovative solutions [2]. The concept of smart cities emerges as a comprehensive framework that leverages digital technologies, data analytics, and intelligent systems to address these urban challenges while promoting sustainability, efficiency, and quality of life [3].
In this context, urban mobility planning has evolved from traditional static approaches to dynamic, data-driven methodologies that can accommodate the complexity and variability inherent in modern transportation networks [4]. Decision-makers require tools that not only simulate current conditions but also enable the exploration of alternative scenarios, predict the impact of interventions, and support evidence-based policy formulation [5]. However, traditional simulation and planning tools often present significant barriers: they require specialized technical expertise, involve lengthy configuration processes, and lack the flexibility to rapidly iterate through multiple scenarios [6].
1.2. State of the Art
Recent advances in three distinct technological domains offer promising pathways to address these limitations: digital twin technology, generative artificial intelligence, and conversational AI systems.
1.2.1. Digital Twins for Urban Planning
Digital twins (virtual replicas of physical systems that enable real-time monitoring, simulation, and optimization) have gained substantial traction in urban planning and smart city applications [7]. Urban digital twins integrate heterogeneous data sources including geospatial information, sensor networks, and historical records to create dynamic models of city infrastructure and services [8]. Applications span traffic management [9], energy systems [10], and comprehensive city-scale planning [11].
In the mobility domain specifically, digital twins enable the simulation of multimodal transportation networks, incorporating vehicles, public transit, pedestrians, and emerging mobility services [12]. These systems typically employ agent-based modeling (ABM) frameworks where individual entities (vehicles, passengers) follow defined behavioral rules within a spatial network representation [13]. Tools such as SUMO (Simulation of Urban MObility) [14], MATSim [15], and custom simulation engines built with discrete-event simulation libraries like SimPy have been successfully applied to urban mobility analysis [16].
Despite their sophistication, most digital twin implementations require significant technical expertise for configuration and scenario design, limiting their accessibility to specialized analysts rather than broader stakeholder groups including urban planners, policymakers, and community representatives [17].
1.2.2. Generative AI for Simulation and Urban Design
The emergence of large language models (LLMs) and generative AI has opened new possibilities for automating complex tasks through natural language interaction [18,19]. Recent work has explored the application of generative AI to urban design [20] and scenario generation [21].
Generative models demonstrate particular promise in translating high-level user intentions expressed in natural language into structured system configurations [22]. This capability addresses a critical bottleneck in simulation systems: the translation of domain expertise and planning objectives into technical parameters. Google’s Gemini models, including the Gemini 2.5 Flash variants, represent state-of-the-art multimodal LLMs with demonstrated capabilities in complex reasoning, structured output generation, and tool use [23].
However, the integration of generative AI with domain-specific simulation engines for urban mobility remains largely unexplored. Existing applications tend to focus either on standalone AI assistants for information retrieval or on simulation systems with conventional interfaces, but rarely on deep integration where AI actively configures and controls simulation parameters [24].
1.2.3. Conversational AI for Decision Support
Conversational AI systems, employing natural language processing (NLP) for human-computer interaction, have been successfully deployed across numerous domains including healthcare [25], customer service [26], and business analytics [27]. In the context of decision support systems, conversational interfaces reduce cognitive load, accelerate task completion, and democratize access to complex analytical tools [28].
Several studies have investigated conversational interfaces for urban data exploration [29] and smart city applications [30]. However, these implementations typically provide read-only access to data or simple parameter adjustments, rather than comprehensive configuration management for complex simulation systems. Furthermore, most conversational AI systems for urban applications operate independently from digital twin infrastructures, limiting their capacity to provide actionable insights grounded in rigorous simulation [31].
1.3. Research Gap and Motivation
While substantial progress has been made in each of these three domains independently, a critical gap exists at their intersection. Specifically, there is a lack of integrated architectures that combine:
- 1.
- Digital twin technology for realistic, data-driven simulation of urban mobility systems;
- 2.
- Generative AI for intelligent interpretation of user requirements and automated configuration; and
- 3.
- Conversational interfaces for accessible, natural language interaction with complex simulation systems.
This gap is particularly significant given the pressing need for decision support tools that can be effectively utilized by diverse stakeholders in smart city planning, not only technical specialists but also urban planners, policymakers, and community representatives who may lack programming or simulation expertise [6].
Moreover, existing digital twin frameworks for urban mobility rarely incorporate mechanisms for dynamic reconfiguration based on stakeholder input, limiting their utility in iterative, participatory planning processes that are increasingly recognized as essential for equitable smart city development [32].
1.4. Proposed Approach
This paper addresses the identified gap by presenting a novel integrated architecture that synergistically combines generative AI with digital twin technology for urban mobility simulation and decision support. Our approach employs a conversational AI agent built on the Gemini 2.5 Flash Lite model to enable natural language configuration of simulation parameters, which are then executed on a digital twin constructed using established simulation tools (SimPy for discrete-event simulation, NetworkX and OSMnx for spatial network representation, and GeoPandas for geospatial data processing).
The architecture is designed to support the complete decision support cycle: from data acquisition and processing, through scenario configuration and simulation execution, to visualization and interpretation of results. Critically, the conversational AI agent serves not merely as an interface layer but as an intelligent intermediary that interprets user intentions, validates configuration consistency, and maintains context across multiple interactions.
1.5. Contributions
This work makes the following key contributions to the field of smart cities and urban mobility planning:
- 1.
- Integrated Architecture: We present a novel architecture that seamlessly integrates generative AI with digital twin technology, demonstrating how these complementary technologies can be combined to create more accessible and flexible decision support systems for urban mobility.
- 2.
- Conversational Configuration: We introduce and validate a conversational AI agent capable of interpreting natural language requests, identifying relevant simulation parameters (through entity recognition), and dynamically modifying configuration files, reducing the technical barrier to entry for non-specialist users.
- 3.
- Multimodal Mobility Simulation: We demonstrate the application of our architecture to a realistic multimodal urban mobility scenario incorporating buses, metro systems (MetroGuagua), and pedestrian flows, with explicit consideration of sustainability indicators (environmental, economic, and social dimensions).
- 4.
- Proof-of-Concept Validation: We provide comprehensive documentation and validation of a functional prototype at Technology Readiness Level (TRL) 4, demonstrating technical feasibility in a controlled laboratory environment and establishing a foundation for future development toward operational deployment.
- 5.
- Open and Extensible Design: The modular architecture facilitates integration with diverse data sources, simulation engines, and visualization tools, supporting adaptation to different urban contexts and planning requirements.
1.6. Paper Structure
The remainder of this paper is organized as follows. Section 2 describes the materials and methods, detailing the system architecture, data acquisition processes, digital twin construction, conversational AI implementation, and visualization approach. Section 3 presents the results of our proof-of-concept validation, including specific simulation scenarios and performance metrics. Section 4 discusses the implications of our findings for smart city planning, compares our approach with prior work, and acknowledges current limitations. Section 5 concludes with a summary of key contributions and directions for future research.
2. Materials and Methods
This section presents the comprehensive methodology employed to develop and validate the proposed design. We describe the system architecture, data acquisition and processing pipelines, digital twin construction approach, the implementation of the conversational AI agent, simulation generation mechanisms, and visualization strategies. The implementation follows established software engineering practices for modular, scalable system design appropriate for a Technology Readiness Level (TRL) 4 proof-of-concept.
2.1. System Architecture Overview
The proposed architecture integrates three primary components: (1) a conversational AI agent for natural language configuration, (2) a digital twin simulation engine for multimodal urban mobility modeling, and (3) a visualization layer for interactive exploration of simulation results. Figure 1 presents the high-level system architecture.
The architecture follows a modular design pattern, in which each component operates independently while maintaining well-defined interfaces for data exchange. This modularity facilitates system maintenance, component upgrades, and adaptation to different urban contexts. The system operates primarily in Python 3.11 and is containerized using Docker to ensure reproducibility and deployment consistency across different computing environments.
Cloud infrastructure services (AWS ECS for container orchestration, AWS RDS for PostgreSQL database hosting, and AWS S3 for data storage) provide scalable computational resources and persistent storage, although the current TRL 4 implementation operates in a controlled laboratory environment rather than production deployment.
2.2. Digital Twin Construction
The reliability of a digital twin is intrinsically linked to the quality, diversity, and resolution of its underlying data. In this work, we implemented a multi-source data acquisition strategy that combines open-access institutional repositories with high-resolution private traffic data. This approach ensures that the simulation is not merely a theoretical model but a data-driven representation of the urban dynamics of Las Palmas de Gran Canaria.
2.2.1. Data Sources
The digital twin integrates heterogeneous geospatial and demographic data to describe the urban transportation network and mobility patterns:
- Road Network Data: OpenStreetMap (OSM) provides the street network topology, including road classifications and connectivity. Data is accessed programmatically via the OSMnx Python library [33], which retrieves and processes network data for specified geographic bounding boxes to construct a directed graph representation.
- Public Transit Data (GTFS and Custom): Transit stop locations, line geometries, and official schedules were processed from General Transit Feed Specification (GTFS) datasets provided by the local authority, Guaguas Municipales [34]. Additionally, a custom GeoJSON dataset was developed to represent the future MetroGuagua (BRT) infrastructure, incorporating planned stops and corridors based on official project specifications.
- Demographic and Resident Dynamics (INE): Population density data was obtained from the Spanish National Institute of Statistics (Instituto Nacional de Estadística, INE) at the census tract level (secciones censales). This allows for a high-granularity distribution of resident agents based on residential density.
- Tourism and Temporary Population (ISTAC and OSM): To model tourist flows, we integrated occupancy rates by accommodation type from the INE, complemented by precise geographic locations of hotels from OSM. Furthermore, data on licensed holiday rentals and apartments were retrieved from the Canary Islands Statistics Institute (ISTAC) to ensure a comprehensive mapping of tourist "spawn points".
- Points of Interest (POIs): Over 200 geographically referenced locations of tourist attractions, commercial centers, and activity generators were extracted from OSM using custom importers that query specific amenity types [35]. These served as primary destinations in the agents’ activity agendas, categorized by their profile (resident vs. tourist).
- High-Resolution Traffic Statistics (TomTom): To overcome the limitations of static schedules, we incorporated segment-level traffic data from TomTom. This dataset provides percentiles for vehicle speeds and volumes for every street segment in the city, sampled at 30-minute intervals from 06:00 to 18:00. This enables the simulation to account for historical congestion patterns and realistic vehicle behavior, particularly in areas where transit delays are frequent.
2.2.2. Data Processing and Graph Unification
Raw data undergoes a systematic pipeline to ensure quality and compatibility with the simulation engine. A significant contribution of this research lies in the automated and manual processing required to unify these heterogeneous sources into a single, simulation-ready graph.
Automated Importers and Scalability: For highly dynamic sources such as INE, ISTAC, GTFS, and OSM, we developed modular Python-based importers. These scripts facilitate the periodic update of the digital twin’s baseline, ensuring that any changes in census data or transit schedules can be reflected with minimal manual intervention. This design also ensures that the framework is replicable in other Spanish cities where these standardized open data sources are available.
Spatial and Network Processing: The digital twin represents the urban environment as a geospatially embedded network graph , where N denotes the set of nodes (intersections, stops) and E represents the set of directed edges (road segments). Each edge is associated with attributes:
GeoPandas [37] and Shapely [38] libraries handle geospatial manipulation, including coordinate system transformations and geometric validation. The road network is converted into a directed graph using NetworkX [39]. For each bus and MetroGuagua route, a dedicated subgraph is generated, ensuring that transit agents are constrained to realistic paths.
Transit Route Calibration and Map-Matching: GTFS data is parsed to extract route shapes and sequences. Routes are aligned with the road network graph through map-matching algorithms that project trajectories onto the nearest network edges [40]. One of the most complex tasks involved the spatial alignment of proprietary TomTom traffic segments with the OSMnx network. This unification allows for the assignment of historical speed profiles to each edge. Given that transit vehicles typically exhibit lower average speeds than private cars, we implemented a calibration factor. In traffic-based mode, bus speeds are estimated as of the median speed () reported by TomTom:
This approach significantly improves the realism of the digital twin compared to models that rely solely on GTFS theoretical times, which are frequently unmet in Las Palmas due to urban congestion. The scaling factor was also added to the configuration file to allow users to simulate different scenarios and analyze the impact of changing bus speeds.
2.2.3. Dynamic Entity Modeling
The digital twin incorporates three primary classes of dynamic entities, each governed by specific behavioral rules:
1. Bus Entities: Buses follow predefined routes extracted from GTFS data, adhering to scheduled departure times and stop sequences. The simulation models boarding and alighting processes at each stop, tracking vehicle occupancy dynamically. Bus movement between stops incorporates:
- Schedule Adherence: Buses attempt to maintain scheduled arrival times but may experience delays due to traffic conditions (modeled as stochastic edge traversal times).
- Capacity Constraints: Each bus has a maximum passenger capacity. If a bus reaches capacity, waiting passengers must wait for the next service.
- Dwell Time: Time spent at stops depends on the number of passengers boarding and alighting, following empirical distributions derived from transit operations literature [41].
2. MetroGuagua Entities: The MetroGuagua (a bus rapid transit system) operates similarly to conventional buses but with higher frequencies, dedicated lanes (modeled as edges with reduced travel times), and larger capacities. MetroGuagua routes are treated as high-priority corridors in the network graph.
3. Pedestrian Agents: Pedestrians are modeled as autonomous agents with individualized origin-destination pairs, behavioral profiles (tourist vs. local resident), and activity schedules. Pedestrian movement incorporates:
- Route Choice: Pedestrians select routes based on shortest path algorithms (Dijkstra’s algorithm implemented in the NetworkX library) considering walking distance.
- Mode Choice: When pedestrians decide to visit a Point of Interest (POI), they decide whether to board available services based on factors including destination proximity and distance to transit stops.
- Activity Scheduling: Pedestrian agents have time-dependent activity patterns (visiting POIs, commuting) that influence their spatial-temporal trajectories.
2.2.4. Discrete-Event Simulation Engine
The digital twin employs SimPy [16], a process-based discrete-event simulation (DES) framework in Python, to orchestrate entity behaviors and interactions. In DES, the simulation advances through discrete events (e.g., bus departure, passenger boarding, agent arrival at destination) rather than continuous time steps, improving computational efficiency for large-scale scenarios.
SimPy’s environment manages the simulation clock, schedules events, and resolves resource contention (e.g., multiple agents competing for limited bus capacity). Each entity is implemented as a SimPy process that yields control to the simulation engine during waiting periods or resource acquisition attempts.
The simulation operates over a configurable time horizon (typically representing a full day of urban activity, e.g., 05:00 to 24:00) with a temporal resolution sufficient to capture meaningful mobility dynamics while maintaining computational tractability. All entity states (positions, occupancies, delays) are logged at configurable intervals for subsequent analysis.
2.2.5. Optimization and Pre-computation
To achieve the execution times required for an interactive decision-support system, several parameters are pre-calculated using the baseline configuration. This includes the generation of arrival/departure matrices for every stop under both schedule-based and traffic-based scenarios. Pre-computing these temporal variables, reduced the computational overhead during simulation execution, allowing 19-hour simulations to be processed in minutes.
2.2.6. Quality Assurance and Architectural Readiness
The pipeline includes automated routines to detect errors in the matching process between different graph sources (e.g., disconnected transit stops or misaligned segments). For data consistency, Pydantic [42] schemas are employed to enforce strict type checking and validation, particularly for the configuration files generated by the conversational AI agent. This ensures that parameters such as frequencies (integers), capacities, and probability distributions (which must sum to 1.0) are valid before simulation execution.
While the current TRL 4 implementation handles the high-volume TomTom traffic data through specialized manual pre-processing, the architecture is designed to support real-time data streams. The internal data structures and API endpoints are prepared to transition toward live sensor integration (e.g., traffic cameras or GPS feeds), representing a primary direction for future operational scaling and real-time analytics.
2.2.7. Data Management and Infrastructure
All processed data and simulation results are stored in a PostgreSQL database with PostGIS extensions for spatial queries, hosted on AWS RDS. This centralized repository facilitates efficient data access and supports version control for different simulation scenarios, providing a scalable foundation for the digital twin infrastructure.
2.3. Conversational AI Agent for Configuration
2.3.1. Natural Language Processing Architecture
The conversational AI agent serves as the primary user interface, enabling urban planners and decision-makers to configure simulation scenarios through natural language dialogue rather than manual editing of configuration files or programming. The agent is built upon Google’s Gemini 2.5 Flash Lite model [23], a Large Language Model (LLM) optimized for efficient inference with strong reasoning and instruction-following capabilities (see Figure 2 and Figure 3).
The agent makes use of four primary capabilities:
1. Intent Recognition: The agent analyzes user utterances to identify the underlying intent (e.g., modifying bus frequencies, adjusting MetroGuagua capacity, offering results). Intent recognition leverages Gemini’s in-context learning capabilities, where the system prompt provides examples of intent-query mappings.
2. Named Entity Recognition (NER): For configuration modification requests, the agent extracts relevant entities including:
- Parameter names (frequency, capacity, etc.)
- Parameter values (numeric quantities, temporal expressions)
- Scope identifiers (specific points of interest, vehicle types, or system-wide changes)
NER is performed through structured output generation, where Gemini is prompted to return JSON-formatted entity extractions rather than free-form text responses [22].
3. Configuration Management: Extracted entities are validated against predefined schemas (using Pydantic) and applied to the simulation configuration file (YAML format). The agent maintains a conversational context allowing users to iteratively refine configurations through multi-turn dialogues.
4. Response Generation: The agent generates natural language confirmations of applied changes, explanations of system capabilities, and guidance for next steps. Response generation is contextualized by the current configuration state and conversation history, as shown in Figure 3.
2.3.2. Conversational Interface Implementation
The conversational interface is implemented using Chainlit [43], a Python framework for building production-ready conversational AI applications. Chainlit provides:
- Session Management: Persistent conversation histories that enable context-aware interactions across multiple user queries.
- Streaming Responses: Progressive display of agent responses as they are generated, improving perceived responsiveness.
- Rich Media Support: Display of structured data (configuration previews), images (results visualizations), and file downloads (simulation outputs).
The frontend interface, developed with React and TypeScript, communicates with the Python backend via RESTful API endpoints. This separation of concerns follows modern web application architecture patterns, facilitating independent development and testing of frontend and backend components.
2.3.3. Prompt Engineering and System Instructions
The effectiveness of the conversational agent depends critically on carefully designed system prompts that define the agent’s role, capabilities, and behavioral guidelines. The system prompt includes:
- 1.
- Role Definition: Clear specification that the agent is a specialized assistant for urban mobility simulation configuration, not a general-purpose chatbot.
- 2.
- Domain Knowledge: Contextual information about the simulation system’s capabilities and parameter constraints.
- 3.
- Output Format Instructions: Explicit templates for structured outputs (JSON schemas for entity extraction, YAML formatting for configuration updates).
- 4.
- Safety and Validation Guidelines: Instructions to validate user requests against system constraints and to alert users to potentially problematic configurations (e.g., the sum of the probabilities of visiting the different POIs for the simulated agents is above one and the configuration needs to be revised).
The system prompt is version-controlled and subject to iterative refinement based on the evaluation of the agent performance across various user queries.
2.4. Simulation Generation
2.4.1. Simulation Execution Workflow
Once the user confirms a configuration via the conversational agent, the simulation execution workflow proceeds as follows:
Step 1: Configuration Loading: The validated YAML configuration file is parsed and converted into Python data structures representing simulation parameters (vehicle schedules, capacities, pedestrian population sizes, temporal boundaries).
Step 2: Entity Initialization: Based on configuration parameters, the simulation engine instantiates entity objects:
- Bus and MetroGuagua vehicles are created according to scheduled service patterns.
- Pedestrian agents are generated with stochastic origin-destination pairs sampled from distributions defined by POI locations and population density estimates.
Step 3: Event Scheduling: Initial events (vehicle departures, pedestrian activity starts) are scheduled in the SimPy environment’s event queue.
Step 4: Simulation Loop: The SimPy environment processes events in chronological order, advancing the simulation clock. At each event:
- Entity states are updated (positions, occupancies).
- New events are scheduled (next stop arrivals, passenger arrivals).
- Interactions are resolved (boarding decisions, capacity constraints).
Step 5: Data Logging: Throughout the simulation, state variables are logged to capture:
- Vehicle trajectories (sequence of edge traversals with timestamps).
- Occupancy levels (passenger counts at each stop and along route segments).
- Pedestrian paths (origin, destination, mode choices, travel times).
- System-level metrics (total vehicle-kilometers traveled, kilometers traveled, average wait times).
Step 6: Output Generation: Upon simulation completion, logged data is post-processed and exported in formats suitable for visualization and analysis.
2.4.2. Asynchronous Simulation Management
To accommodate potentially long-running simulations without blocking user interactions, the system implements asynchronous task execution using AWS Fargate (ECS). When a simulation is initiated:
- 1.
- A unique simulation ID is generated and returned immediately to the user.
- 2.
- The simulation task is dispatched to a Fargate container where it executes independently.
- 3.
- The user can query simulation status via the conversational agent using the simulation ID.
- 4.
- Upon completion, results are packaged and made available for download as compressed archives (ZIP format containing GeoJSON and Excel files).
This architecture prevents interface freezing during computation and supports concurrent execution of multiple simulation scenarios.
2.5. Visualization and Decision Support
2.5.1. Geospatial Visualization with Kepler.gl
Simulation outputs are visualized using Kepler.gl (see Figure 4), an open-source geospatial analysis tool developed by Uber [44]. Kepler.gl provides:
- Multi-layer Rendering: Simultaneous display of multiple geospatial datasets (road networks, bus routes, pedestrian flows) as distinct layers with customizable styling.
- Temporal Animation: Time-series data (vehicle trajectories over the simulation period) can be animated to visualize traffic dynamics and congestion patterns.
- Interactive Filtering: Users can filter data by attributes (e.g., vehicle type, occupancy level, time of day) to focus analysis on specific subsets.
- Data Aggregation: Spatial aggregation functions (e.g., hexagonal binning) summarize point-level data into regional statistics, revealing spatial patterns in mobility demand.
Simulation outputs are exported as GeoJSON files, a widely-supported standard for encoding geographic features with associated properties. Each GeoJSON file contains:
- Geometry: LineString geometries for vehicle/pedestrian trajectories, point geometries for stops and POIs.
- Properties: Attributes including entity IDs, timestamps, occupancy levels, route identifiers, and sustainability indicators.
It is important to note that the system is still not fully integrated with FourSquare or other Kepler.gl providers. Users manually upload GeoJSON files to the platform through a web interface, where they can interactively explore results and generate custom visualizations tailored to specific decision-making questions.
2.6. Implementation Technologies and Infrastructure
Table 1 summarizes the key technologies and infrastructure components employed in the system implementation.
2.7. Validation Approach
Given the TRL 4 status of this proof-of-concept, validation focuses on demonstrating technical feasibility and functional correctness in a controlled laboratory environment rather than comprehensive real-world performance evaluation. Full validation with real-world mobility data, stakeholder engagement studies, and operational deployment would be addressed in subsequent TRL phases (TRL 5-7).
3. Results
This section details the experimental validation of the proposed generative AI-driven digital twin architecture. The evaluation focuses on the technical feasibility of the system, its functional robustness as a decision-support tool, and the efficiency of the conversational interface in managing complex urban mobility simulations. Rather than focusing solely on mobility outcomes, the presented results emphasize seamless integration of large language models (LLMs) with discrete-event simulation (DES) engines. The validation is structured to assess the accuracy of the conversational agent in parameter mapping, the reliability of the validation layer, and the overall performance metrics of the decoupled architecture.
3.1. Case Study: Las Palmas de Gran Canaria
The system was validated using a case study focused on Las Palmas de Gran Canaria, a major European mid-sized and the capital city of Gran Canaria in the Canary Islands, Spain. Las Palmas presents an ideal testbed for urban mobility analysis due to several challenges and structural characteristics:
- Complex Morphological and Linear Constraints: The city exhibits a pronounced linear morphology and includes a prominent northern peninsula that hosts the industrial harbor, residential areas, and major tourist attractions. This geographic configuration concentrates most north–south transit flows into a limited number of critical corridors, particularly the isthmus connecting the peninsula to the mainland. As a result, simulating new transit systems such as the MetroGuagua is especially relevant for congestion management.
- Tourist-Resident Dynamics: The city manages two overlapping mobility layers: a stable resident population of approximately 380,000 people and a high tourist influx with distinct travel patterns and preferences.
- Multimodal Public Transit System: The current infrastructure relies on an extensive bus network. The ongoing implementation of the MetroGuagua (a high-capacity system with dedicated lanes and metro-like frequencies) provides a perfect "what-if" scenario for our architecture, as it requires planners to reconfigure existing bus lines and evaluate multimodal connectivity.
- Standardized Data Availability: The choice of this city is also strategic for its adherence to Spanish and European data standards. By mainly using open data, the case study serves as a blueprint for replicability across other Spanish and European municipalities.
The study area encompasses the central urban core, covering approximately 100 km. The digital twin represents a network of more than 40 active bus routes and the planned 12 km MetroGuagua line, comprising 20 dedicated stops [45]. For the purposes of this validation, we simulated a standard 19-hour operational day (05:00 to 24:00), allowing for the observation of peak-hour dynamics and transition periods. This scenario provides enough complexity to test whether the conversational agent can interpret high-level planning instructions and translate them into a valid, executable simulation configuration.
3.2. Validation of Conversational Configuration
A primary objective of this validation was to demonstrate the conversational AI agent’s capability to interpret natural language requests and correctly modify simulation parameters. We conducted structured tests that encompassed not only common configuration tasks that urban planners might perform, but also typical error scenarios. During the development of the system, we also consulted with a team from a public municipal entity to ensure practical relevance and alignment with real-world needs.
3.2.1. Example Interaction 1: Viewing Current Configuration
User: “Show me the current configuration settings.”
Agent Response: The agent successfully retrieved and displayed the YAML configuration file content, presenting key parameters including:
- Bus service frequency: 10 minutes (peak), 15 minutes (off-peak)
- MetroGuagua service frequency: 5 minutes (peak), 8 minutes (off-peak)
- Bus capacity: 80 passengers
- MetroGuagua capacity: 150 passengers
- Simulation temporal bounds: 05:00–24:00
The agent formatted the configuration in a human-readable structure with clear labeling of parameter categories (POI opening hours, specifications by vehicle type, temporal settings, etc.).
3.2.2. Example Interaction 2: Modifying Service Frequency
User: “Increase the MetroGuagua frequency to every 10 minutes.”
Agent Processing:
- 1.
- Intent Recognition: Identified modification intent.
- 2.
-
Entity Extraction:
- Target parameter: metroguagua.frequency.
- New value: 10 minutes.
- Scope: MetroGuagua frequency only.
- 3.
- Configuration Update: Modified YAML file to set frequency inside the metroguagua section to 10.
- 4.
- Confirmation: “I have updated the MetroGuagua frequency to 10 minutes. The new setting will be applied in the next simulation run.”
Validation confirmed that the YAML file was correctly modified, and subsequent simulation execution used the updated parameter.
3.2.3. Example Interaction 3: Complex Multi-Parameter Adjustment
User: “I want to test a scenario where buses run less frequently but have higher capacity. Set bus frequency to 20 minutes and capacity to 100 passengers.”
Agent Processing:
- 1.
- Recognized compound modification intent affecting two parameters.
- 2.
-
Extracted entities:
- buses.frequency: 20
- buses.capacity: 100
- 3.
- Applied both modifications atomically (ensuring configuration consistency).
- 4.
- Confirmed: “Configuration updated: Bus frequency set to 20 minutes, capacity increased to 100 passengers.”
Table 2 summarizes the conversational agent’s performance across 50 structured test queries covering diverse interactions with the configuration and simulation engine of the digital twin.
The agent demonstrated strong performance in interpreting user intentions and correctly extracting entities. Errors primarily occurred in ambiguous queries lacking explicit parameter names (e.g., ’make buses run faster’ without specifying whether to adjust frequency or speed limits). In such cases, the agent requested clarification rather than making incorrect assumptions, which is the desired behavior for safety-critical configuration management. It also handled out of scope requests, like adding new vehicle types or trying to modify the bus itineraries.
3.3. System Performance and Computational Efficiency
A critical component of the architecture is the safety/validation layer implemented via Pydantic. This layer ensures that the stochastic nature of the LLM does not result in broken simulations. During the testing phase, the system monitored the types of errors caught by the validator before the simulation was triggered.
The most frequent validation triggers were:
- 1.
- Type Consistency: Attempting to pass string values to integer fields (e.g., "high" as maximum bus capacity).
- 2.
- Probability Constraints: Ensuring that the sum of probabilities for POI visits does not exceed . This was the most usual case, since most times the user does not know that, in order to increase the probability of agents visiting a group of POIs, it is needed to reduce the probability of other groups.
- 3.
- Domain Bounds: Restricting parameters like the speed ratio of buses vs other vehicles to a logical range of .
This decoupled approach allows the simulation API to remain agnostic of the AI’s internal state, receiving only verified and sanitized YAML configurations.
3.4. System Performance and Computational Efficiency
To assess the practical utility for urban planners, we measured the end-to-end time of the "what-if" cycle to assess the computational performance of the system and evaluate its scalability potential. The metrics were averaged over 5 full simulation runs (simulating a standard 19-hour operational day).
- Simulation Execution Time: Average execution time for a full 19-hour simulation: 14.2 minutes (SD = 2.1 min) on AWS Fargate containers with 2 vCPUs and 4 GB RAM.
- Conversational Agent Latency: Average response time for configuration queries: 3.8 seconds. Parameter modification confirmation: 6.3 seconds (including YAML file I/O).
- Visualization Loading: Kepler.gl visualization load times: 10–20 seconds for datasets with more than 50,000 trajectory points using the default FourSquare account settings.
These performance characteristics indicate that the system operates within acceptable latency bounds for interactive use by urban planners, supporting iterative scenario exploration without prohibitive wait times.
4. Discussion
This section interprets the results presented in Section 3, analyzes the implications of the integrated AI-digital twin architecture for smart city planning, compares the proposed approach with prior work, and acknowledges the limitations inherent to this TRL 4 proof-of-concept.
4.1. Interpretation of Results
The validation results demonstrate that the proposed generative AI-driven digital twin architecture successfully addresses key challenges in urban mobility planning through three primary mechanisms: accessibility enhancement, flexibility in scenario exploration, and evidence-based decision support.
4.1.1. Accessibility Through Natural Language Interaction
The conversational AI agent achieved a 95.99% success rate in interpreting and executing configuration modification tasks, demonstrating that natural language interfaces can effectively democratize access to sophisticated simulation tools. This finding is particularly significant given that traditional digital twin platforms require specialized technical expertise in programming, geospatial analysis, and simulation modeling [17]. By abstracting technical complexity behind a conversational interface, the system enables urban planners, policymakers, and domain experts without computational backgrounds to directly engage with simulation-based analysis.
A key factor in this success is the integration of Pydantic as a validation layer. Although LLMs are inherently stochastic, the system ensures that the agent’s output is strictly mapped to the required technical schemas before any tool is executed. The observed failure cases (5.4% of queries) occurred primarily in ambiguous requests. Importantly, the agent’s behavior, requesting clarification before acting, aligns with responsible AI principles for safety-critical applications [46]. This prevents potentially harmful misconfigurations that could lead to invalid simulation results.
4.1.2. Flexibility in Scenario Exploration
The ability to rapidly configure and execute diverse scenarios represents a substantial improvement over conventional planning workflows. Traditional approaches often involve manual editing of configuration files and lengthy data preprocessing, processes that can take hours and are prone to human error [6]. In contrast, the proposed architecture enabled scenario modifications to be specified, validated, and executed within minutes, supporting iterative exploration of the urban mobility design space.
This speed allows for an iterative exploration of trade-offs between environmental sustainability, economic efficiency, and social equity. For instance, testing the impact of MetroGuagua frequencies against conventional bus service quality becomes a matter of minutes, facilitating a future use of multi-objective decision support tools that make these relationships transparent to stakeholders [47].
4.1.3. Evidence-Based Decision Support
The integration of diverse data sources, ranging from INE census data and ISTAC tourism statistics to OSM infrastructure, provides a robust baseline for evidence-based decisions. By using standardized open data formats, the architecture proves to be highly replicable across other Spanish and European cities.
The simulation results, such as identifying accessibility gaps (e.g., limit the distance pedestrians are willing to walk to transit stops), transform raw open data into actionable insights. This capability allows planners to assess whether proposed interventions, such as the introduction of the MetroGuagua corridor, contribute meaningfully to city-wide sustainability and equity targets [48]. It can also help identify specific geographic areas where additional transit stops, demand-responsive services, or pedestrian infrastructure improvements could enhance equity. Without simulation-based analysis, such service gaps might remain undetected until after infrastructure investments are made, when remediation is more costly [49].
4.2. Value of the Integrated Architecture
The integration of generative AI with digital twin technology creates a complementary system in which each component enhances the other’s capabilities. The conversational AI layer transforms the digital twin from a passive simulation tool into an interactive environment by interpreting high-level planning objectives and translating them into executable parameters. This process is constrained through schema validation mechanisms, ensuring logical consistency and reducing the risk of erroneous outputs while preserving the flexibility of natural language interaction [22].
At the same time, the digital twin grounds AI-generated configurations in physical and behavioral realities, enforcing constraints such as network topology, vehicle capacity, and traffic dynamics. This prevents plausible but inaccurate suggestions and ensures that outputs remain empirically valid [50]. Together, this integration enables a closed-loop decision support process in which planners iteratively define goals, simulate outcomes, and refine strategies. By significantly accelerating this feedback cycle compared to traditional methods, the system aligns with participatory planning approaches while improving efficiency and responsiveness [51].
4.3. Comparison with Prior Work
The proposed architecture extends prior research in digital twins, urban AI, and conversational systems by integrating these domains into a unified, accessible framework. Traditional urban mobility digital twins, such as those based on SUMO [14] or MATSim [15], offer strong simulation capabilities but typically require technical expertise and manual configuration. Even more advanced implementations, including Virtual Singapore [52], rely on conventional interfaces that can limit accessibility. In contrast, this approach leverages a conversational interface powered by large language models, combined with automated pipelines based on open data sources (e.g., INE, OSM, GTFS), enabling more flexible interaction while improving replicability across municipalities.
Within the broader landscape of AI in urban planning, existing approaches often focus on predictive analytics or generative design [4,20], frequently operating as opaque “black-box” systems. Here, AI is instead positioned as an orchestration layer that translates user intent into validated simulation configurations. The incorporation of schema validation mechanisms ensures that generated outputs remain technically consistent, preserving human oversight while reducing barriers to use [53]. This paradigm also advances the role of conversational AI, which has seen limited application in urban planning beyond data querying tools such as Urban Data Explorer [29], by enabling the management of complex, stateful simulation workflows rather than simple query-response interactions.
These contributions have several implications for smart city development. By lowering technical barriers, the system supports more inclusive participation in planning processes, aligning with principles of collaborative governance [32]. Its ability to rapidly generate and evaluate scenarios facilitates more adaptive and iterative policymaking in dynamic urban contexts [5]. At the same time, reliance on standardized open data enhances transparency and reproducibility, supporting evidence-based decision-making and cross-city comparability [51]. Finally, the system’s modular, API-driven design provides a foundation for future real-time digital twin implementations, where integration with live urban data streams could enable responsive, operational decision support in evolving city environments [12].
4.4. Principal Findings and Implications for Smart City Development
The validation study yielded several key findings with implications for smart city planning:
- Democratization through Accessibility: Natural language interfaces effectively lower the technical barriers to sophisticated urban planning tools. The conversational agent enables non-technical users to configure and trigger complex simulations, a task that traditionally required specialized programming expertise in simulation frameworks and geospatial analysis.
- Replicability through Open Data: A major strength of the architecture is its reliance on standardized data sources such as OSM, GTFS, and the Spanish INE. This ensures that the methodology is not only robust for the case study of Las Palmas but also highly replicable across other Spanish and European cities, facilitating a standardized approach to data-driven urban management.
- Quantifiable Trade-offs for Decision Support: While urban planning involves inherent conflicts between objectives (e.g., service frequency vs. operational costs), our system provides the evidence needed to make these trade-offs explicit. By allowing planners to compare scenarios, such as the impact of the MetroGuagua corridor on existing bus lines, the digital twin supports more informed and transparent decision-making processes.
- Identification of Social Equity Gaps: The high spatial granularity of the simulation allows for the detection of accessibility gaps. By analyzing pedestrian flows and transit proximity, the system can identify neighborhoods falling below critical service thresholds (e.g., imposing a walking limit). This capability is vital for ensuring that smart city interventions promote social equity before infrastructure is physically deployed.
- Agile Iteration and Exploration: The efficiency of the system—capable of processing a 19-hour urban day in less than 20 minutes—supports an agile policymaking cycle. This rapid iteration allows planners to explore a vast design space of ’what-if’ scenarios, identifying robust strategies that can adapt to changing urban conditions.
The validated architecture demonstrates that generative AI and digital twin technology can be integrated to create decision support tools that are simultaneously sophisticated, accessible, and actionable. This combination addresses a critical barrier to smart city development: the gap between data-driven insights and practical implementation.
By enabling broader participation in planning processes, the system aligns with principles of inclusive governance and can lead to mobility policies that better reflect diverse community needs [32]. Furthermore, by providing evidence-based analysis of sustainability impacts, the system supports cities in achieving climate, economic, and equity goals.
4.5. Limitations and Future Work
As a TRL 4 proof-of-concept, this work demonstrates technical feasibility in a controlled environment but possesses specific limitations that outline the roadmap for future operational deployment in the Smart City ecosystem.
The proposed system presents several limitations and opportunities for improvement related to data quality, simulation fidelity, scalability, user evaluation, and governance. The simulation relies on publicly available data sources such as OpenStreetMap (OSM) and GTFS, which, although comprehensive, may include inaccuracies or omissions. OSM coverage varies across regions, and GTFS data represents scheduled rather than actual service conditions [33]. For operational deployment, integration with higher-quality and continuously updated data sources, such as real-time vehicle tracking, automated passenger counting systems, and validated geospatial datasets maintained by transportation authorities, would be essential. The current decoupled architecture is designed to accommodate such real-time data streams from urban sensors. Additionally, the use of synthetic pedestrian populations simplifies real-world mobility demand. While agent-based modeling can capture heterogeneous travel behaviors [36], accurate calibration requires extensive empirical data, including travel surveys, mobile phone records, and transit smart card data, which were not available for this proof-of-concept. Future efforts should therefore prioritize data-driven calibration and validation against observed mobility patterns.
In terms of simulation fidelity, the digital twin incorporates simplifying assumptions to ensure computational tractability. For example, the Vbus calibration factor (0.7 × Vmedian) serves as a practical heuristic at TRL 4 but does not capture micro-scale influences such as weather conditions, driver behavior, or intersection-specific delays. Similarly, pedestrian routing is based on shortest-path algorithms that do not account for qualitative factors such as sidewalk width, lighting conditions, or terrain characteristics like the steep topography of volcanic cities [54]. Enhancing fidelity through the integration of microscopic traffic models, more nuanced pedestrian behavior, and dynamic multimodal interactions would improve realism, though at the cost of increased computational demands. Balancing accuracy and responsiveness remains a key design trade-off.
Scalability also represents a critical challenge. While the system effectively handles a study area of approximately 100 km² with thousands of agents, extending it to metropolitan-scale environments with millions of entities will require further optimization. This includes adopting distributed computing approaches, hierarchical simulation techniques, and more efficient data structures to support large-scale analyses [13].
From a user-centered perspective, although the system’s initial validation was based on structured testing and informed by consultation with a public municipal entity during the planning and development phases, comprehensive evaluation with end users has not yet been conducted. Future work should include usability studies, participatory planning workshops, and real-world deployment scenarios, as well as improved interoperability with existing municipal tools such as GIS platforms and project management systems. These steps are necessary to assess and enhance the system’s practical impact on urban decision-making processes.
Finally, the integration of generative AI into urban planning workflows raises important ethical and governance considerations, particularly regarding transparency and potential algorithmic bias [46]. The current architecture adopts a human-in-the-loop approach, whereby the AI agent proposes configurations that must be explicitly validated by the user. However, there remains a need for greater transparency in documenting the agent’s internal prompts and decision-making logic. Addressing these concerns will require the development of robust AI governance frameworks, including transparent documentation practices, algorithmic auditing, and safeguards to ensure that AI-assisted planning supports equitable outcomes and does not disproportionately disadvantage specific communities [53].
5. Conclusions
This paper has presented a novel architecture integrating generative artificial intelligence with digital twin technology for urban mobility simulation and decision support in smart cities. The system addresses a critical gap in existing planning tools: the lack of accessible, flexible interfaces that enable diverse stakeholders to engage with sophisticated simulation-based analysis without requiring specialized technical expertise.
5.1. Summary of Contributions
The key contributions of this work are:
- 1.
- Integrated Architecture: We developed and validated an architecture that synergistically combines a conversational AI agent (based on Google Gemini 2.5 Flash Lite) with a digital twin simulation engine to enable natural language configuration of multimodal urban mobility simulations. This integration demonstrates how complementary technologies can be composed to create capabilities exceeding what either component could achieve independently.
- 2.
- Conversational Configuration Interface: We implemented and validated a conversational AI agent capable of interpreting natural language planning objectives, extracting relevant simulation parameters, and autonomously modifying configuration files. The agent achieved 95.99% accuracy across 50 diverse configuration tasks, demonstrating the viability of LLM-based interfaces for complex technical systems.
- 3.
- Data-Rich Multimodal Simulation: We developed a digital twin that integrates heterogeneous data sources (including INE census tracts for resident density, ISTAC and OSM for tourist activity, and TomTom traffic statistics) to create a realistic simulation environment. The system models buses, the future MetroGuagua (BRT), and pedestrian agents with differentiated behavioral profiles operating on a realistic road network extracted from OpenStreetMap. This setup provides a robust foundation for generating comprehensive outputs, such as vehicle trajectories and occupancy dynamics, which are essential for assessing sustainability indicators across environmental, economic, and social dimensions.
- 4.
- Proof-of-Concept Validation (TRL 4): We conducted a technical validation of the framework in Las Palmas de Gran Canaria, demonstrating the feasibility of an LLM-driven orchestration of discrete-event simulations. By executing multiple scenarios, we confirmed that the system produces realistic mobility dynamics consistent with transportation planning theory. The validation highlighted the effectiveness of the Pydantic-based safety layer, which achieved a high success rate in mapping natural language to executable configurations, ensuring system stability despite the stochastic nature of the generative agent.
5.2. Roadmap
Several directions for future research and development are evident:
- 1.
- Transition to TRL 5-7: Advance the system toward operational deployment through validation in real-world settings with actual planning agencies. This transition requires integration with authoritative data sources, comprehensive user evaluation, and refinement based on stakeholder feedback.
- 2.
- Enhanced Simulation Fidelity: Incorporate more detailed models of traffic dynamics, pedestrian behavior, and multi-modal interactions. Integrate real-time data streams (GPS tracking, sensor networks) to enable operational decision support beyond scenario planning.
- 3.
- Multi-City Generalization: Validate the architecture across diverse urban contexts (varying sizes, geographic settings, transportation systems) to assess generalizability and identify necessary adaptations for different planning environments.
- 4.
- Integration with Broader Planning Ecosystems: Develop APIs and data exchange standards to integrate the system with existing GIS platforms, transportation demand models, and project management tools used by planning agencies.
- 5.
- Ethical AI Frameworks: Establish governance frameworks addressing algorithmic transparency, bias mitigation, data privacy, and accountability for AI-assisted planning decisions [46].
- 6.
- Economic and Social Impact Assessment: Conduct longitudinal studies to measure the actual impact of AI-digital twin decision support on planning outcomes, policy quality, and community well-being.
5.3. Closing Remarks
As urban populations continue to grow and cities face mounting pressures related to climate change, resource constraints, and social equity, the need for intelligent, evidence-based planning tools becomes increasingly urgent. This work demonstrates that the integration of generative artificial intelligence with digital twin technology offers a promising pathway toward more accessible, flexible, and effective decision support for smart city mobility planning.
By transforming sophisticated simulation engines from specialist tools into systems that respond to natural language, we can democratize access to data-driven insights and enable broader participation in shaping the future of urban mobility. By grounding AI-generated recommendations in rigorous simulation, we ensure that decision support is based on realistic assessments of physical and behavioral dynamics rather than abstract speculation.
The validated proof-of-concept represents a significant step toward this vision, but substantial work remains to transition from laboratory demonstration to operational deployment. We hope that this research inspires continued innovation at the intersection of AI, digital twins, and smart cities, ultimately contributing to more sustainable, equitable, and livable urban environments for all.
Author Contributions
Conceptualization, E.S.-O., M.S.-M., E.W.-S.; methodology, A.C.-R., M.Á.G.-E., P.V.-M.; software, A.C.-R.; validation, M.Á.G.-E., P.V.-M., M.S.-M.; writing—original draft preparation, E.S.-O., A.C.-R, P.V.-M. All authors have read and agreed to the published version of the manuscript.
Funding
This work has been carried out within the framework of the Spain Living Lab project (Grant Reference 1/1/2024-0412093852 – SLLC16-01), funded by the Canarian Agency for Research, Innovation and the Information Society (ACIISI), Department of Universities, Science, Innovation and Culture of the Government of the Canary Islands, under the RETECH Programme, contributing to milestones 251, 252 and 253 of Component 16 of the Recovery, Transformation and Resilience Plan (PRTR), and co-funded by the European Union – Next Generation EU.
Data Availability Statement
The data and code supporting the findings of this study are available from the corresponding author upon reasonable request.
Conflicts of Interest
Authors Pablo Vicente-Martínez and Adrián Chust-Ros were employed by the company SPV Scala. The remaining authors declare that the research was conducted in the absence of any commercial or financial relationships that could be construed as a potential conflict of interest.
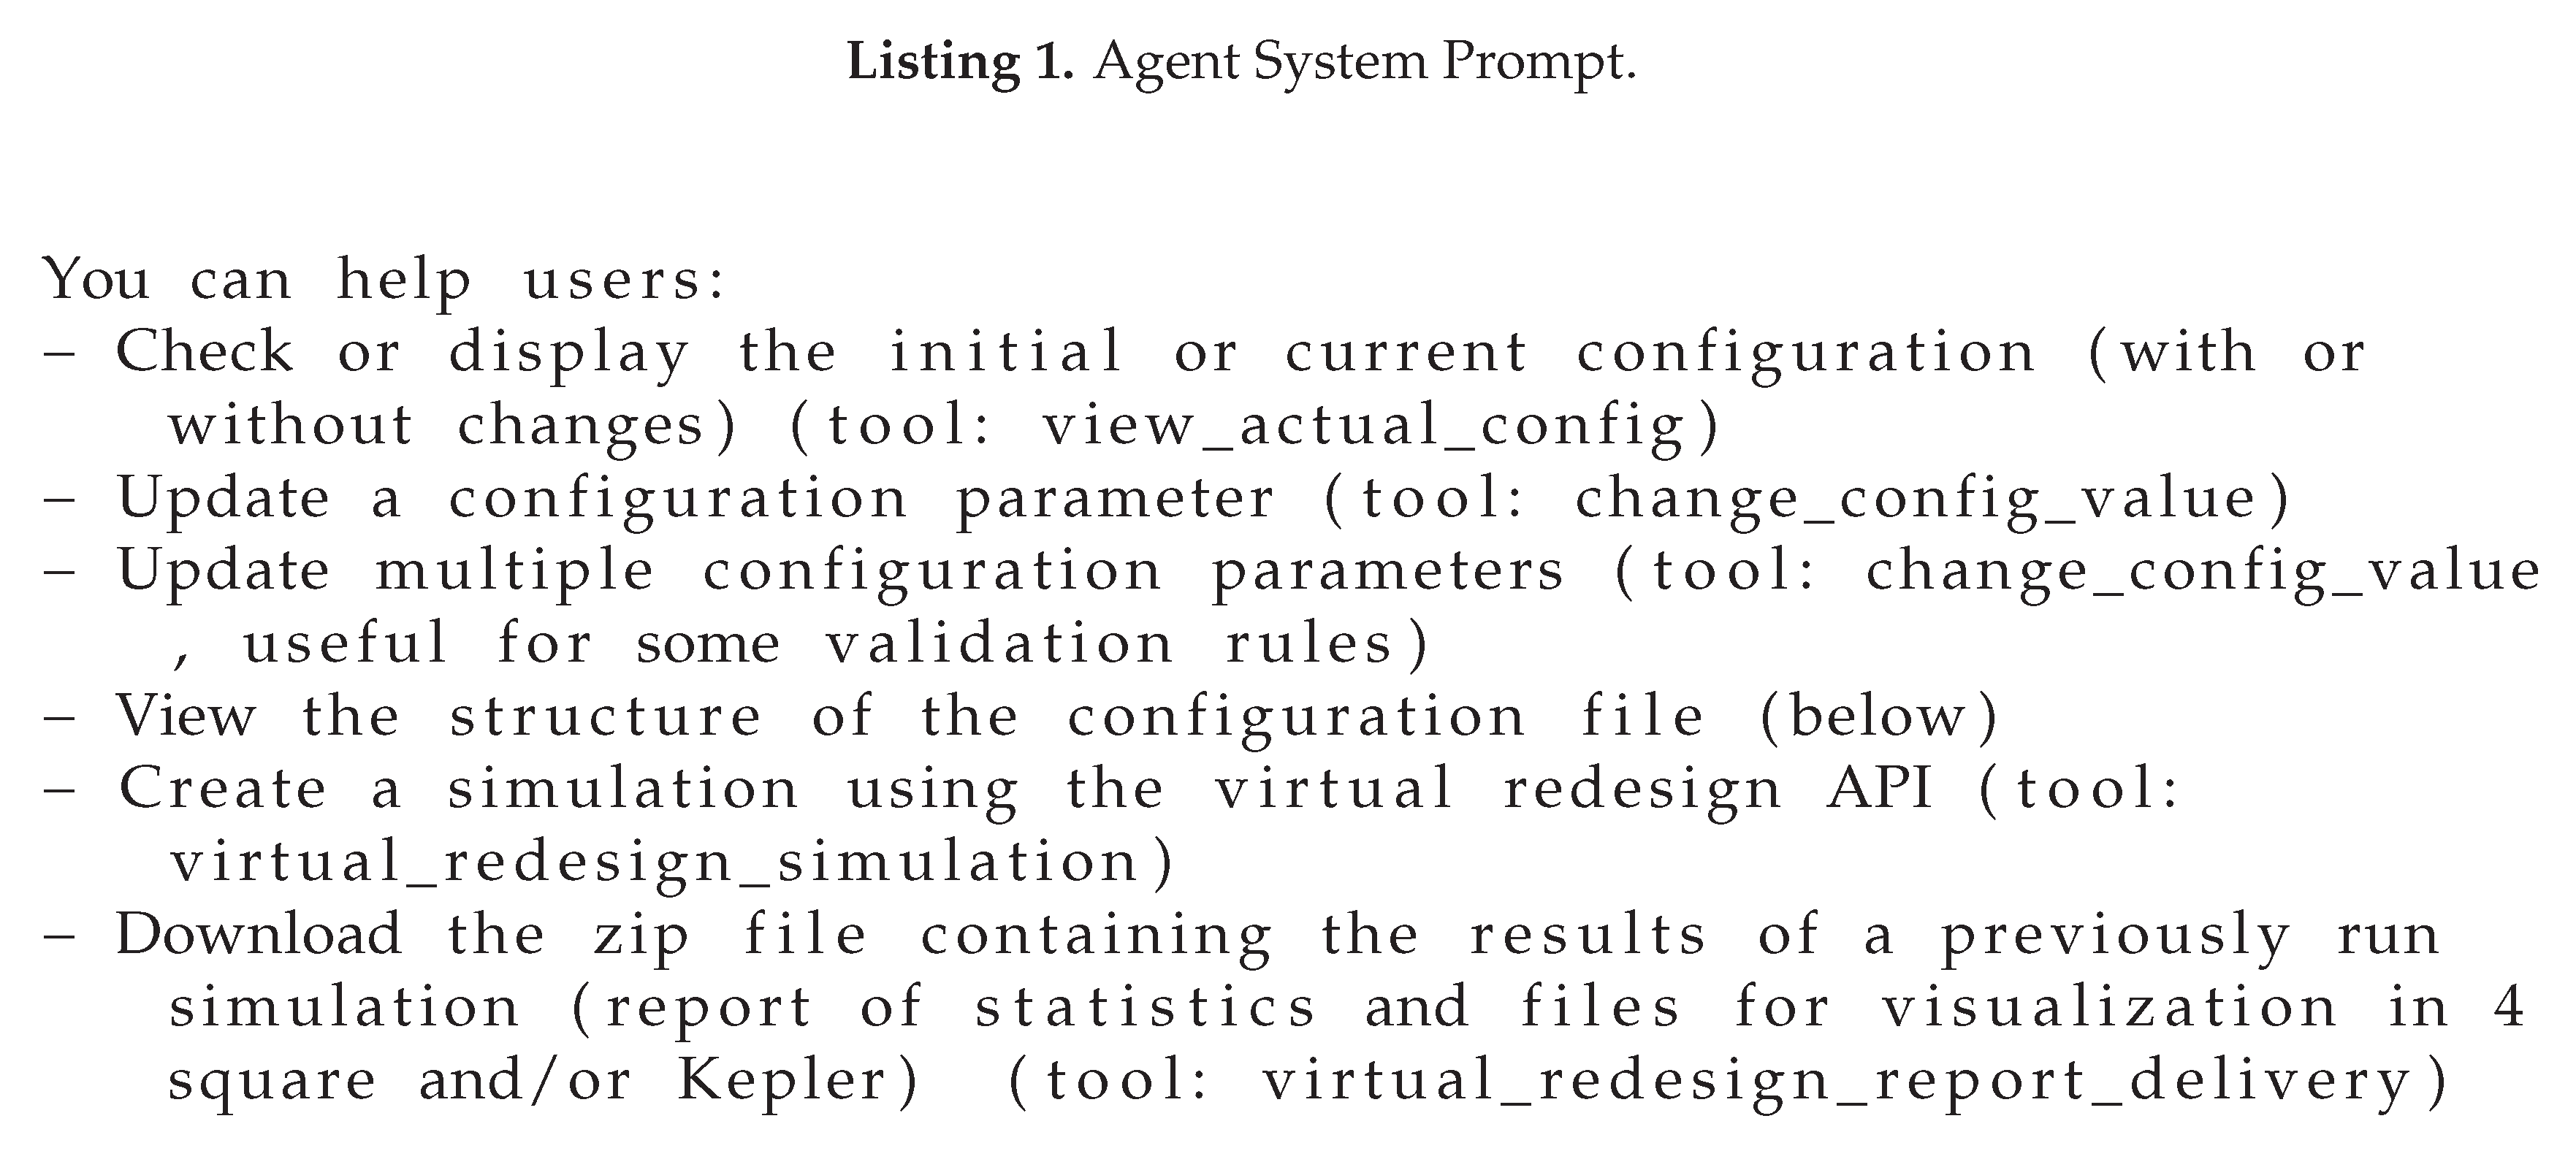
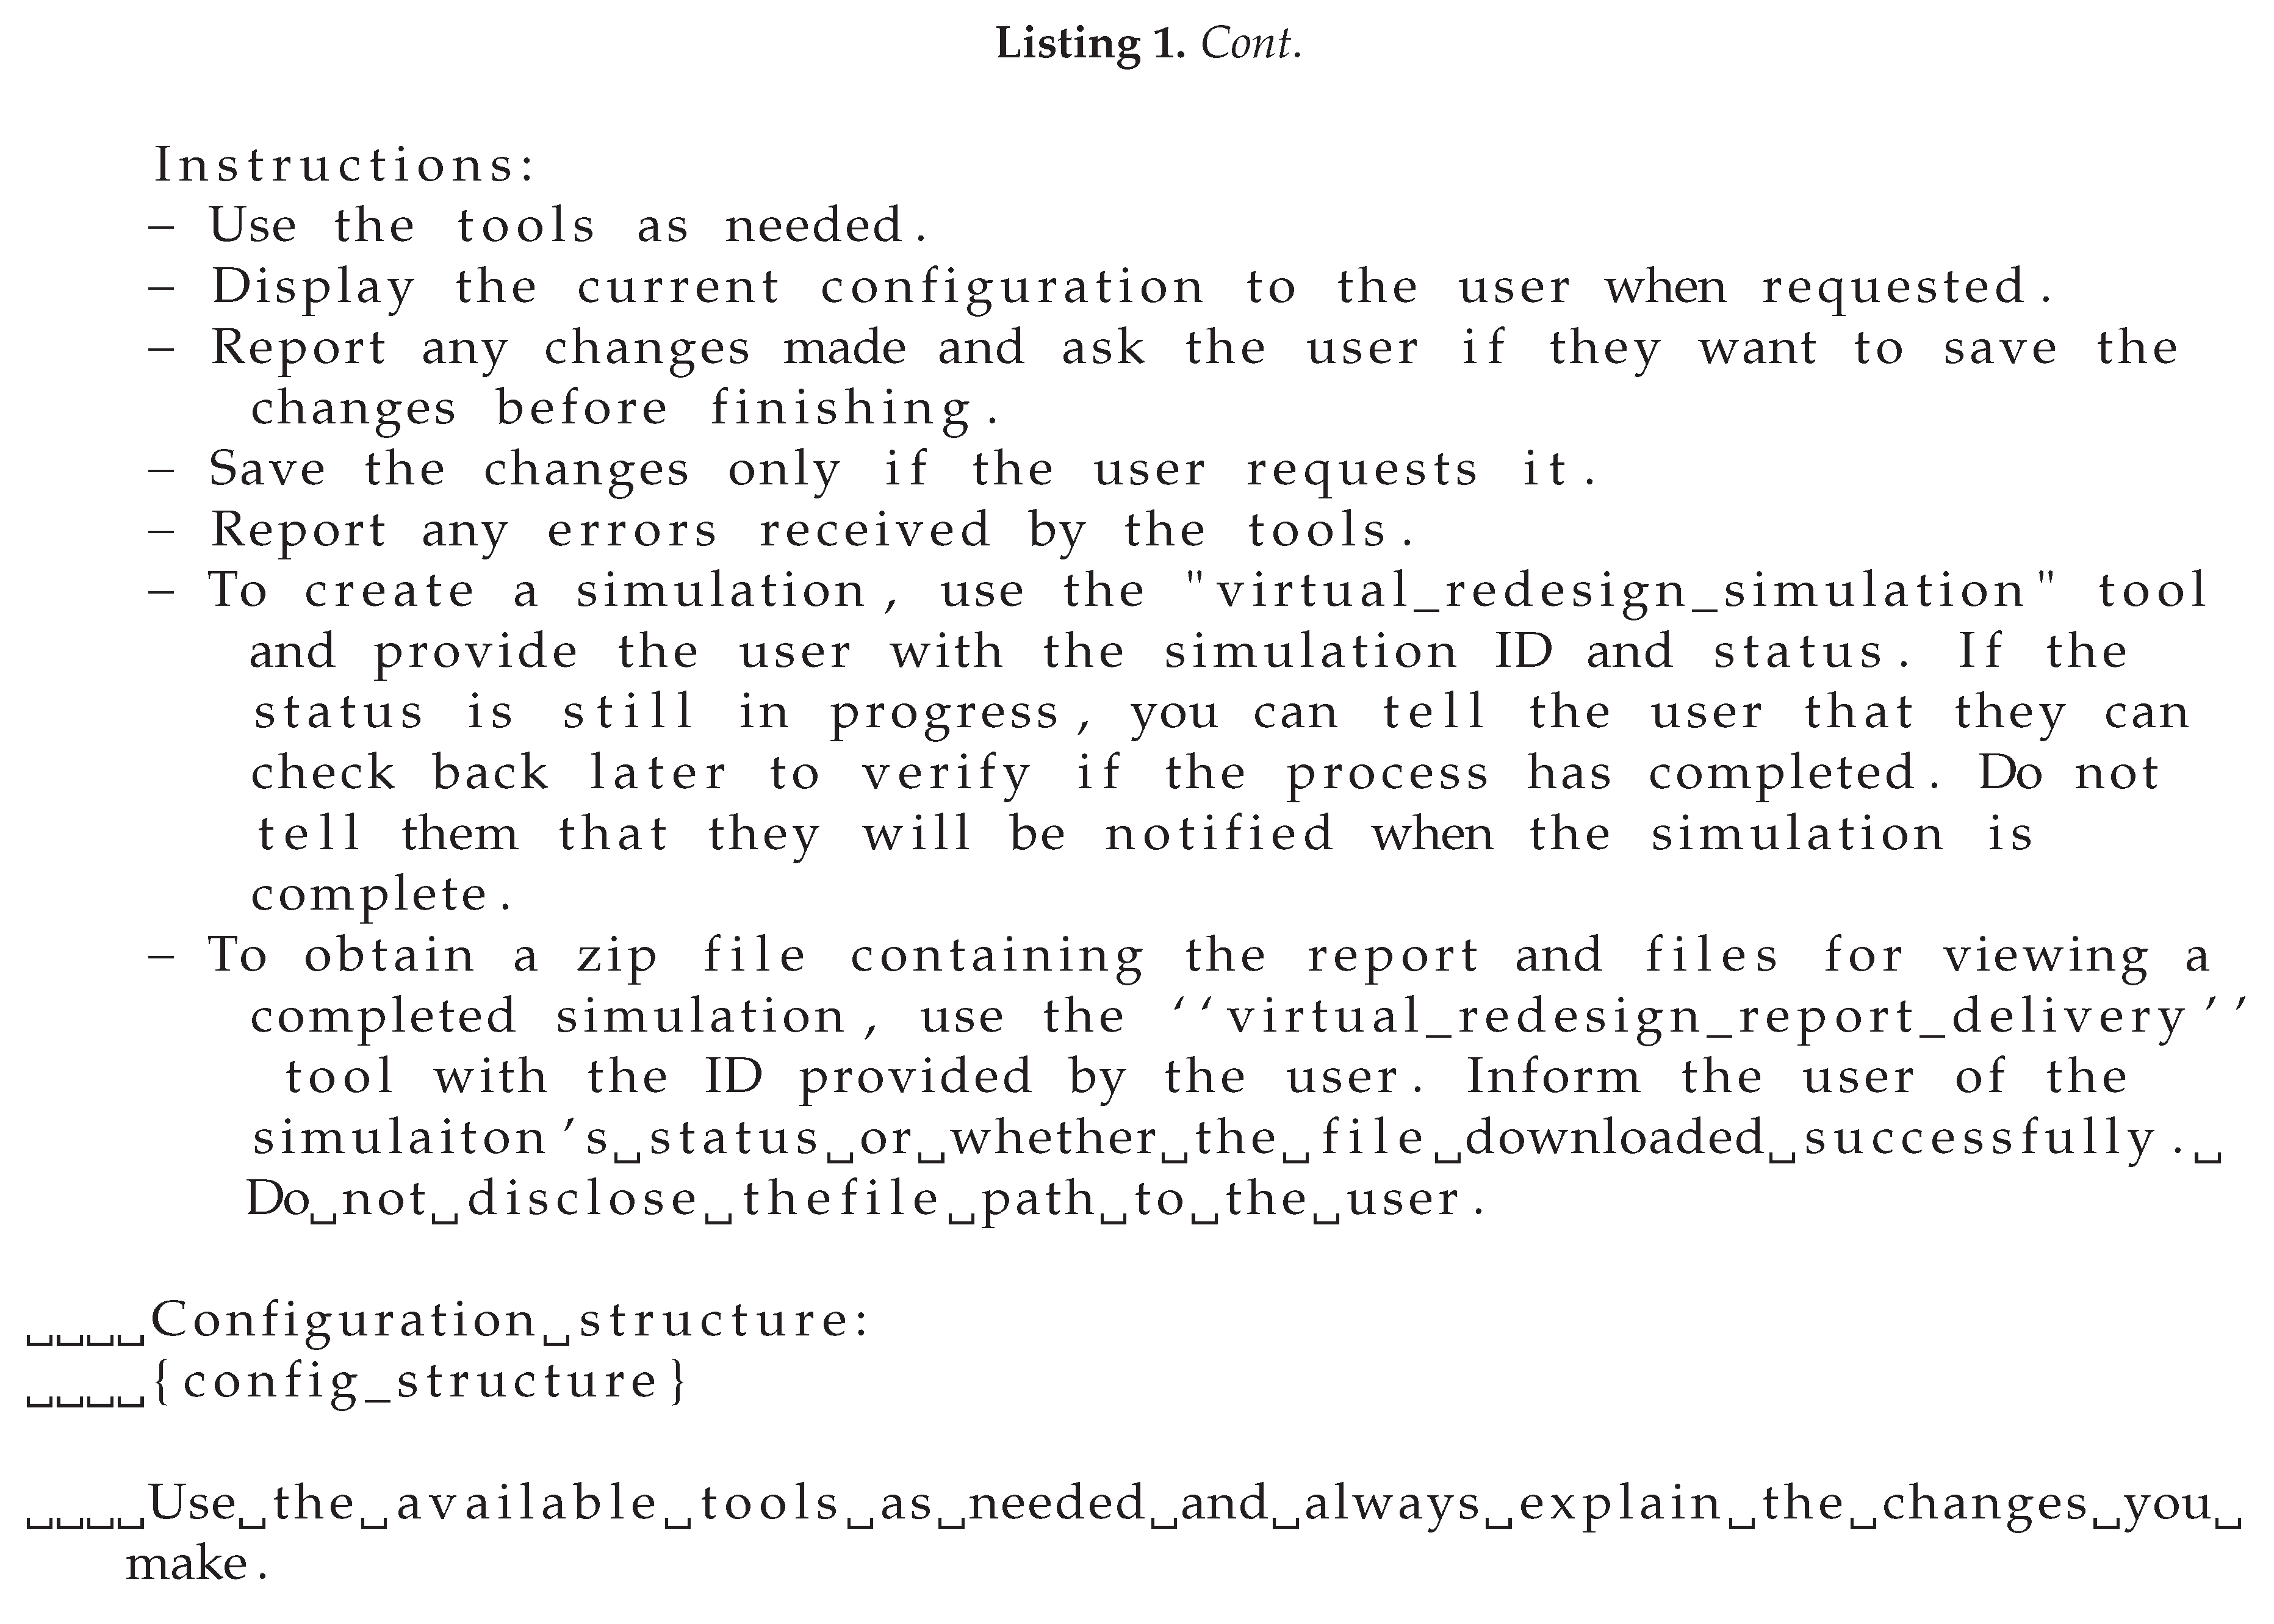
Appendix A. System Prompt and Configuration
Appendix A.1. Configuration Agent System Prompt
The subsequent appendix details the operational instructions employed to direct the functional conduct of the dialogue system. These directives delineate the agent’s persona, permissible operations, and procedural limitations, guaranteeing coherent and systematic performance throughout the integrated framework. The prompt was originally in Spanish, but has been translated to facilitate its understanding.
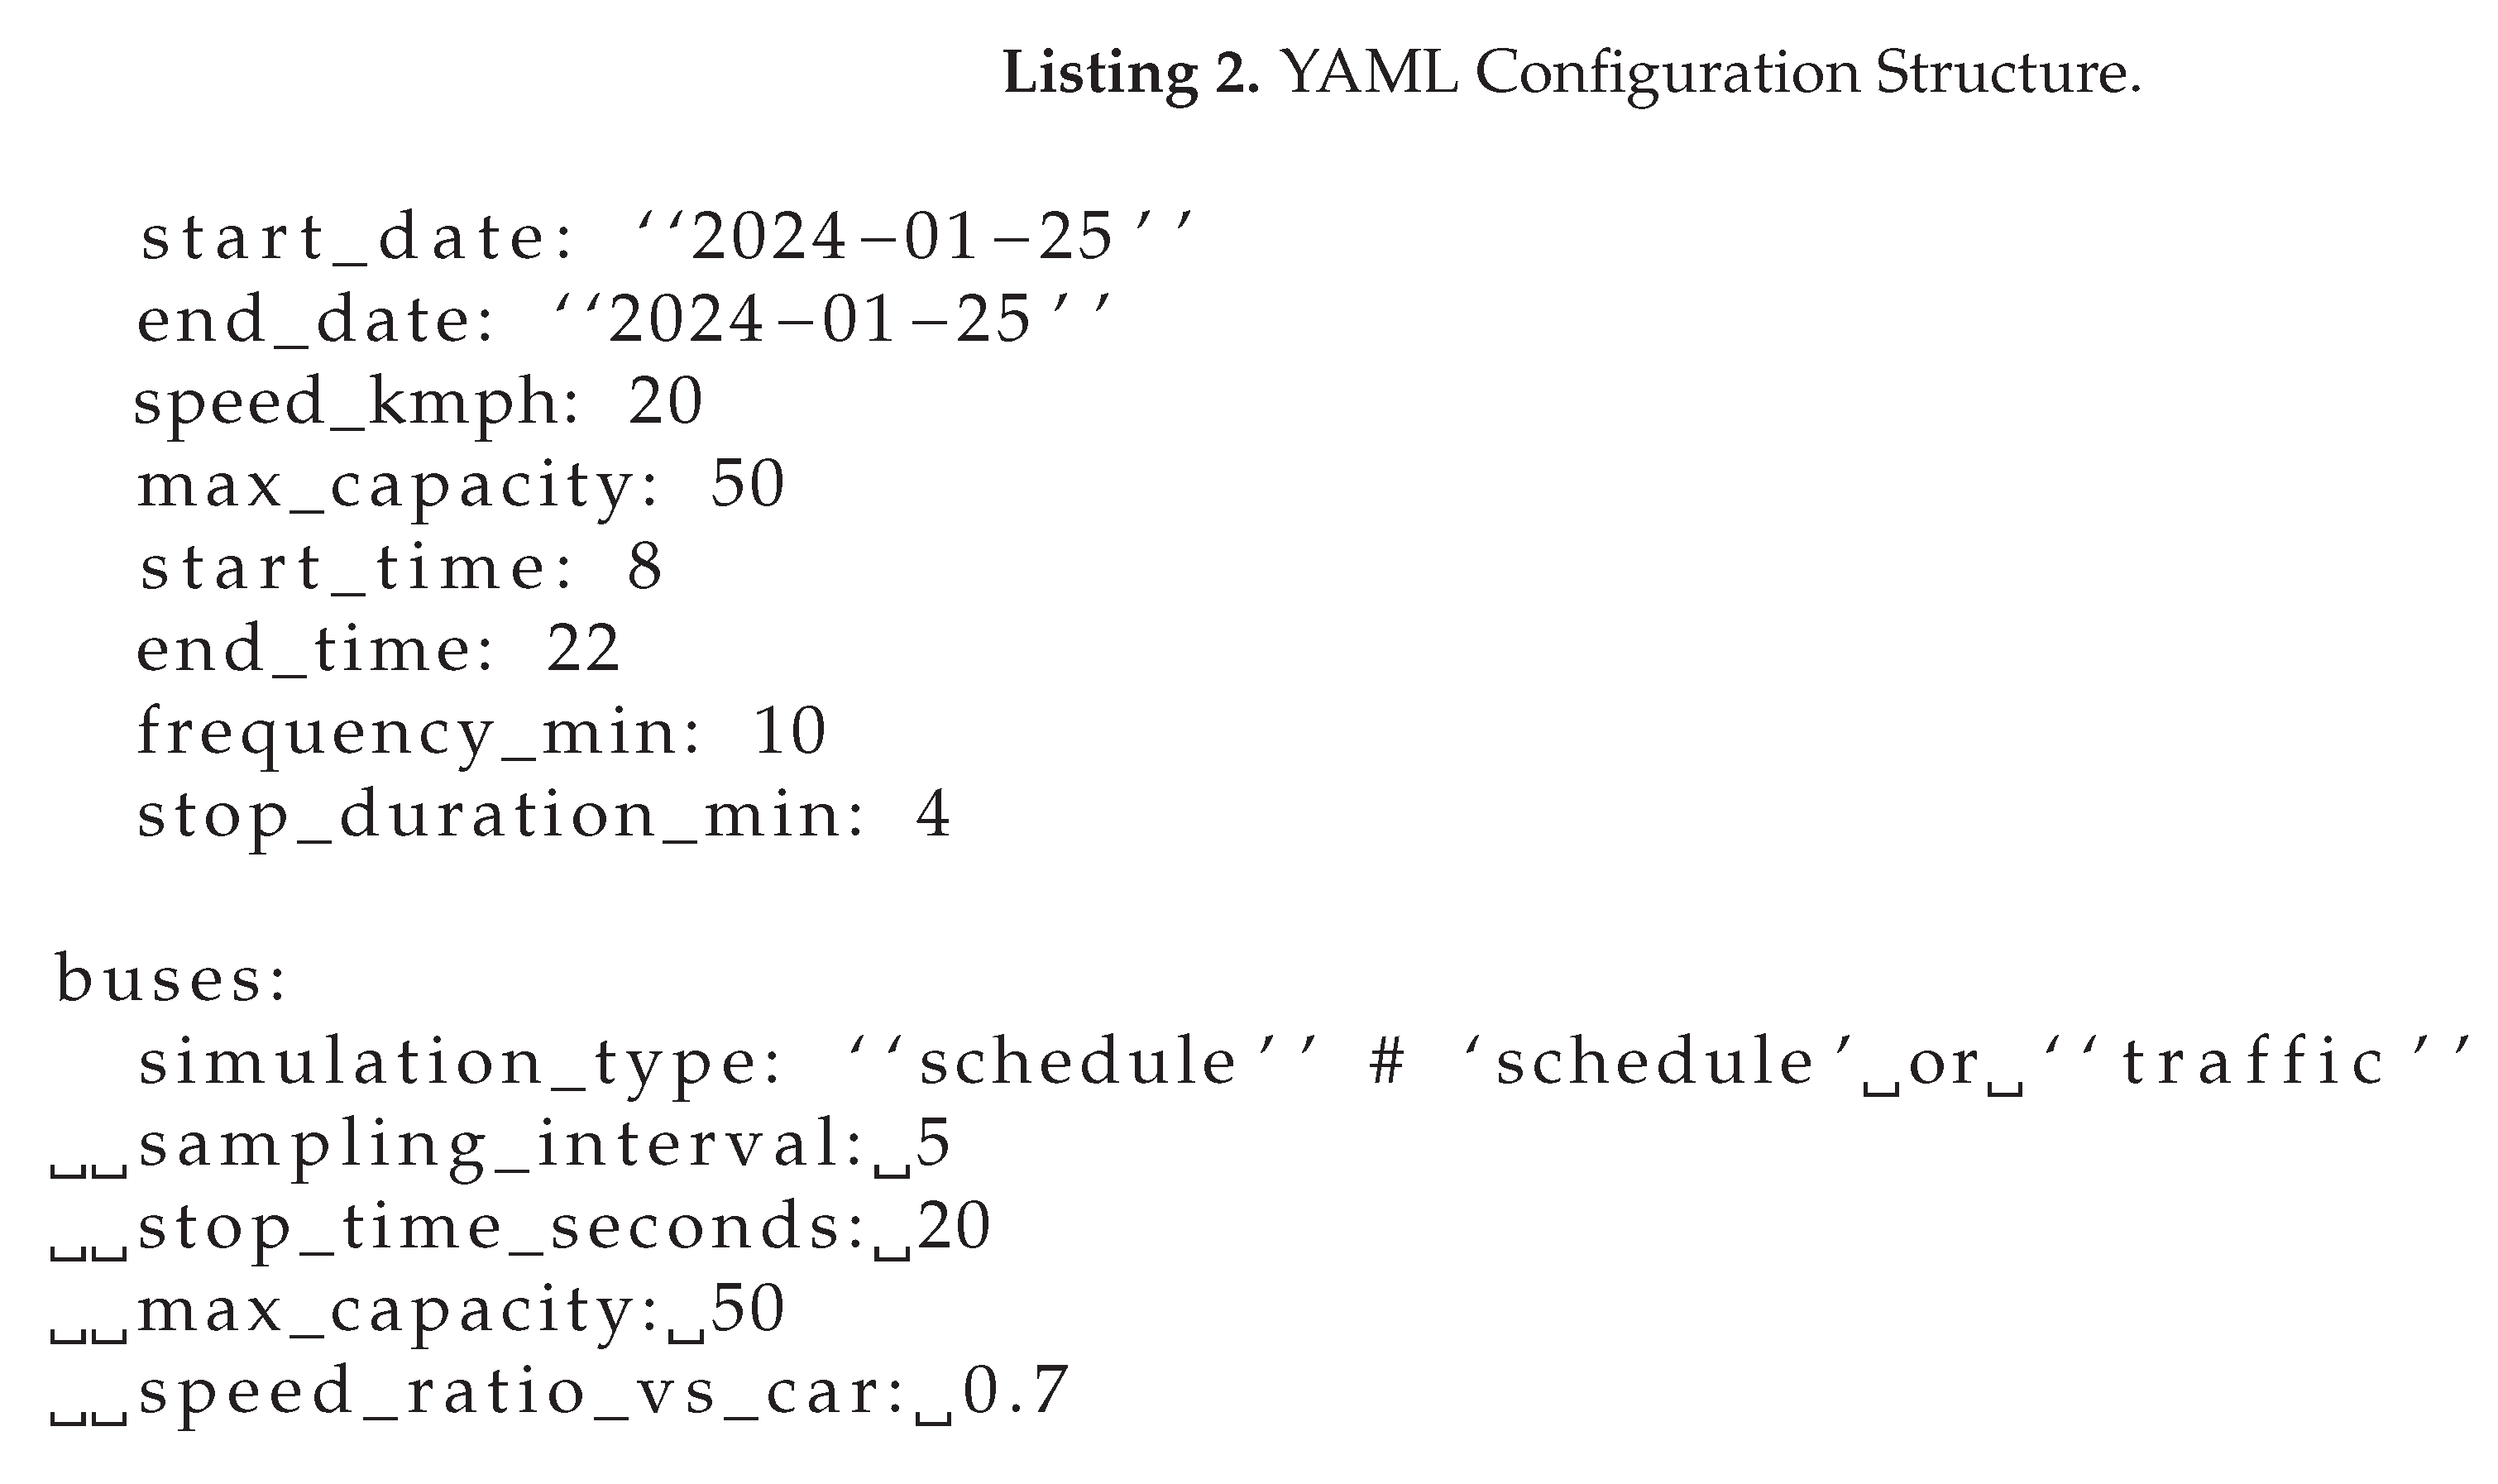
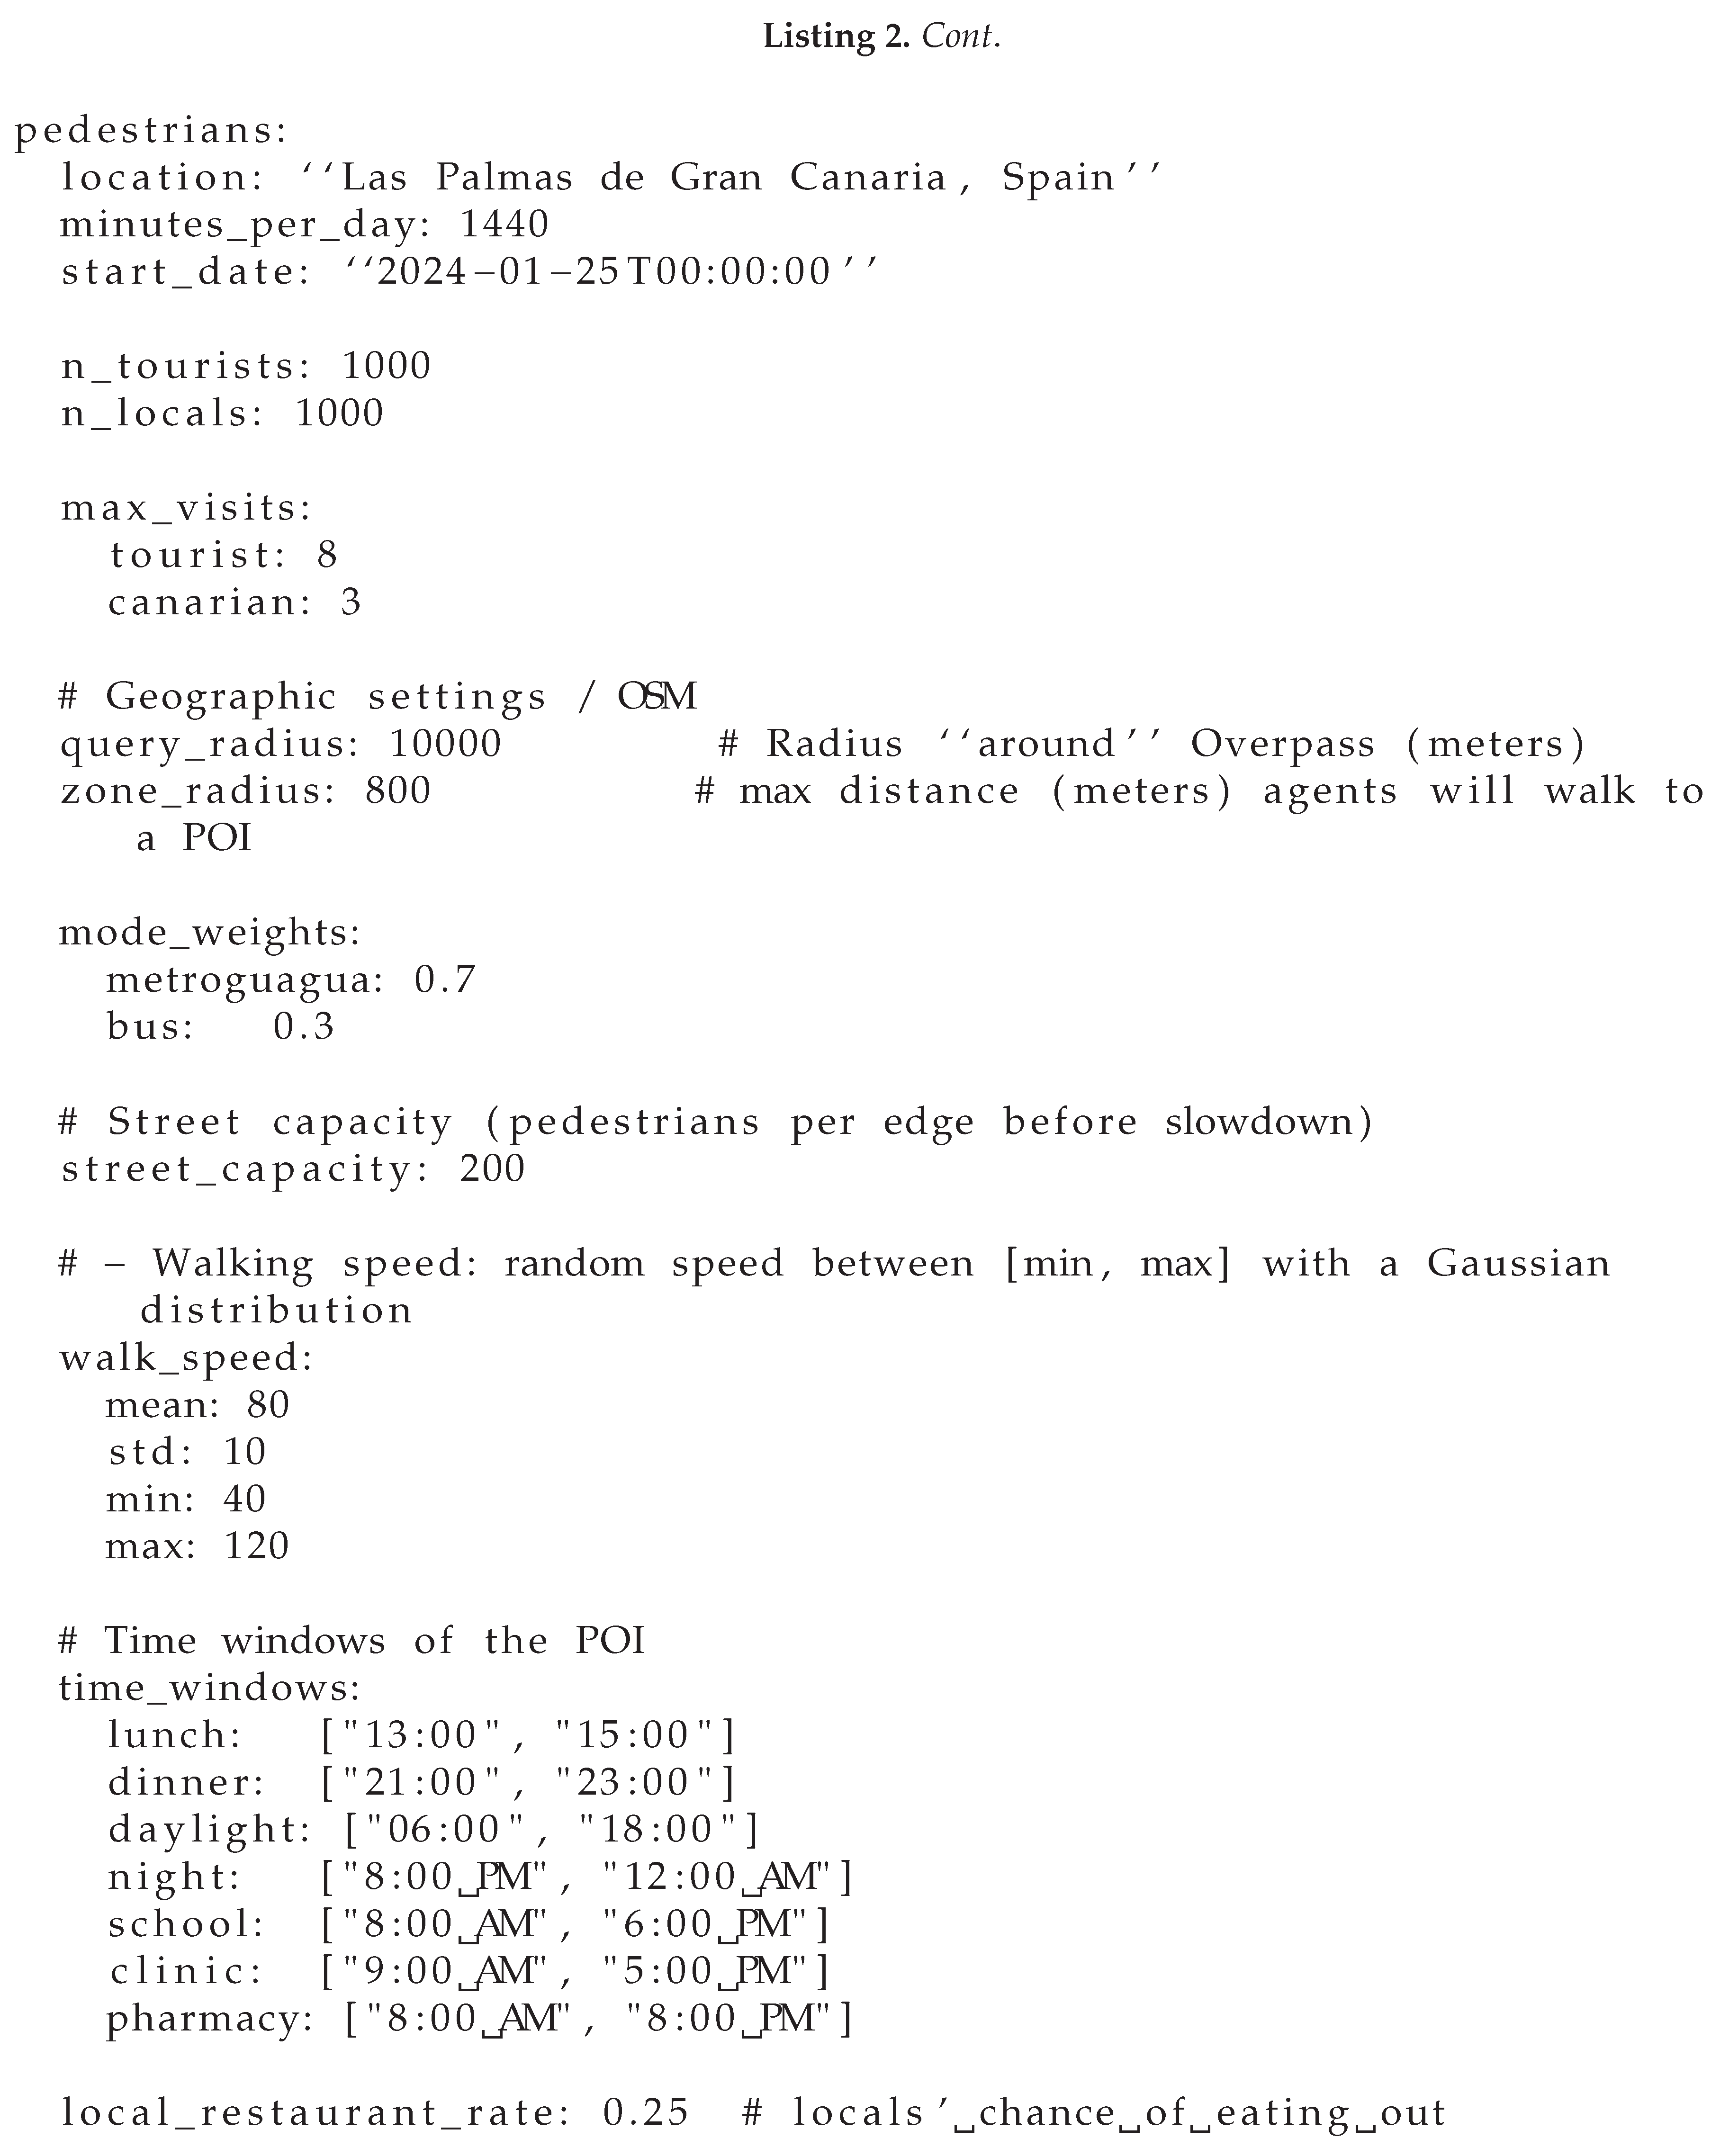
Appendix A.2. Default Configuration File
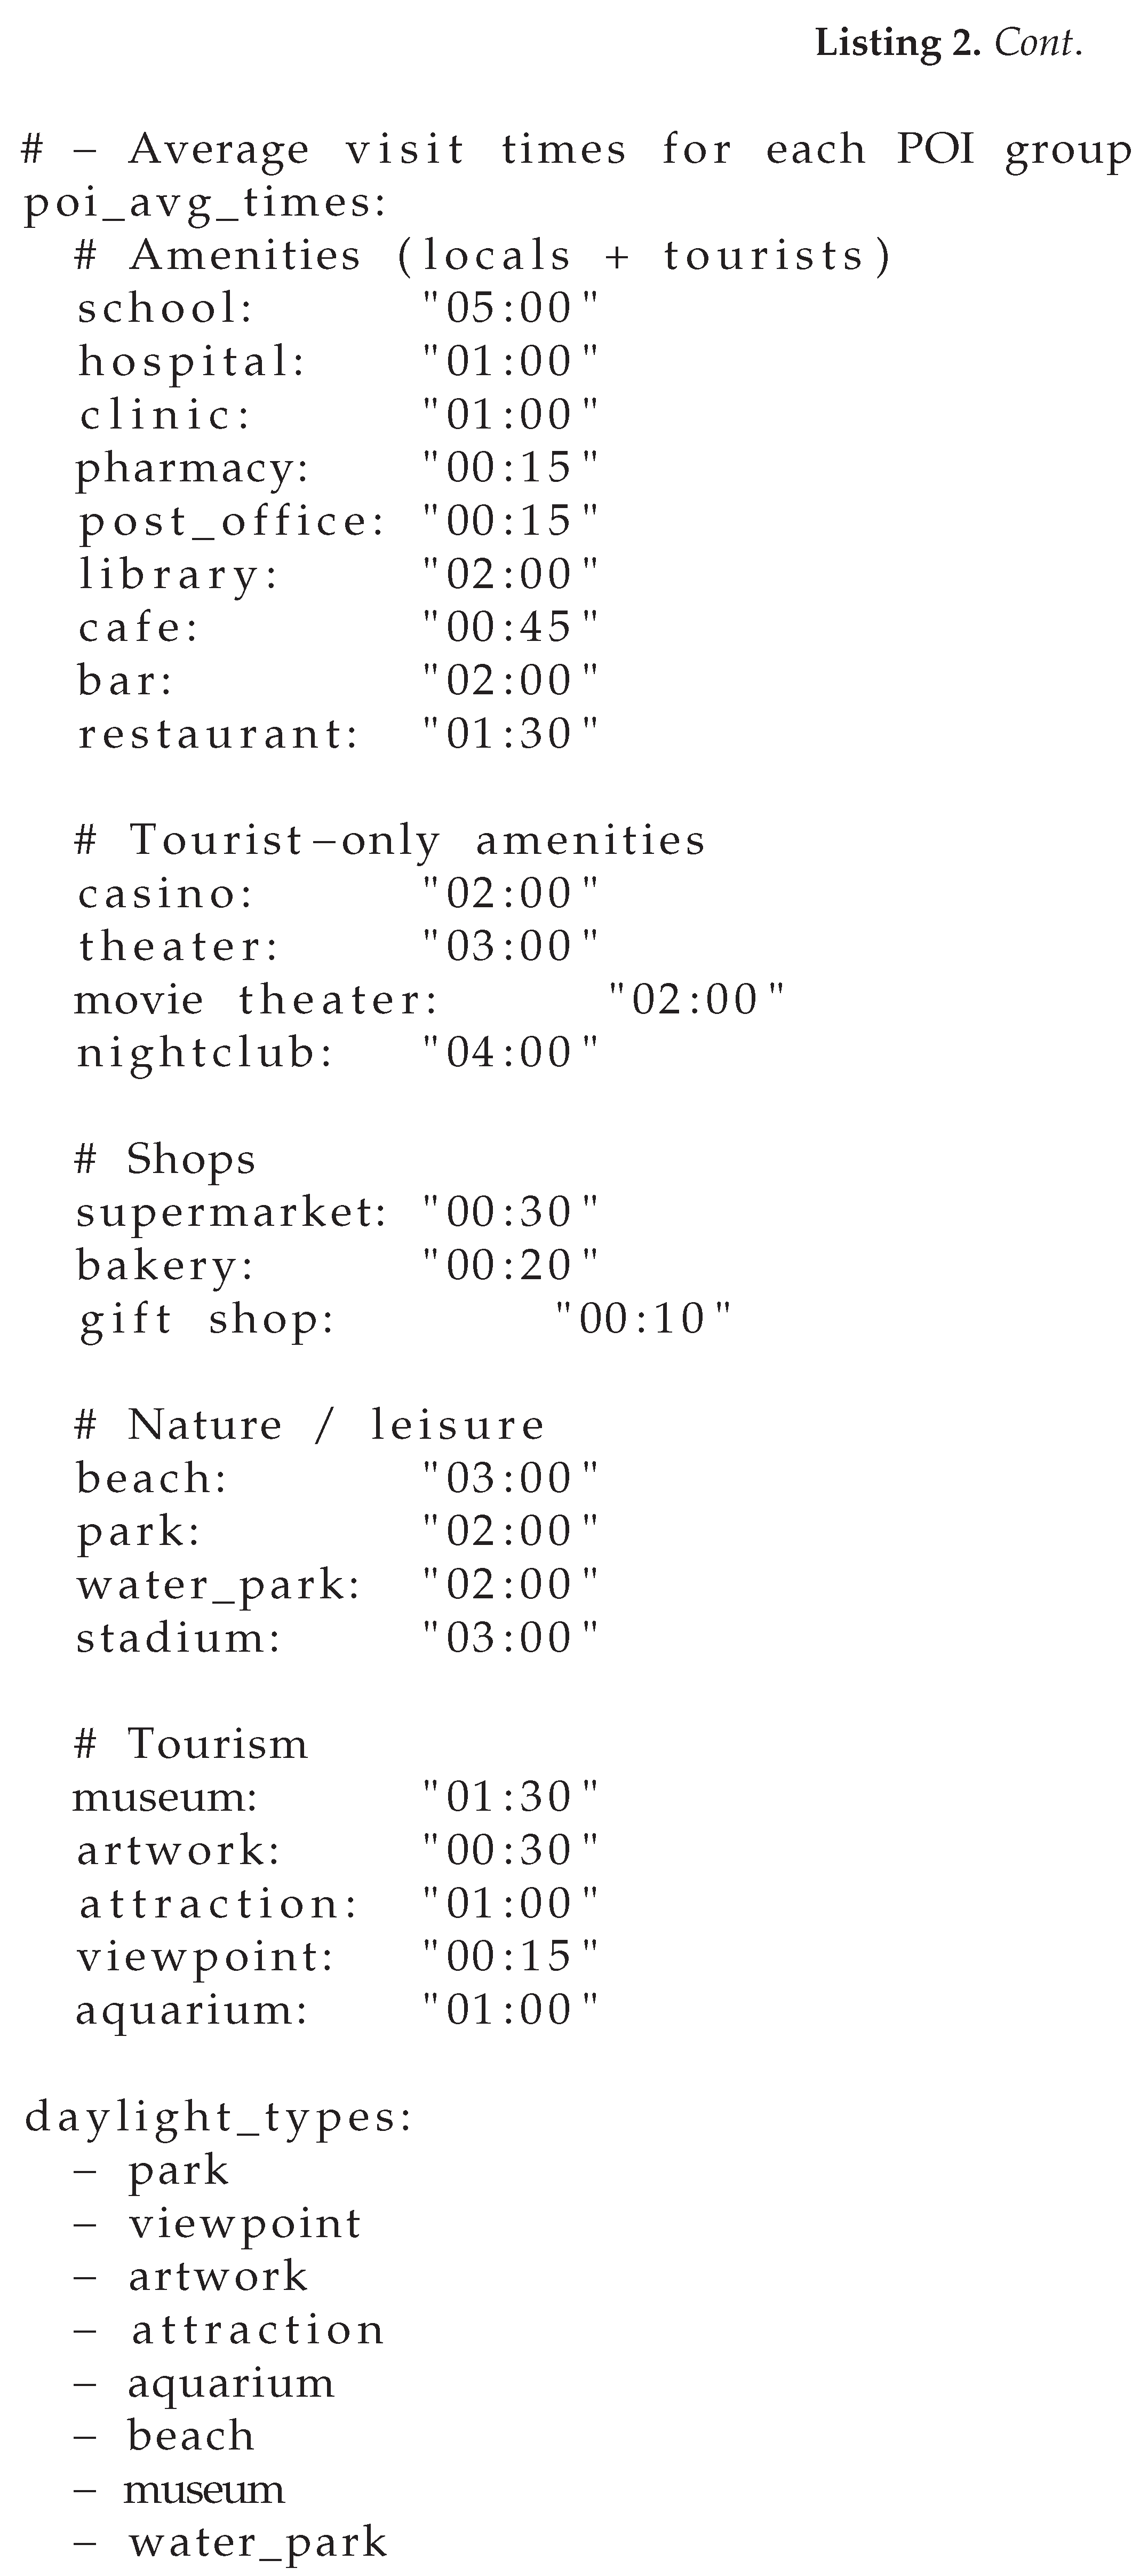
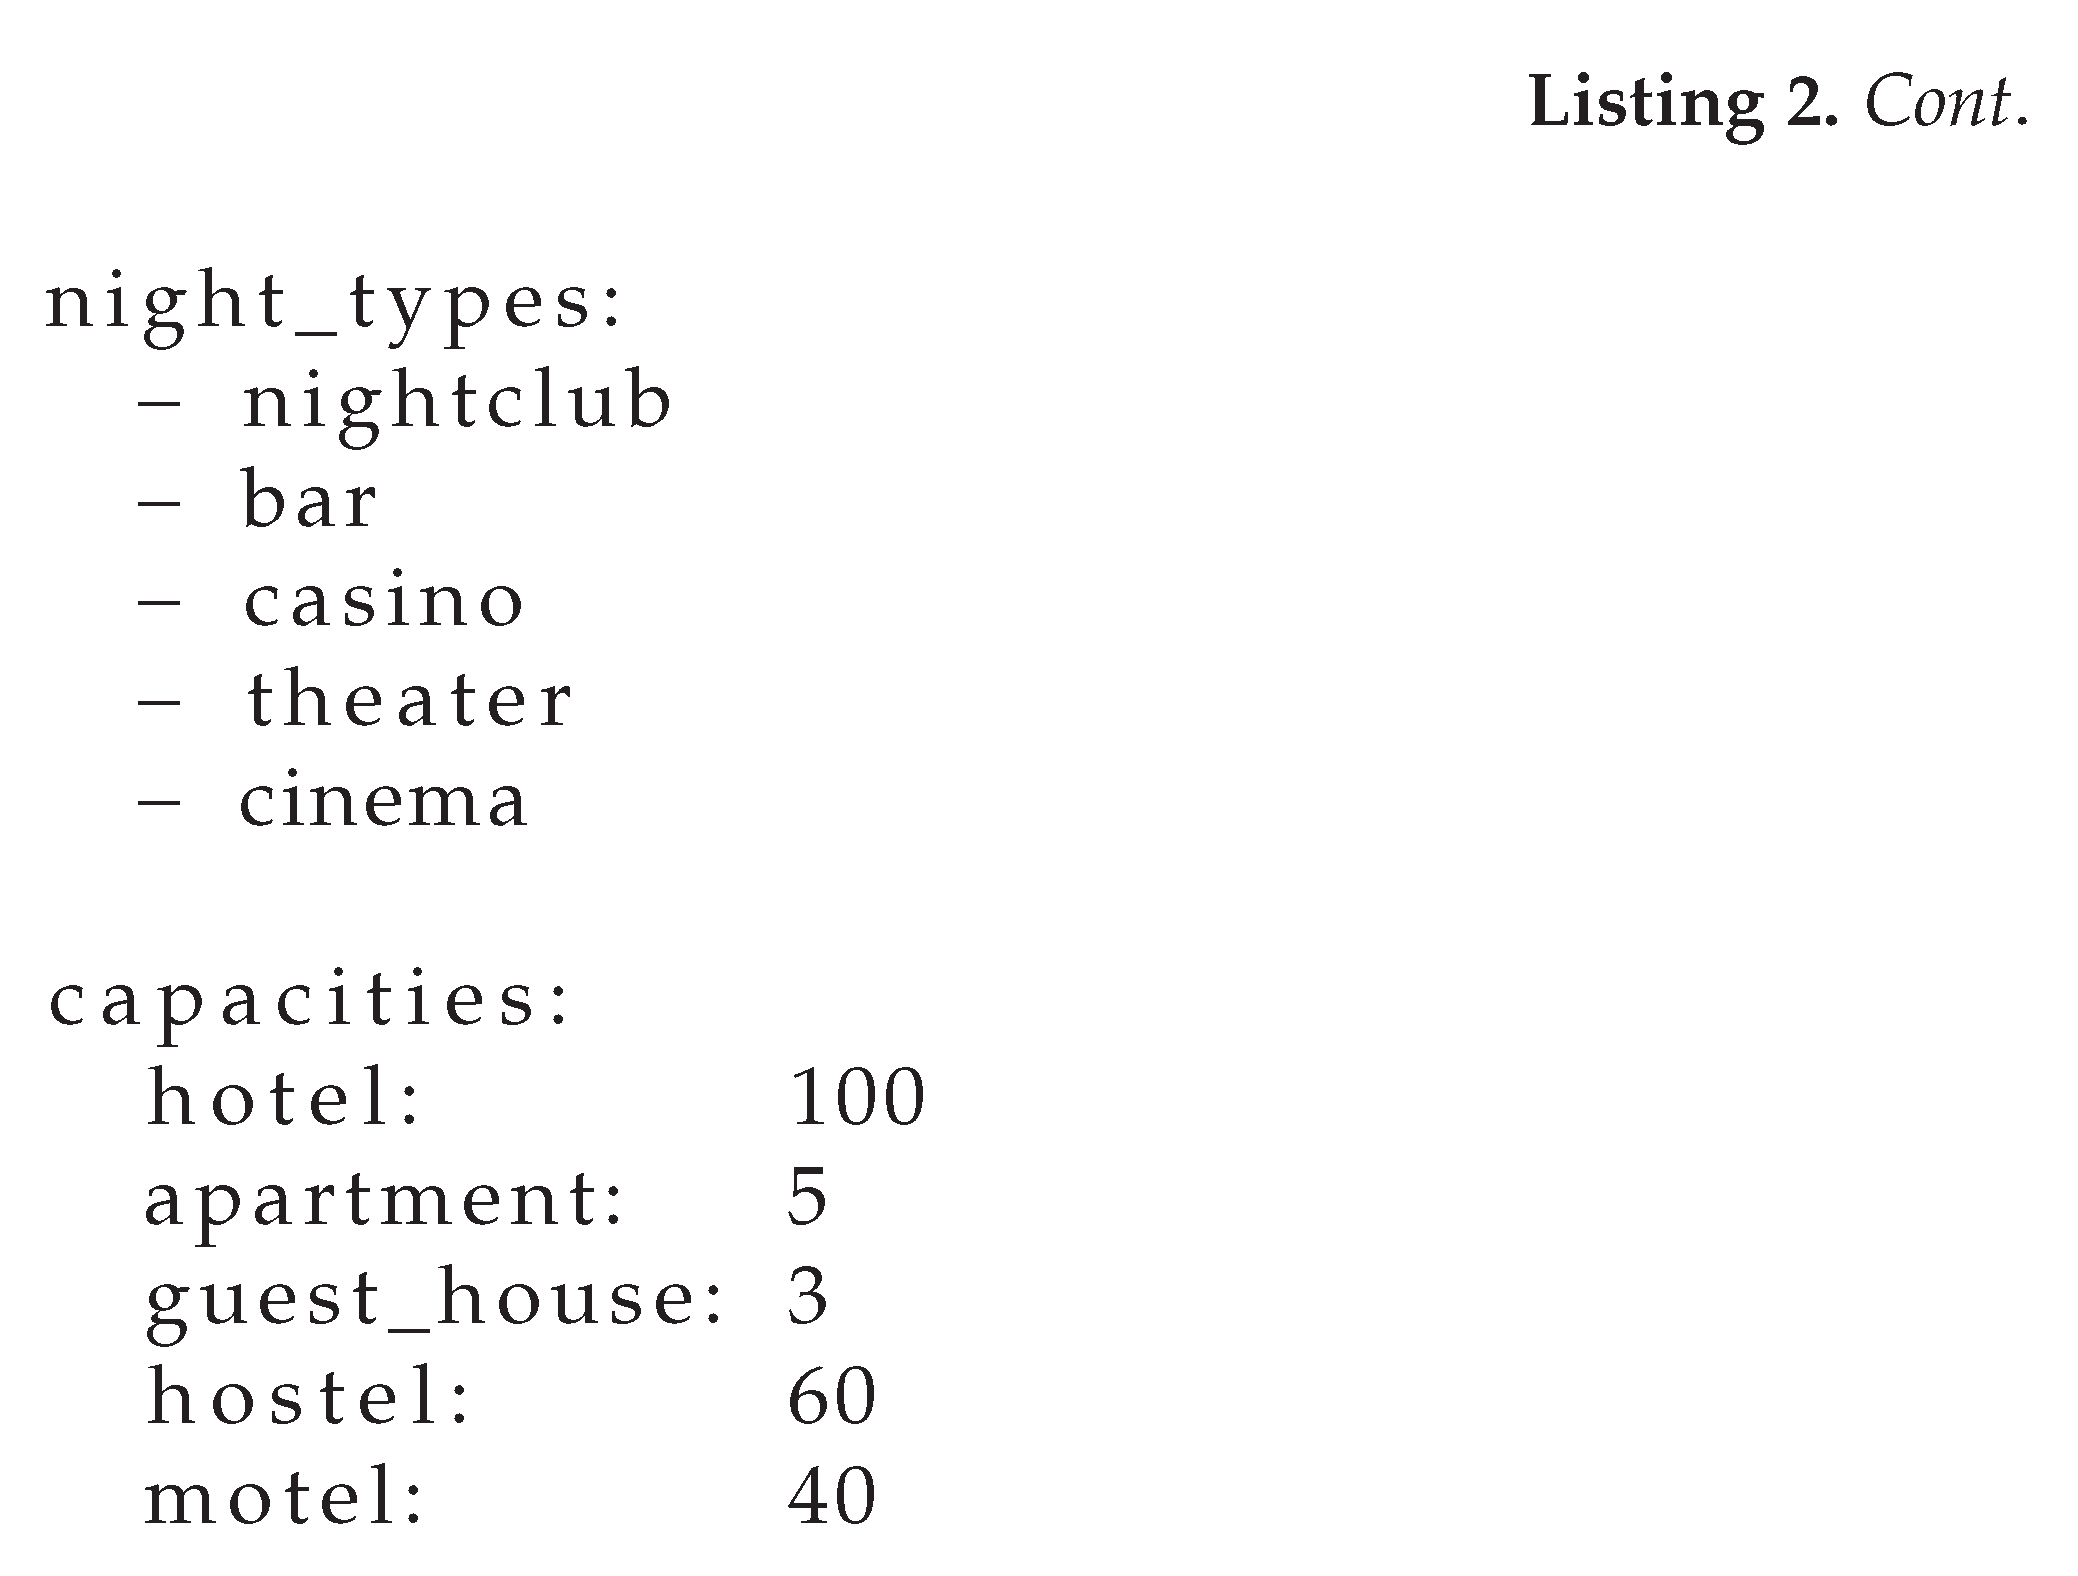
The following segment illustrates the default values of the parameters to configure the simulations. This specification establishes the number of agents simulated, the opening hours of the points of interest and other relevant parameters
References
- United Nations; Department of Economic and Social Affairs; Population Division. World Urbanization Prospects: The 2018 Revision; United Nations: New York, NY, USA, 2018. [Google Scholar]
- Bibri, S.E.; Krogstie, J. Smart sustainable cities of the future: An extensive interdisciplinary literature review. Sustain. Cities Soc. 2017, 31, 183–212. [Google Scholar] [CrossRef]
- Yigitcanlar, T.; Kamruzzaman, L.; Foth, M.; Sabatini-Marques, J.; da Costa, E.; Ioppolo, G. Can cities become smart without being sustainable? A systematic review of the literature. Sustain. Cities Soc. 2019, 45, 348–365. [Google Scholar] [CrossRef]
- Liao, F.; Arentze, T.; Timmermans, H. Incorporating space-time constraints and activity-travel time profiles in a multi-state supernetwork approach to individual activity-travel scheduling. Transp. Res. Part B Methodol. 2013, 55, 41–58. [Google Scholar] [CrossRef]
- Batty, M. Digital twins. Environ. Plan. B Urban Anal. City Sci. 2018, 45, 817–820. [Google Scholar] [CrossRef]
- Pettit, C.; Bakelmun, A.; Lieske, S.N.; Glackin, S.; Hargroves, K.; Thomson, G.; Shearer, H.; Dia, H.; Newman, P. Planning support systems for smart cities. City Cult. Soc. 2018, 12, 13–24. [Google Scholar] [CrossRef]
- Deng, T.; Zhang, K.; Shen, Z.J. A systematic review of a digital twin city: A new pattern of urban governance toward smart cities. J. Manag. Sci. Eng. 2021, 6, 125–134. [Google Scholar] [CrossRef]
- Shahat, E.; Hyun, C.T.; Yeom, C. City digital twin potentials: A review and research agenda. Sustainability 2021, 13, 3386. [Google Scholar] [CrossRef]
- Lv, Z.; Chen, D.; Lou, R.; Song, H. Industrial security solution for virtual reality. IEEE Internet Things J. 2021, 8, 6273–6281. [Google Scholar] [CrossRef]
- Qi, Q.; Tao, F.; Hu, T.; Anwer, N.; Liu, A.; Wei, Y.; Wang, L.; Nee, A.Y.C. Enabling technologies and tools for digital twin. J. Manuf. Syst. 2021, 58, 3–21. [Google Scholar] [CrossRef]
- Ferré-Bigorra, J.; Casals, M.; Gangolells, M. The adoption of urban digital twins. Cities 2022, 131, 103905. [Google Scholar] [CrossRef]
- Mohammadi, N.; Taylor, J.E. Smart city digital twins. In Proceedings of the 2017 IEEE Symposium Series on Computational Intelligence (SSCI), Honolulu, HI, USA, 27 November–1 December 2017; pp. 1–5. [Google Scholar]
- Heinrichs, D.; Cyganski, R. Automated driving: How it could enter our cities and how this might affect our mobility decisions. disP. Plan. Rev. 2015, 51, 74–79. [Google Scholar] [CrossRef]
- Lopez, P.A.; Behrisch, M.; Bieker-Walz, L.; Erdmann, J.; Flötteröd, Y.P.; Hilbrich, R.; Lücken, L.; Rummel, J.; Wagner, P.; Wiessner, E. Microscopic traffic simulation using SUMO. In Proceedings of the 2018 21st International Conference on Intelligent Transportation Systems (ITSC), Maui, HI, USA, 4–7 November 2018; pp. 2575–2582. [Google Scholar]
- Horni, A.; Nagel, K.; Axhausen, K.W. The Multi-Agent Transport Simulation MATSim; Ubiquity Press: London, UK, 2016. [Google Scholar]
- SimPy Team. SimPy: Discrete-Event Simulation for Python . Available online: https://simpy.readthedocs.io/ (accessed on 15 December 2024).
- Francisco, A.; Mohammadi, N.; Taylor, J.E. Smart city digital twin-enabled energy management: Toward real-time urban building energy benchmarking. J. Manag. Eng. 2020, 36, 04019045. [Google Scholar] [CrossRef]
- Brown, T.B.; Mann, B.; Ryder, N.; Subbiah, M.; Kaplan, J.; Dhariwal, P.; Neelakantan, A.; Shyam, P.; Sastry, G.; Askell, A.; et al. Language models are few-shot learners. In Proceedings of the 34th Conference on Neural Information Processing Systems (NeurIPS 2020), Virtual, 6–12 December 2020; Volume 33, pp. 1877–1901. [Google Scholar]
- OpenAI. GPT-4 Technical Report. arXiv 2023, arXiv:2303.08774. [Google Scholar] [CrossRef]
- Cugurullo, F.; Acheampong, R.A.; Gueriau, M.; Dusparic, I. The transition to autonomous cars, the redesign of cities and the future of urban sustainability. Urban Geogr. 2021, 42, 833–859. [Google Scholar] [CrossRef]
- Nishant, R.; Kennedy, M.; Corbett, J. Artificial intelligence for sustainability: Challenges, opportunities, and a research agenda. Int. J. Inf. Manag. 2020, 53, 102104. [Google Scholar] [CrossRef]
- Liu, P.; Yuan, W.; Fu, J.; Jiang, Z.; Hayashi, H.; Neubig, G. Pre-train, prompt, and predict: A systematic survey of prompting methods in natural language processing. ACM Comput. Surv. 2023, 55, 1–35. [Google Scholar] [CrossRef]
- Google DeepMind. Gemini: A Family of Highly Capable Multimodal Models. arXiv 2023, arXiv:2312.11805. [Google Scholar] [CrossRef]
- Chen, X.; Lin, M.; Schärli, N.; Zhou, D. Teaching large language models to self-debug. In Proceedings of the 12th International Conference on Learning Representations (ICLR 2024), Vienna, Austria, 7–11 May 2024. [Google Scholar]
- Palanica, A.; Flaschner, P.; Thommandram, A.; Li, M.; Fossat, Y. Physicians’ perceptions of chatbots in health care: Cross-sectional web-based survey. J. Med. Internet Res. 2019, 21, e12887. [Google Scholar] [CrossRef]
- Chung, M.; Ko, E.; Joung, H.; Kim, S.J. Chatbot e-service and customer satisfaction regarding luxury brands. J. Bus. Res. 2020, 117, 587–595. [Google Scholar] [CrossRef]
- Kar, A.K.; Haldar, N. Applying chatbots to the Internet of Things: Opportunities and architectural elements. Int. J. Inf. Manag. 2016, 36, 1233–1238. [Google Scholar] [CrossRef]
- Shum, H.Y.; He, X.D.; Li, D. From Eliza to XiaoIce: Challenges and opportunities with social chatbots. Front. Inf. Technol. Electron. Eng. 2018, 19, 10–26. [Google Scholar] [CrossRef]
- Psyllidis, A.; Bozzon, A.; Bocconi, S.; Bolivar, C.T. A platform for urban analytics and semantic data integration in city planning. In Proceedings of the CUPUM 2015: 14th International Conference on Computers in Urban Planning and Urban Management, Cambridge, MA, USA, 7–10 July 2015. [Google Scholar]
- Wang, W.; Siau, K. Artificial intelligence, machine learning, automation, robotics, future of work and future of humanity: A review and research agenda. J. Database Manag. 2019, 30, 61–79. [Google Scholar] [CrossRef]
- White, G.; Zink, A.; Codecà, L.; Clarke, S. A digital twin smart city for citizen feedback. Cities 2021, 110, 103064. [Google Scholar] [CrossRef]
- Cardullo, P.; Kitchin, R. Being a ’citizen’ in the smart city: Up and down the scaffold of smart citizen participation in Dublin, Ireland. GeoJournal 2019, 84, 1–13. [Google Scholar] [CrossRef]
- Boeing, G. OSMnx: New methods for acquiring, constructing, analyzing, and visualizing complex street networks. Comput. Environ. Urban Syst. 2017, 65, 126–139. [Google Scholar] [CrossRef]
- Google. General Transit Feed Specification Reference . Available online: https://gtfs.org/reference/static (accessed on 15 December 2024).
- Ballatore, A.; Bertolotto, M.; Wilson, D.C. An evaluative baseline for geo-semantic relatedness and similarity. GeoInformatica 2014, 18, 747–767. [Google Scholar] [CrossRef]
- Bonabeau, E. Agent-based modeling: Methods and techniques for simulating human systems. Proc. Natl. Acad. Sci. USA 2002, 99, 7280–7287. [Google Scholar] [CrossRef]
- GeoPandas Development Team. GeoPandas: Python Tools for Geographic Data . Available online: https://geopandas.org/ (accessed on 15 December 2024).
- Gillies, S. Shapely: Manipulation and Analysis of Geometric Objects . Available online: https://shapely.readthedocs.io/ (accessed on 15 December 2024).
- Hagberg, A.A.; Schult, D.A.; Swart, P.J. Exploring network structure, dynamics, and function using NetworkX. In Proceedings of the 7th Python in Science Conference (SciPy2008), Pasadena, CA, USA, 19–24 August 2008; pp. 11–15. [Google Scholar]
- Newson, P.; Krumm, J. Hidden Markov map matching through noise and sparseness. In Proceedings of the 17th ACM SIGSPATIAL International Conference on Advances in Geographic Information Systems, Seattle, WA, USA, 4–6 November 2009; pp. 336–343. [Google Scholar]
- Tirachini, A. Bus dwell time: The effect of different fare collection systems, bus floor level and age of passengers. Transp. A Transp. Sci. 2013, 9, 28–49. [Google Scholar] [CrossRef]
- Pydantic Development Team. Pydantic: Data Validation Using Python Type Hints . Available online: https://docs.pydantic.dev/ (accessed on 15 December 2024).
- Chainlit Development Team. Chainlit: Build Production-Ready Conversational AI Applications . Available online: https://docs.chainlit.io/ (accessed on 15 December 2024).
- Technologies, Uber. Kepler.gl: A Powerful Web-Based Geospatial Data Visualization Tool . Available online: https://kepler.gl/ (accessed on 15 December 2024).
- Guaguas Municipales. MetroGuagua: Recorrido y sistema de transporte masivo. Available online: https://www.guaguas.com/lineas/metroguagua/recorrido (accessed on 22 April 2026).
- Jobin, A.; Ienca, M.; Vayena, E. The global landscape of AI ethics guidelines. Nat. Mach. Intell. 2019, 1, 389–399. [Google Scholar] [CrossRef]
- Macharis, C.; Bernardini, A. Reviewing the use of Multi-Criteria Decision Analysis for the evaluation of transport projects: Time for a multi-actor approach. Transp. Policy 2015, 37, 177–186. [Google Scholar] [CrossRef]
- Creutzig, F.; Jochem, P.; Edelenbosch, O.Y.; Mattauch, L.; van Vuuren, D.P.; McCollum, D.; Minx, J. Transport: A roadblock to climate change mitigation? Science 2015, 350, 911–912. [Google Scholar] [CrossRef]
- Foth, N.; Manaugh, K.; El-Geneidy, A.M. Towards equitable transit: Examining transit accessibility and social need in Toronto, Canada, 1996–2006. J. Transp. Geogr. 2013, 29, 1–10. [Google Scholar] [CrossRef]
- Ji, Z.; Lee, N.; Frieske, R.; Yu, T.; Su, D.; Xu, Y.; Ishii, E.; Bang, Y.J.; Madotto, A.; Fung, P. Survey of hallucination in natural language generation. ACM Comput. Surv. 2023, 55, 1–38. [Google Scholar] [CrossRef]
- Innes, J.E.; Booher, D.E. Reframing public participation: Strategies for the 21st century. Plan. Theory Pract. 2004, 5, 419–436. [Google Scholar] [CrossRef]
- OECD Observatory of Public Sector Innovation (OPSI). Virtual Twin Singapore . Available online: https://oecd-opsi.org/innovations/virtual-twin-singapore/ (accessed on 29 April 2026).
- Green, B.; Chen, Y. The principles and limits of algorithm-in-the-loop decision making. Proc. ACM Hum. Comput. Interact. 2019, 3, 1–24. [Google Scholar] [CrossRef]
- Ewing, R.; Handy, S. Measuring the unmeasurable: Urban design qualities related to walkability. J. Urban Des. 2009, 14, 65–84. [Google Scholar] [CrossRef]
Figure 1.
High-level architecture of the system. The AI agent helps the user configure the simulation engine, which processes heterogeneous data and executes multimodal mobility simulations. Results are visualized through interactive tools enabling evidence-based decision support.
Figure 1.
High-level architecture of the system. The AI agent helps the user configure the simulation engine, which processes heterogeneous data and executes multimodal mobility simulations. Results are visualized through interactive tools enabling evidence-based decision support.
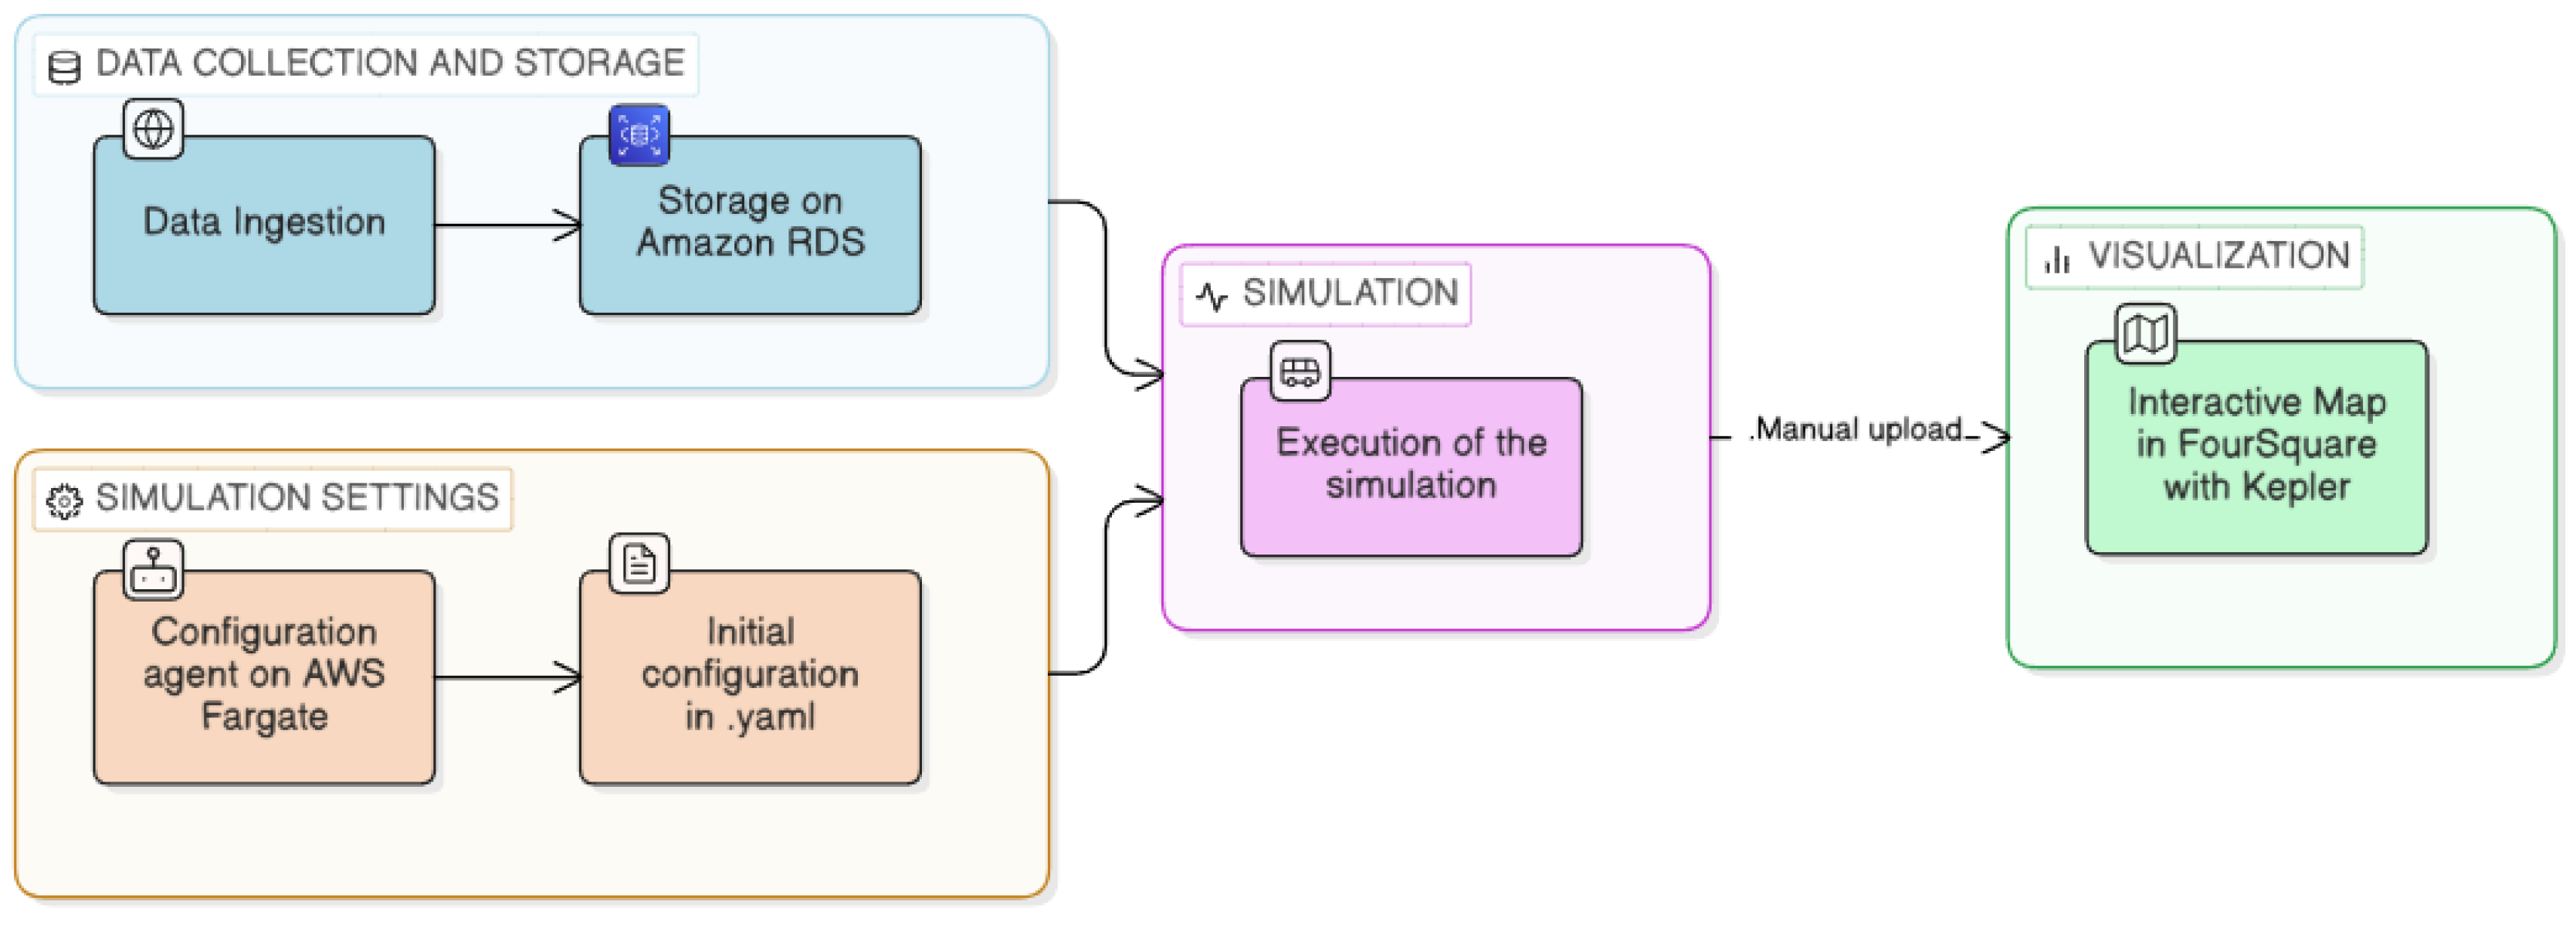
Figure 2.
Response of the AI agent when asked about the current configuration.
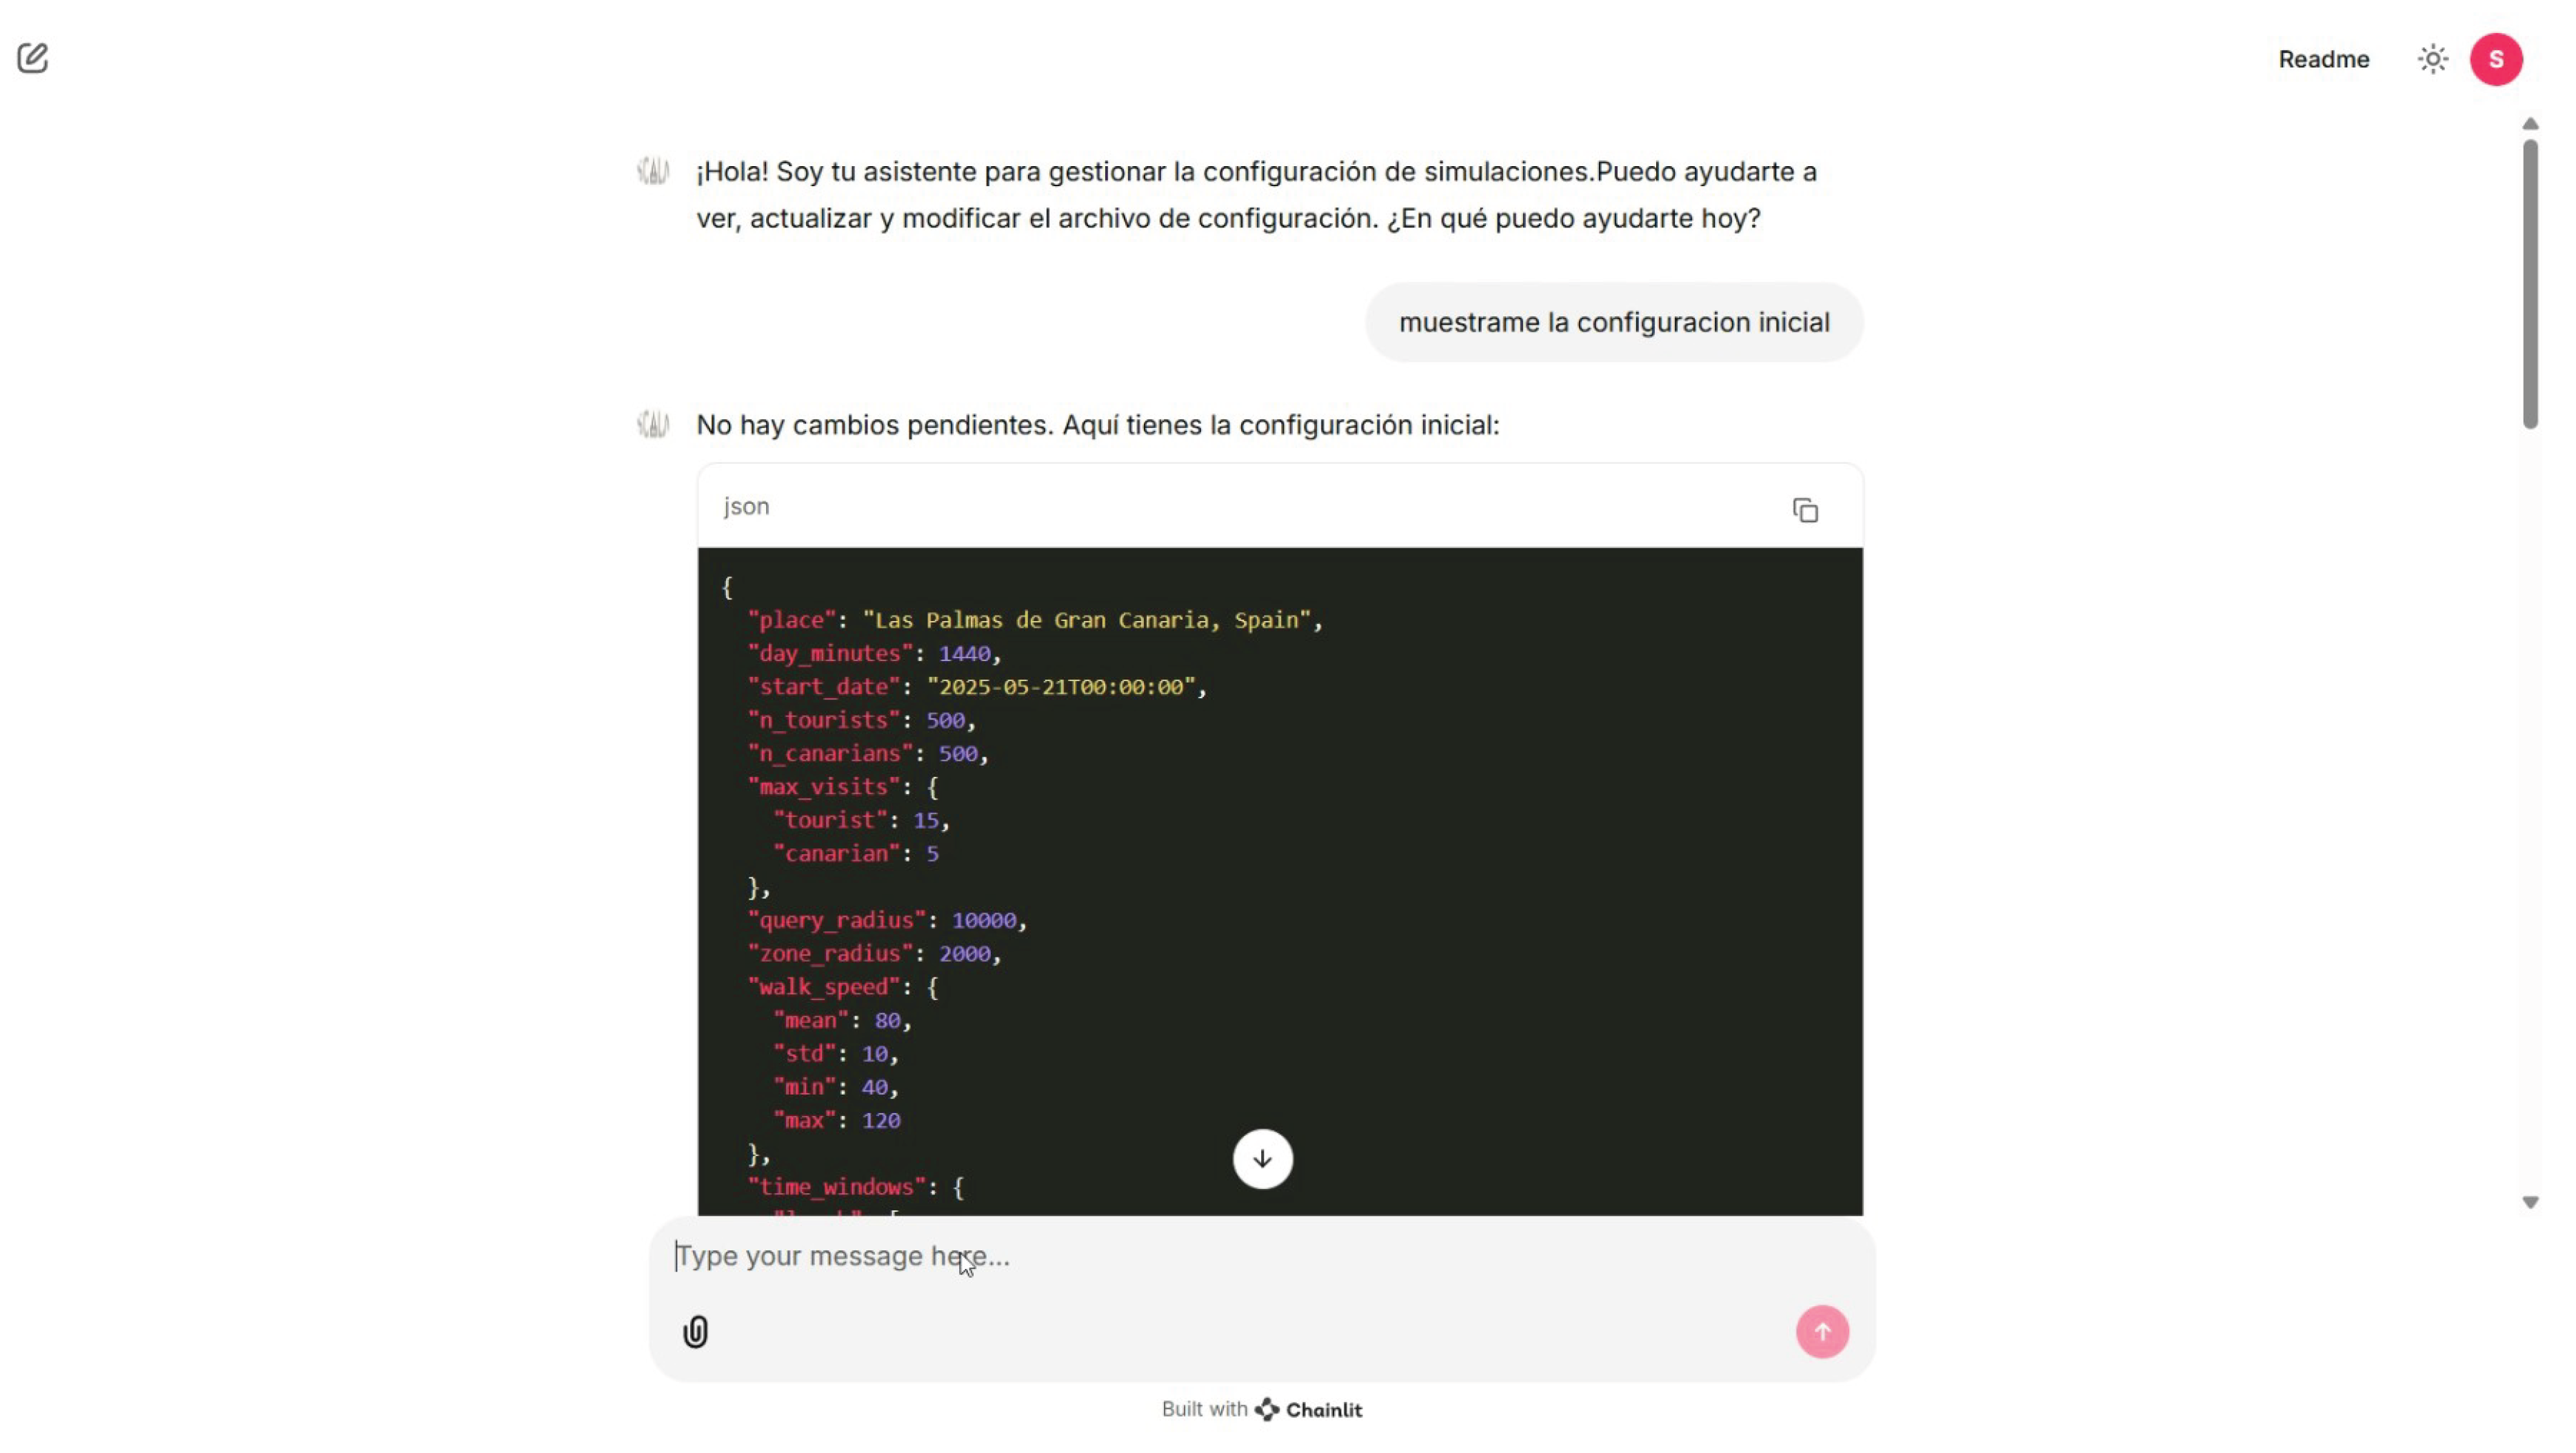
Figure 3.
Response of the AI agent when asked to make changes to two of the parameters in the configuration.
Figure 3.
Response of the AI agent when asked to make changes to two of the parameters in the configuration.
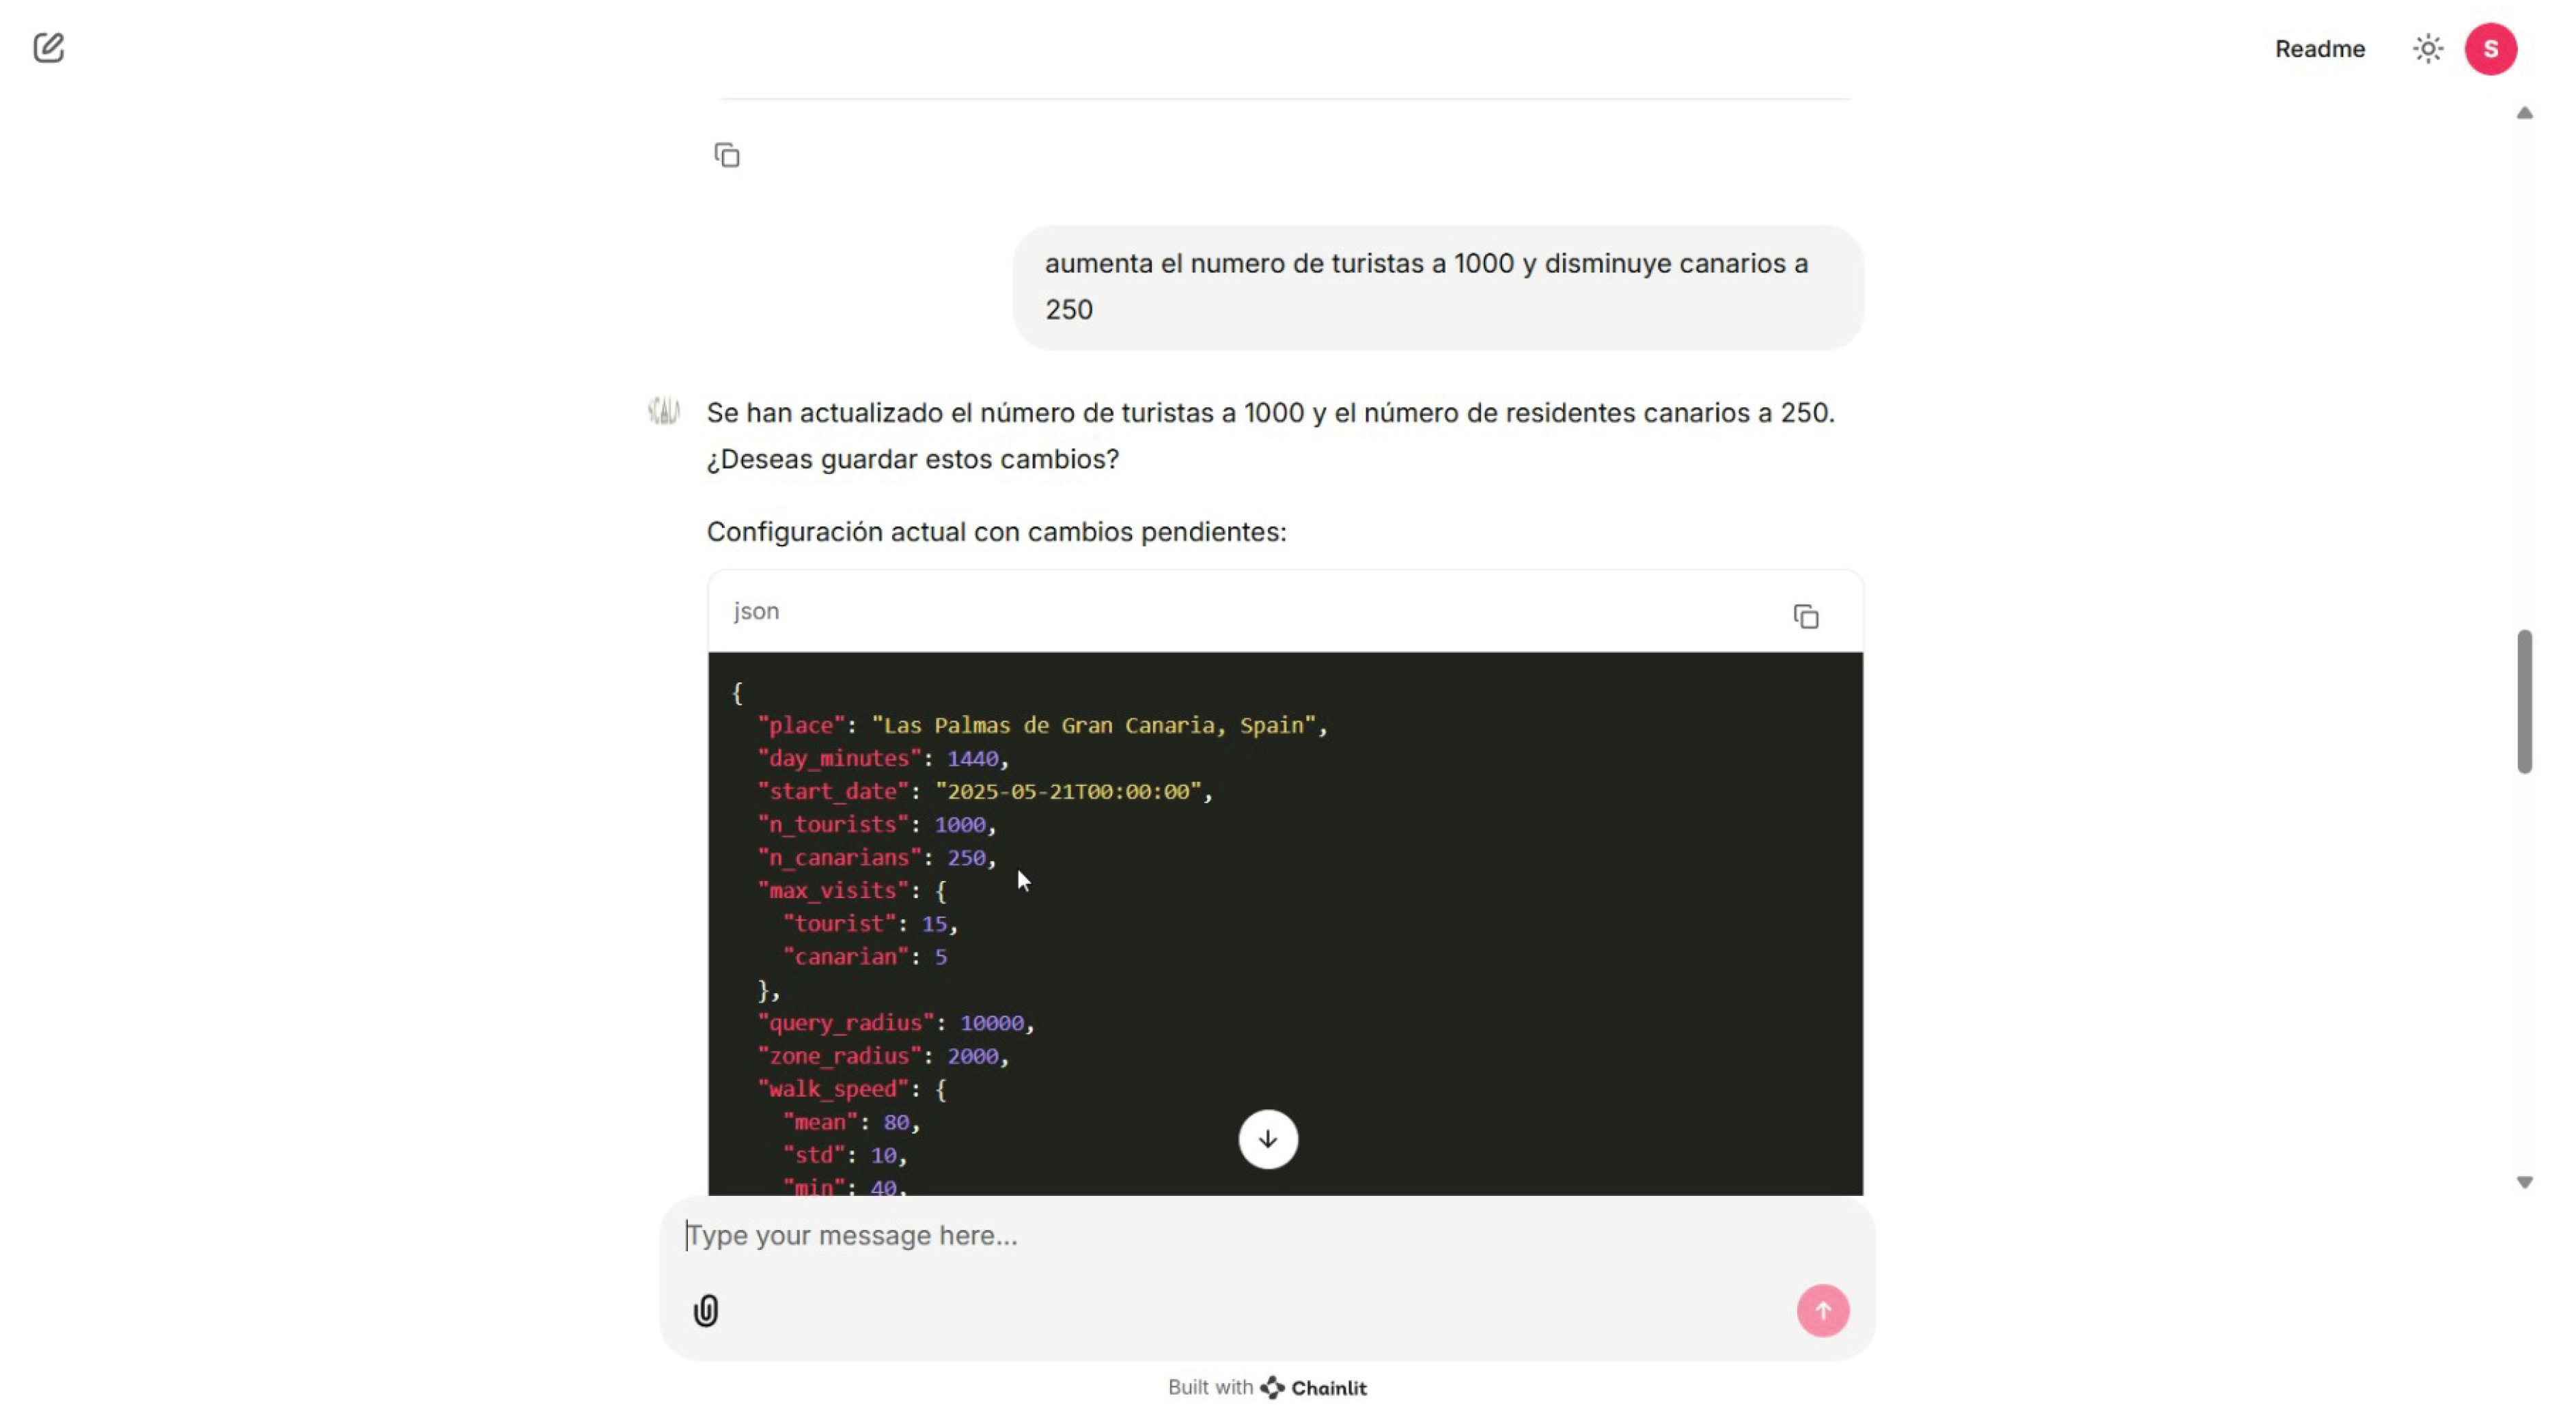
Figure 4.
Interactive map made using Kepler.gl and the results of a simulation. The yellow dots correspond to metroguaguas’ stops, while red dots are bus stops. The coloured lines represented are the different bus lanes and the planned metroguagua itinerary (in yellow). Each element can be clicked to read its properties. The user can interact with the layers and watch the simulated elements move across the city using controls similar to most video players.
Figure 4.
Interactive map made using Kepler.gl and the results of a simulation. The yellow dots correspond to metroguaguas’ stops, while red dots are bus stops. The coloured lines represented are the different bus lanes and the planned metroguagua itinerary (in yellow). Each element can be clicked to read its properties. The user can interact with the layers and watch the simulated elements move across the city using controls similar to most video players.
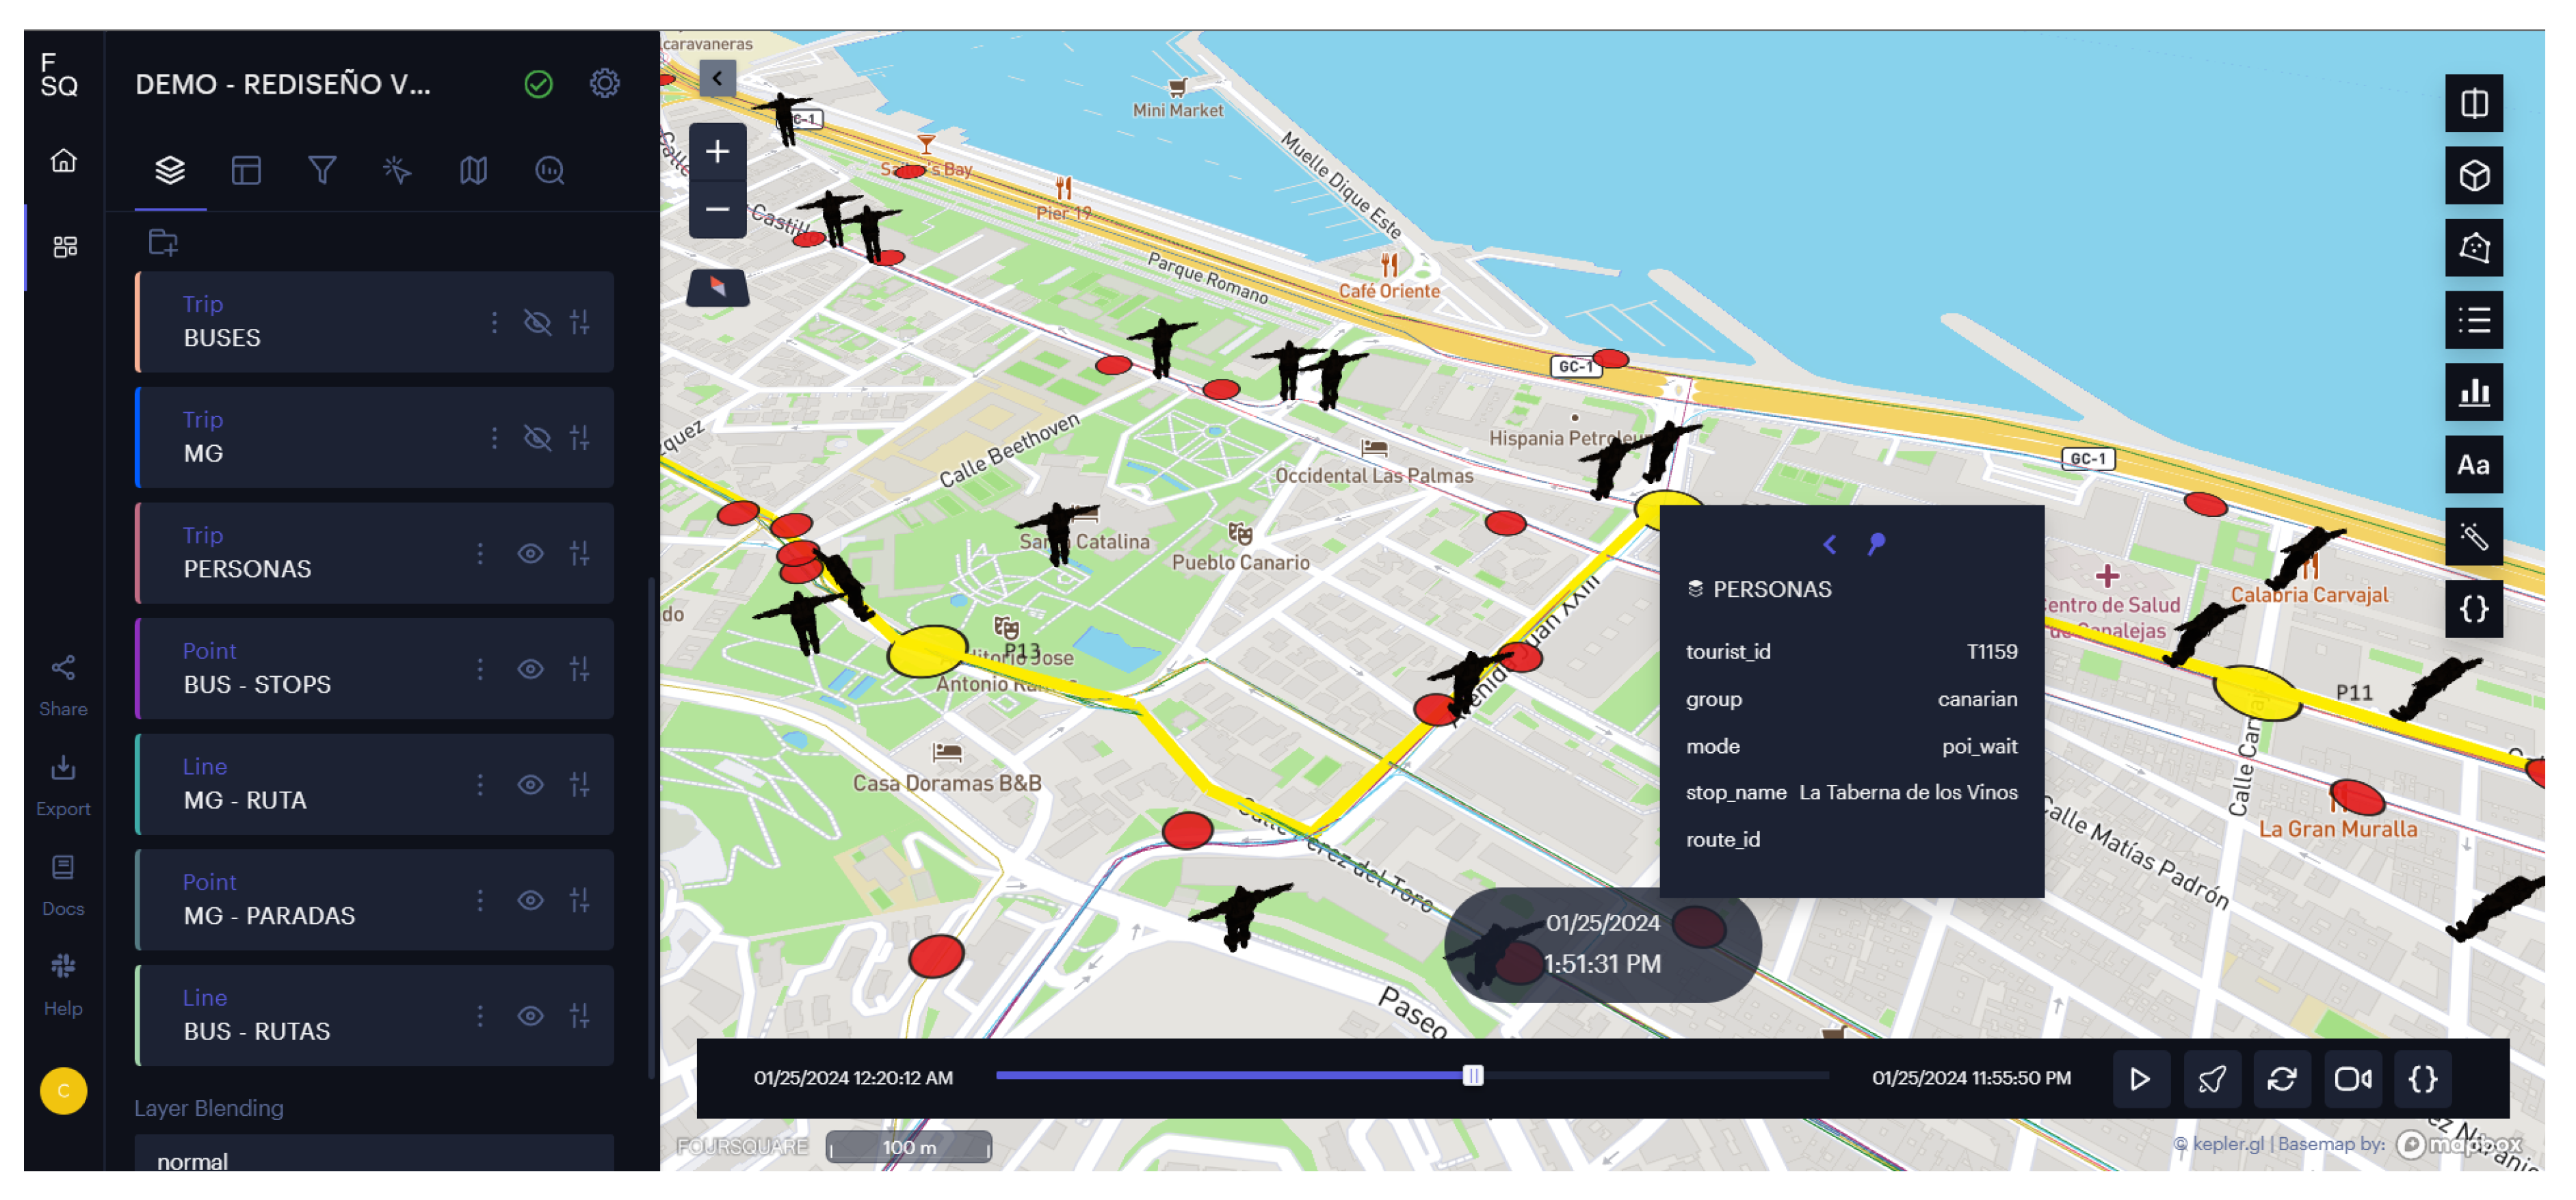

Table 1.
Summary of implementation technologies and infrastructure.
| Component | Technology/Tool | Version/Provider |
|---|---|---|
| Programming Language | Python | 3.11 |
| LLM for Conversational AI | Gemini 2.5 Flash Lite | Google Vertex AI |
| Conversational Framework | Chainlit | 2.6.2 |
| Discrete-Event Simulation | SimPy | 4.1.1 |
| Network Analysis | NetworkX, OSMnx | 3.4.2, 2.0.5 |
| Geospatial Processing | GeoPandas, Shapely | 1.1.1, 2.1.1 |
| Data Validation | Pydantic | 2.11.7 |
| Database | PostgreSQL with PostGIS | 17.5 |
| Containerization | Docker | 29.0.2 |
| Cloud Infrastructure | ECS Fargate, RDS, S3 | AWS |
| Frontend Framework | React, TypeScript | 19.1.0, 5.8 |
Table 2.
Conversational AI agent performance on configuration modification tasks.
| Task Category | Test Cases | Success Rate (%) |
|---|---|---|
| View current configuration | 10 | 100 |
| Modify single parameter | 15 | 93.3 |
| Modify multiple parameters | 10 | 90.0 |
| Launch the simulation using the modified configuration | 10 | 100 |
| Detect invalid or ambiguous requests | 5 | 100 |
| Overall | 50 | 95.99 |
Disclaimer/Publisher’s Note: The statements, opinions and data contained in all publications are solely those of the individual author(s) and contributor(s) and not of MDPI and/or the editor(s). MDPI and/or the editor(s) disclaim responsibility for any injury to people or property resulting from any ideas, methods, instructions or products referred to in the content. |
© 2026 by the authors. Licensee MDPI, Basel, Switzerland. This article is an open access article distributed under the terms and conditions of the Creative Commons Attribution (CC BY) license (http://creativecommons.org/licenses/by/4.0/).
Copyright: This open access article is published under a Creative Commons CC BY 4.0 license, which permit the free download, distribution, and reuse, provided that the author and preprint are cited in any reuse.


