

Submitted:
10 May 2026
Posted:
12 May 2026
You are already at the latest version
Abstract
The global energy crisis drives the search for sustainable biomass resources. Microalgae, particularly Chlorella vulgaris, represent a promising third-generation feedstock for bi-ochar and biofuels. However, detailed kinetic schemes for its slow devolatilization are still scarce. This work compares the thermogravimetric behavior of commercially Chlorella vulgaris with data reported in the literature under identical experimental conditions and develops a multi-stage kinetic scheme using model-free methods and simultaneous global optimization. A complete set of kinetic parameter is provided in conjunction with a mass wights in order to close the reaction scheme. Biological composition of microalgae was experimentally determined resulting in 21.20, 59.30 and 19.50% for carbohydrates, protein and lipids. Thermogravimetric (TG/DTG) analyses were conducted with 5, 10 and 20 °C/min heating rates. Activation energy distribution was obtained through isoconversional model-free methods (Fried-man, FWO, KAS and Starink). A parallel multi-stage kinetic model was subsequently optimized globally against the experimental data to determine the complete kinetic tri-plet (E, A, n). TG/DTG profiles exhibited in general a good agreement with the literature refer-ence in the number and the temperature of features, peaks and shoulders, however different in intensity probably due to the different amount of biological components, carbohydrates, proteins and lipids. The multi-stage model achieved excellent fitting quality accounting for 5 reactions. Activation energies for the principal devolatilization stages ranged from 140 to 220 kJ/mol, while ln(A) values lay between 20 and 35 s⁻¹. The findings an results provided by this study is considered useful for the community con-tributing with discussion and a robust kinetic scheme suitable for example for slow pyrolysis process simulation.
Keywords:
thermal analysis
; TGA
; DTG
; kinetics
; model-free
; iso-conversional
; Arrhenius parameters
; microalgae
; Chlorella vulgaris
1. Introduction
- i)
- Motivation
In terms of so-called "green energy," thermal and biological conversions of biomass are two alternatives for transforming feedstock into a sustainable pool of resources, such as chemical products and fuels. Such transformation is the reasoning behind current research to optimize the techniques and technologies to produce such chemical products and fuels from second- and third-generation sources [1].
- ii)
- Microalgae biomass as raw source for energy
A promising form of third-generation raw material is microalgae biomass, which has captured the growing interest of researchers mainly in the last fifteen years as a source of potential fuel, and high valued materials and chemicals. As stated by Demirbas et al. [2], microalgae are defined as photosynthetic organisms growing in aquatic environments, requiring sunlight, carbon dioxide, and nutrients from water. Microalgae possess outstanding characteristics that justify their study as a third-generation resource. Ahmad et al. [1] observed that microalgae can grow in places unsuitable for other crops, such as brackish or saline water or non-arable lands, while Costa et al. [3] noted that microalgae can be cultivated on land unfit for agriculture and farming activities. In this context, it is crucial to distinguish between microalgae that thrive in marine saline water and those in freshwater environments. For instance, Chlorella, one of the most important microalgae species today in the market is a marine species can growth in saline, brackish and severe environments [4]. The growth medium for microalgae is important in terms of freshwater usage, a critical issue for the future and related to human beings development. To obtain value-added products like biofuels or biomaterials from microalgae, processes such as lipid extraction for biodiesel production [5] or anaerobic digestion for biogas generation [6] have been developed. However, thermal decomposition processes, such as slow, fast, or flash pyrolysis and gasification, offer greater versatility but have not yet been sufficiently developed in terms of theory and technical aspects. Products derived from these thermal decomposition processes, such as biochar, tar, and gases, can have high added value in the modern bio industry. Within this framework, biochar, which constitutes the solid residue that remains after devolatilization in pyrolysis processes —especially slow pyrolysis—, is of significant interest given its multiple practical applications.
- iii)
- Applications for char
Mahmoud et al. [7] show that microalgal biomass-derived biochar can replace carbon black in rubber composites (NBR, SBR), enhancing mechanical properties and reducing fossil oil usage. Beyond microalgae, biochar from various sources is a co-product on energy, environmental, and industrial sectors. Altantzis et al. [9] state that char can be used as solid fuel, soil amendment, and as carbon sequestration agent in general or for agricultural uses. Alfattani et al. [8] add applications for water purification, electrode materials for supercapacitors, batteries, industrial materials, and medicinal applications. Kajda-Szcześniak et al. [10] list also CO2 capture, catalysis, desalination, electromagnetic interference shielding, and solar photothermal energy converters, highlighting the technological versatility. Sen et al. [11] in addition mentioned hydrogen storage for environmental and energy benefits. Wang et al. [12] focus on CO2 capture and supercapacitors electrodes for climate and energy storage solutions. These applications demonstrate the great value of high-quality biochar production justifying the research to account for the microalgal biomass as a natural and sustainable source.
- iv)
- Theoretical research using chemical kinetics
Research on the efficient, reliable and eco-friendly synthesis of biochar and other derived products can be performed experimentally, theoretically, or by a combination of both. Within an extended context of biorefinery, where value-added materials can also be obtained, theoretical research for example allows the parametric prospection of interactions among various transformation processes. Theoretical research, typically carried out by mathematical modeling and simulation through Computational Fluid Dynamics (CFD), requires detailed knowledge about the modeling of these transformation processes. For biochar synthesis from microalgae biomass and other materials via thermal decomposition, physicochemical properties, transport phenomena and chemical kinetic parameters are required. Under all these disciplines, chemical kinetics plays an essential role, as it constitutes the core of material transformation. In theoretical applications, it is frequently described through the so-called a reaction mechanism that is parametrized by the kinetic triplet, i.e., the activation energy E, the pre-exponential factor A and the reaction model parametrized in tur by the model order n.
- v)
- Lak of knowledge about chemical kinetics mechanisms of microalgae biomass
A barrier here arises because microalgae is a complex composite material, like lignocelulosic biomass. The thermal decomposition of complex materials such as woody, polymer, or microalgae biomass is not completely known or is very difficult to describe [13,14]. Microalgae biomass can be defined as a biological material composed of carbohydrates, lipids, and proteins, which can have different sub-components and, when subjected to a thermal decomposition process such as slow pyrolysis, interact in direct dependence on conditions such as temperature, heating rate and residence time.
At this point, a gap in the theory appears, as can be observed in the respective literature. For microalgae biomass, the kinetic framework, described by a reaction mechanism for devolatilization i.e. for slow, fast pyrolysis or gasification is not completely available so far, neither for a generic species nor for a specific species. Reaction mechanisms, composed by apparent kinetics parameters, are basically constructed with data derived from thermogravimetric experiments, whether in isothermal or non-isothermal conditions. Reaction mechanisms for devolatilization can be classified as competitive global, semi-global, or multi-stage types. The difference lies in the fact that in the former, more than one reaction competes for a single substrate, while in the latter, the components of a material decompose in parallel. In the case of lignocellulosic material global and semi-global reaction mechanisms have been widely developed by Di Blasi and Branca, mainly based on isothermal TG results [13,86,87,88,89,90,91,92] while a multi-stage semi-global mechanism with secondary reaction kinetics has been developed by Ranzi et al. [15] obtaining the kinetic data from different sources.
The use of thermal analysis of microalgae has basically focused, independently by different authors, on the characterization of devolatilization through TG experiments or in laboratory reactors in order to detect thermal features such as peaks and shoulders in a set of DTG profiles where the activation energy E is generally determined. Under this basic analysis, 48 articles [16,17,18,19,20,21,22,23,24,25,26,27,28,29,30,31,32,33,34,35,36,37,38,39,40,41,42,43,44,45,46,47,48,49,50,51,52,53,54,55,56,57,58,59,60,93,94,96] have been counted, that can be grouped into six categories of microalgae species —Chlorella 32 [16,17,18,19,20,21,22,23,24,25,26,27,28,29,30,31,32,33,34,35,36,37,38,39,40,41,42,43,44,93,94,96], Nannochloropsis 11 [25,30,32,34,42,43,44,45,46,47,48], Spirulina 9 [25,32,33,40,42,43,47,49,50] Dunaliella 5 [25,27,51,52,53], Scenedesmus 3 [25,30,48,54], and other species 8 [55,56,57,58,59,60,61,95]—. Of these 64 analyses (not papers), 44 have reported the activation energy E using some method, either model-free (isoconversional) or non-model-free. Of these runs, there are 18 cases where the pre-exponential factor A and the model (of the 1-α type) parameterized by the order n are also determined. However, A is not always determined using model-free methods, as the model is arbitrarily chosen.
The analysis presented above shows that only 40% of the available scientific reports provide data sufficiently complete for use in process simulations or estimative calculations of thermal decomposition. Moreover, not all reported data were obtained through validated kinetic methods. These findings indicate that the theoretical understanding of microalgal thermal decomposition remains incipient and is predominantly at the stage of basic kinetic characterization, focused mainly on the determination of activation energy E. Nonetheless, determining the complete kinetic triplet in a single thermal study is still insufficient for performing accurate simulations, as further extra parameters are needed.
Only two articles [39,58] have been identified where, in addition to the kinetic triplet (i.e., E, A, and n), a context for a mechanism or kinetic scheme is provided, defining each characteristic (peak and shoulder) of a thermogram as a reaction, configuring a multi-stage description. In these two articles the kinetic schemes a weight coefficient of mass fraction w is also provided —the extra parameter—, determined from the initial relative amount of a component. The first article from Biu et al. 2016 [39] has reported a devolatilization scheme using a first and n order model for Chlamydomonas and Chlorella sorokiniana, along with weights to adjust the initial mass and using only a one heating rate run. On the other hand, Sharara et al. 2014 [58] reported kinetic data using a set of first order reactions for consortia microalgae, along also with adjustment weights for initial mass. However, a separate and different set of kinetics were identified for each heating rate studied.
The mechanisms determined in the last two reviewed articles are specific to the microalga under study. It should be noted that these mechanisms cannot be generalized a priori. Such generalization would require first investigating the possible existence of fundamental characteristics common to all microalgae or, at least, to their main biological constituents (carbohydrates, proteins, and lipids).
The reaction mechanisms reported in the last two recent studies reviewed are specific to the microalga under investigation and cannot be generalized a priori. Any attempt at generalization would first necessitate examining whether fundamental features exist that are shared by all microalgae or by their primary pseudo-components (carbohydrates, proteins, and lipids), similar to the approach adopted in the mechanism developed by Ranzi et al. [15] for lignocellulosic biomass. This remains an open question that merits further systematic research highlighting the need for a more generalized multi-stage kinetic scheme. A complete kinetic scheme also enables deconvolution analysis, i.e., analyzing the overall thermogram disaggregated into its basic components, facilitating the correlation with the biological components of the microalga.
A comprehensive kinetic scheme further enables deconvolution analysis —i.e., the disaggregation of the overall thermogram into its individual contributing reactions— thereby facilitating a direct correlation with the biological components of the microalga (carbohydrates, proteins, and lipids). The central idea, therefore, is to identify common underlying elements in the kinetic characterization reported across the various studies.
The characterization of kinetics of devolatilization using model-free methods for E is widely used and useful because of these parameter is distributed across the temperature and allows association with a devolatilization rate profile (DTG), linking to the characteristics. In most cases, this E value has been determined using the Friedman, FWO, KAS, Starink methods, or a nonlinear method such as that developed by Vyazovkin and Dollimore [62]. The implementation of these methods generally yields similar but clearly significantly different values for E introducing a bias when comparing results across multiple articles thereby introducing an additional component of uncertainty into any generalization through meta-analysis.
Another element observed in the literature regarding the characterization of the devolatilization rate profile (DTG) is that peaks and shoulders are commonly associated with a component of the microalgae, even if not determined in that study. This fact is significant as it suggests a relationship between the temperature range in which a characteristic occurs and a component or its relative amount.
In fact, in 33 of the 44 reviewed articles, the content of carbohydrates, proteins, and lipids has been determined. The association of a characteristic with a component may be a criterion for evaluating the generalization of the devolatilization of microalgae, prior the association with apparent kinetic parameters. For example, it can be conjectured that a species from the same origin but from different production batch may exhibit slight but significant differences in the height of peaks and shoulders, but without major changes in its characteristic temperature at which these occur, it means, a temperature invariant.
The aforementioned conjecture opens the way for exploring the degree of sensitivity to origin. As formulated, sensitivity to origin implies that the same microalgal species, when grown under identical conditions and given its inherent species-specific compositional nature, may exhibit different relative amounts of biological components while displaying the same overall thermal behavior, albeit with varying intensities. Consequently, any preliminary analysis aimed at linking the characteristics of a thermogram to the relative quantities of these components should be preceded by the association of kinetic parameters. The key question is whether the current literature can adequately address this conjecture or whether further research is required. The following literature survey focuses on Chlorella vulgaris because it is one of the most extensively documented microalgal species in the scientific literature.
The composition of Chlorella vulgaris, a marine species, was analyzed by several researchers who reported the amounts of carbohydrates, proteins, and lipids: Agrawal & Chakraborty [29], 13.04%, 55.43%, 31.52% (corrected for free ashes); De Filippis et al. [26], 38.2%, 45.6%, 16.2%; Belotti et al. (nitrogen starved) [16], 35.3% (as a difference of lipid and proteins), 37.5%, 27.2%; Gong et al. [27], 21.2%, 47.4%, 15.6%; López-González [30], 12.4%, 58.1%, 13.5% and Wang et al. [63], 26.85%, 53.10%, 20.05%. In general, all authors reported a trend toward a higher concentration of proteins, even in the case of Belotti et al. [16]. This indicates that, average concentrations across these reports are 25.56 ± 10.8%, 52.85 ± 11.2%, and 21.59 ± 6.7% for carbohydrates, proteins, and lipids, respectively, considering a 95% confidence interval and a t-student distribution (all data corrected for ash content). Thus, it can be observed that proteins are the predominant component in these cases, although their relative quantities vary significantly. Nonetheless a great difference can be encountered for the same species due to growing conditions.
Adamakis et al. [20] studied three strains of Chlorella vulgaris under severe (LN-HL), moderate (MN-ML), and low (HN-LL) nitrogen restriction, an example of sensibility of origin, determining the following concentrations of carbohydrates, proteins, and lipids, respectively: 33.4%, 29.29%, 16.6%; 32.12%, 27.11%, 21.67%; 23.72%, 24.09%, 36.6%. This indicates that the relative component content is highly sensitive to growth conditions. Here there is an origin-related effect that makes more difficult to define kinetically without a comprehensive thermal study or under the framework of a conjecture related to an intrinsic characteristic such as the temperature invariant.
Comparing the results of Adamakis et al. [20], Agrawal & Chakraborty [29], De Filippis et al. [26], Belotti et al. [16], Gong et al. [27], and López-González et al. [30], it can be stated that protein content can also vary significantly depending on growth conditions. The analysis can be complemented by noting that Gong et al. [27] and López-González et al. [30] show that the devolatilization of Chlorella vulgaris develops practically as a single characteristic peak below 600°C, with maximum temperatures of 300°C and 344°C, respectively. The lack of a clear peak or shoulder at higher temperature, particularly in the case of López-González [30], corresponds well with the low lipid content value of 13.5%.
On the other hand, Agrawal & Chakraborty [29] and Belotti et al. [16] show devolatilization rate profiles where both the most intense peak occurs near 300°C, while at 277°C for De Filippis et al. [26]. However, all three profiles exhibit another characteristic, a shoulder, at a higher temperature. For Agrawal & Chakraborty [29] and Belotti [16], this second characteristic corresponds well with the high lipid content of 31.52% and 27.20% respectively. De Filippis et al. [26] also reports a devolatilization rate profile with a pronounced shoulder, almost a peak, at a higher temperature despite a lipid content of only 16.2%. The author suggests that this second characteristic corresponds to repolymerization of the residue. Judging by the temperature at which this characteristic occurs, around ~700°K (~427°C), then it seems more likely to be lipids. A further analysis performed on the composition reported by De Filippis [26] reveals that the reported carbohydrate content is high i.e., 38.2%, comparable to 45.6% of proteins and higher than 16.2% of lipids (noting that this is the highest carbohydrate content reported among the six authors). Consequently, the appearance of a characteristic at a higher temperature may be attributed to a reduced intensity of the protein decomposition flank due to the lower relative protein content. This suggests that a reaction for lipids is always present but it is overlapping with the flank of the protein reaction explaining the second shoulder.
From these articles, it can be inferred that the temperature at which the main characteristic occurs varies: 277°C in De Filippis et al. [26], close to 300°C in Agrawal & Chakraborty [29] and Belotti et al. [16], 300°C in Gong et al. [27], and 344°C in López-González et al. [30]. Then the conclusion can be apparently the characteristics occurs at different temperatures for the same species, the Chlorella vulgaris. However, in general, in the thermogravimetric analysis of microalgae, several authors have observed a more or less pronounced shift as the heating rate increases [62], although the sample size can be also a relevant factor. A more detailed survey, therefore, can be made with data reported in the literature.
In one hand, De Filippis et al. [26] reported 277°C for 10°C/min and a sample size of 7 mg, Agrawal & Chakraborty [29] reports approximately 300°C for 10°C/min and a TG sample size of 10 mg, and finally López-González et al. [30] reports 344°C for 40°C/min and a sample size of 20 mg. On the other hand, Gong et al. [27] reports 300°C but, 5°C/min for heating rate but not sample size was indicated. Belotti et al. [16] did not report heating rate nor sample size. Excluding Belotti et al. [16], these results suggest that De Filippis et al. [26] reports 277°C due to a small sample size and relatively low heating rate (10°C/min), which explains an early peak in the characteristic. At the same heating rate, Agrawal [29] reports approximately 300°C but with a 10 mg sample, which could account for the delay observed. In the case of López-González et al. 2014 [30], the value of 344°C could be explained by the higher heating rate of 40°C/min and the use of a 20 mg sample.
Consequently, the discussion and investigation regarding the effect of sample size and heating rate, which may introduce bias due to transport phenomena, remain open.
However, after a continued review of the abundant literature, it can be argue that the shift phenomenon observed in the thermal decomposition of microalgae is not merely a technical issue related to sample size or heating rate and its influence on heat and mass transport.
Sharara et al. [58] processed a small size of 5 mg of consortia microalgae at low heating rates of 5, 10, and 20°C/min, observing a strong and consistent forward shift. Chagas et al. [50] used Spirulina platensis at 20, 40, and 60°C/min with a even more smaller of 3 mg sample, observing also an evident and consistent forward shift. Badshah et al. [61] used Chara vulgaris microalgae with 5 mg samples at 5, 10, and 20°C/min, and the thermograms show a strong forward shift. Finally, Mohit et al. [60] used a polyculture microalgae with a 5 mg sample size at 12, 20, 30, and 40°C/min, also observing a forward shift as the heating rate increases.
This evidence from the literature suggests that the forward shift may be an inherent property of this material and not only an effect of transport phenomena. The literature review regarding the relationship between composition and the temperature at which a characteristic occurs indicates that at least, for Chlorella vulgaris species, one of the most studied species, this relationship may be effective. However, analysis remains pending for other families of species, such as Nannochloropsis or Spirulina. It could be hypothesized that the characteristic temperature for carbohydrates and proteins is similar for Chlorella vulgaris and does not change, but variations in peak intensity can be observed, including the appearance of a shoulder or an earlier peak for carbohydrates, as in the case of Raheem [22].
- vi.
- Objective
The literature review has demonstrated that, although a large number of studies have addressed the thermal decomposition and kinetic characterization of microalgae, the reported data cannot be directly employed for prospective calculations or process simulations. In particular, the sensitivity to biomass origin has been proposed such as key factor that requires more detailed examination to determine whether invariant features common to the devolatilization process exist across different sources. At the same time, the vast number of existing microalgal species and strains has highlighted the need to develop a generalized kinetic description as a systematic and methodical framework for parametric studies under comparable production scenarios. In this context, the present study aims to contribute toward addressing these open questions through the specific objectives detailed below.
Based on the literature review, this article aims to contribute by addressing aforementioned topics about: i) to explore the effect of sample size on the thermal response; ii) the sensitivity of the devolatilization profile with respect to the origin; and iii) developing a kinetic scheme for the slow devolatilization of a single species.
The first objective of this study arises from key evidence reported in the literature. Differences in the temperatures of characteristic peaks and shoulders observed across studies have frequently been attributed to the applied heating rate and sample size. Notably, temperature shifts in these features persist even when small sample masses are employed. This evidence suggests a possible overlap between transport phenomena and an inherent property of the microalgal devolatilization process. In order to address this effect, a set of TG runs were performed and compared for Chlorella vulgaris using different sample sizes, and the statistical significance of the observed differences was evaluated.
The second objective of this study is to assess the sensitivity of the thermogravimetric behavior to biomass origin comparing the characteristic response in a DTG. It is hypothesized that, although the relative content of the main biological components is sensitive to growth conditions, these components decompose at characteristic temperatures in the thermogram. Consequently, variations in composition is primarily expressed as changes in peak intensity and height rather than shifts in peak temperature. To address this objective, the experimental thermogravimetric conditions reported by Raheem et al. [22] were replicated in the present work using the same commercial Chlorella vulgaris. This species was selected due to its standardized commercial production by the same supplier, its relative large coverage in the scientific literature, and the fact that Raheem et al. [22] had already reported a thermal analysis of this biomass.
This research group is focused, in long term, on determining whether the slow thermal decomposition behavior of Chlorella vulgaris can be generalized into a single kinetic scheme that enables theoretical parametric simulations for studying reactor geometry, scaling rules, and techno-economic analysis. In line with this focus, the third objective of the present study is to develop a kinetic scheme for the slow thermal decomposition of Chlorella vulgaris. In addition to providing new kinetic parameters, such a scheme enables the description of the process through deconvolution analysis, thereby facilitating a direct correlation with the biological components (carbohydrates, proteins, and lipids) quantified in this study.
The results of this research are limited to only one species however the findings can contribute to give more clarity about the study of the thermal decomposition of Chlorella vulgaris, providing additional kinetic data, and develop a devolatilization scheme, which, according to the literature review, has not yet been fully reported.
2. Materials and Methods
2.1. Kinetics Analysis
The basic brick in a reaction mechanism for devolatilization is the one-step reaction shown in (1). If a material is composed by only one reactant, then the decomposition can be described by the following forward chemical reaction equation:
In dynamic chemistry, an additional equation must be defined that provides the finite rate of reaction of the consumption of the reactant B or, equivalently, the rate of production of C and D.
Equation (2) shows that the rate equation for reactant B depends on the kinetic coefficient and model function. A more suitable form to describe the overall process can be obtained with the use of the extent of reaction
where , and are the actual mass at time , the initial mass, and the final residue, respectively. Combining (2) and (3) yields
where the kinetic constant is frequently expressed by means of the Arrhenius equation
where A, E, R and T are the pre-exponential factor (), activation energy (J/mol), universal gas constant (J/mol/K), and absolute temperature (K). Therefore, a chemical process described dynamically can be expressed combining equations (4) and (5).
For the thermal analysis of pyrolysis, there is a set of reaction models generally related to the thermal decomposition of solid materials, such as lignocellulosic biomass or homogenous polymers and can used to describe the microalgae kinetics. Table 1 shows 14 models suggested by Vyazovkin et al. [77] and Zhou et al. [85] to study the devolatilization of solid materials.
In Table 1,and are the differential and integral forms of the reaction model, respectively. It is worth noting that the most common reaction mechanism used in eulerian-eulerian simulation of lignocellulosic biomass pyrolysis is the model 7, the Mampel first order reaction model, as can be verified in works of Mellin et al. [26], Xion et al. [27], Ranzi et al. [6], Trendewicz et al. [28] and Xue et al. [29], on the other hand reaction mechanism with order n can be used in tracking particle simulations or in simulation in which the fuel particle is immobile.
2.2. Kinetic Triplet from Experimental TG and DTG Data
For each basic reaction, the kinetic triplet must be determined. Generally, data obtained from TG and DTG analysis are used in conjunction with a fitting procedure performed in isothermal or non-isothermal conditions [77]. The most straightforward method to fit the experimental data is the one-heating rate method (OHR) applying a linear heating rate,
The mass loss rate function of the extent of reaction is converted by means of (3). A linearized form of (6) is obtained applying the Neperian logarithm in time basis
or in temperature basis
Assuming an arbitrary reaction model from Table 1, the activation energy E and the pre-exponential factor A can be determined as the slope and intercept. According to Vyazovkin et al. [77], there is a compensation effect between the three elements of the kinetic triplet, A, E, and . Therefore, practically all models in Table 1 fit the experimental data causing a bias or an ambiguous set of kinetic parameters.
2.3. Model-Free Methods
The model-free method is composed of a set of procedures to give an unambiguous kinetic triplet. The fundamental concept is to solve (6) in a different form as a function of the mass loss rate only and applying Neperian logarithm again.
Equation (10) allows to determine E without an arbitrary selection of the reaction model. Nevertheless, is necessary an additional method to determine unambiguously the pre-exponential factor A thus avoiding the compensation effect.
2.4. Iso-Conversional Methods
The iso-conversional method starts from the hypothesis that the reaction rate at a constant certain extent of conversion is only a function of the temperature [77]. Deriving (6) with respect to 1/T at a constant extent of reaction gives
Equation (11) allows the determination of the activation energy E using more than one experimental OHR run. The Friedman differential method is based on this concept, and taking the linearized form similar of (6) in time or temperature basis gives:
Using mass loss rate data and the respective temperature for constant at, at least, three different heating rates, the slope of the curve gives the activation energy E. An important observation is that the method of Friedman uses experimental or derived data obtained from the devolatilization rate profile. This type of profile often contains noise, requiring a smoothing method that may introduce bias in data interpretation.
2.5. Integral Methods
In order to avoid noisy data and numerical differentiation, the integral form of (6) can be used.
In (13), the integral of the model is replaced by the function listed in Table 1. The integral, on the right hand, is frequently named the temperature integral [77], and there is no analytical solution for it. In order to surpass the later barrier a redefinition of the argument of the exponential term inside the integral of (13) is generally used as:
An approximate solution is proposed named the Flynn, Ozawa and Wall (FWO) method giving [76]
The approximation of equation (15) can reach an accuracy of more than 95% for values of or . In order to obtain the distribution of the activation energy E as a function on the extent of reaction , at least three experimental runs must be performed at different heating rates . The linear regression procedure must be calculated at a constant conversion , by plotting v/s . The disadvantage of the method resides in the accuracy of the temperature integral approximation. Taking the approximation for [78] results in an accuracy of 95%. The approximation gives thelinearized form for regression procedure becomes
This equation is known as the Kissinger–Akahira–Sunose method (KAS). Another accurate integral method is the Starink method [76] which uses the following equation to obtain the activation energy distribution:
2.6. Pre -Exponential Factor
It is supposed that at least one of the reaction model or their derivate is the correct model for a one-step reaction of solid materials, and the other models that fits the same experimental data just only compensates the activation energy E and the pre-exponential factor A. Vyavzovkin & Linert [80] postulate that the compensation produced by the estimation of the kinetic parameters A and E, assuming different reaction models, obeys a linear relationship between called the compensation equation
This idea resides on the fact that exists an intersection point of the Arrhenius lines (straight lines produced from Eq. 18), named the Isokinetic Relationship (IKR) [80] obtained from the linearized Arrhenius equation
The factor can be the different reaction models, evaluated with the OHR method, that produce a linear variation [80] of ln(k) as a function of 1/T. An alternative definition of IKR can be obtained combining Eq. 19 and Eq. 6
This equation states that an IKR point be in the intersection of the curves ln(k) v/s 1/T and the temperature is the temperature where the RHS of Eq. 20 is least dependent of the factor . This definition permits to search an IKR point from experimental data. The definition has a topological characteristic, due to its implicit neighbor sense, that permits the search of an IKR from experimental data that not necessarily produces a unique common point of intersection between different experimental Arrhenius lines.
As demonstrated by Vyavzovkin & Linert [80], an IKR exists when the reaction model is the factor , allowing a method to determine the pre-exponential factor A using the value of the activation energy E estimated by any isoconversional method through eq. 19. Besides the fact that the isoconversional method can provide a distribution of the activation energy, the compensation method provide a distribution of the pre-exponential factor A as a function of the extent of reaction giving a comprehensive view of the devolatilization. The linear coefficients a and b are determined from values of the pre-exponential factor A using the OHR fitted method for at least four reaction models listed in Table 1 for the data set of 5°C/min while activation energy E is obtained for an isoconversional model-free method.
2.7. Kinetic Scheme
A multi-stage parallel reaction mechanism is proposed to describe the thermal decomposition of microalgal biomass and its components as is a complex material. The objective is to correlate the observed characteristics in the devolatilization profile, such as relevant peaks and shoulders, with a specific reaction. Each characteristic can be defined as a pseudo-component. This proposal assumes the superposition principle of Miller & Bejan (1997) [68], which considers that each pseudo-component decomposes independently of the others, neglecting interaction effects. A reaction model of order n, (1-α)n, is proposed, with a kinetic coefficient governed by the Arrhenius equation.
The parameters Ai, Ei, and ni for each pseudo-component are determined through non-linear optimization. However, the initial guess for the optimization process corresponds to the values of E and A is proposed here to be obtained from isoconversional methods. The total devolatilization rate is obtained from the sum, or superposition, of the contributions of all considered pseudo-components [58].
A constrain is over the weight
Total mass released is calculated by
Where and is the sample mass and the final residue.
The optimization process aims to minimize the error of the following objective function for the devolatilization rate:
Where , represent the observed experimental points and the observed devolatilization rate, respectively. For the mass loss profile:
The quality of the fit can be determined by [Biu, 2016]:
For the devolatilization rate and:
In order to solve the minimization problem given by system of equations (21) to (24), MATLAB toolbox software package is utilized.
2.8. Thermal Analysis of Complex Materials
Complex materials can be thermally decomposed by serial, parallel, and competitive reactions. The evidence of that behavior can be seen in direct observation of the TG and DTG analysis. In order to elucidate the mechanism with more details, the iso-conversional method serves as a useful tool due to serves as a discriminator to define a single step reaction analyzing the peak temperatures and the overlapped processes [30] commonly recognized by shoulders.
2.9. Thermogravimetric Experiments
In order to obtain a mas decay and the mass loss rate a TG analysis was performed.
One of the objectives of this research is to determine the sensitivity of the characteristics, such as peaks and shoulders, in a thermogram. The fundamental idea is to assess whether the temperature, magnitude, and shape at which a characteristic occurs correspond to the reference observations. This will be achieved by acquiring a commercial nutritional-grade microalga, expected to be produced under repeatable quality standards over time. Consequently, a stable sample is being evaluated.
As mentioned, the selected microalga is Chlorella vulgaris. Raheem et al. [22] utilized this species, obtained from PureBulk Inc. in the United States. This research proposes to replicate the experiment of Raheem et al. (2015) by analyzing 20 mg samples of microalgal powder, applying heating rates of 5, 10, and 20 °C/min.
Also pure nitrogen was used to sweep out the pyrolytic gases with a flow of 25 ml/min, and the heating processes started from room temperature 25°C to 1000°C as performed by Raheem et al. [22]. The sample of microalgae was loaded in an alumina ceramic crucible without a lid, in order to avoid secondary cracking reaction and interactions between the formed char and pyrolytic gases. The programmed heating rate was applied for each sample, and the temperature of the sample and the reference were recorded to determine the effective heating rate. For the thermal responses, a Perkin Elmer Simultaneous Thermal Analyzer (STA) 6000 was used.
The sample size used by Raheem is 20 mg. This sample size has been applied in other studies. However, this size may be considered large. Consequently, a survey was performed in order to assess the independence of sample size with respect to the thermal decomposition response. A comparison between the temperature and the extent of reaction α is proposed in order to evaluate, locally, each temperature against a specific value of α. The temperature of TG profiles of 5 mg samples (4 replicates) against the TG temperatures of samples of 3, 5, 15, and 20 mg at a heating rate of 20 °C/min were compared for the same value of the extent of reaction α. The following hypothesis test is then proposed considering the following null hypothesis H0: µ5mg = µvariable. Here, µ5mg represents the mean temperature of the 4 replicates with 5 mg samples, and µvariable is the mean temperature for the samples of 3, 5, 15, and 20 mg. The significance coefficient p considering a t-student distribution were used in order to evaluate the null hypothesis H0. The criteria of the proposed inference state that y p value is greater than 0.05 then H0 may not be rejected.
2.10. Data Treatment
Mass loss data over time from the TG experiment was obtained for the three heating programs defined in this work. In order to apply the OHR and different iso-conversional methods, the mass loss rate data was obtained through numerical differentiation. Since noisy data were expected, a low band filter was applied, taking windows of 200 data points and normalized data sets were obtained by using (3).
The iso-conversional differential method of Friedman (12), the integral methods FWO (15), KAS (16), and Satrink (17) were applied. Linear regression is calculated using code written in the polyfit MatLab function, which gives the regression parameter and the linear regression coefficient. The quality of regression is determined by means of the normalized coefficient of determination,
wherein the sum of squares and is the sample variance. To determine the pre-exponential factor A, the compensation effect presented in (24) is used.
2.11. Biological Components
Analysis of content of carbohydrates, proteins and lipids, expressed as mass fraction, was performed in this research in order to associate the different peaks of mass loss rate that have been calculated from TG analysis. Chlorella Vulgaris microalgae from Pure Bulk Inc. (USA) were used and the methodology to determine the amount of each component are described in detail in the paper of Muñoz et al. [69]. As explained in Muñoz et al. [69] proteins content was obtained suspending the microalgae in distilled water (water/microalgae 16:1). Also, lipid content was determined chemically by solvent separation using petroleum ether with an additional process to separate the solvent after extraction. Both remnants of proteins and lipids were measured gravimetrically. Finally, carbohydrate content was determined by difference using the following formula (eq. 29).
3. Results and Discussion
3.1. Sample Weight
In this research, the experimental conditions of Raheem et al. [22] were replicated, particularly with the sample size of 20 mg. Literature frequently recommends using small sample sizes to avoid heat or mass transport effects that bias the experiment often manifested as a shift in thermograms. It is suggested in TG studies to conduct a preliminary survey to rule out transport effects or apply an estimation based on the dimensionless Fourier number [81].
A 20 mg sample size has also been used by other authors. Figuera et al. [23] analyzed Chlorella vulgaris with 20 mg samples and observed a shift. Li et al. (2019) [49] analyzed Spirulina microalgae, following the TG methodology of Zhao et al. [83], using 20 mg samples and heating rates up to 100°C/min, with the former observing a moderate shift. Banihashemi et al. [56] used 20 mg to study Galdieria sulphuraria with heating rates of 5, 10, and 20°C/min, observing a shift. Lopez-Gonzalez et al. (2014) [], Kim et al. [52], and Wang et al. [36] used 20, 25, and 25–30 mg samples, respectively, for TG analysis of various microalgae species, observing a clear shift. However, as mentioned earlier, Sharara [58], Chagas [50], Badshah [61], and Mohit [60] used sample sizes of 3 and 5 mg, yet still observed significant shifts.
The local statistical analysis proposed in the methodology was applied, comparing the mean temperature observed in TG experiments conducted with 5 mg samples against four TG experiments with sample sizes of 3, 5, 15, and 20 mg. The results showed a value for H0: µ5mg - µvariable varying across temperature, with an average p-value of 0.29. This suggests that the null hypothesis may not be rejected and indicates that the shift also manifests with smaller sample sizes. However, Figure 1 shows a significant temperature difference around α = 0.84, corresponding to temperatures of approximately 527°C. According to Belotti et al.[16] and Figueira et al. [23] this temperature may correspond to lipid devolatilization. However, Kebelmann [72] in a more detailed analysis for Chlorella Vulgaris devolatilization indicates that up to 500°C, carbohydrates, proteins, and lipids are devolatilized, while above 500°C, only char residues remain. Furthermore, Lopez-Gonzalez et al. [30] set the char devolatilization temperature even higher pointing out that above 550°C, char decomposes. These temperatures can be considered close to, but higher than, those at which lipids devolatilize in Chlorella vulgaris. Consequently, most biological components devolatilize significantly before α = 0.70. As reported by Kebelmann [72], various lipid types in Chlorella Vulgaris may devolatilize at different temperatures. Thus, the difference observed in Figure 1 may be due to this effect or by the overlapping with gasification of carbonaceous residue. For the α range from 0.05 to 0.70, the main devolatilization zone p-value is lay on 0.37, allowing acceptance of the null hypothesis H0 and assuming there are no significant difference between using 20 mg and 5 mg samples.
Finally, another important observation from Figure 1 is that the thermogram difference between 5 and 15 mg samples is minimal, even at α = 0.82, despite a 10 mg difference in sample weight. Conversely, at α = 0.82, a greater difference is observed between 3 and 5 mg samples (2 mg difference) and between 15 and 20 mg samples (5 mg difference). In other words, two samples with a 10 mg difference exhibit similar behavior, while two samples with a 2 mg difference show distinctly different behavior. In summary, the use of 20 mg samples for TG, as conducted by Raheem et al. [22] and other authors, can be accepted, but these preliminary results encourage further investigation. Many authors consider this temperature as that of carbonaceous residue reduction.
3.2. Biologoical Components
Valuable information is provided by analyzing the composition of the microalgae in order to start the understandings about the devolatilization process, hence, several authors that have performed thermal analysis also have determined the carbohydrates, lipids and proteins contents. As has been reviewed before, authors Gong et al. [27], De Filippis et al. [26], Wang et al. [63], Belotti [16] Lopez-Gonzalez et al. [30] and Agrawal and Chakraborty [29] have reported the characteristic microalgae contents for Chlorella Vulgaris. Figure 2a shows the composition of the microalgae Chlorella Vulgaris obtained in this work in dry basis. Table 2 and Figure 2b presents a comparison between the compositions obtained in this study and results collected from the mentioned authors.
At first look the content of biological components can vary significantly for carbohydrates and lipids from source to source. As can be seen in Table 2 and Figure 2b values of lipids are similar excepting in the study of Belotti [16] who applied a starving of nitrogen to the species pointing out that result in a higher content of lipids. A higher value for lipids were reported also by [29], however the growth condition has not been reported in the study. According to Chisti [71] the differences in carbohydrates and lipids content can be attributed to the growing rate of the culture and growing conditions such as level of solar radiation, temperature, nutrients and indeed nitrogen availability. Results obtained in this study are in agreement with the literature, in where apparently protein is the dominant biological component in Chlorella vulgaris microalgae. However, significant variation among different sources can be observed. Therefore, differences in origin, as growing condition, are significant even for microalgae of the same species, even when arbitrary starving conditions are not applied to force higher content of a specific component.
Microalgae component distribution is useful in order to help the identification of the characteristic zones in thermograms establishing a potential link with a basic devolatilization reaction. As has been mentioned in the literature review, generally, the peaks and shoulders at lower temperatures are associated to the devolatilization of carbohydrates and proteins and at higher temperatures to lipids. Kebelmann et al. [72] has shown this characteristic by means of the thermal analysis of extracted components. The results obtained here are, in general, in agreement with the referenced authors, allowing the identification of the zones in the thermal analysis charts that are presented in the next subsection.
3.3. Thermal Analysis
Figure 3 shows the TG chart for the mass loss curve obtained directly from experiments. As can be seen in the Figure, devolatilization can be explained by three stages. At the initial stage, as suggested by Peng et al. [37] and Gong et al. [27], near 5% of the total sample mass is released. Second stage is attributed to zones with a higher slope between 200 and 500°C indicating the main devolatilization process. In stage 3 further mass is lost starting from 500°C, corresponding to char and carbonaceous residues thermal decomposition, according to Belotti et al. [16], Figueira et al. [23].
Figure 4 shows the calculated DTG thermogram as a function of temperature. In this Figure, the three stages are clear and shows several characteristics. The process starts with the moisture elimination (zone 1) followed by a main devolatilization, at Stage 2. The two clear peaks (zone 3 and zone 4), in addition to two shoulders (zone 2 and zone 5) at the start and at the end of stage 2, suggest a decomposition of four pseudo-components partially overlapped. As suggested by experimental results indicated in the literature these four characteristics can be attributed to the devolatilization of three biological components i.e. carbohydrates, proteins, and lipids [16,26,27,29,30,63]. Here, peaks and shoulders suggests the existence a complex process with more than one reaction simultaneously occurring during the thermal degradation of Chlorella Vulgaris.
The DTG profile obtained in the present study is similar to that reported by Raheem et al. [22] for Chlorella Vulgaris from the same commercial brand (Pure Bulk Inc., USA) and under the same experimental conditions. The similar behavior are particularly evident through the observation of the characteristic peaks and shoulders in Stage 2. In quantitative terms, Table 3 presents a comparison between the temperatures reported by Raheem et al. [22] and the temperatures of the characteristic obtained in the present study
The similar behavior is particularly evident through the inspection of the characteristic peaks and shoulders in Stage 2. In quantitative terms, Table 3 presents a comparison between the temperatures reported by Raheem et al. [22] and those obtained in the present study, especially showing that the temperatures in the peaks in zones 3 and 4 are very close for the three heating rates applied.
As proposed in the research, one of the objectives is to use a reference study, Raheem et al. [22], to compare results and evaluate the proposed issue of sensitivity in origin. According to thermogram Stage 2 is the main stage because of contains the release of volatiles. As shown in Table 3, the temperatures at which the two peaks occur in Stage 2 partially coincide with the peak observed in the reference study by Raheem et al [22]. In zone 3, this study notes that the temperatures for 5, 10, and 20 °C/min, compared to those of Raheem et al. [22], are 263°C and 280°C; 274°C and 273°C; and 285°C and 282°C, respectively. On the other hand, for the peak of zone 4 in this study, the temperatures observed and compared with Raheem et al. [22] are 320°C and 325°C; 331°C and 334°C; and 341°C and 342°C, respectively. Except for the first temperature in zone 3, 263°C (for 5 °C/min) in this study and 280°C in Raheem et al. [22], there is an agreement between the temperatures in both studies. This is expected, as the microalga is a species from a brand commercialized under a consistent standard over time. To address the observed difference in the peak temperature in zone 3, the Figure 5a reported by Raheem et al. [22] (Figure 4a) was used instead the data presented in the table reported in their article. By extracting approximate values using GetData Graph Digitizer software, the second peak observed in Figure 5a was determined to correspond to approximately 268 °C instead 280 reported by Raheem et al. [22], which is indeed in close agreement with the finding reported in the present study for the same heating rate of 5 °C/min, 263 °C. The present results indicate strong agreement with those reported by Raheem et al. [22] concerning the temperatures corresponding to the characteristic peaks.
About this zone 3 more important comparison about of the sensitivity can be made by analyzing the results for a heating rate of 5°C/min and discussing the following regarding the relative intensity of the characteristics. As observed in Figure 5a, the second peak in Raheem et al. [22] (from left to right) is higher than the second peak (zone 3) observed in this study. Conversely, the third peak in chart of Raheem et al. [22] is lower than the third peak (zone 4) observed in this study.
According with the data in Table 3 and the agreement aforementioned between the temperature of both peaks in both studies it can be conjectured that they correspond to the same pseudo-component. Following this conjecture, it can be inferred then that the pseudo-component devolatilizing near the lower temperature (peak 3 in this study) may be present in lower quantities in the sample processed by Raheem et al. [22] or exhibit a higher devolatilization rate. The same applies to zone 4 in this study and the third peak observed by Raheem et al. [22]; there is the same pseudo-component in both samples and that pseudo-component is less abundant in the sample analyzed in the current study.
Other aspect that can be seen on the peaks observed in Raheem et al. [22] appears narrower, nonetheless this may be due to image distortion, the relative height, and the smoothing method applied to raw data. Reference author give the mass loss rate in mg per second. Considering the order of the abscissa on the right hand of Figure 5 and a 20 mg of sample size the maximum mass loss rate on the reference lie in 0.012 %/min the same magnitude in the current study. Therefore, it can be suggested that the mass loss rate is similar and the relative amounts of pseudo components between samples is different. However, it can be stated that there are differences in the relative amounts of these two pseudo components between samples.
Another significant detail distinguishing the thermogram of this study from that of Raheem et al. [22] is the evident presence of a shoulder at the end of stage 2 in this study, which is not observed in the reference study. As previously noted, this shoulder is typically associated with lipid devolatilization and may suggest that the lipid content in the sample analyzed in the reference study is lower.
This result highlights the sensitivity of the composition of the microalga to its origin, where slight but significant changes in growth conditions can lead to different thermogram characteristics. The effect of these changes on determining the distribution of activation energy E and pre-exponential factor A must be analyzed. Consequently, in this research, thermal analysis data are processed using model-free methods to contribute to the overall analysis in the future.
It can also be mention is that these findings suggest that, beyond general component analysis, a more detailed analysis of proteins, composed of several amino acids [14], would be useful. Similarly, fatty acids, it can be also be detailed because of which may vary in type [27,72]. Finally, carbohydrates, which may include galactose, glucose, mannose, and glucosamine molecules [73,74], are complex components and can be devoted for more analysis. This additional information, providing a broader data pool, enables better correlation of results.
3.4. Kinetics
Figure 6 show the results for the distribution of activation energy E after applying the iso-conversional methods of Friedman, KAS, FWO and Starink while Figure 7a presents the COD R2 for the method of Starink. Figure 7b show simultaneously a chart with the distribution of activation energy obtained from Starink method and the rate of reaction at the same values of the extent of reaction α. Figure 8 show selected fitted lines for the various extent of reaction using the FWO, Starink and KAS methods. As can be seen in these figures from 8a to 8c, a good fitting is achieved from α 0.1 to 0.7, validating that thermal kinetic profile is well represented by the Arrhenius kinetic parameters.
The differential method of Friedman gives more oscillating values, probably caused by the introduction of artificial noise because of the use of numerical differentiation and starts to diverge significantly for α = 5. The devolatilization stages 1 and 2 defined in Figure 4 take place between the range of [0.1 0.7] for α with values of activation energy from 150 to near 400 kJ/kg. According to literature from 0 to 0.05 there is the moisture elimination characterized by a range of activation energy E below of 100 kJ/mol [22,27] and beyond 0.7 there is a carbonaceous devolatilization [72]. The integral methods of KAS, FWO and Starink yields practically the same values for all values of calculated and less oscillations due to the integral basis of the method.
Table 4 shows the distribution of activation energy E obtained using the Starink method, accompanied by the corresponding COF R² as a function of the advance of reaction α. E values determined by the Starink method will be used to obtain the pre-exponential factor A, as it is a more accurate method [76].
Figure 7a and Table 4 shows that the COD R2 for α in the range from 0.01 to 0.06 and from 0.1 to 0.7 is very close to 1, from 07 to 0.81 slightly under 0.9 however validating thus the fitting procedure from the Starink method. In the range of 0.06 to 0.1 there is a COD R2 as low as 0.45. This range correspond to a zone with a very low change in mass and therefore with an error comparable to the magnitude to the instrument uncertainty.
In the range between 0.1 to 0.7 for α the wide range of values for the activation energy E has been obtained from all the methods revealing a complex process in where more than one reaction composes the thermal decomposition of Chlorella Vulgaris. A straightforward way that may suggest the number of reactions can be inferred form Figure 7b.
Figure 7b shows a plot of the activation energy E and the mass loss rate as a function of the extent of reaction α obtained from the application of the Starink method. Chart presented in the latter Figure allows to propose a set of reactions for the global devolatilization of Chlorella Vulgaris. Consequently, a total of 5 independent reactions can be defined in order to fit the experimental data. Here, the shoulder barely observed in Figure 4 is evident and is defined as the reaction zone R5. Following the literature suggestions, this may correspond to lipid devolatilization and as shown in same the figure higher values of the activation energy can be associated with its devolatilization [72].
Table 5 presents the activation energy E values obtained in this study using the FWO and KAS methods. These data are compared with those obtained by Agrawal et al. [29] and Yang et al. [], who also analyzed Chlorella vulgaris. Table 5 shows a notable divergence in results compared to those of Agrawal et al. [29] using the same methods. However, there is better correspondence with the results of Yang et al., at least in terms of order of magnitude. Although Agrawal et al [29] used the isoconversional FWO and KAS methods, their results largely differ from those of Yang et al. [38] and the present study. A review of the article by Agrawal et al. [29] reveals that the major difference between the Chlorella Vulgaris strain used by Yuan et al. and that of the present study lies in its significantly higher lipid and lower carbohydrates contents (see Figure 2b and Table 2), a condition that commonly arises during nitrogen starvation [20]. However, it appears unrealistic to attribute the substantial difference in activation energy reported by Yuan et al. solely to this compositional difference.
3.5. Pre-Exponential Factor
Figure 9 plots the linear regression estimation to determine the factors a and b for (24) in order to obtain the compensation equation. Four models have been evaluated with the OHR methodology using (8) the Mampel first-order, one-dimensional boundary, two-dimensional boundary, and second-order models from Table 1, for zones 1, 3 and 4. Additionally, the power law reaction models for n = 1/2 and n = 1/4 were evaluated for zone 2. As can be seen in Figure 9, a good fitting was obtained, thus allowing the determination of the pre-exponential factor A. Values of factors a and b are presented for each stage evaluated in Table 6.
3.6. Kinetic Scheme and Multi-Stage Fitting
This section presents the results of the multi-stage kinetic optimization performed numerically and iteratively. Owing to the compensation effect between the activation energy E and the pre-exponential factor A, the system of equations (21)-(24) admits an infinite number of solutions. Therefore, solving the minimization problem with an arbitrarily assumed model may result in compensating pairs of E and A. Table 6 summarizes the ranges of E and ln(A) obtained for different values of the reaction extent alpha. These parameters were calculated using the Starink isoconversional method and provide a good approximation of the true effective kinetic values.
Each of the 5 zones identified in Figure 7b will be considered a reaction. The same values for reaction R4 is applied for reaction R5 due to the lack of reliable data. In Table 6, the limits of the extent of reaction for each reaction zone is defined based on the range of activation energy shown in Figure 7b. An average value of the activation energy E for each zone is presented and the corresponding value for LN(A) obtained from the compensation equation with the respective interval.
To determine a unique solution for the system of equations (21) to (24), an optimization process was conducted using a different initial assumption. This initial assumption was constructed by selecting three different points for each interval indicated in Table 6. The optimization adjustment process determined a unique set of kinetic parameters E, A, and n for each reaction, as defined in Table 6, which best fits the experimental results. The search interval in the optimization process was set broader than the interval suggested in Table 6 to improve the searching process. Figure 10 and Figure 11 graphically illustrate a good agreement for the fit for both the mass loss and the mass loss rate as a function of time. Figure 10 shows that the fit for mass loss is also in good agreement, particularly in the steepest part, where the main release of volatiles take place. Additionally, it can be noted that the final part of the process is underestimated for the 20 °C/min run and overestimated for the 5 °C/min run. The estimation is significantly better in the final part for the 10 °C/min run.
Figure 11 shows the fitting results for the mass loss rate curves obtained from the three experiments performed. Examination of the mass loss rate profiles provides greater detail regarding the effectiveness of the model fit
Table 7 summarizes the kinetic parameters obtained from the multi-stage optimization procedure and also presents the quality of fit (QOF) for both the TG mass loss and the DTG mass loss rate. These value of QOF reflect that a single set of parameters successfully describes the process across the three heating rates studied. The values of wi correspond to the absolute mass fraction of each devolatilized component; in this case, they account for a total of 74.3% (0.743) of the initial sample mass.
As can be observed, the QOFTG indicates a good agreement of the fitting process, approaching 100%, and the results are consistent across all heating rates. The value of QOFDTG yields a lower value for the run at 5 °C/min and the best value for the run at 20 °C/min. This is explained by a slight divergence of the model from the experimental results at lower temperatures, which increases the sum of squared residuals in Eq. (25) relative to the maximum mass loss rate recorded in that run. At 20 °C/min, the higher mass loss rate allows a better overall fit, thereby markedly improving the QOFDTG.
The QOF results obtained here can be compared with those reported by Bui et al. (2016) and Sharara et al. (2014). Bui et al. developed kinetic models of reaction order n = 1 (Mampel model) and n ≠ 1 for the microalgal species Chlamydomonas and Chlorella sorokiniana. The value of QOF reported were 98.34% and 98.69% for n = 1 model and 98.00% and 98.67% (for n ≠ 1) for Chlorella sorokiniana and Chlamydomonas, respectively. Although the fit achieved in the study is very good, it should be noted that Bui et al. performed only one run at 20 °C/min and did not apply an isoconversional model-free method; consequently, the effective parameters A and E were not independently determined as in the study presented here. This approach is valid, nonetheless, grants greater degrees of freedom and allow the parameter compensation, especially when fitting a single experimental run, which explains the high QOF values obtained.
Sharara et al. has determined a separate set of kinetic parameters for each run performed on a consortium microalgae and obtained QOF values (recalculated here for comparison) between 96.69% and 97.91% using a compensated model (i.e., without a model-free approach). It is evident that a high QOF can be achieved when a compensated kinetic model is fitted individually to each run rather than employing a single generalized model for multiple runs. Comparing the results of Sharara et al. [58] with those of the present work clearly illustrates the trade-off between achieving a good fit with a model (with kinetics parameters) for each run and obtaining a generalized model describing simultaneously a range of heating rate. The objective of this study is to develop a reaction scheme—preferably described by a single set of kinetic parameters—that can be practically applied for example in CFD simulations of slow pyrolysis in fixed-bed reactors. Consequently, the moderate decrease in QOF for certain values of heating rate is offset by the advantages of generality that can allow systematic surveys.
Table 8 demonstrates that the activation energy E obtained for each of the five reaction zones lie largely within the ranges provided by the isoconversional analysis. For zone reactions R1, R2, and R4, the values in Table 8 fall within the ranges proposed in Table 6, whereas R3 is slightly overestimated and R5 is slightly underestimated. The latter deviations are likely due to the uncertainty associated with the activation energy estimation at α = 0.8 (0.869). Nevertheless, the multi-stage optimization preserves the increasing trend of activation energy as a function of the advance of reaction α—and therefore with temperature—, evidencing that the compensation effect between A and E has been minimized under the interval limits imposed in the fitting procedure. As a result, a generalized fitted model with good QOF indicators is obtained while maintaining close agreement with the activation energy determined by the isoconversional method. This confirms that the primary procedure of determining activation energy is useful and effectively preserves the effective kinetic parameters. Regarding the pre-exponential factor A, a value within the expected range were obtained for reaction zone R2. For the remaining reaction zones —R1, R3, and R4—, the values are close to but outside the expected ranges. For reaction zone R5, however, the fitted value is substantially lower than the minimum of the interval, which is attributed to the high sensitivity introduced by the natural logarithm when dealing with large values of pre-exponential factor A.
3.6.1. Deconvolution Analysis
Figure 12 shows the experimental and fitted mass loss rate profiles at a heating rate of 5 °C/min, together with the deconvolution provided kinetic parameters obtained from the multistage procedure. This allows a second look at the relationship between the detected thermal characteristics, the set of reaction zones considered and the content of carbohydrates, proteins, and lipids, and also an overview of the fitting process.
Although the overall fit is very good, certain details can still be refined to further improve the kinetic scheme. In the overlapping region between reactions R2 and R3, the model does not fully capture the experimental data, underestimating the prediction around 210 °C. Likewise, the maximum observed in zone R3 is also underestimated by the fitted model.
It should be noted that the DTG curve is derived from the experimental data through numerical differentiation and that the raw profile exhibits excessive noise. To improve the prediction, a smoothing method such as a moving average can be applied. Consequently, the maximum value of the DTG profile in reaction zone 2 also depends on the window size used for the moving average. Nevertheless, the direct experimental TG data are captured very well by the model, as clearly shown in Table 7 (see QOFTG value), which ultimately validates the overall fitting procedure.
The simultaneous optimization allows each reaction to evolve independently while contributing to the total rate through superposition. This effect is clearly evident in the overall profile, where the long tail of reaction zone R2 contributes to the growth of the third calculated peak but also broadens it. The extended tail of reaction R2 arises mainly from the high reaction order n3 = 7.75 (see Table 7), which reduces the symmetry of the profile and shifts it forward, together with the specific combination of E, A, and mass fraction w3. This behavior results from the analysis of the thermogram characteristics, which suggests that only two main reactions occur in zones 2 and 3. According to the literature, the feature represented by the reaction zone R2 is frequently associated with carbohydrates, R3 and R4 with proteins, and R5 with lipids. In order to relate the literature observation with the finding in the present study Table 9 show a proposal of the distribution of mass in which the wi values corresponding to the gas released by each pseudo-component, grouped according to the literature classification. The analyzed gas (i.e., the contribution from R2 to R5) is reported on a dry basis; therefore, R1 (assumed to be moisture release) is excluded. In addition, the relative amounts of carbohydrates, proteins, and lipids that were also determined on a dry basis is presented in the same Table 9.
Although the reaction scheme developed here is derived from the observed characteristics of the thermograms, additional sources of information can provide further details to refine this scheme as future research. Aniza et al. [84] performed separate TG experiments on extracted proteins and lipids from Chlorella sorokiniana and Thraustochytrium sp., along with a biological substitute (model composed by glucose-starch) for carbohydrates. This type of research is very useful in order to account for the individual contributions of the different biological components, although there are some bias referent to interactions and degradation. Two important findings emerge from that study: (i) all components (at least those examined by the authors) decompose at two markedly different temperatures (low and high), and (ii) the absolute carbonaceous residue is approximately 15% for carbohydrates, 10% for proteins, and 2% for lipids. Similarly, Kebelmann et al. [72] observed that lipids from Chlorella vulgaris decompose in two overlapping temperature regions, suggesting the occurrence of more than one devolatilization reaction.
In one hand the result reported by Aniza et al. [84] reveal that the carbonaceous residue from biological models of carbohydrates, and extracted proteins and lipids are 20%, 10% and 5% respectively, and from the article proximate analysis the moisture content is 16.00%, 1.50% and 10.00% respectively. In consequence the expected distribution of the gas, in dry basis, may be 13.57%, 52.48% and 16.58% for carbohydrates, proteins and lipids respectively. As can be seen in Table 9 the total gas released in this study is 69.3% —subtracting the contribution of reaction R1, considered moisture—. Applying the gas distribution calculated from Aniza et al. [84] the expected gas distribution for the current study may be 9.4%, 36.4% and 11.5% for carbohydrates, proteins and lipids. Comparing the latter distribution with the resulting gas distribution due to the proposed assignation of reaction zones i.e 7.7%, 57.4% and 4.2% for carbohydrates, proteins and lipids reveal that the expected gas released for carbohydrates are very close. However, in the case of proteins and lipids the proposal overestimates the gas released by the proteins and underestimates the gas release for lipid, 57.4 to 36.4 and 4.2 to 11.5 respectively. The latter analysis suggest that an additional reaction may be proposed to split R3 or R4 in order to assign this R6 reaction to lipids.
This is in agreement with the finding by Aniza et al. [84] and Kebelmann et al. [72] that indicates the lipids is decomposed in two different temperatures 250 °C and 420 °C; and 300°C and 410°C respectively. However, in the case of Aniza et al. [84] the lipids were extracted form microalgae different than Chlorella Vulgaris. On the other hand, in the case of Kebelmann et al. [72], the experiments performed with lipids extracted from Chlorella Vulgaris did not clearly show the devolatilization of lipids occurring at two distinct temperatures.
Consequently, the devolatilization of lipids from Chlorella vulgaris at two distinct temperatures remains highly debatable in light of the findings reported in these studies. These findings indicate that the investigation of the reaction mechanism with effective kinetic parameters is still an open area of research, and that additional experiments are necessary.
The contribution of each pseudo-component to the final residue remains an open question for future research including more details about for example the type of fatty acids in microalgae chlorella vulgaris and further analysis of gas phase. This leads to the formulation of a new model that reconciles the experimentally determined biological composition, the gas release estimated by deconvolution, and the final residue mass.
4. Conclusions
This study began with the premise of analyzing the thermal response of microalgal devolatilization and addressing questions concerning the relationship between biological component content, thermogram characteristics, and the deconvoluted contribution of each pseudo-component. In parallel, with a focus on generalization, the sensitivity to biomass origin was examined through direct comparison with thermal analysis data from another study (Raheem et al. [22]) and the results reported here. Finally, a kinetic scheme for the slow thermal decomposition of Chlorella vulgaris based on kinetic data obtained by isoconversional (model-free) methods was constructed. The main findings are summarized as follows.
Regarding sample size, the findings provide no evidence to rule out the use of 20 mg samples of Chlorella vulgaris in TG experiments. However, experiments with 3 mg samples have proven repeatable and are recommended to minimize transport effects. Nevertheless, as observed in the literature, a temperature shift persists even with small sample sizes. This opens the door to important and necessary new research.
The comparison of the thermogravimetric analysis performed in this study with that of Raheem et al. [22] for the same commercial microalga from the same supplier reveals that differences can exist in the thermogram response, which not affect the temperatures in where the characteristics take place but indeed affect the intensity suggesting that the relative amount of biological components can vary even though for a commercial species. This highlights the sensitivity to biomass origin and underscores the practical utility of a generalized model that relies on relatively easy-to-determine characteristics, thereby avoiding the extensive parameter estimation required for each species and strain.
This study has developed the foundations of a reaction scheme for the devolatilization of Chlorella vulgaris starting from detailed kinetic analysis and providing a kinetic scheme for the devolatilization data showing a complex thermal decomposition consisting of three stages with five distinct zones. It is pointing out here that there is no other kinetic scheme reported in the literature covering a set of heating rates simultaneously for Chlorella vulgaris. Good agreement was achieved between experimental data and model predictions across different heating rates for both mass loss and mass loss rate. The work provides a solid starting point for developing a global reaction mechanism suitable for parametric studies of slow pyrolysis.
Considering the kinetic parameters provided by the multi-stage optimization, this study concludes that stage 1 and 2 are composed of more than one single-step parallel or competitive reaction (including moisture elimination R1) i.e R2, R3, R4, and R5. In contrast to the partial reaction schemes for microalgal biomass reported in the literature, the present results preserve the activation energies determined by the isoconversional method and the isokinetic relationship, thereby reflecting the intrinsic characteristics of the devolatilization process without excessive parameter compensation.
With respect to deconvolution analysis, beyond what is suggested by the thermogram characteristics alone, it is necessary to incorporate additional information—such as separate analysis of the individual components—to redefine zones where the fit may present weaknesses. This approach enables the definition of a mechanism based on the actual microalgal composition, avoiding fictitious compensated adjustments.
This validates the superposition of five parallel reaction zones, with R1 attributed to moisture release and R2–R5 to the primary devolatilization stages. The proposed assignment correlates R2 primarily with carbohydrates, R3 and R4 with proteins, and R5 with lipids, which is qualitatively consistent with the experimentally determined biological components (21.2% carbohydrates, 59.3% proteins, and 19.5% lipids on a dry basis). Nevertheless, the gas distribution derived from the model overestimates the protein contribution and underestimates the lipid fraction according to the values reported by Aniza et al. [84].
Although reference authors indicated that lipids can decompose at two distinct temperature ranges, these observations were obtained from species other than Chlorella vulgaris [84] in which did not clearly show the devolatilization of lipids occurring at two distinct temperatures, therefore is highly debatable the inclusion of an additional reaction zone (R6) to account for dual lipid decomposition and constitutes an important subject for future investigation.
As final words it can be stated that the resulting kinetic scheme faithfully preserves the activation energies obtained by isoconversional (model-free) methods and confirms the complex multi-stage nature of Chlorella vulgaris devolatilization, thereby providing a robust foundation for slow-pyrolysis reactor modeling and process simulation. The findings of this study represent a contribution to the understanding of the thermal decomposition of Chlorella vulgaris, given that few detailed studies exist for this specific species. Moreover, the developed kinetic scheme can be adapted and implemented in simulations of slow pyrolysis with short gas residence times for the production of high-quality char in the various applications mentioned earlier.
References
- Ahmad, A. L., Yasin, N. M., Derek, C. J. C., & Lim, J. K. Microalgae as a sustainable energy source for biodiesel production: a review. Renewable and Sustainable Energy Reviews, 15(1) (2011), 584-593. [CrossRef]
- Demirbas, A. (2010). Use of algae as biofuel sources. *Energy Conversion and Management, 51*(12), 2738–2749. [CrossRef]
- Costa, J. A. V., & De Morais, M. G. (2011). The role of biochemical engineering in the production of biofuels from microalgae. *Bioresource Technology, 102*(1), 2–9.
- Josephine, A., Kumar, T. S., Surendran, B., Rajakumar, S., Kirubagaran, R., & Dharani, G. (2022). Evaluating the effect of various environmental factors on the growth of the marine microalgae, Chlorella vulgaris. *Frontiers in Marine Science, 9*, Article 954622. [CrossRef]
- Hidalgo, P., Ciudad, G., & Navia, R. (2016). Evaluation of different solvent mixtures in esterifiable lipids extraction from microalgae Botryococcus braunii for biodiesel production. *Bioresource Technology, 201*, 360–364. [CrossRef]
- Sivaramakrishnan, R., Suresh, S., Kanwal, S., Ramadoss, G., Ramprakash, B., & Incharoensakdi, A. (2022). Microalgal biorefinery concepts’ developments for biofuel and bioproducts: Current perspective and bottlenecks. *International Journal of Molecular Sciences, 23*(5), Article 2623. [CrossRef]
- Mahmoud, D. S., El-Sabbagh, S. H., & Abdo, S. M. (2025). Advancements in microalgal biomass conversion for rubber composite applications. *Scientific Reports, 15*, Article 810. [CrossRef]
- Alfattani, R., Shah, M. A., Siddiqui, M. I. H., Ali, M. A., & Alnaser, I. A. (2022). Bio-char characterization produced from walnut shell biomass through slow pyrolysis: Sustainable for soil amendment and an alternate bio-fuel. *Energies, 15*(1), Article 1. [CrossRef]
- Altantzis, A.-I., Kallistridis, N.-C., Stavropoulos, G., & Zabaniotou, A. (2021). Apparent pyrolysis kinetics and index-based assessment of pretreated peach seeds. *Processes, 9*(6), Article 905. [CrossRef]
- Kajda-Szcześniak, M., Mainka, A., Ścierski, W., Pawlyta, M., Łukowiec, D., Matus, K., Turyła, K., Lot, D., Barańska, W., & Jabłońska, A. (2025). Activated carbon from selected wood-based waste materials. *Sustainability, 17*(7), Article 2995. [CrossRef]
- Sen, A. U., & Pereira, H. (2021). State-of-the-art char production with a focus on bark feedstocks: Processes, design, and applications. *Processes, 9*(1), Article 87. [CrossRef]
- Wang, X., Yang, S., Shen, B., Yang, J., & Xu, L. (2022). Pyrolysis of biomass pineapple residue and banana pseudo-stem: Kinetics, mechanism and valorization of bio-char. *Catalysts, 12*(8), Article 840. [CrossRef]
- Di Blasi, C. (2008). Modeling chemical and physical processes of wood and biomass pyrolysis. *Progress in Energy and Combustion Science, 34*(1), 47–90. [CrossRef]
- Moldoveanu, S. C. (1998). *Analytical pyrolysis of natural organic polymers* (Vol. 20). Elsevier.
- Ranzi, E., Cuoci, A., Faravelli, T., Frassoldati, A., Migliavacca, G., Pierucci, S., & Sommariva, S. (2008). Chemical kinetics of biomass pyrolysis. *Energy & Fuels, 22*(6), 4292–4300. [CrossRef]
- Belotti, G., de Caprariis, B., De Filippis, P., Scarsella, M., & Verdone, N. (2014). Effect of Chlorella vulgaris growing conditions on bio-oil production via fast pyrolysis. *Biomass and Bioenergy, 61*, 187–195. [CrossRef]
- Chen, C., Yang, S., & Bu, X. (2019). Microwave drying effect on pyrolysis characteristics and kinetics of microalgae. *BioEnergy Research, 12*, 400–408. [CrossRef]
- Karmakar, D., Tasnim, N., Hasan, M. R., Hossain, M. S., Arefin, P., Bhowmik, D., Nibir, Y. M., Kabir, K. B., & Karim, R. (2024). Kinetic study and modelling of drying of Chlorella vulgaris. *Heliyon, 10*(19), Article e38441. [CrossRef]
- Rawat, S., & Kumar, S. (2024). Thermal response estimation of de-oiled fresh and marine microalgae based on pyrolysis kinetic studies and deep neural network modeling. *BioEnergy Research, 17*(1), 570–586. [CrossRef]
- Adamakis, I.-D., Lazaridis, P. A., Terzopoulou, E., Torofias, S., Valari, M., Kalaitzi, P., Rousonikolos, V., Gkoutzikostas, D., Zouboulis, A., Zalidis, G., & Triantafyllidis, K. S. (2018). Cultivation, characterization, and properties of Chlorella vulgaris microalgae with different lipid contents and effect on fast pyrolysis oil composition. *Environmental Science and Pollution Research, 25*(23), 23018–23032. [CrossRef]
- Mane, S., Singh, A., & Taneja, N. K. (2025). Pretreatment optimization for microalgae oil yield enhancement and residual biomass characterization for sustainable biofuel feedstock production. *Biomass Conversion and Biorefinery, 15*, 9859–9874. [CrossRef]
- Raheem, A., Sivasangar, W. A. K. G., Wan Azlina, W. A. K. G., Taufiq Yap, Y. H., Danquah, M. K., & Harun, R. (2015). Thermogravimetric study of Chlorella vulgaris for syngas production. *Algal Research, 12*, 52–59. [CrossRef]
- Figueira, C. E., Moreira, P. F., Jr., & Giudici, R. (2015). Thermogravimetric analysis of the gasification of microalgae Chlorella vulgaris. *Bioresource Technology, 198*, 717–724. [CrossRef]
- Rizzo, A. M., Prussi, M., Bettucci, L., Libelli, I. M., & Chiaramonti, D. (2013). Characterization of microalga Chlorella as a fuel and its thermogravimetric behavior. *Applied Energy, 102*, 24–31. [CrossRef]
- Bach, Q. V., & Chen, W. H. (2017). Pyrolysis characteristics and kinetics of microalgae Chlorella vulgaris ESP-31, Chlorella spp., Chlorella pyrenoidosa, Dunaliella tertiolecta, Nannochloropsis gaditana, Scenedesmus almeriensis, and Spirulina platensis via thermogravimetric analysis (TGA): A state-of-the-art review. *Bioresource Technology, 246*, 88–100. [CrossRef]
- De Filippis, P., De Caprariis, B., Scarsella, M., & Verdone, N. (2014). Double distribution activation energy model for microalgae pyrolysis. In *Proceedings of the 5th International Conference on Development, Energy, Environment, Economics (DEEE '14)*, Florence, Italy, November 22–24, 2014.
- Gong, X., Zhang, B., Zhang, Y., Huang, Y., & Xu, M. (2013). Investigation on pyrolysis of low lipid microalgae Chlorella vulgaris and Dunaliella salina. *Energy & Fuels, 28*(1), 95–103.
- Hu, M., Chen, Z., Guo, D., Liu, C., Xiao, B., Hu, Z., & Liu, S. (2015). Thermogravimetric study on pyrolysis kinetics of Chlorella pyrenoidosa. *Bioresource Technology, 177*, 41–50. [CrossRef]
- Agrawal, A., & Chakraborty, S. (2013). A kinetic study of pyrolysis and combustion of microalgae Chlorella vulgaris using thermo-gravimetric analysis. *Bioresource Technology, 128*, 72–80. [CrossRef]
- López-González, D., Fernandez-Lopez, M., Valverde, J. L., & Sanchez-Silva, L. (2014). Pyrolysis of three different types of microalgae: Chlorella vulgaris, Nannochloropsis gaditana, and Scenedesmus almeriensis. *Energy, 73*, 33–43. [CrossRef]
- Yuan, T., Tahmasebi, A., & Yu, J. (2015). Comparative study on pyrolysis of lignocellulosic and algal biomass using a thermogravimetric and a fixed-bed reactor. *Bioresource Technology, 175*, 333–341. [CrossRef]
- Binda, G., Spanu, D., Bettinetti, R., Magagnin, L., Pozzi, A., & Dossi, C. (2020). Comprehensive comparison of microalgae-derived biochar from different feedstocks: Chlorella vulgaris, Nannochloropsis sp., and Spirulina sp. *Algal Research, 52*, Article 102103. [CrossRef]
- Kong, W., Shen, B., Ma, J., Kong, J., Feng, S., Wang, Z., & Xiong, L. (2022). Pyrolysis of Spirulina platensis, Tetradesmus obliquus, and Chlorella vulgaris by TG-FTIR and Py-GC/MS: Kinetic analysis and pyrolysis behaviour. *Energy, 244*, Article 123165. [CrossRef]
- Ali, S. A. M., Razzak, S. A., & Hossain, M. M. (2015). Apparent kinetics of high temperature oxidative decomposition of microalgal biomass. *Bioresource Technology, 175*, 569–577. [CrossRef]
- Sharma, A. K., Ghodke, P., Sharma, P. K., Manna, S., Pugazhendhi, A., Matsakas, L., & Patel, A. (2024). Holistic utilization of Chlorella pyrenoidosa microalgae for extraction of renewable fuels and value-added biochar through in situ transesterification and pyrolysis reaction process. *Biomass Conversion and Biorefinery, 14*, 5261–5274. [CrossRef]
- Wang, X., Wang, Y., Guo, J., Zhao, Y., Wang, X., Zhang, X., & Chen, Z. (2024). Behaviors and non-isothermal kinetics of Chlorella pyrenoidosa fodder pyrolysis by a modified kinetic compensation effects and a parallel two-step reaction model. *Biomass Conversion and Biorefinery, 14*(4), 5589–5600. [CrossRef]
- Peng, W., Wu, Q., Tu, P., & Zhao, N. (2001). Pyrolytic characteristics of microalgae Chlorella protothecoides as renewable energy source determined by thermogravimetric analysis. *Bioresource Technology, 80*(1), 1–7. [CrossRef]
- Yang, X., Zhang, R., Fu, J., Geng, S., Cheng, J. J., & Sun, Y. (2014). Pyrolysis kinetic and product analysis of microalgal biomass Chlorella sorokiniana 21 by distributed activation energy model and pyrolysis–gas chromatography–mass spectrometry. *Bioresource Technology, 163*, 335–342. [CrossRef]
- Bui, H. H., Tran, K. Q., & Chen, W. H. (2016). Pyrolysis of microalgae residues Chlorella sorokiniana CY1. *Bioresource Technology, 199*, 362–366. [CrossRef]
- Gai, C., Zhang, Y., Chen, W. T., Zhang, P., & Dong, Y. (2013). Thermogravimetric and kinetic analysis of thermal decomposition characteristics of low-lipid microalgae Chlorella pyrenoidosa. *Bioresource Technology, 150*, 139–148. [CrossRef]
- Chen, C., Ma, X., & Liu, K. (2011). Thermogravimetric analysis of microalgae combustion under different oxygen supply concentrations. *Applied Energy, 88*(9), 3189–3196. [CrossRef]
- Cano-Pleite, E., Rubio-Rubio, M., Riedel, U., & Soria-Verdugo, A. (2021). Evaluation of the number of first-order reactions required to accurately model biomass pyrolysis of Chlorella vulgaris, Isochrysis galbana, Nannochloropsis gaditana, Nannochloropsis limnetica, Phaeodactylum tricornutum, and Spirulina platensis. *Chemical Engineering Journal, 408*, Article 127291. [CrossRef]
- Soria-Verdugo, A., Goos, E., García-Hernando, N., & Riedel, U. (2018). Analyzing the pyrolysis kinetics of several microalgae species: Chlorella vulgaris, Isochrysis galbana, Nannochloropsis gaditana, Nannochloropsis limnetica, Phaeodactylum tricornutum, and Spirulina platensis by various differential and integral isoconversional kinetic methods and the distributed activation energy model. *Algal Research, 32*, 11–29. [CrossRef]
- Ceylan, S., & Kazan, D. (2015). Pyrolysis kinetics and thermal characteristics of microalgae Nannochloropsis oculata. *Bioresource Technology, 187*, 1–5. [CrossRef]
- Sanchez-Silva, L., López-González, D., Villaseñor, J., Sánchez, P., & Valverde, J. L. (2012). Thermogravimetric–mass spectrometric analysis of lignocellulosic and marine biomass pyrolysis: Nannochloropsis gaditana. *Bioresource Technology, 109*, 163–172. [CrossRef]
- Zhang, L., Liu, J., Li, D., Yang, Z., Wang, X., & Lin, R. (2022). Research on the thermochemical conversion utilization of nitrogen-rich microalgae: Two-step catalytic pyrolysis of Nannochloropsis sp. *Energy Conversion and Management, 258*, Article 115475. [CrossRef]
- Tang, Z., Chen, W., Chen, X., Xia, M., Chen, Y., Yang, H., Chen, H., & Liu, X. (2023). Thermal behavior and kinetic mechanism of model compounds: soybean protein (PT), sunflower oil (OL), sucrose (SC), Nannochloropsis sp., and Spirulina platensis. *Fuel, 344*, Article 128037. [CrossRef]
- López-González, D., Puig-Gamero, M., Acién, F. G., García-Cuadra, F., Valverde, J. L., & Sanchez-Silva, L. (2015). Energetic, economic and environmental assessment of the pyrolysis and combustion of microalgae: Scenedesmus sp. *Renewable and Sustainable Energy Reviews, 51*, 1752–1770. [CrossRef]
- Li, J., Qiao, Y., Zong, P., Wang, C., Tian, Y., & Qin, S. (2019). Thermogravimetric analysis and isoconversional kinetic study of biomass pyrolysis: Spirulina. *Energy & Fuels, 33*(4), 3299–3310. [CrossRef]
- Chagas, B. M. E., Costa, C. C., Chagas, M. B., Paula, S. A. F., Braga, R. M., Melo, M. A. F., Aguiar, E. M., Oliveira, J. A., Souza, J. R., & Ataíde, C. H. (2021). Kinetic study and pyrolysis: GC/MS products analysis of Spirulina platensis cultivated under a different growing medium. *Journal of Thermal Analysis and Calorimetry, 143*, 3161–3171. [CrossRef]
- Shuping, Z., Yulong, W., Mingde, Y., Chun, L., & Junmao, T. (2010). Pyrolysis characteristics and kinetics of the marine microalgae Dunaliella tertiolecta using thermogravimetric analyzer. *Bioresource Technology, 101*(1), 359–365. [CrossRef]
- Kim, S. S., Ly, H. V., Kim, J., Lee, E. Y., & Woo, H. C. (2015). Pyrolysis of microalgae residual biomass derived from Dunaliella tertiolecta after lipid extraction and carbohydrate saccharification. *Chemical Engineering Journal, 263*, 194–199. [CrossRef]
- Wu, K., Liu, J., Wu, Y., Chen, Y., Li, Q., Xiao, X., & Yang, M. (2014). Pyrolysis characteristics and kinetics of aquatic biomass: Dunaliella tertiolecta A and B. *Bioresource Technology, 163*, 18–25. [CrossRef]
- Chen, W. H., Wu, Z. Y., & Chang, J. S. (2014). Isothermal and non-isothermal torrefaction characteristics and kinetics of microalga Scenedesmus obliquus CNW-N. *Bioresource Technology, 155*, 245–251. [CrossRef]
- Arbeláez, A. A., Giraldo, N. D., Pérez, J. F., & Atehortúa, L. (2019). Pyrolysis kinetics using TGA and simulation of gasification of the microalga Botryococcus braunii. *BioEnergy Research, 12*, 1077–1089. [CrossRef]
- Banihashemi, F., Ibrahim, A. F., Deng, S., & Lin, J. Y. (2023). Pyrolysis and gasification characteristics of Galdieria Sulphuraria microalgae. *BioEnergy Research, 16*(1), 611–621. [CrossRef]
- Sanchez-Silva, L., López-González, D., Villaseñor, J., Sánchez, P., & Valverde, J. L. (2012). Thermogravimetric–mass spectrometric analysis of lignocellulosic and marine biomass pyrolysis. *Bioresource Technology, 109*, 163–172. [CrossRef]
- Sharara, M. A., Holeman, N., Sadaka, S. S., & Costello, T. A. (2014). Pyrolysis kinetics of algal consortia grown using swine manure wastewater: Mougeotia (Algae 1) and Cladophora (Algae 2). *Bioresource Technology, 169*, 658–666. [CrossRef]
- Tang, Z., Chen, W., Chen, X., Xia, M., Chen, Y., Yang, H., Chen, H., & Liu, X. (2024). Thermal behavior and kinetic mechanism of model microalgae compounds: soybean protein (PT), sunflower oil (OL), sucrose (SC). *Fuel, 344*, Article 128037. [CrossRef]
- Mohit, A., & Remya, N. (2024). Pyrolysis characteristics and kinetics study of native polyculture microalgae using thermogravimetric analysis. *Biomass Conversion and Biorefinery, 14*(16), 19825–19833.
- Badshah, S. L., Shah, Z., Alves, J. L. F., da Silva, J. C. G., Noreen, N., & Iqbal, A. (2021). Kinetic and thermodynamics study of the pyrolytic process of the freshwater macroalga, Chara vulgaris. *Journal of Applied Phycology, 33*, 2511–2521. [CrossRef]
- Vyazovkin, S., & Dollimore, D. (1996). Linear and nonlinear procedures in isoconversional computations of the activation energy of nonisothermal reactions in solids. *Journal of Chemical Information and Computer Sciences, 36*(1), 42–45. [CrossRef]
- Wang, K., Brown, R. C., Homsy, S., Martinez, L., & Sidhu, S. S. (2013). Fast pyrolysis of microalgae remnants in a fluidized bed reactor for bio-oil and biochar production. *Bioresource Technology, 127*, 494–499. [CrossRef]
- Chatzimaliakas, P. F., Koutsaftis-Fragkos, E., Mai, S., Malamis, D., & Barampouti, E. M. (2024). From microalgae to biofuels: Investigating valorization pathways towards biorefinery integration. *Processes, 12*(12), Article 2936. [CrossRef]
- Grierson, S., Strezov, V., Ellem, G., Mcgregor, R., & Herbertson, J. (2009). Thermal characterisation of microalgae under slow pyrolysis conditions. *Journal of Analytical and Applied Pyrolysis, 85*(1-2), 118–123. [CrossRef]
- Marcilla, A., Catalá, L., García-Quesada, J. C., Valdés, F. J., & Hernández, M. R. (2013). A review of thermochemical conversion of microalgae. *Renewable and Sustainable Energy Reviews, 27*, 11–19. [CrossRef]
- Marcilla, A., Gómez-Siurana, A., Gomis, C., Chápuli, E., Catalá, M. C., & Valdés, F. J. (2009). Characterization of microalgal species through TGA/FTIR analysis: Application to nannochloropsis sp. *Thermochimica Acta, 484*(1-2), 41–47. [CrossRef]
- Miller, R. S., & Bellan, J. (1997). A generalized biomass pyrolysis model based on superimposed cellulose, hemicelluloses and lignin kinetics. *Combustion Science and Technology, 126*(1-6), 97–137. [CrossRef]
- Muñoz, R., Navia, R., Ciudad, G., Tessini, C., Jeison, D., Mella, R., Rabert, C., & Azócar, L. (2015). Preliminary biorefinery process proposal for protein and biofuels recovery from microalgae. *Fuel, 150*, 425–433. [CrossRef]
- Sawalha, H., Bader, A., Sarsour, J., Al-Jabari, M., & Rene, E. R. (2022). Removal of dye (methylene blue) from wastewater using bio-char derived from agricultural residues in Palestine: Performance and isotherm analysis. *Processes, 10*(10), Article 2039. [CrossRef]
- Miller, R. S., & Bellan, J. (1997). A generalized biomass pyrolysis model based on superimposed cellulose, hemicelluloses and lignin kinetics. *Combustion Science and Technology, 126*(1-6), 97–137. [CrossRef]
- Chisti, Y. (2007). Biodiesel from microalgae. *Biotechnology Advances, 25*(3), 294–306. [CrossRef]
- Kebelmann, K., Hornung, A., Karsten, U., & Griffiths, G. (2013). Intermediate pyrolysis and product identification by TGA and Py-GC/MS of green microalgae and their extracted protein and lipid components. *Biomass and Bioenergy, 49*, 38–48. [CrossRef]
- Takeda, H. (1988a). Classification of Chlorella strains by means of the sugar components of the cell wall. *Biochemical Systematics and Ecology, 16*(4), 367–371. [CrossRef]
- Takeda, H. (1988b). Classification of Chlorella strains by cell wall sugar composition. *Phytochemistry, 27*(12), 3823–3826. [CrossRef]
- Vyazovkin, S., Burnham, A. K., Criado, J. M., Pérez-Maqueda, L. A., Popescu, C., & Sbirrazzuoli, N. (2011). ICTAC Kinetics Committee recommendations for performing kinetic computations on thermal analysis data. Thermochimica Acta, 520(1-2), 1–19. [CrossRef]
- Vyazovkin, S., & Wight, C. A. (1998). Isothermal and non-isothermal kinetics of thermally stimulated reactions of solids. International Reviews in Physical Chemistry, 17(3), 407–433. [CrossRef]
- Lyon, R. E. (1997). An integral method of non-isothermal kinetic analysis. Thermochimica Acta, 297(1-2), 117–124. [CrossRef]
- Vyazovkin, S. V., & Lesnikovich, A. I. (1988). Estimation of the pre-exponential factor in the isoconversional calculation of effective kinetic parameters. Thermochimica Acta, 128, 297–300. [CrossRef]
- Vyazovkin, S., & Linert, W. (1995). False isokinetic relationships found in the nonisothermal decomposition of solids. Chemical Physics, 193(1-2), 109–118. [CrossRef]
- Vyazovkin, S., Chrissafis, K., Di Lorenzo, M. L., Koga, N., Pijolat, M., Roduit, B., Sbirrazzuoli, N., & Suñol, J. J. (2014). ICTAC Kinetics Committee recommendations for collecting experimental thermal analysis data for kinetic computations. Thermochimica Acta, 590, 1–23. [CrossRef]
- Vyazovkin, S. (2015). Isoconversional methodology. In Isoconversional kinetics of thermally stimulated processes (pp. 1–85). Springer, Cham. [CrossRef]
- Zhao, J., Wang, X., Hu, J., Liu, Q., Shen, D., & Xiao, R. (2014). Thermal degradation of softwood lignin and hardwood lignin by TG-FTIR and Py-GC/MS. Polymer Degradation and Stability, 108, 133–138. [CrossRef]
- Aniza, R., Chen, W.-H., Lin, Y.-Y., Tran, K.-Q., Chang, J.-S., Lam, S. S., Park, Y.-K., Kwon, E. E., & Tabatabaei, M. (2021). Independent parallel pyrolysis kinetics of extracted proteins and lipids as well as model carbohydrates in microalgae. Applied Energy, 300, Article 117372. [CrossRef]
- Zhou, D., Schmitt, E. A., Zhang, G. G. Z., Law, D., Wight, C. A., Vyazovkin, S., & Grant, D. J. W. (2003). Model-free treatment of the dehydration kinetics of nedocromil sodium trihydrate. Journal of Pharmaceutical Sciences, 92(7), 1367–1376. [CrossRef]
- Branca, C., & Di Blasi, C. (2006). Multistep mechanism for the devolatilization of biomass fast pyrolysis oils. Industrial & Engineering Chemistry Research, 45(17), 5891–5899. [CrossRef]
- Branca, C., Di Blasi, C., & Russo, C. (2005). Devolatilization in the temperature range 300–600 K of liquids derived from wood pyrolysis and gasification. Fuel, 84(1), 37–45. [CrossRef]
- Branca, C., & Di Blasi, C. (2003). Kinetics of the isothermal degradation of wood in the temperature range 528–708 K. Journal of Analytical and Applied Pyrolysis, 67(2), 207–219. [CrossRef]
- Branca, C., Albano, A., & Di Blasi, C. (2005). Critical evaluation of global mechanisms of wood devolatilization. Thermochimica Acta, 429(2), 133–141. [CrossRef]
- Branca, C., & Di Blasi, C. (2026). Unified lumped decomposition kinetics of Klason, organosolv and milled wood lignin. Journal of Analytical and Applied Pyrolysis, 196, Article 107760. [CrossRef]
- Branca, C., & Di Blasi, C. (2024). Changes in the devolatization kinetics induced by washing pretreatments of short- and long-aged food crop residues. Thermochimica Acta, 734, Article 179705. [CrossRef]
- Di Blasi, C., & Branca, C. (2001). Kinetics of primary product formation from wood pyrolysis. Industrial & Engineering Chemistry Research, 40(23), 5547–5556. [CrossRef]
- Zhang, X., Zhu, S., Wang, Y., & Hong, C. (2025). Pyrolysis characteristics of microalgae and machine learning modelling for activation energy. Journal of Environmental Chemical Engineering, 13(6), Article 119876. [CrossRef]
- Mirzaei, R., Shirazvatan, M., & Tavakoli, O. (2026). Co-pyrolysis of microalgae Chlorella vulgaris and polyvinyl chloride: Synergistic effects, thermo-kinetic analysis, and thermal behaviour prediction via machine learning. Biomass and Bioenergy, 213, Article 109158. [CrossRef]
- Osman, N. B., Mohd Amin, U. S. B., Patrick, D. O., Badir Noon Zaman, N. A. B., Saadon, S. Z. A. H., Yusup, S., & Yahya, L. (2025). Pyrolysis and kinetic analysis of marine (Isochrysis sp.) and freshwater (Monoraphidium c.) microalgae. Energy Conversion and Management: X, 26, Article 100904. [CrossRef]
- Polat, S., & Kılıç, Ö. F. (2025). Pyrolysis of Chlorella vulgaris: Kinetic analysis, advanced characterization, and bio-oil optimization. Journal of Environmental Chemical Engineering, 13(6), Article 120374. [CrossRef]
Figure 1.
Relation between the extent of reaction α and temperature for sample size of 3, 5, 15 and 20 mg and a heating rate of 20 °C/min.
Figure 1.
Relation between the extent of reaction α and temperature for sample size of 3, 5, 15 and 20 mg and a heating rate of 20 °C/min.
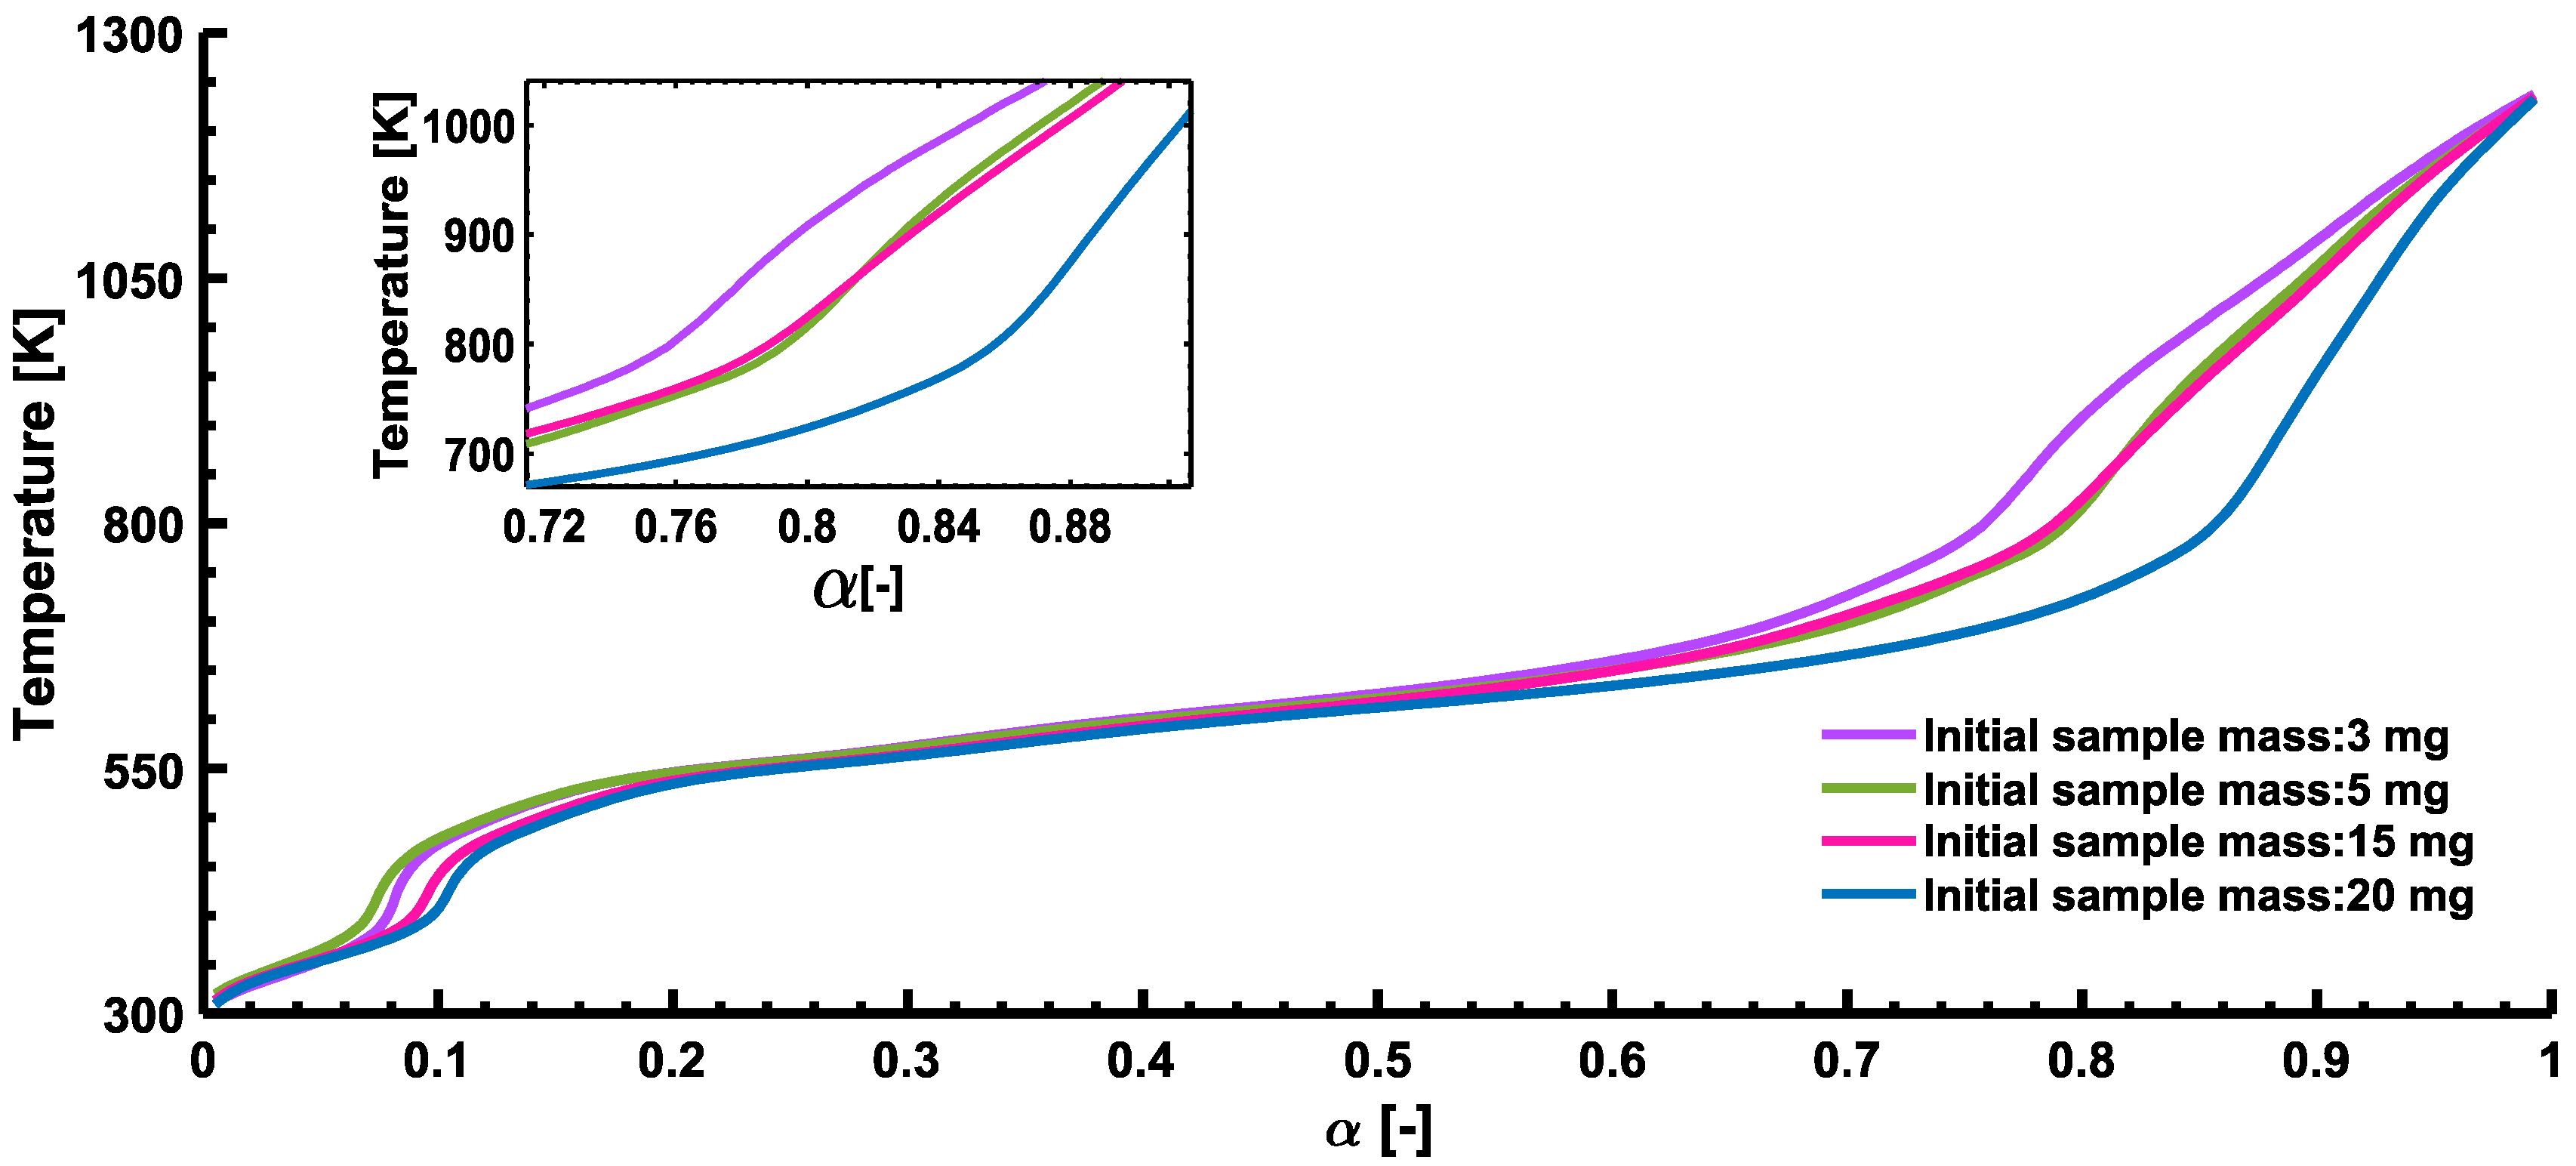
Figure 2.
Component mass fraction of carbohydrates, proteins and lipids. (a) in dry basis determined in this study; (b) Comparison with other authors.
Figure 2.
Component mass fraction of carbohydrates, proteins and lipids. (a) in dry basis determined in this study; (b) Comparison with other authors.
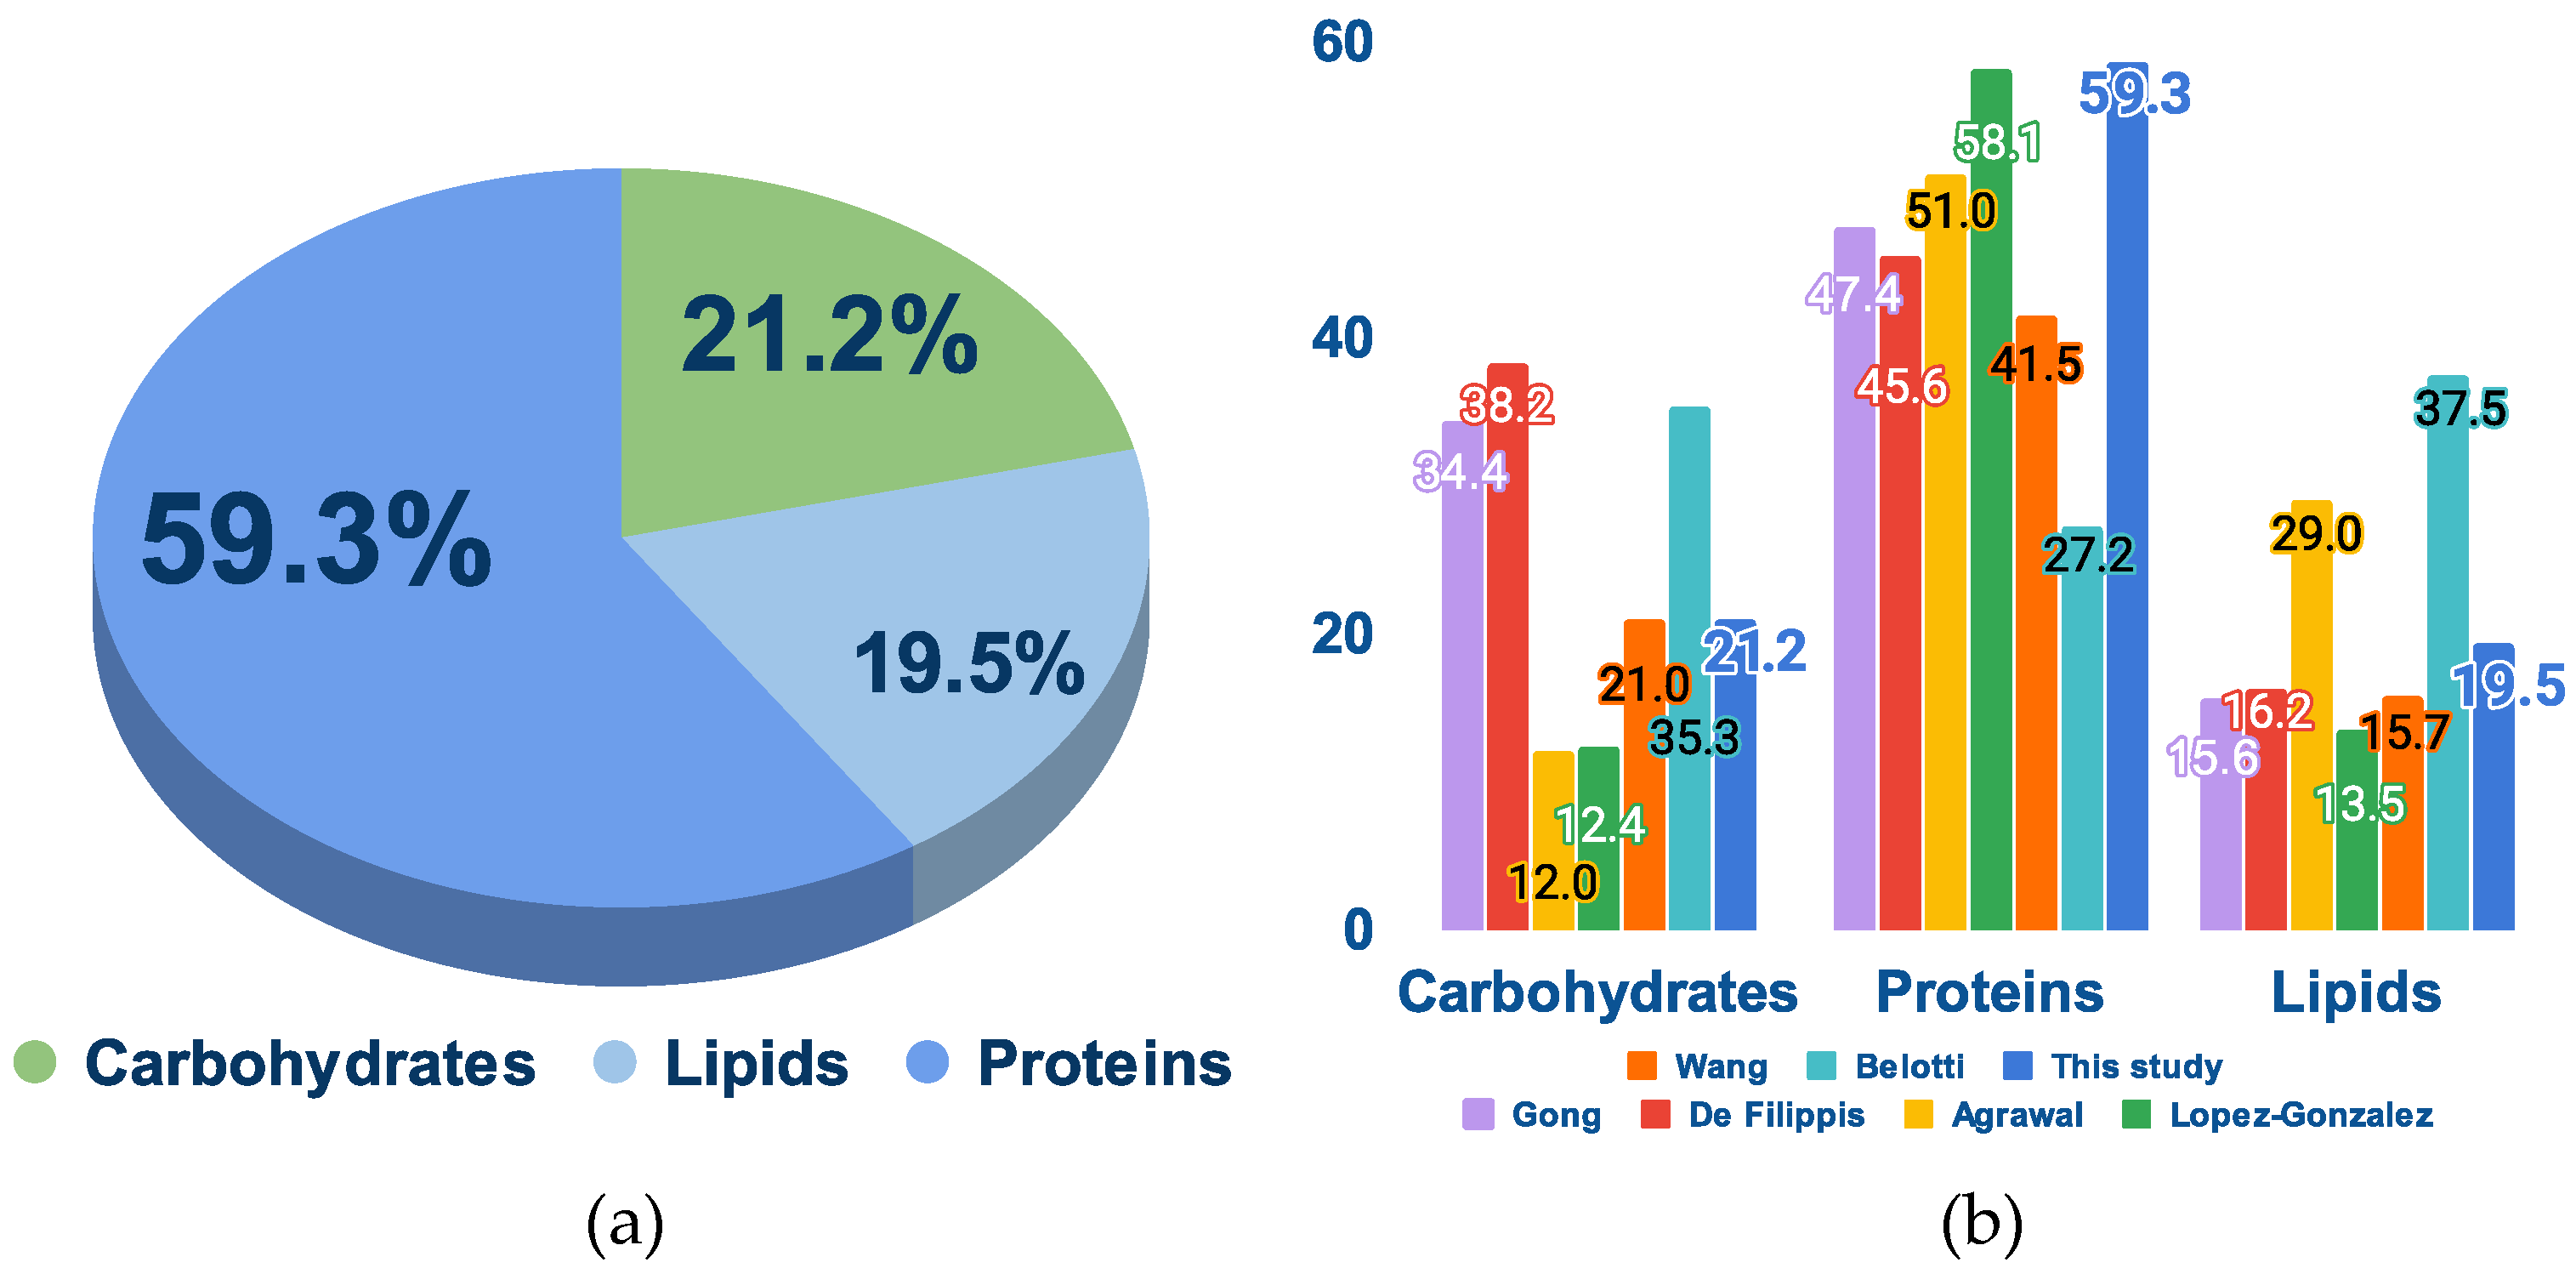
Figure 3.
Normalized thermogravimetry mass loss curve for heating rate of 5, 10 and 5°C/min.
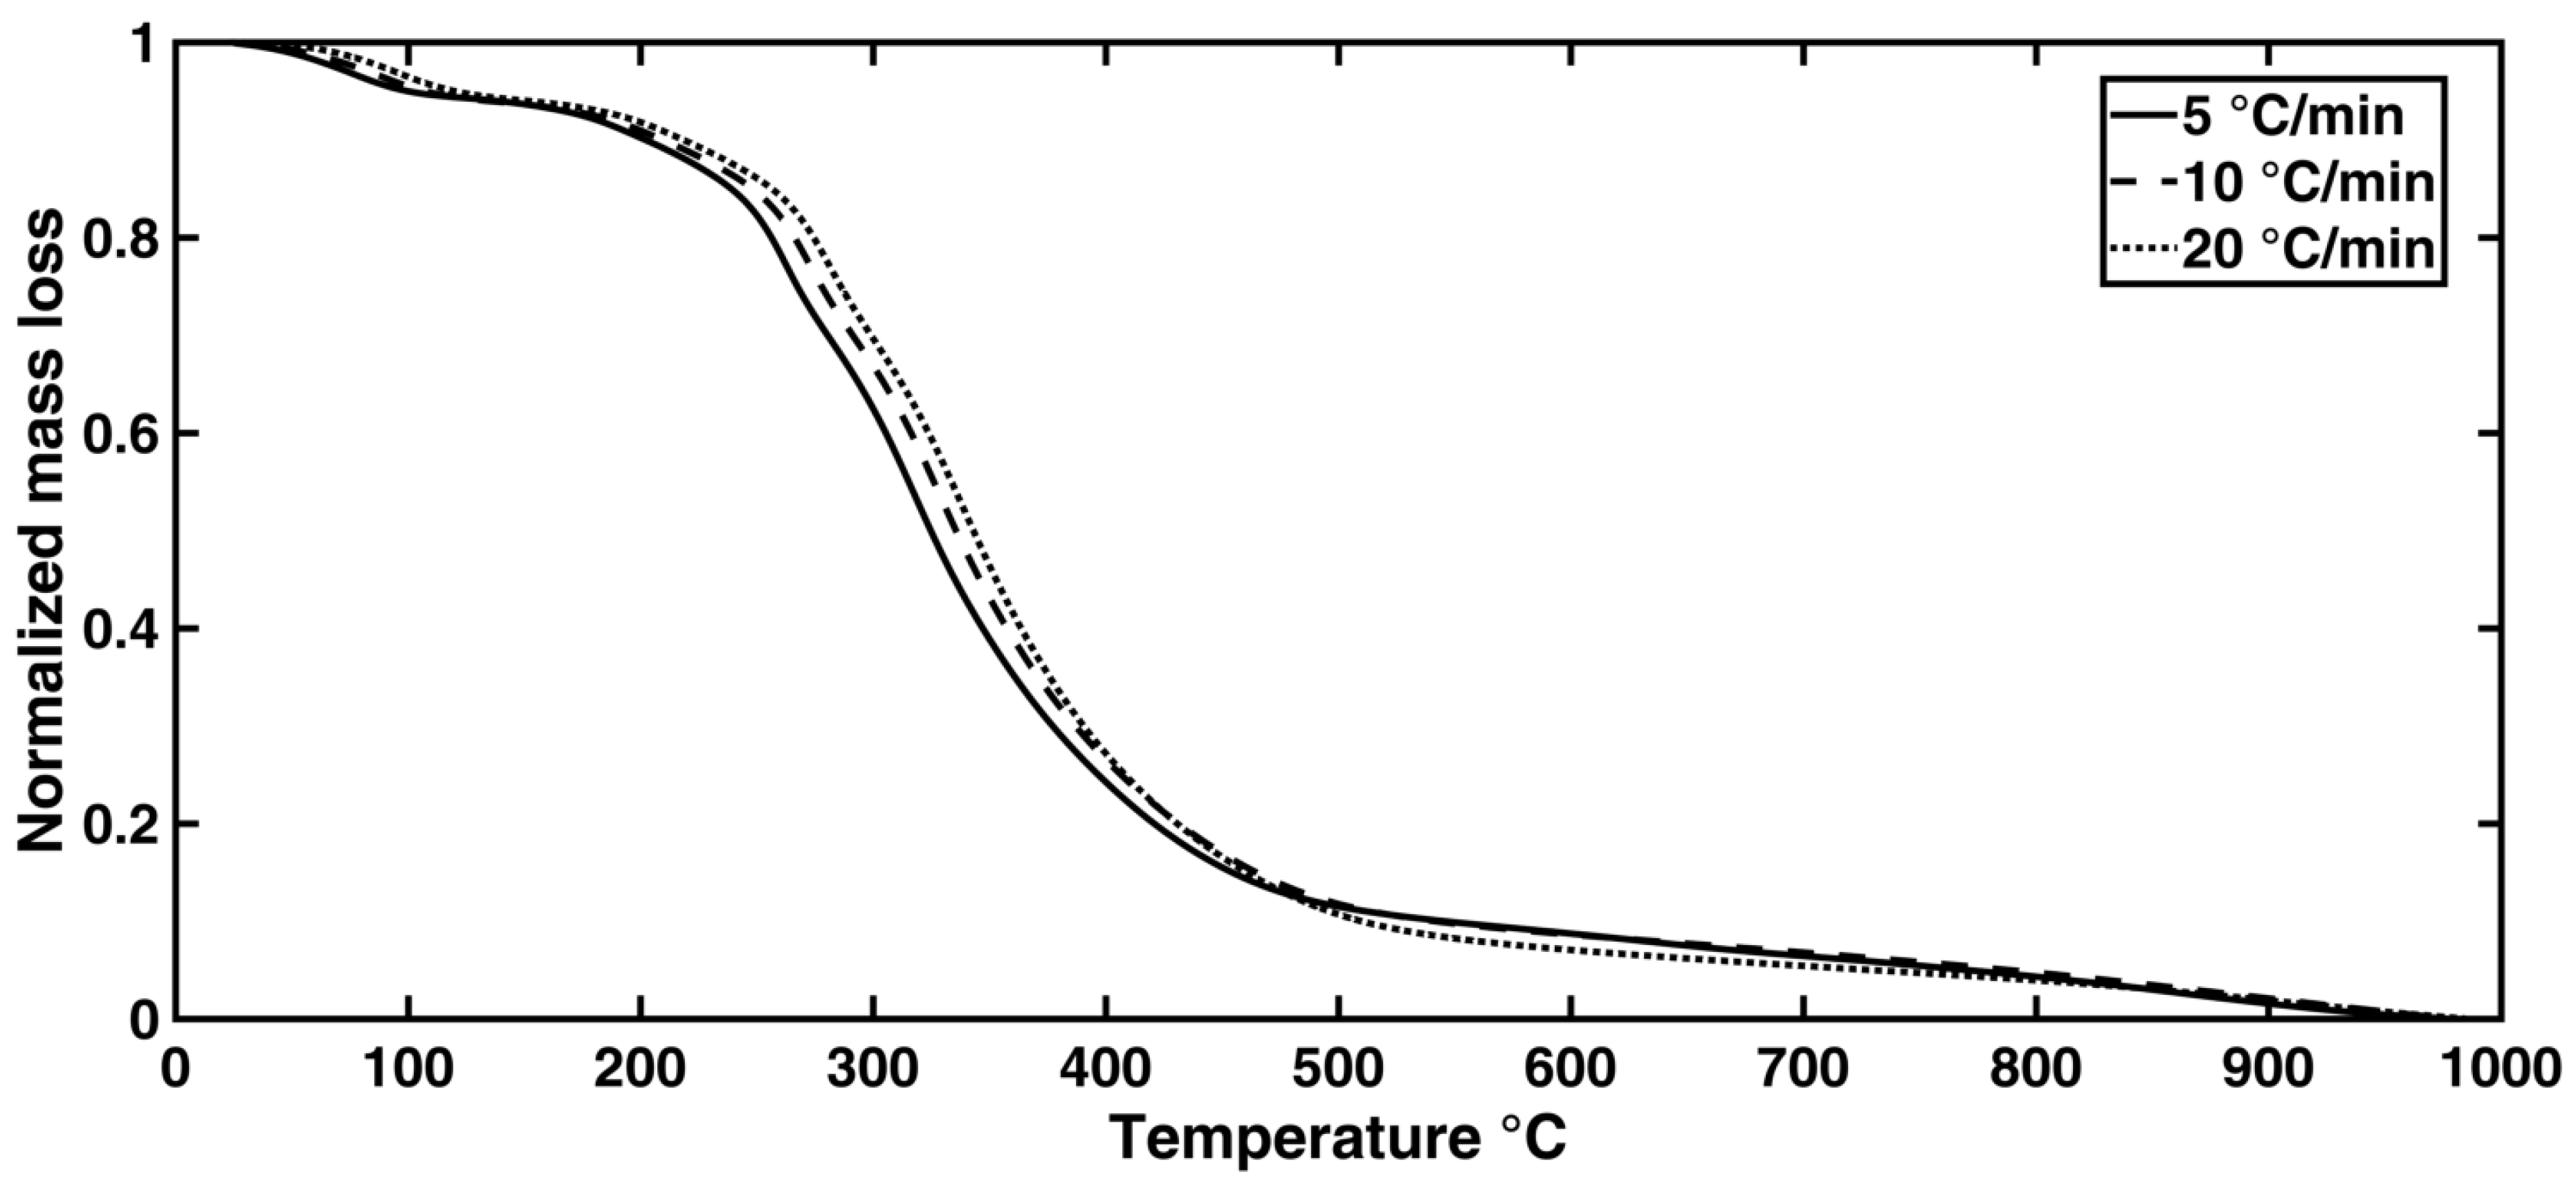
Figure 4.
Mass loss rate curve calculated from TG data for 5, 10 and 5°C/min. Zone identification is indicated in reference of 5° C/min chart.
Figure 4.
Mass loss rate curve calculated from TG data for 5, 10 and 5°C/min. Zone identification is indicated in reference of 5° C/min chart.
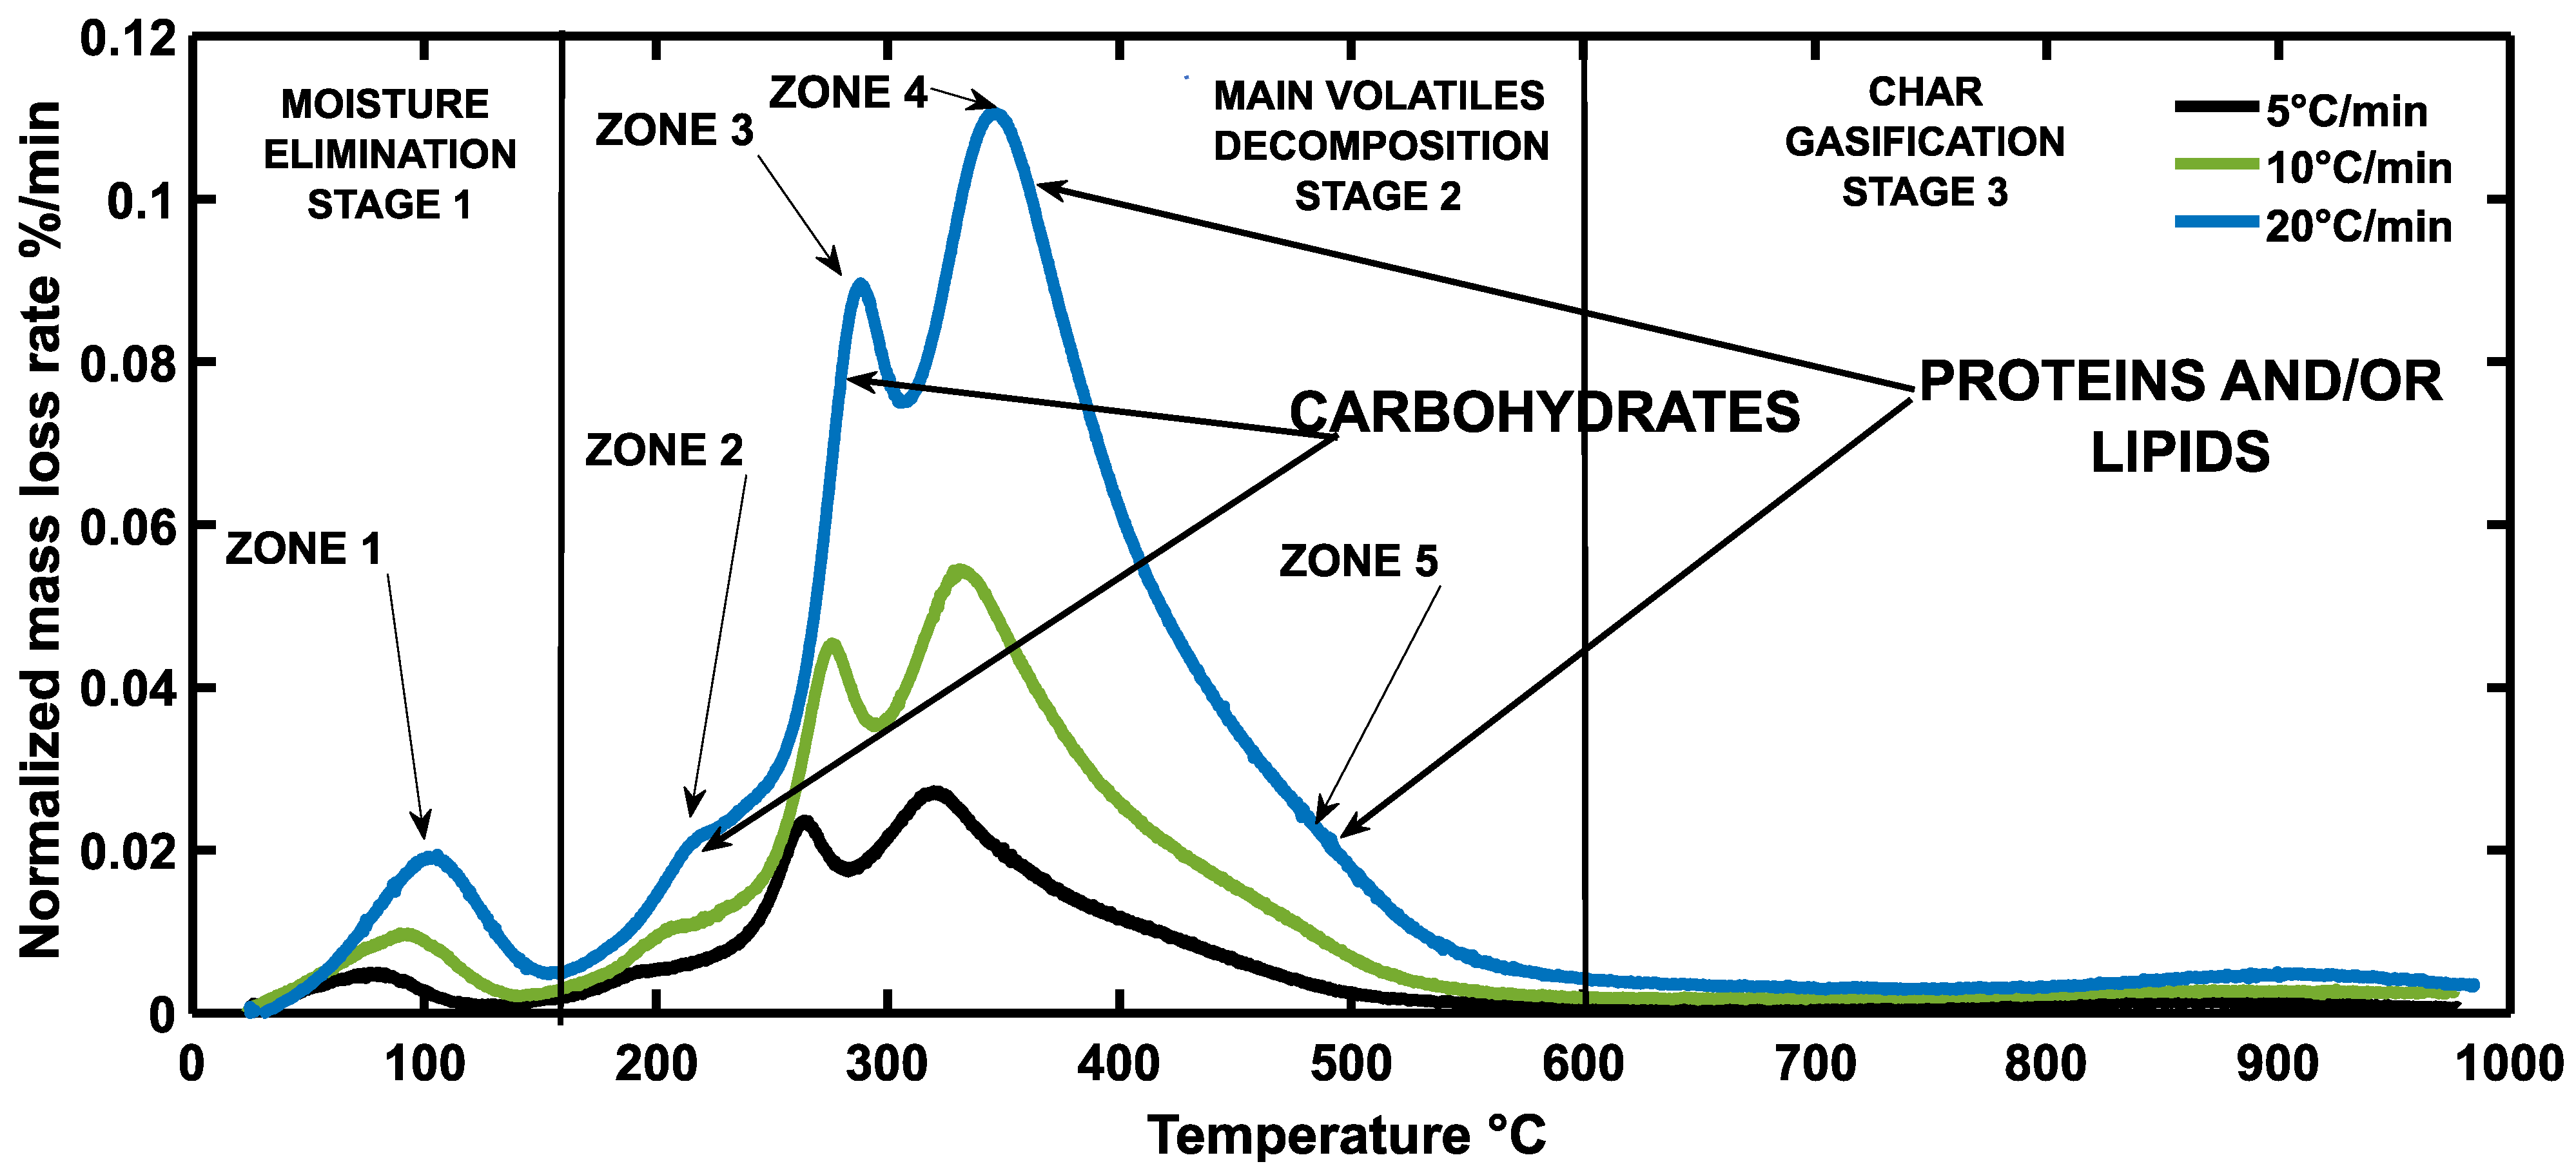
Figure 5.
(a) Mass loss rate curve for heating of 5 C/min obtained Raheem et al. [22]. (b) Mass loss rate for heating rate for 5, 10 and 20°C/min obtained Raheem et al. [22].
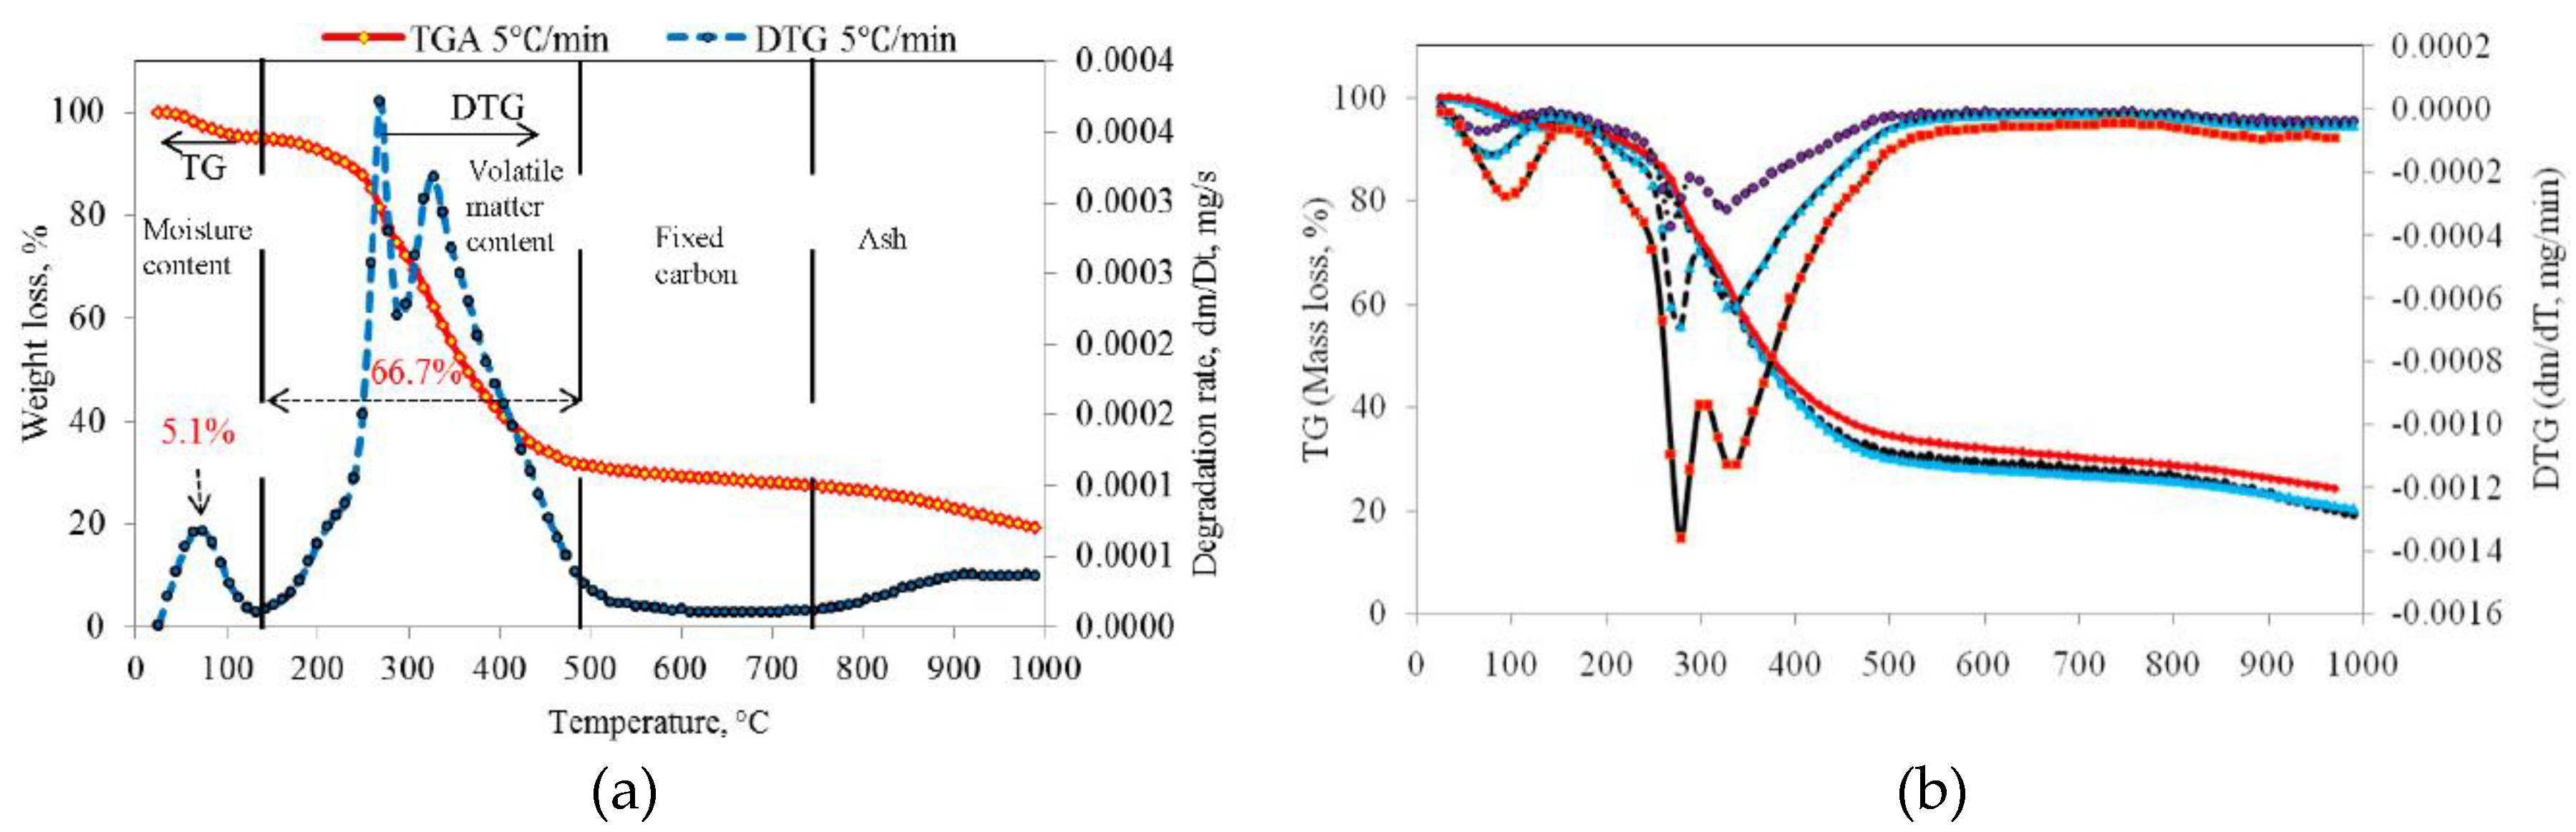
Figure 6.
Effective activation energy E calculated using iso-conversional method Friedman, FWO, KAS and Starink.
Figure 6.
Effective activation energy E calculated using iso-conversional method Friedman, FWO, KAS and Starink.
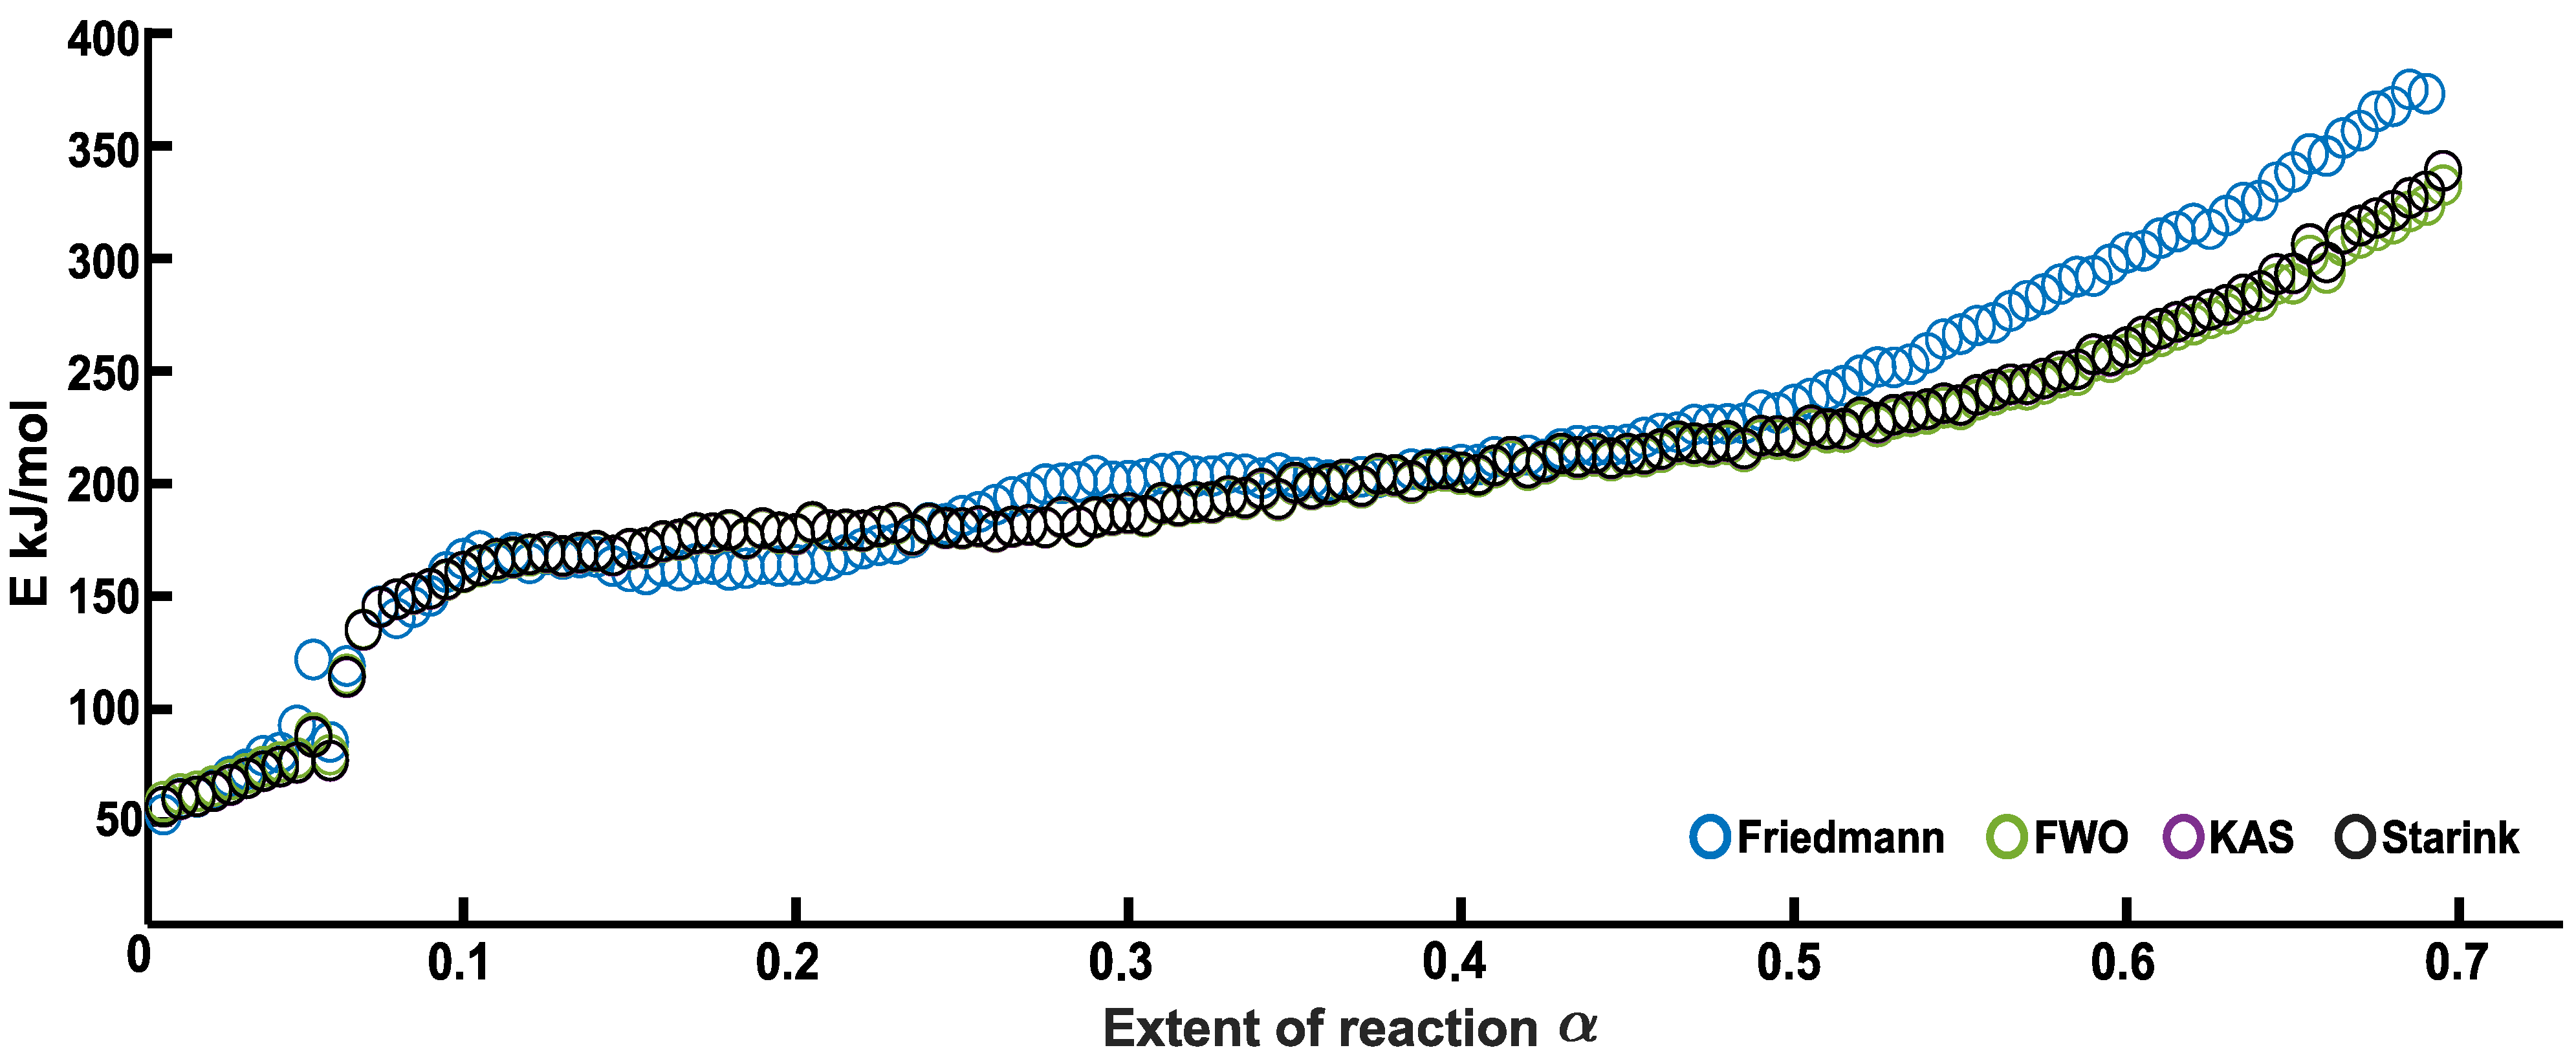
Figure 7.
(a) Coefficient of determination for activation energy distribution. (b) Activation energy distribution and mass loss rate data for 5°C/min. Five reactions are proposed according to characteristic peaks and shoulder of the mass loss rate curve.
Figure 7.
(a) Coefficient of determination for activation energy distribution. (b) Activation energy distribution and mass loss rate data for 5°C/min. Five reactions are proposed according to characteristic peaks and shoulder of the mass loss rate curve.
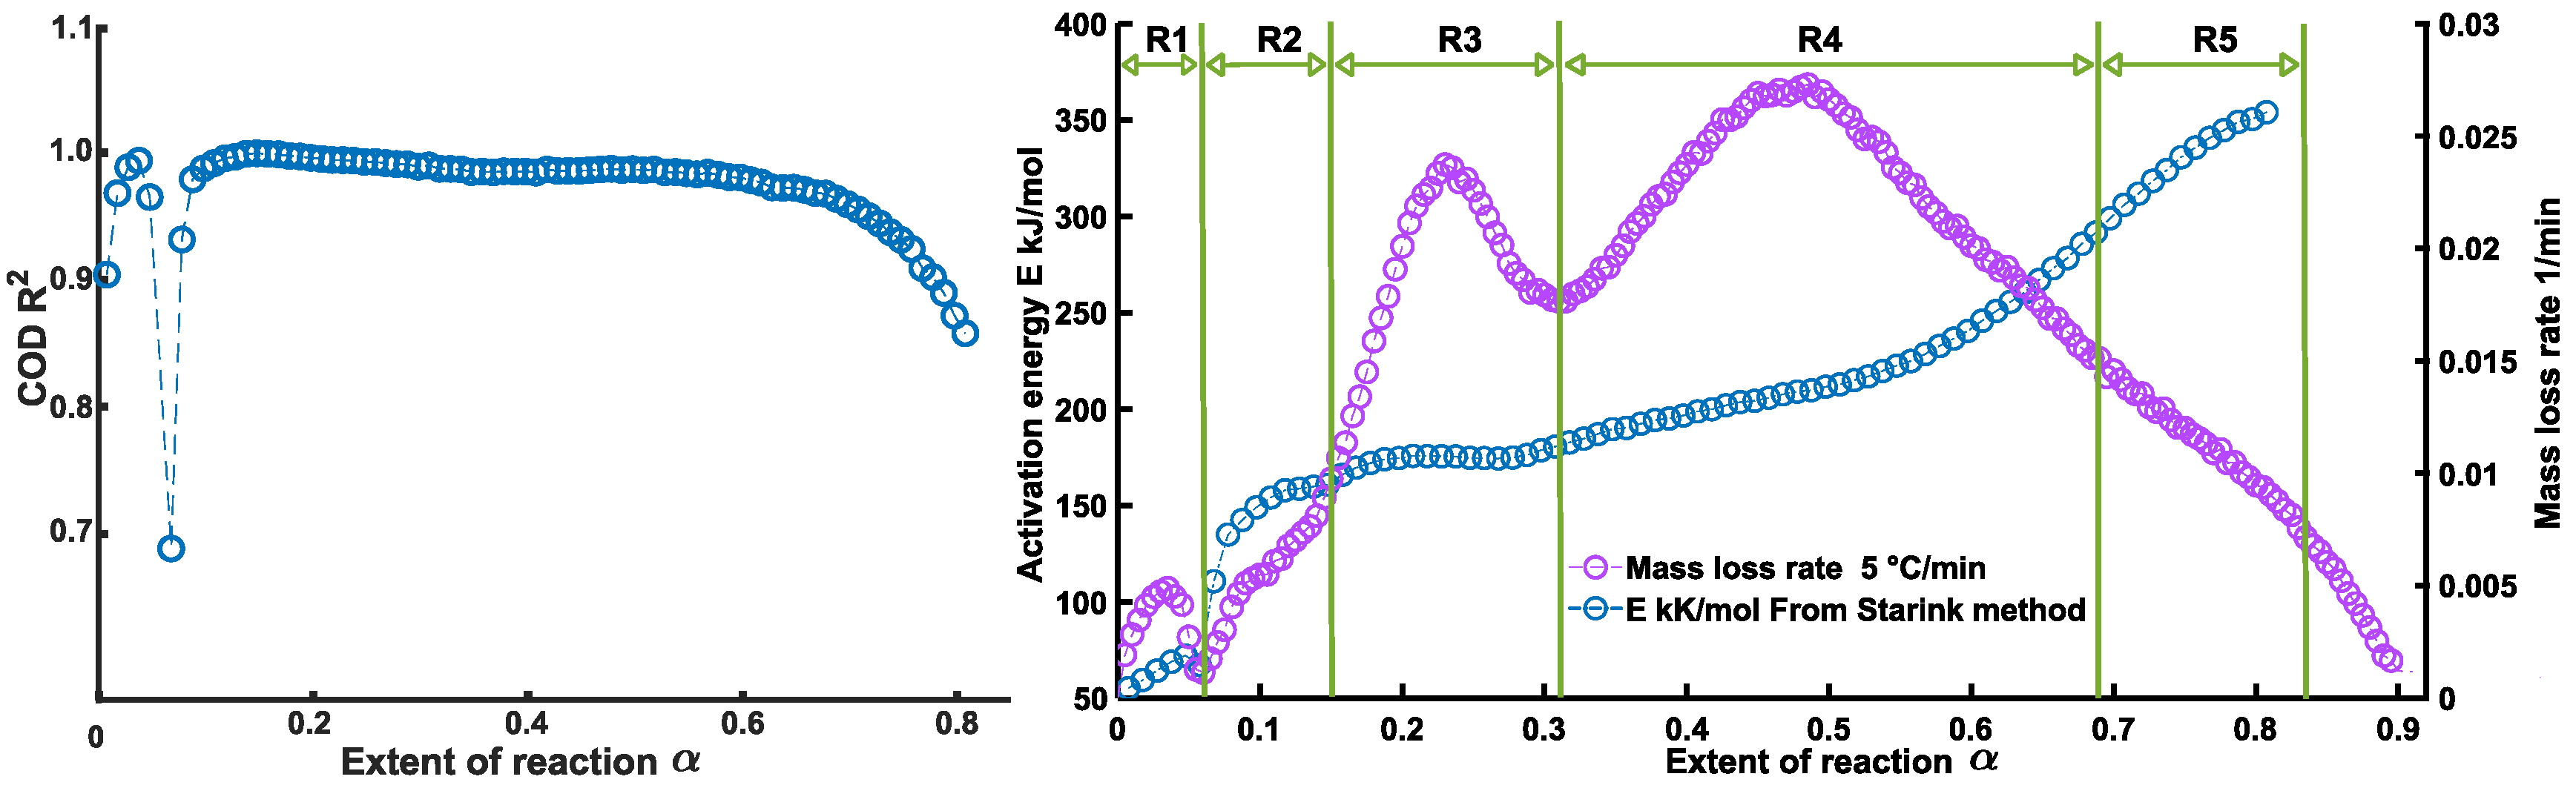
Figure 8.
(a) Selected fitted lines for FWO method (b) Selected fitted lines for Starink method. (c) Selected fitted lines for KAS method.
Figure 8.
(a) Selected fitted lines for FWO method (b) Selected fitted lines for Starink method. (c) Selected fitted lines for KAS method.
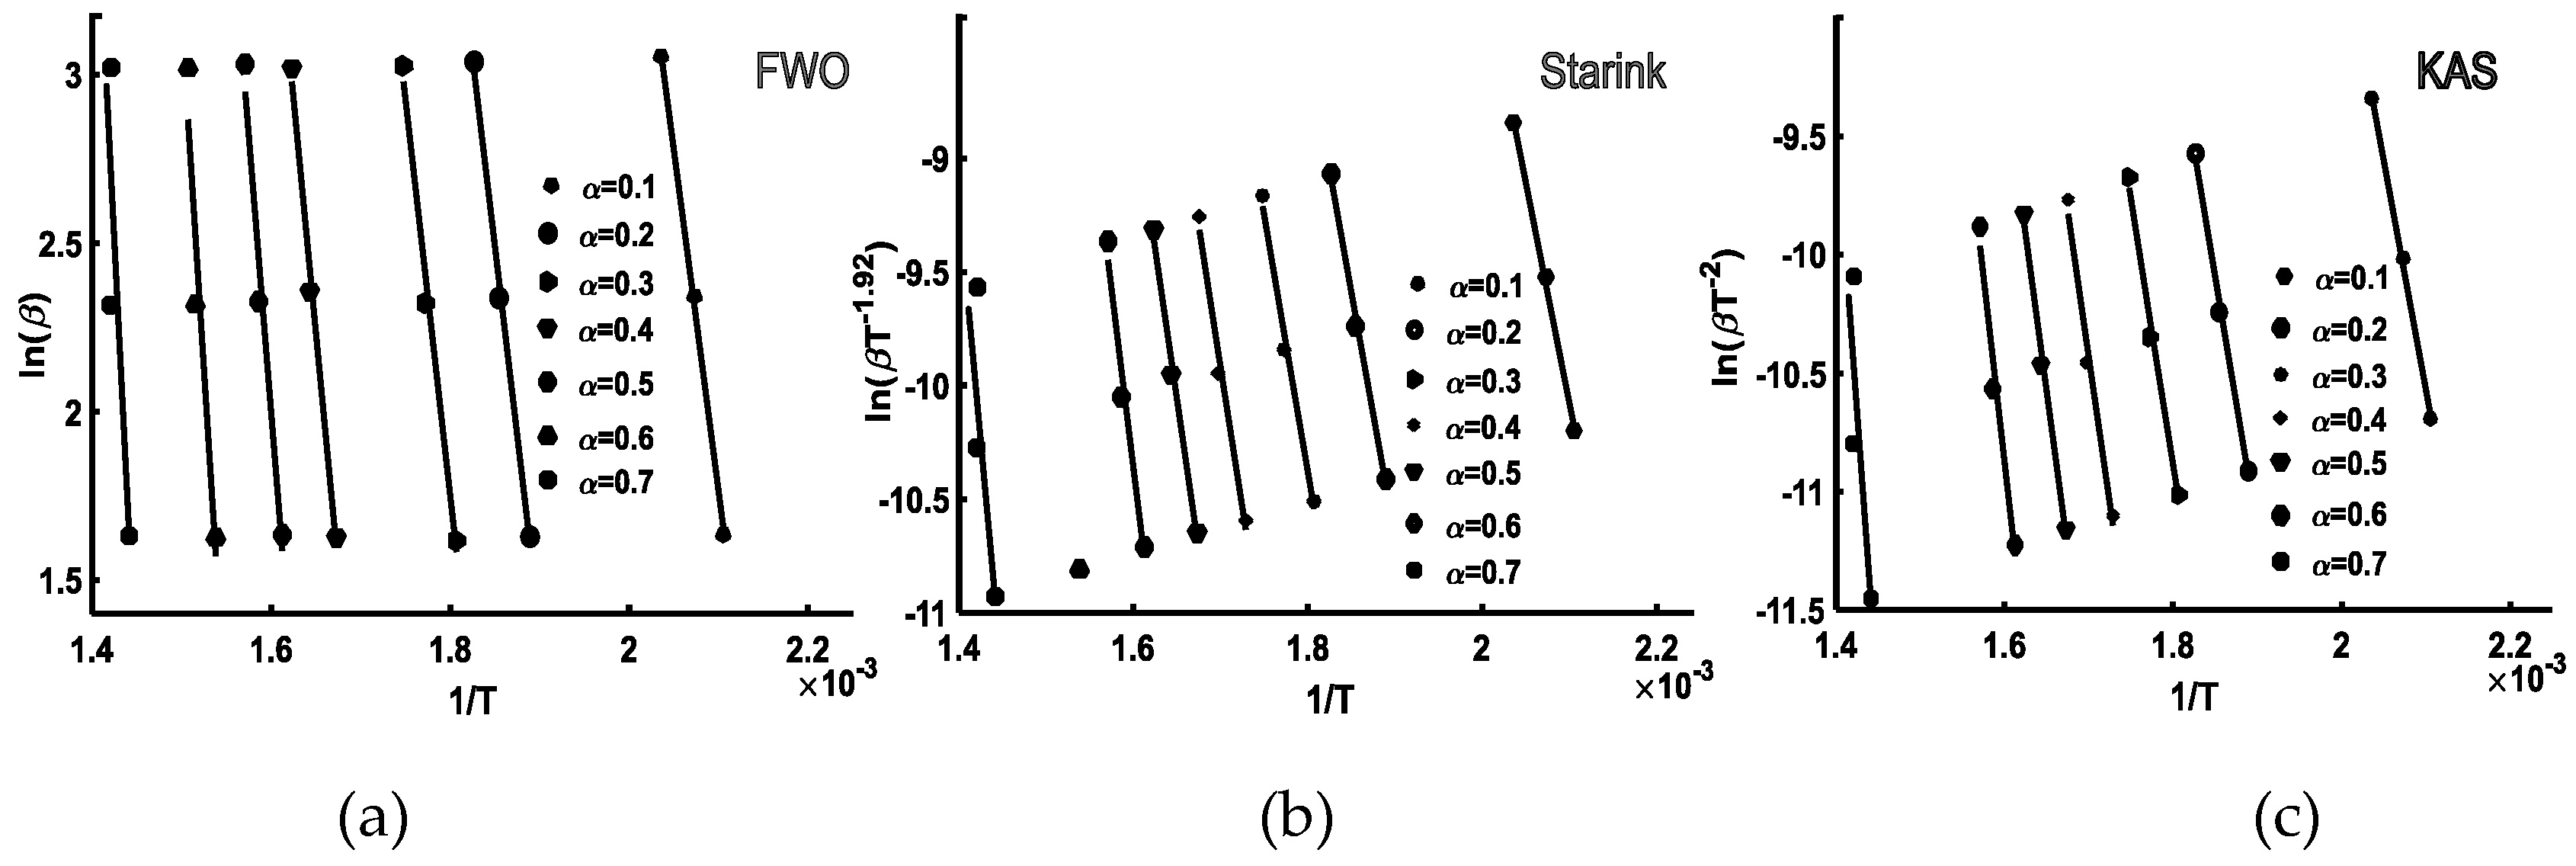
Figure 9.
Regression analysis results for parameters a and b of the compensation equation.
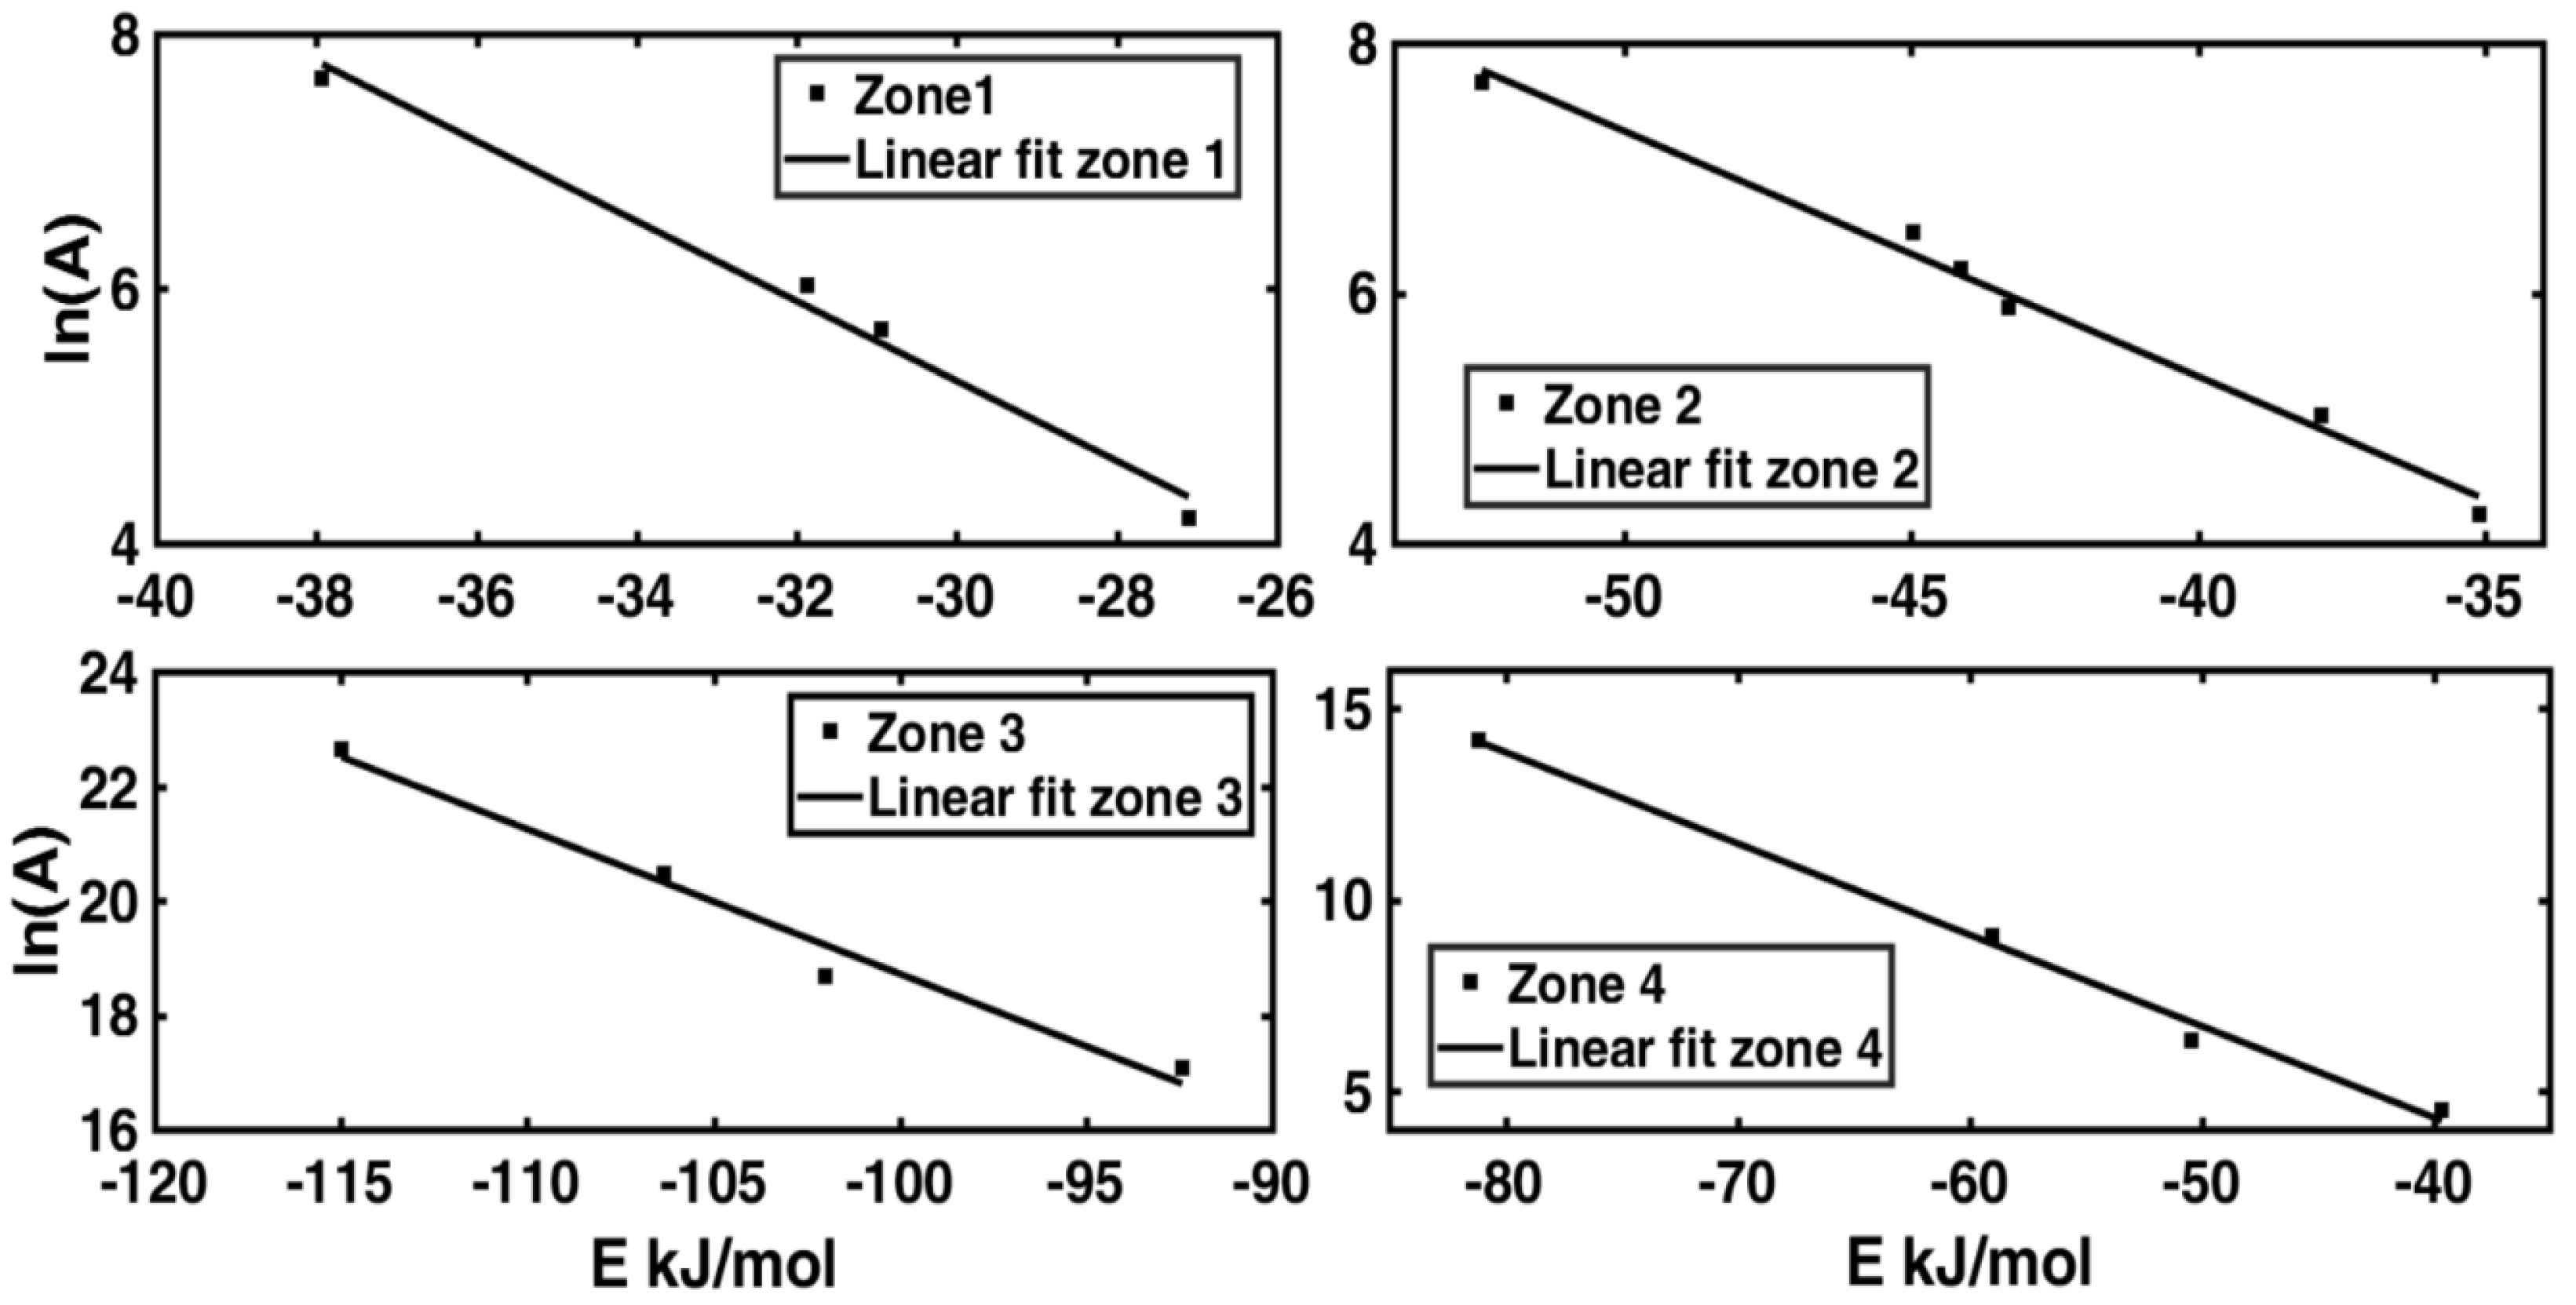
Figure 10.
Normalized mass loss experimental data compared with the simulated data obtained for heating rates 5, 10 and 20° C/min.
Figure 10.
Normalized mass loss experimental data compared with the simulated data obtained for heating rates 5, 10 and 20° C/min.
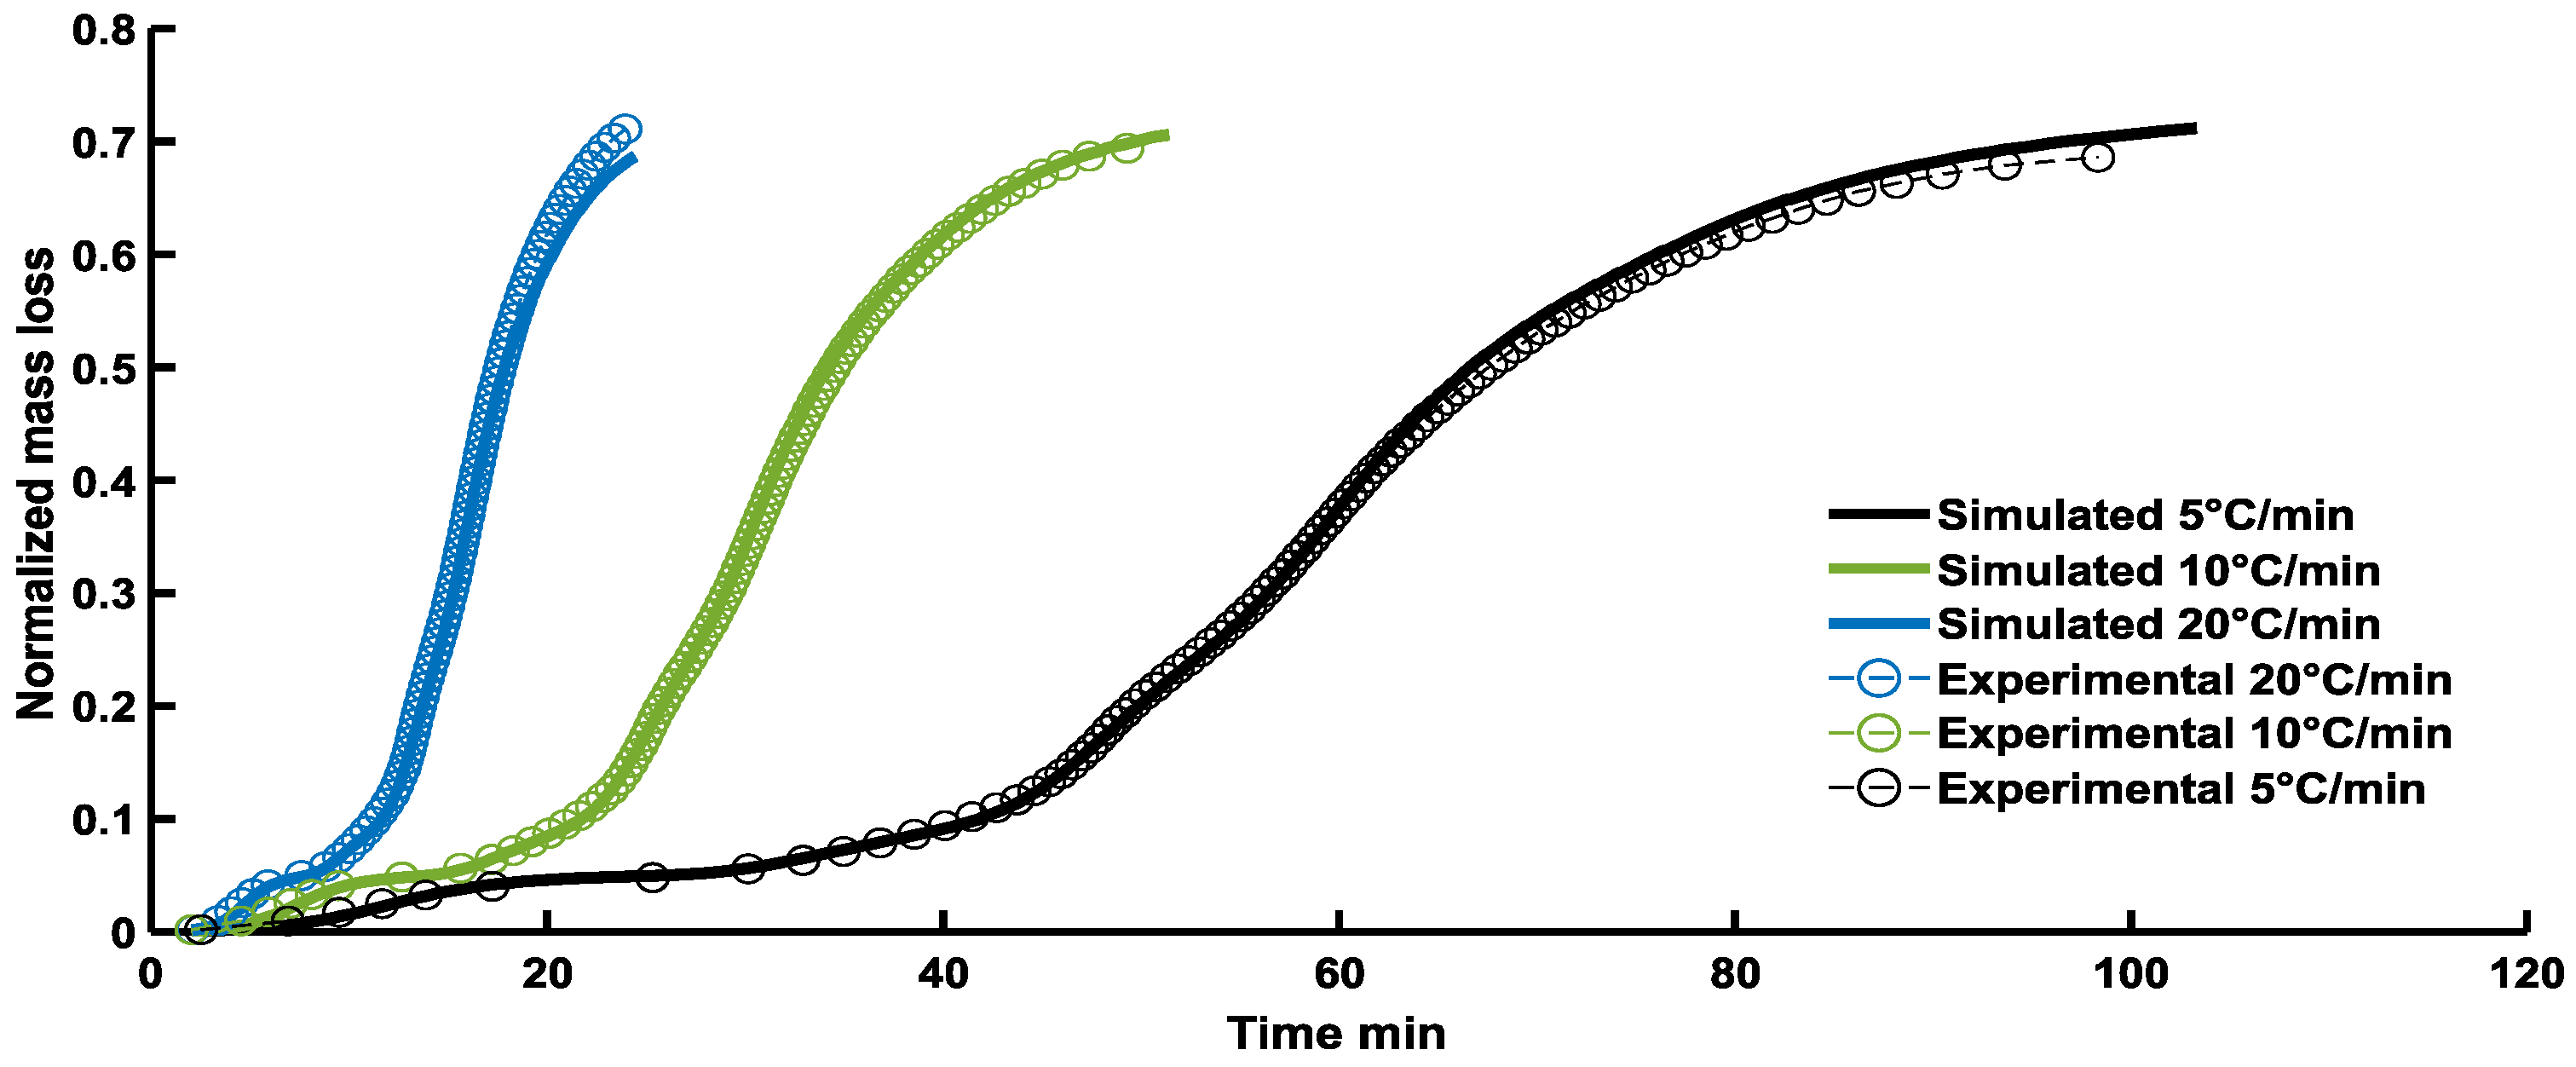
Figure 11.
Normalized mass loss rate experimental data compared with the simulated data obtained for heating rates 5,10 and 20° C/min.
Figure 11.
Normalized mass loss rate experimental data compared with the simulated data obtained for heating rates 5,10 and 20° C/min.
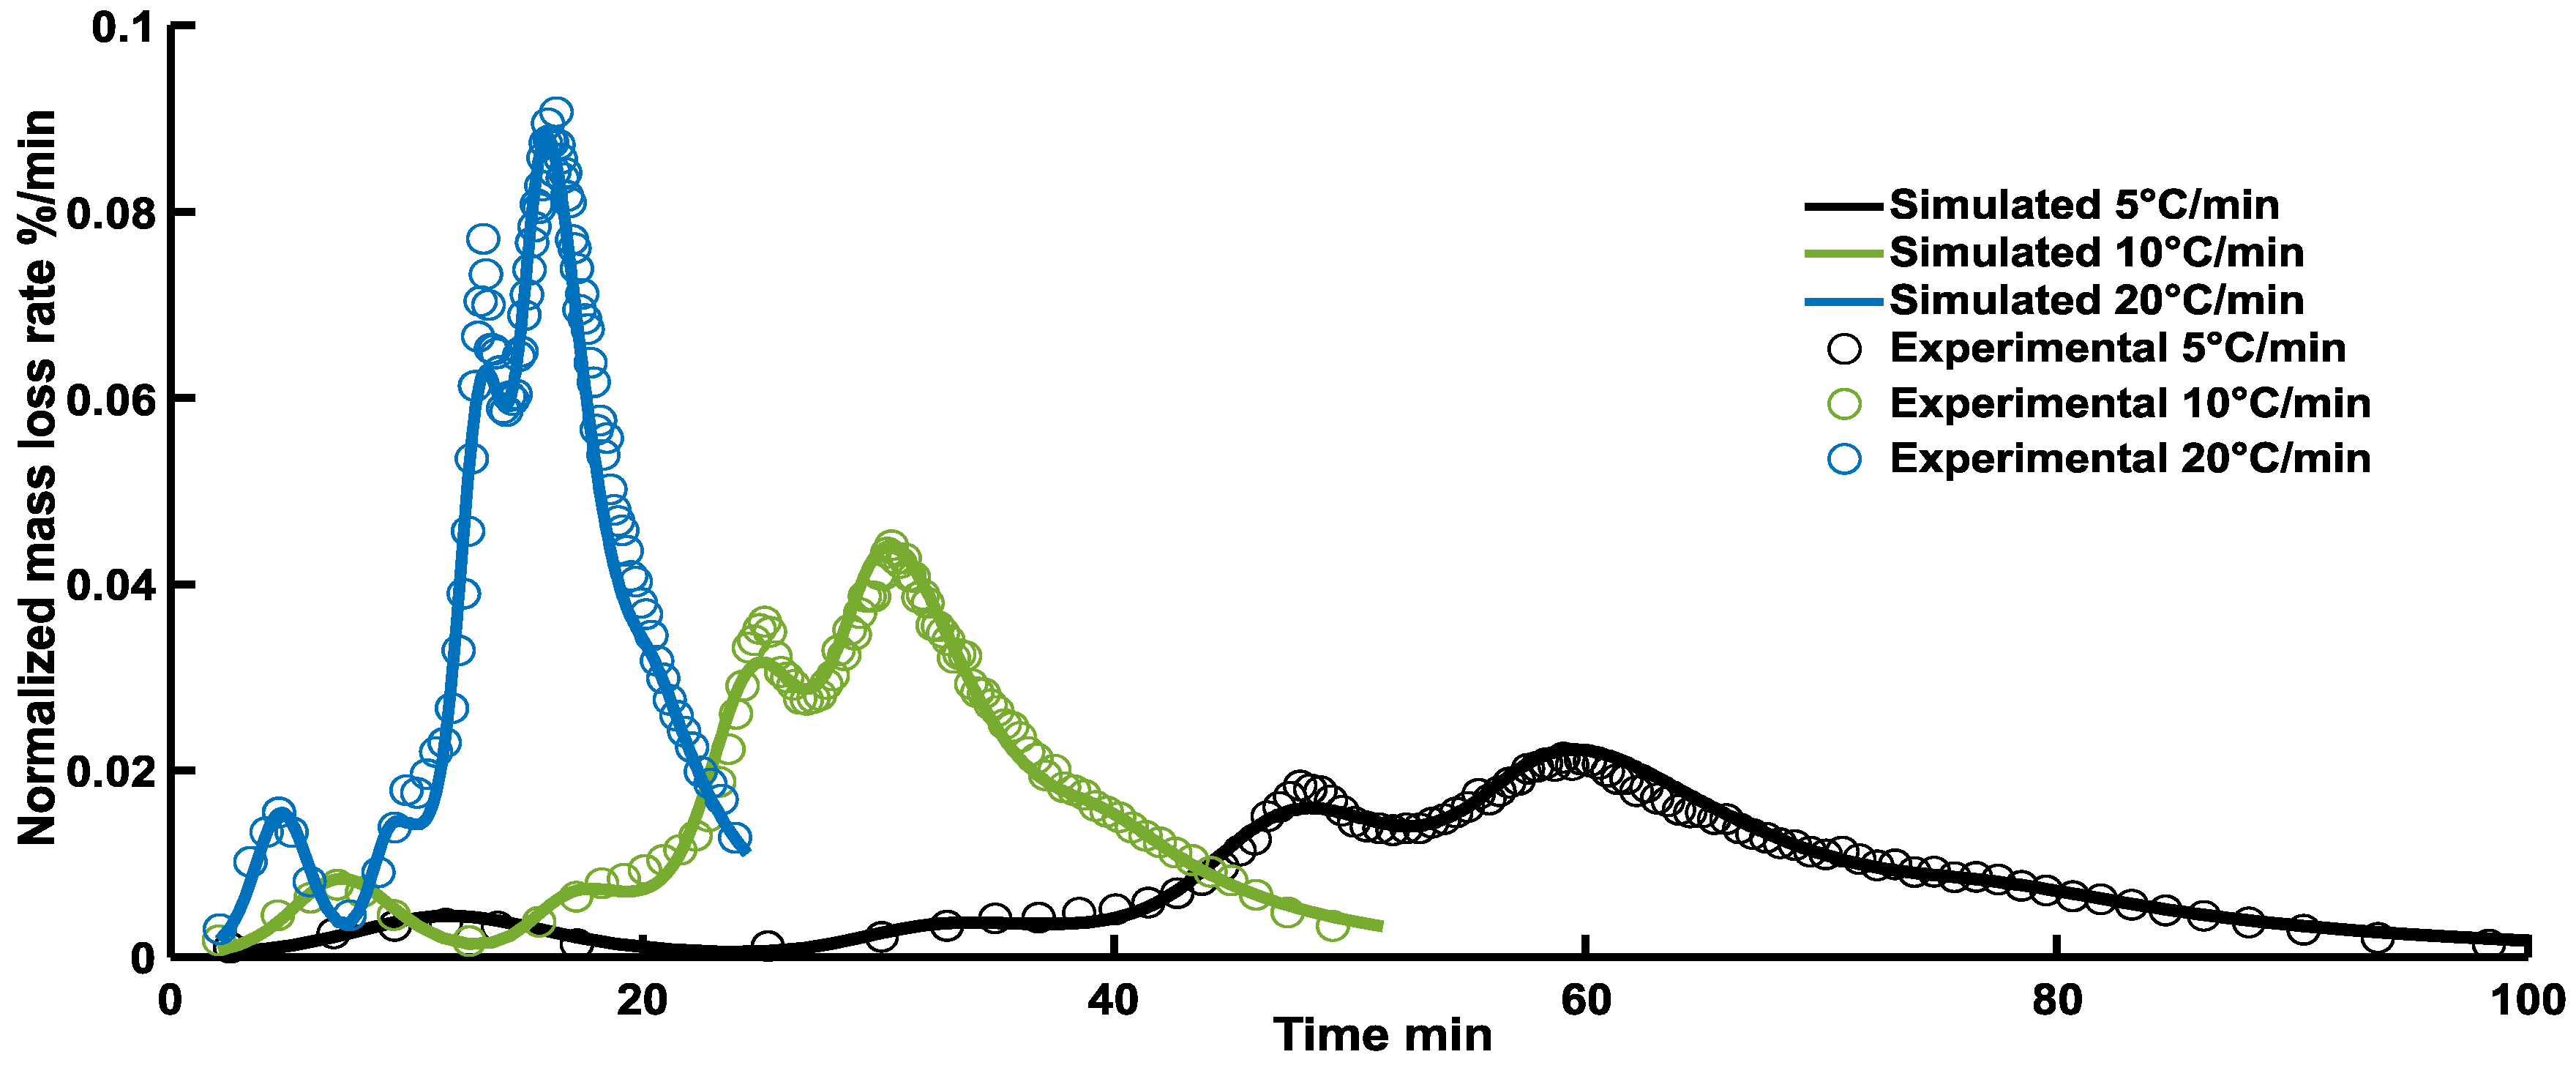
Figure 12.
Experimental data compared with the total and partial contributions of all reaction for a heating rate of 5°C/min.
Figure 12.
Experimental data compared with the total and partial contributions of all reaction for a heating rate of 5°C/min.
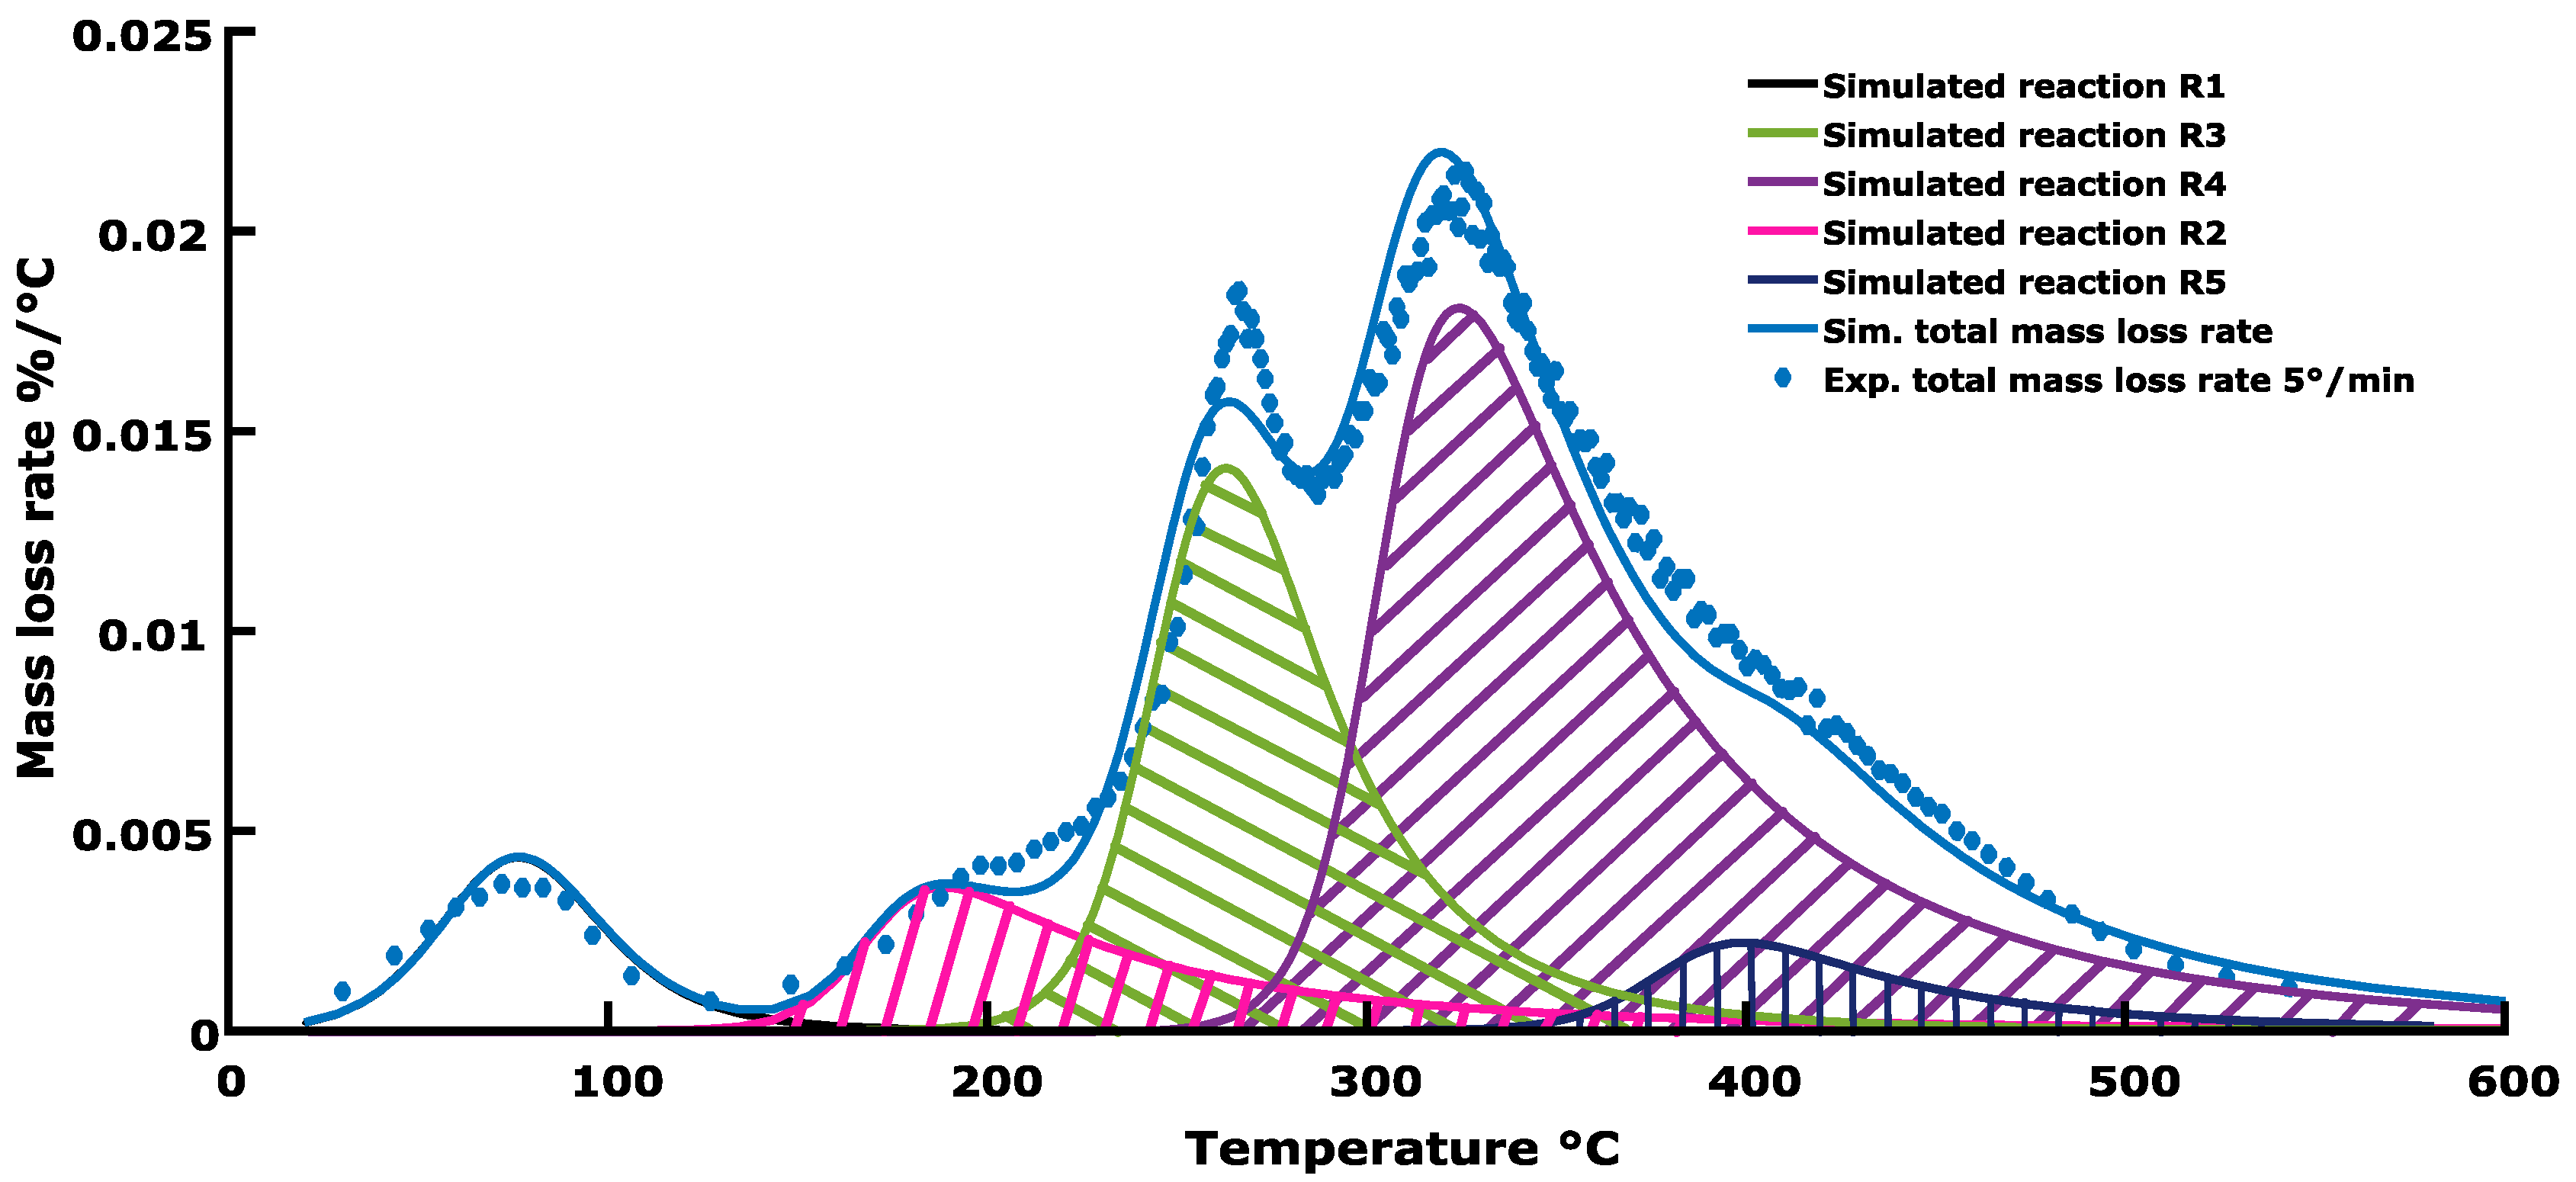

Table 1.
Differential and integral forms of common reaction models for solid devolatilization.
| Reaction model | |||
|---|---|---|---|
| 1 | Zero order* | 1 | |
| 2 | Power law | ||
| 3 | Power law | ||
| 4 | Power law | ||
| 5 | Power law | ||
| 6 | One-dimensional diffusion | ||
| 7 | Mampel (first order) | ||
| 8 | Avrami-Erofeev | ||
| 9 | Avrami-Erofeev | ||
| 10 | Avrami-Erofeev | ||
| 11 | Three dimensional diffusion | ||
| 12 | Contracting sphere | ||
| 13 | Contracting cylinder | ||
| 14 | Second order* |
Table 2.
Comparison of Chlorella Vulgaris components obtained in this study with values obtained from literature.
Table 2.
Comparison of Chlorella Vulgaris components obtained in this study with values obtained from literature.
| Author | Carbohydrates | Lipids | Proteins |
|---|---|---|---|
| Gonga | 34.4 | 15.6 | 47.4 |
| De Filippisb | 38.2 | 16.2 | 45.6 |
| Agrawalc | 12.0 | 29.0 | 51.0 |
| Lopez-Gonzalezd | 12.4 | 13.5 | 58.1 |
| Wange | 21.0 | 15.7 | 41.5 |
| **Belotti | 38.2* | 16.2 | 45.6 |
| This study | 20.9 | 19.3 | 58.6 |
*Calculated here, from data of Belotti et al. (2014), by difference between lipids and proteins, in dry basis, with an estimated error of ±2%. **Data from BG-11 species reported in Belotti et al. (2014). aGong et al. (Gong et al., 2013), bDe Filippis et al. (2015), cAgrawal and Chakraborty (2013), dLopez-gonzalez et al. (2014), Wang et al. (2013), fBelotti et al. (2014).
Table 3.
Characteristic temperature at peaks and shoulders in the stage 1 and stage 2.
| Stage 1 | Stage 2 Main | |||||||
| Zone 1p | Zone 2s | Zone 3p | Zone 4p | Zone 5s | Mass*[%] | |||
| β[°C/min] | Temperature [°C] (Temperature from Raheem et al. [22] [°C]) | |||||||
| 5 | 79 | 193a | 263 (280, 268**) | 320(325) | 418a | 91.3 | ||
| 10 | 89 | 204a | 274 (273) | 331(334) | 456a | 91.4 | ||
| 20 | 101 | 215a | 285 (282) | 343(342) | 487a | 93.0 | ||
aEstimated temperatures at peaks and shoulders. btotal mass lost. pindicates a zone with a peak. sindicate a zone with a shoulder. In parentheses () data at the same characteristics reported by Raheem et al. [22] for commercial Chlorella Vulgaris obtained from the same brand (Pure Bulk Inc. USA). *Total Mass loss. **Temperature value approximated with software.
Table 4.
Results for the activation energy distribution obtained by using the Starink method.
| Starink method | |||
| α | E [kJ/mol] | R2 | |
| 0.01 | 56.06 | 0.920 | |
| 0.10 | 150.59 | 0.989 | |
| 0.20 | 174.09 | 0.995 | |
| 0.30 | 178.58 | 0.990 | |
| 0.40 | 196.87 | 0.984 | |
| 0.50 | 211.80 | 0.987 | |
| 0.60 | 241.86 | 0.979 | |
| 0.70 | 299.38 | 0.959 | |
| 0.80 | 351.54 | 0.869 | |
Table 5.
Results for the activation energy distribution obtained by using the FWO and KAS methods.
| E from FWO [kJ/mol] | E from KAS [kJ/mol] | |||||
|---|---|---|---|---|---|---|
| α | This study | Agrawal | Yuan | This study | Agrawal | Yuan |
| 0.20 | 177.30 | 43.73 | 210.14 | 177.58 | 41.15 | 201.21 |
| 0.30 | 186.62 | 46.61 | 210.08 | 186.97 | 43.97 | 200.89 |
| 0.40 | 204.13 | 48.74 | 207.04 | 204.98 | 46.02 | 198.30 |
| 0.50 | 219.18 | 51.16 | 206.73 | 220.49 | 48.36 | 197.08 |
| 0.60 | 257.49 | 54.94 | 211.19 | 260.44 | 52.09 | 201.28 |
| 0.70 | 331.86 | 58.76 | 235.87 | 338.21 | 55.80 | 225.60 |
| 0.75 | 376.28 | -- | 263.77 | 384.62 | -- | 253.24 |
Table 6.
Average kinetic parameters A and E and intervals defined as start point for simultaneous multi-stage fitting.
Table 6.
Average kinetic parameters A and E and intervals defined as start point for simultaneous multi-stage fitting.
| ISO-CONVERSIONAL PARAMETERS | COMPENSATION PARAMETERS | ||||||
|---|---|---|---|---|---|---|---|
| αi - αfa | Eavg [kJ/mol] | Ei-Efb [kJ/mol] | a-bc | R | LN(A) | LN(A)i-LN(A)fd | |
| Zone 1 R1 | 0.001-0.06 | 71 | 56-87 | 0.314-4.150 | 0.987 | 26.4 | 21.7-31.5 |
| Zone 2 R2 | 0.06-0.15 | 144 | 114-174 | 0.196-2.528 | 0.988 | 30.8 | 24.9-36.6 |
| Zone 3 R3 | 0.15-0.31 | 182 | 174-191 | 0.250-6.566 | 0.976 | 52.1 | 50.1-54.3 |
| Zone 4 R4 | 0.31-0.70 | 273 | 191-356 | 0.238-5.217 | 0.993 | 70.2 | 50.7-89.9 |
| Zone 5 R5 | 0.70-0.80 | 370 | 344-395 | 0.238-5.217 | 0.993 | 93.3 | 87.1-99.2 |
aExtent of reaction interval, bActivation energy E range, cCompensation parameters a and b Range, dPre-exponential factor LN(A) range.
Table 7.
Summary of the kinetic parameters obtained in this work by using the multi-stage simultaneously fitting process and quality fo fitting values.
Table 7.
Summary of the kinetic parameters obtained in this work by using the multi-stage simultaneously fitting process and quality fo fitting values.
| wi | E [kJ/mol] | A [1/s] | n | |||
|---|---|---|---|---|---|---|
| Zone 1 Reaction R1 | 0.050 | 64.9 | 2.42E+07 | 2.00 | ||
| Zone 2 Reaction R2 | 0.077 | 165.4 | 3.19E+16 | 7.75 | ||
| Zone 3 Reaction R3 | 0.193 | 195.3 | 6.60E+16 | 3.55 | ||
| Zone 4 Reaction R3 | 0.381 | 261.1 | 4.39E+20 | 6.90 | ||
| Zone 5 Reaction R4 | 0.042 | 300.3 | 2.58E+21 | 5.00 | ||
| Total mass released | 0.743 | |||||
| 5 °C/min | 10 °C/min | 20 °C/min | ||||
| QOFTG* | 95.49% | 95.52% | 97.66% | |||
| QOFDTG* | 72.77% | 81.41% | 99.73% | |||
*Quality of fitting.
Table 8.
Comparisson between values obtained from isoconversional method of Starink and from multistage fitting.
Table 8.
Comparisson between values obtained from isoconversional method of Starink and from multistage fitting.
| Reaction | Eavg,iso [kJ/mol] | Emulti [kJ/mol] | Ei-Efb [kJ/mol] | LN(A)iso | LN (A) | LN(A)i-LN(A)fd | |
|---|---|---|---|---|---|---|---|
| R1 | 71 | 65 | 56-87 | 26.4 | 17.0 | 21.7-31.5 | |
| R2 | 144 | 165 | 114-174 | 30.8 | 38.0 | 24.9-36.6 | |
| R3 | 182 | 195 | 174-191 | 52.1 | 38.7 | 50.1-54.3 | |
| R4 | 273 | 261 | 191-356 | 70.2 | 47.5 | 50.7-89.9 | |
| R5 | 370 | 300 | 344-395 | 93.3 | 49.3 | 87.1-99.2 |
Table 9.
Proposed relation between biological composition and pseudo-components assumed in this study.
Table 9.
Proposed relation between biological composition and pseudo-components assumed in this study.
| Biological components | |||||
| Carbohydrates | Proteins | Lipids | |||
| 21.2% | 59.3% | 19.5% | |||
| Gas Distribution according to the present results | |||||
| R2 | R3 | R4 | R5 | ||
| 7.7% | 19.4% | 38.0% | 4.2% | ||
| 7.7% | 57.4% | 4.2% | |||
| Total gas released in dry basis | |||||
| 69.3% | |||||
| Gas Distribution according to Aniza et al. [84] in dry basis | |||||
| 9.4% | 36.4% | 11.5% | |||
Disclaimer/Publisher’s Note: The statements, opinions and data contained in all publications are solely those of the individual author(s) and contributor(s) and not of MDPI and/or the editor(s). MDPI and/or the editor(s) disclaim responsibility for any injury to people or property resulting from any ideas, methods, instructions or products referred to in the content. |
© 2026 by the authors. Licensee MDPI, Basel, Switzerland. This article is an open access article distributed under the terms and conditions of the Creative Commons Attribution (CC BY) license (http://creativecommons.org/licenses/by/4.0/).
Copyright: This open access article is published under a Creative Commons CC BY 4.0 license, which permit the free download, distribution, and reuse, provided that the author and preprint are cited in any reuse.