

Submitted:
10 May 2026
Posted:
11 May 2026
You are already at the latest version
Abstract
This study challenges the static treatment of the "green premium" in commercial real estate. We introduce and empirically test the Sustainability Value Decomposition Framework, which disaggregates sustainability-related valuation effects into signalling, performance, and market-access components: Signalling (the value of the label), Performance (the value of operational efficiency), and Market Access (the value of regulatory compliance). Using a mixed-methods approach that combines econometric analysis of 111 institutional office transactions in London with an instrumental-variable strategy, we strengthen identification of the certification effect while recognising the remaining assumptions required for causal interpretation. Our 2SLS model estimates an IV-based premium of 9.5% for top-tier BREEAM certification, conditional on the validity of the local planning-authority instrument. Mediation analysis suggests that EPC ratings, interpreted as market-perceived energy-performance and compliance proxies, statistically account for approximately 65.2% of the observed BREEAM-value association. We also provide a sizeable "brown discount" in a major European market, documenting a 24.7% valuation penalty for assets non-compliant with minimum energy standards, consistent with a Market Access effect. These findings suggest that sustainability-related pricing in mature office markets increasingly reflects market-perceived performance and regulatory risk, rather than certification labels alone.
Keywords:
Sustainability Value Decomposition
; energy performance mediation
; brown discount hypothesis
; ESG real estate
; regulatory transition risk
1. Introduction
The global commercial real estate sector confronts an unprecedented sustainability transformation that has elevated environmental performance from a peripheral consideration to a fundamental determinant of value (Jamaludin & Mohd, 2025). With over €2.1 trillion in assets under management committed to net-zero pathways by 2050 (Shahzad, Faheem, Muqeet, & Waseem, 2024), the financial materiality of environmental attributes has achieved systemic importance across international capital markets (Fuerst & McAllister, The impact of Energy Performance Certificates on the rental and capital values of commercial property assets, 2011). Yet, despite this massive capital commitment, the precise mechanisms through which sustainability characteristics translate into asset pricing remain theoretically underdeveloped and empirically contested. This knowledge gap carries profound implications for capital allocation efficiency in an era where regulatory frameworks increasingly bind environmental performance to market access.
The European Union's Taxonomy Regulation (which classifies environmentally sustainable economic activities), alongside national implementations such as the United Kingdom's Minimum Energy Efficiency Standards (MEES), which mandate minimum Energy Performance Certificate (EPC) ratings for commercial lettings, creates direct linkages between a building's environmental performance and its let-ability, fundamentally altering the risk-return profile of CRE investments (Gopal, 2025). The traditional separation between financial and environmental objectives has collapsed, necessitating sophisticated analytical frameworks that can disentangle the complex relationships between sustainability attributes and asset values (Eichholtz P. H., 2019).
London's commercial office market, representing approximately €480 billion in investible stock, provides an optimal laboratory for examining these dynamics (Hodgetts, 2025). The market’s combination of a mature regulatory framework, a sophisticated investor base, and a heterogeneous submarket structure enables rigorous analysis of how environmental credentials influence pricing across diverse competitive contexts, thereby offering insights transferable to other global cities undergoing similar regulatory transitions. Moreover, London's leadership in sustainability regulation—including the world's first comprehensive MEES framework and mandatory Energy Performance Certificate (EPC) disclosure—offers insights into regulatory transition effects that are likely to emerge in other global markets.
This research develops and empirically applies a “Sustainability Value Decomposition Framework”, which conceptualises that observed ‘green premiums’ are not monolithic but comprise three analytically distinct components:
- Signalling Effects
- Performance Effects, and
- Market Access Effects.
By decomposing this value, our study moves beyond documenting the existence of premiums to explaining the mechanisms of their creation and evolution. Through a mixed-methods design integrating econometric analysis of 111 London office transactions with 18 structured expert interviews, this paper addresses four interconnected research questions:
- Decomposition: How are signalling, market-perceived performance, and market-access effects associated with observed sustainability premiums in urban office markets?
- Geographic Heterogeneity: Why do sustainability premiums vary dramatically across submarkets within a single metropolitan area?
- Temporal Evolution: How has the relative importance of sustainability components evolved as markets mature, and what implications does this hold for investment strategy?
- Regulatory Transition: How do anticipated regulatory changes influence current asset pricing, and what framework can predict future premium evolution?
To address these questions, this paper proceeds as follows. Section 2 reviews the evolution of green premium research, identifies conceptual and empirical gaps, and introduces the Sustainability Value Decomposition Framework. Section 3 details the mixed-methods research design, outlining the data, econometric models, and qualitative inquiry strategy. Section 4 presents the empirical results, integrating quantitative findings with qualitative insights. Section 5 discusses the theoretical implications of our findings, validating and extending the proposed framework. Section 6 translates these insights into practical applications for investment and policy. Finally, Section 7 concludes with a summary of the contributions, and avenues for future research.
2. Literature Review and Theoretical Framework
The introduction has established the critical need for a mechanistic understanding of sustainability value creation in CRE. Having identified the gaps in existing research and introduced our integrative Sustainability Value Decomposition Framework, we now turn to a comprehensive examination of the literature. This review will trace the evolution of scholarly inquiry from the empirical documentation of green premiums (Roig-Hernando, Marmolejo-Duarte, & Espinoza-Zambrano, 2026) to the emerging focus on the penalisation of poor environmental performance, thereby demonstrating how our three-component framework addresses fundamental limitations in current research.
2.1. The Evolution of Green Premium Research
The academic literature on sustainable real estate has evolved through three distinct phases.
- Phase I: Foundational Hedonics (c. 2000-2010). This initial wave of research focused on establishing the empirical existence of a ‘green premium’. Using hedonic pricing models, seminal contributions by Miller, Spivey, and Florance (2008) and Eichholtz, Kok, and Quigley (Eichholtz, Kok, & Quigley, 2010) provided evidence of rental and asset value premiums for certified buildings in the US market. These studies were instrumental in legitimising sustainability as a financial, rather than purely ethical, consideration.
- Phase II: Methodological Refinement and Geographic Expansion (c. 2010-2020). The second phase addressed the methodological challenges inherent in the early studies, such as endogeneity and sample selection bias. Fuerst and McAllister’s (2011) comprehensive analysis of the US market and Chegut, Eichholtz, and Kok’s (2019) cross-country study in Europe were pivotal. These works confirmed the existence of premiums across different markets but also revealed substantial heterogeneity, suggesting that regulatory and cultural contexts were crucial moderating factors.
- Phase III: Market Maturation and the "Brown Discount" (c. 2020-Present). The contemporary phase grapples with the effects of market maturation, where high levels of certification compress premiums and the narrative shifts from a ‘green premium’ to a ‘brown discount’ (Leutner, Gloria, & Bienert, 2024), a concept increasingly recognised in urban economics and climate finance literature as the inverse of the traditional green premium (Fuerst & McAllister, 2011). Research in this phase, often supported by industry analysis (CBRE, 2022), suggests that sustainability is transitioning from a competitive advantage to a baseline requirement. As Reichardt (2014) notes, the mechanisms driving value are becoming more complex than simple certification status.
2.2. Theoretical Gaps and Research Opportunities
Despite this progress, several critical theoretical gaps persist:
2.2.1. Mechanism Identification
The bulk of existing research documents an association between certification and value but does not empirically isolate the mechanisms through which this value is created. It remains unclear whether the premium stems from the credibility of the label itself (a signal) or the tangible benefits of superior building performance.
2.2.2. Intra-Metropolitan Heterogeneity
While cross-national variation is well-documented (Chegut, Eichholtz, & Kok, 2019), significant value heterogeneity within a single city remains underexplored. This gap is critical for granular asset selection and portfolio construction strategies (Robinson & McIntosh, 2022).
Recent work in sub-city price modelling reinforces the importance of within-metropolitan granularity. Arat et al. (2026) demonstrate that sub-city real estate price indices exhibit materially different dynamics at finer geographic scales, and that multimodal data inputs, including satellite radar and news sentiment, are required to capture these differences at strategically relevant forecasting horizons. Their finding that nonparametric modelling approaches outperform parametric alternatives in limited-data regimes is relevant to the present study's design choices, and their emphasis on sub-city variation supports the theoretical and empirical priority placed here on submarket-level analysis
2.2.3. Temporal Dynamics
The evolution of premiums as markets mature lacks a solid theoretical foundation. Static models fail to capture the dynamic nature of sustainability value as it transitions from a niche attribute to a market norm (Abdelkafi & Täuscher, 2016).
The methodological challenge of modelling ESG effects over time in hedonic frameworks is further addressed by Bailey, Lindquist, and Rachev (2024), who demonstrate that average annual real estate price series and their ESG predictors constitute non-stationary time series, the direct regression of which risks generating spurious correlations. Their approach, transforming price series via AR(q)-ARCH(1) innovations before applying generalised additive models, identifies substantial city-level heterogeneity in ESG factor influence, reinforcing the broader theoretical case for context-specific and dynamic modelling of sustainability value.
Whilst the present study's five-year panel and cross-sectional identification strategy (IV and submarket fixed effects) mitigate the non-stationarity concern for our log-transformed price data, the Bailey et al. framework offers a complementary time-series perspective that is directly relevant to longitudinal extensions of the Sustainability Value Decomposition framework.
2.2.4. Regulatory Integration
The increasingly powerful role of regulation (e.g., MEES) in determining asset marketability has not been adequately incorporated into valuation frameworks, despite its growing importance for risk assessment (Devine & Kok, 2015).
2.3. The Sustainability Value Decomposition Framework
To address these gaps, we propose the Sustainability Value Decomposition Framework. This framework recommends that the total valuation impact of sustainability is the sum of three distinct, yet interacting, components:
2.3.1. Signalling Effects
Following Spence’s (Spence, 1978) seminal theory of market signalling, we posit that environmental certification functions as a powerful device to counteract the information asymmetry endemic to real estate markets, a classic 'market for lemons' scenario as described by Akerlof (2002). In a market where true building quality and future operational efficiency are opaque to potential buyers and tenants, a credible certification like BREEAM acts as a costly signal to separate high-quality 'cherries' from low-quality 'lemons.' It signals superior construction, competent management, and future-proof design, thereby reducing perceived risk for investors independent of its direct performance metrics (Uddin, et al., 2025).
However, the value of a signal is contingent on its scarcity and the sophistication of the market. In line with Akerlof’s work on information asymmetry (2002), as certification becomes widespread, its ability to differentiate quality diminishes.
Proposition 1: Therefore, we expect signalling effects “to be largest in emerging or less transparent submarkets and to diminish as certification becomes more prevalent”.
3.2.2. Performance Effects
Performance effects represent the tangible financial benefits derived from a building's superior operational characteristics, which are capitalized into the asset’s value according to standard valuation theory (DeSalvo, 2017). In a perfectly efficient market with complete information, this performance channel would be the sole determinant of sustainability value (Li, et al., 2026).
These effects include:
- Reduced energy and water consumption, leading to lower operating costs for tenants or the landlord.
- Enhanced occupier well-being and productivity, supporting higher rents and lower vacancy rates.
- Improved operational efficiency and lower maintenance requirements.
Crucially, these effects can exist independently of certification. A high performing but uncertified building should, in a perfectly efficient market, capture this value.
Proposition 2: Therefore, we expect that “market-perceived performance effects, proxied by EPC ratings, to represent a more durable source of value than certification signalling, particularly in mature markets where certification is widespread”.
This study operationalizes energy performance using Energy Performance Certificate (EPC) ratings (Hardy & Glew, 2019). While EPCs are based on standardized, modelled assumptions rather than metered consumption, they remain the dominant and most consistently observable indicator of operational energy efficiency in the UK commercial real estate market. EPC ratings aggregate building-level characteristics such as envelope quality, system efficiency, and services specification into a relative measure of expected in-use energy demand, enabling comparability across assets at scale (Economidou, et al., 2020). Crucially, EPCs capture operational efficiency as it is perceived, regulated, and priced by the market. Institutional investors, lenders, and valuers routinely rely on EPC thresholds to assess regulatory compliance, transition risk, and long-term asset viability. As a result, EPC ratings function as an economically meaningful proxy for operational performance, even in the presence of a documented performance gap between predicted and realized energy use (Masoso & Grobler, 2009).
Crucially, EPC ratings function as the market-perceived performance channel through which energy efficiency is priced: they constitute the legally operative, institutionally recognised, and commercially actionable measure of operational efficiency in the UK market.
Institutional investors, lenders, and valuers routinely rely on EPC thresholds to assess regulatory compliance under MEES and to determine asset eligibility for capital markets. As a result, the EPC mediates the relationship between sustainability certification and observed pricing outcomes not by virtue of measuring delivered energy consumption accurately, but because it is the metric through which the market, the regulator, and the institutional investment community evaluate and price operational risk and future compliance obligations.
The performance channel captured in this study is therefore best understood as a market-perceived performance channel: the capitalisation into asset values of expected and regulated operational efficiency as reflected in EPC ratings, rather than realised metered energy consumption.
Consistent with the Sustainability Value Decomposition Framework, EPC therefore represents the primary market-perceived performance and compliance channel through which environmental attributes are priced in this study. The analysis does not assume EPC to be a perfect engineering measure but rather treats it as the market-relevant indicator of operational energy efficiency that mediates the relationship between sustainability certification and observed pricing outcomes.
2.3.3. Market Access Effects
Market access effects are discrete, threshold-based value drivers that can be best understood through the lens of real options theory (Dixit & Pindyck, 1994). As regulatory frameworks like MEES create a "bright line" standard for legality, compliance is not merely an attribute that adds a marginal premium; it grants the asset owner the fundamental 'option to operate' in the institutional rental market. Non-compliance substantially reduces this option, potentially resulting in a non-linear valuation penalty that reflects impaired market access, reduced liquidity, and anticipated retrofit costs.
Similarly, as institutional investors adopt stringent ESG mandates, non-compliant assets are excluded from a vast pool of capital, extinguishing their 'option to be sold' to a significant portion of the market. This value component is therefore not a premium but a prerequisite for value preservation in an increasingly regulated and institutionalized market.
This component of value is not a continuous premium; it is an option-like characteristic where compliance grants access to the market, and non-compliance results in a loss of liquidity and value.
Proposition 3: Therefore, we expect that “market access effects will create cliff-edge valuation drops for non-compliant assets, with the penalty (or "brown discount") accelerating as regulatory deadlines approach”.
Figure 1 below, shows the conceptual framework of the Sustainability Value Decomposition describing the relationship between Signalling, Performance, and Market Access effects.
2.4. The Brown Discount Hypothesis
A critical extension of our theory is the formalisation of the Brown Discount Hypothesis. Traditional research has focused on the upside of green premiums. In more mature and regulated markets, however, poor environmental performance may increasingly be capitalised as a downside valuation risk. It is no longer a question of forgoing a benefit, but of incurring a direct penalty. We hypothesise that this discount arises from several channels:
- Regulatory Stranding: Assets that cannot be legally let due to non-compliance with standards like MEES become effectively stranded (Jenkins, S.Semple, Patidar, & McCallum, 2021).
- Capital Market Exclusion: Institutional mandates systematically exclude environmentally obsolete properties, shrinking the buyer pool and increasing the cost of capital (Carlson & Pressnail, 2017).
- Operational Obsolescence: Rising energy costs and sophisticated tenant demand render inefficient buildings uncompetitive (Lizana, et al., 2023).
- Insurance Underwriting: Insurers are beginning to price climate risk, imposing higher premiums on buildings with poor environmental credentials (Huo, Xue, & Jiao, 2022).
Proposition 4: Therefore, we expect that “brown discounts will exhibit non-linear acceleration as regulatory deadlines near and institutional norms solidify, creating systemic risk for portfolios with lagging environmental performance”.
Having established this theoretical framework and its testable propositions, the following section details the mixed-methods methodology designed to empirically validate the Sustainability Value Decomposition Framework within the London office market.
3. Methodology
The theoretical framework developed above provides clear, testable propositions regarding the components of sustainability value and their evolution. To evaluate these propositions, we employ a mixed-methods approach that integrates advanced econometric analysis with qualitative stakeholder insights, providing empirical validation of the Sustainability Value Decomposition Framework.
3.1. Research Design Philosophy
This study adopts a pragmatic mixed-methods approach, specifically a sequential explanatory design (Ivankova, Creswell, & Stick, 2005). This design begins with quantitative analysis to establish the magnitude and statistical significance of relationships between sustainability attributes and asset values. These findings then inform the subsequent qualitative inquiry, which seeks to explain the underlying mechanisms, institutional contexts, and strategic decision-making processes that drive the observed quantitative patterns. This study adopts a pragmatic mixed-methods design, using quantitative analysis to estimate valuation relationships and qualitative interviews to interpret the mechanisms through which market participants understand certification, EPC ratings, and regulatory risk (Ni, et al., 2021).
3.2. Portfolio Composition and Geographic Distribution
The analytical sample exhibits substantial heterogeneity across key dimensions, providing robust foundation for empirical analysis. Geographic distribution reveals concentration in traditional commercial centers (City: 31.5%, West End: 27.0%) alongside emerging markets (Stratford: 18.9%, Southbank: 12.6%, Other: 10.0%), enabling comprehensive submarket analysis.
Building characteristics span the full spectrum of London office stock: gross floor areas range from 1,089 m² to 47,500 m² (median: 4,250 m²), construction dates from 1968 to 2024 (median: 2008), and architectural quality from standard commercial to landmark trophy assets. This diversity ensures findings reflect broad market dynamics rather than niche segment effects.
Table 1: Author’s own elaboration. High BREEAM includes 'Excellent' and 'Outstanding' ratings only. EPC ratings range from 1 (G, least efficient) to 7 (A, most efficient). GAV = Gross Asset Value.
3.3. Data Collection and Sample Construction
The analysis is built upon a comprehensive dataset constructed from multiple primary sources:
- Transaction Data: Proprietary, non-public transaction records for 237 potential office deals between 2020-2025 were obtained through collaborative agreements with four leading global real estate advisory firms: CBRE, JLL, Knight Frank, and Cushman & Wakefield.
- Environmental Data: Building-specific environmental performance metrics were gathered from official registries. BREEAM (Building Research Establishment Environmental Assessment Method) certification records were sourced from BRE Global Ltd. (2010). Energy Performance Certificate (EPC) ratings were retrieved from the UK government’s official register, Ministry of Housing, Communities & Local Government (UK-Gov, 2025). Authors acknowledge the performance gap between modelled and actual consumption (Menezes, Cripps, Bouchlaghem, & Buswell, 2011) but use EPC as it represents the legally and financially operative measure in this market.
- Market Intelligence: Submarket classifications, rental benchmarks, and market timing indicators were sourced from Knight Frank’s London Office Market Reports (Qadar, 2025) to construct robust control variables.
The final analytical sample was constructed using rigorous selection criteria to ensure institutional relevance and analytical validity. All properties are institution-grade offices (≥ 1,000 m²), and all transactions were verified as arms-length. After excluding properties with incomplete data, the final sample comprises 111 properties, representing a total transaction value of €3.2 billion and 982,437 m² of office space across London's major submarkets. The sample size is modest relative to the number of empirical exercises undertaken. Accordingly, the main OLS and IV estimates are treated as the primary quantitative results, while the mediation, submarket, and brown-discount analyses are interpreted as supportive and exploratory. To reduce overinterpretation, all subgroup findings are discussed as indicative patterns rather than definitive market-wide estimates.
3.4. Variable Construction and Measurement
- •
- Dependent Variable: The primary valuation metric is the natural logarithm of Gross Asset Value per square meter, ln(GAV/m²). This transformation addresses heteroskedasticity common in property data and allows for the direct interpretation of regression coefficients as percentage changes in value (Rigobon, 2003).
- •
- Environmental Performance Variables:
- ○
- BREEAM Certification: A binary variable (High BREEAM) is coded as '1' for properties with 'Excellent' or 'Outstanding' ratings and '0' otherwise (i.e., 'Very Good', 'Good', 'Pass', or uncertified). This reflects industry practice where only the highest tiers are considered to convey significant sustainability credentials.
- ○
- Energy Performance Certificate (EPC): An ordinal variable EPC Rating is used as an ordinal variable ranging from 1 (G, least efficient) to 7 (A, most efficient). In this study, EPC is interpreted as a market-perceived performance and compliance proxy, rather than a direct measure of actual metered energy consumption. Its relevance arises because EPC ratings are both widely used by market participants and legally connected to MEES compliance.
- •
- Control Variables: To isolate the effect of sustainability attributes, our models include a comprehensive set of controls: building size (ln(GFA)), building age, architectural quality (tier classification), submarket fixed effects (City, West End, Stratford, Southbank, Other), and time fixed effects (transaction quarter).
3.5. Econometric Specification and Identification Strategy
- Baseline Hedonic Model
Our analysis begins with an enhanced hedonic pricing model to estimate the direct association of sustainability attributes with asset values, controlling for other property characteristics:
ln(GAV/m²)ᵢⱼₜ
= α + β₁CERTᵢ + β₂EPCᵢ + β₃Xᵢ + δⱼ + γₜ + εᵢⱼₜ
Where CERT represents BREEAM status, EPC is the energy rating, X is a vector of building controls, and δ and γ are submarket and time fixed effects, respectively.
- Mediation Analysis Framework
To test Proposition 2 and decompose the certification premium (the ‘why’), we implement a formal mediation analysis based on the Baron and Kenny framework (Hayes, 2009), enhanced with bootstrapping for robust inference as recommended by Preacher and Hayes (2008). This assesses whether the relationship between certification (CERT) and value (GAV/m²) is mediated by energy performance (EPC). The three-step process estimates:
- Step 1 (Total Effect):
ln(GAV/m²)ᵢ = α₁ + c·CERTᵢ + β₁Xᵢ + δ₁ⱼ + γ₁ₜ + ε₁ᵢ
- Step 2 (First Stage):
EPCᵢ = α₂ + a·CERTᵢ + β₂Xᵢ + δ₂ⱼ + γ₂ₜ + ε₂ᵢ
- Step 3 (Direct Effect):
ln(GAV/m²)ᵢ = α₃ + c'·CERTᵢ + b·EPCᵢ + β₃Xᵢ + δ₃ⱼ + γ₃ₜ + ε₃ᵢ
The indirect effect is calculated as “ab” with bootstrap confidence intervals (5,000 replications) to assess statistical significance. Mediation is confirmed when the indirect effect confidence interval excludes zero and c' < c, indicating that energy performance explains a substantial portion of the total certification effect.
A potential limitation of the mediation framework as implemented concerns residual endogeneity in the mediator variable. Whilst the 2SLS strategy instruments the endogenous certification variable and thereby addresses selection bias in the treatment stage, the EPC rating included in Step 3 (the direct-effect regression) may itself correlate with unobserved building quality characteristics that independently drive higher valuations.
Buildings of inherently superior construction quality may obtain higher EPC ratings and attract higher prices through channels that are not captured by the observable controls. The comprehensive set of fixed effects and property-level controls included in the model absorbs a substantial proportion of this cross-sectional quality variation. Moreover, the direction of any residual bias is most plausibly upward, suggesting that the 65.2% mediation proportion reported should be interpreted as a conservative estimate of the ceiling, rather than the floor, of the performance channel's contribution.
Full instrumentation of the mediator would require a second instrument, for example, quasi-experimental variation in the timing of Standard Assessment Procedure regulatory revisions, which is beyond the data available for this study and is identified as an avenue for future research in Section 7.
3.6. Identification Strategy and Endogeneity
A primary challenge in hedonic modelling is endogeneity, specifically self-selection bias; higher-quality buildings may be inherently more likely to pursue and achieve certification, leading OLS models to overstate the premium attributable to the label itself (Fuerst & McAllister, The impact of Energy Performance Certificates on the rental and capital values of commercial property assets, 2011). To isolate the causal effect of certification, we employ an instrumental variable (IV) approach using a two-stage least squares (2SLS) estimator. Submarket fixed effects absorb alternative channels through which planning regimes may influence asset values (e.g., amenities or infrastructure), ensuring that the instrument isolates exogenous variation in the likelihood of certification rather than broader location quality.
We instrument the decision to certify using variations in local planning authority (LPA) requirements across different London boroughs. Certain boroughs mandate or strongly incentivize BREEAM certification for new developments and major refurbishments as a condition of planning consent, creating an exogenous source of variation in certification status that is uncorrelated with unobserved building quality characteristics like superior management or architectural design (Chegut, Eichholtz, & Kok, 2019).
A valid instrument must satisfy two conditions:
- Relevance:
The instrument (LPA stringency) must be a strong predictor of the endogenous variable (BREEAM certification); and
- Exclusion Restriction:
The instrument must affect the outcome (asset value) only through its effect on certification. The identifying assumption is that local planning-authority stringency affects transaction values primarily through its effect on the likelihood of obtaining high BREEAM certification, conditional on building characteristics, submarket fixed effects, and transaction-quarter fixed effects. This assumption is plausible but not directly testable.
A potential concern is that planning stringency may also proxy for broader borough-level attributes, including public-realm quality, regeneration policy, infrastructure investment, density permissions, or local development intensity. These factors could affect asset values independently of certification.
To mitigate this concern, the model controls for submarket fixed effects, transaction-quarter fixed effects, building size, age, and architectural quality. These controls absorb a substantial share of systematic location, timing, and asset-quality variation. Nevertheless, the IV estimates should be interpreted as strengthening causal credibility rather than proving causality. The results are therefore presented as IV-based estimates conditional on the exclusion restriction, and not as unconditional causal effects.
3.7. Qualitative Research Design
To provide explanatory depth and context to the quantitative findings, we conducted semi-structured interviews with 18 senior London market participants. Selected through purposive sampling to ensure representation across investment strategies, asset classes, and perspectives on sustainability (see Appendix C for participant profiles, anonymised). All participants possess minimum 10 years London market experience and current roles involving sustainability-related investment decisions, ensuring credible insights into market evolution and strategic considerations.
The purposive sample was stratified to ensure comprehensive market coverage:
- Investment Professionals (n=7): Senior figures from institutional investors like British Land and Land Securities.
- Development and Advisory (n=6): Directors from major developers and advisory firms.
- Specialised Consultants (n=5): Experts in sustainability, energy, and regulation.
Interviews explored decision-making processes, valuation methods, regulatory impacts, and future market expectations. Transcripts were systematically analysed using thematic analysis (Braun & Clarke, 2006) in Atlas.ti software to identify emergent themes and explanatory mechanisms.
3.8. Mixed-Methods Integration
The quantitative and qualitative streams were integrated following a convergent design (Fetters, Curry, & Creswell, 2013). Quantitative results were used to frame inquiry in the qualitative phase. Finally, qualitative themes and direct quotes are used to interpret, explain, and validate the statistical findings, providing a richer, more nuanced understanding of sustainability value creation.
Validation Strategies include:
- Member checking: Key informant review of interview interpretations and preliminary findings
- Methodological triangulation: Comparison of quantitative estimates with qualitative interview evidence.
- Interpretive validation: use of expert interviews to assess whether the estimated relationships correspond to market-practice narratives.
- Theoretical triangulation: Integration of findings with established real estate, environmental economics, and institutional theory.
- Temporal validation: Out-of-sample prediction testing using 2024-2025 transactions to validate model stability.
A detailed description of the methodology is provided in Appendix C of the Supplementary Information.
3.9. Limitations and Boundary Conditions
Several methodological limitations provide important boundary conditions for interpretation:
- Geographic Scope:
London-specific findings may not generalize to markets with different regulatory frameworks, tenant sophistication, or sustainability market maturity levels.
- Methodological Limitations:
A related robustness consideration concerns the granularity of the spatial fixed effects. The baseline specification employs five established commercial submarket fixed effects, consistent with practitioner classification conventions. Borough-level fixed effects, of which there are 33 across Greater London, would offer finer spatial controls capturing more localised planning, amenity, and infrastructure variation. However, with 111 observations distributed unevenly across London's built environment, borough-level fixed effects would generate a thin-cell identification problem in several boroughs, materially reducing statistical power.
After controlling for building stock quality and location characteristics, remaining premium variation is most consistent with differences in submarket maturity, as corroborated by interview evidence.
The interview evidence indicates that EPC ratings are simultaneously interpreted as a proxy for regulatory compliance (market access effect) and as an imperfect indicator of operational energy efficiency (performance effect). The framework therefore treats EPC as a dual-channel variable rather than a singular construct.
Future research employing larger transaction datasets is encouraged to test borough-level or even lower-tier fixed effects as a robustness check on the present findings.
- Temporal Constraints:
The 2020-2025 sample period captures market conditions during significant regulatory evolution but may not reflect long-term equilibrium relationships. Additionally, our 2020-2025 window includes the COVID-19 pandemic and post-pandemic recovery, which may have influenced both transaction volumes and sustainability preferences in ways not fully captured by time fixed effects.
- Selection Effects:
Focus on institutional-grade properties excludes smaller assets where sustainability dynamics may differ substantially.
- Performance Measurement:
Reliance on EPC theoretical ratings rather than actual consumption data limits ability to fully capture performance gap effects identified in qualitative research (Zaroni, De Carvalho Miranda, & De Pinho, 2025).
The methodological foundation developed now enables a comprehensive test of theoretical propositions through mixed quantitative and qualitative analysis. The following sections articulate the empirical outcomes validating these models within the London office context.
4. Results
To examine whether the estimated BREEAM premium is affected by selection into certification, we compare the baseline hedonic OLS model with the instrumental-variable specification described in the methodology section.
Table 2 below, reports both sets of estimates. Column (1) presents the OLS association between high BREEAM certification and asset value, while Columns (2) and (3) report the first- and second-stage 2SLS estimates, respectively.
The OLS specification indicates that high BREEAM certification is associated with a 13.8% valuation premium. However, this estimate may partly reflect positive selection, since higher-quality buildings are more likely both to obtain certification and to command higher market values. The IV strategy therefore instruments high BREEAM certification using the stringency of local planning authority (LPA) requirements.
The first-stage results in Column (2) support the relevance of the instrument. The coefficient on LPA stringency is positive and statistically significant, indicating that stricter local planning requirements are associated with a higher probability of achieving high BREEAM certification. The first-stage F-statistic of 18.74 exceeds the conventional threshold of 10, reducing concerns about weak-instrument bias (Bolton & Kacperczyk, 2021).
Column (3) reports the second-stage estimate. After instrumenting for certification status, the coefficient on High BREEAM is 0.095 and remains statistically significant at the 5% level. This implies an IV-based valuation premium of approximately 9.5%, conditional on the validity of the instrument.
The IV estimate is smaller than the OLS estimate of 13.8%, suggesting that the baseline OLS model likely overstates the certification premium by attributing some unobserved asset-quality differences to BREEAM certification.
The 2SLS estimate therefore provides a more conservative estimate of the value associated with certification. Importantly, the persistence of a statistically significant premium after instrumentation indicates that high BREEAM certification retains an independent valuation association, even before considering the role of EPC ratings as a market-perceived performance and compliance channel.
Table 2: Author’s own elaboration. *Notes: This table presents OLS and 2SLS regression results. Robust standard errors are in parentheses. LPA Stringency is a binary variable coded '1' for boroughs with stringent BREEAM planning requirements. ***p<0.01, **p<0.05, p<0.1. The reduction from 13.8% (OLS) to 9.5% (2SLS) represents a 31% attenuation, quantifying the upward bias from positive selection.
Qualitative interviews reveal the market thinking behind these dual effects. The BREEAM premium is driven by its function as a cognitive shortcut—a signal of quality and liquidity, particularly for institutional investors.
This signalling value was articulated by a fund management director, who explained:
"I believe certification is particularly important for large institutional players because it's about liquidity... if there's a rating, it actually sells better because it's somehow a perceived no-brainer for the buyer."
This statement supports the signalling component of our theory. The label itself confers value by reducing information asymmetry and transaction friction. However, participants also stressed that EPC ratings are becoming a direct proxy for risk. The value associated with higher EPC grades is less about a "green" image and more about mitigating future regulatory and operational risks.
An investment manager articulated this risk-focused perspective clearly:
"We in our underwriting process we use [EPC] as a proxy for energy efficiency... it's more the interlink between energy efficiency and regulatory risk."
4.1. Mediation Analysis: Decomposing the BREEAM Premium
While the hedonic model shows that both certification and performance matter, it does not explain how they are related. To assess our second proposition, that performance is a key mechanism through which certification creates value, we conducted a formal mediation analysis.
The results, presented in Table 3, suggest a substantial statistical mediation pathway. The total effect of a high BREEAM certification on asset value is a 18.7% premium (c). However, when we decompose this effect, we find that the indirect effect—the portion mediated through a higher EPC rating (ab)—is 12.2%. This accounts for 65.2% of the total premium. The direct effect of the BREEAM label, independent of its association with a better EPC, remains significant but is much smaller at 6.5% (c').
Table 3: Author’s own elaboration.
This is a central finding of the study: approximately two-thirds of the observed BREEAM-value association is statistically accounted for by EPC ratings. Because EPC ratings are market-perceived performance and compliance proxies, this result should be interpreted as evidence consistent with a performance-related and regulatory-risk pathway, rather than as definitive causal mediation. This provides powerful empirical support for Proposition 2 and the dominance of the performance effect. The market is becoming more sophisticated, rewarding tangible operational efficiency and risk mitigation over the symbolic value of a label alone.
It bears emphasis that EPC ratings, as the mediating variable, represent the market's perception of operational energy efficiency rather than metered consumption data. The value attributed to the performance channel therefore reflects what investors, lenders, and valuers price, namely, regulatory compliance status and expected operational risk, rather than a precise engineering measure of energy use.
The qualitative data explains this shift. Investors are increasingly aware of the "performance gap", the disparity between a building's designed efficiency (reflected in a BREEAM certificate) and its actual operational energy use.
A sustainability research director noted:
"EPC it's kind of a good indicator... [but] there is research that shows that the correlation between EPC and real operational energy use isn't actually that good... EPC shows building fabric but not always real energy use." (ID VI)
This awareness drives investors to look beyond the certificate to the underlying performance metrics that the EPC rating, however imperfectly, represents. The 6.5% residual direct effect of BREEAM suggests that signalling still matters—it conveys unobserved quality and reduces risk—but its role as the primary value driver has diminished.
4.2. Geographic Heterogeneity: The Evolution from Advantage to Hygiene
Our theory predicts that the importance of sustainability components will vary with market maturity. The analysis of premiums across London's submarkets, presented in Table 4, provides indicative evidence consistent with this expectation.
The BREEAM certification premium is an enormous 39.8% in Stratford, an emerging regeneration submarket with a high concentration of new, high-quality stock. In contrast, the premium compresses to just 9.4% (and is statistically insignificant) in the West End, London's most established and mature prime office market. A clear premium gradient is visible, declining systematically as markets mature.
Table 4: Author’s own elaboration. Combined effect calculated as: exp(β_BREEAM + β_EPC×6) - 1, representing a property moving from Low BREEAM/EPC G to High BREEAM/EPC A.
This pattern is consistent with Proposition 1. In emerging markets like Stratford, a BREEAM certificate acts as a powerful signal of quality and a key differentiator in a competitive leasing environment. However, in mature markets like the West End and the City, where high sustainability standards have become the norm, the signalling value is eroded.
As an investment manager observed about mature markets:
"...it's almost seen as a kind of basic requirement for a new office development now to have such a certification... now more just synonymous with having a good quality asset so it will be subject to kind of a discount or a negative if you didn't have a certification." (ID VII)
This quote illustrates the transition of certification from a competitive advantage (generating a premium) to a market hygiene factor (where its absence incurs a penalty). This leads directly to our final set of findings on the brown discount.
4.3. The Brown Discount: Quantifying the Penalty for Underperformance
The Brown Discount Hypothesis (Proposition 4) predicts that as markets mature and regulations tighten, the financial penalty for poor environmental performance will accelerate. Our analysis provides indicative empirical evidence of this effect in a major European office market.
Table 5 shows the valuation discount for properties with poor energy performance relative to a baseline EPC C-rated building. The results are compelling. Properties with an EPC rating of F or G, which are non-compliant with current MEES regulations and thus cannot be legally let to new tenants, trade at an estimated 24.7% discount. Even properties rated EPC E, which are at risk from future regulatory tightening, already face a significant 12.3% discount, indicating that the market is pricing in future risk today.
Table 5: Author’s own source
This is consistent with the market-access effect at work. The 24.7% discount is not a gradual penalty; it is a cliff-edge effect reflecting the loss of income and liquidity for a stranded asset.
A corporate reporting analyst vividly described this impending reality:
"In the UK if they don't [have] a higher EPC rating, they will not be able to... let the offices out... that's going to have a bad impact on returns... even if you don't care about ESG, you still have to do these things at a bare minimum, because there's a regulatory response." (ID IV)
This finding supports the brown discount hypothesis: as sustainability becomes institutionalised, the focus shifts from the reward for leaders to the punishment for laggards. The financial consequences of failing to meet regulatory and market-based minimums are severe and accelerating.
5. Discussion and Theoretical Implications
These findings extend beyond real estate finance to inform urban planning theory, particularly debates on sustainability transitions, just retrofit pathways, and the financialisaton of climate risk in cities.
The empirical results provide compelling validation for the Sustainability Value Decomposition Framework. Our findings not only confirm the existence of sustainability-linked valuation effects but, more importantly, they disaggregate the mechanisms through which this value is created. This mechanistic understanding represents a significant advance over the existing literature, which has treated the 'green premium' as a monolithic phenomenon.
5.1. Validation of the Sustainability Value Decomposition Framework
Our analysis is consistent with distinct and measurable contributions of the three value components proposed in our framework.
- Market-Perceived Performance and Compliance as Major Value Channels: The central finding that EPC ratings account for approximately two-thirds (65.2%) of the BREEAM certification premium provides powerful support for Proposition 2, challenging the assumption prevalent in early green building literature (pre-2015) that certification labels themselves drive value, revealing instead that operational performance is the primary mediating mechanism. Thus demonstrates a fundamental shift in market sophistication. While early research (Eichholtz, Kok, & Quigley, 2010) found it difficult to disentangle signalling from performance, our results indicate that as markets mature and data availability improves, investors are increasingly able to "look through" the label to the underlying operational and financial performance. This aligns with institutional theory, which predicts a move from symbolic compliance to substantive performance as practices become institutionalised (DiMaggio & Powell, 1983). The durable value is found in the tangible cash flow improvements and risk mitigation associated with energy efficiency, not just the certificate itself.
- Persistent, but Diminishing, Signalling Value: The significant residual direct effect of BREEAM certification (6.5%) confirms that Proposition 1 holds: signalling still has value. The brand of a top-tier certification continues to function as a heuristic for quality, reducing information asymmetry and enhancing liquidity, as described by Spence (1973). However, our geographic heterogeneity analysis shows this signal's value is highly context-dependent and erodes with market saturation. The dramatic compression of the BREEAM premium from 39.8% in emerging Stratford to an insignificant 9.4% in the established West End empirically demonstrates the diminishing returns to signalling predicted by our framework.
- Market Access and the Cliff-Edge of the Brown Discount: The quantification of a 24.7% discount for MEES non-compliant properties provides significant validation for Proposition 3 and the concept of market access effects. This is not a continuous premium but a binary, threshold-based outcome. An asset's exclusion from the legal rental market or from the investment universe of institutional capital constitutes a loss of value that traditional premium/discount models fail to capture. The finding that the market is already pricing in future risk for EPC 'E' assets (-12.3% discount) supports Proposition 4, demonstrating that regulatory anticipation effects are powerful drivers of current valuation. This non-linear, accelerating penalty for underperformance is a critical extension to real estate finance theory, introducing a new dimension of regulatory transition risk.
5.2. Extensions to Real Estate Finance and Institutional Theory
Our findings have several important implications for broader theory.
First, we refine hedonic pricing theory in the context of sustainable real estate. By employing mediation analysis, we move beyond simply adding a 'green' dummy variable to a hedonic model. We demonstrate that such an approach conflates distinct causal pathways and can lead to flawed strategic conclusions. Future research must explicitly model the mechanisms, signalling, performance, and risk, through which attributes like certification translate into value.
Second, we contribute to real estate finance theory by empirically demonstrating that sustainability is not just an 'alpha' factor but is now a source of systematic risk. The 'brown discount' represents a new form of financial obsolescence tied to regulatory and market standards. This 'transition risk' needs to be formally incorporated into asset pricing models, risk management frameworks, and portfolio construction, much like interest rate or market risk. The option-like characteristics of market access effects suggest that standard linear risk-return models are insufficient, and frameworks from option pricing theory may be more appropriate for valuing regulatory compliance.
Third, our work provides a real-world validation of institutional theory in a market context. The transition of BREEAM certification from a symbol of elite status in emerging submarkets to a 'license to operate' in mature ones is a textbook case of institutional isomorphism. The interviews reveal the coercive pressures of regulation (MEES), the normative pressures of professional standards (investor ESG mandates), and the mimetic processes of competitors all driving the market toward a new equilibrium where sustainability is a baseline expectation.
5.3. Practical Applications and Policy Implications
The theoretical insights derived from our findings provide evidence base for strategic decision-making by investors, valuers, and policymakers.
5.3.1. For Investors and Asset Managers
Our decomposition of value leads to a more nuanced investment strategy than simply acquiring 'green' buildings.
- Adopt a "Performance-First" Strategy: Given that EPC ratings account for a large share of the observed BREEAM-value association, investors should prioritise improvements that strengthen both operational performance and regulatory resilience. This approach captures the most durable component of the sustainability premium.
- Target Strategic Certification: The decision to pursue a BREEAM certification should be strategic, not automatic. It is most valuable in emerging submarkets (to maximise signalling value) or for assets intended for near-term disposal in any market (to enhance liquidity and reduce transaction friction). In mature markets, its value is primarily defensive ,to avoid a discount.
- Price Regulatory Risk Explicitly: The estimated 'brown discount' is economically material and may become more significant as standards tighten. Acquisition due diligence must include a formal 'regulatory stress test' that models the cost of future MEES compliance. Portfolios should be audited for assets at risk of becoming stranded, and a clear strategy for retrofit or disposal must be implemented. As one manager warned, a "cliff edge" is approaching where value write-downs could be sudden and significant (ID IV). This dynamic creates a two-tier urban office market, with potential consequences for urban inequality, as lower-grade buildings in secondary locations face cumulative disadvantage from both locational and environmental obsolescence.
- Exploit Geographic Arbitrage: The dramatic variation in premiums across submarkets creates opportunities. Investors can acquire high-performing assets in mature markets where the explicit 'green premium' is modest, thereby benefiting from superior operational cash flows and downside risk protection without overpaying for a signal.
5.3.2. For Valuers and Appraisers
Valuation methodologies must evolve to reflect these findings. Relying on a simple 'green premium' comparable uplift is no longer sufficient and may be misleading. Valuers should:
- Disaggregate the Adjustment:
Explicitly consider separate adjustments for certification (signalling/liquidity) and energy performance (operational cost savings and regulatory risk).
- Incorporate Regulatory Risk:
The capital expenditure required to bring a building to future MEES compliance (e.g., EPC 'B' by 2030) should be explicitly deducted from the valuation of non-compliant buildings.
- Contextualise Premiums:
Recognise that premiums are not static. The premium for a BREEAM 'Excellent' building in Stratford is fundamentally different from the same building in the West End. Valuation reports must reflect this submarket-specific context.
5.3.3. For Policymakers
Our findings offer insights for designing more effective environmental regulations for the built environment.
- Focus on Performance-Based Regulation: The finding that the market values legally recognised performance (proxied by EPC) more than a holistic certificate (BREEAM) suggests that policy should be laser-focused on measurable outcomes like operational energy use and carbon emissions. While certifications have been useful in building market awareness, the next generation of policy should be performance driven.
- Provide Clear, Long-Term Regulatory Pathways: The market's ability to price in future risk for EPC 'E' assets demonstrates that clear, long-term regulatory signals are effective. Governments should provide a predictable, ratcheting schedule for minimum standards to allow the market to adjust efficiently and avoid abrupt value destruction (Seow, 2025).
- Leverage Spillover Effects: Our spatial analysis revealed positive spillover effects from sustainable buildings. This provides an economic rationale for targeted incentives (e.g., tax abatements, density bonuses) in designated regeneration zones to create clusters of high-performing buildings, which can lift the entire submarket.
6. Limitations and Future Research
While this study provides significant insights into the mechanisms of sustainability value, its limitations define the boundaries of its conclusions and, more importantly, illuminate a compelling agenda for future research. Our findings position the Sustainability Value Decomposition Framework as a useful analytical lens; the following avenues of inquiry would serve to evaluate its generalizability, extend its application, and deepen its theoretical power.
6.1. Generalizability and the Dynamics of Market Evolution
Our findings are specific to the London office market, a global city with a unique regulatory environment and high investor sophistication. This serves as an excellent "leading indicator" market but raises questions about generalizability. Future research should apply the Sustainability Value Decomposition Framework to a diverse range of contexts to evaluate its robustness:
- Sample size and estimation stability
The final analytical sample contains 111 institutional office transactions. While this sample provides a focused and relatively homogeneous setting, it limits the statistical power available for subgroup estimates, mediation analysis, and brown-discount categorisation. Accordingly, the main OLS and IV results should be treated as the primary quantitative findings, while the submarket and brown-discount estimates should be interpreted as exploratory evidence requiring confirmation in larger datasets
- Cross-Market Application:
How do the relative weights of Signalling, Performance, and Market Access effects shift in markets with different regulatory drivers or certification architectures? The Sustainability Value Decomposition Framework generates specific, testable predictions for two categories of market that are of particular policy and investment interest. In emerging and secondary markets, such as those in Central and Eastern Europe, or in developing economies with nascent sustainability reporting norms, Signalling effects are expected to dominate, since certification remains scarce, information asymmetry is high, and institutional investor sophistication is lower.
The large BREEAM premium observed in Stratford in the present study, a regeneration submarket sharing several of these characteristics relative to the mature West End, is empirically consistent with this prediction. As certification prevalence increases, diminishing returns to signalling should cause premium compression analogous to that documented across London's submarkets herein.
These differences should not be attributed exclusively to market maturity. They may also reflect compositional differences in building age, development timing, asset quality, tenant structure, lease profile, and transaction activity across submarkets. The submarket results are therefore interpreted as suggestive evidence of heterogeneous sustainability pricing, rather than as definitive proof that market maturity alone explains premium compression
In LEED-dominated markets such as major US gateway cities, the architectural differences of the LEED credit-based system generate a more heterogeneous signal than BREEAM's hierarchical rating bands. More importantly, the absence of a direct regulatory equivalent to MEES, a statutory minimum performance threshold that determines let-ability, implies that Market Access effects would be structurally weaker in the US federal context, notwithstanding the emergence of city-level performance ordinances (e.g., New York City Local Law 97; California Title 24 benchmarking).
The brown discount, whilst expected to be present, would be predicted to be smaller in magnitude than the 24.7% penalty quantified herein. A systematic cross-market study testing these differential predictions across global city-markets at various stages of regulatory and certification maturity would represent a significant contribution to the literature.
- Modeling the Rate of Value Decay:
Our submarket analysis provides a static snapshot of the Signalling premium's erosion. A crucial next step is to model this dynamic process explicitly. Longitudinal research could apply models from marketing and innovation studies (e.g., the Bass diffusion model) to predict the rate of decay of a certification's signalling value as it transitions from a differentiator to a market norm. This would provide investors with a predictive tool for timing market entry and exit strategies.
6.2. From Theoretical Ratings to Actual Performance: Pricing the Gap
This analysis relies on EPC ratings as the primary proxy for energy performance, reflecting their central role in regulatory compliance and market transactions. However, the "performance gap" between a building's designed efficiency and its actual operational energy use is a well-documented challenge. This gap represents a significant, un-priced risk factor.
- Quantifying a "Performance Gap Discount":
The advent of operational energy benchmarks like NABERS UK, which measure actual consumption, provides a new research frontier. Future studies should compare buildings with identical BREEAM and EPC ratings but different NABERS scores. We hypothesize the existence of a "performance gap discount", a valuation penalty for certified buildings that fail to deliver on their operational promise. Quantifying this discount would be a major contribution, signaling the market's ultimate shift from valuing design intent to valuing delivered results.
6.3. Extending the Framework: Decomposing the 'S' in ESG
Our framework masterfully decomposes the value drivers of the 'E' in ESG. A powerful test of its theoretical utility would be to apply it to the social dimension of real estate. The 'S' component is often considered less tangible, but it is increasingly being codified through certifications and measured through performance metrics (Dauerer, 2025).
- Decomposing the 'Social' Premium:
Future research could use the Sustainability Value Decomposition Framework to disentangle the value of social attributes. For example, one could analyse the premium for a WELL-certified building by separating its Signalling effect (the WELL label itself), its Performance effect (measured improvements in indoor air quality, occupant satisfaction surveys, or reduced employee absenteeism for tenants), and its Market Access effect (its appeal to corporate tenants with strong human capital policies). Such a study would pioneer a structured, financial approach to valuing the social dimension of real estate.
By pursuing these research avenues, the academic and practitioner communities can build upon the foundations laid in this paper, developing an ever more nuanced understanding of how sustainability, in all its facets, fundamentally creates and shapes value in the built environment.
7. Conclusions
This research set out to deconstruct the ‘green premium’ in commercial real estate by examining the channels through which certification, market-perceived performance, and regulatory compliance are associated with asset value. By developing and empirically validating the “Sustainability Value Decomposition Framework”, this study makes several fundamental contributions to real estate finance theory and practice (Ghijselinck, Matthysen, & Honnay, 2025).
Our primary contribution is the empirical disaggregation of sustainability value into its constituent components. The headline finding—that superior energy performance mediates 65.2% of the valuation premium associated with BREEAM certification, adds nuance to the ESG investment narrative (Schwartz & Raslan, 2013). The market's focus is rapidly shifting from the symbolic accumulation of labels (signalling) to the substantive rewards of operational efficiency and risk mitigation (performance).
Secondly, we provide evidence of a sizeable "brown discount" in a major European market. The 24.7% valuation penalty for properties non-compliant with current energy regulations (MEES) provides significant evidence of market access effects, where regulatory and institutional thresholds create decarbonization risks (Di Liddo, Amoruso, Tajani, Morano, & Stara, 2025). This suggests that regulatory transition risk is increasingly reflected in asset values.
Thirdly, our analysis of geographic heterogeneity reveals that sustainability value is not static but is highly contingent on market maturity. The systematic erosion of certification premiums from 39.8% in emerging submarkets to just 9.4% in established cores demonstrates the evolution of sustainability from a competitive differentiator to a market hygiene factor.
Collectively, these findings suggest that the era of a simple, universal 'green premium' is over. For investors, the strategic implications are profound: capital should be directed towards performance-enhancing retrofits, regulatory risks must be explicitly priced, and strategies must be dynamically adapted to local market contexts. For policymakers, our results advocate for a continued focus on clear, long-term, performance-based standards that allow the market to price risk efficiently.
This research suggests that sustainability attributes are increasingly material to commercial real estate valuation, particularly where energy-performance proxies and regulatory thresholds directly affect leasing, liquidity, and transition-risk expectations. As global cities navigate the transition to net-zero built environments, the Sustainability Value Decomposition Framework offers both a theoretical lens and a practical toolkit for aligning financial incentives with climate imperatives, ensuring that sustainability transitions are not only environmentally effective but also economically efficient and socially just.
9. Appendices
Appendix A: Qualitative Interviews
Appendix B: Quantitative Data. Submarkets
Appendix C: Quantitative Data and Models.
Funding
This research did not receive any specific grant from funding agencies in the public, commercial, or not-for-profit sectors.
Competing Interests
The authors declare no competing financial or non-financial interests.
Compliance with Ethics Standards
Not applicable.
Data Availability Statement
All data generated or analysed during this study are included in this published article and available in the Supplementary Information.
Declaration of generative AI and AI-assisted technologies
During the preparation of this work the author(s) used Chat-GPT in order to verify accessibility and academic grammar. After using this tool/service, the author(s) reviewed and edited the content as needed and take(s) full responsibility for the content of the published article.
References
- Abdelkafi, N., & Täuscher, K. (2016). Business Models for Sustainability From a System Dynamics Perspective. Organization & Environment, 29(1), 74-96. [CrossRef]
- Akerlof, G. A. (2002). Behavioral macroeconomics and macroeconomic behavior. American Economic Review, 92(3), 411–433. doi:10.1257/00028280260136192.
- Arat, B., Ates, H. F., & Sefer, E. (2026). Sub-City Real Estate Price Index Forecasting at Weekly Horizons Using Satellite Radar and News Sentiment. arXiv. Retrieved from http://doi.org/10.48550/ARXIV.2602.18572.
- Bailey, J. R., Lindquist, W. B., & Rachev, S. T. (2024). Hedonic Models Incorporating Environmental, Social, and Governance Factors for Time Series of Average Annual Home Prices. Journal of Risk and Financial Management, 17(8), 375. [CrossRef]
- Bolton, P., & Kacperczyk, M. (2021). Do investors care about carbon risk? Journal of Finance, 76(6), 3059–3111. [CrossRef]
- Braun, V., & Clarke, V. (2006). Using thematic analysis in psychology. Qualitative Research in Psychology, 3(2), 77–101. [CrossRef]
- BRE Global. (2010). BRE Global Ltd. Energy efficiency in existing housing . Garston, Watford, Hertfordshire, UK: IHS BRE Press. Retrieved 2 15, 2026, from https://www.bretrust.org.uk.
- Carlson, K., & Pressnail, K. D. (2017). Value impacts of energy efficiency retrofits on commercial office buildings in Toronto, Canada. Energy and Buildings, 162, 154–162. [CrossRef]
- CBRE. (2022). Green is good: The enduring rent premium of LEED-certified U.S. office buildings. CBRE Research. Retrieved 2 26, 2026, from https://www.cbre.com/insights/viewpoints/green-is-good-the-endurance-of-the-rent-premium-in-leed-certified-us-office-buildings.
- Chegut, A., Eichholtz, P., & Kok, N. (2019). The price of innovation: An analysis of the marginal cost of green buildings. Journal of Environmental Economics and Management, 98, 102248. [CrossRef]
- Dauerer, A. (2025). A systematic literature review of performance measurement systems and the integration of ESG factors. Environmental and Sustainability Indicators, 27, 100746. [CrossRef]
- DeSalvo, J. S. (2017). Teaching the DiPasquale-Wheaton Model. Journal of real estate practice and education, 20(1), 1-25. [CrossRef]
- Devine, A., & Kok, N. (2015). Green certification and building performance: Implications for tangibles and intangibles. Journal of Portfolio Management, 41(6), 151-163. doi:10.3905/jpm.2015.41.6.151.
- Di Liddo, F., Amoruso, P., Tajani, F., Morano, P., & Stara, F. (2025). Urban redevelopment and decarbonization challenges. An overview from the real estate market perspective. Energy and Buildings, 343, 115914. [CrossRef]
- DiMaggio, P. J., & Powell, W. W. (1983). The iron cage revisited: Institutional isomorphism and collective rationality in organizational fields. American Sociological Review, 48(2), 147-160. [CrossRef]
- Dixit, A. K., & Pindyck, R. S. (1994). Investment under uncertainty. New Jersey: Princeton University Press. Retrieved from https://press.princeton.edu/books/hardcover/9780691034102/investment-under-uncertainty?srsltid=AfmBOooVcalI8mjfC1o6k799VY1XAzyAZK3WcfgYQEqlQ9lEm20t4bRE.
- Economidou, M., Todeschi, V., Bertoldi, P., D’Agostino, D., Zangheri, P., & Castellazzi, L. (2020). Review of 50 years of EU energy efficiency policies for buildings. Energy and Buildings, 225, 110322. [CrossRef]
- Eichholtz, P. H. (2019). Environmental performance and the cost of debt: Evidence from commercial mortgages and REIT bonds. Journal of Banking & Finance, 102, 19–32. [CrossRef]
- Eichholtz, P., Kok, N., & Quigley, J. M. (2010). Doing well by doing good? Green office buildings. American Economic Review, 100(5), 2492-2509. doi:10.1257/aer.100.5.2492.
- Fetters, M. D., Curry, L. A., & Creswell, J. W. (2013). Achieving integration in mixed methods designs — Principles and practices. Health Services Research, 48(6-2), 2134–2156. [CrossRef]
- Fuerst, F., & McAllister, P. (2011). Green noise or green value? Measuring the effects of environmental certification on office values. Real estate economics, 39(1), 45-69. [CrossRef]
- Fuerst, F., & McAllister, P. (2011). The impact of Energy Performance Certificates on the rental and capital values of commercial property assets. Energy Policy, 39(10), 6608-6614. [CrossRef]
- Ghijselinck, D., Matthysen, E., & Honnay, O. (2025). Beyond compliance: Strengthening mitigation hierarchy implementation in environmental impact assessment practice. Environmental Impact Assessment Review, 116, 108134. [CrossRef]
- Gopal, S. V. (2025). ESG or financial metrics? What retail investors really look for in decision-making. Investment Management and Financial Innovations, 22(1), 351–368. [CrossRef]
- Hardy, A., & Glew, D. (2019). An analysis of errors in the Energy Performance certificate database. Energy Policy, 129, 1168-1178. [CrossRef]
- Hayes, A. F. (2009). Beyond Baron and Kenny: Statistical Mediation Analysis in the New Millennium. Communication Monographs, 76(4), 408-420. [CrossRef]
- Hodgetts, E. (2025). Investment Management Survey. Theia.org, The Investment Association, London. Retrieved 1 14, 2026, from https://www.theia.org/sites/default/files/2025-10/Investment%20Management%20in%20the%20UK%202024-2025_1.pdf.
- Huo, X., Xue, H., & Jiao, L. (2022). Risk management of retrofit project in old residential areas under green development. Energy and Buildings, 279, 112708. [CrossRef]
- Ivankova, N. V., Creswell, J. W., & Stick, S. L. (2005). Using Mixed-Methods Sequential Explanatory Design: From Theory to practice. Field Methods, 18(1), 3–20. [CrossRef]
- Jamaludin, A. F., & Mohd, B. (2025). The Impact of Environmental, Social and Governance (Esg) on Real Estate Investment: A Bibliometric Review. Pacific Rim Real Estate Society Journal, 30(1). Retrieved from https://www.prres.org/uploads/1350/180/ESG-in-real-estate-investment-latest.pdf.
- Jenkins, D., S.Semple, Patidar, S., & McCallum, P. (2021). Changing the approach to energy compliance in residential buildings – re-imagining EPCs. Energy and Buildings, 221, 111239. [CrossRef]
- Leutner, S., Gloria, B., & Bienert, S. (2024). Is there a green discount in commercial real estate lending? Journal of Property Investment and Finance, 42(5), 411–434. [CrossRef]
- Li, W., Sui, W., Cheng, L., Ji, Y., Guo, Y., & Zhu, J. (2026). Quantifying seasonal demand-side flexibility in residential air conditioning under diverse control strategies. Energy and Buildings, 352, 116764. [CrossRef]
- Lizana, J., Wheeler, S., Azizi, E., Halloran, C., Wheeler, J., Wallom, D. C., & McCulloch, M. (2023). Integrated post-occupancy evaluation and intervention that achieve real-world zero-carbon buildings. Energy and Buildings, 303, 113766. [CrossRef]
- Masoso, O., & Grobler, L. (2009). The dark side of occupants’ behaviour on building energy use. Energy and Buildings, 42(2), 173–177. [CrossRef]
- Menezes, A. C., Cripps, A., Bouchlaghem, D., & Buswell, R. (2011). Predicted vs. actual energy performance of non-domestic buildings: Using post-occupancy evaluation data to reduce the performance gap. Applied Energy, 97, 355–364. Retrieved from https://hdl.handle.net/2134/9937.
- Miller, N., Spivey, J., & Florance, A. (2008). Does green pay off? Journal of Real Estate Portfolio Management, 14(4), 385-400. [CrossRef]
- Ni, G., Zhang, Z., Yuan, Z., Huang, H., Xu, N., & Deng, Y. (2021). Transformation paths and influencing factors of tacit knowledge into explicit knowledge in real estate companies: a qualitative study. Engineering Construction & Architectural Management, 29(3), 1319–1342. [CrossRef]
- Preacher, K. J., & Hayes, A. F. (2008). Asymptotic and resampling strategies for assessing and comparing indirect effects in multiple mediator models. Behavior Research Methods, 40(3), 879–891. [CrossRef]
- Qadar, S. (2025). London Office Market Report. London: Knight Frank. Retrieved from https://www.knightfrank.co.uk/site-assets/research/report-pdfs/lomr/lomr-q4-2025_final.pdf.
- Reichardt, A. (2014). Operating Expenses and the Rent Premium of Energy Star and LEED Certified Buildings in the Central and Eastern U.S. J Real Estate Finan Econ, 49, 413–433. [CrossRef]
- Rigobon, R. (2003). Identification through heteroskedasticity. The Review of Economics and Statistics, 85(4), 777–792. [CrossRef]
- Robinson, S., & McIntosh, M. G. (2022). A Literature Review of Environmental, Social, and Governance (ESG) in Commercial Real estate. Journal of Real Estate Literature, 30(1-2), 54–67. [CrossRef]
- Roig-Hernando, J., Marmolejo-Duarte, C., & Espinoza-Zambrano, P. (2026). The economic impact of ESG-Driven office building Renovations: Evidence from prime Spanish commercial real estate. Energy and Buildings, 357, 117132. [CrossRef]
- Schwartz, Y., & Raslan, R. (2013). Variations in results of building energy simulation tools, and their impact on BREEAM and LEED ratings: A case study. Energy and Buildings, 62, 350–359. [CrossRef]
- Seow, R. Y. (2025). Clarifying CSR and ESG: Causes of conflation, consequences, and pathways to conceptual clarity. Journal of Environmental Management, 394 , 127468. [CrossRef]
- Shahzad, S., Faheem, M., Muqeet, H. A., & Waseem, M. (2024). Charting the UK’s path to net zero emissions by 2050: Challenges, strategies, and future directions. IET Smart Grid, 7(6), 716–736. [CrossRef]
- Spence, M. (1978). Job market signaling. Uncertainty in economics, 281-306. [CrossRef]
- Uddin, M. A., Shahabuddin, M., Jameel, M., Rahman, M., Hosen, M. A., Alanazi, F., . . . El-Kady, M. S. (2025). Sustainable construction practices in urban areas: innovative materials, technologies, and policies to address environmental challenges. Energy and Buildings, 341, 115831. [CrossRef]
- UK-Gov. (2025). Energy Performance of Buildings Certificates Statistical Release. Retrieved from Gov.uk/government/statistics/energy-performance-of-building-certificates-in-england-and-wales-october-to: https://www.gov.uk/government/statistics/energy-performance-of-building-certificates-in-england-and-wales-october-to-december-2025/energy-performance-of-buildings-certificates-statistical-release-october-to-december-2025-england-and-wales.
- Zaroni, H. W., De Carvalho Miranda, R., & De Pinho, A. F. (2025). Enhancing sustainable efficiency: applications of data envelopment analysis in ESG performance measurement. International Journal of Productivity and Performance Management(74), 2908–2931. [CrossRef]
Figure 1.
Author’s own elaboration. Relationship between Signalling, Performance, and Market Access effects.
Figure 1.
Author’s own elaboration. Relationship between Signalling, Performance, and Market Access effects.
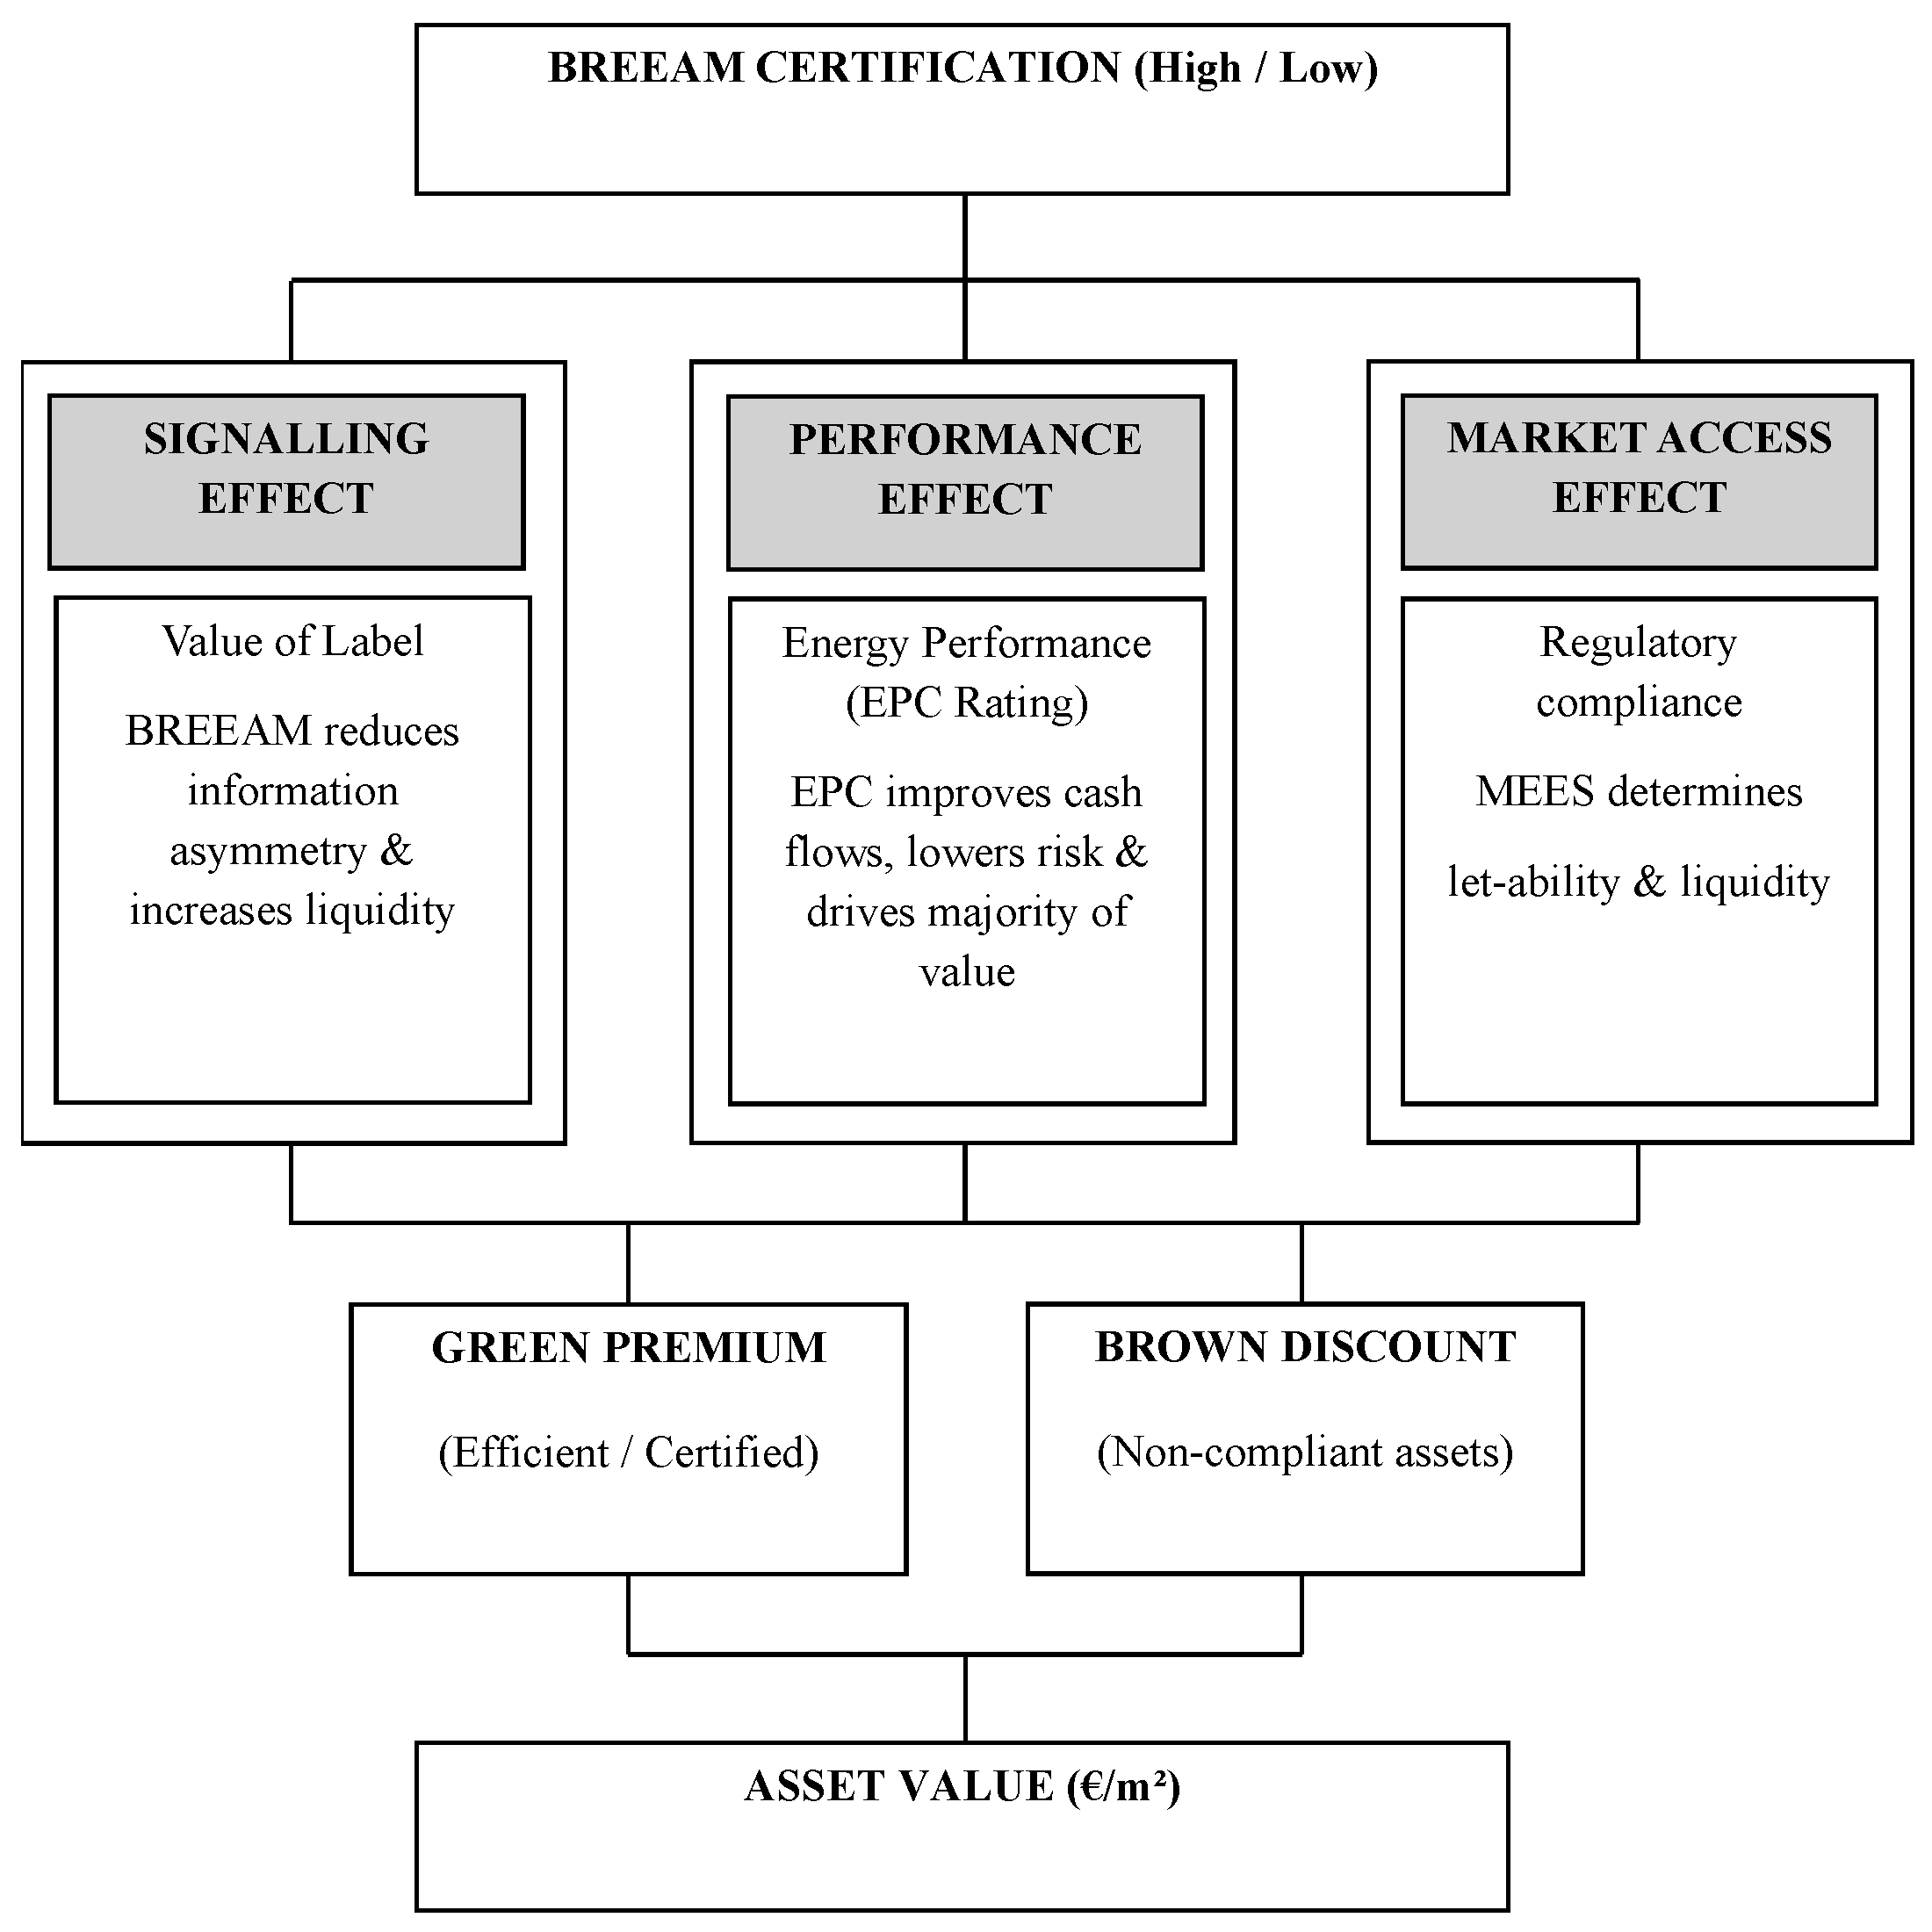

Table 1.
below, presents the Sample Composition by Submarket and Certification Status.
| Submarket | Total Assets | High BREEAM (%) | Mean EPC Rating | Mean Value €/m² |
| City | 35 | 68.6% | 4.2 (C+) | €8,947 |
| West End | 30 | 73.3% | 3.8 (C) | €12,156 |
| Stratford | 21 | 85.7% | 5.1 (B) | €4,678 |
| Southbank | 14 | 71.4% | 4.5 (C+) | €9,234 |
| Other | 11 | 54.5% | 3.9 (C) | €6,891 |
| Total | 111 | 70.3% | 4.3 (C+) | €8,942 |
Table 2.
OLS and 2SLS Estimates of the BREEAM Certification Premium Dependent Variable: ln(GAV/m²).
| Variable | (1) OLS | (2) 2SLS First Stage | (3) 2SLS Second Stage |
| Dep. Var: High BREEAM | |||
| High BREEAM | 0.138** | 0.095* | |
| (0.041) | (0.048) | ||
| LPA Stringency (Instrument) | 0.453*** | ||
| (0.104) | |||
| ln(GFA) | -0.041** | -0.038** | -0.039** |
| (0.016) | (0.015) | (0.016) | |
| Building Age | -0.006** | -0.005** | -0.005** |
| (0.002) | (0.002) | (0.002) | |
| Submarket FE | Yes | Yes | Yes |
| Quarter FE | Yes | Yes | Yes |
| Observations (N) | 111 | 111 | 111 |
| R² | 0.778 | 0.751 | 0.765 |
| First-Stage F-statistic | 18.74 |
Table 3.
Mediation Analysis of EPC on the BREEAM-Value Relationship.
| Effect Type | Coefficient | Bootstrap 95% CI | Interpretation |
| Total Effect (c) | 0.187*** | [0.098, 0.276] | Total BREEAM premium |
| First Stage (a) | 1.247*** | [0.832, 1.662] | BREEAM → EPC relationship |
| Second Stage (b) | 0.098*** | [0.060, 0.136] | EPC → Value relationship |
| Direct Effect (c') | 0.065* | [0.012, 0.118] | Residual signalling premium |
| Indirect Effect (ab) | 0.122* | [0.078, 0.171] | Portion mediated through EPC |
| Proportion Mediated | 65.2% | [58.7%, 73.8%] | % of premium explained by energy performance |
Table 4.
Submarket-Specific Sustainability Premiums.
| Submarket | BREEAM Premium | EPC Effect | Combined Effect* | Market Interpretation |
| Stratford | 39.8%*** | 12.7%*** | 58.2% | Emerging market differentiation |
| Southbank | 24.6%** | 11.4%*** | 41.3% | Development area growth |
| Other | 18.9%* | 10.1%** | 32.1% | Secondary market premiums |
| City | 12.3%* | 8.9%** | 22.7% | Mature market compression |
| West End | 9.4%ns | 7.2%* | 17.8% | Established market saturation |
Table 5.
Brown Discount Magnitude by Performance Category.
| Performance Category | Discount Magnitude | Regulatory Risk | Market Interpretation |
| EPC F-G (Stranded) | -24.7%*** | MEES non-compliant | Systematic exclusion |
| EPC E (At Risk) | -12.3%** | Future MEES risk | Discount anticipation |
| EPC D (Below Market) | -5.8%* | Competitive disadvantage | Market penalty |
| No/Low BREEAM + Poor EPC | -31.2%*** | Combined penalties | Cumulative effects |
Disclaimer/Publisher’s Note: The statements, opinions and data contained in all publications are solely those of the individual author(s) and contributor(s) and not of MDPI and/or the editor(s). MDPI and/or the editor(s) disclaim responsibility for any injury to people or property resulting from any ideas, methods, instructions or products referred to in the content. |
© 2026 by the authors. Licensee MDPI, Basel, Switzerland. This article is an open access article distributed under the terms and conditions of the Creative Commons Attribution (CC BY) license (http://creativecommons.org/licenses/by/4.0/).
Copyright: This open access article is published under a Creative Commons CC BY 4.0 license, which permit the free download, distribution, and reuse, provided that the author and preprint are cited in any reuse.