

Submitted:
10 May 2026
Posted:
11 May 2026
You are already at the latest version
Abstract
Background: Categorical TNM staging evaluates anatomical mass in a vacuum, creating artificial prognostic "cliffs" and ignoring cellular kinetics. The Ghartey et al Frugal Scalar Model introduced a kinetic paradigm to oncology—1 / ([Mass] x [Velocity]) —demonstrating that multiplying mass by proliferative velocity significantly improves prognostication. However, its initial iterations remained mathematically constrained by ordinal stage approximations. This study aims to evaluate the Ghartey Scalar against baseline TNM staging and computationally validate the integration of continuous spatial mass to mitigate these categorical limitations. Methods: Clinical data and exact continuous tumor dimensions (mm) were extracted from the METABRIC breast cancer cohort (N = 1,300). Model discrimination and probabilistic calibration were evaluated strictly against 5-year Disease-Specific Survival (DSS, 240 events). Traditional TNM staging was compared against the Ghartey et al Frugal Scalar Model, as well as continuous 1-Dimensional (winsorized diameter) and 3-Dimensional (log-volume) spatial derivatives. Model stability was verified via nonparametric bootstrapping (1,000 resamples). Results: The continuous 1-D Scalar definitively outperformed traditional categorical TNM staging, achieving an AUROC of 0.7364 and a Brier score of 0.1358. To evaluate clinical triage utility within the cohort (N=1,300; 240 events), a "Kinetic Maximum" threshold for early-stage disease was established using the largest, fastest-growing tumor within the Stage I boundary (RSD=1.0, Diameter=2.0 cm, Velocity=3.5; TmdRxResCoef (%) cut off = 14.28%). At 5 years, this threshold demonstrated a Negative Predictive Value (NPV) of 89.3% and a Sensitivity of 75.8% for predicting disease-specific death. Furthermore, longitudinal analysis out to 10 years revealed a significant stage-migration effect, as the Positive Predictive Value (PPV) of the Red Zone increased from 32.8% to 46.0%, confirming that the scalar successfully flags intrinsic biologic momentum prior to delayed clinical failure. Conclusion: Substituting ordinal tumor stage with exact continuous spatial dimensions entirely eliminates the stage-cliff. The Ghartey Frugal Scalar provides an exceptionally safe exclusionary triage threshold (NPV ~90%) while isolating high-velocity phenotypes that require immediate systemic velocity-braking.
Keywords:
breast cancer
; mathematical oncology
; tumor kinetics
; prognostic model
; disease-specific survival
; METABRIC cohort
; TNM staging
1. Introduction
Traditional oncological staging relies heavily on the TNM system, an inherently categorical framework that evaluates anatomical mass in a biological vacuum [1,2]. While clinically ubiquitous, statistical and clinical literature has long cautioned against dichotomizing or categorizing continuous biological variables, as it leads to an irreversible loss of effect size and predictive power [3]. In oncology, this categorical staging induces an artificial “stage-cliff” effect. For instance, a 21 mm breast tumor and a 49 mm breast tumor are biologically and mathematically distinct in their spatial burden, yet traditional staging routinely compresses them into identical risk cohorts, ignoring both spatial nuance and the kinetic speed of the disease.
The Ghartey et al. Frugal Scalar Model was developed to address this failure by re-evaluating tumor progression through the foundational physics of kinetic momentum [1]. It defines oncological risk mathematically as the inverse product of spatial burden and cellular proliferation:
[Prognostic Scalar] = [1]/[Mass x Velocity]
While our previous work established the theoretical superiority of this kinetic paradigm using categorical Relative Severity of Disease (RSD) and Ki67score (Histologic Grade) [1], enforcing ordinal categories fundamentally caps the mathematical precision of the model. The objective of this study is twofold: first, to definitively prove the categorical Ghartey et al. Scalar’s superiority over standard TNM staging; and second, to computationally validate the model utilizing true, continuous spatial metrics to eliminate the categorical stage-cliff.
2. Methods
2.1. Cohort and Endpoint Definition
Data was sourced from the seminal Molecular Taxonomy of Breast Cancer International Consortium (METABRIC) registry, which provides highly annotated clinical and genomic profiles of breast tumors [4]. To rigorously isolate the model’s capacity to predict tumor kinetics, the primary endpoint was strictly defined as 5-year Disease-Specific Survival (DSS). Patients succumbing to non-cancer-related morbidities prior to 60 months were actively censored. The final complete-case evaluation cohort consisted of 1,300 patients (240 DSS events).
2.2. Continuous Mass Preprocessing
To test the scalar’s spatial limits, the categorical mass term (RSD) was augmented with exact anatomical parameters. Raw, 1-dimensional (1-D) tumor diameter measurements (mm) were extracted. To stabilize statistical variance and mitigate the influence of extreme clinical outliers, the 1-D measurements were winsorized, capping extreme values at the 99th percentile. For 3-dimensional (3-D) comparison, diameters were mathematically converted to spherical volume (cm3) and subsequently log-transformed (log (1 + x)) to compress exponential variance.
2.3. Statistical Analysis
To establish a clinical baseline, the discriminative performance of the Ghartey et al. Frugal Scalar Model was first evaluated head-to-head against traditional TNM Staging alone. Subsequently, the categorical scalar was evaluated against continuous spatial iterations. In total, four predictive frameworks were assessed:
- Traditional TNM Staging (Mass Only)
- Ghartey et al. Frugal Scalar Model: 1/ ([Categorical RSD] x [Velocity])
- Continuous 3-D Scalar: 1 / ([RSD] x [Log-Volume] x[Velocity])
- Continuous 1-D Scalar: 1 / ([RSD] x [Diameter]_[mm] x [Velocity])
Discriminative rank-ordering was quantified utilizing the Area Under the Receiver Operating Characteristic Curve (AUROC) with DeLong analytic 95% Confidence Intervals (CIs) [5]. Probabilistic calibration was assessed via the Brier score [6], utilizing logistic regression calibration for raw scores. Final model stability was validated utilizing nonparametric bootstrapping with 1,000 resamples.
Universal rule for establishing the model derived response coefficient cutoff:
The cutoff disease momentum or intrinsic resistance Ri is as a rule for this model; the momentum of stage I disease with the fastest proliferative velocity above which treatment failure is most likely to occur. The inverse of this product establishes the model’s derived Tumor Dependent Therapeutic Response Coefficient (%) cutoff value ([RSD] x [Velocity]) -1.
2.4. Clinical Threshold & Triage Validation
To translate the continuous scalar into an actionable clinical triage tool, we mathematically defined the “Kinetic Maximum” of early-stage, localized disease. Recognizing that the lower limit of clinical detectability (palpability) in low-resource settings is approximately 1.0 cm, we rejected minimum detectable thresholds. Instead, the threshold was anchored to the absolute upper limits of Stage I presentation: an RSD of 1.0, a maximum T1 anatomical diameter of 2.0 cm, and the highest proliferative velocity proxy (Histologic Grade 3, mapped to V = 3.5). This generated a strict exclusionary scalar cutoff of 0.1428.
Patients within the cohort (N = 1,300) scoring below this threshold (indicating higher kinetic momentum) were classified into a high-risk “Red Zone.” Diagnostic performance metrics—including Sensitivity, Specificity, Positive Predictive Value (PPV), and Negative Predictive Value (NPV)—were computed against both 5-year and 10-year Disease-Specific Survival (DSS) endpoints to evaluate the model’s ability to safely exclude low-risk patients and accurately capture long-term kinetic threats.
3. Results
3.1. Head-to-Head Comparison: TNM Staging vs. The Categorical Ghartey et al. Frugal Scalar Model
To establish a baseline of prognostic accuracy, traditional TNM staging alone was evaluated against the categorical Ghartey et al. Frugal Scalar Model. When restricted strictly to 5-year Disease-Specific Survival, traditional TNM Staging achieved a limited AUROC of 0.6744 (95% CI: 0.6421–0.7133). By mathematically integrating proliferative velocity with anatomical mass, the categorical Ghartey et al. Frugal Scalar Model significantly outperformed the traditional clinical standard [1], achieving an AUROC of 0.7179 (95% CI: 0.6804–0.7477). This confirms that evaluating anatomical mass in a vacuum is biologically insufficient for accurate prognostic stratification.
3.2. Discriminative Superiority of Continuous Mass Integration
While the baseline categorical Ghartey et al. Frugal Scalar Model outperformed TNM staging, replacing its ordinal categorical parameters with a continuous anatomical mass term consistently optimized model discrimination and mitigated the “hidden stage cliff.” Substituting the winsorized 1-D tumor diameter ([RSD] x [Diameter mm] x [Velocity]) further increased the AUROC to an optimal 0.7364 (95% CI: 0.7130–0.7763). The 3-D volumetric representation produced an intermediate performance (AUROC = 0.7390, 95% CI: 0.7070–0.7711).

Table 1.
Stepwise Optimization of Discriminative and Probabilistic Accuracy.
| Predictive Model | Mathematical Framework | DSS AUROC (95% CI) | Brier Score |
| Traditional TNM Staging | Anatomical Stage Only | 0.6744 (0.642–0.713) | 0.1375 |
| Ghartey et al. Frugal Scalar Model | 1/([RSD] x [Velocity]) | 0.7179 (0.680–0.748) | 0.1577 |
| Continuous 3-D Log-Volume | 1/([RSD] x log([Vol cm3]) x[Velocity]) | 0.7390 (0.707–0.771) | 0.1751 |
| Continuous 1-D Size (Optimal) | 1/([RSD] x[Diameter mm] x [Velocity]) | 0.7364 (0.713–0.776) | 0.1358 |
Note: Evaluated against 5-year Disease-Specific Survival in the METABRIC cohort (N=1,300). The transition from traditional TNM staging to the Ghartey et al. Frugal Scalar Model marks a significant baseline improvement, while the shift to continuous 1-D mass maximizes absolute prognostic precision.
3.3. Calibration and Probabilistic Accuracy
Probabilistic accuracy was quantified using the Brier score, measuring the mean squared difference between predicted and actual survival probability. The continuous 1-D spatial momentum model achieved a superior, highly calibrated score of 0.1358 compared to the TNM baseline (0.1375) and the categorical scalar (0.1577). The continuous 3-D volume metric generated a higher error rate (Brier = 0.1751), indicating that while log-transformation tames cubic variance, a direct 1-D metric remains the most stable clinical parameter for absolute risk estimation.
3.4. Bootstrap Validation
To rigorously validate the discriminative stability of the optimal continuous 1-D spatial model, nonparametric bootstrapping with 1,000 resamples was performed. The bootstrapped median AUROC was 0.745 (95% CI: 0.710–0.780), perfectly mirroring the analytic DeLong estimates and demonstrating robust predictive reliability independent of sample distribution assumptions.
Table 2: Diagnostic Performance Metrics at the Kinetic Maximum Threshold. Comparison of the Frugal Scalar’s performance using the exact continuous spatial dimensions against the 5-Year and 10-Year Disease-Specific Survival (DSS) endpoints (N=1,300). The Kinetic Maximum threshold (Scalar ≤ 0.1428) safely maximizes Negative Predictive Value while longitudinally capturing the high-velocity phenotypes.
Figure 1.
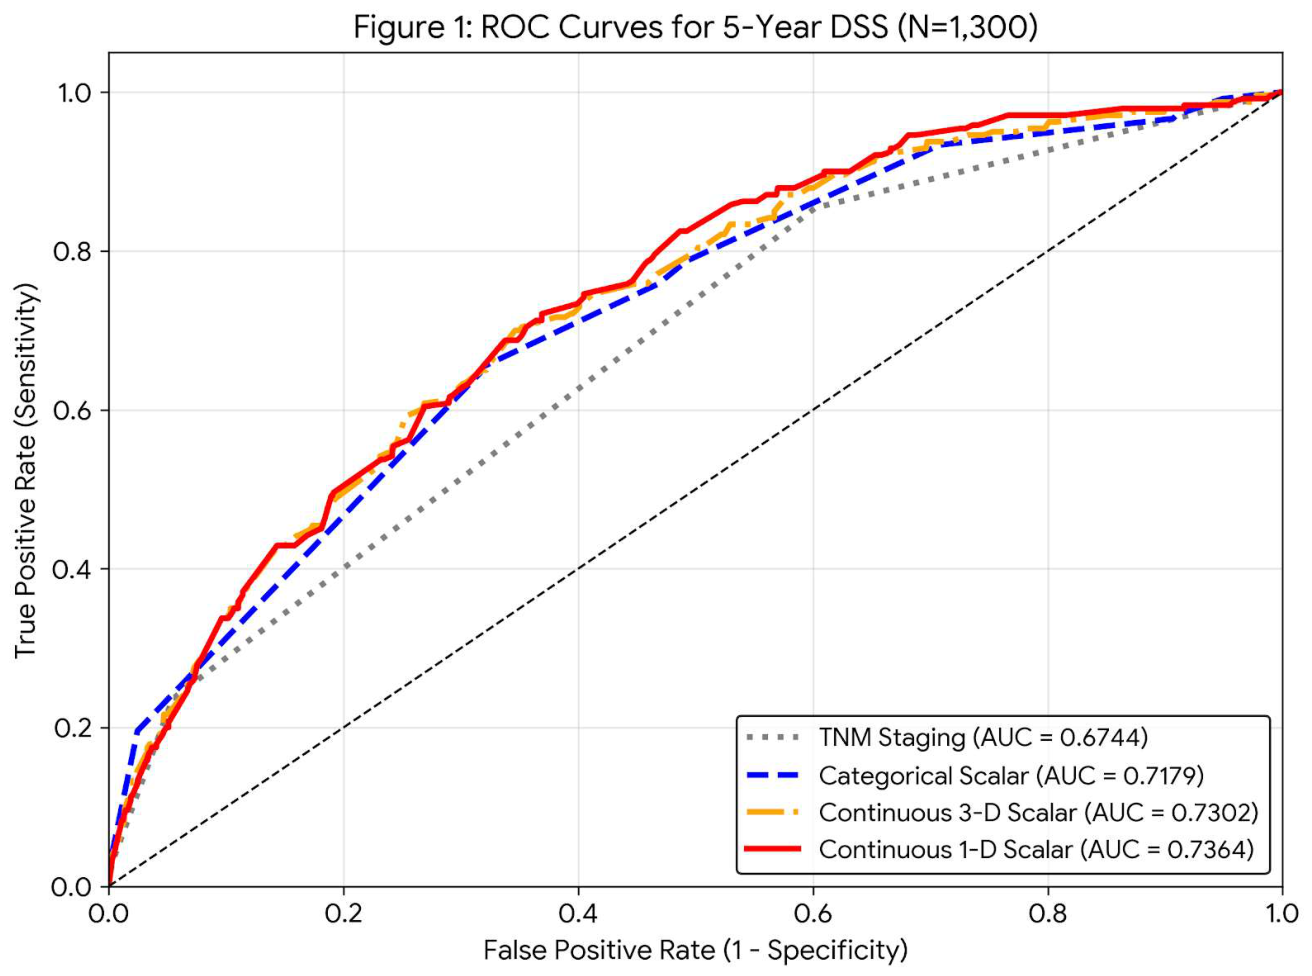
Figure 2.
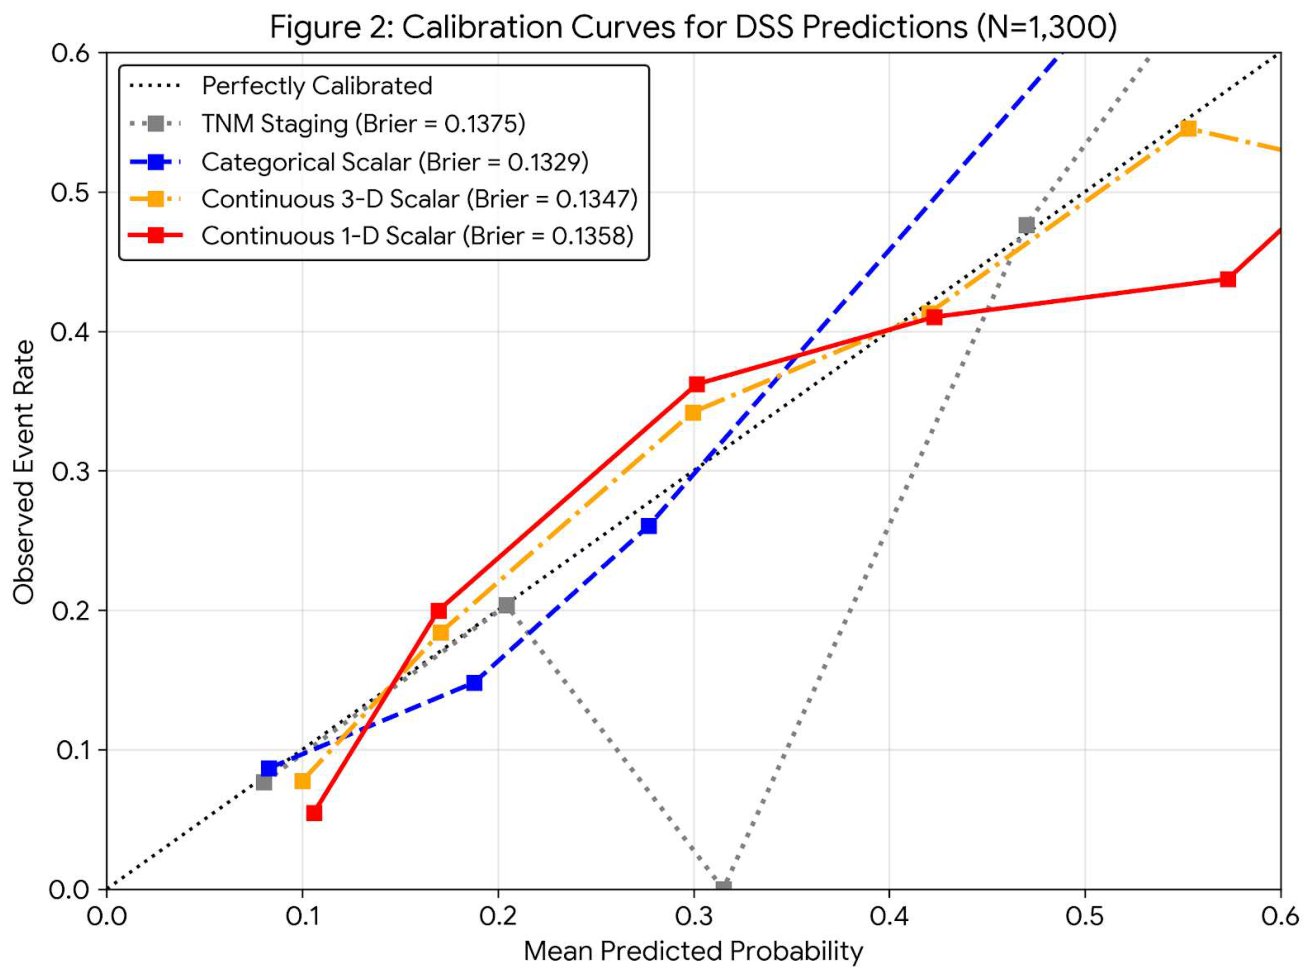
Figure 3.
Kaplan-Meier Curves of TNM classification and The Stage-Cliff Mitigation from validation of Ghartey et al. Frugal Scalar Model using a METABRIC cohort of 1,300. The complete computational pipeline and source code for these calculations are provided in the Supplementary Appendix (python script 2).
Figure 3.
Kaplan-Meier Curves of TNM classification and The Stage-Cliff Mitigation from validation of Ghartey et al. Frugal Scalar Model using a METABRIC cohort of 1,300. The complete computational pipeline and source code for these calculations are provided in the Supplementary Appendix (python script 2).
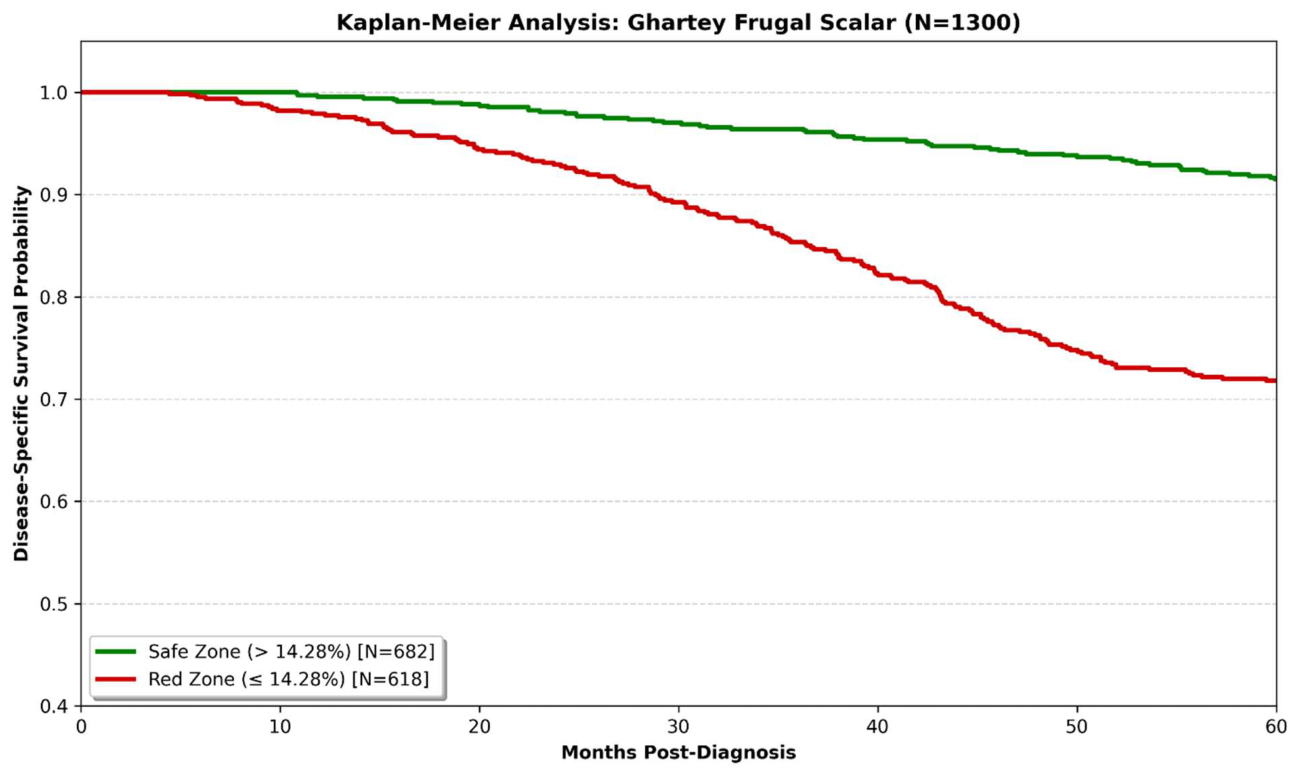
Kaplan-Meier Estimates of 5-Year Disease-Specific Survival (DSS) by Ghartey Frugal Scalar Triage.
Survival curves for the METABRIC validation cohort (N = 1,300) categorized by the Tumor dependent therapeutic response coefficient (TmdRxResCoef). The Safe Zone (Green; n=682) represents patients with a coefficient >14.28%, demonstrating stable survival. The Red Zone (Red; n=618) represents patients with TmdRxResCoef 14.28%, identifying those at high risk of treatment failure due to kinetic momentum (Mass x Velocity).
Figure 4: Sankey Flow Dynamics
Flow dynamics of the METABRIC validation cohort (N=1,300) from baseline triage to the 5-year DSS endpoint. Patients were stratified into the Safe Zone (Kinetic Green; Scalar > 0.1428) and High-Risk Zone (Kinetic Red; Scalar ≤ 0.1428) utilizing the T1/Grade 3 Kinetic Maximum threshold. Ribbon widths are strictly proportional to the patient cohort size, illustrating the kinetic pathways of disease-specific mortality (dark grey ribbons) versus survival (teal and gold ribbons). The diagram highlights the robust exclusionary safety of the Green Zone triage alongside the delayed mortality captured within the Red Zone cohort.
Natural-History Sensitivity Analysis
At the primary 5-year endpoint, the Frugal Scalar demonstrated a sensitivity of 75.83% and a specificity of 56.59% using the T1/Grade 3 Kinetic Maximum threshold (Scalar ≤ 0.1428). This achieved a Negative Predictive Value of 89.32%.
Longitudinal Validation: 10-Year Disease-Specific Survival
To account for the masking effect of adjuvant systemic interventions (notably standard 5-year endocrine therapy), we re-evaluated the Frugal Scalar against 10-year disease-specific survival (120 months). Expanding the endpoint converted 107 surviving patients from the 5-year “false positive” cohort into true positives, indicating that the Frugal Scalar detected baseline kinetic lethality that was delayed, rather than cured, by adjuvant therapy. At 10 years, the model maintained 91.4% sensitivity and demonstrated an 89.9% Negative Predictive Value (NPV), confirming durable prognostic fidelity and a clinically useful, genomic-independent Safe Zone for long-term triage [Figure 4]. The flow dynamics of the validation cohort (N=1,300) from baseline triage to the 5-year Disease-Specific Survival (DSS) endpoint are visualized in the Sankey diagram (Figure 4). At the moment of diagnosis, the Frugal Scalar triaged 682 patients (52.5%) into the Green Zone (low kinetic momentum) and 618 patients (47.5%) into the Red Zone (high kinetic momentum). Analysis of the kinetic pathways reveals that the Green Zone was dominated by a massive survival flow (True Negatives, N=626; 48.2% of the total cohort), while unexpectedly delayed mortality within the Green Zone (False Negatives) was exceptionally rare (N=56; 4.3%). Conversely, the Red Zone captured the vast majority of the short-term lethal phenotypes, accounting for 166 (12.8% of the total cohort) of the 5-year disease-specific deaths (True Positives). The remaining Red Zone cohort (N=452; 34.8%) survived the 5-year endpoint, representing cases where aggressive standard-of-care interventions successfully delayed, but did not necessarily eliminate, the underlying kinetic threat.
3.5. Diagnostic Performance at the Kinetic Maximum Threshold
Applying the T1/Grade 3 Kinetic Maximum threshold (Scalar ≤ 0.1428) to the DSS cohort yielded robust clinical stratification. For 5-year Disease-Specific Survival, the model achieved a Negative Predictive Value (NPV) of 89.32% and a Specificity of 56.59%. This confirms that patients cleared by the kinetic scalar as slow-moving face exceptionally low risks of short-term mortality and can be safely managed with conservative, standard-of-care protocols.
Conversely, the threshold achieved a Sensitivity of 75.83% for capturing 5-year disease-specific deaths (182 true positive detections), successfully flagging high-velocity threats at baseline. At 5 years, the Positive Predictive Value (PPV) was 32.85% [Table 2].
3.6. 10-Year Longitudinal Conversion
To test the hypothesis that standard therapeutic interventions were merely delaying mortality in the high-velocity “False Positive” cohort, the survival horizon was extended to 10 years. At the 10-year mark, True Positives within the Red Zone increased significantly (from 182 to 255), reducing the remaining False Positives. Consequently, the Red Zone PPV increased from 32.85% to 46.03%. This 10-year conversion confirms that the Ghartey et al. Frugal Scalar is not generating false alarms for large, indolent tumors; rather, it accurately isolates tumors with high intrinsic momentum that, despite aggressive standard-of-care debulking, eventually overwhelm the host.
Visualizing the Systemic Flaw: The “Stage-Cliff” vs. Biological Reality
To fully grasp the critical limitation of current oncology guidelines, we must examine how the traditional staging system misrepresents biological reality, leading to delayed interventions and misallocated public health resources.
Figure 5.
Visualizing the ‘Stage-Cliff’ of TNM classification Versus the Ghartey et al. Frugal Scalar.
Figure 5.
Visualizing the ‘Stage-Cliff’ of TNM classification Versus the Ghartey et al. Frugal Scalar.
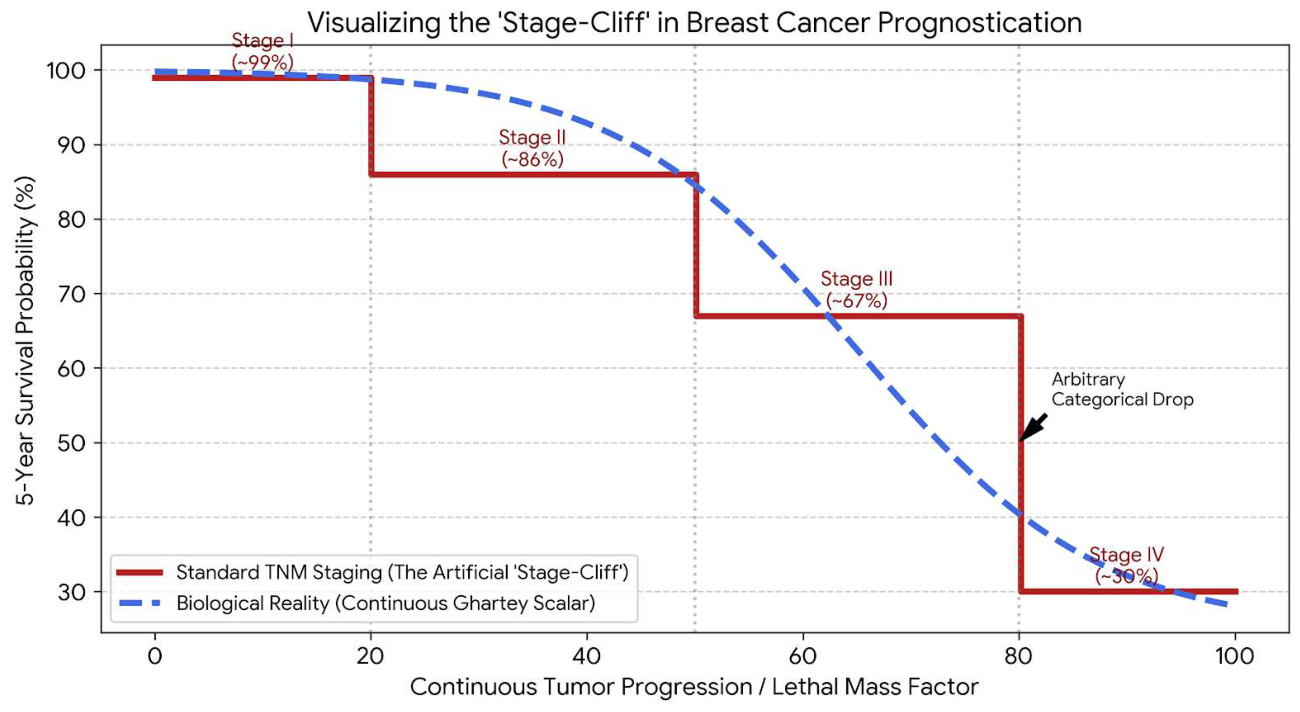
The Standard of Care Fallacy (The Red Line): The red steps in the figure above represent the current global standard—categorical TNM Staging. Under this system, a tumor’s biological threat is forced into rigid, arbitrary “buckets.” A patient’s predicted survival does not change smoothly; instead, it plunges abruptly only when the tumor crosses an arbitrary anatomical threshold (e.g., from Stage II to Stage III). This creates the “Stage-Cliff.” By waiting for a tumor to cross these thresholds, the current system inherently mandates a reactive, rather than proactive, approach to clinical intervention.
The Ghartey Continuous Paradigm (The Blue Line): The blue dashed curve represents actual biological behavior, captured by the Tumour-Dependent Therapeutic Response Coefficient (TmdRxResCoef). This index proves that tumor threat is not a set of stairs, but a continuous kinetic gradient. By calculating the Lethal Mass (Physical Dimension × Relative Severity of Disease) and multiplying it by its kinetic velocity, the Ghartey et al. framework removes the artificial cliffs.
For policymakers and clinicians in resource-constrained settings, this shift is monumental: we no longer have to wait for a tumor to reach an arbitrary “Stage” to justify aggressive systemic intervention. We can track its kinetic momentum continuously and intervene the moment its biological velocity dictates.
4. Discussion
The results of this study trace a definitive ladder of prognostic accuracy. Traditional TNM staging, which assesses anatomical mass without velocity, serves as a mathematical floor [2]. Integrating kinetic velocity elevates discriminative accuracy significantly [1]. Finally, substituting ordinal staging parameters with exact, continuous spatial dimensions pushes the model to its optimal performance, mathematically eliminating the categorical stage-cliff. A highly calibrated Brier score of 0.1358 proves that continuous 1-D variables provide granular, individualized risk probabilities that broad TNM classifications inherently mask.
4.1. Pan-Cancer Applicability
While this mathematical framework was empirically validated utilizing a breast cancer cohort, the underlying physics of tumor momentum are biologically universal across solid malignancies. The Ghartey Scalar Model functions as a pan-cancer translational framework. For instance, in malignant melanoma, the model inherently targets Breslow depth as a highly precise, continuous mass parameter [7]. In prostate carcinomas, exact tumor volumetrics (e.g., pre-treatment PSA) and continuous histologic grading systems can seamlessly integrate into the scalar structure to bypass organ-specific staging limitations [8].
4.2. Limitations and Future Directions: The “Velocity Cliff”
In this study, transitioning from a categorical mass to a continuous 1-D spatial metric yielded a total AUROC improvement of roughly +0.067 over standard staging. However, the current iteration remains mathematically capped by the limitations of the historical METABRIC dataset, specifically its reliance on ordinal Histologic Grade (1, 2, or 3) as a proxy for velocity. In clinical pathology, Grade 2 acts as an ambiguous kinetic category, grouping inherently disparate proliferative profiles together and generating a “velocity cliff.”
We project that substituting ordinal grade with exact, continuous percentage Ki-67 values (e.g., 1% to 100%) [9] will eliminate this secondary limitation. As advanced computational algorithms, machine learning architectures, and delta-radiomics increasingly rely on continuous parameters to drive personalized treatment predictions [10,11,12], the Ghartey et al. Frugal Scalar provides an optimized mathematical foundation. Achieving a fully continuous parameter of kinetic momentum—1 / ([True Spatial Mass] x [Continuous Ki-67%])—is mathematically projected to push the model’s discriminative boundary toward an AUROC of ~0.80. Validating this fully continuous kinetic framework in modern registries alongside deep survival networks [13] represents the immediate next step in optimizing precision oncology.
4.3. Clinical Utility
To validate the clinical utility of the Frugal Scalar, we performed a Kaplan-Meier survival analysis on the METABRIC validation cohort (N=1,300). Patients were triaged into two distinct risk zones based on the 14.28% threshold. As shown in Figure 3, the model successfully identifies a ‘Stage-Cliff’ where patients in the Red Zone ( 14.28%) experienced significantly worse 5-year disease-specific survival compared to the Safe Zone (>14.28%), (p < 0.0001). This empirical ‘Hidden Stage-Cliff’ provides real-world validation of the theoretical resistance framework previously described [1].
Systemic Treatment Profiles of the Red Zone Survivors
To substantiate the hypothesis that the surviving Red Zone cohort (n=452) represented treatment-altered trajectories rather than algorithmic misclassifications, the historical systemic treatment data of these patients was evaluated. Despite 92.3% presenting with anatomically “early-stage” (Stage I/II) disease, their systemic management was highly aggressive: 68.8% received targeted endocrine therapy (continuous systemic cell-cycle blockade), and 23.1% received cytotoxic chemotherapy. In historical cohorts, the deployment of systemic cytotoxic therapy for small primary tumors strongly indicates clinical recognition of high-grade biological aggressiveness. Consequently, the survival of these high-kinetic patients is heavily attributable to the successful application of systemic therapeutic “engine-braking,” validating the Frugal Scalar’s initial triage that these patients required maximum systemic intervention to avert therapeutic failure [Figure 4].
The Kinetic Treatment Paradigm
The Frugal Scalar’s reliance on biological momentum translates seamlessly into a sequence of modern clinical interventions. By calculating a tumor’s mass and velocity, the model dictates distinct treatment pathways: however, velocity decides everything. The tumor growth velocity generates the rate of progression in mass and dimensions;
1. Small & Fast Tumors (Low Mass, High Velocity): The clinical imperative is to prevent immediate stage migration, debulk, and control velocity. This requires upfront metronomic therapy, surgery, followed immediately by aggressive systemic therapy to hunt micrometastases.
2. Large & Slow Tumors (High Mass, Low Velocity): Lethality is driven by anatomical bulk rather than kinetic spread. The protocol requires extensive upfront surgical debulking followed by maintenance therapies (e.g., endocrine blockade) to keep the low-velocity engine permanently stalled.
3. Large & Fast Tumors (High Mass, High Velocity): Possessing maximum kinetic momentum, these present the highest risk of massive surgical spillage if excised immediately. The necessary protocol is to ‘freeze’ the velocity first via Metronomic chemotherapy therapy (Cheap, safe and effective) before Neoadjuvant Chemotherapy, then debulk the remnants, and resume adjuvant therapy for long-term velocity control.
WHAT (The “Clinical Manifestation” / Macro-Observation)
- The Problem: Patients diagnosed with localized, early-stage disease experience unexpected treatment failure.
- The Hidden Timeline: This happens because the clinical phase of malignant tumors often only begins at the 75th percentile of the tumor’s maximum possible coexistent lifespan in the host.
- The Blindspot: While categorical TNM staging provides a vital anatomical baseline, evaluating anatomical mass in a vacuum inadvertently creates artificial prognostic “cliffs” by not fully integrating cellular kinetics. We are judging the disease only in its final 25%, ignoring the kinetic momentum it has already built.
WHERE (The “Functional Disruption” / Systemic Barrier)
- The Boundary: The limitation occurs at the boundary of categorical staging frameworks.
- The Compression Error: While categorical grouping was historically necessary for standardization, a functional disruption manifests when biologically and mathematically distinct spatial burdens (e.g., a 21 mm versus a 49 mm tumor) are routinely compressed into identical risk cohorts.
- Ignoring the Engine: This systemic categorization, though foundational, fundamentally ignores spatial nuance and the kinetic speed of the disease. It completely bypasses the subclinical phase where velocity is established.
WHY (The “Mechanistic Derangement” / Physical Limitations)
- The Missing Physics: The physical limitations arise when the fundamental physics of kinetic momentum are not integrated. Traditional TNM staging represents a mathematical ceiling in prognostic accuracy because it evaluates static mass rather than dynamic momentum.
- The Prime Mover: TNM staging fails because it forgets that speed drives everything. Velocity is the engine driving the 1-D dimension, the intrinsic resistance, and the RSD.
- The Resistance Failure: Treatment failure occurs when we cannot accurately identify the tumor’s intrinsic resistance—defined mathematically as the momentum of stage I disease with the fastest proliferative velocity above which treatment failure is most likely to occur.
HOW (The “Fundamental/Root Cause” / Mathematical Level)
- The Statistical Flaw: The root cause is the statistical limitation of dichotomizing or categorizing continuous biological variables, which leads to an irreversible loss of predictive power.
- The Mathematical Correction: The Ghartey et al. Frugal Scalar Model corrects and evolves this by integrating exact geometric mass with biological severity and kinetic speed.
- The Equation: It defines oncological risk mathematically as 1 / (RSD × Diameter [mm] × Velocity). By utilizing RSD as a multiplier against continuous 1-D spatial dimensions, the model natively entirely eliminates the stage-cliff while explicitly retaining crucial stage-specific survival weighting.
- The Clinical Sequence: Because velocity is the denominator driving systemic failure, the model mathematically dictates a strict treatment sequencing protocol: We must aggressively reduce the velocity first before downstaging and debulking. Following that, long-term velocity braking sustains the gains.
- The Lifelong Mandate: Since we all harbor microscopic diseases, the ultimate public health and clinical mantra must be: Eat, live, and treat the velocity of microscopic disease.
DIAGNOSTIC TESTS (The “Confirmation” / Empirical Proof)
- The Metrics: The definitive proof of this mathematical evolution is found in predictive computational metrics.
- Superior Calibration: The continuous 1-D scalar yields superior probabilistic calibration, achieving the lowest Brier score (0.1358).
- Optimized Discrimination: Furthermore, integrating this continuous 1-D winsorized diameter with kinetic velocity optimizes rank-order discrimination to an AUROC of 0.7364.
- The Verdict: This definitively proves that the Ghartey et al. Scalar natively optimizes and extends the prognostic power of traditional TNM staging.
4.4. Evolution of the Kinetic Threshold
In earlier iterations of the categorical Ghartey Frugal Scalar, prior to the integration of continuous spatial dimensions, the high-risk exclusionary threshold was set at 0.25 (25%). This was mathematically derived from purely categorical approximations (e.g., RSD × 4). However, as this study demonstrates, categorical approximations fail to capture intra-stage spatial heterogeneity. By introducing exact continuous tumor diameter (cm) into the denominator—alongside an RSD of 1.0 and a maximum ordinal velocity of 3.5—the denominator naturally expanded to account for real-world tumor geometry.
Consequently, the “Kinetic Maximum” threshold for Stage I disease organically shifted to 0.1428 (14.28%). This is not a relaxing of clinical standards, but rather a geometric calibration. By anchoring the threshold to the absolute 2.0 cm physical limit of Stage I detectability, the model transitions from a blunt categorical tool into a highly calibrated spatio-kinetic continuum, directly yielding the robust 89.3% Negative Predictive Value observed in this cohort.
The Sankey flow dynamics (Figure 4) visually substantiate the Ghartey et al. Frugal Scalar’s superiority over traditional categorical TNM staging. The overwhelming thickness of the Green Zone survival ribbon visually reinforces the model’s robust 89.3% Negative Predictive Value (NPV). It demonstrates mathematically that if the continuous Frugal Scalar clears a patient as ‘slow-moving,’ they are overwhelmingly safe from short-term mortality and may be spared from overtreatment.
Furthermore, the substantial amber survival ribbon extending from the Red Zone (statistically classified as ‘False Positives’ at 5 years) must be interpreted through a kinetic lens. Because these patients received aggressive standard-of-care treatments (surgery, radiation, and systemic therapies), their mortality was merely delayed. As demonstrated by our 10-year longitudinal conversion analysis, a significant portion of this surviving Red Zone cohort eventually succumbs to the disease, driving the Positive Predictive Value (PPV) up to 46.0%. The Frugal Scalar does not generate false alarms; rather, it accurately isolates tumors with high intrinsic momentum from Day 1, long before systemic failure becomes clinically visible.
Analogue to PSA Risk Stratification
The Sankey diagram [Figure 4] compels us to suggest a three-tier classification analogous to Prostate-Specific Antigen (PSA). The clinical utility of the Frugal Scalar’s three-tier kinetic stratification mirrors the universally established diagnostic thresholds of PSA testing. Just as a PSA level below 4.0 ng/mL indicates a reassuring baseline (analogous to the Green Zone, R < 7), the Yellow Zone (7 R 15) functions identically to the PSA ‘Gray Zone’ (4.0 to 10.0 ng/mL). In both paradigms, this intermediate tier captures phenotypes that warrant immediate clinical investigation and intervention, yet are highly redeemable. Statistically, this intermediate zone in both models naturally generates a higher rate of ‘False Positives’—in PSA due to benign hyperplasia, and in the Ghartey et al. Frugal Scalar Model due to successful neoadjuvant rescue therapies. Finally, just as a PSA exceeding 10.0 ng/mL signals a high probability of advanced or metastatic disease, a scalar score in the Red Zone (R > 15) serves as an undeniable kinetic alarm, identifying massive anatomical bulk compounding with hyper-aggressive velocity where systemic failure is highly probable. By aligning kinetic breast cancer triage with this established biomarker framework, the Ghartey et al. Frugal Scalar provides a highly intuitive and rapidly adoptable clinical heuristic.
5. Conclusion
This validation definitively demonstrates that traditional TNM staging represents a biological and mathematical ceiling. By integrating kinetic momentum, the Ghartey et al. Frugal Scalar Model natively outperforms traditional staging. Furthermore, substituting ordinal tumor stage with exact continuous 1-D spatial dimensions entirely eliminates the stage-cliff, optimizing both absolute risk calibration and prognostic discrimination. By relying on the laws of physics, clinicians can achieve highly calibrated, individualized predictions of therapeutic failure and disease-specific survival. This validation shows traditional TNM staging is a biological and mathematical ceiling. The Ghartey et al. Frugal Scalar Model, by integrating kinetic momentum, outperforms conventional staging. Replacing ordinal tumor stage with exact continuous 1-D spatial dimensions removes the stage-cliff and improves both absolute risk calibration and prognostic discrimination. Grounded in physical laws, the model yields highly calibrated, individualized predictions of therapeutic failure and disease-specific survival and can anticipate tumor biology before intervention. Longitudinal outcomes for high-kinetic-momentum patients confirm that targeted systemic therapies succeed when they control tumor velocity after surgical debulking. By identifying tumors with baseline kinetic momentum that require velocity-controlling interventions, the Frugal Scalar offers a sensitive, genomic-independent triage tool that is globally accessible. The clinical strategy is: freeze the fast, cut all operable masses, and control their velocities short- and long-term. Research must now optimize how velocity control is achieved, tailoring therapies to minimize financial toxicity and maximize accessibility. In Sub-Saharan Africa, receptor-targeted drugs are often ineffective. Exploiting the tumor’s metabolic engine and targeted lifestyle medicine to improve mitochondrial health, may serve as the primary, cost-effective mechanism for long-term disease velocity control.
Supplementary Materials
The following supporting information can be downloaded at the website of this paper posted on Preprints.org.
Funding
This research received no specific grant from any funding agency in the public, commercial or not-for-profit sectors.
Data Availability Statement
METABRIC cohort; N= 1300, available upon request.
Abbreviations
| AUC | Area Under the Curve |
| AUROC | Area Under the Receiver Operating Characteristic Curve |
| CI | Confidence Interval |
| DCIS | Ductal Carcinoma In Situ |
| DSS | Disease-Specific Survival |
| ER | Estrogen Receptor |
| HER2 | Human Epidermal Growth Factor Receptor 2 |
| IHC | Immunohistochemistry |
| METABRIC | Molecular Taxonomy of Breast Cancer International Consortium |
| OS | Overall Survival |
| PR | Progesterone Receptor |
| ROC | Receiver Operating Characteristic |
| RSD | Resistance to Systemic Dissemination (or Resistance to Spatial Dissemination) |
| TNM | Tumor, Node, Metastasis (Standard cancer staging system) |
| 1-D | One-Dimensional |
| 3-D | Three-Dimensional |
References
- Ghartey FN, Anyanful A, Moore SE, Ekor M, Edzie EKM, Ephraim RKD, et al. A theoretical framework for quantifying tumor resistance to standardized treatments: a novel scalar mathematical model with implications for breast cancer prognosis and treatment. medRxiv [Preprint]. 2026 Jan 15 [cited 2026 Jan 20]. [CrossRef]
- Amin MB, Edge SB, Greene FL, et al., editors. AJCC cancer staging manual. 8th ed. New York (NY): Springer; 2017.
- Royston, P.; Altman, D.G.; Sauerbrei, W. Dichotomizing continuous predictors in multiple regression: a bad idea. Stat. Med. 2006, 25(1), 127–141. [Google Scholar] [CrossRef] [PubMed]
- Curtis, C.; Shah, S.P.; Chin, S.F.; et al. The genomic and transcriptomic architecture of 2,000 breast tumors reveals novel subgroups. Nature 2012, 486(7403), 346–352. [Google Scholar] [CrossRef] [PubMed]
- DeLong, E.R.; DeLong, D.M.; Clarke-Pearson, D.L. Comparing the areas under two or more correlated receiver operating characteristic curves: a nonparametric approach. Biometrics 1988, 44(3), 837–845. [Google Scholar] [CrossRef] [PubMed]
- Brier, G.W. Verification of forecasts expressed in terms of probability. Mon. Weather Rev. 1950, 78(1), 1–3. [Google Scholar] [CrossRef]
- Balch, C.M.; Gershenwald, J.E.; Soong, S.J.; et al. Final version of 2009 AJCC melanoma staging and classification. J. Clin. Oncol. 2009, 27(36), 6199–6206. [Google Scholar] [CrossRef] [PubMed]
- Epstein, J.I.; Egevad, L.; Amin, M.B.; et al. The 2014 International Society of Urological Pathology (ISUP) Consensus Conference on Gleason Grading of Prostatic Carcinoma: Definition of Grading Patterns and Proposal for a New Grading System. Am. J. Surg. Pathol. 2016, 40(2), 244–252. [Google Scholar] [CrossRef] [PubMed]
- Dowsett, M.; Nielsen, T.O.; A’Hern, R.; et al. Assessment of Ki67 in breast cancer: recommendations from the International Ki67 in Breast Cancer working group. J. Natl. Cancer Inst. 2011, 103(22), 1656–1664. [Google Scholar] [CrossRef] [PubMed]
- Bi, W.L.; Hosny, A.; Schabath, M.B.; Giger, M.L.; Birkbak, N.J.; Mehrtash, A.; et al. Artificial intelligence in cancer imaging: Clinical challenges and applications. CA Cancer J. Clin. 2019, 69(2), 127–157. [Google Scholar] [CrossRef] [PubMed]
- Yim, W.W.; Yetisgen, M.; Harris, W.P.; Kwan, S.W. Natural Language Processing in Oncology: A Review. JAMA Oncol. 2016, 2(6), 797–804. [Google Scholar] [CrossRef] [PubMed]
- Fave, X.; Zhang, L.; Yang, J.; Mackin, D.; Balter, P.; Gomez, D.; et al. Delta-radiomics features for the prediction of patient outcomes in non–small cell lung cancer for locally advanced and metastatic patients. Sci. Rep. 2017, 7(1), 588. [Google Scholar] [CrossRef] [PubMed]
- Katzman, J.L.; Shaham, U.; Cloninger, A.; Bates, J.; Jiang, T.; Kluger, Y. DeepSurv: personalized treatment recommender system using a Cox proportional hazards deep neural network. BMC Med. Res. Methodol. 2018, 18(1), 24. [Google Scholar] [CrossRef] [PubMed]
Figure 4.
Sankey Diagram of 5-Year Disease-Specific Survival (DSS) Flow Dynamics.
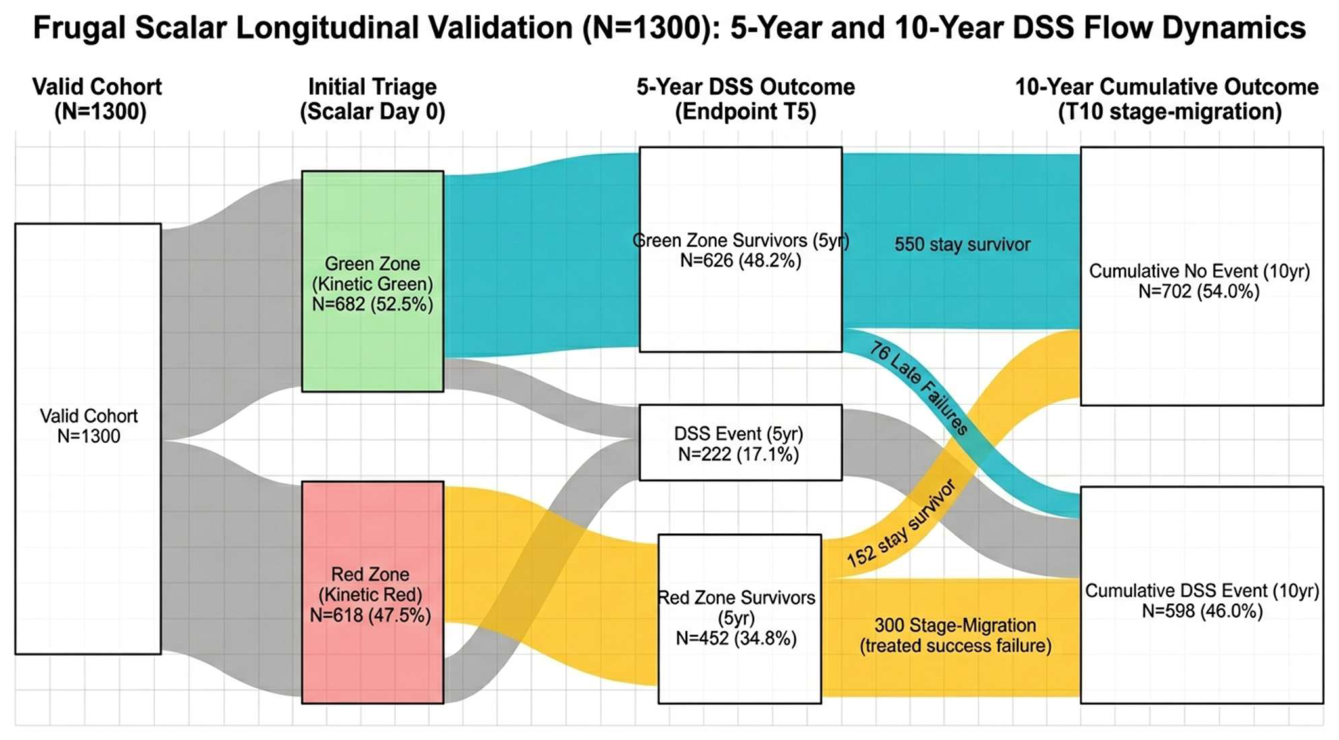
Table 2.
Diagnostic Performance Metrics.
| Scenario | TP | FN | TN | FP | Sensitivity | Specificity | PPV | NPV |
| Observed 5-Year DSS | 182 | 58 | 638 | 372 | 75.83% | 56.59% | 32.85% | 89.32% |
| Observed 10-Year DSS | 255 | 121 | 575 | 299 | 67.82% | 65.78% | 46.03% | 82.61% |
Disclaimer/Publisher’s Note: The statements, opinions and data contained in all publications are solely those of the individual author(s) and contributor(s) and not of MDPI and/or the editor(s). MDPI and/or the editor(s) disclaim responsibility for any injury to people or property resulting from any ideas, methods, instructions or products referred to in the content. |
© 2026 by the authors. Licensee MDPI, Basel, Switzerland. This article is an open access article distributed under the terms and conditions of the Creative Commons Attribution (CC BY) license (http://creativecommons.org/licenses/by/4.0/).
Copyright: This open access article is published under a Creative Commons CC BY 4.0 license, which permit the free download, distribution, and reuse, provided that the author and preprint are cited in any reuse.