

Submitted:
10 May 2026
Posted:
11 May 2026
You are already at the latest version
Abstract
This study characterized standard biochars produced at 300, 400, and 500 °C alongside a locally made biochar (LBC, drum kiln method with newly devised method of Bababe) to assess fertilizer value and toxicity against IBI thresholds. Pyrolysis temperature strongly influenced properties: electrical conductivity and salt content increased with tempera-ture (BC300 and BC500 highest; LBC lowest). All standard biochars were highly alkaline (pH 10.26–10.57), while LBC was near-neutral (7.84). Maximum carbon content occurred at 300–400 °C (56.8–56.9 %). At 10 kg ha⁻¹, standard biochars supplied 308–331 kg ha⁻¹ K, with BC400 providing the highest Ca and Mg. LBC had the highest volatile micronu-trients (B, Cu, Fe, Mn), which decreased with rising temperature. It can be particularly well suited to fertilizer coating or blending systems, especially for salt-sensitive soils where application rates are kept low (< 10 t ha⁻¹), thereby limiting agronomic risks such as Mo contaminant loading. Nevertheless, molybdenum levels in all biochars were 5–8 times above IBI safe limits (5–75 mg kg⁻¹), posing toxicity risk at 10 t ha⁻¹ application. Cd was undetectable, reduced Pb by 90 % at 400–500 °C, and kept Ni and Pd within limits. SEM revealed BC400 had optimal honeycomb porosity and homogeneous mineral dis-tribution. BC400 is most suitable for agricultural fertilizer value, BC500 for carbon se-questration, BC300 for potassium supply, and LBC as a low-cost, low-salinity material. However, excessive molybdenum across all biochars relates feedstock composition as the paramount safety factor. The weakness and limitation of this studies lies in the resource constraints from use of one feedstock, absence of direct measurement of surface area and phosphorus, and absence of measurement of biochar stability.
Keywords:
biochar
; temperature international biochar initiative
; nutrients
; temperature
; fertilizer value
1. Introduction
According to the International Biochar Initiative (IBI), biochar (BC) is a solid substance that is formed as a result of thermochemical transformation of biomass under oxygen-limiting conditions[1,2]. This is a sustainable soil amendment that has received growing interest because of its ability to alter the soil structure, increase nutrient retention, water-retention, and microbial activity, which play a vital role in soil health and crop productivity [3,4,5]. Owing to its elevated carbon content, biochar also leads to long term carbon sequestration in soils, thus leading to mitigation of climate change.
Feedstock type and production conditions, especially pyrolysis temperature, have a very high influence on the physicochemical property of biochar. Some of the important parameters are pH, electrical conductivity (EC) which differ considerably in terms of ash content as well as soluble salts. Further, biochar has key macro- and micronutrients, such as nitrogen, phosphorus, potassium, calcium, magnesium, and the trace elements, which affect its agronomic potential[6,7,8]. Nevertheless, the properties are heterogeneous, and each of them requires a deep characterization to make sure that the quality and performance remain consistent [9,10,11,12].
Although biochar is beneficial, it can be a hazard to the environment without proper evaluation. As an example, trace amounts of heavy metals may be found in it depending on the feedstock and the pyrolysis conditions. Although biochar could be used to stabilize heavy metal levels in polluted soils, the elements themselves need to be monitored in biochar to avoid unintentional contamination[2,13,14]. The IBI has developed to ensure the safe use of biochar in agriculture through the establishment of standardized guidelines and maximum allowable amounts of heavy metals[2,14,15].
Structural characterization also helps to improve the knowledge on biochar functionality. The use of Scanning Electron Microscopy (SEM) to examine its porous nature and high surface area are some of its major characteristics that aid in adsorption processes, nutrient retention, and overall performance of soil amendment [15,16,17]. These features offer biochar a viable alternative to traditional organic amendments like animal manure, and other advantages are lower greenhouse gas emissions and enhanced carbon storage[18].
The increased supply of agricultural residues is an opportunity of producing sustainable biochar. There is a great potential of using crop residues as rice straw, wheat straw, maize cobs and husks which have been underutilized or disposed of in open burning resulting in loss of nutrients and environmental pollution[19,20]. Recycling the nutrients in the form of biochar is one of the effective ways of recycling these residues to the soil to reduce the environmental impacts. Simple and portable biochar production systems are especially significant in countries such as Nigeria where agriculture is mostly practiced in rural settings. An example of such innovation is a local kiln developed by Bababe at the University of Maiduguri [21]; nevertheless, the characteristics of biochar produced with the help of this system are not thoroughly studied.
Rice residues such as rice straw and rice husk are particularly high and have a lot of potential in biochar production. Past research has obtained that biochar produced with the help of cereal waste can significantly enhance the fertility of the soil and the yield of crops. As an example, biochar of wheat straw has been shown to boost the productivity of rice grains by up to 49 percent[22] which indicates the agronomic advantages of these materials. Though there are few data on Borno State, Nigeria produces significant amounts of rice residues, which are typically improperly managed and present environmental risks[23]. The use of these residues to produce biochar might thus help to create sustainable agricultural development[24].
Nevertheless, no research has been conducted to compare the physicochemical characteristic, nutrient profile, and possible hazardousness of biochar generated through the Bababe kiln. Specifically, there has been no thorough evaluation on its macronutrient and micronutrient composition, nitrogen forms or trace metals against the biochar produced conventionally.
This study intends to fill this gap by systematically describing rice straw biochar prepared using the local Bababe kiln and comparing it to standard biochar prepared at pyrolysis temperatures of 300, 400 and 500oC. Among the key parameters measured were pH, electrical conductivity, carbon (C), nitrogen (N), sulfur (S), nitrogen species (ammonia-N, nitrate-N, nitrite-N), macronutrients (Ca, Mg, K, Na), micronutrients (B, Cu, Fe, Mn, Mo, Zn), and trace metals (Cd, Pb, Ni, Pd), and microstructural analysis by SEM. The objectives were goals to: (1) examine the effect of temperature on the biochar characteristics in comparison with the locally produced biochar; (2) evaluate the fertilizer value of the LBC and the standard biochar and determine the agronomic relevance; and (3) test the compliance with the IBI safety limits, especially with reference to trace metal levels, to identify the suitability of the biochar type in the agricultural application.
2. Materials and Methods
2.1. Site Characteristics
According to [25,26], Jere is located in the semi-arid Sahel Savanna zone, Jere is characterized by a hot climate, with average temperatures around 33°C, low average humidity of about 29%, and low and variable rainfall, with some sources reporting annual precipitation of 850 mm and others giving a range of 500 to 800 mm. From their reports, the natural vegetation consists mainly of savanna grasslands with scattered trees and shrubs. The local economy relies heavily on agriculture, with crops such as maize, rice, millet, and sorghum, along with livestock rearing, but the area faces challenges from land degradation and desertification [27].
2.1. Rice Straw Collection and Handling
Sufficient rice straw was collected at rice filed in Gongulong, Jere, Local Government of Borno State, Nigeria. The rice straw was air dried and chopped to smaller sizes for onward use.
2.2. Local and Standard BC Production
The local BC was produced using the Bababe kiln as described in [21] and the standard BC was produced using batch reactor as described by [28]. At the end of the pyrolysis, the solid char that remained in the kiln and reactor were collected, weighed and recorded. Part of the biochar was grinded and passed through 10 mm stainless steel used for further analysis and experiment. The yield of biochar was determined gravimetrically.
2.3. Laboratory Analysis
All analysis were carried out in three (3) replicates. The EC and pH were determined in a 1:20 (w/v) water extract after shaking according to [29]; the salt content was obtained by EC using a conversion factor and KCl standardization. Inorganic nitrogen (NO2-, NO3-, NH4+) was extracted using 2M KCl and read spectrophotometrically (according to [30] through Griess reaction (nitrite), cadmium reduction (nitrate), and indophenol blue (ammonium). The exchangeable cations (Ca, Mg, K, Na) were extracted by 1M HCl following the procedure described by [31] and were analyzed by flame photometry. Percentage C, N and S were determined through dry combustion (Elementar Vario Max Cube). Micronutrients and heavy metals were analyzed by HNO3/H2O2 digestion followed by MP-AES detection while surface imaging of biochar samples were done using scanning electron microscopy. The SEM (HITACHI S-4700 Field emission-SEM) was used to examine the morphology of the biochar samples. Before analysis, the samples were prepared in an ion-sputtering device. Backscattered electron (BSE) was used to obtain atomic number contrast, allowing to distinguish the carbonaceous matrix (darker regions) and mineral phases (brighter regions). The following magnifications were used to take the images:
LBC: 800× (scale bar 50.0 μm)
BC300: 400× (scale bar 100 μm)
BC400: 500× (scale bar 100 μm)
BC500: 1,500× (scale bar 30.0 μm)
2.4. Statistical Analysis
All statistical analyses were conducted in R (RStudio). Data were screened for missing values and organized by treatment prior to analysis. Descriptive statistics including mean, standard deviation (SD) and standard error (SE) were calculated. Assumptions of normality and homogeneity of variance were assessed before inferential analysis using the Shapiro–Wilk test and Levene’s test, respectively. Variables that violated normality (p < 0.05) were log-transformed using log10(x + 1), after which assumptions were re-evaluated. Treatment effects were tested using analysis of variance (ANOVA). Where significant differences were detected, means were separated using Tukey’s Honest Significant Difference (HSD) test at α = 0.05. Results were reported as mean ± SD with statistical significance indicated by letter groupings. The statistical analyses and data manipulation were conducted with R packages of dplyr[32,33] and car[34], and post-hoc comparisons were conducted with agricolae. The ggplot2[35,36] was used to create graphical visualizations and writexl was used to export the results.
3. Results
3.1. Biochar Physicochemical Properties
Pyrolysis temperature significantly (p≤0.05) affected all measured physicochemical properties (Table 1 and Figure 1:A-F). Biochar pH increased from about neutral in LBC (7.84) to strongly alkaline in all the other temperature treatments (10.26–10.57), with BC400 resulting in the highest (10.57) while BC300 and BC500 were statistically the same. Electrical conductivity (EC) and salt content (%) had similar patterns, with BC300 and BC500 having the highest values and being statistically equivalent groups, with BC400 having intermediate and LBC showing significantly the lowest results. Carbon percentage was highest in BC400 (56.94%), which was followed closely by BC300 (56.83%), with both significantly higher than LBC (49.35%) and BC500 (44.06%). Nitrogen (%) increased with an increase in pyrolysis temperature, which ranged from 0.66 to 1.30% in BC300 and BC500, with BC400 and LBC having statistically equal results and intermediate levels. An increase in pyrolysis temperature decreased biochar yield significantly (P < 0.05) from 34.3% (300°C) to 28.5% (500°C).
3.2. Nitrogen Forms
Ammonia-N concentration significantly (p < 0.05) resulted in a complex pattern that was temperature-dependent (Table 2 and Figure 2:A-C). BC500 resulted in the highest concentration of 38.53 mg kg−1, LBC resulted in an intermediate concentration of 20.42 mg kg−1 while BC300 and BC400 resulted in the lowest concentration, which ranged from 10.73 to 14.20 mg kg−1. Results obtained from nitrate-N concentration showed no significant differences (p>0.05) among treatments with mean values ranging from 4.72 to 6.49 mg kg−1. The nitrite-N results obtained were significantly higher in BC400 with a concentration of 0.098 mg kg−1, with all other treatments statistically equivalent and lower with concentrations ranging from 0.083–0.089 mg kg−1, though all concentrations remained in the trace range.
3.3. Macronutrients
Results obtained showed calcium concentration from the different biochar treatments was significantly (p < 0.05) higher in BC400 with a value of 15.140 mg kg−1, equivalent to about a 4.5-fold increase over LBC, with BC300 and BC500 at intermediate levels (Table 3 and Figure 3:A-E). Magnesium concentrations did not differ significantly among treatments despite an apparent increase with high variability in BC400 (2.287 mg kg−1).
Potassium concentration was significantly higher (p< 0.05) in BC300, BC400 and BC500 ranging from 30,775 to 33,079 mg kg−1 compared to LBC with a concentration of 22,268 mg kg−1. Sodium concentration was highest at BC400 with a concentration of 1303 mg kg−1, followed by BC300 (1152 mg kg−1), BC500 (1005 mg kg−1 and LBC (753 mg kg−1), with all treatments significantly different except BC300 which was intermediate. Results obtained for all the biochar showed no significant differences among treatments, with all biochars statistically the same with a concentration range of 0.043–0.06%.
3.4. Micronutrients
Pyrolysis temperature had a significant impact on the concentration of micronutrients, with most elements, including boron (B), copper (Cu), iron (Fe), manganese (Mn), molybdenum (Mo), and zinc (Zn). Detailed results for each micronutrient are presented in Table 4 and Figure 4. LBC resulted in the highest B concentration with a value of 24.75 mg kg−1 and significantly lower in BC500 with a value of 11.73 mg kg−1, and BC300 and BC400 at intermediate levels. It was observed that Cu concentration reduced from 17.13 mg kg−1 in LBC to 4.46 mg kg−1 in BC500, with BC400 resulting in the lowest concentration of 5.40 mg kg−1. Fe concentrations in the biochar results obtained were significantly higher (p < 0.05) in LBC, with a mean value of 504 mg kg−1 when compared to the remaining biochars, which were statistically the same and ranged from 304 to 383 mg kg−1. Mn also followed a similar pattern, with LBC having the highest concentration of 132 mg kg−1 and BC300, BC400 and 500 were statistically the same, with concentrations ranging from 85 to 100 mg kg−1. Molybdenum was significantly higher in LBC with a concentration of 633 mg kg−1 when compared to all other biochar samples which ranged from 395 to 433 mg kg−1 and statistically equivalent. Zinc concentration was highest in LBC and BC400 (76.5–79.6 mg kg−1) while results obtained showed BC300 was significantly the lowest (56.9 mg kg−1) and BC500 intermediate (62.5 mg kg−1).
3.5. Trace Elements
Pyrolysis temperature significantly affected the concentration of trace elements in the biochars. Results for cadmium (Cd), lead (Pb), nickel (Ni), and palladium (Pd) are shown in Table 5 and Figure 5. Results obtained showed that Cd was detected with LBC alone with a concentration of 1.00 mg kg−1 and was non-detectable in the remaining biochar samples (BC300, BC400, and BC500). Although statistical analysis showed no significant differences due to high variability in LBC. The mean concentration of Pb from the biochar samples decreased from 5.49 mg kg−1 (LBC) to 0.56 mg kg−1 (BC500), with BC400 and BC500 statistically the same and the lowest. There was no significant difference observed for Ni concentration among the biochar samples with all biochars statistically equal at a concentration of 3.41–6.05 mg kg−1. Pd results obtained showed similar findings to Ni with no significant differences in concentration, with all the biochar statistically equivalent at 8.40–14.57 mg kg−1, though BC500 exhibited remarkably low variability.
3.6. SEM Results
The SEM photographs are given in Figure 6 for all the bochar samples. The LBC micrograph indicates an irregular surface morphology of lignocellulosic biomass that is moderately pyrolyzed. Long, channel-shaped deposits, symbolizing the preserved vascular tissue of plants (xylem vessels and tracheids), are obvious. The pore structure is partially developed but shows indications of early thermal modification but less than at elevated temperatures in BC300. The long cellular structures of the original feedstock are retained in their original forms. This preservation shows that at 300 oC, hemicellulose and some celluloses have broken down, but lignin, the structural framework, is still rather intact.
The BC400 exhibited a well-defined honeycomb pore structure with continuous cellular channels and extensive secondary porosity. Compared with BC300, cell walls were thinner and pore density was higher. Mineral phases appeared more uniformly distributed within the carbon matrix. The BC500 showed the highest degree of structural modification, characterised by increased pore density and extensive perforation of cell walls. At 1500× magnification, cellular channels were disrupted and walls were markedly thinner than in BC400. Mineral phases appeared as larger, aggregated clusters.
4. Discussion
4.1. Biochar Physicochemical Properties
The continues decline in biochar yield with increasing temperature (34.3% to 28.5%) denotes greater devolatilization and carbonization at higher temperatures[37,38]. The dramatic pH increases to strongly alkaline in pyrolyzed biochars (10.26–10.57) is attributable to the concentration of alkali and alkaline earth metals and decomposition of acidic functional groups[39,40]. The peak pH recorded at 400°C and a decline at 500°C show that transformations in the biochar samples are dependent on temperature changes. This is possibly due to enhanced volatilization of certain alkali species at 400°C, which is followed by reduced release or stabilization at higher temperatures according to reports of [40,41]. At 400°C, the consistency of pH (SD = 0.01) represents a better improvement over LBC. This proves that controlled pyrolysis temperature enhances biochar product consistency. EC and salt content were higher with LBC and all pyrolyzed biochars. BC300 and BC500 exhibiting the highest values. Moderate values were observed with BC400. LBC was found to be significantly lower, denoting changes in transformation that depend on temperature in salt speciation. The incorporation of soluble ions into less soluble mineral phases (phosphates, carbonates) may be the cause of the decline at 400°C[42], whereas the formation of new soluble species or continuous concentration effects may be the cause of the subsequent increase at 500°C[37,42].
Percentage carbon was higher at 300–400°C (56.8–56.9%) then declined sharply at 500°C (44.1%), indicating carbon gasification losses at the highest temperature[43]. Considering its uncontrolled production temperature, LBC showed an intermediate carbon content of 49.35%. This value is in between the lower value that results from pyrolysis at 500°C and the high carbon concentrations attained under sustained optimum temperatures (300–400°C). Nitrogen (%) rose from 0.66% to 1.30% at 300 and 500°C under regulated conditions, indicating the concentration of nitrogen in thermally stable heterocyclic structures, even though labile nitrogen molecules volatilized at lower temperatures[44]. The local biochar produced in the drum kiln was adequate to concentrate nitrogen above the levels observed at 300°C, albeit not to the amount attained under sustained 500°C controlled pyrolysis, as demonstrated by LBC's nitrogen concentration of 0.92%, which was statistically equal to BC400. The final carbon and nitrogen contents were impressively consistent throughout the batch despite the local biochar kiln's uncontrolled temperature, as seen by the relatively low variation in both carbon and nitrogen content in LBC (SD = 0.01% for both).
4.2. Nitrogen Forms
Ammonia-N had a maximum concentration of 38.5 mg kg−1 at 500°C, which implies that it was more effectively retained or formed through adsorption onto developed pore surfaces or incorporation into heterocyclic structures[45]. LBC results showed an intermediate ammonia-N concentration of 20.42 mg kg−1. This is statistically equivalent to the standard BC produced at 500°C and the lower temperature biochars. This intermediate range of LBC indicates the dynamic temperature gradient in the drum kiln where some fraction of the feedstock were at a temperature high enough to hold ammonia and some at low temperatures where ammonia losses might dominate. The poor uniformity in LBC (SD = 0.96mg kg−1) relative to the high uniformity in BC500 (SD = 14.04 mg kg−1) and the exceptional uniformity in BC400 (SD = 0.54mg kg−1) emphasize the potential of uncontrolled production processes to produce intermediate, but relatively stable concentrations of ammonia, albeit with no possibility of maximising either of the ammonia content or uniformity.
The concentration of nitrate-N showed no temperature dependence. with the all the temperature treatments, including LBC, were statistically identical indicating that the condition of pyrolysis within this range did not have any proper effect on nitrate-N. The absence of temperature effect as well as low absolute concentrations (4.7-6.5 mg kg−1) implies that nitrate from the biochar produced is not likely to become agronomically relevant, regardless of the method of production. The concentration of nitrate in LBC (4.72 mg kg−1) was in the small range of all the treatments, which implies that the uncontrolled production of nitrates does not put a disadvantage or advantage to the nitrate content compared to the standard pyrolysis.
Nitrite-N, though statistically significant at 400oC, was at trace levels (less than 0.1mg kg−1) in all treatments including LBC, and showed neglible differences agronomically. LBC had the lowest concentration of nitrite (0.083 mg kg−1), but it was statistically identical to BC300 and BC500. The slight decrease in LBC could be due to the thermal history variability of production by drum kiln whereby sustained intermediate temperatures optimal to the production of nitrite may not have obtained in a consistent manner.
4.3. Macronutrients
Pyrolysis temperature was found to have a considerable element-specific effect on macronutrient concentration and variability on different biochar types. This is consistent with known thermochemical transformations during biomass carbonization. Ca concentration significantly rises from LBC (3400 ± 524 mg kg−1) to BC300 (12347 ± 525 mg kg−1) and was maximum at BC400 (15140 ± 2134 mg kg−1) and declined at BC500 (11260 ± 1200 mg kg−1). This trend could indicate the effects of concentration of the ash at intermediate temperatures followed by a gradual conversion to more crystalline and partly soluble mineral phases such as calcite and Ca-silicates at higher temperatures, making it less extractable but not necessarily total Ca content[46,47]. Magnesium (Mg) concentrations increased from LBC (740 ± 92 mg kg−1) to BC300 (1380 ± 72 mg kg−1) and BC500 (1907 ± 482 mg kg−1). The highest but most variable concentrations was observed at BC400 (2287 ± 1137 mg kg−1). But these differences were not statistically significant, probably because there was large within-treatment variability, especially in BC400, indicating heterogeneous formation of Mg-bearing mineral phases under different temperature[48]. All pyrolyzed biochar samples contained a large concentration of potassium (K), with BC300 (32805 ± 173 mg kg−1), BC400 (30775 ± 1131 mg kg−1), and BC500 (33079 ± 1060 mg kg−1) having statistically comparable concentrations that were much higher than LBC (22268 ± 2556 mg kg−1). This increase aligns with the stable behavior of K during pyrolysis and its accumulation in highly soluble and exchangeable forms (e.g., K+ salts and carbonates) when organic matter is volatilized[49]. The concentration of Na rose with an increase in LBC from 753 ± 69 mg kg−1 to 1152 ± 21 mg kg −1 at BC300 and the peak observed with BC400 (1303 ± 51 mg kg−1). It decreased at BC500 (1005 ± 28 mg kg−1) which indicates that it was partially volatilized or converted to less exchangeable mineral forms at higher temperatures. The consequences of Na addition will depend on the soil cation exchange capacity, the leaching processes, and the occurrence of divalent cations like that can counteract the Na-induced clay dispersion[50,51,52]. There was no significant difference in S concentrations across the treatments. This may imply that the S exists in thermo-stable forms in the organic or mineral-associated forms, which could be heterocyclic sulfur structures formed in the process of carbonization. Standard deviations were low in BC300 (e.g., K: ±173 mg kg−1; Mg: ±72 mg kg−1; Na: ±21 mgkg−1), which indicated high homogeneity of chemical composition. BC400 was, however, much more heterogeneous particularly with regard to divalent cations.
4.4. Micronutrients
Most of the micronutrients (boron, copper, iron and manganese) exhibited a decrease with rise in temperature. It contrasts with the patterns of macronutrient concentration, and this can be due to the volatilization of organically complexed forms or incorporation into recalcitrant mineral phases[53]. Copper had the highest reduction in concentration with temperature increase and BC400 showed the highest consistency (SD = 0.15 mgkg−1), which was 44 times lower than that of LBC (SD = 6.57mg kg−1). Among pyrolyzed biochars, BC400 had the best combination of moderate Fe concentration (349 mg kg−1) and high level of uniformity (SD = 21.04 mg kg−1), as iron declined steadily with increasing temperature.
Manganese concentration was maintained at 400°C in comparison to 300°C, and BC400 and showed superior homogeneity (SD = 3.28 mg kg−1). The multi-phase nature of the behavior of manganese, decreasing at 300°C, increasing at 400°C, and decreasing at 500°C, indicates that the oxidation states (Mn2+, Mn3+, Mn4+) are changing based on their volatility and solubility characteristics[54].
Zinc was maintained at 400°C in concentrations similar to those of LBC, which suggested formation of thermally stable zinc[55]; zinc oxides, zinc silicates and zinc phosphates at this intermediate temperature. The lowest variability was observed with BC400 (SD = 2.62 mg kg−1), and BC300 and BC500 had larger variability. Zinc retention at temperatures of 400°C, along with an outstanding level of consistency, ensures that BC400 is the most suitable option in the case of uniform zinc supplementation.
4.5. Trace Elements
Cadmium was completely not detected for BC300, C400 and BC500 and was from 1.00 mg kg−1 in LBC to non-detectable levels in all pyrolyzed biochars. This complete removal with no variability shows the effectiveness of thermal treatment of this volatile heavy metal with low melting point[56,57]. The high variability of LBC reflected by the statistical non-significance (p = 0.0533) and not the uncertainty of removal efficiency. Lead revealed gradual 90% reduction at 400-500oC with BC400 and BC500 attaining concentrations of less than 0.6 mg kg−1. The statistical similarity between BC400 and BC500 indicates that both temperature conditions are adequate to reduce lead. Nickel reductions were substantial but not significant. BC400 had remarkably low variability with SD = 0.10 mg kg−1 despite no significant mean changes being observed. The rise in concentration to 5.04 mg kg−1 at 500°C compared to lower temperatures with concentrations ranging from 3.41 to 3.53 mg kg−1 (however, not statistically significant), implies probable transformation into recalcitrant inorganic phases at higher temperatures. Palladium concentration showed no significant decreases. However, BC500 had demonstrated remarkable consistency with SD = 0.23 mg kg−1 equalling about a 23-fold improvement over LBC. Regardless of the non-significant ANOVA result, BC500 remains the best option for palladium reductions due to its exceptional consistency and low mean concentration.
5. Fertilizer Value
Fertilizer value of different biochars produced were evaluated by adopting an application rate of 10 t ha−1 which corresponds to a common biochar application range of 5-20 t ha−1 [58,59,60]
Elements reported in mg kg−1 will be calculated as:
supply (g ha−1) = concentration x 10.
For nutrient elements measured in percentages will be calculated as:
supply (kg ha−1) = concentration × 100.
This will allow for comparison of possible nutrient inputs from various types of biochar. Table 6 and Table 7 presents a detailed review of all nutrient supply data.
5.1. pH, Electrical Conductivity and Salt Content
The pyrolyzed biochar had strong alkaline conditions (10.26 -10.57) in contrast to almost neutral LBC (7.84), with the highest pH of BC400 (10.57). This rise is attributed to the concentration of alkali metals during pyrolysis which forms oxides and carbonates which are hydrolyzed in water[61,62]. BC400 has the highest liming potential of acidic soils and uniformity (SD = 0.01) is remarkable and make it possible that pH adjustment can be predictable. The electrical conductivity rose significantly between LBC (1,805 μS cm−1) and pyrolyzed biochars (3,335–3,705 μS cm−1), which is close to the 4 mS/cm and a critical value for non-salt tolerant crops. The same trend was observed with salt content. BC300 (2.08%) and BC500 (2.12%) were the highest, BC400 was intermediate (1.91%) and LBC the lowest (1.03%). Salt additions of up to 103 kg ha−1 (LBC) and 212 kgha−1 (BC500) can built up at 10 tha−1 biochar application. Therefore, LBC can be safest and then followed by BC400 considering salt sensitive crops.
5.2. Carbon Content
The maximum percentage of carbon was observed with biochar produced at 300-400 °C (56.8 to 56.9%) and reduced drastically at 500°C (44.1%), with LBC having intermediate results (49.35%). Carbon additions vary between 4.41 t C ha−1 (BC500) and 5.69 t C ha−1 (BC400) at 10 t ha−1. Therefore, BC400 has the highest carbon sequestration potential, and it is very uniform (SD=0.01) with carbon stability yet to be investigated.
5.3. Nitrogen Forms
Immediate availability of inorganic nitrogen (ammonia-N + nitrate-N + nitrite-N) at 10 t ha -1 was in this order; BC500 (445 g ha−1), LBC (252 g ha−1), BC300 (208 g ha−1) and BC400 (157 g ha−1). The dominating inorganic fraction was ammonia-N that has a 68-87 % contribution. Although BC500 offers the best immediate available nitrogen although it is still low compared to crop demands of about 100 to 200 kg Nha−1. Biochar nitrogen can be considered a slow-release source and BC300 may have significant mineralization in the longer term owing to its higher C (56.8%) as well.
5.4. Macronutrients
Potassium: Pyrolyzed biochars (BC300, 400 and 500) proof good as source of K (308–331 kg K ha−1 at 10 tha−1), much higher than LBC (223 kg ha−1) and adequate to most crops as K application of 150–200 kg K ha−1 was reported to have increased yield and K uptake in rice[63]. BC300 provides superior uniformity (SD=173.27) and easy prediction to K management.
Calcium: BC400 is the best source of Ca (151 kg ha−1), which supplies a 4.5 fold higher than LBC (34 kg ha−1), much higher than the crop requirements as 40-80kg Ca/ha reported to have 16% yield increase of potato in low Ca soil[64]. BC300 and BC500 supply 113–123 kg ha−1.
Magnesium: BC400 provides 22.9 kg Mg ha−1, which is above some crop requirements as 16 kg Mg ha−1 was reported to be optimal for maize (Ahmed et al., 2020)[65], but with great variability (SD=1137.4). BC300 has a higher uniformity (SD= 72.1) potentially supplying 13.8 kg Mg ha−1).
Sodium: Additions vary between 7.5 kg ha−1 (LBC) and 13.0kg ha−1 (BC400). Fr sodium-sensitive crops consideration, LBC has the less risk.
Sulfur: All biochars potentially can supply 4.3-6.0 kg S ha−1, which can augment crop needs of about 20-40 kg ha −1 [66]. BC500 provides superior predictability (SD=0.0).
5.5. Micronutrients
Boron: LBC can potentially supply 248 g B ha−1, BC300 (194 g ha−1), BC400 (171 g ha−1), and BC500 (117 g ha−1). BC500 potential supply can be marginal with the crops that are boron demanding.
Copper: Potential additions are between 45 g ha−1 (BC500) and 171 g ha−1 (LBC). LBC and BC300 have the potential to treat the deficiency of Cu, and the BC400 is exceptionally uniform (SD=0.1).
Iron: All the biochars potentially can supply 3.04 to 5.04 kg Fe ha−1, which is well beyond crop removal (for example 0.87 kg ha−1 uptake by urdbean after application of 5.0 ha−1 of Fe as reported by[67] although when alkaline the availability can be lower.
Manganese: Potential supplies are 0.85 kg ha−1 (BC300) up to 1.32 kg ha−1 (LBC), which are above the crop requirements (0.048–0.065 g/kg for sunflower as reported by [68,69]l. BC400 provides an outstanding uniformity (SD=3.3).
Zinc: LBC and BC400 can potentially supply 765–796 g Zn ha−1, which is about the optimum Zn required by some crops per year (e.g., 10 kg Zn ha−1 optimum for maize-wheat system as reported by[70]. BC400 is a combination of higher Zn content with outstanding uniformity (SD= 1.5) compared to LBC (SD= 2.8).
Molybdenum - Critical Concern: All biochars can potentially supply (3.95–6.33 kg Mo ha−1) at 10 tha−1 and against 50 g ha−1 required by some legumes and pastures (Morton, 2023). This is a great toxicity hazard, especially in livestocks that graze on forages planted on amended soils, where molybdenum causes secondary copper deficiency[71]. All biochars are 5-8 times higher than IBI safety thresholds (5-75 mg kg−1), which is a major limitation that must be overcome by feedstock selection or removal prior to agricultural application.
5.6. IBI Metal Thresholds and Trace Element Safety
The International Biochar Initiative (IBI) defines set limits of the concentration of heavy metals in biochar, to allow safe usage in agriculture. Grades (Premium, Standard) have different thresholds, where the lowest threshold is the strictest one[72]. All biochars, including LBC, contain cadmium, copper, lead, nickel and zinc at levels that are far below the IBI levels (Table 8).
Cadmium is entirely removed in terms of BC300, BC400 and BC500 (below detectable limits) and 1.00 mg kg−1 in LBC. This 100 percent elimination with zero variability shows the final attainment of the reduction of contaminants and guarantees the absence of cadmium levels as a limiting factor to biochar application in agriculture.
At 400-500°C, lead is gradually decreased by about 90%, and concentrations below 0.6 mg kg−1, which is well below the IBI limit of 121 mg kg−1. The statistical equivalence of BC400 and BC500 gives options to the producer who aims at minimizing lead.
Copper exhibits about 74% reduction at 500 C, BC400 and BC500 over LBC and have very good safety margin and which are still above deficiency levels. The high uniformity (SD = 0.15 mg kg−1 ) of BC400 guarantees a consistent content of copper.
Nickel and zinc are well under limits in all treatments with BC400 providing exceptional consistency in both elements. The non-significant differences of nickel signify that all biochar is equally safe in terms of this element.
5.7. Molybdenum as Metal of Concern
Molybdenum is present in all biochars, including the locally produced LBC, at 5-8 times higher than the IBI maximum allowable level (5-75 mg kg−1). LBC has 633 mg kg−1, which is over 8 times the upper limit. Further pyrolysis at 300 and 500°C have lower molybdenum level of 395-433 mg kg−1, which is 5-8 times higher than the limit.
This is a severe drawback, which would exclude IBI certification and may limit the agricultural application, especially livestock systems, where molybdenosis (molybdenum toxicity) poses an issue. Molybdenosis is caused by livestock feeding on forages with a high molybdenum content, and lead to secondary copper deficiency, which is manifested by diarrhea, anaemia, and retarded growth[62,73]. Molybdenum toxicity of ruminants is found at a level of about 5-10 mg kg−1 in forage[74,75]). and biochar at agronomically relevant levels could raise soil molybdenum to a point of causing toxicity in plants.
The problem lies with the feedstock and cannot be solved by pyrolysis at any temperature. Molybdenum has a large melting point (2610–2620 °C) [76,77] and boiling point and therefore its compounds are usually non-volatile at the temperatures of pyrolysis. This is one of the limitations as it is not possible to treat a feedstock containing a lot of molybdenum by pyrolysis. BC400 has the least molybdenum concentration (395 mg kg −1) and the highest uniformity (SD = 12 mg kg −1), still, it is 5.3-fold exceeding the IBI threshold.
5.8. Biochar Morphology
LBC had cell structure in a good condition and had elongated channels that resembles plant initial vascular tissue. The pore structure was made of macropores that showed signs of mesopore formation on the cell wall surfaces. The heterogeneity may show distributed mineral phases (Ca, K, Mg, Si compounds) were indicated by bright areas on BSE mode. This microstructure promotes moderate functionality but is the reason moderate to high elemental variability of LBC (e.g., Cu SD = 6.57).
BC300 exhibited semi-formed pore structure featuring intact cellular channels. The mineral phases were possibly present in small specks and clusters and were more plentiful than LBC but less concentrated than higher temperatures (BC400 and BC500). There was surface cracking but not extensive. This intermediate microstructure is the reason why BC300 has high elemental variability (Fe SD = 45.34, Cu SD = 2.51), and is more representative of intermediate nutrient availability, and its K uniformity (SD = 173) is indicative of uniform mineral distributions.
BC400 contained well-formed honeycomb-like porosity having thinner walls on its cells, strong development of secondary pores and interrelationship of channels. The mineral phases were evenly spread as small grains throughout the carbon skeleton, which constituted the physical basis of high levels of elemental uniformity (pH SD = 0.01, Mn SD = 3.28, Mo SD = 20.02, Zn SD = 2.62). Signs of perforation and thinning of cell walls augmented discrete surface area without structural damage. This optimum change accounts for peak Ca (15140 mg kg−1) and Mg (2287 mg kg−1) levels, maximum pH (10.57) and retained Zn levels.
The pore development in BC500 was seen to be the most widespread one and had much thinner and perforated cell walls and high levels of microporosity, possibly forming high surface area. Mineral phases were observed to be replaced by discrete, larger aggregates which were evidence of thermal melting or recrystallization, and this can explain the decreases of Ca (11260mg kg−1) and Mg (1907 mg kg−1). The contribution to low yield (28.2%), was possibly the degradation and fragmentation of the cell wall. Moderate to high elemental variability (Mo SD = 50.14, Fe SD = 36.45) can be due to heterogeneous modification of the surface, whereas exceptional uniformity of Ni (SD = 0.14) and Pd (SD = 0.23) may be due to homogeneous volatilization of these elements.
The highest ammonia-N (38.53 mg kg−1) of BC500 is justified by large volumes of microporosity with numerous adsorption sites and the high porosity of BC500 and the change in mineral phases are the reasons why it has high removal of Cd (100%), Pb (90%), and Cu (74%). Table 9 gives summary of features and their relationship to functions.
6. Conclusion and Recommendation
The nature of pyrolysis temperature essentially dictates the nature of physicochemical characteristics, elemental composition, and microstructure of biochar with far-reaching effects on agronomic value and environmental safety.
Pyrolyzed biochars were strongly alkaline (10.26-10.57) relative to near-neutral LBC (7.84); BC400 was found to have the greatest pH value (10.57) and displayed the greatest degree of uniformity, which is the most effective liming material. EC and salt content were significantly higher in pyrolyzed biochars compared to LBC (BC300 and BC500 contained the highest values, 3,705 mS cm-1 EC, 2.12 percent salt), and the salinity risk was greatest with LBC (salt load 1.03 percent). Carbon levels were highest at 300-400 degC (56.8-56.9%), then decreased at 500 degC (44.1%); LBC was intermediate in carbon (49.35%). Therefore, BC400 presents the maximum carbon sequestration capacity and the liming effect.
Pyrolyzed biochars had high concentrations of potassium, calcium, magnesium, and sodium compared to LBC. Biochar pyrolysates were all good sources of K (308-331 kg ha-1), far better than LBC (223 kg ha-1), and BC300 offered outstanding uniformity of K. Calcium reached the peaks of BC400 (151 kg ha-1 a 4.5-fold increase compared to LBC) and magnesium peaked at BC400 (22.9 kg ha-1). The highest sodium additions were in BC400 (13.0 kg ha-1), and the lowest ones in LBC (7.5 kg ha-1). Sulfur did not have a significant temperature effect with LBC and BC400 supplying 6.0 kg ha−1.
LBC had the highest levels of volatile micronutrients (B, Cu, Fe, Mn), indicating its less severe thermal history. Boron declined with temperature (LBC 248 g ha-1, BC500 117 g ha-1); copper declined in the same manner (LBC 171 g ha-1, BC500 45 g ha-1). LBC had the highest amount of iron (5.04 kg ha-1) but went down with temperature. LBC had also the highest level of manganese (1.32 kg ha-1). Zinc was maintained in BC400 (765 g ha-1) at the same levels as LBC (796 g ha-1), with great losses observed in BC300 and BC500.
At all temperature of pyrolysis (0.00 mg kg−1), cadmium was totally removed, but LBC was found to contain detectable Cd (1.00 mg kg−1). The 5.49 mg kg−1 Lead in LBC had been reduced to 0.56-0.58 mg kg-1 at 400-500degC. Nickel and palladium were numerically, but statistically nonsignificant decays, with BC400 showing outstanding uniformity in both.
All biochars meet IBI safety thresholds of Cd, Cu, Pb, Ni and Zn. Nevertheless, the issue of molybdenum is decisive: all biochars, LBC included contain Mo in the levels of 5-8 times more than the IBI limit (5-75 mg kg−1). Mo additions at 10 tha−1, i.e. 3.95 kg ha−1 (BC400) and 6.33 kg ha−1 (LBC), are actually lower than crop removal (10-30 g ha−1). This represents a critical toxicity threat, especially to livestock (molybdenosis), and has to be mitigated by avoiding feedstock or by moderation.
Fertilizer value: BC400 is the most balanced one, maintaining the levels of Ca, Mg, and Zn, with an unparalleled uniformity of products and maximum liming effect. BC500 maximizes the total N, the available N, the available K and the total contaminants removal, but this is at the cost of the loss of B, loss of Cu, loss of Fe, and loss of Mn and the maximum salinity. BC300 provides the best yield (34.3 %) and excellent uniformity of K, appropriate in large-scale fertilization of K. LBC has the greatest concentration of numerous volatile micronutrients and the least salinity, but is high in variability and can be detected Cd, thus it can be used in low-cost and salt-sensitive systems where accuracy is not demanded such as fertilizer coating.
SEM analysis showed that there were progressive changes in microstructure. LBC had a well-preserved cellular structure with homogenously distributed minerals, which is why it contained moderate nutrient content and was highly varied. BC300 exhibited partially formed pore and incomplete carbonization giving rise to high elements variability but remarkable uniformity of K. BC400 exhibited a well-developed, honeycomb like porosity and fine mineral masses were uniformly distributed and the structure was incredibly homogeneous-the physical characteristic of its excellent uniformity, high Ca and Mg and retained Zn. BC500 had the largest microporosity, aggregated mineral phases, and cell walls degradation, which justified the high ammonia-N-retention, contaminant-removal, and carbon-stability, yet caused the nutrient losses and heterogeneity.
Higher pyrolysis temperature has critical influence on biochar properties as a result of combination compositions and microstructural alterations. BC400 will be the best option when it comes to balanced agricultural uses, as it will eliminate the need to compromise on nutrient preservation, uniformity, and liming capacity. IB 500 is the most appropriate in carbon sequestration and remediation, BC300 in high-yielding K fertilization, and LBC in low-cost and salt-sensitive applications of micronutrients. Nevertheless, the widespread presence of molybdenum in all biochars is too overwhelming of all other factors and needs to be eliminated first to be able to use it in agriculture. The screening of feedstock of Mo is necessary because even the best pyrolysis cannot cure this natural pollutant. Future research ought to consider Mo mitigation, field testing of nutrient availability and combining with organic processes including composting to increase the agronomic properties of biochar further.
The present research shows that the composition, fertilizer value and structure of biochar have a high dependence on pyrolysis temperature, with clear trade-offs across treatments. BC400 offers the best balance of performance with high calcium and zinc content and excellent uniformity of the product. BC300 will be more preferable in potassium fertilization and high-yield production, but BC500 will make more sense in nitrogen retention and contaminant elimination (Cd, Pb, Cu) at the cost of the preservation of the micronutrients and yield. LBC has more volatile micronutrients (B, Cu, Fe, Mn) as well as less salinity, yet it has a high degree of variation and discernible cadmium.
Pyrolyzed biochar samples are also high-potassium (308–331 kg K ha−1) sources, which is adequate to supply crops, with calcium being highly enriched at 400 C (151 kg Ca ha−1), and having considerable liming potential. Micronutrients tend to be larger than the crop removal, but their supply can be pH-sensitive. Nevertheless, the major constraint is molybdenum contamination with input of 3.95–6.33 kg Mo ha−1 at 10 tha−1 are both much greater than that absorbed by crops and exceed safe levels (5-75mg kg -1). This shows how important feedstock selection is since pyrolysis cannot remove naturally found contaminants.
Microstructurally, rise in temperature promotes pore formation and mineral change. BC400 has the best porosity and uniformity of the mineral that favors low levels of variability and high rates of nutrient retention. BC500 forms large quantities of microporosity, thereby preferring adsorption and elimination of contaminants, but decreases nutrient content, whereas BC300 partially carbonizes with larger variation. LBC retains original structure yet it is not consistent.
Altogether, BC400 is the most suitable choice in terms of nutrient retention, uniformity, and functionality in the majority of agricultural applications, especially where there is a need to provide a uniform nutrient supply. BC500 is more appropriate to remediation and carbon sequestration and BC300 to high yield potassium applications where variability is not critical. LBC is a low-cost strategy, average nutrient delivery, and retained structure but low reliability since it is heterogeneous and contains contaminants. Nevertheless, it can be used suitably in fertilizer coating or blending processes in which much lower application rates (<10 tha−1) can mitigate the effects of contaminant loading and variability. Although all materials have agronomic potentials, the problem of molybdenum toxicity should be taken care of before the field. The research in the future must be directed at field validation, mitigation, and integration with other practices.
Author Contributions
Conceptualization, M.G., A.MZ. and A.T.; methodology, M.G., A.T., B.A.D. and A.S.; writing—original draft preparation, A.M.Z., C.M.O., M.G. and A.T.; writing—review and editing, C.M.O., M.G., A.M.Z., A.T., A.S. and B.A.D.; visualization, A.M.Z., and M.G.; supervision, M.G., A.S., A.T. and B.A.D.; funding acquisition, M.G. All authors have read and agreed to the published version of the manuscript.
Funding
We acknowledged the support by the Flagship Research Groups Program 2024 and the Research Excellence Program 2025 of the Hungarian University of Agriculture and Life Sciences.
Institutional Review Board Statement
Not applicable.
Informed Consent Statement
Not applicable.
Data Availability Statement
The data presented in this study is available on request from the corresponding author.
Acknowledgments
We thank the Hungarian University of Agriculture and Life Sciences and Tempus Public Foundation by the Hungarian Government for providing the facilities and services needed.
Conflicts of Interest
The authors declare no conflict of interest.
References
- Mulabagal, V.; Baah, D. A.; Egiebor, N. O.; Chen, W. Y. Biochar from Biomass: A Strategy for Carbon Dioxide Sequestration, Soil Amendment, Power Generation, and CO2 Utilization. Handb. Clim. Change Mitig. Adapt. Second Ed. 2016, 3, 1937–1974. [Google Scholar] [CrossRef]
- Mulabagal, V.; Viticoski, R. L.; Hayworth, J. S.; Baah, D. A.; Egiebor, N. O.; Sajjadi, B.; Chen, W. Y. Biochar from Biomass: A Comprehensive Approach to CO2 Sequestration and Utilization, Soil Amendment, Power Generation, PFAS Removal, Healthcare, and Sustainable Food Solutions. Handb. Clim. Change Mitig. Adapt. 2025, 1291–1362. [Google Scholar] [CrossRef]
- Kumar, A.; Kumari, P.; Solanki, M. K.; Prasad, M. N. V. An Overview of Biochar Production and Its Multifaceted Applications for Sustainable Agriculture and Environmental Benefits. Biochar Ecotechnology Sustain. Agric. Environ. 2025, 3–54. [Google Scholar] [CrossRef]
- Waheed, A.; Xu, H.; Qiao, X.; Aili, A.; Yiremaikebayi, Y.; Haitao, D.; Muhammad, M. Biochar in Sustainable Agriculture and Climate Mitigation: Mechanisms, Challenges, and Applications in the Circular Bioeconomy. Biomass Bioenergy 2025, 193. [Google Scholar] [CrossRef]
- Zhao, Y.; Wang, X.; Yao, G.; Lin, Z.; Xu, L.; Jiang, Y.; Jin, Z.; Shan, S.; Ping, L. Advances in the Effects of Biochar on Microbial Ecological Function in Soil and Crop Quality. Sustainability 2022, 14(16), 10411 10411. [Google Scholar] [CrossRef]
- Hu, Y.; He, Q. Application of Biochar as a Soil Amendment for Ameliorating Soil Properties. Feed. Tomorrow Ecol. Ecofriendly Food From Cradle To Cradle 2025, 49–71. [Google Scholar] [CrossRef]
- Dhir, B. Biochar Amendment Improves Crop Production in Problematic Soils. Handb. Assist. Amend.-Enhanc. Sustain. Remediat. Technol. 2021, 189–204. [Google Scholar] [CrossRef]
- Hossain, M. Z.; Bahar, M. M.; Sarkar, B.; Donne, S. W.; Ok, Y. S.; Palansooriya, K. N.; Kirkham, M. B.; Chowdhury, S.; Bolan, N. Biochar and Its Importance on Nutrient Dynamics in Soil and Plant. Biochar 2020, 2(4), 379–420. [Google Scholar] [CrossRef]
- Steiner, C. Considerations in Biochar Characterization. Agric. Environ. Appl. Biochar Adv. Barriers 2015, 87–100. [Google Scholar] [CrossRef]
- Igalavithana, A. D.; Mandal, S.; Niazi, N. K.; Vithanage, M.; Parikh, S. J.; Mukome, F. N. D.; Rizwan, M.; Oleszczuk, P.; Al-Wabel, M.; Bolan, N.; et al. Advances and Future Directions of Biochar Characterization Methods and Applications. Crit. Rev. Environ. Sci. Technol. 2017, 47(23), 2275–2330. [Google Scholar] [CrossRef]
- Sharma, R. K.; Singh, T. P.; Haydary, J.; Azad, D.; Verma, A. Modern Tools and Techniques of Biochar Characterization for Targeted Applications. Biochar Prod. Green. Econ. Agric. Environ. Perspect. 2024, 81–95. [Google Scholar] [CrossRef]
- Tripathy, P.; Prakash, O.; Sharma, A.; Shukla, V.; Dhodapkar, R. S.; Pal, S. Biochar Processing for Green and Sustainable Remediation: Wastewater Treatment, Bioenergy, and Future Perspective. Metagenomics to Bioremediation: Applications, Cutting Edge Tools, and Future Outlook 2023, 659–683. [Google Scholar] [CrossRef]
- Gwenzi, W. Potential Environmental and Human Health Risks of Biochar Systems: A Call for Comprehensive Health Risk Assessments. Biochar Environ. Remediat. Princ. Appl. Prospect. 2025, 433–445. [Google Scholar] [CrossRef]
- Denyes, M. J.; Parisien, M. A.; Rutter, A.; Zeeb, B. A. Physical, Chemical and Biological Characterization of Six Biochars Produced for the Remediation of Contaminated Sites. J. Vis. Exp. 2014, (No. 93), 52183. [Google Scholar] [CrossRef]
- Chafik, Y.; Hassan, S. H.; Lebrun, M.; Sena-Velez, M.; Cagnon, B.; Carpin, S.; Boukroute, A.; Bourgerie, S.; Morabito, D. Biochar Characteristics and Pb2+/Zn2+ Sorption Capacities: The Role of Feedstock Variation. Int. J. Environ. Sci. Technol. 2024, 21(16), 9829–9842. [Google Scholar] [CrossRef]
- Anjum, Z.; Min, Q.; Riaz, L.; Waqar-Un-Nisa; Qadeer, S.; Saleem, A. R. Employment of Cannabis Sativa Biochar to Improve Soil Nutrient Pool and Metal Immobilization. Front. Environ. Sci. 2022, 10, 1011820. [Google Scholar] [CrossRef]
- Kassa, Y.; Amare, A.; Nega, T.; Alem, T.; Gedefaw, M.; Chala, B.; Freyer, B.; Waldmann, B.; Fentie, T.; Mulu, T.; et al. Water Hyacinth Conversion to Biochar for Soil Nutrient Enhancement in Improving Agricultural Product. Sci. Rep. 2025, 1(2025, 15 (1)), 1820. [Google Scholar] [CrossRef] [PubMed]
- Karbout, N.; Bol, R.; Brahim, N.; Moussa, M.; Bousnina, H. Applying Biochar from Date Palm Waste Residues to Improve the Organic Matter, Nutrient Status and Water Retention in Sandy Oasis Soils. J. Res. Environ. Earth Sci. 2019, 203–209. [Google Scholar]
- Laird, D. A. The Charcoal Vision: A Win–Win–Win Scenario for Simultaneously Producing Bioenergy, Permanently Sequestering Carbon, While Improving Soil and Water Quality. Agron. J. 2008, 100(1), 178–181. [Google Scholar] [CrossRef]
- Jadhav, V. H.; Patil, C. R.; Kamble, S. P. Conversion of Agricultural Crop Waste into Valuable Chemicals. Adv. Mater. From Recycl. Waste 2023, 57–86. [Google Scholar] [CrossRef]
- Zubairu, A. M.; Michéli, E.; Ocansey, C. M.; Boros, N.; Rétháti, G.; Lehoczky, É.; Gulyás, M. Biochar Improves Soil Fertility and Crop Performance: A Case Study of Nigeria. Soil. Syst. 2023 2023, Vol. 7(Page 105 7 (4)), 105. [Google Scholar] [CrossRef]
- Korai, P. K.; Sial, T. A.; Pan, G.; Abdelrahman, H.; Sikdar, A.; Kumbhar, F.; Channa, S. A.; Ali, E. F.; Zhang, J.; Rinklebe, J.; et al. Wheat and Maize-Derived Water-Washed and Unwashed Biochar Improved the Nutrients Phytoavailability and the Grain and Straw Yield of Rice and Wheat: A Field Trial for Sustainable Management of Paddy Soils. J. Environ. Manag. 2021, 297, 113250. [Google Scholar] [CrossRef] [PubMed]
- Ejiofor, O. S.; Okoro, P. A.; Ogbuefi, U. C.; Nnabuike, C. V.; Okedu, K. E. Off-Grid Electricity Generation in Nigeria Based on Rice Husk Gasification Technology. Clean. Eng. Technol. 2020, 1, 100009. [Google Scholar] [CrossRef]
- Zubairu, A. M.; Marjanović, J.; Abdulkadir, M.; Eldawwy, N.; Takács, A.; Ocansey, C. M.; Gulyás, M. Conceptual Framework for Restoring Soil Fertility in Arid Borno State, Nigeria with Biochar from Agricultural Wastes. Discov. Sustain. 2025, 7(1), 7. [Google Scholar] [CrossRef]
- Ajaegbu, H. I.; St Matthew-Daniel, B. J.; Uya, O. Edet.; Mamman, A. B.; Oyebanji, J. Oluwole.; Petters, S. W. Nigeria : A People United, a Future Assured; 2000. [Google Scholar]
- Jere Local Government Area. Available online: https://www.manpower.com.ng/places/lga/191/jere#google_vignette (accessed on 13 Apr 2026).
- FAO earmarked over 400 hectares of land under the Climate Smart restoration of degraded land in Borno State. - Radio Nigeria North East Zone. Available online: https://radionigerianortheast.gov.ng/?p=3047 (accessed on 13 Apr 2026).
- Csutoras, B.; Miskolczi, N. Thermo-Catalytic Pyrolysis of Sewage Sludge and Techno-Economic Analysis: The Effect of Synthetic Zeolites and Natural Sourced Catalysts. Bioresour. Technol. 2024, 400, 130676. [Google Scholar] [CrossRef]
- Rajkovich, S.; Enders, A.; Hanley, K.; Hyland, C.; Zimmerman, A. R.; Lehmann, J. Corn Growth and Nitrogen Nutrition after Additions of Biochars with Varying Properties to a Temperate Soil. Biol. Fertil. Soils 2011, 48(3), 271–284. [Google Scholar] [CrossRef]
- Rayment, N.; Higginson, F. Australian Laboratory Handbook of Soil and Water Chemical Methods; 1992. [Google Scholar] [CrossRef]
- Camps-Arbestain, M.; Amonette, J. E.; Singh, B.; Wang, T.; Schmidt, H.-P. A Biochar Classification System and Associated Test Methods; Lehmann, J., Joseph, S., Eds.; Routledge: New York, NY, United States(US), 18 February 2015. [Google Scholar]
- Kopra, J.; Tikka, S.; Heinäniemi, M.; López-Pernas, S.; Saqr, M. An R Approach to Data Cleaning and Wrangling for Education Research. Learning Analytics Methods and Tutorials: A Practical Guide Using R 2024, 95–119. [Google Scholar] [CrossRef]
- Cadman, T.; Slofstra, M.; Avraam, D.; Hyde, E.; Kikkert, N.; van der Geest, M.; Postma, D.; Veenstra, R.; Wheater, S.; Zwart, E.; et al. ‘Dstidyverse’: An Implementation of TidyverseWithin the DataSHIELD Ecosystem. F1000Res. 2025, 14, 606. [Google Scholar] [CrossRef]
- Sunwoo, J.; Kim, H.; Choi, D.; Bae, K. S. Validation of “SasLM,” an R Package for Linear Models with Type III Sum of Squares. Transl. Clin. Pharmacol. 2020, 28(2), 83. [Google Scholar] [CrossRef]
- Xu, S.; Chen, M.; Feng, T.; Zhan, L.; Zhou, L.; Yu, G. Use Ggbreak to Effectively Utilize Plotting Space to Deal With Large Datasets and Outliers. Front. Genet. 2021, 12, 774846. [Google Scholar] [CrossRef]
- Zhu, Y. Leveraging Data Visualization with Ggplot2 in Translation Pedagogy: Enhancing Learning Through Visual Insights. Lect. Notes Comput. Sci. 2025, 15589 LNCS, 135–144. [Google Scholar] [CrossRef]
- Zhang, X.; Zhang, P.; Yuan, X.; Li, Y.; Han, L. Effect of Pyrolysis Temperature and Correlation Analysis on the Yield and Physicochemical Properties of Crop Residue Biochar. Bioresour. Technol. 2020, 296. [Google Scholar] [CrossRef] [PubMed]
- Krysanova, K. O.; Krylova, A. Y.; Pudova, Y. D.; Kulikova, M. V. Influence of the Method of Preparation of Biochar from Peat and Sawdust on Its Composition and Thermal Characteristics. Solid Fuel Chem. 2021, 55(5), 306–311. [Google Scholar] [CrossRef]
- Dai, Z.; Wang, Y.; Muhammad, N.; Yu, X.; Xiao, K.; Meng, J.; Liu, X.; Xu, J.; Brookes, P. C. The Effects and Mechanisms of Soil Acidity Changes, Following Incorporation of Biochars in Three Soils Differing in Initial PH. Soil Science Society of America Journal 2014, 78(5), 1606–1614. [Google Scholar] [CrossRef]
- Zhao, Y.; Feng, D.; Zhang, Y.; Huang, Y.; Sun, S. Effect of Pyrolysis Temperature on Char Structure and Chemical Speciation of Alkali and Alkaline Earth Metallic Species in Biochar. Fuel Process. Technol. 2016, 141, 54–60. [Google Scholar] [CrossRef]
- Andersson, V.; Kong, X.; Pettersson, J. B. C. Online Speciation of Alkali Compounds by Temperature-Modulated Surface Ionization: Method Development and Application to Thermal Conversion. Energy Fuels 2024, 38(3), 2046–2057. [Google Scholar] [CrossRef]
- Zolfi Bavariani, M.; Ronaghi, A.; Ghasemi, R. Influence of Pyrolysis Temperatures on FTIR Analysis, Nutrient Bioavailability, and Agricultural Use of Poultry Manure Biochars. Commun. Soil. Sci. Plant Anal. 2019, 50(4), 402–411. [Google Scholar] [CrossRef]
- Mafu, L. D.; Neomagus, H. W. J. P.; Everson, R. C.; Okolo, G. N.; Strydom, C. A.; Bunt, J. R. The Carbon Dioxide Gasification Characteristics of Biomass Char Samples and Their Effect on Coal Gasification Reactivity during Co-Gasification. Bioresour. Technol. 2018, 258, 70–78. [Google Scholar] [CrossRef]
- Pels, J. R.; Kapteijn, F.; Moulijn, J. A.; Zhu, Q.; Thomas, K. M. Evolution of Nitrogen Functionalities in Carbonaceous Materials during Pyrolysis. Carbon N. Y. 1995, 33(11), 1641–1653. [Google Scholar] [CrossRef]
- Wang, W.; Zhou, H.; Liu, Y.; Zhang, S.; Zhang, Y.; Wang, G.; Zhang, H.; Zhao, H. Formation of BNC Coordination to Stabilize the Exposed Active Nitrogen Atoms in G-C3N4 for Dramatically Enhanced Photocatalytic Ammonia Synthesis Performance. Small 2020, 16(13), 1906880. [Google Scholar] [CrossRef]
- Reinmöller, M.; Schreiner, M.; Laabs, M.; Scharm, C.; Yao, Z.; Guhl, S.; Neuroth, M.; Meyer, B.; Gräbner, M. Formation and Transformation of Mineral Phases in Biomass Ashes and Evaluation of the Feedstocks for Application in High-Temperature Processes. Renew. Energy 2023, 210, 627–639. [Google Scholar] [CrossRef]
- Jia, R.; Liu, J.; Han, Q.; Zhao, S.; Shang, N.; Tang, P.; Zhang, Y. Mineral Matter Transition in Lignite during Ashing Process: A Case Study of Early Cretaceous Lignite from the Hailar Basin, Inner Mongolia, China. Fuel 2022, 328. [Google Scholar] [CrossRef]
- Farhang, F.; Oliver, T. K.; Rayson, M.; Brent, G.; Stockenhuber, M.; Kennedy, E. Experimental Study on the Precipitation of Magnesite from Thermally Activated Serpentine for CO2 Sequestration. Chem. Eng. J. 2016, 303, 439–449. [Google Scholar] [CrossRef]
- Yingjie, Z.; Xueli, C.; Handing, C.; Haifeng, L. Transfer of Potassium in Different Forms during Pyrolysis of Rice Straw in a Fixed Bed Reactor. Ranliao Huaxue Xuebao 2014, 42(4), 427–433. [Google Scholar]
- Jalali, M. Effect of Saline-Sodic Solutions on Column Leaching of Potassium from Sandy Soil. Arch. Agron. Soil. Sci. 2011, 57(4), 377–390. [Google Scholar] [CrossRef]
- Jalali, M.; Merrikhpour, H. Effects of Poor Quality Irrigation Waters on the Nutrient Leaching and Groundwater Quality from Sandy Soil. Environ. Geol. 2007, 53(6), 1289–1298. [Google Scholar] [CrossRef]
- Rengasamy, P. Irrigation Water Quality and Soil Structural Stability: A Perspective with Some New Insights. Agronomy 2018, Vol. 8(Page 72 8 (5)), 72. [Google Scholar] [CrossRef]
- Chamorro, E.; Garzón-Camacho, P. A.; Fischer Sbrissia, A.; Álvarez-López, V.; Paz-González, A.; Cárdenas-Aguiar, E. Temperature-Driven Trade-Offs Between Carbon Stability and DTPA-Extractable Micronutrients in Vineyard-Pruning Biochars (NW Spain). Processes 2026, Vol. 14(Page 849 14 (5)), 849. [Google Scholar] [CrossRef]
- Zaitseva, N. A.; Onufrieva, T. A.; Barykina, J. A.; Krasnenko, T. I.; Zabolotskaya, E. V.; Samigullina, R. F. Magnetic Properties and Oxidation States of Manganese Ions in Doped Phosphor Zn2SiO4:Mn. Mater. Chem. Phys. 2018, 209, 107–111. [Google Scholar] [CrossRef]
- Karipidis, T. K.; Mal’tsev, V. V.; Volkova, E. A.; Chukichev, M. V.; Leonyuk, N. I. Thermal Stability of Zincite Single Crystals. Crystallogr. Rep. 2008, 53(2), 326–330. [Google Scholar] [CrossRef]
- Pöttgen, R. Intermetallics from Cadmium Self-Flux Reactions. Z. Fur Naturforschung-Sect. B J. Chem. Sci. 2025, 80(3–4), 57–64. [Google Scholar] [CrossRef]
- Zhang, Y.; Zhou, L. C.; Hou, F. C.; Su, H. L.; Ye, J.; Chen, B. C.; Sun, J.; Song, L. ReaxFF Parameter Optimization and Reactive Molecular Dynamics Simulation of Cadmium Metal. Chem. Phys. Lett. 2025, 862, 141864. [Google Scholar] [CrossRef]
- Li, S.; Shangguan, Z. Positive Effects of Apple Branch Biochar on Wheat Yield Only Appear at a Low Application Rate, Regardless of Nitrogen and Water Conditions. J. Soils Sediments 2018, 18(11), 3235–3243. [Google Scholar] [CrossRef]
- Zhang, N.; Ye, X.; Gao, Y.; Liu, G.; Liu, Z.; Zhang, Q.; Liu, E.; Sun, S.; Ren, X.; Jia, Z.; et al. Environment and Agricultural Practices Regulate Enhanced Biochar-Induced Soil Carbon Pools and Crop Yield: A Meta-Analysis. Sci. Total Environ. 2023, 905, 167290. [Google Scholar] [CrossRef]
- Lee, S. R.; Lee, J. H.; Rho, J. S.; Park, Y. J.; Lee, J. M.; Park, J. H.; Seo, D. C. Effects of Lettuce Growth and Carbon Sequestration by Different Application Methods with Excessive Amount of Wood-Based Agricultural and Forestry By-Product Biochar. Korean J. Environ. Agric. 2024, 43, 251–260. [Google Scholar] [CrossRef]
- Yang, H.; Chen, Z.; Zhang, Y.; Liu, B.; Yang, Y.; Tang, Z.; Chen, Y.; Chen, H. Catalytic Effect of K and Na with Different Anions on Lignocellulosic Biomass Pyrolysis. Front. Chem. Sci. Eng. 2024, 18(12), 141. [Google Scholar] [CrossRef]
- Liu, G.; Shen, X. Copper Sulfate Supplementation Alleviates Molybdenosis in the Tibetan Gazelles in the Qinghai Lake Basin. Toxics 2024, Vol. 12(Page 546 12 (8)), 546. [Google Scholar] [CrossRef]
- Gao, Z.; Ye, T.; Cui, X.; Lu, J.; Ren, T.; Cong, R.; Lu, Z.; Zhang, Y.; Liao, S.; Li, X.; et al. Dynamics of Potassium Concentration in Paddy Field Water, Soil and Plant Affected by Potassium Fertilizer Levels. Nutr. Cycl. Agroecosystems 2025 130:2, 130, 313–326. [Google Scholar] [CrossRef]
- Giletto, C. M.; Kloster Erreguerrena, M.; Ceroli, P.; Carciochi, W.; Silva, S. E.; Rodriguez, S.; Salvagiotti, F.; Reussi Calvo, N. I. Holistic Assessment of Calcium Fertilization in Potato: Diagnostic, Productivity, and Tuber Quality. J. Soil. Sci. Plant Nutr. 2022, 23(1), 485–495. [Google Scholar] [CrossRef]
- Ahmed, N.; Habib, U.; Younis, U.; Irshad, I.; Danish, S.; Rahi, A. A.; Munir, T. M. Growth, Chlorophyll Content and Productivity Responses of Maize to Magnesium Sulphate Application in Calcareous Soil. Open Agric. 2020, 5(1), 792–800. [Google Scholar] [CrossRef]
- Mandi, S.; Shivay, Y. S.; Prasanna, R.; Nayak, S.; Baral, K.; Reddy, K. S.; Borate, R. B. Insights into the Response of Elemental Sulfur Fertilization on Crop Yield and Nutritional Quality of Durum Wheat. J. Soil. Sci. Plant Nutr. 2024, 24(4), 8306–8320. [Google Scholar] [CrossRef]
- Singh, O.; Kumar, S.; Dwivedi, A.; Dhyani, B. P.; Naresh, R. K. Effect of Sulphur and Iron Fertilization on Performance and Production Potential of Urdbean [Vigna Mungo (L.) Hepper] and Nutrients Removal under Inceptisols. [CrossRef]
- László, M. Manganese Requirement of Sunflower (Helianthus Annuus L.), Tobacco (Nicotiana Tabacum L.) and Triticale (x Triticosecale W.) at Early Stage of Growth. Eur. J. Agron. 2008, 28(4), 586–596. [Google Scholar] [CrossRef]
- Mn2+ DEFICIENCY AS AN ENVIRONMENTAL STRESSOR ON SUNFLOWER, TOBACCO, AND TRITICALE GROWTH on JSTOR. Available online: https://www.jstor.org/stable/90003450 (accessed on 14 Apr 2026).
- Kumar, S.; Verma, G.; Dhaliwal, S. S.; Sharma, V. Influence of Zinc Fertilization Levels and Frequencies on Crop Productivity, Zinc Uptake and Buildup of Soil Zinc in Maize–Wheat System. J. Plant Nutr. 2022, 45(12), 1774–1785. [Google Scholar] [CrossRef]
- Giussani, A. Molybdenum in the Environment and Its Relevance for Animal and Human Health. Encycl. Environ. Health 2011, 3, V3-840-V3-846. [Google Scholar] [CrossRef]
- Biochar Standards - International Biochar Initiative. Available online: https://biochar-international.org/biochar-standards/ (accessed on 15 Apr 2026).
- Ranaweera, S.; Silva, S. S. H.; Manatunga, D. C. Cobalt and Copper Deficiency and Molybdenosis. Med. Geol. En. Route To One Health 2023, 235–252. [Google Scholar] [CrossRef]
- Axelson, U.; Söderström, M.; Jonsson, A. Risk Assessment of High Concentrations of Molybdenum in Forage. Environ. Geochem. Health 2018 2018, 40(6), 2685–2694. [Google Scholar] [CrossRef] [PubMed]
- Zhou, X.; Shen, X. Environmental Sulfur and Molybdenum Stress Disrupts Mineral Homeostasis and Induces Physiological and Molecular Alterations in Goats. Environ. Res. 2025, 282, 122033. [Google Scholar] [CrossRef] [PubMed]
- Andreev, D. E.; Vdovin, Y. S.; Yukhvid, V. I.; Sachkova, N. V.; Kovalev, I. D. Centrifugal SHS-Metallurgy of Composite Materials Mo–Si–B. Russ. J. Phys. Chem. B 2020, 14(2), 261–265. [Google Scholar] [CrossRef]
- Jakob, S.; Lorich, A.; Eidenberger-Schober, M.; Knabl, W.; Clemens, H.; Maier-Kiener, V. Microstructural Characterization of Molybdenum Grain Boundaries by Micropillar Compression Testing and Atom Probe Tomography. Prakt. Metallogr. Metallogr. 2019, 56(12), 776–786. [Google Scholar] [CrossRef]
Figure 1.
Physicochemical properties of biochar. Bars represent mean values with standard error (SE) as error bars. Different letters above bars indicate significant differences among treatments (Tukey HSD, p ≤ 0.05).
Figure 1.
Physicochemical properties of biochar. Bars represent mean values with standard error (SE) as error bars. Different letters above bars indicate significant differences among treatments (Tukey HSD, p ≤ 0.05).
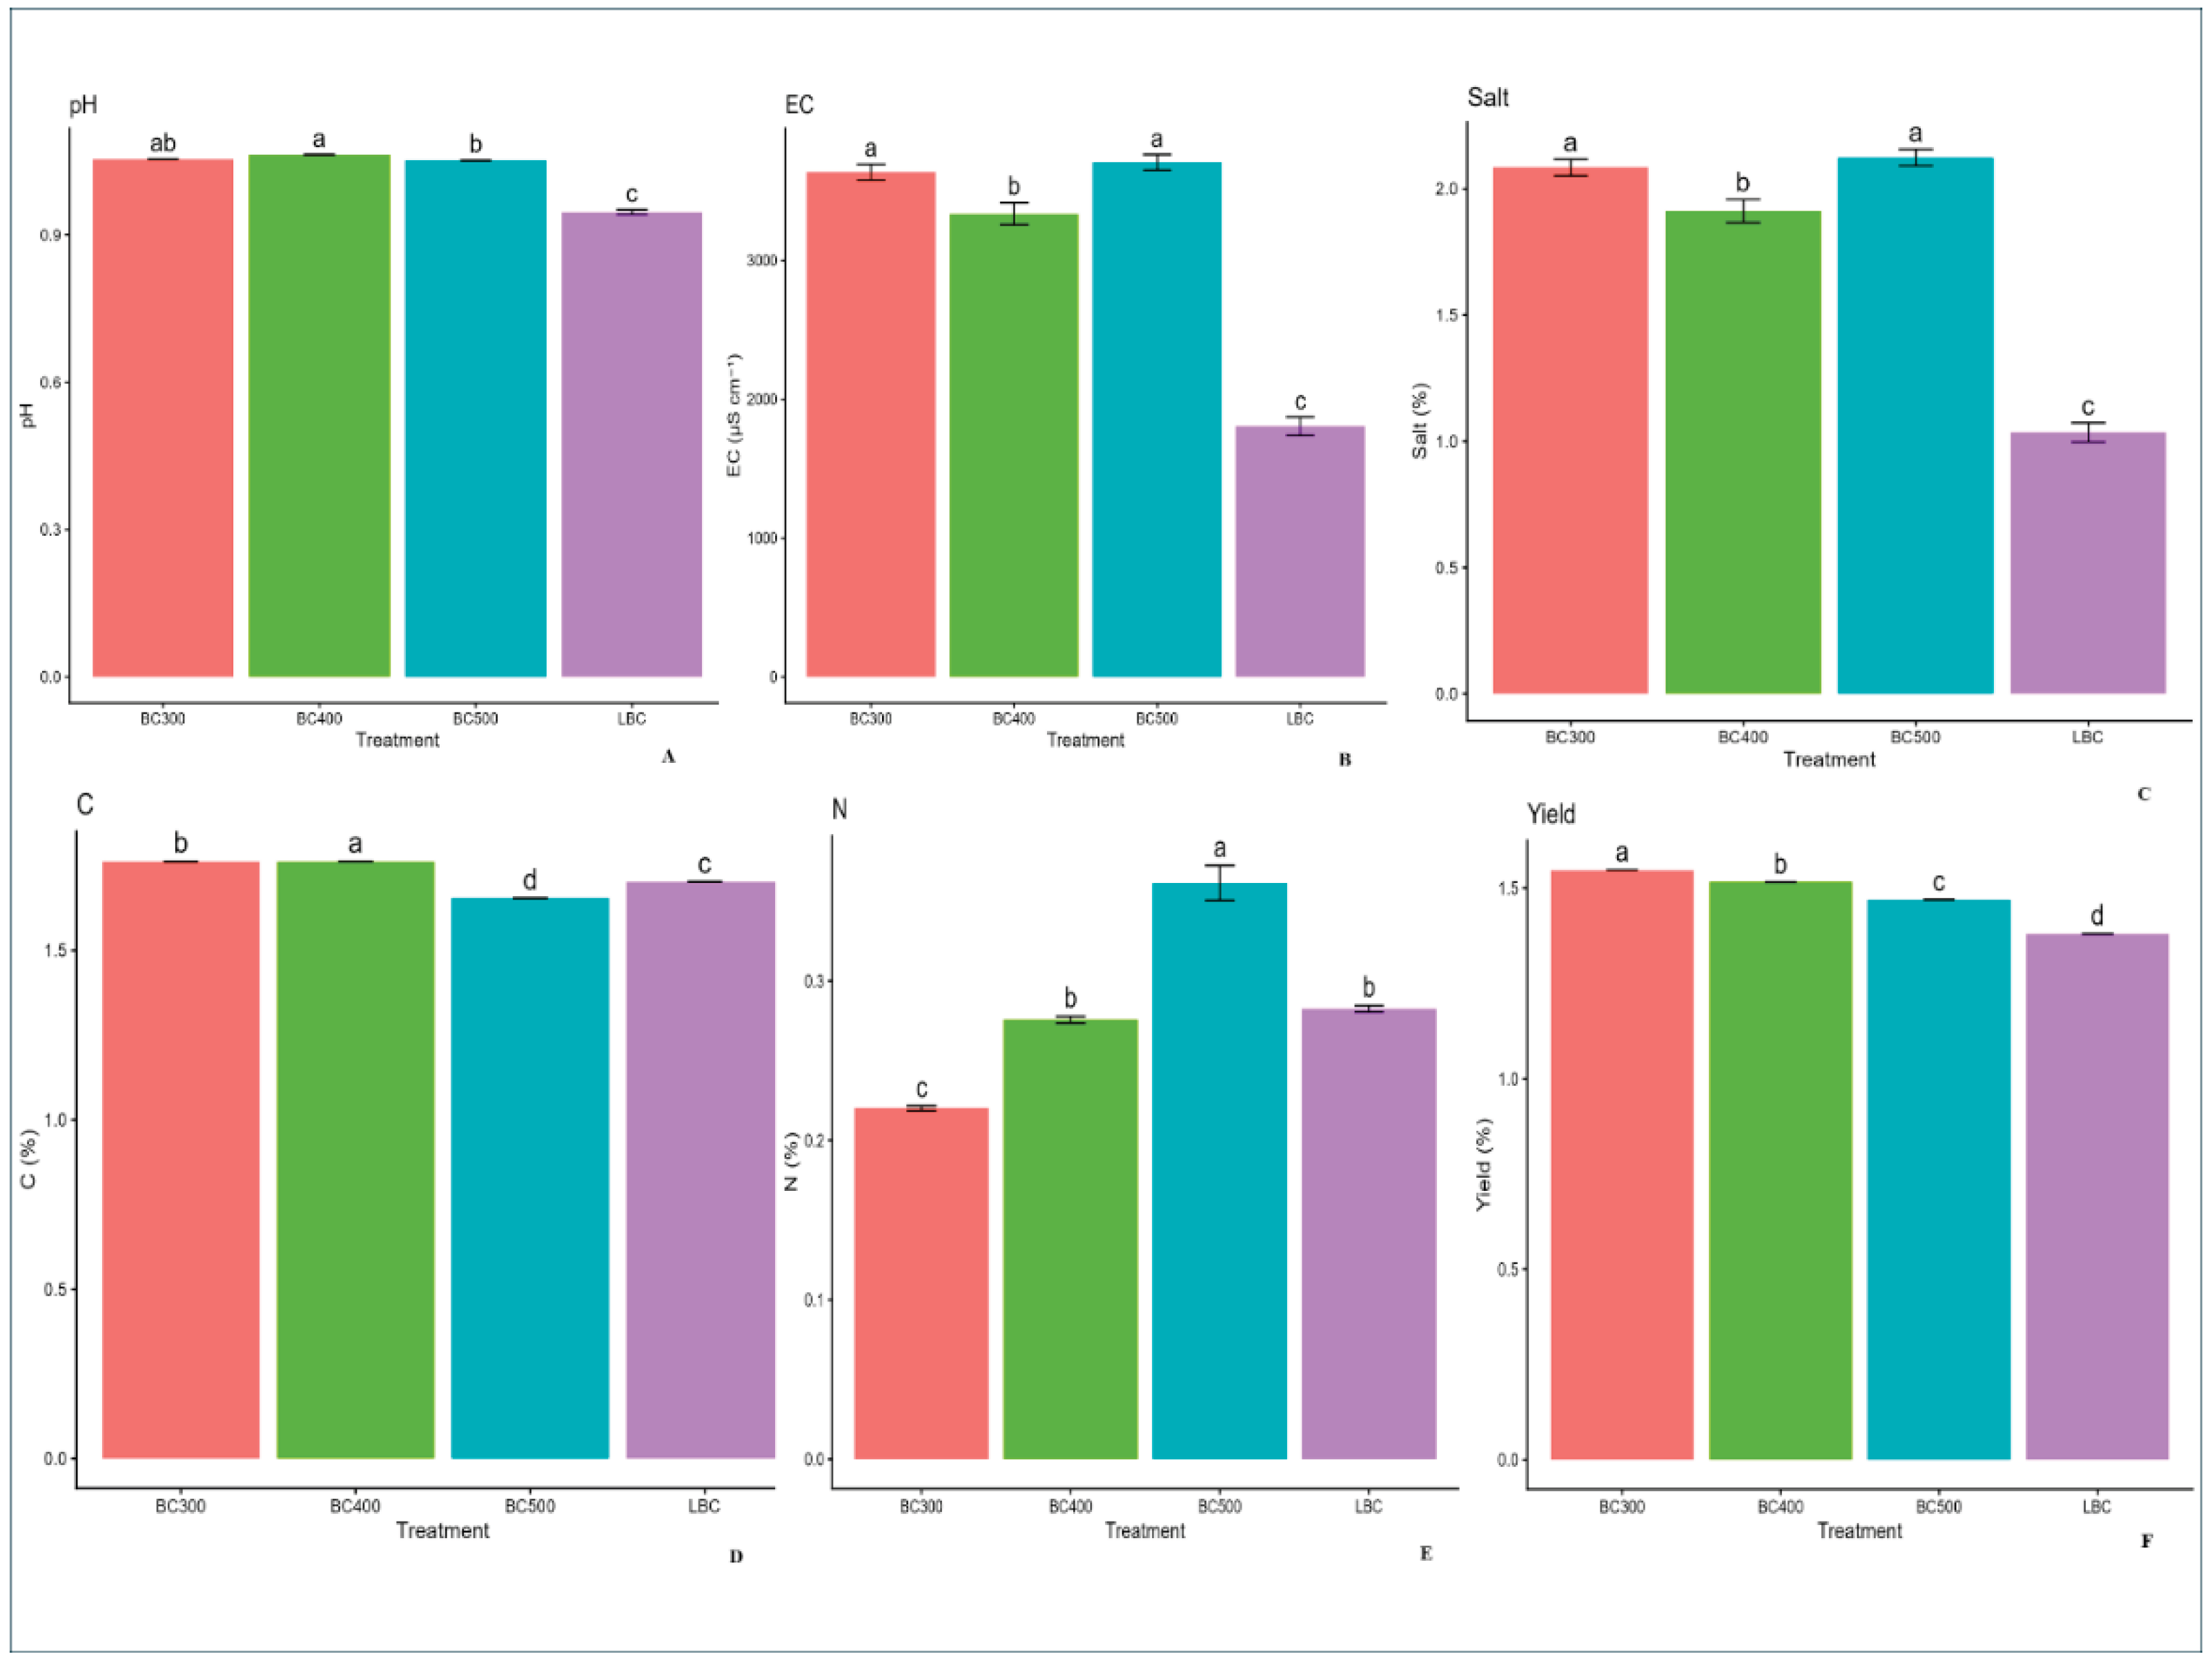
Figure 2.
Nitrogen forms (ammonia-N, nitrate-N, nitrite-N) in biochar. Bars represent mean values with standard error (SE) as error bars. Different letters above bars indicate significant differences among treatments (Tukey HSD, p ≤ 0.05).
Figure 2.
Nitrogen forms (ammonia-N, nitrate-N, nitrite-N) in biochar. Bars represent mean values with standard error (SE) as error bars. Different letters above bars indicate significant differences among treatments (Tukey HSD, p ≤ 0.05).
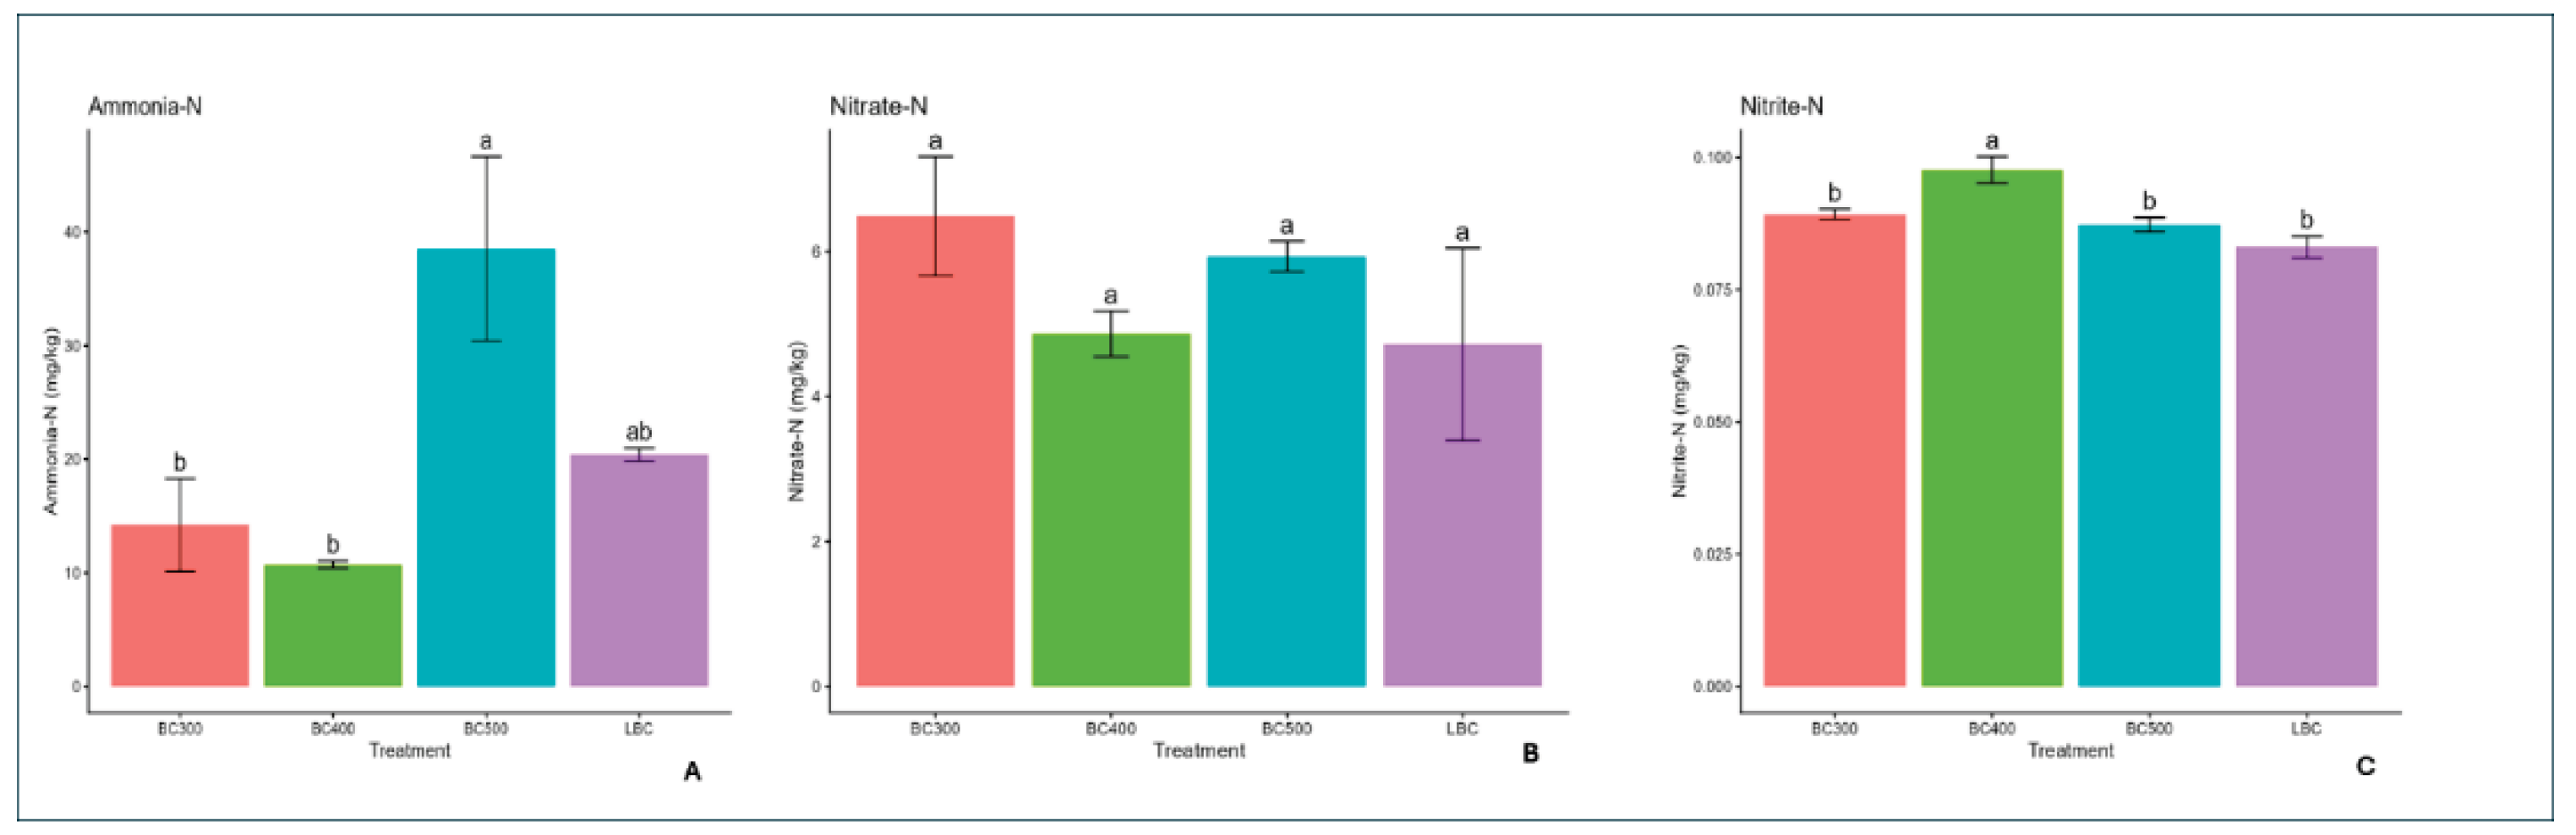
Figure 3.
Macronutrients concentration in biochar. Bars represent mean values with standard error (SE) as error bars. Different letters above bars indicate significant differences among treatments (Tukey HSD, p ≤ 0.05).
Figure 3.
Macronutrients concentration in biochar. Bars represent mean values with standard error (SE) as error bars. Different letters above bars indicate significant differences among treatments (Tukey HSD, p ≤ 0.05).
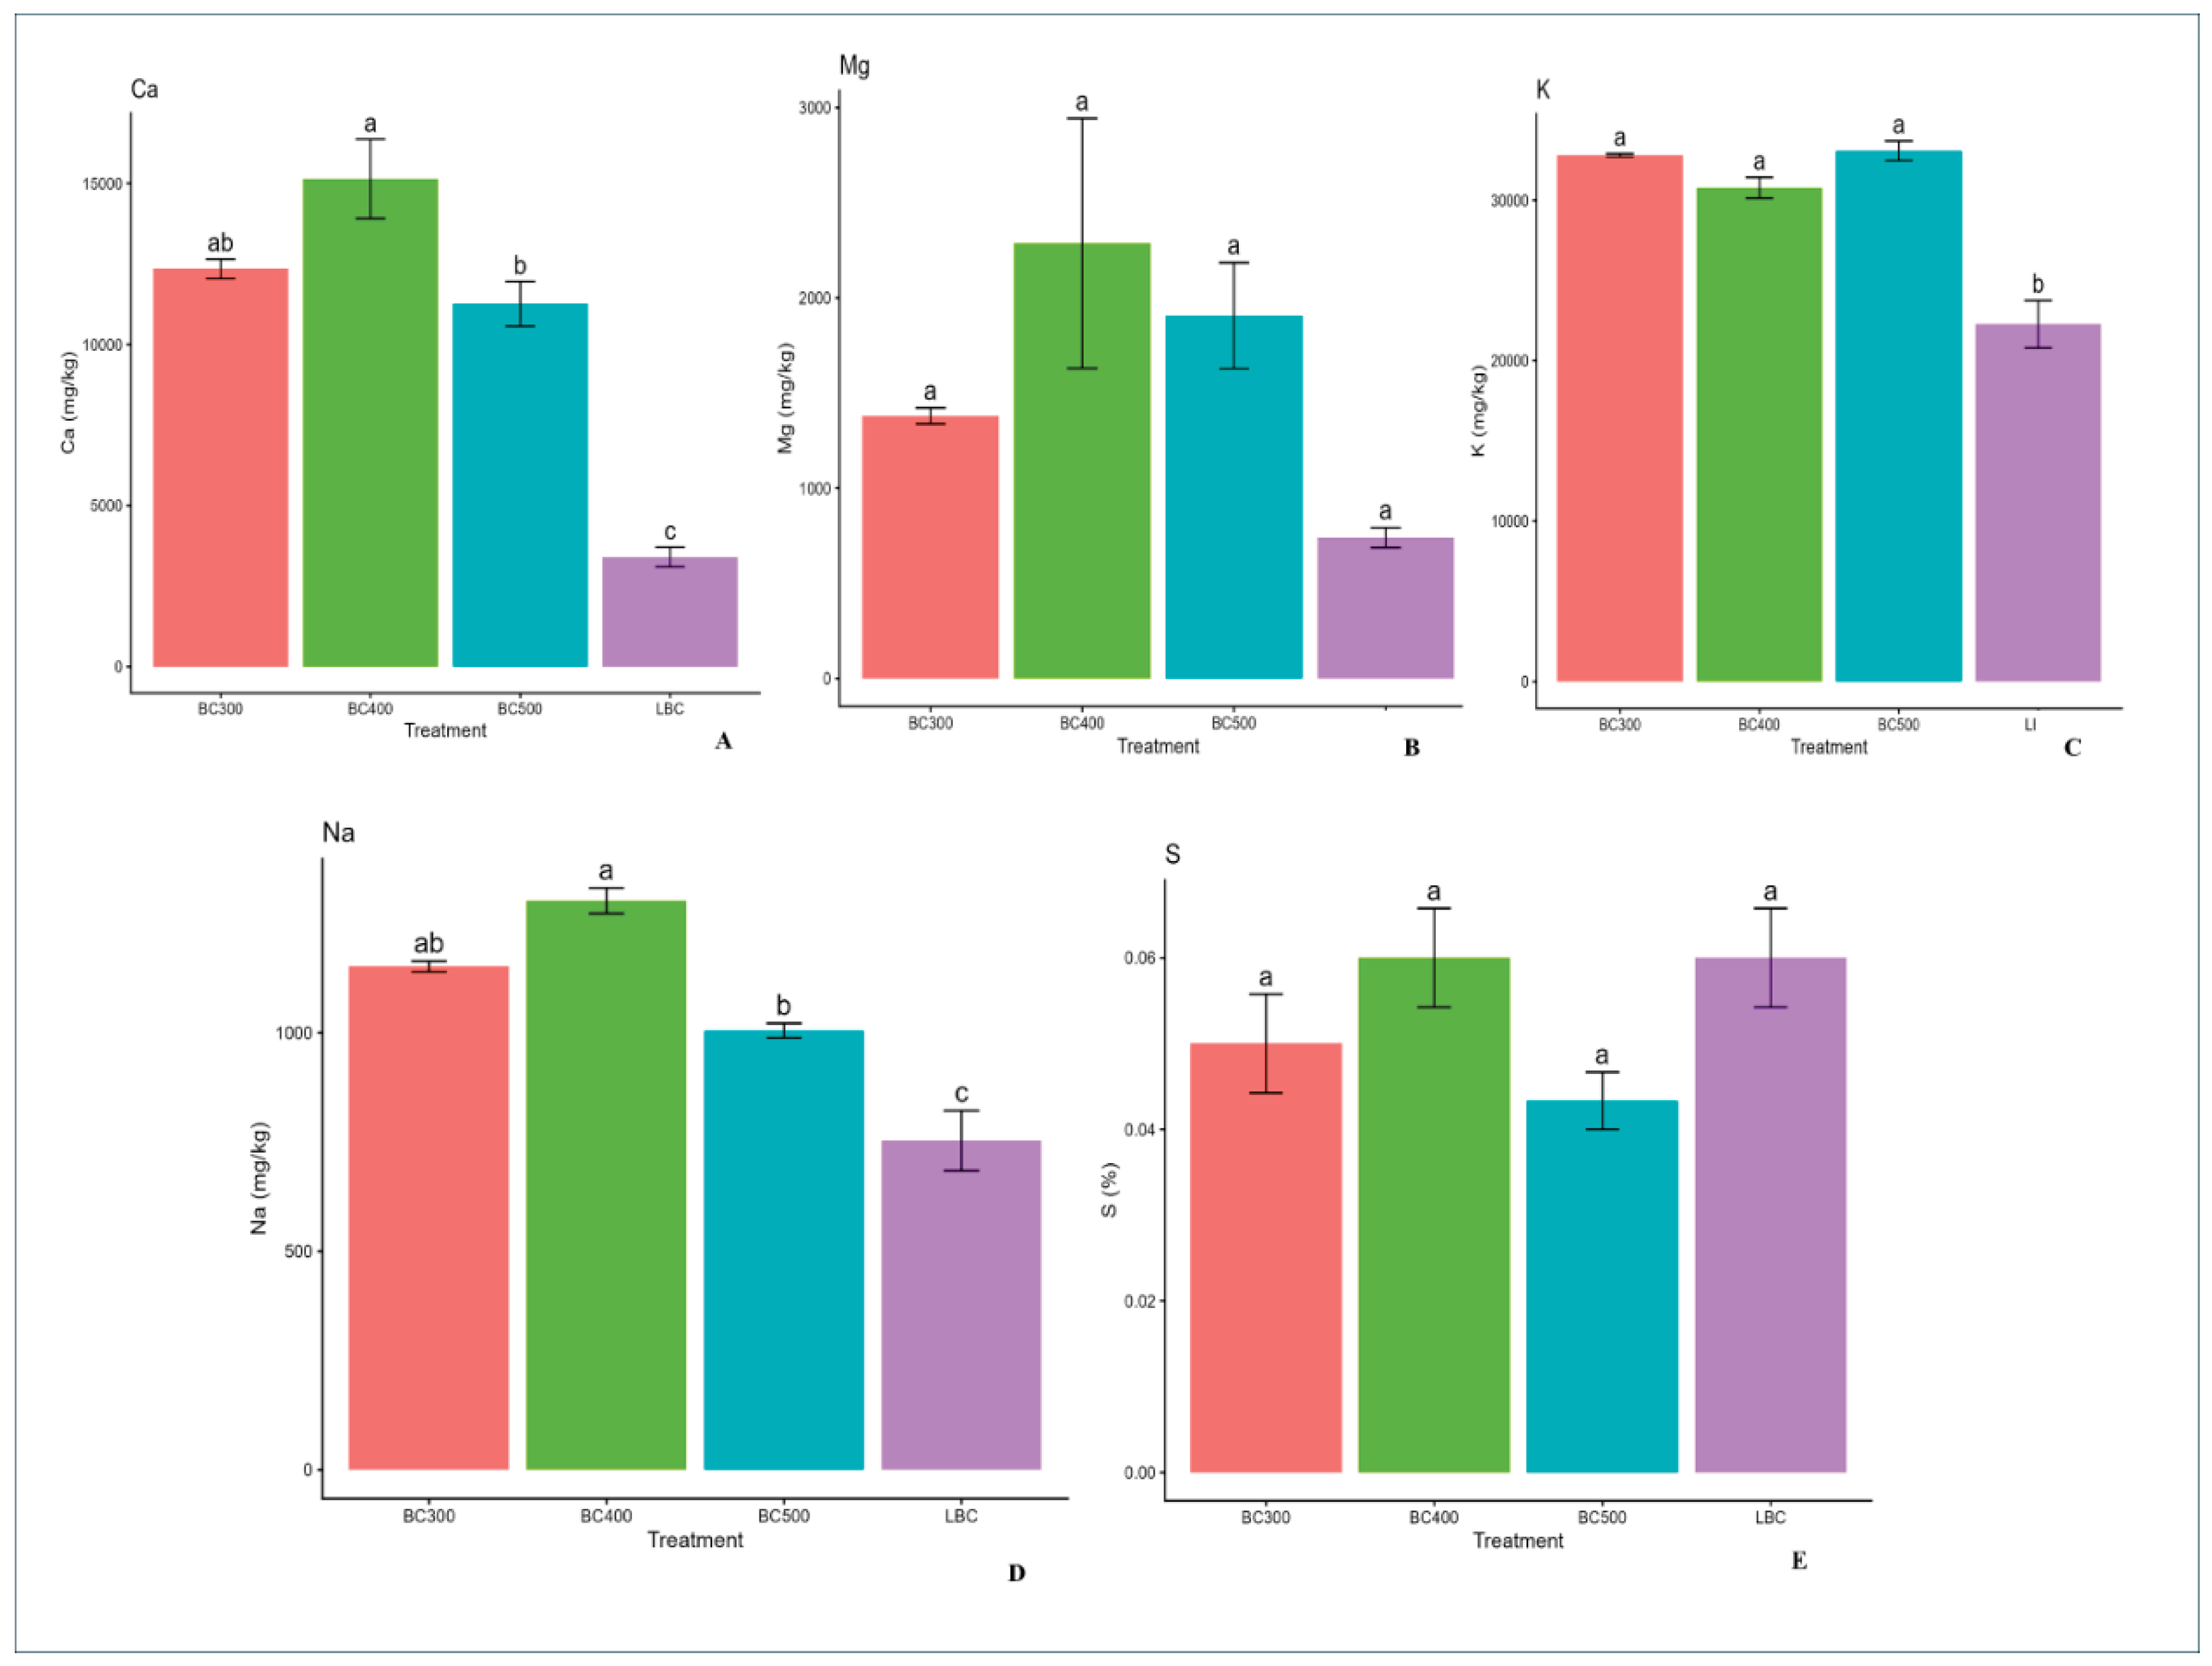
Figure 4.
Micronutrients concentration in biochar. Bars represent mean values with standard error (SE) as error bars. Different letters above bars indicate significant differences among treatments (Tukey HSD, p ≤ 0.05).
Figure 4.
Micronutrients concentration in biochar. Bars represent mean values with standard error (SE) as error bars. Different letters above bars indicate significant differences among treatments (Tukey HSD, p ≤ 0.05).
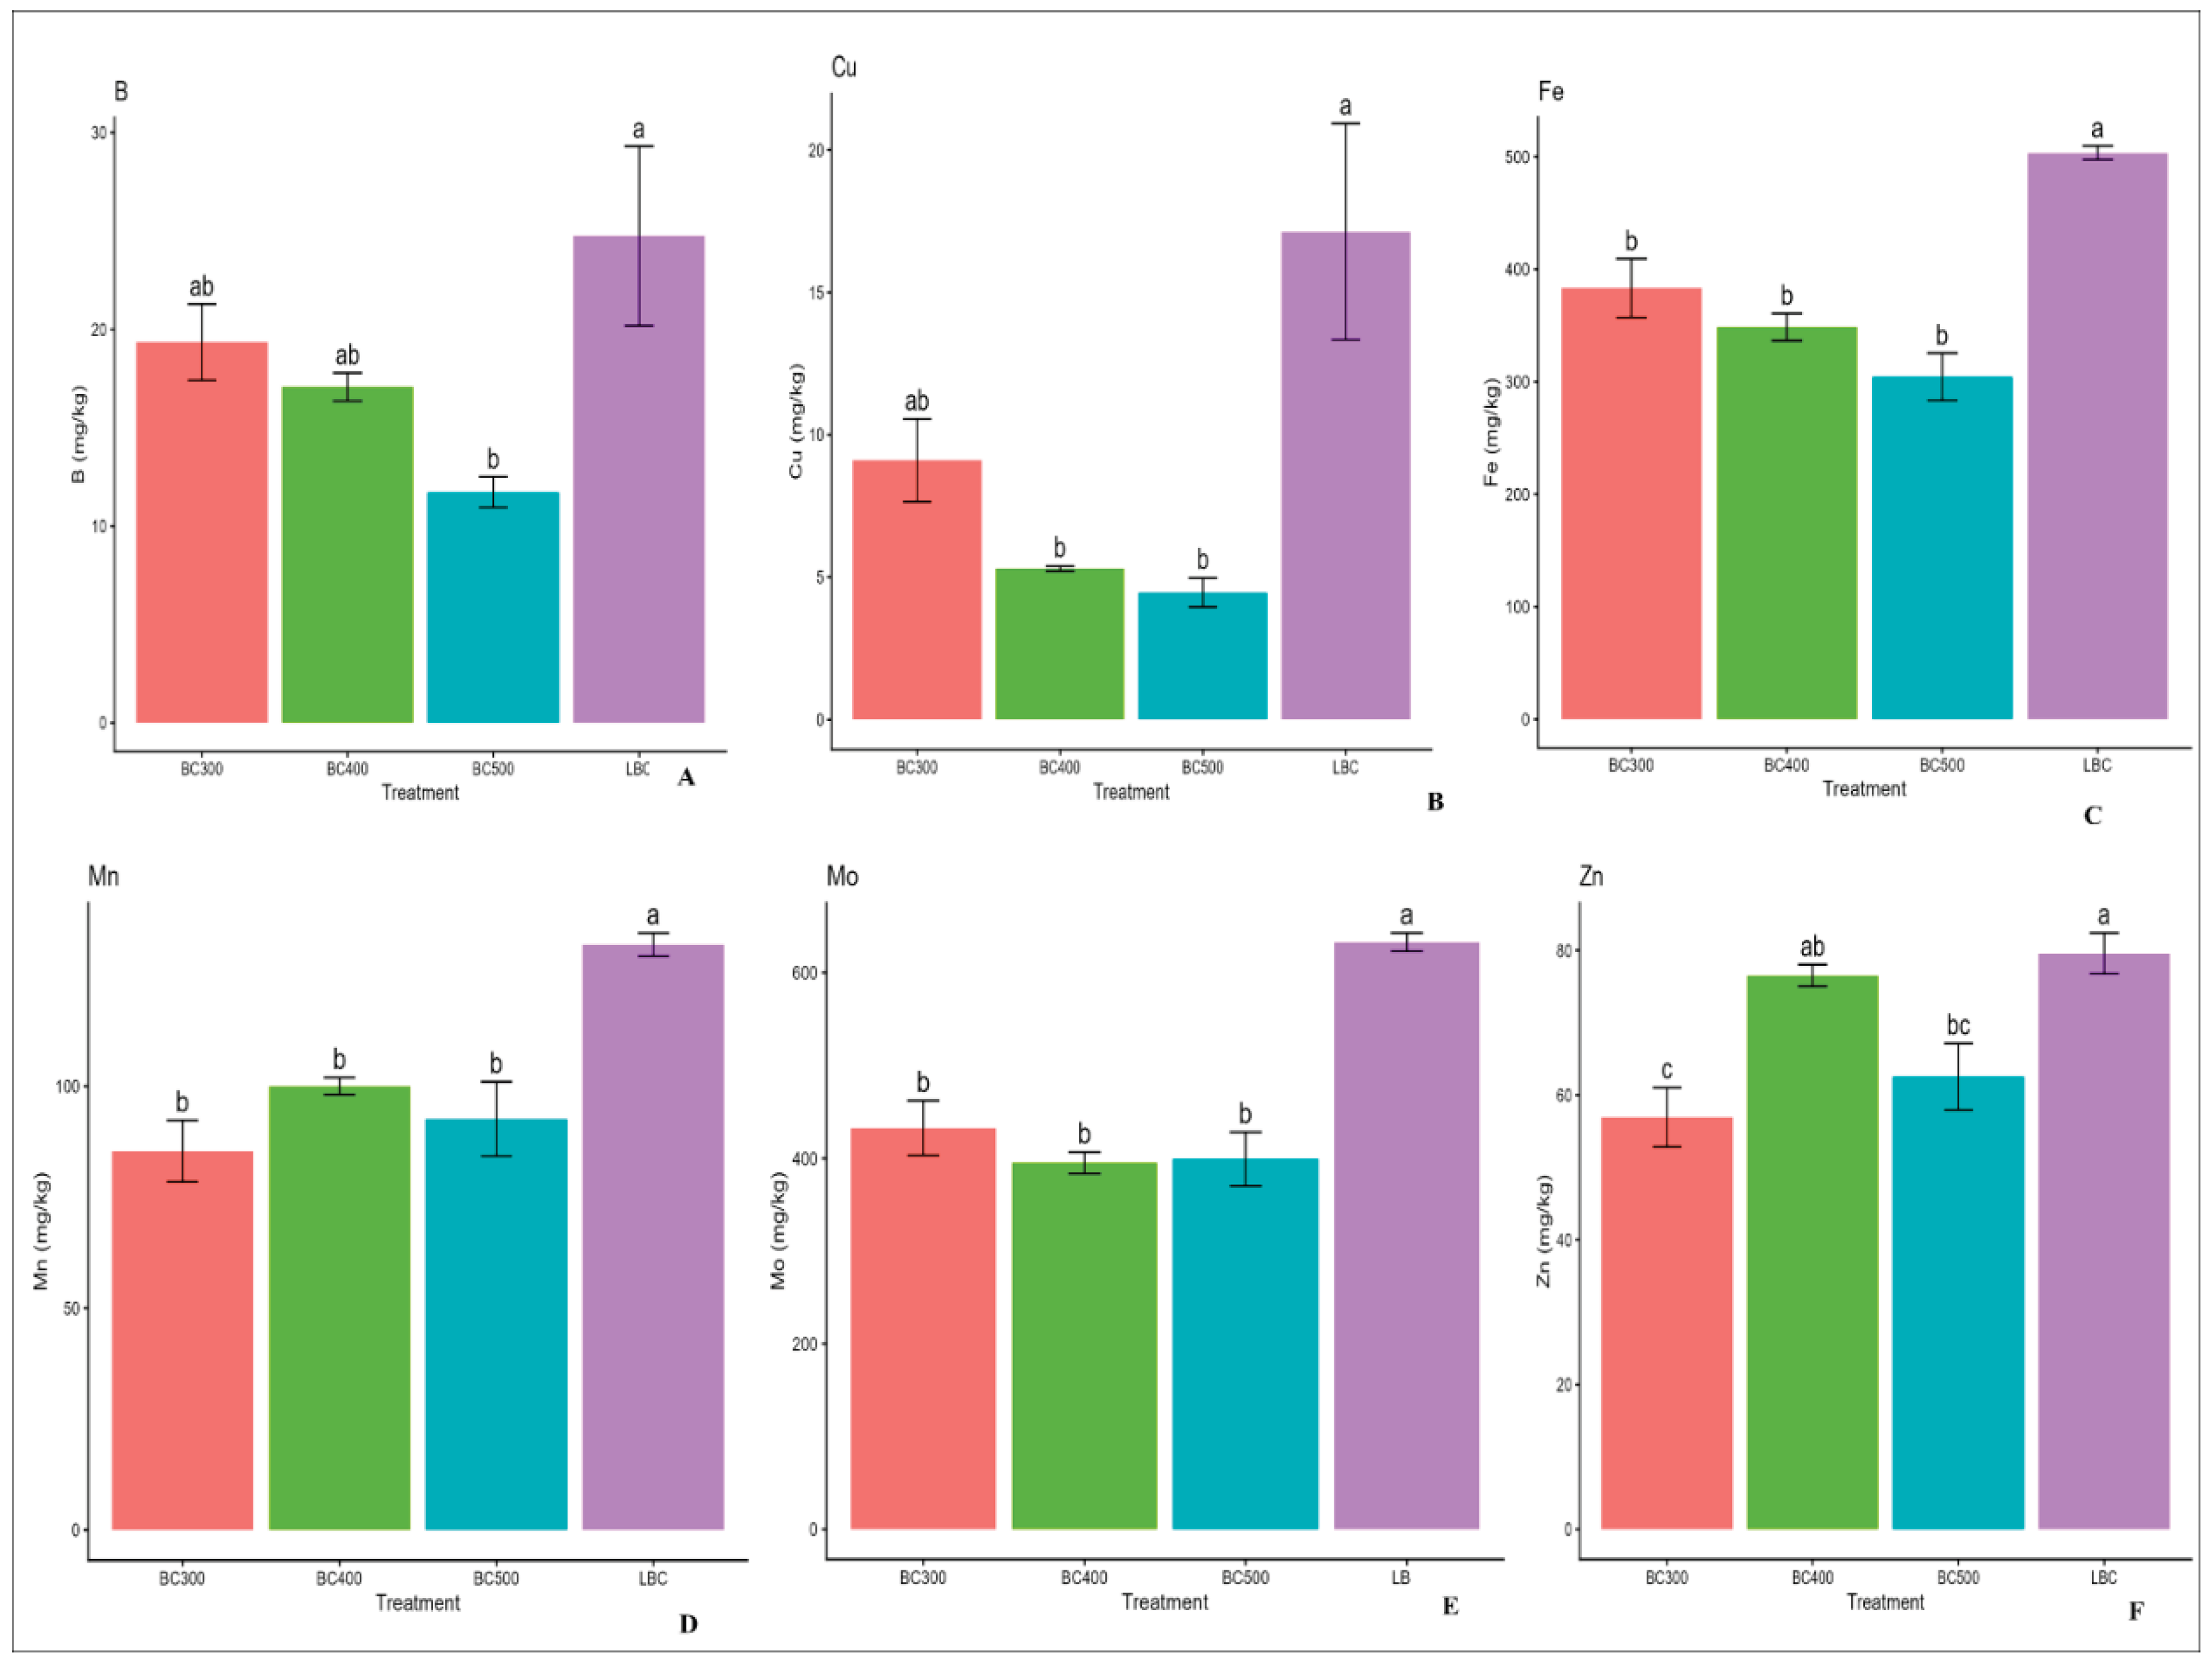
Figure 5.
Trace elements concentration in biochar. Bars represent mean values with standard error (SE) as error bars. Different letters above bars indicate significant differences among treatments (Tukey HSD, p≤0.05).
Figure 5.
Trace elements concentration in biochar. Bars represent mean values with standard error (SE) as error bars. Different letters above bars indicate significant differences among treatments (Tukey HSD, p≤0.05).
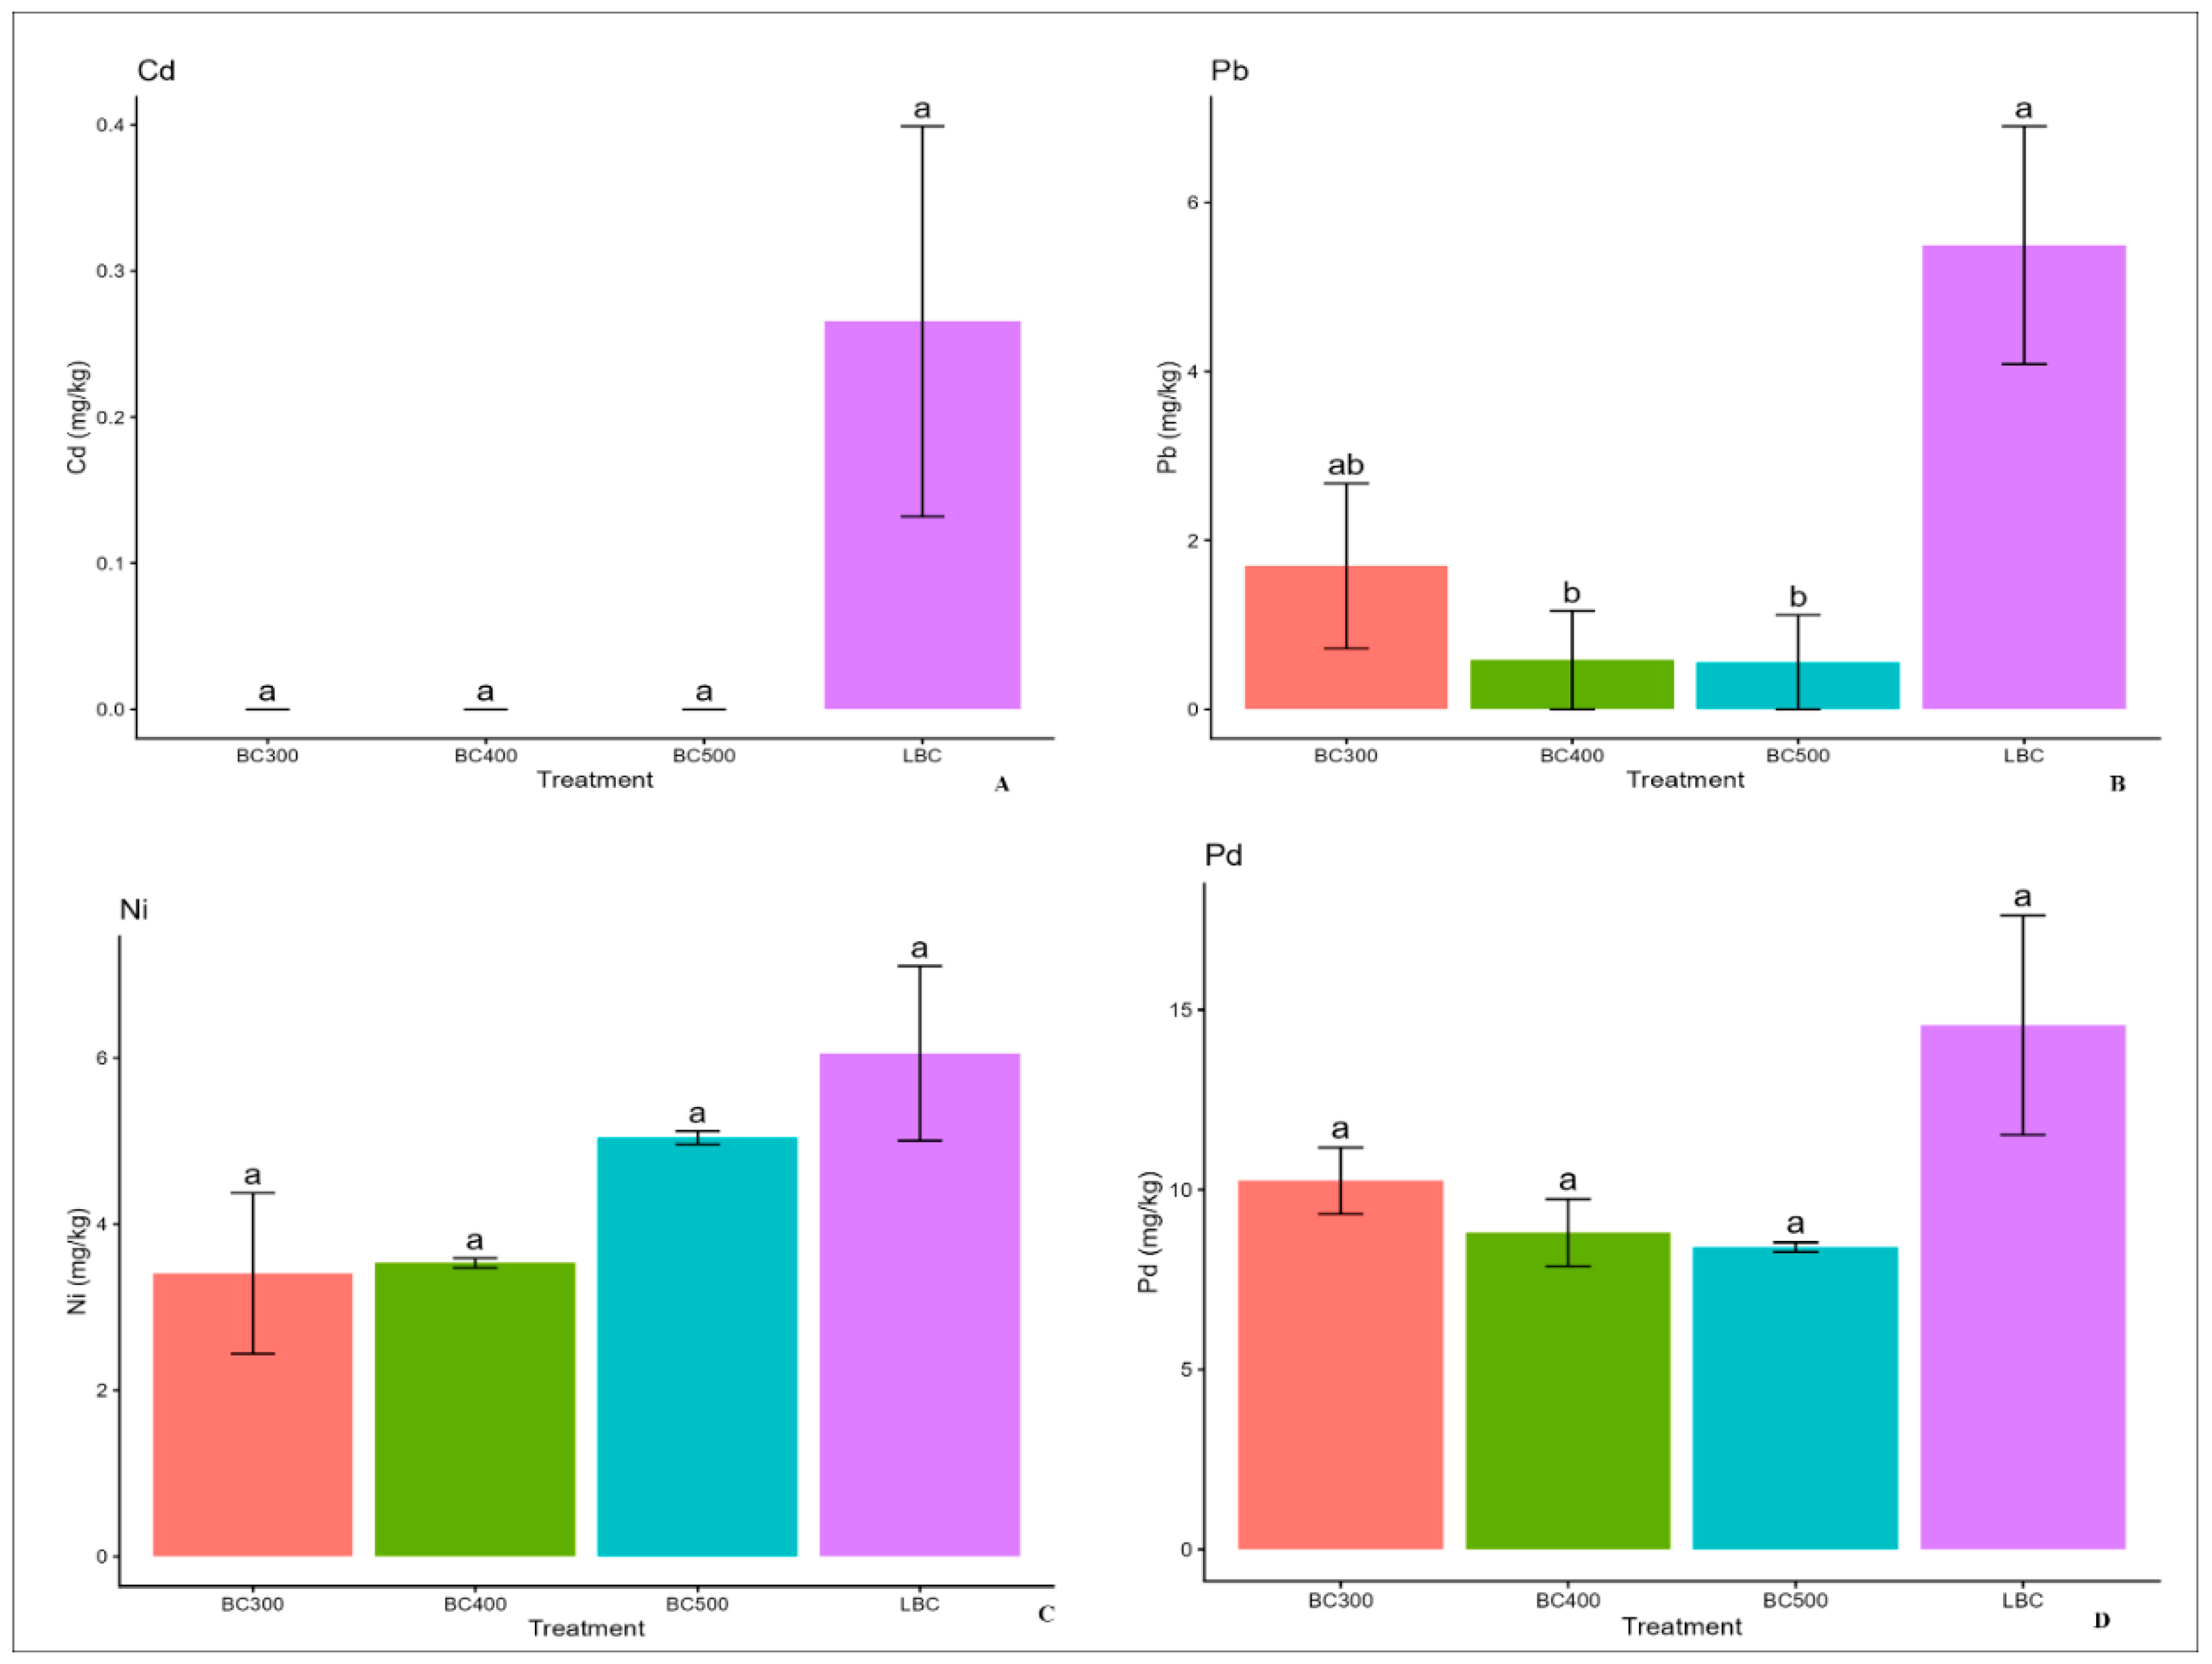
Figure 6.
SEM of biochars produced at different temperatures: LBC (800×), BC300 (400×), BC400 (500×), BC500 (1500×). Backscattered electron (BSE) mode; scale bars = 30–100 μm.
Figure 6.
SEM of biochars produced at different temperatures: LBC (800×), BC300 (400×), BC400 (500×), BC500 (1500×). Backscattered electron (BSE) mode; scale bars = 30–100 μm.
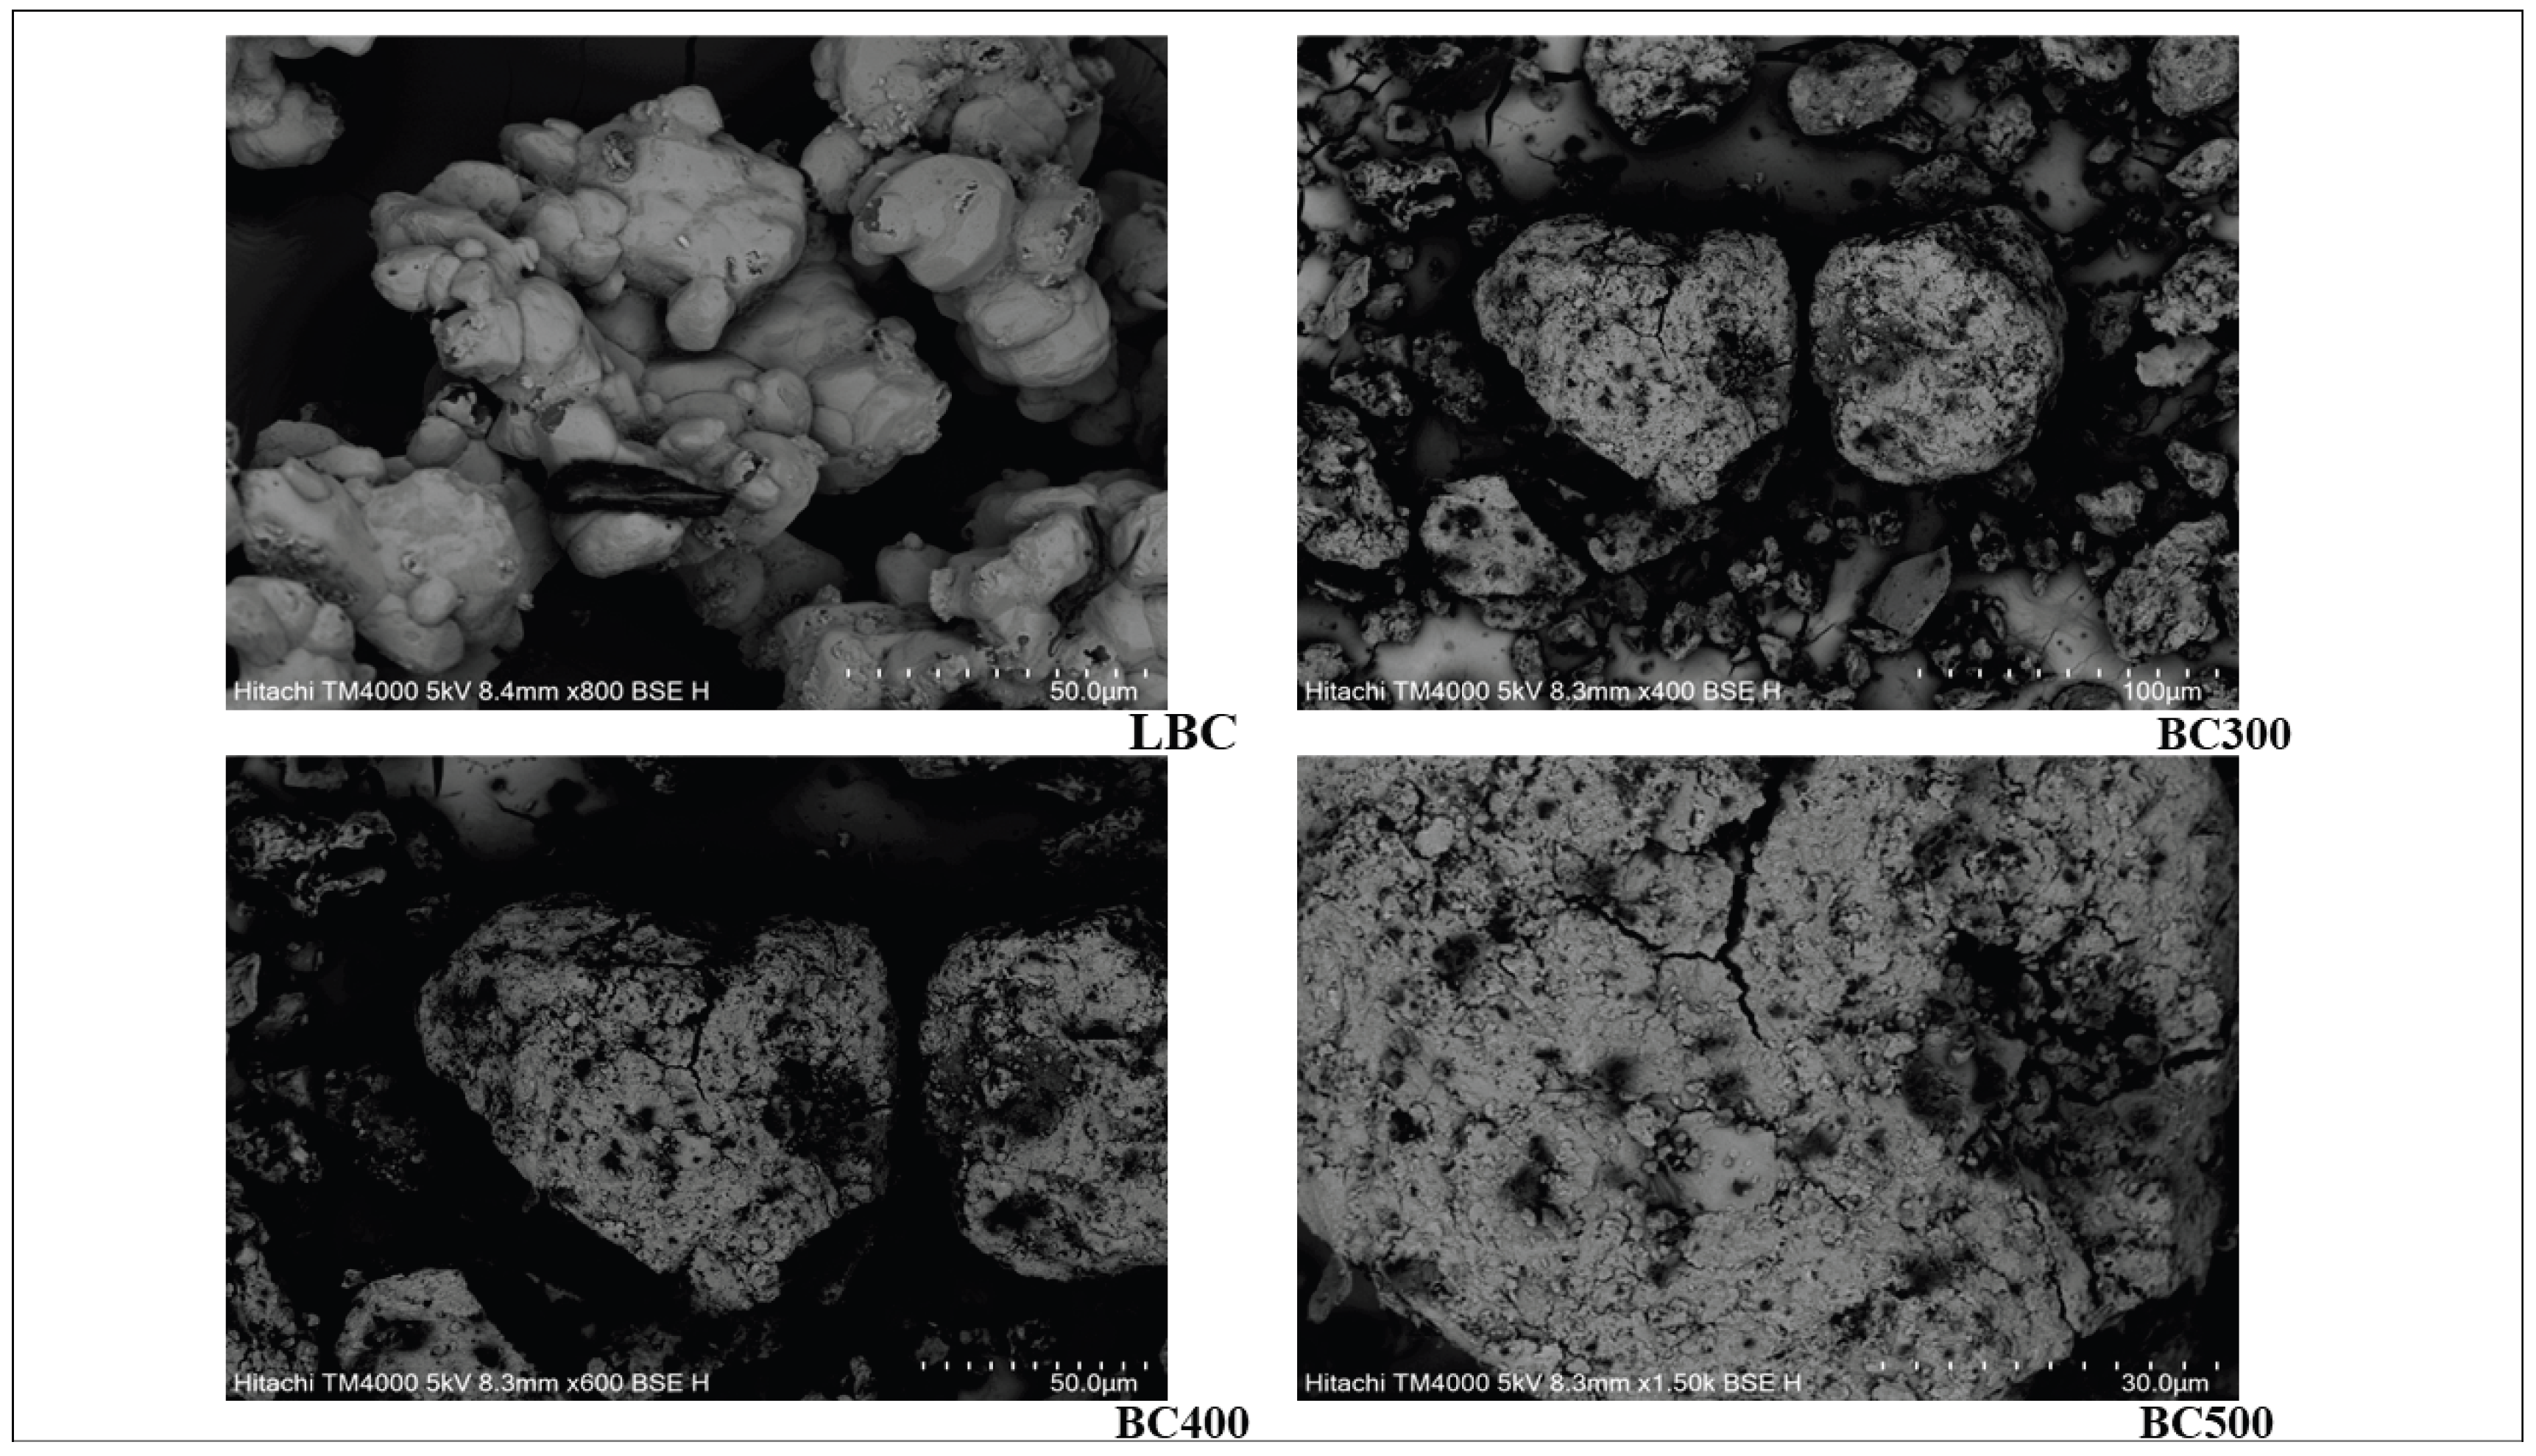

Table 1.
Biochar physicochemical properties.
| Treatment | pH | EC(μS cm−1) | Salt (%) | Carbon (%) | Nitrogen (%) | Yield (%) |
|---|---|---|---|---|---|---|
| BC300 | 10.31±0.013ab | 3635 ± 57a | 2.08±0.033a | 56.83±0.006b | 0.66±0.006c | 34.3±0.0a |
| BC400 | 10.57 ± 0.006a | 3335 ± 80b | 1.91± .046b | 56.94±0.006a | 0.89±0.009b | 31.8±0.0b |
| BC500 | 10.26±0.012b | 3705 ± 56a | 2.12±0.032a | 44.06±0.006d | 1.30±0.058a | 28.5±0.0c |
| LBC | 7.84 ± 0.098c | 1805 ± 67c | 1.03±0.038c | 49.35±0.006c | 0.92±0.009b | 23.0±0.0d |
Values are mean ± SD and different letters in a row indicate statistically significant differences among treatments (Tukey HSD, p ≤ 0.05).
Table 2.
Nitrogen Forms (ammonia-N, nitrate-N, nitrite-N (mg kg−1) in various biochar types.
| Treatment | Ammonia-N | Nitrate-N | Nitrite-N |
|---|---|---|---|
| BC300 | 14.20 ± 4.08b | 6.49 ± 0.82a | 0.089 ± 0.001b |
| BC400 | 10.73 ± 0.31b | 4.87 ± 0.31a | 0.098 ± 0.003a |
| BC500 | 38.53 ± 8.10a | 5.94 ± 0.21a | 0.087 ± 0.001b |
| LBC | 20.42 ± 0.55ab | 4.72 ± 1.33a | 0.083 ± 0.002b |
Values are mean ± SD and different letters in a row indicate statistically significant differences among treatments (Tukey HSD, p ≤ 0.05).
Table 3.
Macronutrients concentration (mg kg−1) in various biochar types.
| Treatment | Calcium (Ca) | Magnesium (Mg) | Potassium (K) | Sodium (Na) | Sulfur (S%) |
|---|---|---|---|---|---|
| BC300 | 12347± 303ab | 1380 ± 42a | 32805 ± 100a | 1152 ± 12ab | 0.05 ± 0.006a |
| BC400 | 15140± 1232a | 2287 ± 657a | 30775 ± 653a | 1303 ± 29a | 0.06 ± 0.006a |
| BC500 | 11260 ± 693b | 1907 ± 278a | 33079 ± 612a | 1005 ± 16b | 0.043 ± 0.003a |
| LBC | 3400 ± 303c | 740 ± 53a | 22268 ± 1,476b | 753 ± 69c | 0.06 ± 0.006a |
Values are mean ± SD and different letters in a row indicate statistically significant differences among treatments (Tukey HSD, p ≤ 0.05).
Table 4.
Micronutrients (mg kg−1) concentration in various biochar types.
| Treatment | Boron (B) | Copper (Cu) | Iron (Fe) | Manganese (Mn) | Molybdenum (Mo) | Zinc (Zn) |
|---|---|---|---|---|---|---|
| BC300 | 19.35±1.94ab | 9.10±1.45ab | 383±26b | 85.4 ± 6.9b | 433 ±29b | 56.9±4.1c |
| BC400 | 17.08±0.72ab | 5.30± 0.09b | 349±12b | 100.0± 1.9b | 395 ±12b | 76.5±1.5ab |
| BC500 | 11.73±0.78b | 4.46± 0.50b | 304±21b | 92.6 ± 8.4b | 399 ± 29b | 62.5±4.6bc |
| LBC | 24.75 ± 4.56a | 17.13±3.79a | 504 ± 6a | 132.0 ± 2.6a | 633 ± 10a | 79.6 ± 2.8a |
Values are mean ± SD and different letters in a row indicate statistically significant differences among treatments (Tukey HSD, p ≤ 0.05).
Table 5.
Trace elements (mg kg−1) −1) in various biochar types.
| Treatment | Cadmium (Cd) | Lead (Pb) | Nickel (Ni) | Palladium (Pd) |
|---|---|---|---|---|
| BC300 | 0.00 ± 0.00a | 1.70 ± 0.98ab | 3.41 ± 0.97a | 10.25 ± 0.92a |
| BC400 | 0.00 ± 0.00a | 0.58 ± 0.58b | 3.53 ± 0.06a | 8.81 ± 0.93a |
| BC500 | 0.00 ± 0.00a | 0.56 ± 0.56b | 5.04 ± 0.08a | 8.40 ± 0.13a |
| LBC | 1.00 ± 0.51a | 5.49 ± 1.41a | 6.05 ± 1.05a | 14.57 ± 3.05a |
Values are mean ± SD and different letters in a row indicate statistically significant differences among treatments (Tukey HSD, p ≤ 0.05).
Table 6.
Summary of Nutrient Supply from Biochars at 10 t ha−1 Application Rate.
| Parameter | Unit | BC300 | BC400 | BC500 | LBC |
|---|---|---|---|---|---|
| Salt | kg ha−1 | 208 | 191 | 212 | 103 |
| Carbon | t ha−1 | 5.68 | 5.69 | 4.41 | 4.94 |
| Total N | kg ha−1 | 66 | 89 | 130 | 92 |
| Available N | g ha−1 | 208 | 157 | 445 | 252 |
| Potassium (K) | kg ha−1 | 328 | 308 | 331 | 223 |
| Calcium (Ca) | kg ha−1 | 123 | 151 | 113 | 34 |
| Magnesium (Mg) | kg ha−1 | 13.8 | 22.9 | 19.1 | 7.4 |
| Sodium (Na) | kg ha−1 | 11.5 | 13.0 | 10.1 | 7.5 |
| Sulfur (S) | kg ha−1 | 5.0 | 6.0 | 4.3 | 6.0 |
| Boron (B) | g ha−1 | 194 | 171 | 117 | 248 |
| Copper (Cu) | g ha−1 | 91 | 53 | 45 | 171 |
| Iron (Fe) | kg ha−1 | 3.83 | 3.49 | 3.04 | 5.04 |
| Manganese (Mn) | kg ha−1 | 0.85 | 1.00 | 0.93 | 1.32 |
| Molybdenum (Mo) | kg ha−1 | 4.33 | 3.95 | 3.99 | 6.33 |
| Zinc (Zn) | g ha−1 | 569 | 765 | 625 | 796 |
Table 7.
Summary of Fertilizer Value by Biochar Type.
| Biochar | Key Strengths | Limitations | Best Suited For |
|---|---|---|---|
| BC300 | Highest yield (34.3%); excellent K (328 kg ha−1) with exceptional uniformity; good B and Cu retention | Lowest total N; high salinity risk; variable for other elements | High-yield production; precision K fertilization; bulk applications |
| BC400 | Best overall balance; highest pH (liming); highest C (5.69 t ha−1); highest Ca (151 kg ha−1); highest Mg (22.9 kg ha−1); preserved Zn (765 g ha−1); exceptional uniformity | High variability for Ca and Mg; moderate salinity | General agricultural use; liming acidic soils; carbon sequestration; precision nutrient management |
| BC500 | Highest total N (130 kg ha−1); highest available N (445 g ha−1); highest K (331 kg ha−1); maximum contaminant removal | Substantial B and Cu losses; highest salinity risk; lowest yield | Nitrogen supplementation; contaminated soils; carbon sequestration where nutrients secondary |
| LBC | Highest B, Cu, Fe, Mn; lowest salinity risk; no pyrolysis cost | High variability; detectable Cd; uncontrolled production | Salt-sensitive and low quantity applications; fertilizer coating, micronutrient supplementation where uniformity not critical |
Table 8.
Comparison of Biochar Metal Concentrations with IBI Safety Thresholds (mg kg−1).
| Metal | IBI Threshold (mg kg−1)* | LBC | BC300 | BC400 | BC500 | Compliance status |
|---|---|---|---|---|---|---|
| Cadmium | 1.4 – 39 | 1.00±0.51a | 0.00±0.00a | 0.00±0.00a | 0.00±0.00a | All compliant |
| Copper | 143 – 6000 | 17.13±3.79a | 9.10±1.45ab | 5.30± .09b | 4.46± .50b | All compliant |
| Lead | 121 – 300 | 5.49 ± 1.41a | 1.70±0.98ab | 0.58± .58b | 0.56± .56b | All compliant |
| Molybdenum | 5 – 75 | 633 ± 10a | 433 ± 29b | 395 ± 12b | 399 ± 29b | All exceed |
| Nickel | 47 – 420 | 6.05 ± 1.05a | 3.41 ± 0.97a | 3.53± .06a | 5.04± .08a | All compliant |
| Zinc | 416 – 7400 | 79.6 ± 2.8a | 56.9 ± 4.1c | 76.5±1.5ab | 62.5±4.6bc | All compliant |
*Source:[72].
Table 9.
Possible structure-function relationship of biochar types.
| Feature | LBC | BC300 | BC400 | BC500 |
|---|---|---|---|---|
| Cellular Preservation | High | High | Moderate | Low |
| Pore Development | Moderate | Moderate | Well-developed | Extensive |
| Secondary Porosity | Limited | Limited | Abundant | Extensive |
| Mineral Distribution | Heterogeneous | Discrete clusters | Uniform fine dispersion | Large aggregates |
| Uniformity | Moderate | Low | Exceptional | Variable |
Disclaimer/Publisher’s Note: The statements, opinions and data contained in all publications are solely those of the individual author(s) and contributor(s) and not of MDPI and/or the editor(s). MDPI and/or the editor(s) disclaim responsibility for any injury to people or property resulting from any ideas, methods, instructions or products referred to in the content. |
© 2026 by the authors. Licensee MDPI, Basel, Switzerland. This article is an open access article distributed under the terms and conditions of the Creative Commons Attribution (CC BY) license (http://creativecommons.org/licenses/by/4.0/).
Copyright: This open access article is published under a Creative Commons CC BY 4.0 license, which permit the free download, distribution, and reuse, provided that the author and preprint are cited in any reuse.


