

Submitted:
08 May 2026
Posted:
11 May 2026
You are already at the latest version
Abstract
The increasing presence of microplastics (MPs) in freshwater ecosystems poses significant threats to aquatic biota; yet, species-level information on the presence of MPs in Indian riverine ecosystems is scarce. This study assessed 220 fish samples from twelve species and various trophic levels for MP ingestion, organ-level accumulation, polymer type, and ecological risk at four locations along the River Yamuna in India. MPs were detected in all the studied species and organs, indicating their widespread distribution across various ecological habitats and trophic levels. A total of 1,678 MPs were quantified, which were significantly higher in fish from urban Delhi compared to upstream regions. The gastrointestinal tract had the highest MP concentrations (751), followed by gills (605) and muscle tissues (322), thus confirming ingestion as the primary route of MP uptake and their subsequent translocation into internal organs. Fibers dominated the MP community (>78%), with transparent (44%) and blue (19.5%) particles being the most abundant. ATR-FTIR analysis revealed the presence of ten different polymers, with polyethylene (≈24%) and polypropylene (≈21%) contributing to approximately 45% of MPs. Significant organ-level correlations (r/ρ = 0.635-0.958) and spatial variability (Kruskal-Wallis, H = 11.03, p = 0.011) indicated coordinated MP accumulation influenced by urban pollution. The Polymer Hazard Index analysis revealed a high PHI value (Category IV), mainly contributed by the widespread distribution of highly toxic polymers such as polycarbonate and polyimide.
Keywords:
microplastics
; river
; freshwater fish
; ecological risk
; trophic guilds
; MP distribution pattern
1. Introduction
In today’s contemporary age, reliance on plastic products has become indispensable owing to their sturdiness, affordability, durability and ease of handling. Hence, plastic pollution has tremendously increased over the last 80 years, leading to the production of about 413.8 million tons of plastic products globally (Houssini et al., 2025; Rhodes, 2018). The extensive use of these materials is largely attributed to their favourable physico-chemical properties such as resilience, thermostability, and maintaining hygienic standards across diverse environmental conditions (Yarahmadi et al., 2024).
Microplastics (MPs), defined as the miniscule (<5 mm) plastic particles which are persistent and ubiquitous in the environment (Emenike et al., 2023; NOAA, 2024). These are broadly classified into two distinct categories: primary microplastics, which are intentionally manufactured by the plastic and cosmetic industries to be incorporated in their products as microbeads in cosmetics, plastic pellets for the industrial uses, and secondary microplastics, which form when larger plastic items get broken down due to fragmentation, UV-degradation, waves action, synthetic fibres shed from textiles (Ziani et al., 2023). Despite their size, they are widespread across terrestrial, aquatic and even atmospheric environments, posing hazardous threats to the organisms through unintentional inhalation, ingestion, and bioaccumulation, which in turn points to the fact that, these tiny menaces have reached the different levels of food web (Nguyen et al., 2023). The evidence indicates that rivers function as major conduits for the transport of plastic debris from terrestrial to marine ecosystems (Thushari & Senevirathna, 2020). Microplastic pollution is progressively being documented as serious potential threat to many biotic communities (Navarro et al., 2023; Yuan et al., 2022). Numerous studies have indicated that MP ingestion could pose substantial health risks to different fish species, including genotoxicity effects in Danio rerio (Ren et al., 2025), Cyprinus carpio (Menezes et al., 2024), as well as pronounced inflammation responses in Oreochromis niloticus (König Kardgar et al., 2024), histopathological alteration in Clarias gariepinus (Soliman et al., 2023), Oncorhynchus mykiss (Jakubowska et al., 2022), neurotoxic effects in zebrafish (Buzenchi Proca et al., 2024; Rojoni et al., 2024) and Japanese medaka (Oryzias latipes) (Banaee et al., 2025). MP contamination also disrupt antioxidant ability in Cyprinus carpio, Carassius auratus and reproductive performance in zebrafish, tilapia and common carp (Li et al., 2023; Osman et al., 2023; Sadique et al., 2025), imbalance reactive oxygen species (ROS), damages cellular components like proteins, DNA, and mitochondrial functions (Cui et al., 2025; Kadac-Czapska et al., 2024).
MPs uptake in fish primarily occurs through direct ingestion, wherein the fish might mistake MPs for their prey/food, as they mimic the shape, size and colour of the natural prey or through non-selective filtering of water and sediments by omnivorous and filter feeder fishes. These ingestion patterns are strongly influenced by the fish’s trophic level and feeding ecology (Matavos-Aramyan, 2024). The filter feeders and omnivorous fish species often exhibit the highest MP ingestion rates due to their broad dietary spectrum, frequent interaction with suspended particulates and benthic detritus, whereas predator species primarily acquire MPs via trophic transfer from contaminated prey, leading to progressive accumulation along food web (Fraissinet et al., 2024; Setälä et al., 2016). Furthermore, environmental factors such as urbanization could lead to overall MP burden in fish populations (Jolaosho et al., 2025). The dietary exposure to polylactic acid microplastics (PLA-MPs) caused retardations in growth, haemato-physiological indices, mineral composition and nutrient digestibility in the fingerlings of Labeo rohita (Rashid et al., 2025). Also, the controlled exposure of MPs in freshwater fishes (Danio rerio, Perca fluviatilis, Ctenopharyngodon Idella, Oryzias latipes, Oncorhynchus mykiss, Cyprinus carpio) could even induce biochemical, physiological and behavioural changes disruptions in fish (Parker et al., 2021).
Globally, freshwater fish represent one of the most diverse vertebrate groups, with more than 19,000 species documented (Xu et al., 2024), while India alone harbours over 1,239 freshwater fish species, (Jayasankar, 2018). India is now the second largest aquaculture producer worldwide (FAO Report, 2024), with aquaculture contributing substantially to national nutrition security and yielding a per capital fish consumption of ~8-9 kg/year, a figure steadily increasing with rising protein demand. This growing dependence on fish as an affordable animal protein source elevate concern regarding MP exposure, as contaminated fish tissues represent a direct dietary pathway for human consumption. In parallel, a rapid industrialization, untreated sewage discharge, textile fiber release, packaging waste leakage and fragmented urban plastic waste have emerged as major MP-generating sources, intensifying ecological pressure on aquatic food webs.
The river Yamuna, a major tributary of river Ganga and a vital freshwater resource for northern India, flows through densely populated and industrially intensive regions, making it highly susceptible to pollution and ecological degradation. The river embodies one of the most anthropogenically stressed freshwater ecosystems in the Indian subcontinent, receiving continuous inputs from industrial effluents, storm run-off, urban wastewater drainage and legacy pollutants along its course, specially through densely populated regions (Sharma et al., 2024a). Such sustained pressure accelerates the fragmentation of macroplastics and promotes the influx of polymeric fragments, textile derived microfibers as well as other synthetic particulate debris, rendering the river Yamuna, a critical hotspot for MPs contamination. Given their multiple trophic level habitat and diverse feeding habits, freshwater fishes constitute sensitive bioindicators for tracing of MP exposure pathways within the impacted ecosystems. The present study therefore strategically selected 12 different ecologically and taxonomically distinct fish species (n=220) inhabiting different zones of the river to examine species- specific MP ingestion, retention and organ-level accumulation patterns. In order to provide a thorough understanding of how ecological characteristics affect microplastic uptake and retention across the river’s pollution gradient, these species were purposefully chosen in accordance with their varied feeding guilds (herbivores, insectivores, carnivores, omnivores and detrivores) and trophic positions.
The present study aims to generate robust baseline evidence on MP prevalence, characterization, conformation in freshwater fishes of Yamuna River and to elucidate key environmental drivers that modulate MP uptake and bioaccumulation in the food chain. This would help in advancing ecological assessment framework, which could further help in informing targeted management strategies for heavily stressed tropical river systems all over the world.
2. Materials and Methods
2.1. Fish Sampling & Collection Sites
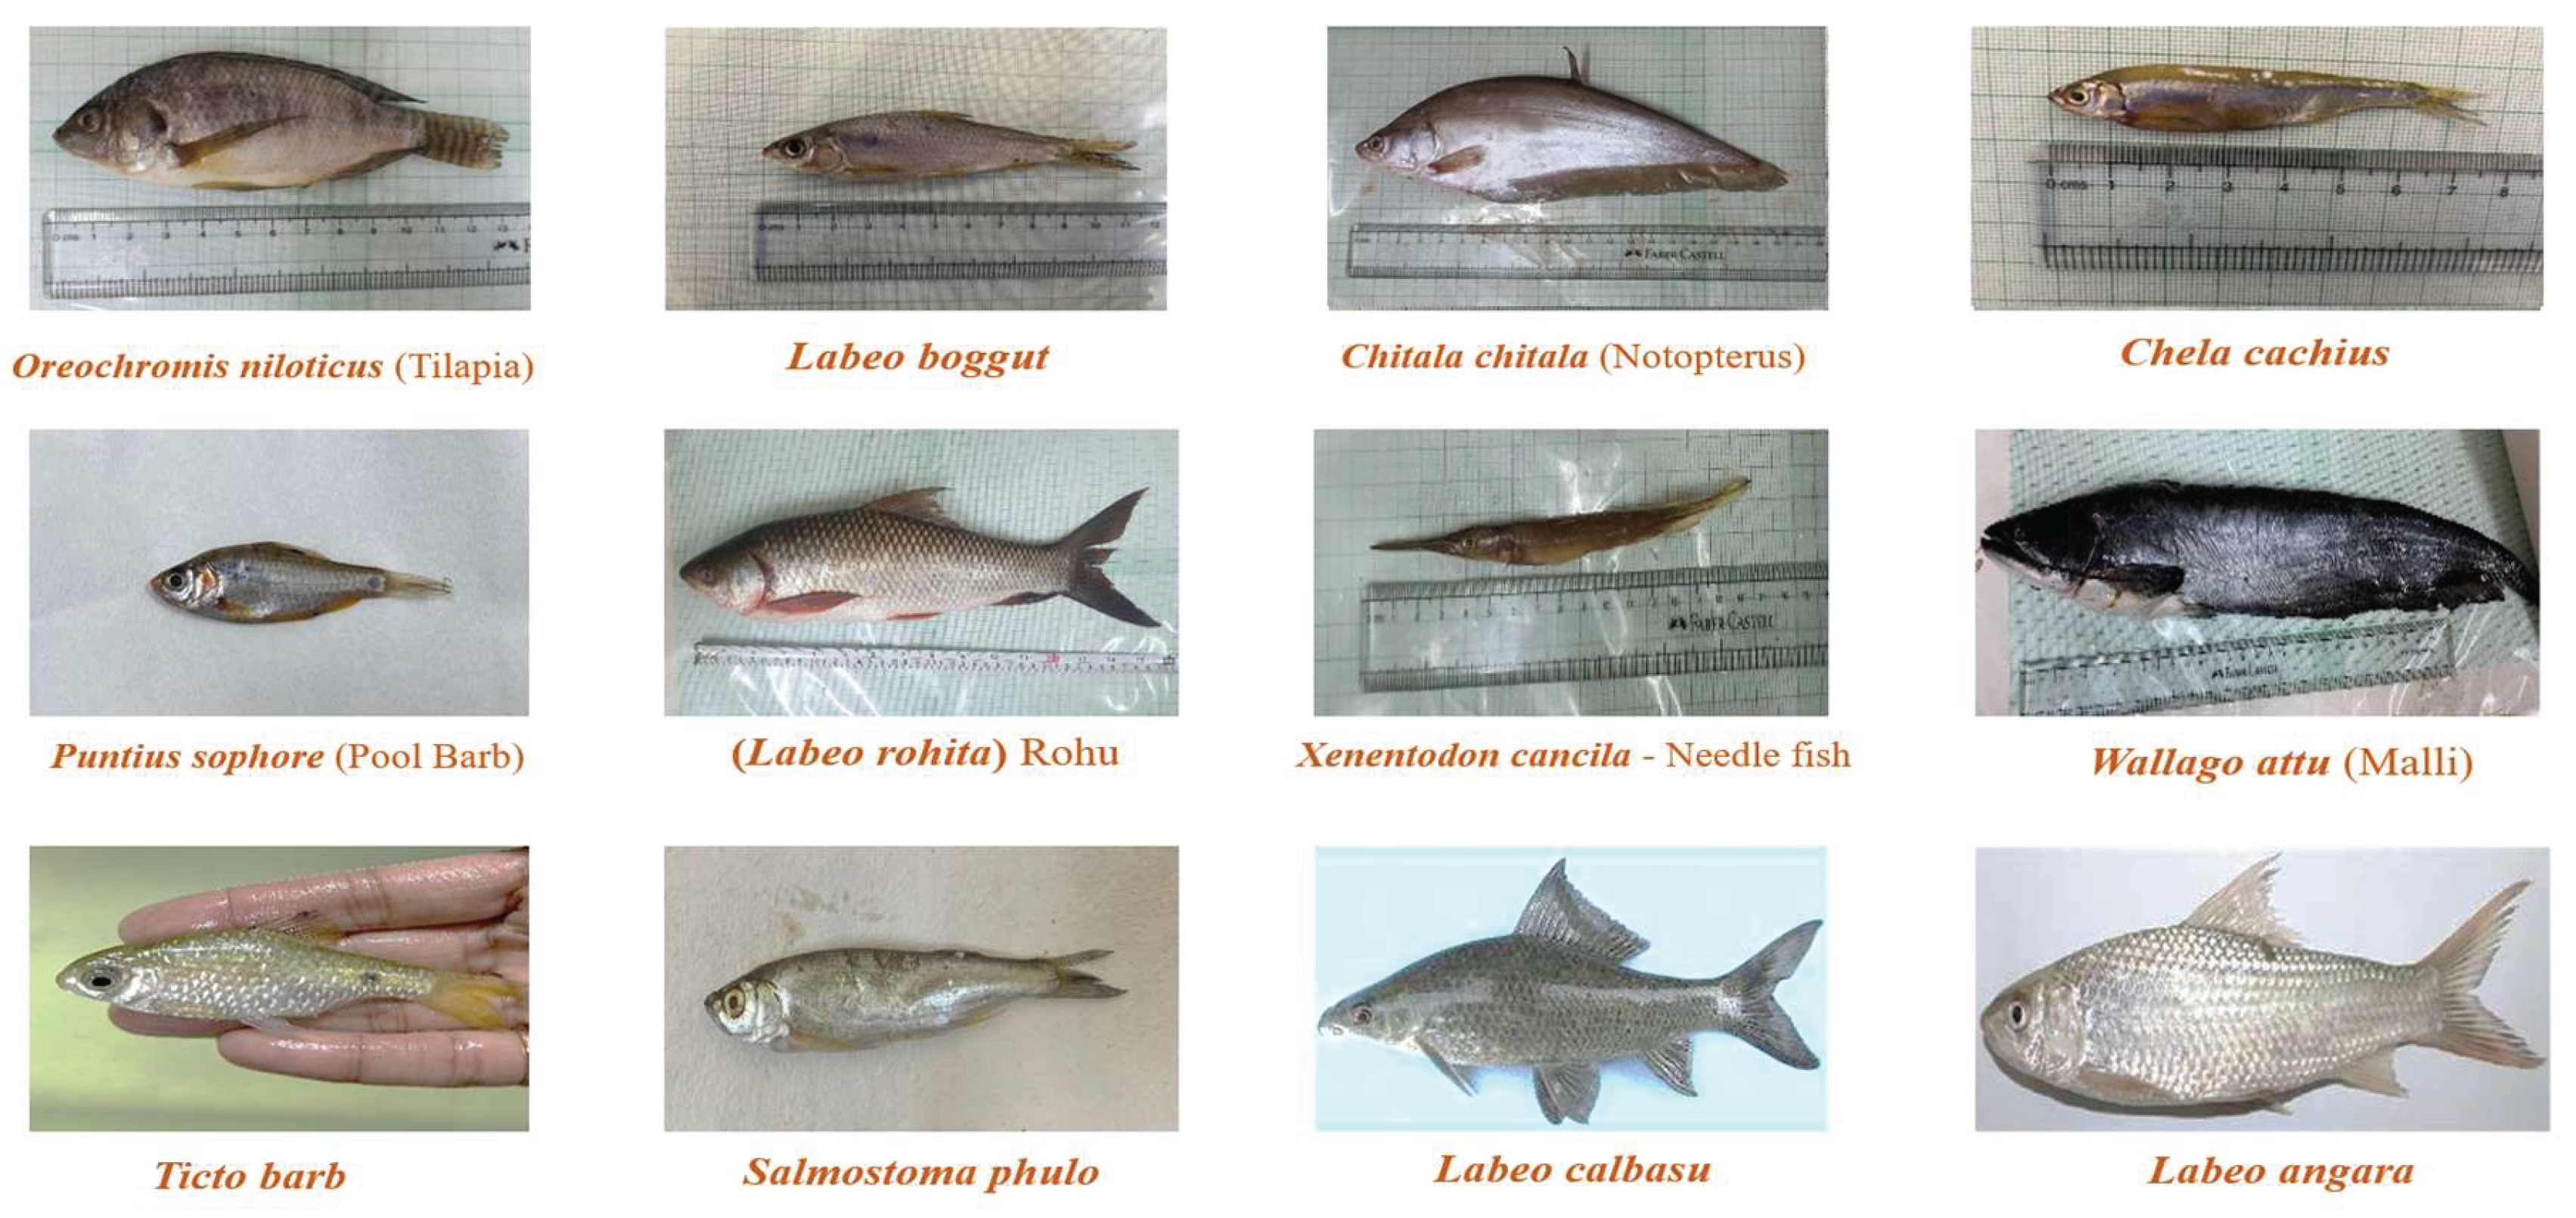
The Yamuna River is a principal tributary of the Ganga River system, originates from the Yamunotri glacier in the western Himalayan range at an elevation of approx. ~6,387 m. It extends its course (~1376 km) and drains a catchment area of nearly 3,66,000 km2 across Uttarakhand, Himachal Pradesh, Haryana, Delhi, Uttar Pradesh, encompassing diverse physiographic as well as different climatic zones which helps in shaping its hydrological regime (Nishat & Singh, 2018). Geographically, the river Yamuna basin lies between 28°24′-31°31′ N and 77°00′-79°48′ E. Its downstream flow experiences intensive anthropogenic pressures due to unmanaged industrial discharges, urban run-off, and untreated municipal wastewater, that is drained directly into the river (Sharma et al., 2024b). In the present investigation, a total of 12 fish species (220 individuals) (Figure 2) were collected from 4 different sampling sites (Figure 1) viz., Yamuna Nagar (YNR) and Karnal (KRN), Haryana; Sur Ghat (S), Sonia Vihar (SV), Delhi (Table 1). Comprehensive sampling was carried out in the months of February-March, 2023 and September-November, 2024, over a course of two years. The fish samples were collected and preserved as per standard protocols and placed in the ice box to be brought back to the laboratory. The fishes were then carefully placed in -20℃ deep freezer till the experimental procedures were carried out to avoid any contamination and degradation.
Figure 1.
Geographical map and pictorial images of sampling sites across river Yamuna.
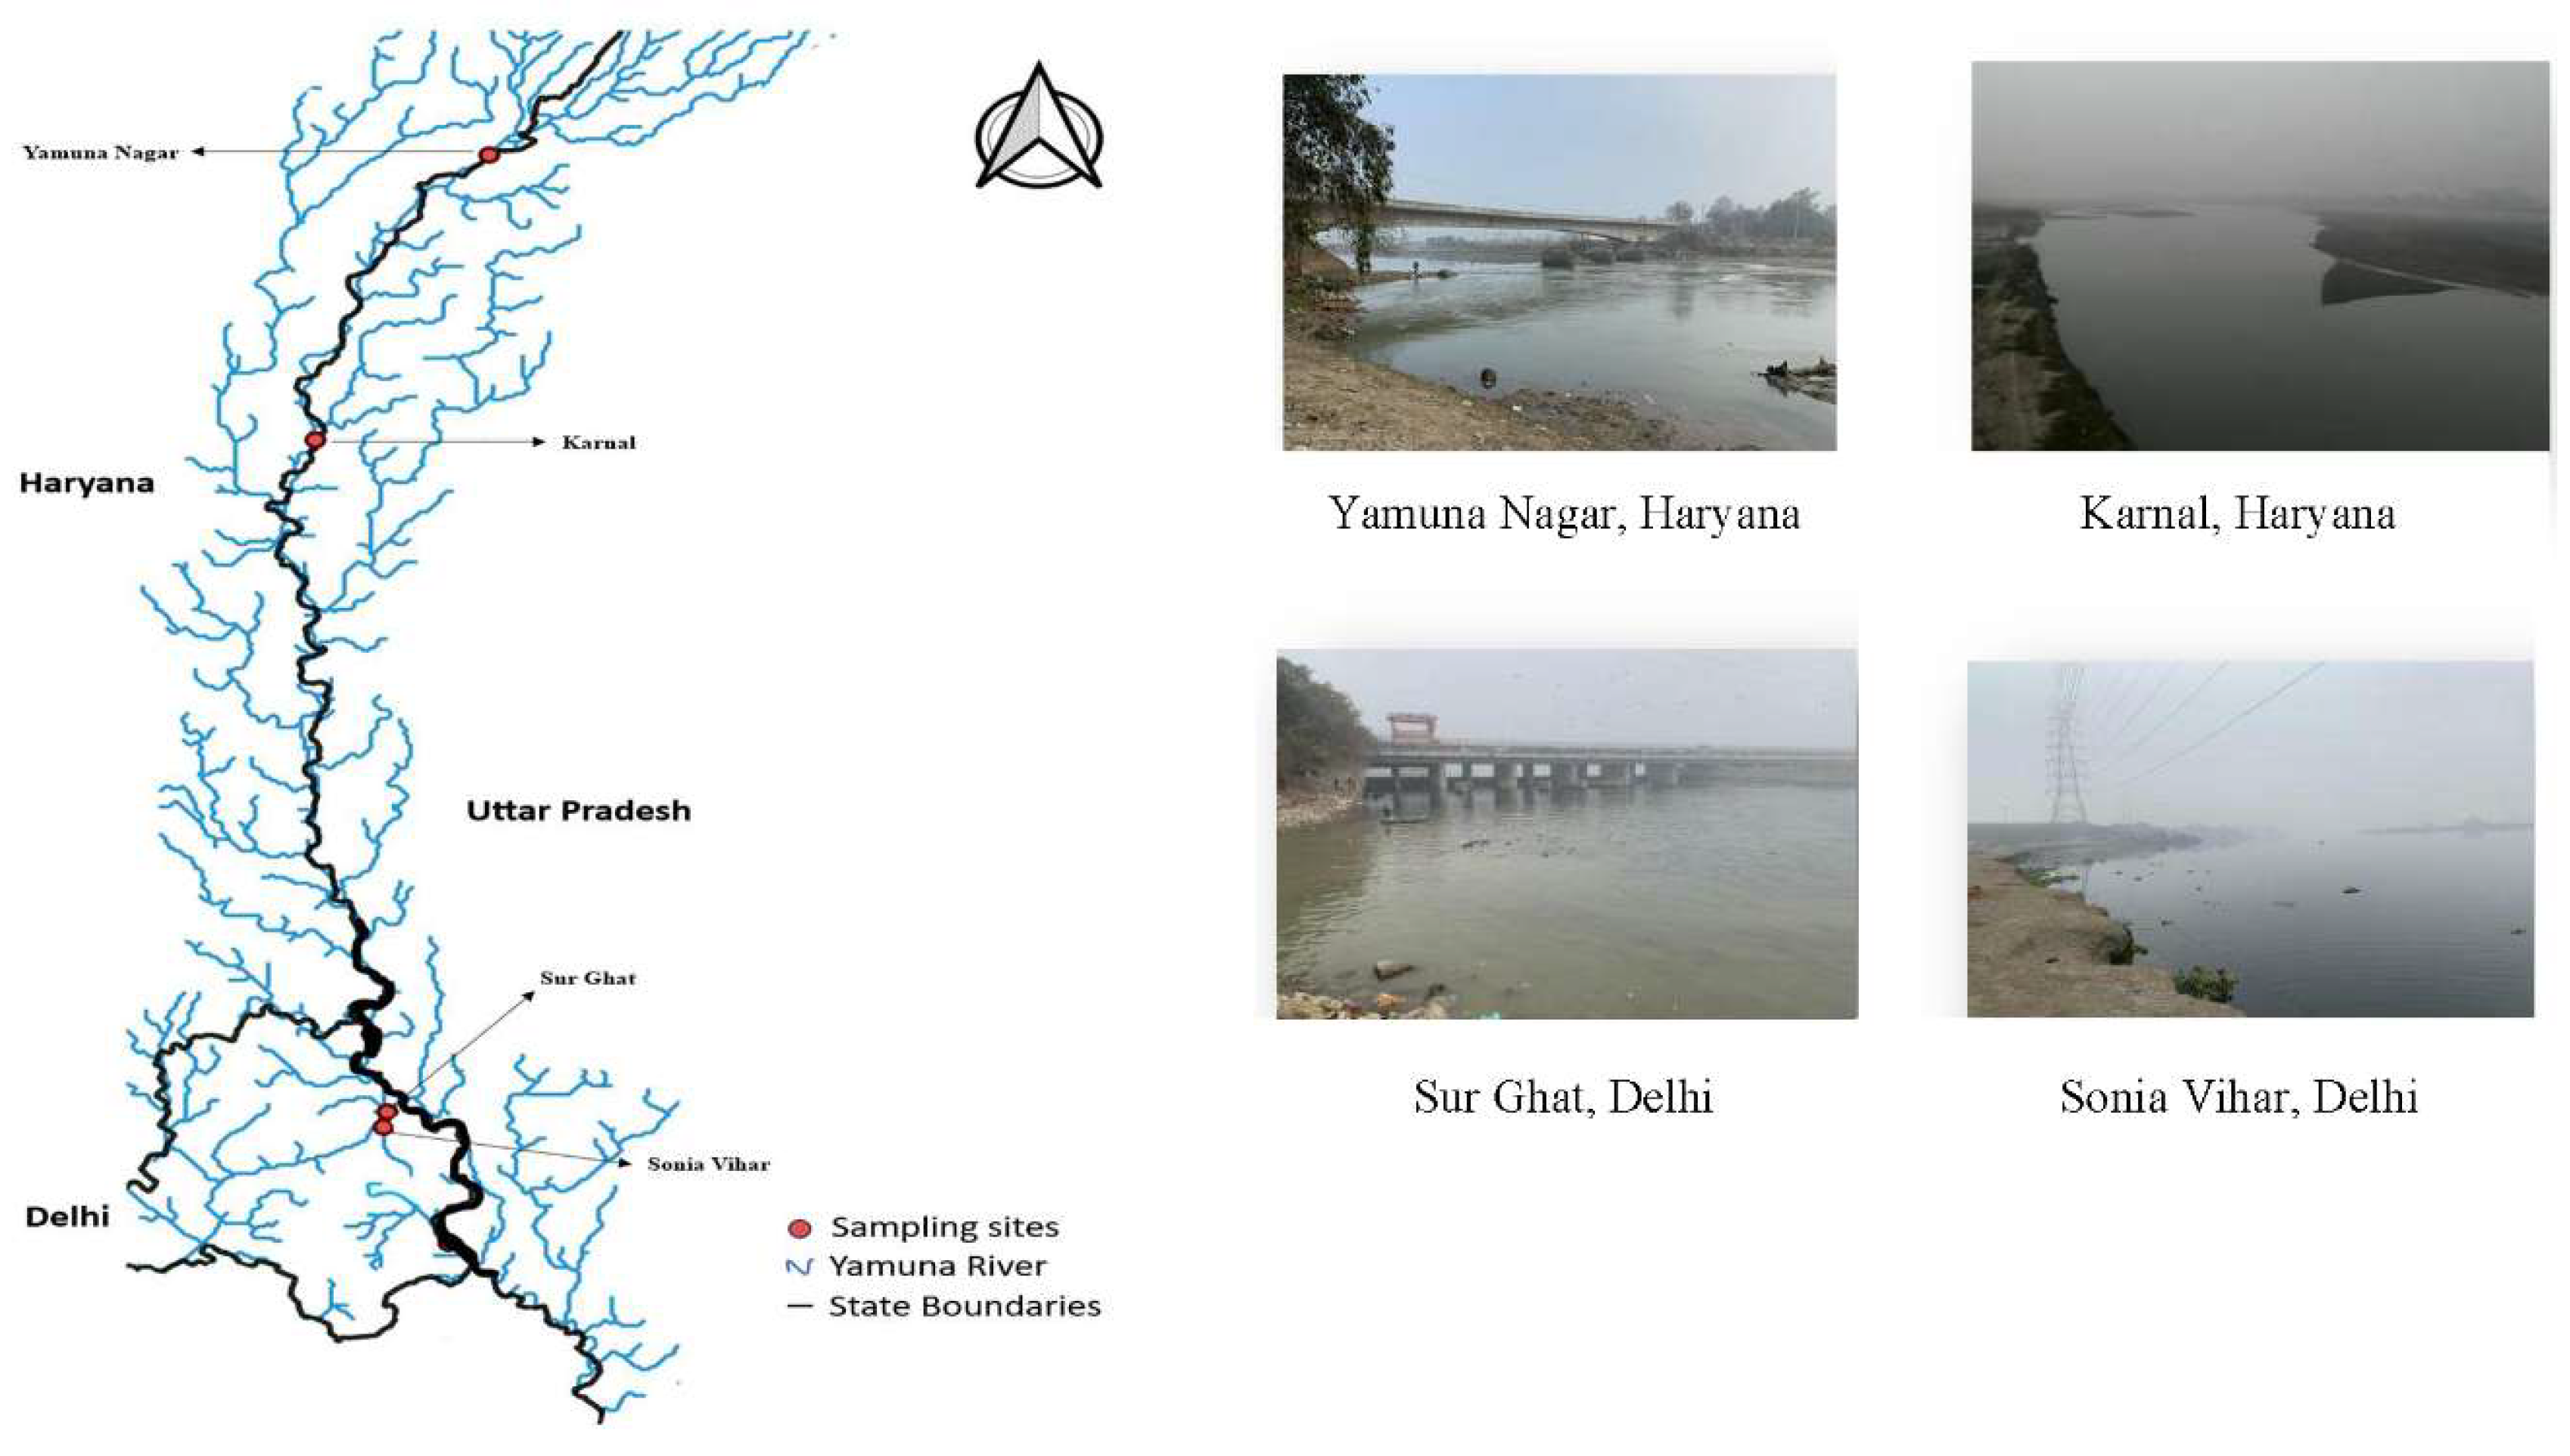
Figure 2.
Fish species collected from four different sampling sites along river Yamuna.
2.2. Wet Peroxidation Reaction: Hydrogen Peroxide (H2O2) Treatment
After defrosting, the fishes were wiped with alcohol and muslin cloth, then individuals of each fish species were measured for total length and weight. For the extraction of MPs, organs gills, gastrointestinal tract (GI tract), and muscles were dissected and placed in pre-cleaned beakers in which 30% H2O2 was added for wet peroxidation reaction (Lestari et al., 2020; Zobkov et al., 2020). Then the beakers were covered by aluminium foil to avoid any environmental contamination, kept for 24-72 hours in shaker incubator at 65℃ with 80 Rpm to ensure complete digestion of the organic matter present in the samples.
2.3. Density Separation & Filtration
The subsequent step involved density separation by adding filtered 23-25% saturated saline solution [NaCl] to each beaker and then again covered with aluminium foil. Thereafter, the beakers were kept in a clean and dry place for around 2-3 weeks to allow effectual floatation, settling as well as separation of the potential MPs based on buoyancy (Masura et al., 2015). Prolonged settling endured complete separation of low-density and high-density polymers. NaCl was used for the density separation and floatation as it has higher MPs extraction efficiency of up to 90% ( Lestari et al., 2020; Quinn et al., 2017; Dong et al., 2022). For efficient extraction of low density and high-density MPs (such as, PE, PP, PS, LDPE, HDPE & PET, PVC) protocol of Dong et al. (2020) has been employed.
2.4. Extraction and Visual Observation of Microplastics
The supernatants obtained after density separation in each beaker were subjected to vacuum filtration using glass fiber filters (Whatman GF/C Membrane Filter, 47mm diameter, 0.45µm). Borosil glass vacuum pump filtration unit was used to filter each sample separately. The filter papers were then recovered carefully with sterilized stainless-steel forceps, subsequently placed in covered glass petri plates, kept for 1-2 days in an isolated and dark place for them to dry out for further procedures. All the MPs which got accumulated on the surface of the filter papers were further analysed under Olympus SZ61 Stereo Microscope and Nikon Upright Microscope-Eclipse Ei Microscope (40-1000x) equipped with Digital Sight 1000 camera. This step is also done to help in manual quantification of the MPs present in the samples.
2.5. Characterization and Polymer Group Identification of Microplastics
MP morphotypes were classified into five different categories (fibers, fragments, microbeads, film and foam) and colours (transparent, blue, yellow, red, green, black, etc.) and were simultaneously recorded as per the guidelines (Markley et al., 2024; Zhang et al., 2020). The images were taken at various magnifications for successive identification of MPs. In addition, JEOL JSM 6610LV Scanning Electron Microscope (SEM) coupled with Energy Dispersive X-ray Analysis (EDAX), was used to detect the elemental composition and potential contaminants associated on the microplastics’ surface (Squadrone et al., 2022). For the precise visualization of surface topography enabling identification of structural deformities such as cracks, pits, scratches, fractures, tiny grooves and gouges, scanning electron microscope (SEM) was used. These surface morphologies demonstrate how the environmental processes cause plastic particles to abrasively age as well as degrade, oxidatively and mechanically (Wang et al., 2021; Zbyszewski et al., 2014). For SEM-EDAX imaging, MP particles retained on the filter membranes were carefully isolated and then mounted on aluminium stubs. The mounted samples were examined under high-vacuum conditions using SEM to obtain detailed particle surface topography and physical alterations of the MPs, such as morphological degradation patterns and elemental composition, thereby offering insights into polymer weathering, adsorption of pollutants. While, EDAX enabled elemental characterization, further supporting the assessment of surface modification and environmental interaction of the recovered MP particles.
Polymeric confirmation of the recovered MP particles was performed using Fourier Transform Infrared Spectroscopy (FTIR). Particles of the size range ~200 µm to 5 mm were analysed using a Nicolet iS50 FTIR Tri-detector equipped with a built-in diamond, in Attenuated Total Reflectance (ATR) mode. Each spectrum was acquired in the mid infrared range of 4000-400 cm-1, with 30-100 scans per sample and a spectral-resolution of around 8 cm-1. The obtained spectra were matched against the Open Specy software's known FTIR polymer reference spectral library (Cowger et al., 2021), Hummel Polymer Sample Library, FLOPP, FLOPP-e were also used to analyse and confirm FTIR peaks (De Frond et al., 2021). Polymer types were then confirmed through verification based on the characteristic absorption peaks and fingerprint regions.
2.6. Ecological Risk Assessment
Polymer Hazard Index (PHI) is an ecological risk assessment index, which quantifies the measurement which is used to rank plastic polymers based on their inherent chemical hazard, incorporating factors like persistence, toxicity and harmful monomers or additives. These pose greater risk to fish health as they often leach out toxic additives as well, which can induce oxidative stress, physiological disruption and tissue damage. Polymers like polystyrene (PS), polyvinyl chloride (PVC) archetypally exhibit higher PHI values owing to their associated carcinogenic or endocrine-disrupting components (Table 4). Whereas, polymers such as polyethylene (PE) and polypropylene (PP) fall in lower hazard categories (Lithner et al., 2011). PHI provides a comprehensive and beneficial framework for assessment of the relative risk posed by different types of polymers detected in biological or environmental samples. It also helps in contextualizing polymer-specific contamination patterns and their potential ecological implications. Therefore, identifying high-hazard polymers which are ingested by fish species is critical, so that further evaluation could point to potential toxic effects.
Herein, the PHI was calculated using the formula;
where Pn is percentage composition of a specific polymer and Sn is the hazard score which is assigned to each polymer type (Boersma et al., 2023; Lithner et al., 2011; Zhou et al., 2025). PHI was divided in 5 distinct levels, I (10, very low risk), II (10-100, low risk), III (100-1000, medium risk), IV (1000-10000, high risk) and V (> 10000, very high risk) (Nithin et al., 2022; Ranjani et al., 2021).
2.7. Quality Assessment and Control (QA/QC)
Standard laboratory and systematic QA/QC operating protocols with stringent quality controls were implemented throughout each of the experimental procedures to assure reliability and replicability of data (Amini-Birami et al., 2023). All of the glassware that were being used in experimentation were precleaned, treated with chromic acid. The glassware was then washed with filtered double distilled water and precisely wrapped with aluminium foil. With the aim of creating a procedural control, filtered double distilled water was used for the identical experimental procedure (blank/control) without adding any of the sample. Ultimately, no MP particles were detected in the blanks, indicating a low likelihood of MP contamination during sampling, pre-treatment and experimental procedures. 100% cotton/linen lab coats and clothes were worn to minimize any plastic contamination. All the chemical solutions were filtered twice to eliminate any MPs. FTIR spectra were quality-checked against certified references of polymers. Instrument calibration was undertaken regularly to guarantee precision and reproducibility in the workflow. Glass Petri plates were utilized for the storage of the filter papers securely; this petri plates were then were kept in a cool and dry place, wrapped with aluminium foil paper until the filter papers are fully dried. These comprehensive and precautionary measures ensure the legitimacy and reliability of the research findings.
2.8. Statistical Analysis
Origin 2022 was used for FTIR data and graph visualization. Fish species were classified into different ecological taxa, feeding habits and habitats as per FishBase data (Froese & Pauly, 2025). Statistical analyses were performed to investigate the correlations between MP concentrations in different fish organ systems and to assess the variance among ecological categories and sample locations. Pearson and Spearman correlation coefficients were calculated to investigate linear and monotonic relationships between MPs within the GI tract, gills, muscular tissues, and total MP load. The non-parametric Kruskal-Wallis test was conducted to examine differences in MP abundance between feeding guilds and sample sites. All the analyses were done in the standard statistical software RStudio version 4.2, JASP 0.17, and Microsoft Excel 2019, with the level of significance at p < 0.05.
3. Result & Discussions
3.1. Distribution and Abundance of Microplastics
A total of 220 fish specimens representing 12 different species were analysed to assess the distribution and abundance of MPs and data were presented in Table 2. MP abundance exhibited substantial variability among species and across sampling sites. A total of 1678 MPs particles were recorded across all examined individuals, with the highest accumulation observed in Oreochromis niloticus from Sonia Vihar, Delhi (n=20; 436 MPs), followed by O. niloticus from Surghat, Delhi (n=20; 265 MPs) and lowest abundance was detected in Xenentodon cancila from Karnal, Haryana (n=10; 37 MPs). Spatial variation in total MP abundance per fish species across sampling sites (Figure S4), showed markedly high MP loads and variability at Sonia Vihar, Delhi compared to the upstream locations.
Across all the species, MPs were most abundant in the gastrointestinal tract [~751] which confirms oral ingestion, likely through suspended MP particulates or contaminated prey, followed by the gills [~605 MPs], which might indicate the fish’s interaction with surrounding habitat through water filtration or filter feeding, active movement, respiration, foraging (Lestari et al., 2020) and was least abundant in the muscle tissues [~322 MPs], which supports the growing evidence of organ translocation across epithelial barriers via blood circulation, with implications for food safety and trophic transfer (Amini-Birami et al., 2023; Atamanalp et al., 2021). This pattern strongly indicates primary exposure through oral ingestion, either via contaminated prey or suspended particles, and secondary exposure via branchial filtration, reflecting interaction with the surrounding water column during respiration, feeding and active movement.
Among species, omnivores and herbivores from highly urbanized downstream regions exhibited the greatest MP loads. Particularly, Labeo rohita from Sonia Vihar displayed elevated accumulation (205 MPs), whereas bottom-dwelling carnivores such as Chitala chitala and Wallago attu showed comparatively lower counts: 64 MPs and 51 MPs, respectively. These differences appear to be linked with the feeding habits and habitat zones, where surface and mid-water feeders are likely to encounter high concentrations of suspended MPs than benthic species inhabiting deeper, less turbulent river sections. Spatially, downstream stretches of Delhi (Sonia Vihar and Surghat) showed the greatest microplastic loads, contributing a major proportion of total MPs detected, whereas upstream sites (Karnal and Yamuna Nagar) recorded lower abundances. This spatial gradient reflects the influence of urban wastewater discharge, textile effluents and increased suspended particulate load in Delhi’s metropolitan section.
On average, per individual fish, 44.75% MPs were detected in GI tract, 36.05% MPs in gills and 19.19% MPs in muscle tissues, confirming a consistent organ-level accumulation pattern across all examined species. Evidence of MPs in muscle tissues, although comparatively lower, suggests potential translocation across epithelial barriers, raising concerns regarding systemic distribution, cellular interaction and potential toxicological implications for fish health and food-web transfer (Amini-Birami et al., 2023; Atamanalp et al., 2021).
Conversely, the upstream sites (Karnal and Yamuna Nagar, Haryana) had left-shifted ECDFs with relatively lower MP loads and distributions, which denote lower levels of contamination pressure. The steeper slopes also denote lower levels of dispersion and higher exposure levels among the sampled population, which denotes consistent urban inputs. Taken together, the distributional trends above denote a strong spatial gradient of microplastic contamination along the Yamuna River, where the downstream urban sections denote consistent exposure hotspots.
3.2. Morphotype and Colour of Microplastics
Across all examined fish species, fibers represent the predominant microplastic (MP) morphotype in all dissected organs, accounting for more than 1,306 particles (77.8%), followed by fragments which accounted for 348 particles (20.7%). Other morphotypes occurred at much lower frequencies, including microbeads (13 MP particles, 0.77%), film (11 MP particles, 0.65%), and foam (9 MP particles, 0.53%) (Figure 4). Organ-wise analysis of MPs showed that fibers were most dominant in the GI tract (~585 particles), followed by gills (~468 particles) and muscle tissues (~253 MP particles). Fragment morphotype MPs were primarily detected in the GI tract (~142 particles) and gills (~121 particles), with comparatively less in the muscle tissues (~85 particles). Spatially, fish species collected from Delhi sampling sites (Sonia Vihar and Sur Ghat) exhibited substantially higher MP abundance and morphotypic diversity compared to the upstream sites (Karnal and Yamuna Nagar, Haryana). For example, Oreochromis niloticus from Sonia Vihar recorded 436 MPs, while the same species from Sur Ghat recorded 265 MPs, whereas upstream species such as Xenentodon cancila from Karnal contained only 37 MPs. Similarly, Puntius sophore from Sonia Vihar contained 102 MPs, compared to 45-67 MPs in fishes from upstream locations. Upstream sites consistently exhibited fewer MP morphotypes, predominantly fibers and fragments, with rare or no occurrence of film, foams or microbeads. Labeo rohita (SV), from Delhi sampling location reflected strong influences from washing effluents, unmanaged sewage discharge, textile industries and urban run-off (Agrawal, 2017; Sharma et al., 2024).
The predominance of fibers (Figure 3) across organs suggests that the major MP sources are likely associated with textile shedding, domestic washing effluents and abrasion of synthetic clothing, which are known to release large quantities of microfibers into urban wastewater streams (Chan et al., 2024; Hossain et al., 2025; Napper & Thompson, 2016). The co-occurrence of fragments, albeit in lower quantities, indicates degradation of larger plastic products, and packaging debris within the river system (Barnes et al., 2009; Gray et al., 2025; Shi et al., 2023). Notably, species collected from Delhi sites exhibited both, higher total MP loads and greater morphotype diversity (Figure 3), consistent with inputs from dense residential clusters, unmanaged waste run-off and effluents-rich drains. In contrast, upstream regions showed fewer morphotypes and lower overall abundance, reflecting reduced anthropogenic pressure and limited industrial discharge. These spatial patterns, when considered alongside morphotype prevalence, point to a strong influence of local pollution intensity and wastewater pathways in shaping the microplastic profile across the Yamuna River.
MP colour analysis revealed 13 distinct colours across the samples (Figure 3). Transparent MP particles were the most abundant (44%, ~739 particles), followed by blue particles (19.5%, ~329 particles), black (16.3%, ~275 particles), red (5%, ~84 particles), pink (4.4%, ~74 particles), white (3.8%, ~64 particles), grey (2.1%, ~35 particles), brown (1.9%, ~32 particles), amber (1.4%, ~24 particles), purple, green, orange and yellow were around (~0.7% each or less) (Figure 4). Species from Delhi sampling sites, particularly Oreochromis niloticus (SV, S), Puntius sophore (SV) and Labeo rohita (SV), exhibited widest colour diversity, whereas upstream fishes from Karnal and Yamuna Nagar were largely dominated by transparent MP particles, with minimal colour diversity.
Colour-wise investigation across organs showed that transparent MPs were the most abundant in all organ systems, representing approx. 44% of MPs in the GI tract, 42% in gills and 14% in muscle tissues (Lusher et al., 2013; P. K. Singh et al., 2025). This was followed by blue (~19-21% across all organs) and black (~15-17%), red, pink, white. and grey occurred in lower proportions ( ~6%), while brown, amber, purple, green, orange, and yellow particles together accounted for less than 5% in each of the organ analysed [Figure 4D]. Fish species from Delhi sampling sites depicted wider diversity of MP colours across all organs, whereas upstream fishes were largely dominated by transparent and blue.
Overall, this spatial contrast among both, morphotype and colour distributions reflects a clear spatial gradient, with higher MP abundance, greater morphotype diversity, and broader colour profiles in downstream and polluted Delhi sites, compared to upstream locations, due to anthropogenic pressure, as the Delhi stretch receives intense inputs from domestic wastewater, textile effluents, stormwater drains and packaging waste, a pattern consistent with documented deterioration of water quality indices (Agrawal, 2017; Sarkar et al., 2019; Sharma et al., 2024). In comparison, upstream regions showed simpler colour profiles and fewer morphotypes, indicative of reduced effluent complexity and lower urban influence.
Similar study has been carried on fishes from upper Himalayan stretch of the river Ganga exhibited an average MP abundance of 29.38 MPs/individual in the GI tract (Badola et al., 2023), Han river, Korea, 17.39 MPs/individual in the GI tract (Park et al., 2022), Meghna river in Bangladesh, had 14.63 MPs/individual in GI tract (Das et al., 2025) also, from Lake Michigan, USA, 11.5 MPs/individual (McNeish et al., 2018). Amini-Birami et al. (2023), reported that GI tract consistently contained the highest MP abundance compared to gills and muscle tissues in multiple freshwater fish species sampled from the Anzali wetland, Iran, and value ranged from 2.1-6.4 MPs in GI tract to 1.3-3.2 MPs in gills and less than 1.5 MPs in muscle tissues. Whereas, Zhou et al. (2025), detected much higher MP loads in the GI tract (3.6-9.8 MPs/individual) than in gills (2.1-5.5 MPs/individual) and less in muscle tissues (0.6-2.3 MPs/individual) from the sampled freshwater fish species inhabiting the Chishui river, China. The elevated organ-wise MP burdens reported in these studies corresponds closely with environmental MP concentrations documented in urban river systems (Table 3).
Low but persistent MP burden in fish GI tract have been consistently reported across diverse aquatic ecosystems. In several Chinese river systems, GI tract MP concentration ranged from 0.6 to 2.11 MPs per individual in the Lijiang, Dafeng and Guangdong rivers (Zhang et al., 2021; Liu et al., 2021; Sun et al., 2022). Similarly low MP load was detected in fish gills (0.7 MPs/individual), indicating continuous but moderate exposure through both ingestion and aeration.
Comparable abundance ranges have also been documented in geographically distant freshwater systems, including the Karasu river, Turkey (2.97 MPs/individual) (Atamanalp et al., 2021), Tokyo Bay, Japan (2.35 MPs/individual) and Deepor Beel, India (3.45 MPs/individual) (Saikia & Handique, 2024) and Dhaka, Bangladesh (3.05 MPs/individual) (Parvin et al., 2021). These concordant observations suggest that chronic, low level MP exposure is a pervasive feature of freshwater and estuaries fish habitats, rather than an anomaly to heavily polluted environments. In comparison, fishes examined in the present study exhibited a mean MP abundance of 7.63 MPs/individual across multiple organ systems, positioning the Yamuna River within the globally reported range for urban-impacted freshwater ecosystems.
This MP presence and retention have been linked with oxidative stress, inflammation, altered metabolism and histopathological injury in Mullus barbatus and Alosa immaculata (Atamanalp et al., 2021), adult zebrafish (Danio rerio) (Félix et al., 2023), and other freshwater fish species (Li et al., 2023; Parker et al., 2021), implying potential sub-lethal impacts for the fish species inhabiting contaminated segments. The combined morphotype and colour data, reveal that MP exposure in the Yamuna River is strongest in urbanized-downstream sites, posing risks to fish health in addition to raising concern for food-web transfer and human consumption.
3.3. Relation Between Abundance of MPs with Weight/Length of Fish Species
Across all sampling locations, clear patterns emerged between fish body size, river segment and MP accumulation. Fish samples from downstream sites in Delhi (SV and S) consistently exhibited the highest MP burdens, irrespective of their total length or weight. Oreochromis niloticus from Sonia Vihar was moderate in body size (15 ± 2 cm; 42 ± 5 g), accumulated the highest total load of 436 MPs, whereas Labeo rohita from the same site, a comparatively larger species (32 ± 3 cm; 370 ± 10 g), accumulated 205 MPs. This indicated that local pollution intensity and feeding behaviours outweighed body size effects. A similar trend was observed in Puntius sophore, where individuals from Sonia Vihar (5 ± 2 cm; 5 ± 2 g) accumulated 102 MPs, whereas conspecifics from Sur ghat accumulated only 71 MPs, despite similar sizes.
In contrast, upstream fish species from Karnal and Yamuna Nagar, despite being larger in body dimensions, had substantially lower MP load. Labeo calbasu (22 ± 1 cm; 270 ± 20 g) accumulated only 45 MPs, markedly lower than smaller downstream omnivores. Oreochromis niloticus from Sonia Vihar (15 ± 2 cm; 42 ± 5 g) recorded highest overall abundance of 436 MPs, which therefore suggests that body mass is not the sole predictor in explaining MP accumulation, rather, it seems to be an interactive function of the two parameters. Many large-sized upstream fish species, such as Labeo angra from Yamuna Nagar (25 ± 1 cm; 250 ± 20 g; 67 MPs) and Labeo calbasu at Karnal (22 ± 1 cm; 270 ± 20 g; 45 MPs), showed far lower MP particle loads compared to the smaller or comparably sized species from sampling sites of Delhi, indicating the overriding effect of pollution intensity. Overall, the length of sampled fish ranged between 5-34 cm, and MP loads varied between 37 and 436 MP particles, with larger fish from less polluted upstream sites often showed lower concentration than smaller fish from polluted sites. This pattern has been also been reported in other freshwater fish species along pollution gradients (Parker et al., 2021; Zhou et al., 2025).
Feeding guild further modulated exposure risk as evident by the surface and mid-water omnivores (O. niloticus, P. sophore, L. rohita) consistently exhibiting highest MP accumulation, whereas benthic carnivores and detrivores (Chitala chitala, Wallago attu, Labeo angra) showed lower burdens, even when larger in size [Figure 4B]. Differences in the MP abundance among the feeding guilds were comparatively feebler than spatial variations as illustrated in Figure S3. This aligns with observations that broad dietary breadth and frequent interaction with suspended particulates increase ingestion likelihood (Fraissinet et al., 2024; Setälä et al., 2016). Thus, body size alone did not predict MP abundance, but rather the combination of habitat exposure, feeding mode and pollution intensity at sampling sites.
Collectively, these findings indicate that fish from Delhi sites accumulated approximately 1.5-4 times more MPs than conspecifics of similar size from upstream regions, driven by higher suspended particle loads, household wastewater influx and textile-derived fibers entering the river (Agrawal, 2017; Sharma et al., 2024a). This relationship demonstrates that MP burden is an emergent property of site-specific contamination pressure and ecological traits, rather than a simple function of body length or mass. The resulting variability underscores the importance of spatial gradients in MP exposure, consistent with observations from urban freshwater systems (Amini-Birami et al., 2023; Jolaosho et al., 2025; Napper et al., 2021).
The mean MP abundance recorded in the present study (7.63 MPs/individual) falls within the global range reported for freshwater fishes, and is comparable to other urban systems influenced by wastewater and textile inputs (Hossain et al., 2025; McIlwraith et al., 2019; Napper & Thompson, 2016). Higher averages have been reported from the stretch of river Ganga (29.4 MPs/individuals) and the river Han, Korea (17.39 MPs/individual), whereas considerably lower values occur in less contaminated rivers of China, Turkey and Assam, India (0.6-3.45 MPs/individual). Across studies (Table 3), a consistent pattern emerges; fibers dominate the MP assemblage and polymers such as PE, PP, PS and PET are common, reflecting the pervasive role of domestic effluents, laundry waste and packaging debris. The fiber dominated morphotypic profile, observed in Yamuna River fish species supports their internal presence, indicating that the Delhi stretch functions similarly to other densely populated urban rivers where wastewater-driven contamination governs MP exposure.
Smaller and moderate sized species inhabiting highly polluted regions accumulated substantially higher MP loads than the larger conspecifics from upstream sites, reinforcing the dominance of spatial pollution gradients over morphometric predictors. This pattern reflects similar findings from both freshwater and marine ecosystems, where MP ingestion has been shown to correlate more stalwartly with ambient MP availability, hydrodynamic conditions and feeding ecology than with fish size or mass (Amini-Birami et al., 2023; Napper et al., 2021). In marine ecosystems, surface and pelagic omnivores similarly exhibited elevated MP loads due to prolonged exposure to buoyant fragments and fibers within the water column, whereas piscivorous or benthic species often show lower ingestion rates despite their larger body size (Setälä et al., 2016). Puntius sophore Karnal, Haryana had 102 MPs and same species collected from Yamuna Nagar, Haryana had accumulated only 71 MPs, and Chela cachius from Sonia Vihar, Delhi (SV) had 45 MPs, whereas Sur Ghat, Delhi (SG) had higher number at around 82 MPs in total. Species-specific feeding traits further modulated MP accumulation, where omnivores and mid-water feeder fishes Oreochromis niloticus, Puntius sophore, and Labeo calbasu showed higher MP loads than benthic-carnivores as well as detritivores. This disproportionately high MP load in Oreochromis niloticus from SV, Delhi compared to its moderate body size, points toward a higher exposure risk for surface and mid-water omnivores in the regions receiving heavy domestic, wastewater and industrial discharges. The fiber-dominated MP profiles and prevalence of common consumer polymers (PE, PS, PP, PET) observed in river Yamuna fishes further underscores the role of wastewater effluents, urban runoff and laundry discharge as MP sources (Napper & Thompson, 2016), a mechanism widely reported across urban sites of the river and costal zones (Hossain et al., 2025; McIlwraith et al., 2019). Together, these findings highlight that MP bioaccumulation in fish is an emergent outcome of site-specific contamination intensity, habitat use as well as dietary breadth, rather than a linear function of body weight or length. Such spatially structured exposure to persistent pollutants emphasizes the importance of integrating pollution gradients and trophic behaviour into MP risk assessment for freshwater biota, particularly in the densely populated urban river systems like the river Yamuna.
Statistical Analysis
The Pearson and Spearman correlation analysis revealed strong positive correlations between MP concentrations in GI tract, gills, muscle tissues and total MP load (r/ρ = 0.635-0.958, p < 0.001), indicating that internal distribution and MP ingestion in fish species are coordinated (Figure S2). Pearson and Spearman tests, deduced that the fish species with higher MP gut contamination presented larger MP loads in gills and muscle tissues. These relationships are further illustrated through pairwise regression analyses (Figure S5). The Kruskal-Wallis test confirmed the increased pollution in the Delhi stretch of the Yamuna River, as a significant spatial variation in MP abundance was observed across sample locations (H = 11.03, df = 3, p = 0.011). Fewer apparent changes were found among the feeding guilds, showing that MP accumulation seems more affected by the site-specific levels of pollution and less affected by their dietary habits. The ECDF-based assessment supports the pragmatic spatial differences in the MPs abundance (Figure S1), in agreement with the significant sampling site-wise variations detected by the Kruskal-Wallis test.
The empirical cumulative distribution functions [ECDFs] were employed to investigate site-wise differences in the total number of microplastics per fish (Figure S1). The ECDF plots for fish species collected from the part of Delhi from the Yamuna River evidently indicate a rightward shift compared to the upstream sites, suggesting higher MP values in the fish. For instance, the ECDF plots for Sonia Vihar and Sur Ghat illustrate that more fish had higher microplastic values even at lower cumulative probabilities. In contrast to the use of central tendency measures, the characterization of the total distribution of microplastic loads instead of using only central tendency measures makes the empirical cumulative distribution function (ECDF) analysis of microplastic exposure patterns in fish populations informative. The consistent rightward displacement of the ECDF curves for Delhi locations suggests that high microplastic loads are not a rare condition in individual fish but are a widespread phenomenon in the majority of fish in the river stretches.
3.4. Surface Screening of Microplastics Under SEM-EDAX
SEM-EDAX analysis confirmed a strong carbon-rich peak, identifying their synthetic plastic-polymer origin (Figure 5) (Wang et al., 2021). Significant oxygen levels indicated surface oxidation and photo-degradation of environmentally exposed microplastics (Ter Halle et al., 2017). Detection of Na and Cl in several spectra attributed to surface-adhered environmental salts rather than polymer-bound halogens like PVC while, Si and Al peaks suggested the adhesion of silicate minerals and sediments, and elevated nitrogen (N) levels may indicate the presence of amide-based polymers or biological residues from microbial biofilms (Figure 5). Oxidized surfaces could reveal prolonged exposure to sunlight and reactive oxygen species (ROS), while nitrogenous and silicate attachments suggest concurrent interactions with biofilms and sediments. These modifications can affect buoyancy, enhance MP particle adhesion, and increase their potential for ingestion through both feeding, or respiration (Lagarde et al., 2016; Rummel et al., 2017).
SEM-EDAX confirmed the carbon-rich composition of these particles, but due to the inability to differentiate specific polymer classes complementarily spectroscopic validation was done. FTIR analysis was employed to identify the polymers conclusively, showing PE, PP, PET, PA, and other common consumer plastics. Similar methodological integration of FTIR and SEM-EDAX has been widely adopted in MP studies to distinguish between the polymer composition and environmentally induced surface modifications and degradation (Primpke et al., 2018). As for the elemental signatures determined, these observations on the enrichment of oxygen, incorporation of nitrogen, and mineral-associated elements like silicon and aluminium are taken in line with observations of environmentally aged MPs that have undergone oxidative weathering, biofilm colonization, and sediment interaction in aquatic environments (Fotopoulou & Karapanagioti, 2012; Kaiser et al., 2017; Rochman et al., 2016). Such surface modifications have been shown to alter particle density, surface charge, and hydrophobicity; these in turn, affect buoyancy, residing time in the water column, and biological availability of microplastics to aquatic organisms (Kooi et al., 2017). Furthermore, biofilm-coated and mineral-encrusted microplastics are more known to enhance adhesion to gill epithelia and digestive tissues, thereby increasing the probability of uptake via both feeding and respiratory pathways (Horn et al., 2021; Keller et al., 2019; Rummel et al., 2017). Collectively, these findings indicate that fish in the Yamuna River are exposed not only to pristine plastics but to environmentally transformed and chemically reactive MPs, whose altered surface properties reflect extended environmental residence and intricate physicochemical interactions. Such weathered microplastics are increasingly recognized as more biologically interactive and potentially more toxic than virgin particles. This emphasizes their ecological relevance within freshwater systems, impacted by urban and wastewater-derived pollution (Amini-Birami et al., 2023; Napper et al., 2021).
3.5. Identification and Confirmation of Microplastic Polymer Using FTIR
Fourier Transform Infrared Spectroscopy equipped with Attenuated Total Reflection (ATR-FTIR) analysis spectra of selected MPs were analysed to identify polymer types. The spectra collected over mid-infrared range (400-4000 cm-1) and compared with the reference spectra from Open Specy software (Cowger et al., 2021), Hummel Polymer Sample Library, FLOPP, FLOPP-e, confirmed ten distinct types of polymers, dominated by common consumer plastics, viz., Polyethylene (PE) ~23% and polypropylene (PP) ~22%, followed by poly(ethylene terephthalate) (PET) ~19% and polystyrene (PS) ~14%. Less but measurable percentage fractions comprised of polyamides (PA) ~6%, Nylon-6 ~4%, poly(vinyl) acetate (PVAc) ~4%, polycarbonate (PC) ~4%, polyimide (PI) ~3%, and trace amounts of polysiloxanes ~1% (Figure 6). The predominance of PE, PP, PS and PET reflect widespread use and environmental persistence (Andrady, 2011; Geyer et al., 2017), while the detection of polymers such as PA, PC and PI, typically associated with industrial or specialized applications, suggesting multiple and diverse MP pollution sources (Eriksen et al., 2014; Horton et al., 2017). The minor presence of polymers like polysiloxanes highlights the complexity of MP inputs and the need for source tracking approaches. Cumulatively, this polymeric diversity underscores the importance of polymer-specific risk assessments rather than reliance on bulk MP counts alone.
Spectra corresponding to PE exhibited the diagnostic vibrational bands including strong aliphatic C-H stretching peaks at ~2915 cm-1 asymmetric and ~2848 cm-1 symmetric, a prominent CH2 bending at ~1465 cm-1 and distinctive CH2 rocking vibration near ~720-730 cm-1, these four bands form the unique fingerprint of polyethylene (PE) (Figure 6). Also, PP showed characteristic aliphatic C-H stretching vibrations at around ~2950-2840 cm-1 and CH3 bending modes around 1455-1375 cm-1, along with strong rocking and wagging modes in 900-800 cm-1 region. PET polymer was confirmed by a strong ester (C=O) stretching peak near 1715-1730 cm-1, accompanied by a prominent aromatic carbon (C=C) vibrations (~1600-1500 cm-1) and multiple C-O stretching bands between 1240-1100 cm-1. PS was confirmed by pronounced aromatic carbon overtones and C-H out-of-plane blending near 700-750 cm-1, together with an aromatic carbon (C=C) stretching in the 1600-1500 cm-1 region. Two different spectra, PA and Nylon-6, showed characteristic N-H stretching vibrations around 3300-3290 cm-1, depicted a strong amide I band at ~1650 cm-1, and a pronounced amid II band near 1540 cm-1, along with C-N stretching peaks between 1300-1200 cm-1. Whereas, PVAc was identified by its ester (C=O) peak at ~1740 cm-1 and strong C-O stretching bands. PC displayed a sharp carbonyl absorption around 1770-1740 cm-1, while PI was confirmed by symmetric and asymmetric imide carbonyl band (1770-1710 cm-1) and imide ring vibrations in the lower wavenumber region.
FTIR confirmed the polymer profile, indicates that MPs ingested by fish come mainly from widely used consumer plastic products, reflecting strong anthropogenic inputs along the studied river stretch. The dominance of PE and PP, together accounting for about half of all the identified polymers, suggests major contributions from single-use carry bags, packaging, and general household items, waste generated from municipal effluents and surface runoff. The substantial presence of PET and PS further points toward the contribution of textile fibers, single-use beverage bottles and food containers, disposable items, which is characteristic of urban waste mismanagement in densely populated areas like Sur Ghat and Sonia Vihar, Delhi. While the proportion is smaller, the detection of PAs, Nylon-6, PVAc, PC, and PI indicates contributions from fishing gear, synthetic textiles, industrial waste materials, adhesives, paint chip offs, electronic wires and parts. Consequently, this reflects shared impacts from unmanaged domestic wastewater, industrial discharge, and degradation of single- and multi-use plastic products. A broad range of polymer classes with their confirmed FTIR fingerprints suggests diverse urban and peri-urban activities with variable influx into the river, which further contributes to a heterogeneous MP burden. Overall, the distribution of various polymers agreed with the observed pollution gradient, showing the most significant contribution of urbanized downstream sections to the load of MP polymers in the aquatic environment.
3.6. Ecological Risk Assessment of Microplastics
The PHI value was calculated based on identified polymers in fish organs (GI tract, gills, muscle tissues) and showed a significantly high hazard potential of the MPs assemblage in the Yamuna River. While PE and PP represented large proportion of the polymers identified, their contribution to overall hazard index was minimal, since they had a very low intrinsic hazard score (Sn = 1). However, the fractions of high-toxicity polymers, even in small quantities, substantially raise the total hazard index load. Among these, PC, with an extremely high hazard score of Sn = 1000, was the single most dominant contributor to higher PHI, followed by PI (Sn = 100) and moderately hazardous polymers such as PET, PS, PA, and Nylon-6 with Sn = 10, collectively increasing the hazard risk profile. The cumulative PHI value was higher, which defines the polymer mixture as Hazard Category level IV (Table 4), indicating high hazard score according to (Lithner et al., 2011). This indicates that MPs associated risks are not driven merely by abundance but rather by the toxicological profiles of specific polymer types. High PHI value driven by the presence of small fractions of high-hazard polymers such as PC and PI. Thus, the composition of the high hazard polymers with greater capacities to leach toxic additives, absorb persistent pollutants and induce oxidative or inflammatory responses in these fish species suggests considerable ecological and possible human health risks, underlining the need for polymer-specific regulatory attention and special prioritization of high-hazard polymers in environmental monitoring and mitigation strategies. These results emphasize the need for polymer-specific risk assessment frameworks as well as targeted regulatory strategies that prioritize the bio-monitoring and mitigation of high-hazard polymers, rather than focusing solely on overall microplastic abundance.
4. Conclusion
This study establishes that MP contamination in the river Yamuna is both pervasive and biologically consequential, affecting every examined fish species irrespective of trophic position, habitat preference, or ecological strategy. Species from the urbanized Delhi stretch consistently exhibited the highest MP burdens, demonstrating that local pollution intensity overwhelmingly controls MP exposure in freshwater ichthyofauna. The dominance of fibers, transparent colour, the presence of multiple polymer classes including high-hazard polymers, and strong inter-organ correlations jointly reveal that MPs are not only ingested but also internalized and translocated within fish tissues, posing risks of systemic physiological stress. By integrating species-level accumulation patterns with polymer-specific hazard profiling, this study underlines microplastic pollution as an immediate ecological threat capable of impairing fish health, altering trophic interactions, and compromising food-web resilience. Distribution-based analyses further validate the sustained and population level MP exposure in fish species from urbanized Delhi stretch of the Yamuna River. These findings emphasize the urgent requirement for targeted mitigation strategies, strengthened wastewater management, and polymer-specific monitoring to protect the ecological integrity of the Yamuna River and the safety of communities reliant on its fisheries.
Environmental Implication
The high microplastic loads, dominance of environmentally persistent fibres, and occurrence of high-hazard polymers in edible freshwater fish from the Yamuna River indicate a critical environmental and public-health concern. The accumulation of MPs across trophic guilds suggests that contamination is now structurally embedded within the river’s food web, with potential repercussions for ecosystem functioning, nutrient cycling, and predator-prey dynamics. The detection of MPs in muscle tissues further highlights direct exposure risks for human consumers relying on these fish species as a protein source. Given the clear pollution gradient and the strong influence of urban wastewater and textile effluents, these findings point out the urgent need for better management of solid waste, advanced treatment of wastewater, and control of the use of plastics to reduce further ecological degradation and safeguard riverine biodiversity.
Supplementary Materials
The following supporting information can be downloaded at the website of this paper posted on Preprints.org, Supplementary Figure S1. Empirical cumulative distribution functions (ECDFs) showing site-wise variation in total microplastic abundance in freshwater fish from the Yamuna River. Supplementary Figure S2. Spearman correlation matrix depicting relationships between MP abundance in the gastrointestinal tract (GI), gills, muscle tissues, and total MP load across fish species. Supplementary Figure S3. Comparison of total microplastic abundance among different feeding guilds of freshwater fish. Supplementary Figure S4. Box-and-whisker plot depicting site-wise variation in total MP abundance per fish species collected from the Yamuna River. Supplementary Figure S5. Pair-wise relationships between MP abundance in fish organs.
Author Contributions
SS.: Conceptualization; Data curation; Formal analysis, Investigation; Methodology; Project administration; Software; Visualization; Writing - original draft; and final review & editing, PD.: Sample collection, Writing - original draft; and Writing - review & editing, AY, AA, MC:.: Writing - original draft; and Writing - review & editing, PY, TL, NS, VS and AS.: Sample collection, review & editing, RKN.: Project administration; Resources; Supervision; Funding acquisition, Validation; Writing - review. All authors have read and agreed to the published version of the manuscript.
Funding
This research received no external funding.
Institutional Review Board Statement
This work has received approval for research ethics from Committee for Control and Supervision of Experiments on Animals and Institutional Animal Ethics Committee (IAEC)-Department of Zoology, University of Delhi with the certificate no. DU/ZOOL/IAEC-R/2025/20.
Informed Consent Statement
Not applicable.
Data Availability Statement
The data presented in this study are available on request from the corresponding author.
Acknowledgments
Doctoral fellowship fundings from Council of Scientific and Industrial Research (CSIR), University Grants Commission (UGC). We also thank Faculty Research Program grant IoE University of Delhi.
Conflicts of Interest
The authors declare no conflict of interest.
References
- Agrawal, P. K. Studies on Increasing Sewage Load in River Yamuna and Its Impact on Some Common Microbes. IOSR J. Environ. Sci. Toxicol. Food Technol. 2017, 11(06), 20–22. [Google Scholar] [CrossRef]
- Amini-Birami, F.; Keshavarzi, B.; Esmaeili, H. R.; Moore, F.; Busquets, R.; Saemi-Komsari, M.; Zarei, M.; Zarandian, A. Microplastics in aquatic species of Anzali wetland: An important freshwater biodiversity hotspot in Iran. Environ. Pollut. 2023, 330, 121762. [Google Scholar] [CrossRef]
- Andrady, A. L. Microplastics in the marine environment. Mar. Pollut. Bull. 2011, 62(8), 1596–1605. [Google Scholar] [CrossRef] [PubMed]
- Atamanalp, M.; Köktürk, M.; Uçar, A.; Duyar, H. A.; Özdemir, S.; Parlak, V.; Esenbuğa, N.; Alak, G. Microplastics in Tissues (Brain, Gill, Muscle and Gastrointestinal) of Mullus barbatus and Alosa immaculata. Arch. Environ. Contam. Toxicol. 2021, 81(3), 460–469. [Google Scholar] [CrossRef] [PubMed]
- Badola, N.; Sobhan, F.; Chauhan, J. S. Microplastics in the River Ganga and its fishes: Study of a Himalayan River. Sci. Total Environ. 2023, 901, 165924. [Google Scholar] [CrossRef]
- Banaee, M.; Multisanti, C. R.; Impellitteri, F.; Piccione, G.; Faggio, C. Environmental toxicology of microplastic particles on fish: A review. Comp. Biochem. Physiol. Part C Toxicol. Pharmacol. 2025, 287, 110042. [Google Scholar] [CrossRef]
- Barnes, D. K. A.; Galgani, F.; Thompson, R. C.; Barlaz, M. Accumulation and fragmentation of plastic debris in global environments. Philos. Trans. R. Soc. B Biol. Sci. 2009, 364(1526), 1985–1998. [Google Scholar] [CrossRef]
- Bhatt, V.; Badola, N.; Chauhan, J. S. Microplastic in fishes: The first report from a Himalayan River — Alaknanda. Environ. Sci. Pollut. Res. 2023, 31(1), 1637–1643. [Google Scholar] [CrossRef] [PubMed]
- Boersma, A.; Grigoriadi, K.; Nooijens, M. G. A.; Henke, S.; Kooter, I. M.; Parker, L. A.; Dortmans, A.; Urbanus, J. H. Microplastic Index—How to Predict Microplastics Formation? Polymers 2023, 15(9), 2185. [Google Scholar] [CrossRef]
- Buzenchi Proca, T. M.; Solcan, C.; Solcan, G. Neurotoxicity of Some Environmental Pollutants to Zebrafish. Life 2024, 14(5), 640. [Google Scholar] [CrossRef]
- Chan, C. K.-M.; Lo, C. K.-Y.; Kan, C.-W. A Systematic Literature Review for Addressing Microplastic Fibre Pollution: Urgency and Opportunities. Water 2024, 16(14), 1988. [Google Scholar] [CrossRef]
- Cowger, W.; Steinmetz, Z.; Gray, A.; Munno, K.; Lynch, J.; Hapich, H.; Primpke, S.; De Frond, H.; Rochman, C.; Herodotou, O. Microplastic Spectral Classification Needs an Open Source Community: Open Specy to the Rescue! Anal. Chem. 2021, 93(21), 7543–7548. [Google Scholar] [CrossRef]
- Cui, Z.; Zhang, J.; Zhang, J.; Zhong, J.; Wu, J.; Miao, Y.; Wang, H. Microplastics (MPs) exposure impairs porcine oocyte quality by triggering oxidative stress-directed DNA damage and apoptosis with metabolomic alterations. Ecotoxicol. Environ. Saf. 2025, 300, 118461. [Google Scholar] [CrossRef]
- Das, R. S.; Mahatab Uddin, S. M.; Gündoğdu, S.; Afrin, J. K.; Jahan, N.; Abedin, Md. R. B.; Chowdhury, S.; Nahian, S. A.; Mustafa, M. G.; Siddique, M. A. M. Unveiling Microplastics in Commercial Brackish Water Fishes from the Lower Meghna River Estuary of Bangladesh. Bull. Environ. Contam. Toxicol. 2025, 114(5), 68. [Google Scholar] [CrossRef]
- De Frond, H.; Rubinovitz, R.; Rochman, C. M. μATR-FTIR Spectral Libraries of Plastic Particles (FLOPP and FLOPP-e) for the Analysis of Microplastics. Anal. Chem. 2021, 93(48), 15878–15885. [Google Scholar] [CrossRef] [PubMed]
- Dong, Y.; Bao, Q.; Gao, M.; Qiu, W.; Song, Z. A novel mechanism study of microplastic and As co-contamination on indica rice (Oryza sativa L.). J. Hazard. Mater. 2022, 421, 126694. [Google Scholar] [CrossRef] [PubMed]
- Emenike, E. C.; Okorie, C. J.; Ojeyemi, T.; Egbemhenghe, A.; Iwuozor, K. O.; Saliu, O. D.; Okoro, H. K.; Adeniyi, A. G. From oceans to dinner plates: The impact of microplastics on human health. Heliyon 2023, 9(10), e20440. [Google Scholar] [CrossRef] [PubMed]
- Eriksen, M.; Lebreton, L. C. M.; Carson, H. S.; Thiel, M.; Moore, C. J.; Borerro, J. C.; Galgani, F.; Ryan, P. G.; Reisser, J. Plastic Pollution in the World’s Oceans: More than 5 Trillion Plastic Pieces Weighing over 250,000 Tons Afloat at Sea. PLoS ONE 2014, 9(12), e111913. [Google Scholar] [CrossRef]
- FAO Report: Global fisheries and aquaculture production reaches a new record high . Newsroom. n.d. Available online: https://www.fao.org/newsroom/detail/fao-report-global-fisheries-and-aquaculture-production-reaches-a-new-record-high/en.
- Félix, L.; Carreira, P.; Peixoto, F. Effects of chronic exposure of naturally weathered microplastics on oxidative stress level, behaviour, and mitochondrial function of adult zebrafish (Danio rerio). Chemosphere 2023, 310, 136895. [Google Scholar] [CrossRef]
- Fotopoulou, K. N.; Karapanagioti, H. K. Surface properties of beached plastic pellets. Mar. Environ. Res. 2012, 81, 70–77. [Google Scholar] [CrossRef]
- Fraissinet, S.; Arduini, D.; Martines, A.; De Benedetto, G. E.; Malitesta, C.; Giangrande, A.; Rossi, S. Microplastics Uptake by Four Filter Feeders. J. Mar. Sci. Eng. 2024, 12(6), 1000. [Google Scholar] [CrossRef]
- Froese, R.; Pauly, D. FishBase; FishBase-WorldFish Center, 2025; Available online: https://www.fishbase.org/.
- Geyer, R.; Jambeck, J. R.; Law, K. L. Production, use, and fate of all plastics ever made. Sci. Adv. 2017, 3(7), e1700782. [Google Scholar] [CrossRef]
- Gray, A.; Gore, B.; Gaesser, M.; Rodriguez Sequeira, L.; Thibodeau, T.; Montgomery, A.; Purvis, S.; Ouimet, K.; Dura, T.; Mayer, K. Insights into the in-situ degradation and fragmentation of macroplastics in a low-order riverine system. Environ. Toxicol. Chem. 2025, 44(7), 2017–2028. [Google Scholar] [CrossRef]
- Horn, S.; Meunier, C. L.; Fofonova, V.; Wiltshire, K. H.; Sarker, S.; Pogoda, B.; Asmus, H. Toward Improved Model Capacities for Assessment of Climate Impacts on Coastal Bentho-Pelagic Food Webs and Ecosystem Services. Front. Mar. Sci. 2021, 8, 567266. [Google Scholar] [CrossRef]
- Horton, A. A.; Walton, A.; Spurgeon, D. J.; Lahive, E.; Svendsen, C. Microplastics in freshwater and terrestrial environments: Evaluating the current understanding to identify the knowledge gaps and future research priorities. Sci. Total Environ. 2017, 586, 127–141. [Google Scholar] [CrossRef]
- Hossain, M. I.; Zhang, Y.; Haque, A. N. M. A.; Naebe, M. Fibrous Microplastics Release from Textile Production Phases: A Brief Review of Current Challenges and Applied Research Directions. Materials 2025, 18(11), 2513. [Google Scholar] [CrossRef] [PubMed]
- Houssini, K.; Li, J.; Tan, Q. Complexities of the global plastics supply chain revealed in a trade-linked material flow analysis. Commun. Earth Environ. 2025, 6(1), 257. [Google Scholar] [CrossRef]
- Jakubowska, M.; Białowąs, M.; Stankevičiūtė, M.; Chomiczewska, A.; Jonko-Sobuś, K.; Pažusienė, J.; Hallmann, A.; Bučaitė, A.; Urban-Malinga, B. Effects of different types of primary microplastics on early life stages of rainbow trout (Oncorhynchus mykiss). Sci. Total Environ. 2022, 808, 151909. [Google Scholar] [CrossRef]
- Jayasankar, P. Present status of freshwater aquaculture in India—A review. Indian J. Fish. 2018, 65(4). [Google Scholar] [CrossRef]
- Jolaosho, T. L.; Rasaq, M. F.; Omotoye, E. V.; Araomo, O. V.; Adekoya, O. S.; Abolaji, O. Y.; Hungbo, J. J. Microplastics in freshwater and marine ecosystems: Occurrence, characterization, sources, distribution dynamics, fate, transport processes, potential mitigation strategies, and policy interventions. Ecotoxicol. Environ. Saf. 2025, 294, 118036. [Google Scholar] [CrossRef]
- Kadac-Czapska, K.; Ośko, J.; Knez, E.; Grembecka, M. Microplastics and Oxidative Stress—Current Problems and Prospects. Antioxidants 2024, 13(5), 579. [Google Scholar] [CrossRef]
- Kaiser, D.; Kowalski, N.; Waniek, J. J. Effects of biofouling on the sinking behavior of microplastics. Environ. Res. Lett. 2017, 12(12), 124003. [Google Scholar] [CrossRef]
- Keller, T.; Sandin, M.; Colombi, T.; Horn, R.; Or, D. Historical increase in agricultural machinery weights enhanced soil stress levels and adversely affected soil functioning. Soil. Tillage Res. 2019, 194, 104293. [Google Scholar] [CrossRef]
- König Kardgar, A.; Doyle, D.; Warwas, N.; Hjelleset, T.; Sundh, H.; Carney Almroth, B. Microplastics in aquaculture—Potential impacts on inflammatory processes in Nile tilapia. Heliyon 2024, 10(9), e30403. [Google Scholar] [CrossRef] [PubMed]
- Kooi, M.; van Nes, E. H.; Scheffer, M.; Koelmans, A. A. Ups and Downs in the Ocean: Effects of Biofouling on Vertical Transport of Microplastics. Environ. Sci. Technol. 2017, 51(14), 7963–7971. [Google Scholar] [CrossRef]
- Lagarde, F.; Olivier, O.; Zanella, M.; Daniel, P.; Hiard, S.; Caruso, A. Microplastic interactions with freshwater microalgae: Hetero-aggregation and changes in plastic density appear strongly dependent on polymer type. Environ. Pollut. 2016, 215, 331–339. [Google Scholar] [CrossRef]
- Lestari, P.; Trihadiningrum, Y.; Wijaya, B. A.; Yunus, K. A.; Firdaus, M. Distribution of microplastics in Surabaya River, Indonesia. Sci. Total Environ. 2020, 726, 138560. [Google Scholar] [CrossRef]
- Li, Y.; Tao, L.; Wang, Q.; Wang, F.; Li, G.; Song, M. Potential Health Impact of Microplastics: A Review of Environmental Distribution, Human Exposure, and Toxic Effects. Environ. Health 2023, 1(4), 249–257. [Google Scholar] [CrossRef] [PubMed]
- Lithner, D.; Larsson, Å.; Dave, G. Environmental and health hazard ranking and assessment of plastic polymers based on chemical composition. Sci. Total Environ. 2011, 409(18), 3309–3324. [Google Scholar] [CrossRef]
- Liu, S.; Chen, H.; Wang, J.; Su, L.; Wang, X.; Zhu, J.; Lan, W. The distribution of microplastics in water, sediment, and fish of the Dafeng River, a remote river in China. Ecotoxicol. Environ. Saf. 2021, 228, 113009. [Google Scholar] [CrossRef]
- Lusher, A. L.; McHugh, M.; Thompson, R. C. Occurrence of microplastics in the gastrointestinal tract of pelagic and demersal fish from the English Channel. Mar. Pollut. Bull. 2013, 67(1–2), 94–99. [Google Scholar] [CrossRef]
- Markley, L. A. T.; Driscoll, C. T.; Hartnett, B.; Mark, N.; Cárdenas, A. M.; Hapich, H. Guide Vis. Identif. Classif. Plast. Part. 2024. [CrossRef]
- Masura, J.; Baker, J.; Foster, G.; Arthur, C.; Herring, C. Laboratory Methods for the Analysis of Microplastics in the Marine Environment: Recommendations for quantifying synthetic particles in waters and sediments; NOAA Marine Debris Division, 2015. [Google Scholar] [CrossRef]
- Matavos-Aramyan, S. Addressing the microplastic crisis: A multifaceted approach to removal and regulation. Environ. Adv. 2024, 17, 100579. [Google Scholar] [CrossRef]
- McIlwraith, H. K.; Lin, J.; Erdle, L. M.; Mallos, N.; Diamond, M. L.; Rochman, C. M. Capturing microfibers – marketed technologies reduce microfiber emissions from washing machines. Mar. Pollut. Bull. 2019, 139, 40–45. [Google Scholar] [CrossRef] [PubMed]
- McNeish, R. E.; Kim, L. H.; Barrett, H. A.; Mason, S. A.; Kelly, J. J.; Hoellein, T. J. Microplastic in riverine fish is connected to species traits. Sci. Rep. 2018, 8(1), 11639. [Google Scholar] [CrossRef] [PubMed]
- Menezes, M.; Teixeira De Mello, F.; Ziegler, L.; Wanderley, B.; Gutiérrez, J. M.; Dias, J. D. Revealing the hidden threats: Genotoxic effects of microplastics on freshwater fish. Aquat. Toxicol. 2024, 276, 107089. [Google Scholar] [CrossRef]
- Napper, I. E.; Baroth, A.; Barrett, A. C.; Bhola, S.; Chowdhury, G. W.; Davies, B. F. R.; Duncan, E. M.; Kumar, S.; Nelms, S. E.; Hasan Niloy, M. N.; Nishat, B.; Maddalene, T.; Thompson, R. C.; Koldewey, H. The abundance and characteristics of microplastics in surface water in the transboundary Ganges River. Environ. Pollut. 2021, 274, 116348. [Google Scholar] [CrossRef] [PubMed]
- Napper, I. E.; Thompson, R. C. Release of synthetic microplastic plastic fibres from domestic washing machines: Effects of fabric type and washing conditions. Mar. Pollut. Bull. 2016, 112(1–2), 39–45. [Google Scholar] [CrossRef]
- Navarro, A.; Luzardo, O. P.; Gómez, M.; Acosta-Dacal, A.; Martínez, I.; Felipe De La Rosa, J.; Macías-Montes, A.; Suárez-Pérez, A.; Herrera, A. Microplastics ingestion and chemical pollutants in seabirds of Gran Canaria (Canary Islands, Spain). Mar. Pollut. Bull. 2023, 186, 114434. [Google Scholar] [CrossRef]
- Nguyen, M.-K.; Lin, C.; Nguyen, H.-L.; Le, V.-R.; Kl, P.; Singh, J.; Chang, S. W.; Um, M.-J.; Nguyen, D. D. Emergence of microplastics in the aquatic ecosystem and their potential effects on health risks: The insights into Vietnam. J. Environ. Manag. 2023, 344, 118499. [Google Scholar] [CrossRef]
- Nishat; Singh, D. S. The Yamuna River: Longest Tributary of Ganga. In The Indian Rivers; Singh, D. S., Ed.; Springer Singapore, 2018; pp. 123–133. [Google Scholar] [CrossRef]
- Nithin, A.; Sundaramanickam, A.; Sathish, M. Seasonal distribution of microplastics in the surface water and sediments of the Vellar estuary, Parangipettai, southeast coast of India. Mar. Pollut. Bull. 2022, 174, 113248. [Google Scholar] [CrossRef] [PubMed]
- NOAA. What are microplastics? National Ocean Service, National Oceanic and Atmospheric Administration; National Ocean Service, 16 June 2024. Available online: https://oceanservice.noaa.gov/facts/microplastics.html?utm_source=chatgpt.com.
- Osman, A. I.; Hosny, M.; Eltaweil, A. S.; Omar, S.; Elgarahy, A. M.; Farghali, M.; Yap, P.-S.; Wu, Y.-S.; Nagandran, S.; Batumalaie, K.; Gopinath, S. C. B.; John, O. D.; Sekar, M.; Saikia, T.; Karunanithi, P.; Hatta, M. H. M.; Akinyede, K. A. Microplastic sources, formation, toxicity and remediation: A review. Environ. Chem. Lett. 2023, 1–41. [Google Scholar] [CrossRef]
- Park, T.-J.; Kim, M.-K.; Lee, S.-H.; Lee, Y.-S.; Kim, M.-J.; Song, H.-Y.; Park, J.-H.; Zoh, K.-D. Occurrence and characteristics of microplastics in fish of the Han River, South Korea: Factors affecting microplastic abundance in fish. Environ. Res. 2022, 206, 112647. [Google Scholar] [CrossRef]
- Parker, B.; Andreou, D.; Green, I. D.; Britton, J. R. Microplastics in freshwater fishes: Occurrence, impacts and future perspectives. Fish. Fish. 2021, 22(3), 467–488. [Google Scholar] [CrossRef]
- Parvin, F.; Jannat, S.; Tareq, S. M. Abundance, characteristics and variation of microplastics in different freshwater fish species from Bangladesh. Sci. Total Environ. 2021, 784, 147137. [Google Scholar] [CrossRef] [PubMed]
- Primpke, S.; Wirth, M.; Lorenz, C.; Gerdts, G. Reference database design for the automated analysis of microplastic samples based on Fourier transform infrared (FTIR) spectroscopy. Anal. Bioanal. Chem. 2018, 410(21), 5131–5141. [Google Scholar] [CrossRef]
- Quinn, B.; Murphy, F.; Ewins, C. Validation of density separation for the rapid recovery of microplastics from sediment. Anal. Methods 2017, 9(9), 1491–1498. [Google Scholar] [CrossRef]
- Ranjani, M.; Veerasingam, S.; Venkatachalapathy, R.; Mugilarasan, M.; Bagaev, A.; Mukhanov, V.; Vethamony, P. Assessment of potential ecological risk of microplastics in the coastal sediments of India: A meta-analysis. Mar. Pollut. Bull. 2021, 163, 111969. [Google Scholar] [CrossRef]
- Rashid, E.; Hussain, S. M.; Sarker, P. K.; Ali, S.; Naeem, A.; Al-Ghanim, K. A. Evaluating the influence of aquatic environmental hazard, polylactic acid microplastics, on Labeo rohita. Environ. Pollut. Bioavailab. 2025, 37(1), 2467745. [Google Scholar] [CrossRef]
- Ren, T.; Yan, L.; Wang, D.; Xu, N.; Zhang, W.; Yang, M. In vivo biotoxicological assessment of nanoplastics and microplastics predicted using the zebrafish model. PeerJ 2025, 13, e19833. [Google Scholar] [CrossRef]
- Rhodes, C. J. Plastic Pollution and Potential Solutions. Sci. Prog. 2018, 101(3), 207–260. [Google Scholar] [CrossRef] [PubMed]
- Rochman, C. M.; Browne, M. A.; Underwood, A. J.; Van Franeker, J. A.; Thompson, R. C.; Amaral-Zettler, L. A. The ecological impacts of marine debris: Unraveling the demonstrated evidence from what is perceived. Ecology 2016, 97(2), 302–312. [Google Scholar] [CrossRef]
- Rojoni, S. A.; Ahmed, Md. T.; Rahman, M.; Hossain, Md. M. M.; Ali, M. S.; Haq, M. Advances of microplastics ingestion on the morphological and behavioral conditions of model zebrafish: A review. Aquat. Toxicol. 2024, 272, 106977. [Google Scholar] [CrossRef]
- Rummel, C. D.; Jahnke, A.; Gorokhova, E.; Kühnel, D.; Schmitt-Jansen, M. Impacts of Biofilm Formation on the Fate and Potential Effects of Microplastic in the Aquatic Environment. Environ. Sci. Technol. Lett. 2017, 4(7), 258–267. [Google Scholar] [CrossRef]
- Sadique, S. A.; Konarova, M.; Niu, X.; Szilagyi, I.; Nirmal, N.; Li, L. Impact of microplastics and nanoplastics on human Health: Emerging evidence and future directions. Emerg. Contam. 2025, 11(3), 100545. [Google Scholar] [CrossRef]
- Saikia, K. K.; Handique, S. Microplastics abundance and potential ecological risk assessment in sediment, water and fish of Deepor Beel—A Ramsar Wetland of the Brahmaputra plain, India. Environ. Monit. Assess. 2024, 196(10), 977. [Google Scholar] [CrossRef]
- Sarkar, D. J.; Das Sarkar, S.; Das, B. K.; Manna, R. K.; Behera, B. K.; Samanta, S. Spatial distribution of meso and microplastics in the sediments of river Ganga at eastern India. Sci. Total Environ. 2019, 694, 133712. [Google Scholar] [CrossRef] [PubMed]
- Setälä, O.; Norkko, J.; Lehtiniemi, M. Feeding type affects microplastic ingestion in a coastal invertebrate community. Mar. Pollut. Bull. 2016, 102(1), 95–101. [Google Scholar] [CrossRef]
- Sharma, M.; Rawat, S.; Kumar, D.; Awasthi, A.; Sarkar, A.; Sidola, A.; Choudhury, T.; Kotecha, K. The state of the Yamuna River: A detailed review of water quality assessment across the entire course in India. Appl. Water Sci. 2024, 14(8), 175. [Google Scholar] [CrossRef]
- Shi, H.; Frias, J.; El-Din H. Sayed, A.; De-la-Torre, G. E.; Jong, M.-C.; Uddin, S. A.; Rajaram, R.; Chavanich, S.; Najii, A.; Fernández-Severini, M. D.; Ibrahim, Y. S.; Su, L. Small plastic fragments: A bridge between large plastic debris and micro- & nano-plastics. TrAC. Trends Anal. Chem. 2023, 168, 117308. [Google Scholar] [CrossRef]
- Singh, P. K.; Singh, A.; Srivastava, A. K.; Chauhan, R.; Basniwal, R. K.; Chauhan, A. Microplastic pollution in the Ganga River: A state-of-the-art review of pathways, mechanisms, and mitigation. Water Supply 2025, 25(2), 249–267. [Google Scholar] [CrossRef]
- Soliman, H. A. M.; Salaah, S. M.; Hamed, M.; Sayed, A. E.-D. H. Toxicity of co-exposure of microplastics and lead in African catfish (Clarias gariepinus). Front. Vet. Sci. 2023, 10, 1279382. [Google Scholar] [CrossRef] [PubMed]
- Squadrone, S.; Pederiva, S.; Bezzo, T.; Sartor, R. M.; Battuello, M.; Nurra, N.; Griglione, A.; Brizio, P.; Abete, M. C. Microplastics as vectors of metals contamination in Mediterranean Sea. Environ. Sci. Pollut. Res. 2022, 29(20), 29529–29534. [Google Scholar] [CrossRef] [PubMed]
- Sun, J.; Peng, Z.; Zhu, Z.-R.; Fu, W.; Dai, X.; Ni, B.-J. The atmospheric microplastics deposition contributes to microplastic pollution in urban waters. Water Res. 2022, 225, 119116. [Google Scholar] [CrossRef] [PubMed]
- Tanaka, K.; Takada, H. Microplastic fragments and microbeads in digestive tracts of planktivorous fish from urban coastal waters. Sci. Rep. 2016, 6(1), 34351. [Google Scholar] [CrossRef]
- Ter Halle, A.; Jeanneau, L.; Martignac, M.; Jardé, E.; Pedrono, B.; Brach, L.; Gigault, J. Nanoplastic in the North Atlantic Subtropical Gyre. Environ. Sci. Technol. 2017, 51(23), 13689–13697. [Google Scholar] [CrossRef]
- Wang, Y.; Wang, X.; Li, Y.; Li, J.; Liu, Y.; Xia, S.; Zhao, J. Effects of exposure of polyethylene microplastics to air, water and soil on their adsorption behaviors for copper and tetracycline. Chem. Eng. J. 2021, 404, 126412. [Google Scholar] [CrossRef]
- Xu, M.; Li, S.; Liu, C.; Tedesco, P. A.; Dick, J. T. A.; Fang, M.; Wei, H.; Yu, F.; Shu, L.; Wang, X.; Gu, D.; Mu, X. Global freshwater fish invasion linked to the presence of closely related species. Nat. Commun. 2024, 15(1), 1411. [Google Scholar] [CrossRef]
- Yarahmadi, A.; Dousti, B.; Karami-Khorramabadi, M.; Afkhami, H. Materials based on biodegradable polymers chitosan/gelatin: A review of potential applications. Front. Bioeng. Biotechnol. 2024, 12, 1397668. [Google Scholar] [CrossRef]
- Yuan, W.; Christie-Oleza, J. A.; Xu, E. G.; Li, J.; Zhang, H.; Wang, W.; Lin, L.; Zhang, W.; Yang, Y. Environmental fate of microplastics in the world’s third-largest river: Basin-wide investigation and microplastic community analysis. Water Res. 2022, 210, 118002. [Google Scholar] [CrossRef]
- Zbyszewski, M.; Corcoran, P. L.; Hockin, A. Comparison of the distribution and degradation of plastic debris along shorelines of the Great Lakes, North America. J. Gt. Lakes Res. 2014, 40(2), 288–299. [Google Scholar] [CrossRef]
- Zhang, L.; Xie, Y.; Zhong, S.; Liu, J.; Qin, Y.; Gao, P. Microplastics in freshwater and wild fishes from Lijiang River in Guangxi, Southwest China. Sci. Total Environ. 2021, 755, 142428. [Google Scholar] [CrossRef]
- Zhang, Y.; Pu, S.; Lv, X.; Gao, Y.; Ge, L. Global trends and prospects in microplastics research: A bibliometric analysis. J. Hazard. Mater. 2020, 400, 123110. [Google Scholar] [CrossRef] [PubMed]
- Zhou, C.; Ran, M.; Wang, Z.; Li, M.; Wang, X.; Zhang, C.; Song, Z. Baseline biomonitoring of microplastic pollution in freshwater fish from the Chishui River, China: Insights into accumulation patterns and influencing factors. J. Hazard. Mater. 2025, 495, 139055. [Google Scholar] [CrossRef] [PubMed]
- Ziani, K.; Ioniță-Mîndrican, C.-B.; Mititelu, M.; Neacșu, S. M.; Negrei, C.; Moroșan, E.; Drăgănescu, D.; Preda, O.-T. Microplastics: A Real Global Threat for Environment and Food Safety: A State of the Art Review. Nutrients 2023, 15(3), 617. [Google Scholar] [CrossRef]
- Zobkov, M.; Zobkova, M.; Galakhina, N.; Efremova, T. Method for microplastics extraction from Lake sediments. MethodsX 2020, 7, 101140. [Google Scholar] [CrossRef]
Figure 3.
Microscopic images of distinct morphotypes of microplastic particles from different organs (A, B, C- GI tract; D, E, F- Muscle tissues, G, H, I- Gills) of the fish specimens.
Figure 3.
Microscopic images of distinct morphotypes of microplastic particles from different organs (A, B, C- GI tract; D, E, F- Muscle tissues, G, H, I- Gills) of the fish specimens.
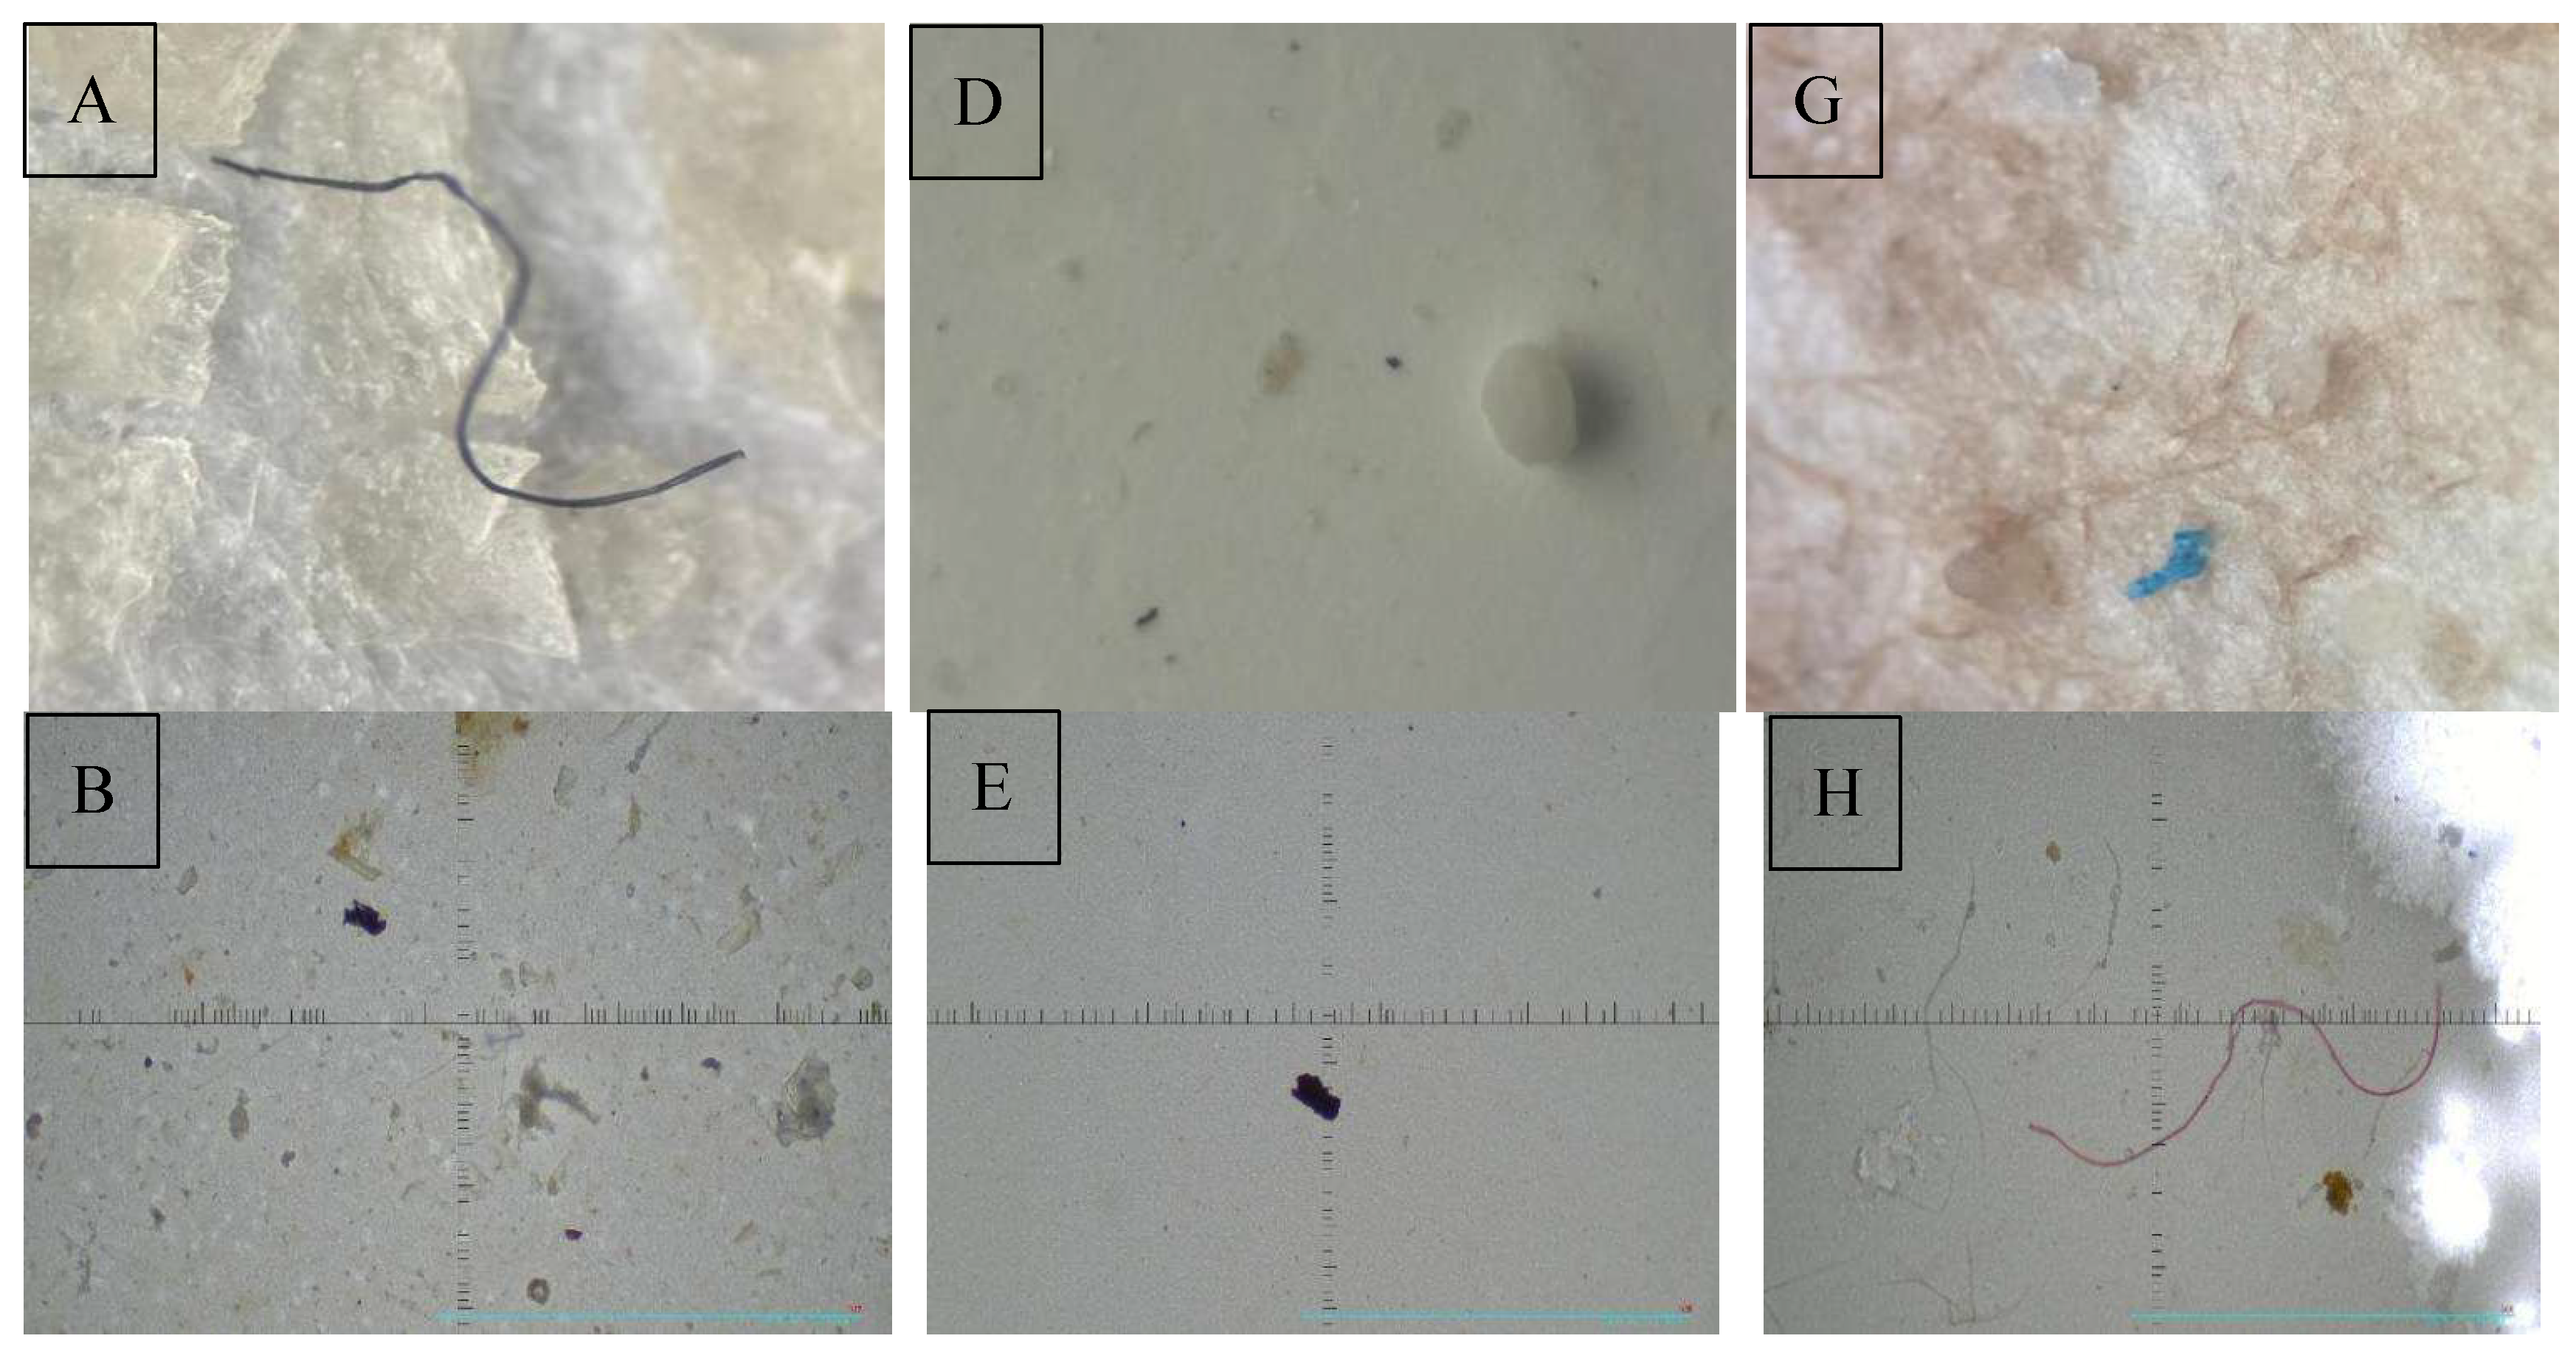
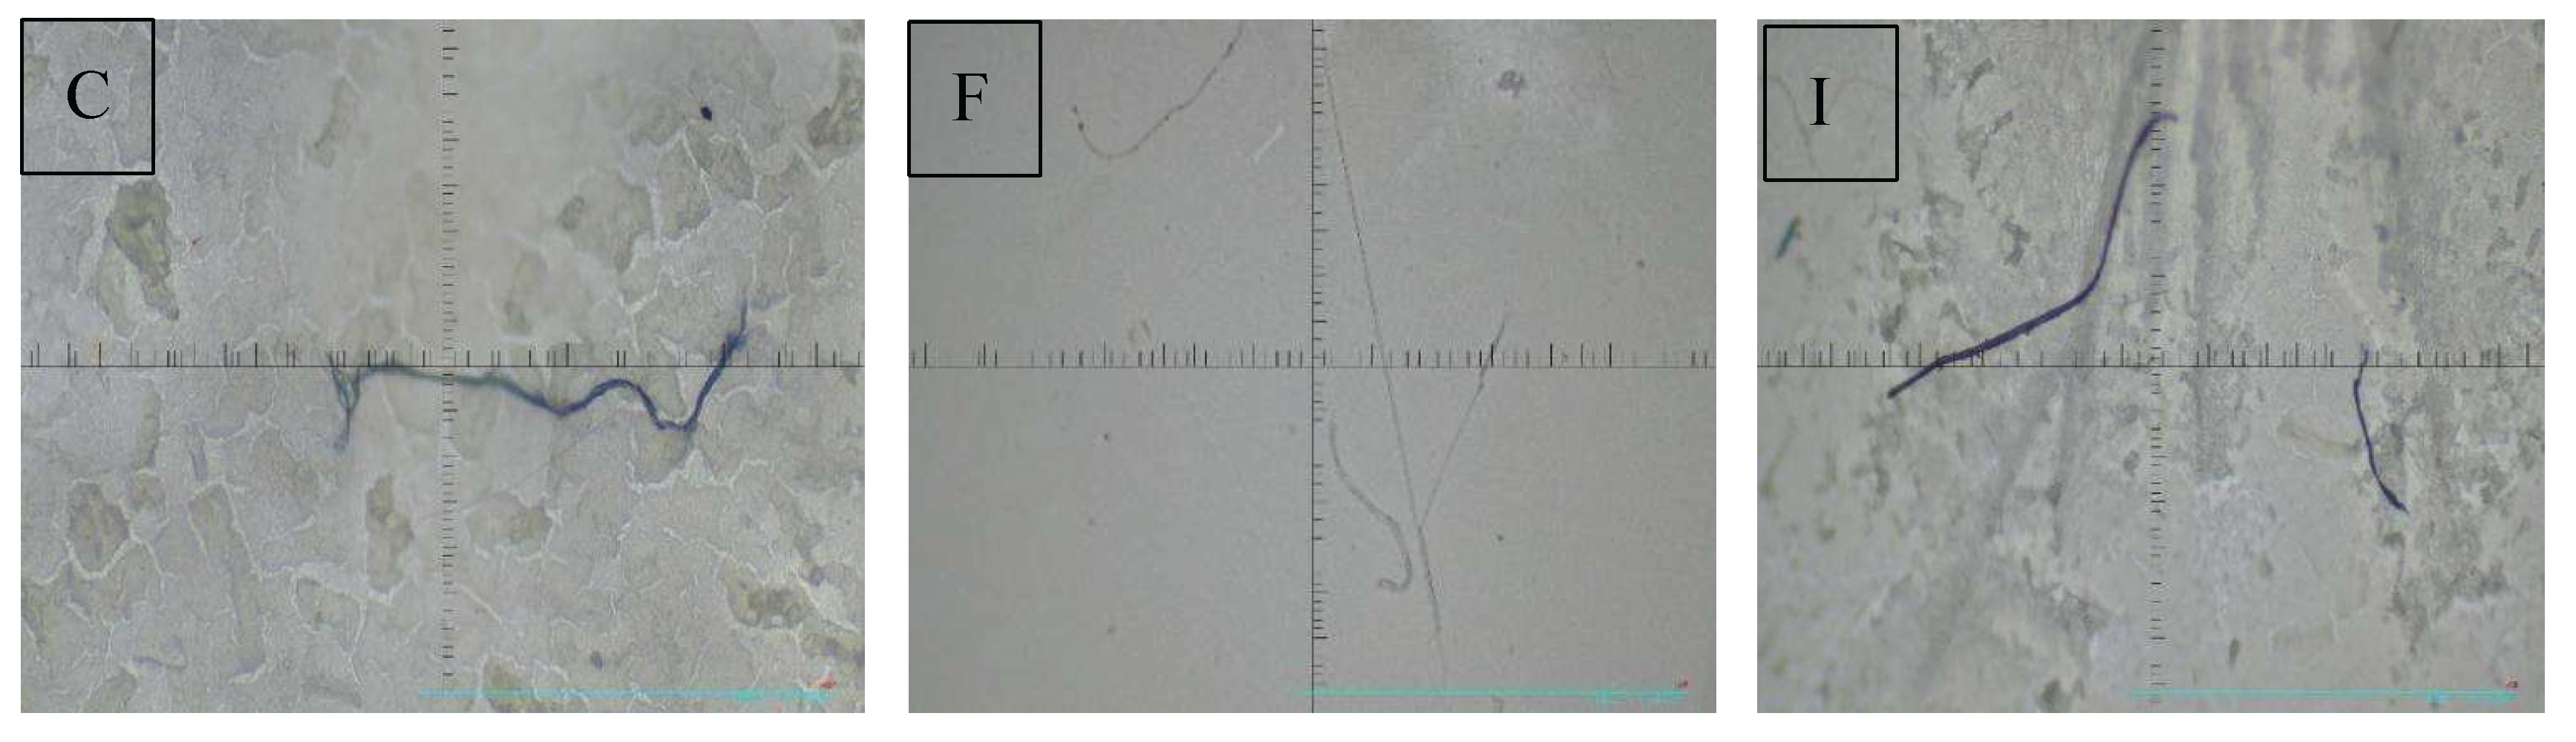
Figure 4.
(A) Abundance of microplastics per fish organ, (B) Average number of microplastics per feeding habit of fish, (C) Morphotypic composition of microplastics in different fish species, (D) Pie-chart depicting different coloured microplastics + morphotypes in fish species.
Figure 4.
(A) Abundance of microplastics per fish organ, (B) Average number of microplastics per feeding habit of fish, (C) Morphotypic composition of microplastics in different fish species, (D) Pie-chart depicting different coloured microplastics + morphotypes in fish species.
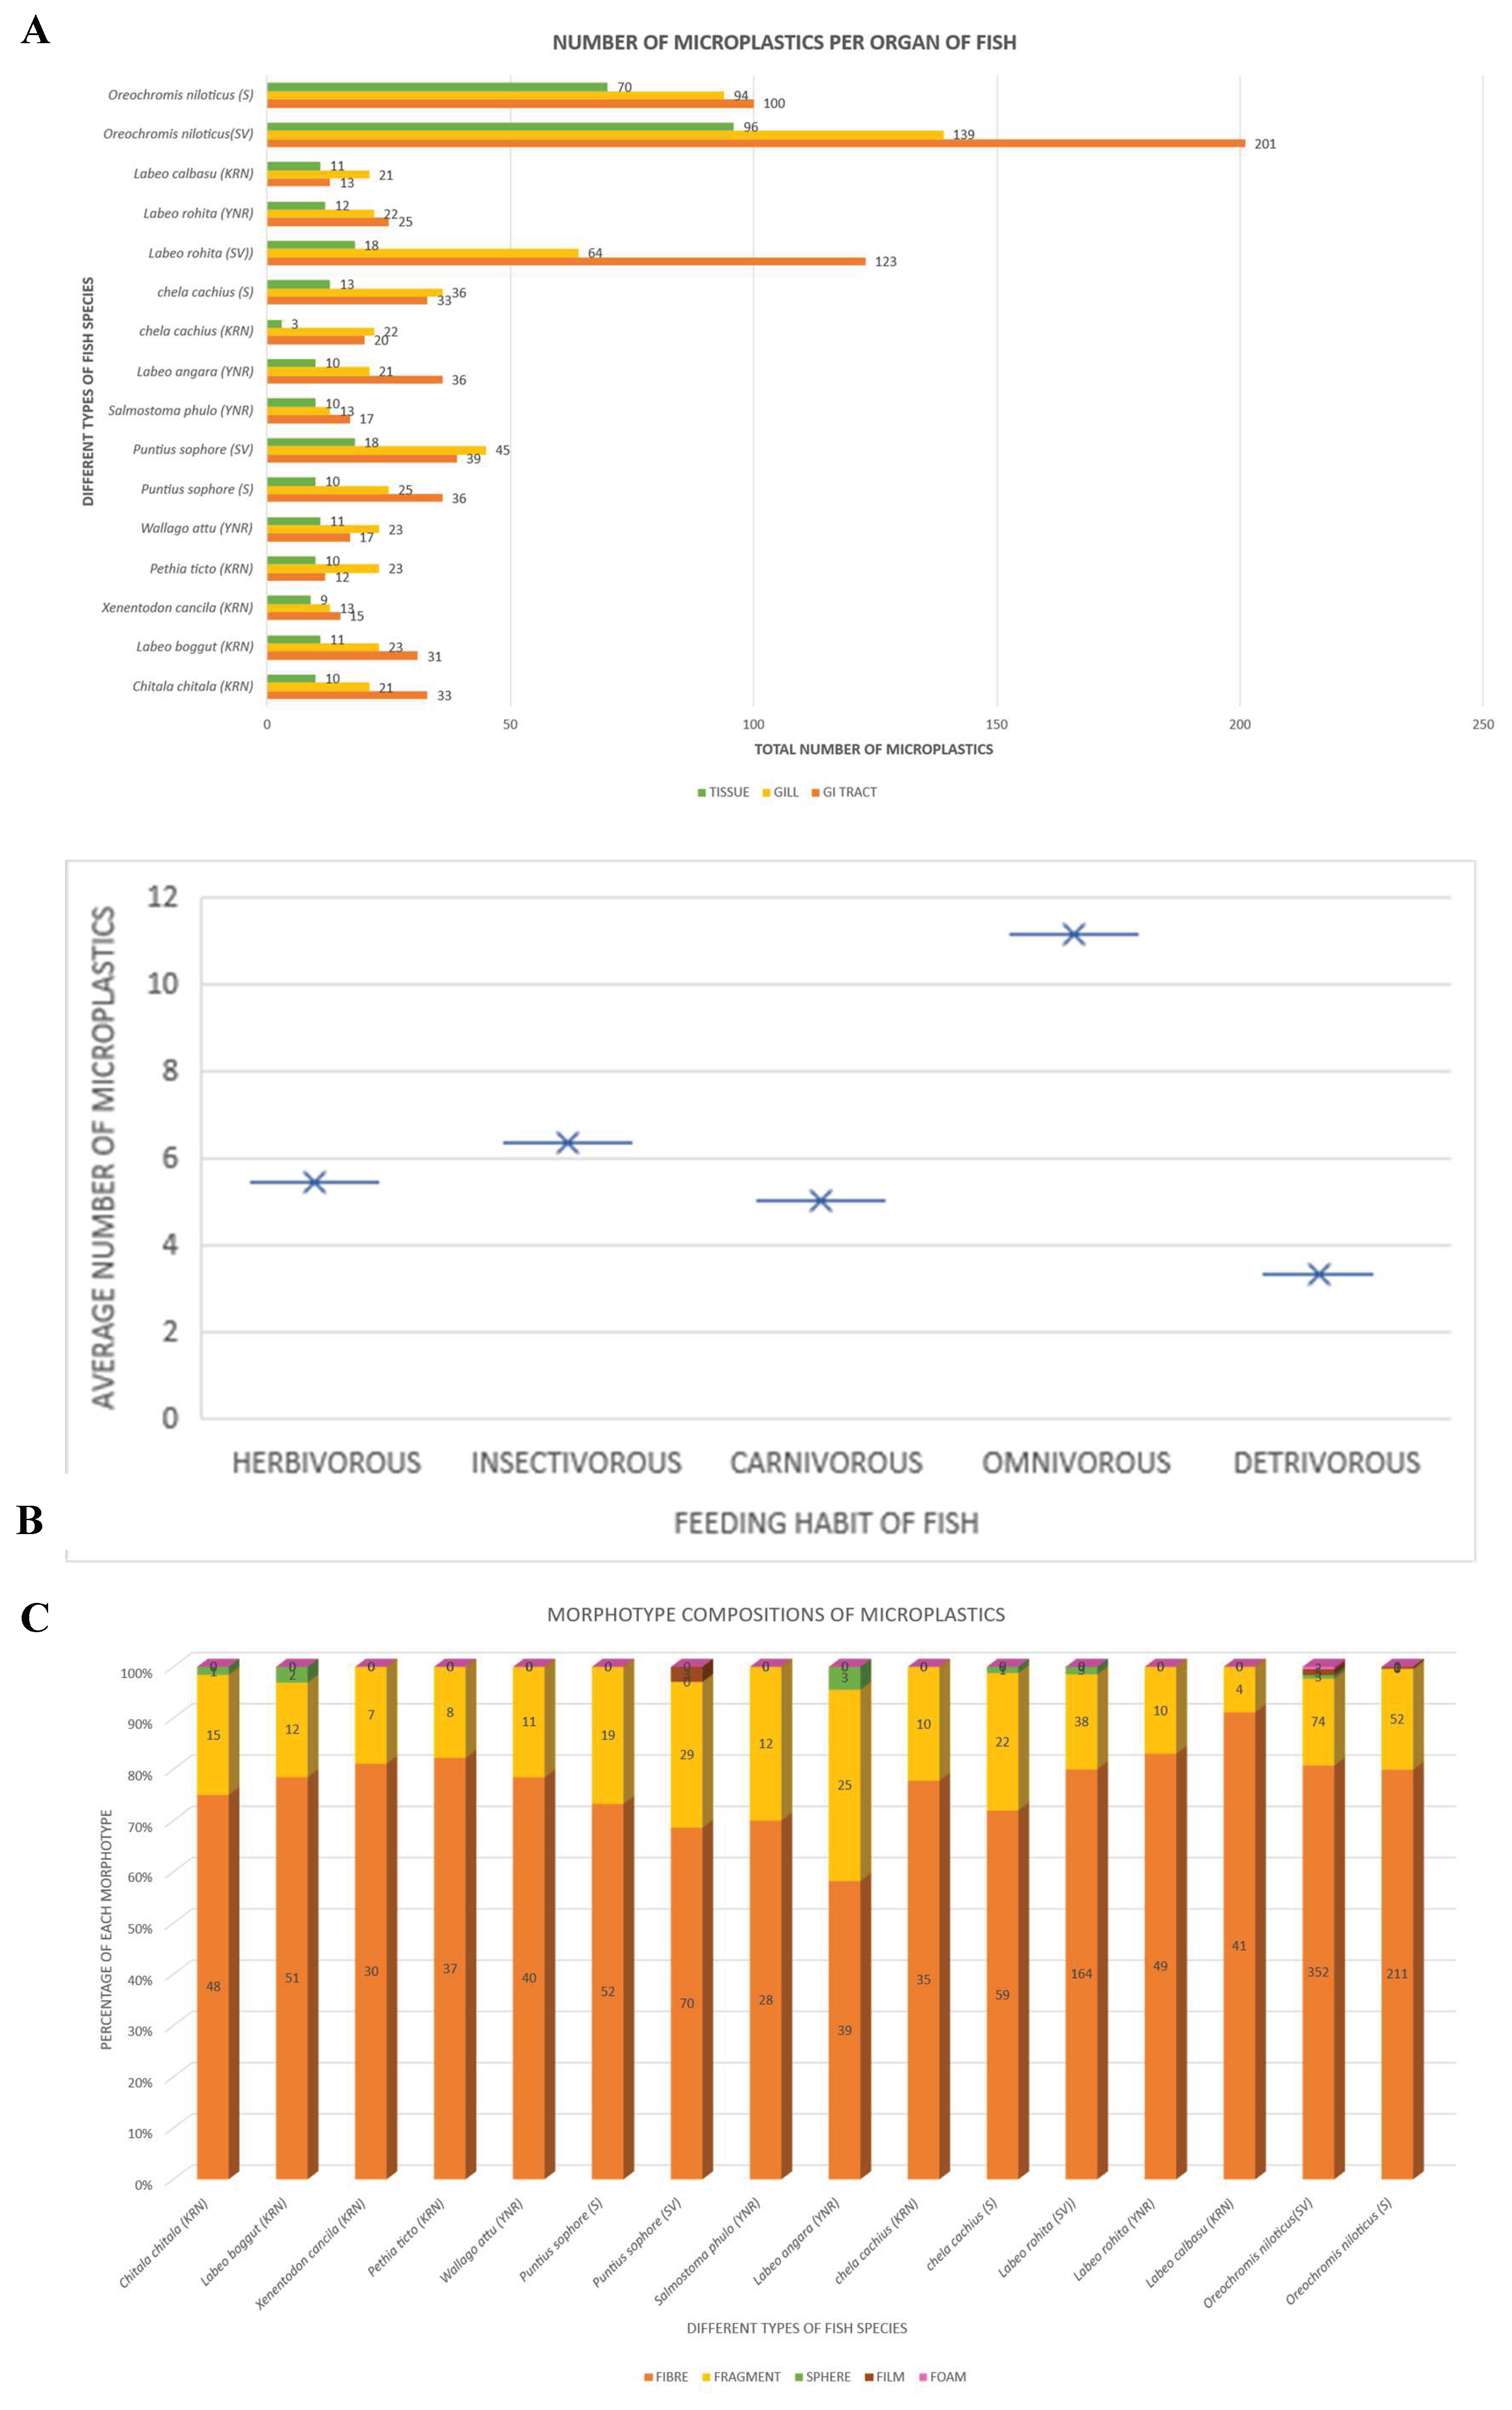
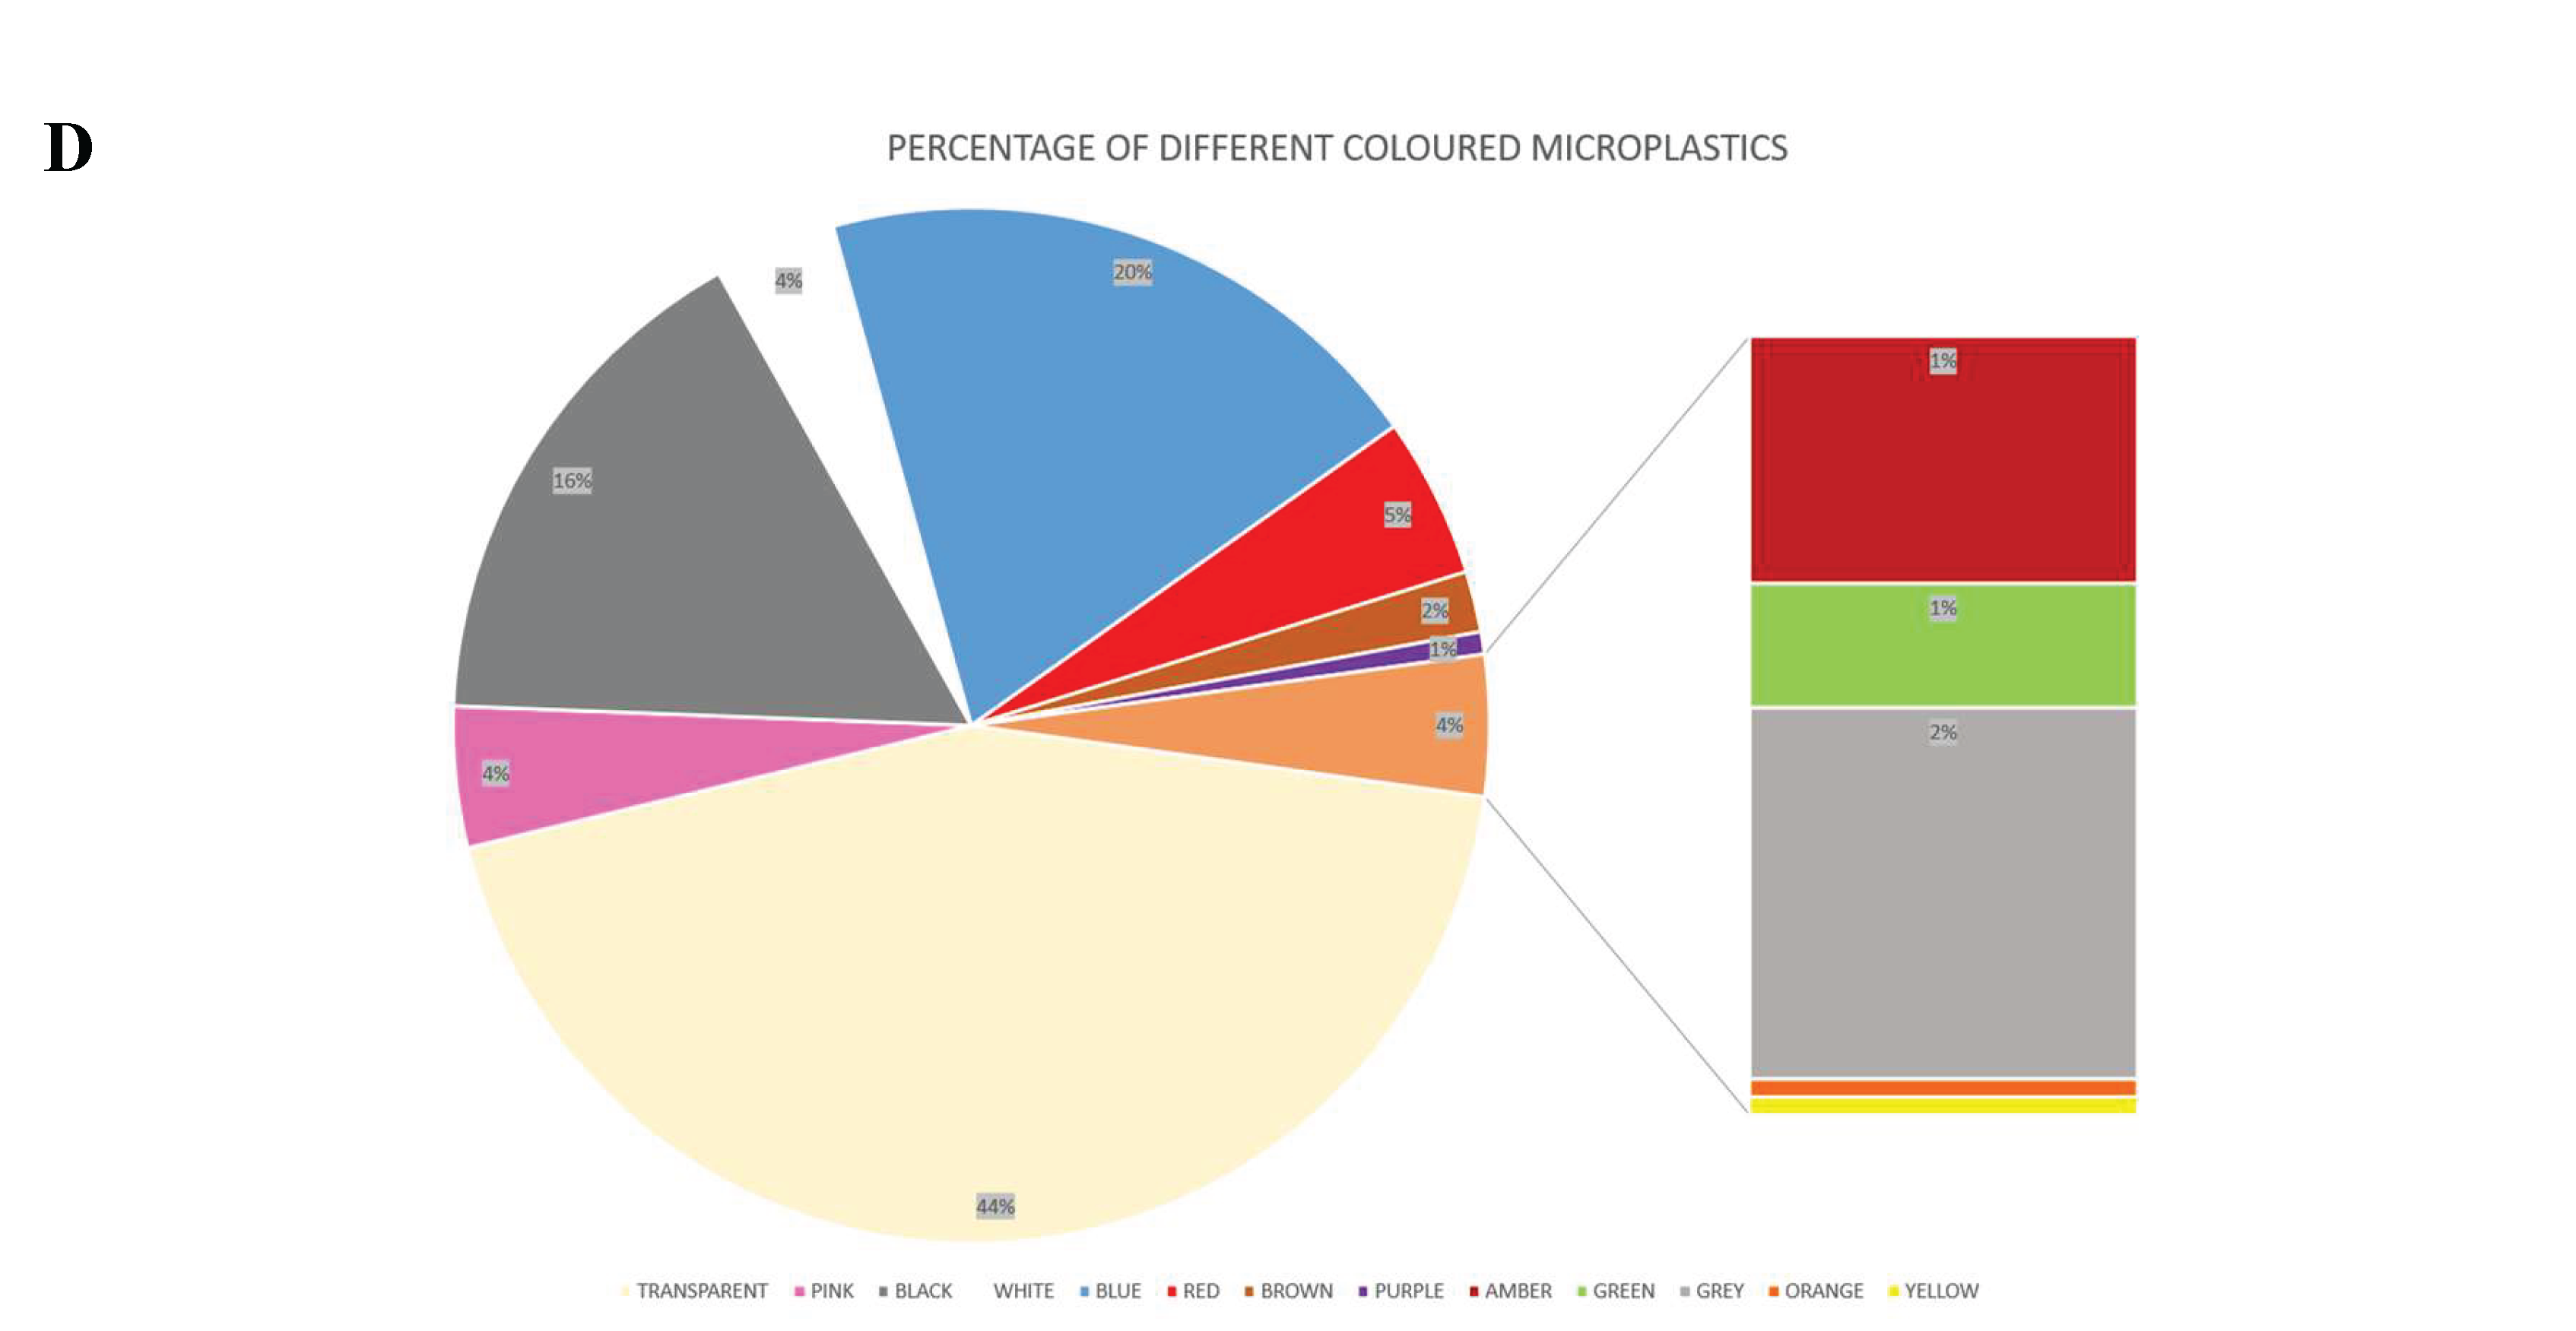
Figure 5.
SEM-EDAX images and micrographs of microplastics found in different organ systems of the fish species, showing a carbon-rich polymer surface with oxidation, showing clear signs of environmental weathering.
Figure 5.
SEM-EDAX images and micrographs of microplastics found in different organ systems of the fish species, showing a carbon-rich polymer surface with oxidation, showing clear signs of environmental weathering.
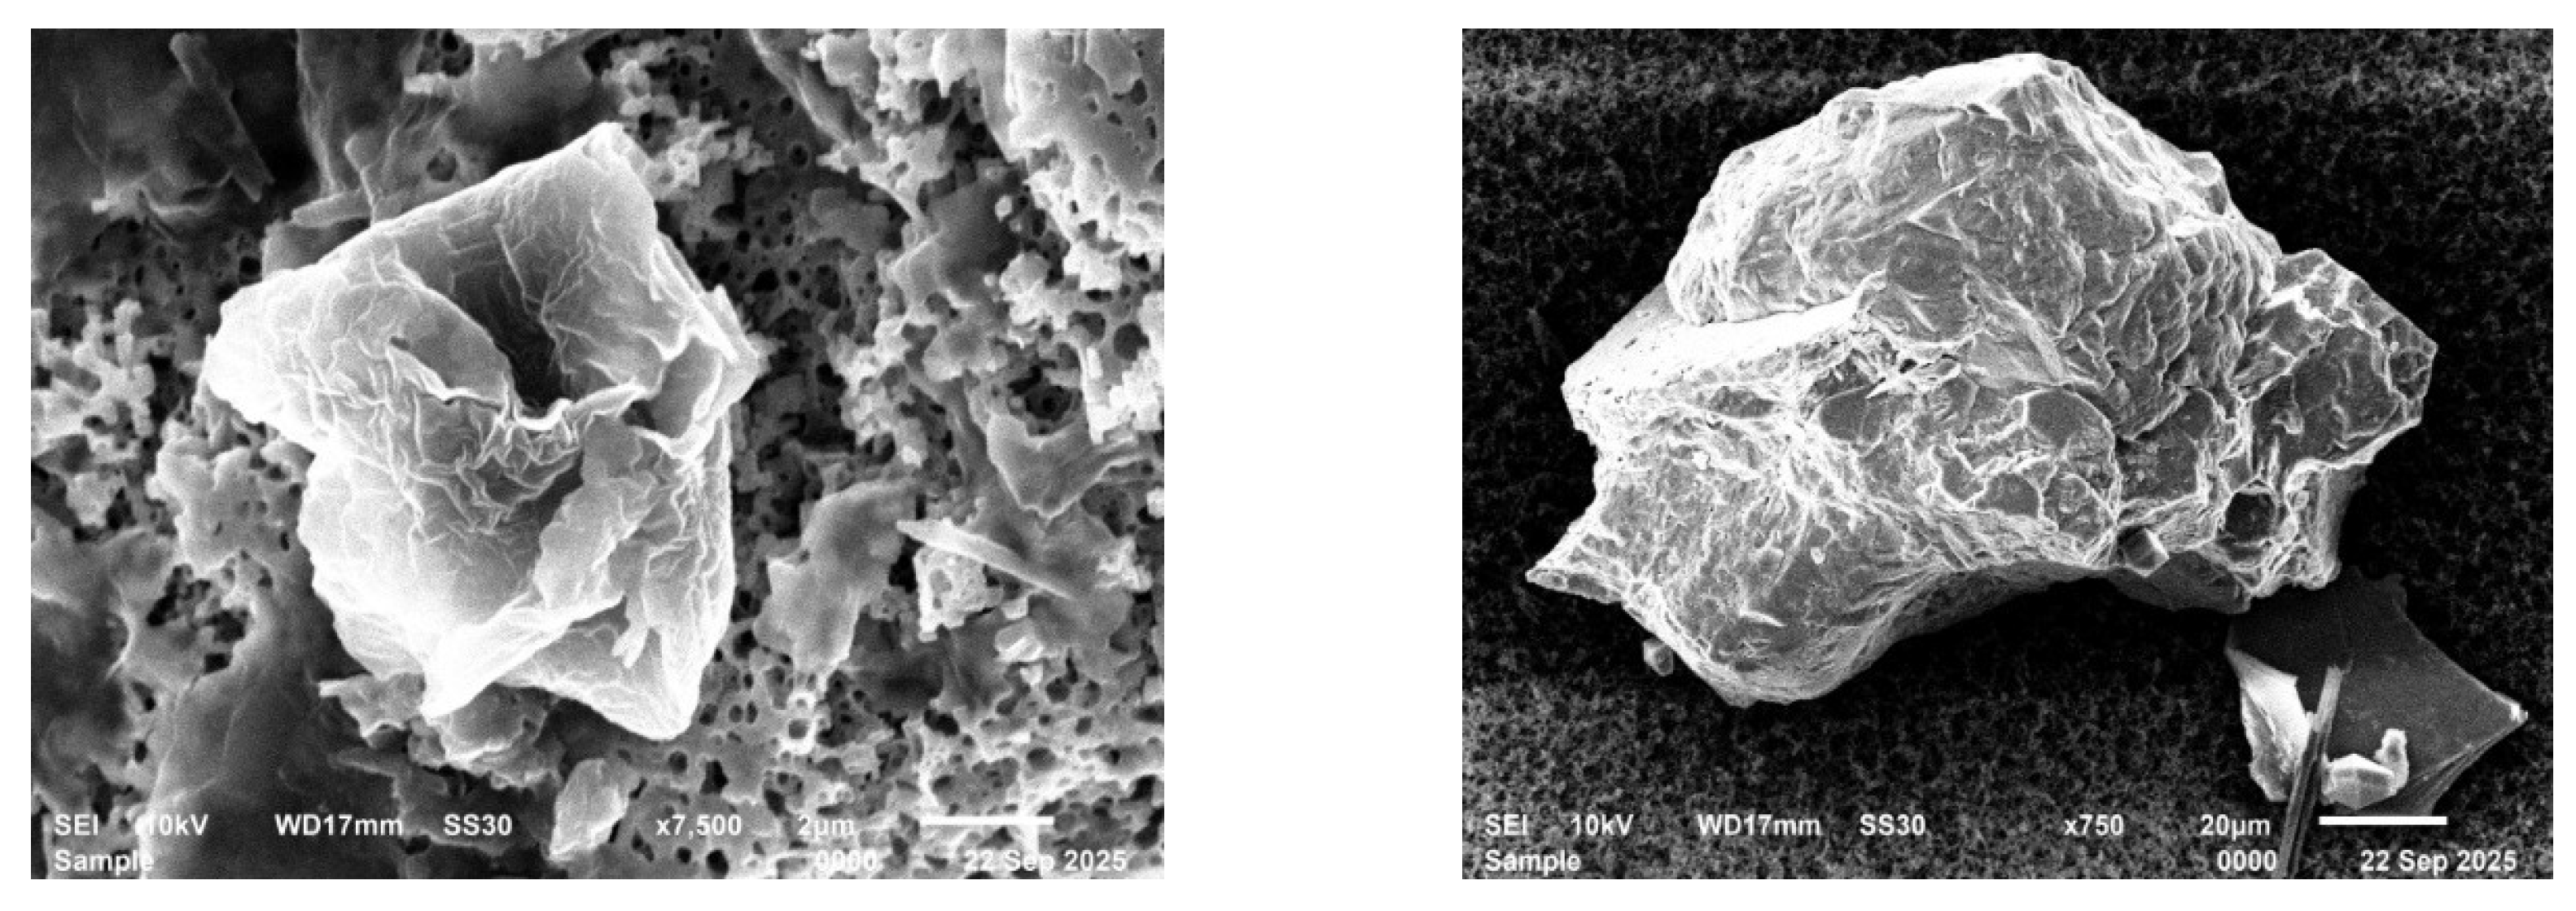
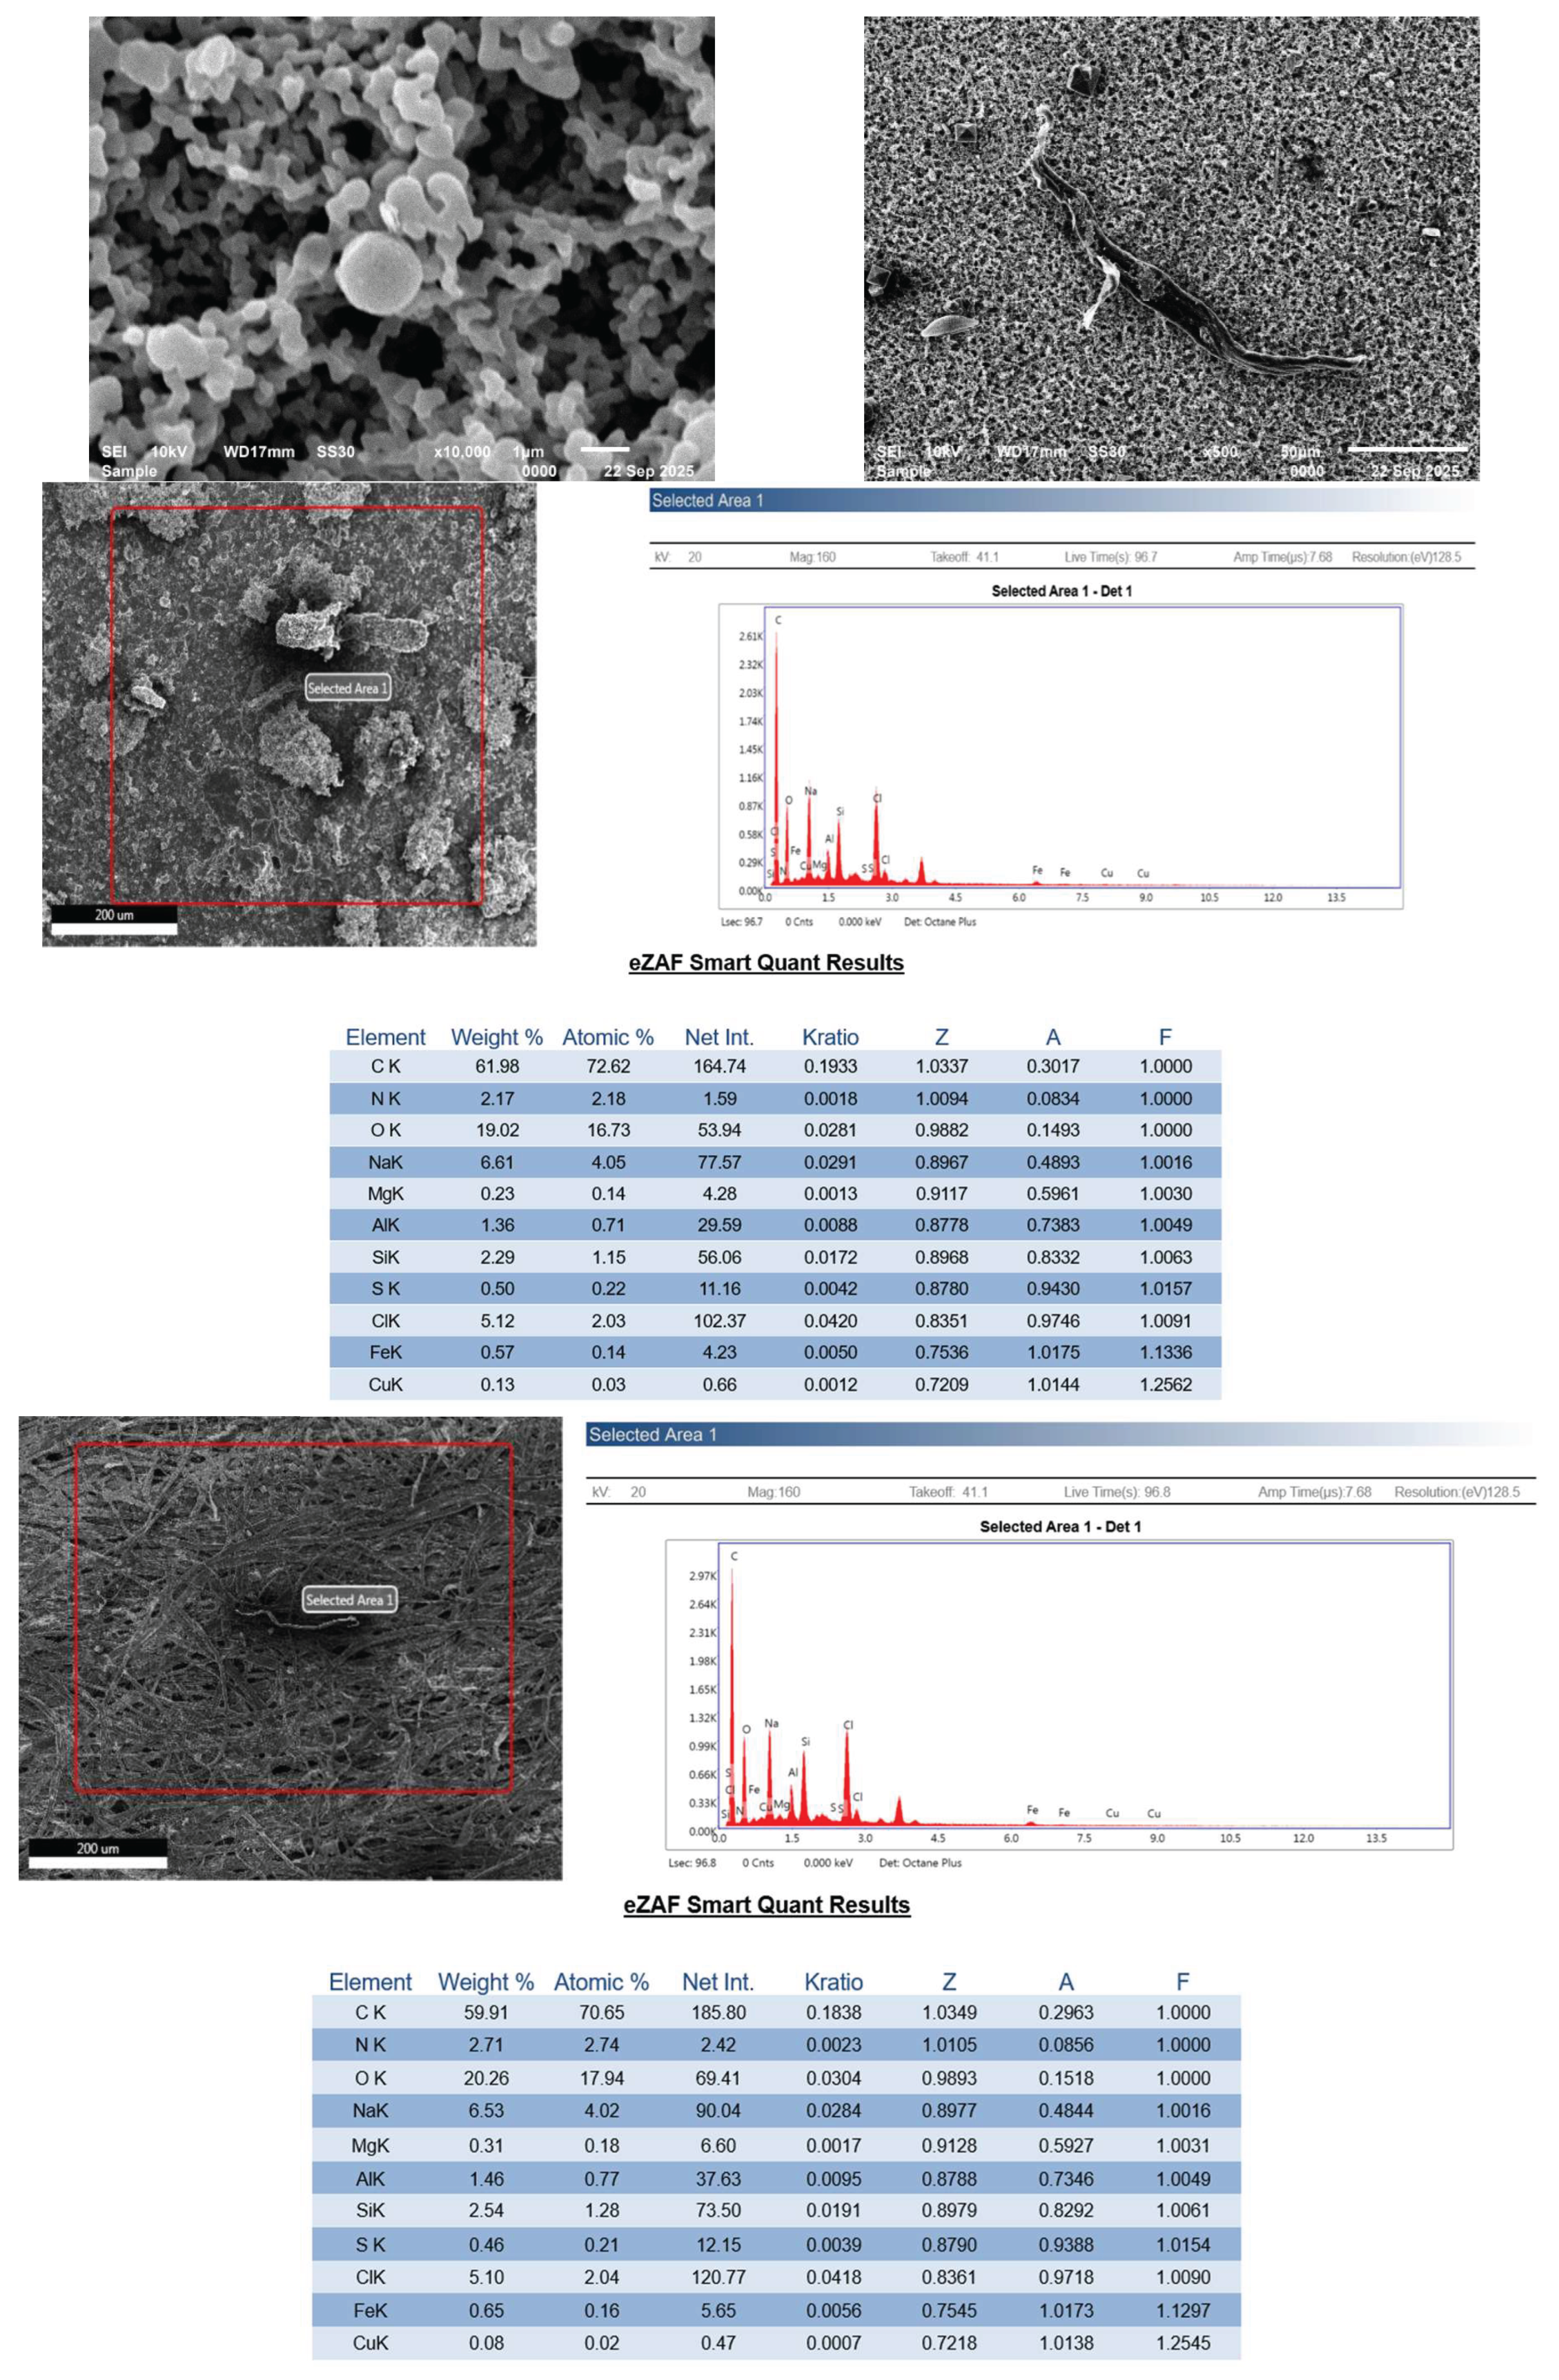
Figure 6.
(A) FTIR-ATR spectra of polyethylene (PE), Poly(ethylene)terephthalate (PET), Polypropylene (PP) and Polyamine (Nylon-6) and (B) Pie-chart depicting different percentage of plastic polymers from the different organs of fish species.
Figure 6.
(A) FTIR-ATR spectra of polyethylene (PE), Poly(ethylene)terephthalate (PET), Polypropylene (PP) and Polyamine (Nylon-6) and (B) Pie-chart depicting different percentage of plastic polymers from the different organs of fish species.
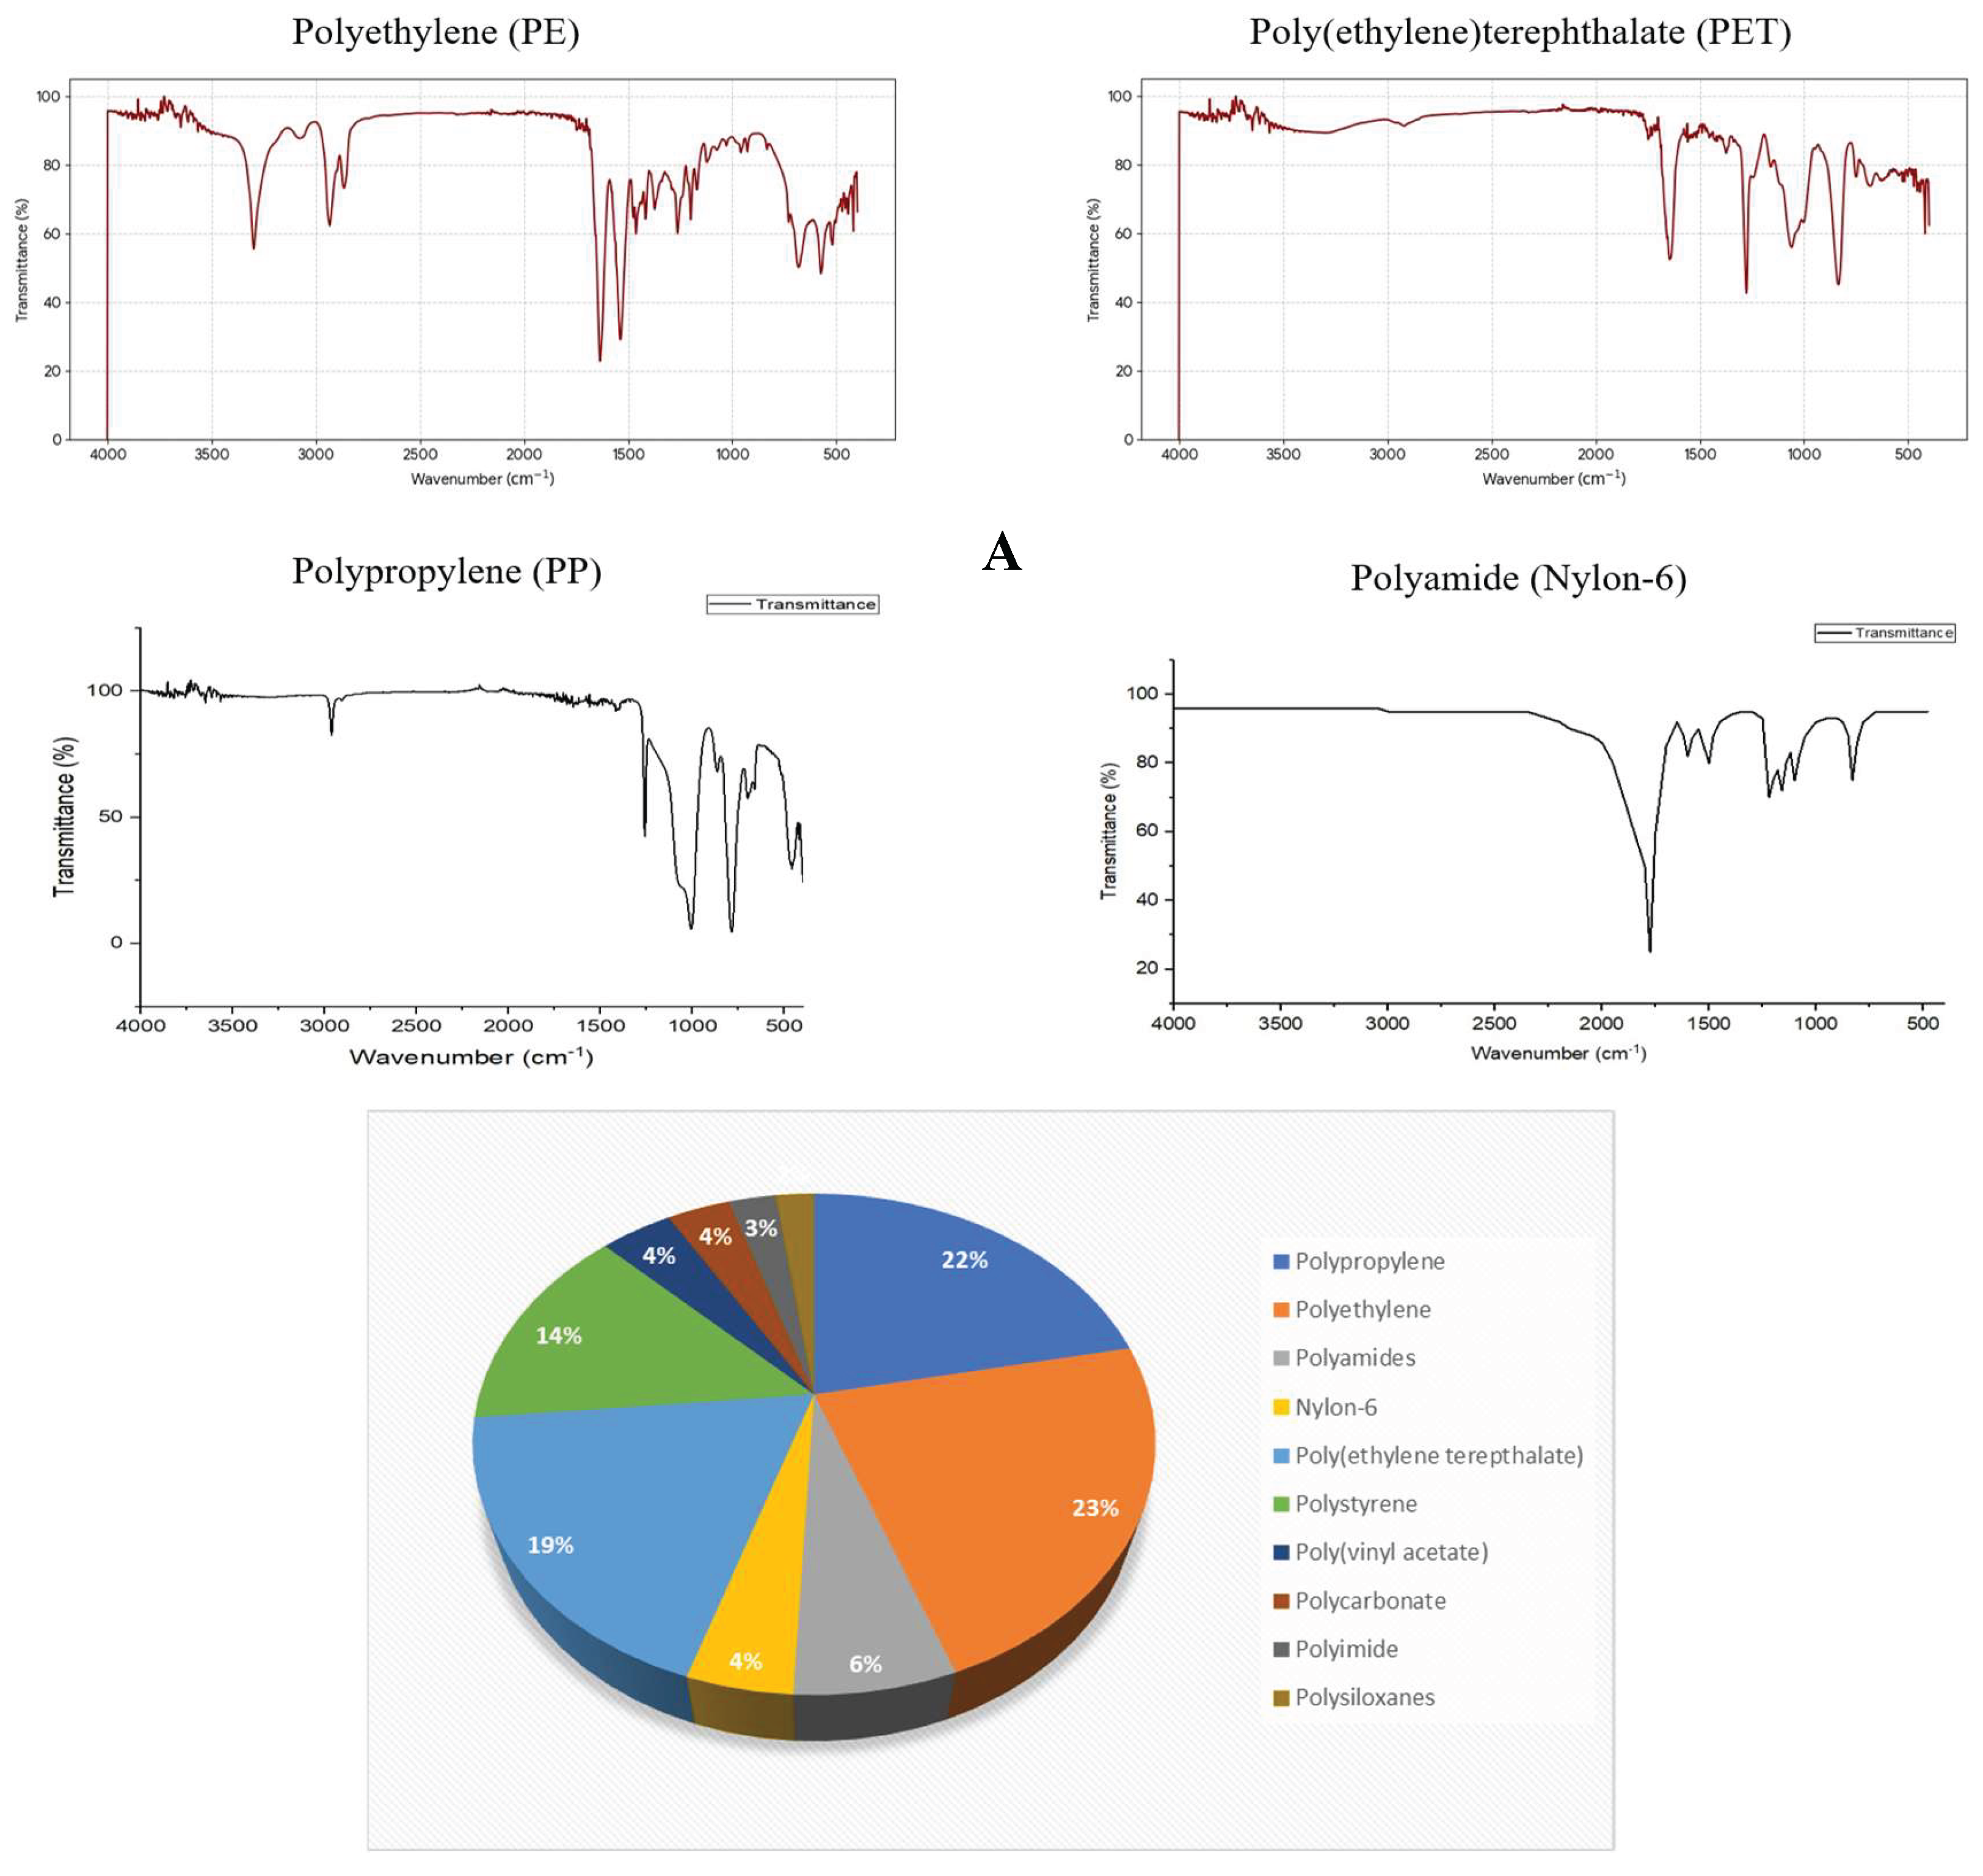

Table 1.
Fish species, sampling locations, feeding habits and feeding zone per sampling location.
| Fish Common Name | Scientific Name | Total No. | Location | Length (cm) | Weight (g) | Feeding Habit | Feeding Zone |
|---|---|---|---|---|---|---|---|
| Notopterus | Chitala chitala (KRN) | 10 | Karnal, Haryana | 20±1 | 60±10 | Carnivore | Bottom |
| Labeo Bata | Labeo boggut (KRN) | 20 | Karnal, Haryana | 11±1 | 6±4 | Herbivore | Mid |
| Needle Fish | Xenentodon cancila (KRN) | 10 | Karnal, Haryana | 16±1 | 30±15 | Carnivore | Surface |
| Ticto Barb | Pethia ticto (KRN) | 10 | Karnal, Haryana | 21±2 | 5±3 | Omnivore | Mid Water |
| Malli | Wallago attu (YNR) | 10 | Yamuna Nagar, Haryana | 34±2 | 319±50 | Carnivore | Bottom |
| Pool Barb | Puntius sophore (K) | 10 | Karnal, Haryana | 5±2 | 5±4 | Omnivore | Surface/Mid |
| Pool Barb | Puntius sophore (YNR) | 10 | Yamuna Nagar, Haryana | 5±2 | 5±2 | Omnivore | Surface/Mid |
| Fine scale razorbelly minnow | Salmostoma phulo (YNR) | 10 | Yamuna Nagar, Haryana | 20±2 | 7±5 | Omnivore | Surface/Mid |
| Battar | Labeo angra (YNR) | 20 | Yamuna Nagar, Haryana | 25±1 | 250±20 | Detrivore | Bottom |
| Chilwa | Chela cachius (KRN) | 10 | Karnal, Haryana | 6±2 | 6±3 | Insectivore | Surface |
| Chilwa | Chela cachius (S) | 10 | Surghat, Delhi | 6±2 | 8±2 | Insectivore | Surface |
| China Rohu | Labeo rohita (SV) | 20 | Sonia Vihar, Delhi | 32±3 | 370±10 | Herbivore | Surface/Mid |
| China Rohu | Labeo rohita (KRN) | 20 | Karnal, Haryana | 30±3 | 250±50 | Herbivore | Surface/Mid |
| Rohu | Labeo calbasu (YNR) | 10 | Yamuna Nagar, Haryana | 22±1 | 270±20 | Omnivore | Mid/ Botttom |
| Tilapia | Oreochromis niloticus (SV) | 20 | Sonia Vihar, Delhi | 15±2 | 42±5 | Omnivore | Surface/Mid |
| Tilapia | Oreochromis niloticus (S) | 20 | Surghat, Delhi | 13±2 | 36±7 | Omnivore | Surface/Mid |
Table 2.
Relative abundance of microplastic reported in different fish species from river Yamuna.
| Scientific Name | Total No. | Location | Gut | Gills | Tissue | Total MPs |
|---|---|---|---|---|---|---|
| Chitala chitala | 10 | Karnal, Haryana | 33 | 21 | 10 | 64 |
| Xenentodon cancila | 10 | Karnal, Haryana | 15 | 13 | 9 | 37 |
| Wallago attu | 10 | Yamuna Nagar, Haryana | 17 | 23 | 11 | 51 |
| Labeo rohita | 20 | Sonia Vihar | 123 | 64 | 18 | 205 |
| Labeo boggut | 20 | Yamuna Nagar, Haryana | 31 | 23 | 11 | 65 |
| Labeo rohita | 20 | Karnal, Haryana | 25 | 22 | 12 | 59 |
| Pethia ticto | 10 | Karnal, Haryana | 12 | 23 | 10 | 45 |
| Labeo calbasu | 10 | Yamuna Nagar, Haryana | 13 | 21 | 11 | 45 |
| Puntius sophore | 10 | Yamuna Nagar, Haryana | 36 | 25 | 10 | 71 |
| Puntius sophore | 10 | Karnal, Haryana | 39 | 45 | 18 | 102 |
| Salmostoma phulo | 10 | Yamuna Nagar, Haryana | 17 | 13 | 10 | 40 |
| Oreochromis niloticus | 20 | Sonia Vihar, Delhi | 201 | 139 | 96 | 436 |
| Oreochromis niloticus | 20 | Surghat, Delhi | 100 | 94 | 70 | 264 |
| Labeo angra | 20 | Yamuna Nagar, Haryana | 36 | 21 | 10 | 67 |
| Chela cachius | 10 | Karnal, Haryana | 20 | 22 | 3 | 45 |
| Chela cachius | 10 | Surghat, Delhi | 33 | 36 | 13 | 82 |
Table 3.
Current status of microplastic ingested by different fish species across the globe.
| Country | River | Fish species (n = Total no. of individuals) | Organ system | Average Microplastic Abundance (MPs/individual) | Main Shapes | Main Colours | Major polymers | Reference |
|---|---|---|---|---|---|---|---|---|
| India | Yamuna river | 12 (n=220) | GI tract, Gills & Muscle tissues | 7.63 | Fiber >fragment > sphere | Transparent, blue, black | PE, PS, PP, PET, PC, Nylon-6 | Present study |
| India | Ganga river (Upper Himalayan Region) | 4 (n=96) | GI tract | 29.375 | Fiber > fragment > film | Not mentioned | PET & PS | (Badola et al., 2023) |
| Korea | Han River | 22 (n=106) | GI tract | 17.39 | Fragment | Not mentioned | PP, PE & PTFE | (Park et al., 2022) |
| Bangladesh | Meghna River | 3 (n=30) | GI tract | 14.63 | Fiber >film > fragment | Blue, red, and black | PP, PE, PET, Nylon 6 & PS | (Das et al., 2025) |
| USA | Lake Michigan | 11 (n=74) | GI tract | 11.5 | Fiber | Blue, transparent, white, black | PE, PAN, POM, PVAc & PET | (McNeish et al., 2018) |
| China | Lijiang River | 4 (n=84) | GI tract and Gills | 0.6 | Flake > film > fiber | Coloured, white, transparent, black | PET | (L. Zhang et al., 2021) |
| China | North & west rivers of Guangdong province | 2 (n=74) | GI tract and Gills | 2.105 | Fragment > fiber | White, black, blue | Not mentioned | (Sun et al., 2022) |
| China | Dafeng River | 33 (n=122) | GI tract | 2 | Fiber > film > fragment | Blue | PET, Rayon & PBT | (Liu et al., 2021) |
| Gills | 0.7 | |||||||
| Turkey | Karasu River Erzurum | 3 (n=78) | GI tract | 2.974 | Fiber > fragment > pellet | Black, blue | PE, Polyester, Poly (vinyl stearate), PET, PP, & cellulose | (Atamanalp et al., 2021) |
| India | Deepor Beel of Assam | 2 (n=18) | GI tract | 3.45 | Fragment > fiber > sphere | Blue, black | PP, PVC, PE, ABS, PC & PS | (Saikia & Handique, 2024) |
| Japan | Tokyo Bay | 1 (n=64) | GI tract | 2.35 | Fragments > beads | Blue, transparent | PE, PP & PS | (Tanaka & Takada, 2016) |
| Bangladesh | Rivers, canals and lakes surrounding Dhaka | 18 (n=48) | GI tract | 3.05 | Fiber > fragments | Transparent | HDPE, PP-PE copolymer | (Parvin et al., 2021) |
| India | Alaknanda River | 5 (n=15) | GI tract | 12.67 | Fiber > fragment > film | White, black, blue, pink, red | HDPE, PP & Polyester | (Bhatt et al., 2023) |
Abbreviations: PE - Polyethylene, PS - Polystyrene, PAN - Polyacrylonitrile, POM - Polyacetal (Polyoxymethylene), PVAc - Polyvinyl Acetate, PET - Polyethylene Terephthalate, PP - Polypropylene, PTFE - Polytetrafluoroethylene, PBT - polybutylene terephthalate, ABS - Acrylonitrile Butadiene Styrene, PC - Polycarbonate, HDPE - High Density Polyethylene, EVA - Ethylene Vinyl Acetate.
Table 4.
Polymer Hazard Index (PHI) of microplastic polymers found in fish species from river Yamuna.
Table 4.
Polymer Hazard Index (PHI) of microplastic polymers found in fish species from river Yamuna.
| S.No. | Polymer | Hazard Level | Hazard Grade | Hazard class (category) |
|---|---|---|---|---|
| 1. | Polypropylene [PP] | I | 1 | Explosives [Div 1.3, 1.5] Pyrophoric liquids & solids Flammable aerosols, gases, and liquids [mostly cat. I] Organic peroxide [Type A, B] Self-reactive blend/material [Type A, B] Oxidizing liquids & solids |
| 2. | Polyethylene [PE] | I | 1 | Flammable aerosols, gases, and liquids [mostly cat. I] Pyrophoric solids and liquids Self-reactive blend/material [Types A and B] Type A and type B organic peroxide Explosives [Div 1.3, 1.5] Oxidizing liquids & solids |
| 3. | Polyamides (Poly-lactams) [Nylon] |
II | 10 | Skin corrosion/irritation [cat. II] Exposure to specific target organ toxicity [cat. III] Severe eye discomfort/injury [cat. II] Dangerous to aquatic life [Chronic cat. III] Acute toxicity [category IV - inhalation, cutaneous, and oral] |
| 4. | Nylon-6 | II | 10 | Skin corrosion/irritation (cat. II) Exposure to specific target organ toxicity [cat. III] Acute toxicity [category IV- inhalation, oral & cutaneous] Dangerous to aquatic life [chronic cat. III] Severe eye distress/injury [cat. II] |
| 5. | Poly (Ethylene terephthalate) [PET] | II | 10 | Exposure to specific target organ toxicity [cat. III] Acute toxicity [category IV- inhalation, oral & cutaneous] Detonators [Div 1.2] Dangerous to aquatic ecosystem [chronic cat. III] Skin corrosion /irritation [cat. II] Severe eye irritation/damage [cat. II] |
| 6. | Polystyrene [PS] | II | 10 | Acute toxicity [category IV- inhalation, oral & cutaneous] Bombs [Div 1.2] Toxicity to a specific target organ single exposure [cat. III] Dangerous for the aquatic ecosystem [chronic cat. III] Skin corrosion /irritation [category II] Severe eye irritation/damage [cat. II] |
| 7. | Poly (Vinyl Acetate) [PVA] | I | 1 | Flammable aerosols, gases & liquids [mostly cat. I] Pyrophoric solids/liquids Self-reactive material/mixture [Type A, B] Oxidizing solids/liquids Explosives [Div 1.3, 1.5] Organic peroxide [Type A, B] |
| 8. | Polycarbonate [PC] | IV | 1000 | Aquatic ecosystem-threatening [chronic cat. I, IV] Respiratory & skin sensitization [cat. I] Repeated exposure to specific target organ toxicity [cat. I] Exposure to specific target organ toxicity [cat. I] Mutagenicity of germ cells [cat. II] Acute toxicity [categories I and II- inhalation, oral & cutaneous] |
| 9. | Polyimide [PI] | III | 100 | Skin corrosion/irritation [cat. II] Severe eye distress/injury [cat. II] Toxicity to a specific target organ-repeated exposure [cat. II] Respiratory & skin sensitization [cat. I] Aquatic environments are at risk [chronic cat. II, III] |
| 10. | Polysiloxanes [o-si-o] |
I | 1 | Irritation of the skin [cat. III/none] Aquatic toxicity [chronic cat. III, primarily for low-molecular weight siloxanes] Inflammation of the eyes [cat. II (B)/none] Inflammable liquids [cat. III depending on side groups] |
Disclaimer/Publisher’s Note: The statements, opinions and data contained in all publications are solely those of the individual author(s) and contributor(s) and not of MDPI and/or the editor(s). MDPI and/or the editor(s) disclaim responsibility for any injury to people or property resulting from any ideas, methods, instructions or products referred to in the content. |
© 2026 by the authors. Licensee MDPI, Basel, Switzerland. This article is an open access article distributed under the terms and conditions of the Creative Commons Attribution (CC BY) license (http://creativecommons.org/licenses/by/4.0/).
Copyright: This open access article is published under a Creative Commons CC BY 4.0 license, which permit the free download, distribution, and reuse, provided that the author and preprint are cited in any reuse.


