
Submitted:
07 May 2026
Posted:
08 May 2026
You are already at the latest version
Abstract
Microtubules contain ordered aromatic amino-acid networks whose optical excitations have been proposed to support non-trivial energy-transfer dynamics. Here, we examined whether bound tryptamine ligands can perturb the excitonic structure of the tubulin tryptophan network. A virtual screen of 294 tryptamines was performed across seven known binding regions of the tubulin heterodimer using AutoDock Vina. From this screen, top-ranked tryptamine ligands were carried forward for excited-state analysis. Geometry optimization and time-dependent density functional theory (TD-DFT) calculations were used to obtain vertical excitation energies and transition dipole moments for the ligand-bound states in the ultraviolet range. These ligand properties were then incorporated into a tight-binding Hamiltonian describing the tubulin tryptophan excitation network in order to evaluate changes in exciton energies and eigenvector delocalization. The calculations indicate that tryptamine binding can modify the excitonic landscape of tubulin in a ligand-dependent manner, with the magnitude of the perturbation governed by excitation wavelength, transition dipole strength, and spatial orientation relative to the intrinsic tryptophan network. These results support the possibility that aromatic ligands may provide a chemically tunable route to altering the optical response of tubulin and motivate future experimental tests of ligand-dependent modulation of microtubule photophysics.
Keywords:
microtubules
; tubulin
; tryptophan network
; tryptamines
; excitons
; TD-DFT
; ultraviolet photophysics
1. Introduction
Microtubules are self-assembling cytoskeletal protein polymers composed of -tubulin heterodimers. They are essential for intracellular transport, maintenance of cell architecture, chromosome segregation, and many other cellular processes [1]. For neurons in particular, the microtubule cytoskeleton contributes both to structural organization and to the long-range intracellular trafficking needed to sustain polarized cell function [2]. Beyond these well-established mechanical and transport roles, microtubules have also attracted attention as ordered biomolecular assemblies whose aromatic amino-acid networks may support non-trivial optical and excitonic behavior [3,4,5,6,7].
Previous theoretical work suggested that aromatic chromophores in tubulin, especially tryptophan residues, may support resonance energy-transfer processes that are not well captured by simple nearest-neighbor or purely incoherent descriptions [3,4]. More recent work has extended this view by considering collective optical effects in protein-based aromatic lattices and by exploring how chemical perturbations may alter the excited-state structure of these systems [8]. In this context, the tryptophan network of the tubulin heterodimer is of particular interest because it provides a compact and chemically defined set of intrinsic chromophores whose relative positions and dipole orientations can be modeled structurally.
From a photonics perspective, such a system is interesting for two reasons. First, the tubulin aromatic network provides a naturally ordered molecular platform in which excitation energies, transition dipoles, and geometric packing can be related directly to collective optical states. Second, if bound aromatic ligands can perturb this intrinsic network in a controlled way, then the optical response of tubulin may become chemically tunable. This is relevant both to fundamental questions in biological photophysics and to broader efforts aimed at understanding or exploiting protein-based optical materials.
Aromatic ligands are especially appealing in this regard because their own electronic transitions may overlap with the ultraviolet absorption band of tryptophan [9]. If such ligands bind in close proximity to the intrinsic chromophore network, their transition dipoles may contribute to or perturb the excitonic manifold of the protein. The magnitude of the perturbation is expected to depend jointly on spectral overlap, dipole strength, and binding geometry. This provides a natural framework for investigating how the molecular structure of a ligand translates into an optical effect at the protein level.
In the present study, we investigated substituted tryptamines as candidate perturbants of the tubulin tryptophan network. A virtual screen of 294 tryptamines was carried out across seven known tubulin binding sites. From this screen, top-ranked tryptamine ligands, based on binding energy, were carried forward for quantum-chemical and excitation analysis. The docked conformations of the ligands were used to calculate excitation energies and transition dipole moments, which were then incorporated into a tight-binding Hamiltonian for the tubulin tryptophan excitation network. Our results indicate that in theory tryptamine ligands that share an excitation overlap with tryptophan can appreciably alter the tubulin excitation delocalization landscape in a manner that may be leveraged to chemically perturb tubulin optical excitations.
2. Materials and Methods
2.1. Computational Docking of Tryptamines to Tubulin
A library of 294 tryptamines was screened computationally against tubulin in order to identify aromatic ligands with the potential to perturb the intrinsic tryptophan excitonic network. Chemical structures were obtained from the PubChem database [10]. Protein structures representing tubulin conformation with microtubule binding agents at seven key binding regions were selected from the Protein Data Bank, namely 1JFF, 4O2B, 4O4J, 4EB6, 4TV8, 5LA6, and 7ALR containing taxol, colchicine, peluroside, vinblastine, maytansine, pironetin, and gatorbulin, respectively [11]. These structures were chosen to sample distinct ligand-binding environments across the tubulin heterodimer.
Docking calculations were performed using AutoDock Vina [12,13]. Each tryptamine was evaluated across all seven binding sites, and the best-scoring pose for each site was retained. The protocol included seven PDB structures with search spaces of 22 x 22 x 22 Å placed at the molecular center of the microtubule binding agent at their respective binding sites. Primary ligands associated with each known binding region were included during the assessment in order to verify that the docking protocol reproduced the expected binding conformations with reasonable fidelity (root mean squared deviation < 2 Å). Ligands were then ranked according to docking binding energy score.
From the full docking screen, top-ranked ligands based on binding energy were carried forward for further study. For each ligand, the retained docked conformation with the strongest binding energy was used as the structural input for subsequent excitation-energy and transition-dipole calculations, followed by incorporation into the ligand-containing Hamiltonian framework.
2.2. Excitation Energies and Transition Dipole Calculations
The transition dipole moment of tryptophan was estimated in previous experimental and computational work [3,5,8,9]. The reference geometry used for this transition dipole representation is shown in Figure 1.
The ligand-bound conformations obtained from docking were used as input coordinates for excited-state calculations. Ground-state geometry optimization followed by time-dependent density functional theory calculations was carried out in Gaussian 16 [14]. Calculations were performed at the B3LYP/6-311++G(d,p) and B3LYP/AUG-cc-pVDZ levels in order to evaluate the robustness of the low-energy electronic transitions for each ligand. The B3LYP functional with both an efficient Pople-style triple- set (6-311++G(d,p)) and a systematically improvable, diffuse-augmented correlation-consistent set (aug-cc-pVDZ) to allow for verification that low-energy electronic transitions are converged with respect to basis set size and diffuse function treatment, rather than being artifacts of a particular basis construction.
For subsequent Hamiltonian construction, vertical singlet excitations in or nearest to the ultraviolet band of interest were retained. In the present workflow, transitions between 270 and 300 nm were treated as the primary ligand-relevant band to align with the tryptophan excitation band. When a selected ligand transition fell below 270 nm, the reference tryptophan excitation used for comparison was fixed at 270 nm; when the ligand transition fell above 300 nm, the reference was fixed at 300 nm. For the unperturbed tubulin reference system, the tryptophan excitation was kept at 280 nm. This scheme was adopted to compare ligand-containing and ligand-free systems within a consistent ultraviolet window.
The tryptophan transition dipole moment used in the tubulin model followed earlier work on aromatic excitations in tubulin [3,8]. Specifically, the tryptophan 1 transition was represented with a dipole magnitude of 6 D oriented at above the methylindole x-axis, consistent with prior experimental and theoretical estimates [9,15] (Figure 1). For the selected ligands, the transition dipole magnitude and direction were taken from the quantum-chemical output in the molecular reference frame of the docked pose.
2.3. Hamiltonian and Exciton Analysis of the Tryptophan Network
The tubulin chromophore system was modeled as the eight-tryptophan network of the -tubulin heterodimer. The positions and numbering convention of the tryptophan chromophores included in the Hamiltonian are shown in Figure 2. Following previous work on coherent energy transfer in tubulin [3,4], the excited-state structure of the network was described using a tight-binding Hamiltonian for an interacting N-body system in the presence of a single excitation,
where denotes the state in which the excitation is localized at site m, is the site energy of chromophore m, and is the excitonic coupling between chromophores m and n. Excitonic couplings were calculated using the point-dipole approximation,
where and are the transition dipole magnitudes of chromophores m and n, is the center-to-center separation between them, and are unit vectors along their transition dipoles, and is the unit vector directed along the line joining the two chromophore centers.
The unperturbed system consisted of the eight intrinsic tryptophan sites of the tubulin heterodimer. In ligand-containing calculations, the selected tryptamine was introduced as an additional chromophoric site, with site energy and transition dipole obtained from the quantum-chemical calculation described above. Diagonalization of the Hamiltonian yielded the exciton energies and eigenvectors used to evaluate localization, delocalization, and ligand-induced perturbation of the tubulin tryptophan network.
2.4. Analysis Strategy
The aim of the present study was to establish the computational workflow required to evaluate how bound substituted tryptamines may perturb the optical excited-state structure of tubulin. The analysis therefore proceeded in three stages. First, a large-scale docking screen was used to identify the preferred binding behavior of tryptamines across known tubulin binding sites. Second, the baseline excitonic structure of the unperturbed tubulin tryptophan network was characterized through diagonalization of the corresponding Hamiltonian. Third, ultraviolet ligand transitions obtained from quantum-chemical calculations were identified for incorporation into the ligand-containing Hamiltonian framework. Full docking results and selected transition-dipole data are provided in the Supplementary Material.
2.5. Ligand-Free-to-Ligand-Bound State Mapping and Perturbation Metrics
To compare each ligand-containing Hamiltonian with the clean tubulin reference, the eight ligand-free excitons were mapped onto eight of the nine excitons of the corresponding ligand-containing system. The purpose of this mapping was to compare how the tryptophan-network component of each exciton changes upon ligand binding, independently of how much total amplitude is transferred onto the ligand site.
For this reason, each eigenvector was first projected onto the tryptophan subspace using only the coefficients of TRP1–TRP8. Because this projection reduces the norm of ligand-containing states whenever part of the amplitude resides on the ligand chromophore, each projected vector was then renormalized within the tryptophan subspace before comparison. Thus, if denotes the TRP1–TRP8 coefficients of state i, the normalized tryptophan-subspace vector was defined as
Pairwise ligand-free-to-ligand-bound similarity was then quantified by the absolute overlap
where the dot product was evaluated using the renormalized TRP1–TRP8 coefficient vectors. This overlap metric was used rather than direct coefficient-by-coefficient differences because it provides a single sign-invariant measure of exciton similarity on the tryptophan subspace. In particular, two eigenvectors that differ only by an overall sign correspond to the same physical state but would appear maximally different under direct coefficient subtraction. By contrast, the absolute overlap directly measures whether two states represent the same pattern of tryptophan-network delocalization and is therefore more suitable for exciton matching between ligand-free and ligand-containing systems.
An optimal one-to-one assignment between the eight ligand-free states and eight ligand states was then obtained by maximizing the total overlap across all pairs. The remaining unmatched ligand state was recorded separately. For each matched pair, the energy change was defined as
and the change in eigenvector structure was quantified as . In this way, ligand effects could be separated into (i) perturbation of ligand-free-like excitons within the tryptophan manifold and (ii) appearance of an unmatched ligand state not required to represent the ligand-free spectrum.
3. Results and Discussion
3.1. Computational Docking
The complete docking results are provided in the Supplementary Material. Across the 294 screened tryptamines, the colchicine binding site emerged as the dominant binding region, with almost all ligands showing their most favorable predicted binding energies at this site. This trend also held for the highest-ranked ligands in the screen. The top 5% of substituted tryptamines by colchicine-site binding affinity are presented in Table 1. This favorability is expected since the colchicine site is located at the interdimer space and is known to bind various ligands, altering the dynamics of microtubule polymerization [16]. On this basis, colchicine-site docked conformations were used as the structural input for transition-dipole calculations and subsequent Hamiltonian analysis.
3.2. Baseline Excitonic Structure of the Ligand-Free Tubulin Tryptophan Network
The diagonalized Hamiltonian of the ligand-free tubulin tryptophan network is shown in Table 2. The resulting eight-state excitonic manifold contains both localized and delocalized states. Excitons 1 and 8 are dominated by TRP4 and TRP7, excitons 3 and 6 by TRP1 and TRP3, and excitons 2 and 7 by the TRP5/TRP6/TRP8 sector. Excitons 4 and 5 are more localized, with dominant contributions centered on TRP2 and on the TRP5/TRP8 sector, respectively. This ligand-free spectrum therefore provides a structured reference manifold against which ligand-induced perturbations can be quantified.
3.3. Ligand-Induced Perturbation of the Tryptophan Excitonic Manifold
To compare each ligand-bound Hamiltonian with the ligand-free reference network, the eight ligand-free excitons were mapped onto eight of the nine excitons of the corresponding ligand-containing system by maximizing the overlap on the normalized TRP1–TRP8 subspace. The remaining state was retained as an unmatched ligand state. Importantly, this unmatched state was not always strongly separated from the ligand-free manifold. In several cases, it retained substantial similarity to one ligand-free exciton, indicating that the main effect of the ligand was redistribution within the existing manifold rather than the appearance of a completely distinct extra state.
Across the screened tryptamines, two broad perturbation regimes were observed. In the first regime, which was classified here as appreciable mixing, the ligand-bound spectrum remained largely describable as a perturbed version of the ligand-free tryptophan manifold. In these cases, perturbation was reflected by finite ligand-free-to-ligand-bound energy shifts, reduced overlap for a subset of matched states, and moderate eigenvector changes. In the second regime, classified as a mostly localized extra state, the unmatched ligand state carried nearly all of the ligand weight, whereas the mapped ligand-free excitons remained almost unchanged. Physically, these two regimes correspond to distinct ways in which a bound ligand can influence the tubulin excited-state structure. In the mixing regime, the ligand redistributes the character of the pre-existing tryptophan excitonic manifold, producing changes in both exciton energies and eigenvector composition. In the mostly localized extra-state regime, the ligand contributes an additional excitation that remains largely centered on the ligand chromophore, while the underlying tryptophan manifold is only weakly perturbed.
These two perturbation regimes may also reflect, in part, how the ligand excitation enters the comparison framework used here. In the ligand-containing calculations, transitions within the 270–300 nm window were treated directly within that ultraviolet range, whereas transitions outside this interval were compared using boundary references at 270 or 300 nm. Accordingly, ligands whose relevant excitations fall within or close to the same ultraviolet window as the intrinsic tryptophan excitations may be more likely to produce mixing within the pre-existing manifold, while ligands that are pushed toward the boundary conditions may be more likely to appear as comparatively localized extra states. However, this effect is only partial, since the transition dipole strength and binding geometry also contribute to the final perturbation pattern.
Among the ligands summarized here, HIOC and moschamine produced relatively small, distributed perturbations in both basis sets. For HIOC, the largest absolute matched-state energy shift was 1.21–, the mean absolute shift was 0.50–, and the largest eigenvector change was 0.086–0.092. Moschamine produced even smaller changes, with largest absolute shifts of 0.79–, mean absolute shifts of 0.24–, and maximum eigenvector changes of only 0.062–0.057. In both cases, the ligand coefficients associated with the unmatched state were moderate, consistent with weak but distributed reorganization of the manifold rather than formation of a strongly distinct ligand-dominated state.
Benzotript produced a stronger but still mixing-type perturbation. Depending on basis set, the largest absolute matched-state energy shift reached 4.44–, the mean absolute shift reached 1.10–, and the largest eigenvector change increased to 0.223 and 0.251. Thus, among the tryptamines summarized here, benzotript produced one of the strongest reshaping effects on the tubulin tryptophan excitonic manifold, although its behavior still remained consistent with distributed manifold reorganization rather than a cleanly separated extra state.
Several additional tryptamines exhibited even stronger mixing-type perturbations. FGIN-1-27 produced the largest matched-state energy shifts among the ligands summarized here, reaching 14.93 and in the two basis sets, with corresponding mean absolute shifts of 3.63 and . 5-MeO-34MPEMT also strongly perturbed the network, with largest absolute shifts of 6.36 and , mean absolute shifts of 1.69 and , and the largest eigenvector changes among the mixing-type cases (0.284 and 0.270). Ibogaine, PRO-LAD, and Milipertine displayed intermediate behavior, with maximum matched-state shifts in the range of approximately 2.57– depending on ligand and basis set.
By contrast, LSD, Alpertine, E-6837, and one basis-set treatment of E-6801 fell into the mostly localized extra-state regime. In these cases, the unmatched ligand state carried a ligand coefficient of 0.994–1.000, while the matched ligand-free states remained nearly unchanged. LSD provides the clearest example of this behavior: the unmatched ligand-centered state was associated with ligand coefficients of 0.999 and 1.000 in the two basis sets, while the largest matched-state energy shifts were only 0.86 and , the mean absolute shifts were only 0.17 and , and the largest eigenvector change was zero at the reported precision. These tryptamines therefore appear to add a largely separate ligand-centered excitation rather than broadly reorganizing the tryptophan excitonic manifold.
Table 3 and Table 4 summarize these results for all ligands and both basis sets. In both tables, Ligand coeff. refers to the absolute coefficient of the ligand chromophore in the unmatched ligand state. Largest and Mean refer to the maximum and mean absolute energy shifts among the eight matched ligand-free-to-ligand-bound pairs. Largest eigvec change and Mean eigvec change report the maximum and mean values of across those same matched pairs.
The present computational framework also provides a practical basis for prioritizing ligands for future experimental study. In particular, ligands that produce the largest perturbations of the tubulin tryptophan excitonic manifold, as reflected by larger matched-state energy shifts, larger eigenvector changes, or stronger ligand-dominated unmatched states, may be the most promising candidates for optical follow-up. Such an approach is consistent with the strategy used by Kalra et al. [6], who probed electronic energy migration in tubulin and microtubules through tryptophan autofluorescence lifetime measurements and showed that anesthetic ligand binding can measurably alter transport behavior. The present calculations therefore provide a rational basis for selecting tryptamine ligands for future ultraviolet absorbance, fluorescence, anisotropy, quenching, and time-resolved measurements.
4. Conclusions
In this study, we investigated whether substituted tryptamines can perturb the excitonic structure of the tubulin tryptophan network. Computational docking indicated that many of the screened tryptamines preferentially bind at the colchicine-associated interdimer pocket, providing a structurally plausible route by which aromatic ligands may influence the intrinsic optical properties of tubulin. Incorporation of ligand excitation energies and transition dipole moments into the tubulin tight-binding Hamiltonian showed that this influence is strongly ligand-dependent.
The ligand-free tubulin heterodimer exhibited a structured eight-state excitonic manifold with both localized and delocalized features distributed across the tryptophan network. Upon ligand binding, two broad classes of behavior were observed. In one regime, ligands produced appreciable mixing within the existing tryptophan excitonic manifold, leading to measurable shifts in exciton energies and changes in eigenvector structure. In the other, the ligand contributed a largely localized additional excitation with comparatively little reorganization of the underlying tubulin manifold. Among the ligands emphasized here, benzotript produced the strongest reshaping of the tryptophan-network excitonic structure, while HIOC and moschamine induced smaller but still distributed perturbations. Across the wider set of screened ligands, FGIN-1-27 and 5-MeO-34MPEMT produced some of the largest overall effects, and these trends were broadly consistent across both basis sets.
A limitation of this study is that the observed ligand effect depends strongly on the modeled wavelength band. Ligands with transitions within or near the 270–300 nm tryptophan window tended to show greater mixing with the tubulin excitonic manifold, whereas ligands outside this band more often appeared as localized ligand-centered states. In a biological setting, however, this spectral overlap may not be fixed: the hydrophobic protein pocket, local electrostatics, solvent exposure, and conformational fluctuations could shift ligand or tryptophan excitation energies and alter transition-dipole orientations, thereby changing the degree of overlap and mixing. The present results should therefore be interpreted as a first-pass computational screening framework, limited by static docked poses, isolated-ligand TD-DFT calculations, point-dipole couplings, and the absence of explicit environmental and dynamical effects.
These results support the idea that substituted tryptamines can act as chemically tunable perturbants of tubulin excited-state structure. Although the biological significance of these excitonic effects remains unresolved, the present work establishes a computational framework for identifying ligands most likely to alter the ultraviolet optical response of tubulin. Because some neurodegenerative conditions are associated with abnormal microtubule dynamics [4,17,18], chemical perturbation of the tryptophan excitonic scaffold may be of interest. Future experimental studies using time-correlated single-photon counting (TCSPC), absorbance, fluorescence, anisotropy, quenching, and other time-resolved measurements could test whether ligand-dependent modulation of tubulin photophysics can be observed directly [6].
Author Contributions
Conceptualization, T.J.A.C.; Methodology, M.T.C., L.G. and T.J.A.C.; Formal Analysis, M.T.C. and L.G.; Writing—Original Draft Preparation, M.T.C. and L.G.; Investigation, M.T.C. and L.G.; Resources, T.J.A.C.; Data Curation, M.T.C. and L.G.; Writing—Review and Editing, M.T.C., L.G., and T.J.A.C.; Visualization, M.T.C.; Supervision, L.G. and T.J.A.C.; Project Administration, T.J.A.C.; Funding Acquisition, T.J.A.C. All authors have read and agreed to the published version of the manuscript.
Funding
This research was undertaken in part thanks to funding to T.J.A.C. from the Canada Research Chairs Program (CRC-2022-00204) and the University of Waterloo. L.G. acknowledges support from the University of Waterloo Provost’s Program for Interdisciplinary Postdoctoral Scholars.
Data Availability Statement
All data generated or analyzed during this study are included in this published article or the Supplementary Material.
Acknowledgments
This research was enabled in part by support provided by the Digital Research Alliance of Canada.
Conflicts of Interest
The authors declare no conflict of interest.
References
- Akhmanova, A.; Steinmetz, M.O. Control of microtubule organization and dynamics: two ends in the limelight. Nat. Rev. Mol. Cell Biol. 2015, 16(12), 711–726. [Google Scholar] [CrossRef] [PubMed]
- Kapitein, L.C.; Hoogenraad, C.C. Building the neuronal microtubule cytoskeleton. Neuron 2015, 87(3), 492–506. [Google Scholar] [CrossRef] [PubMed]
- Craddock, T.J.A.; Friesen, D.; Mane, J.; Hameroff, S.; Tuszynski, J.A. The feasibility of coherent energy transfer in microtubules. J. R. Soc. Interface 2014, 11, 20140677. [Google Scholar] [CrossRef] [PubMed]
- Kurian, P.; Obisesan, T.O.; Craddock, T.J.A. Oxidative species-induced excitonic transport in tubulin aromatic networks: Potential implications for neurodegenerative disease. J. Photochem. Photobiol. B 2017, 175, 109–124. [Google Scholar] [CrossRef]
- Celardo, G.L.; Angeli, M.; Craddock, T.J.; Kurian, P. On the existence of superradiant excitonic states in microtubules. New J. Phys. 2019, 21, 023005. [Google Scholar] [CrossRef]
- Kalra, A.P.; Benny, A.; Travis, S.M.; Zizzi, E.A.; Morales-Sanchez, A.; Oblinsky, D.G.; Craddock, T.J.A.; Hameroff, S.; MacIver, B.; Tuszynski, J.A.; Petry, S.; Penrose, R.; Scholes, G.D. Electronic energy migration in microtubules. ACS Cent. Sci. 2023, 9, 352–361. [Google Scholar] [CrossRef] [PubMed]
- Babcock, N. S.; Montes-Cabrera, G.; Oberhofer, K. E.; Chergui, M.; Celardo, G. L.; Kurian, P. Ultraviolet superradiance from mega-networks of tryptophan in biological architectures. J. Phys. Chem. B 2024, 128(17), 4035–4046. [Google Scholar] [CrossRef] [PubMed]
- Craddock, T.J.A.; Hedrick, T.; De Abreu, I.R. Chemical-induced changes in the optical properties of aromatic amino acid lattices in protein polymers. In Quantum Effects and Measurement Techniques in Biology and Biophotonics Proceedings of SPIE; SPIE: Bellingham, WA, USA, 2024; Vol. 12863, p. 1286304. [Google Scholar] [CrossRef]
- Callis, P.R. Molecular orbital theory of the 1Lb and 1La states of indole. J. Chem. Phys. 1991, 95, 4230–4240. [Google Scholar] [CrossRef]
- Kim, S.; Chen, J.; Cheng, T.; Gindulyte, A.; He, J.; He, S.; Li, Q.; Shoemaker, B.A.; Thiessen, P.A.; Yu, B.; et al. PubChem 2019 update: improved access to chemical data. Nucleic Acids Res. 2019, 47, D1102–D1109. [Google Scholar] [CrossRef] [PubMed]
- Rose, P.W.; Prlić, A.; Altunkaya, A.; Bi, C.; Bradley, A.R.; Christie, C.H.; Costanzo, L.D.; Duarte, J.M.; Dutta, S.; Feng, Z.; et al. The RCSB Protein Data Bank: integrative view of protein, gene and 3D structural information. Nucleic Acids Res. 2017, 45, D271–D281. [Google Scholar] [CrossRef] [PubMed]
- Eberhardt, J.; Santos-Martins, D.; Tillack, A.F.; Forli, S. AutoDock Vina 1.2.0: New docking methods, expanded force field, and Python bindings. J. Chem. Inf. Model. 2021, 61, 3891–3898. [Google Scholar] [CrossRef] [PubMed]
- Morris, G.M.; Huey, R.; Lindstrom, W.; Sanner, M.F.; Belew, R.K.; Goodsell, D.S.; Olson, A.J. AutoDock4 and AutoDockTools4: Automated docking with selective receptor flexibility. J. Comput. Chem. 2009, 30(16), 2785–2791. [Google Scholar] [CrossRef] [PubMed]
- Frisch, M.J.; Trucks, G.W.; Schlegel, H.B.; Scuseria, G.E.; Robb, M.A.; Cheeseman, J.R.; Scalmani, G.; Barone, V.; Petersson, G.A.; Nakatsuji, H.; Li, X.; et al. Gaussian 16, Revision C.01; Gaussian, Inc.: Wallingford, CT, USA, 2016. [Google Scholar]
- Pierce, D.W.; Boxer, S.G. Stark effect spectroscopy of tryptophan. Biophys. J. 1995, 68, 1583–1591. [Google Scholar] [CrossRef] [PubMed]
- Abreu, I.R.; Barkdull, A.; Munoz, J.R.; Smith, R.P.; Craddock, T.J.A. A molecular analysis of substituted phenylethylamines as potential microtubule targeting agents through in silico methods and in vitro microtubule-polymerization activity. Sci. Rep. 2023, 13, 14406. [Google Scholar] [CrossRef] [PubMed]
- Craddock, T.J.A.; Tuszynski, J.A.; Chopra, D.; Casey, N.; Goldstein, L.E.; Hameroff, S.R.; Tanzi, R.E. The Zinc Dyshomeostasis Hypothesis of Alzheimer’s Disease. PLoS ONE 2012, 7(3), e33552. [Google Scholar] [CrossRef]
- Pellegrini, L.; Wetzel, A.; Grannó, S.; Heaton, G.; Harvey, K. Back to the tubule: microtubule dynamics in Parkinson’s disease. Cell Mol. Life Sci. 2017, 74(3), 409–434. [Google Scholar] [CrossRef] [PubMed]
- The PyMOL Molecular Graphics System, Version 3.0. Schrödinger, LLC.
Figure 1.
Transition Dipole Estimation of Tryptophan Shown on 3-Methylindole. Image was generated from PubChem structure 6736 using PyMOL [19] This depiction models the maximum transition dipole moment of tryptophan of 6.0 debye (D) at an excitation wavelength of 280 nm.
Figure 1.
Transition Dipole Estimation of Tryptophan Shown on 3-Methylindole. Image was generated from PubChem structure 6736 using PyMOL [19] This depiction models the maximum transition dipole moment of tryptophan of 6.0 debye (D) at an excitation wavelength of 280 nm.
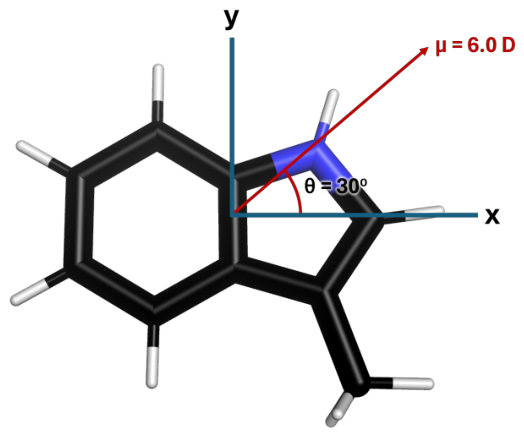
Figure 2.
Tubulin Tryptophan Network; Tryptophan network of the tubulin heterodimer. Images were generated from the Protein Data Bank structure 1JFF using PyMOL [19]. There are 8 tryptophan (abbreviated TRP or W) across the tubulin heterodimer structure. (A) shows the alpha subunit (-tubulin) on the right and the beta subunit (-tubulin) is on the left. The position of TRP in the amino acid sequence of the two tubulin subunits is also indicated for each residue. (B) shows the distances, in Angstroms (Å), between neighboring TRP residue pairs.
Figure 2.
Tubulin Tryptophan Network; Tryptophan network of the tubulin heterodimer. Images were generated from the Protein Data Bank structure 1JFF using PyMOL [19]. There are 8 tryptophan (abbreviated TRP or W) across the tubulin heterodimer structure. (A) shows the alpha subunit (-tubulin) on the right and the beta subunit (-tubulin) is on the left. The position of TRP in the amino acid sequence of the two tubulin subunits is also indicated for each residue. (B) shows the distances, in Angstroms (Å), between neighboring TRP residue pairs.
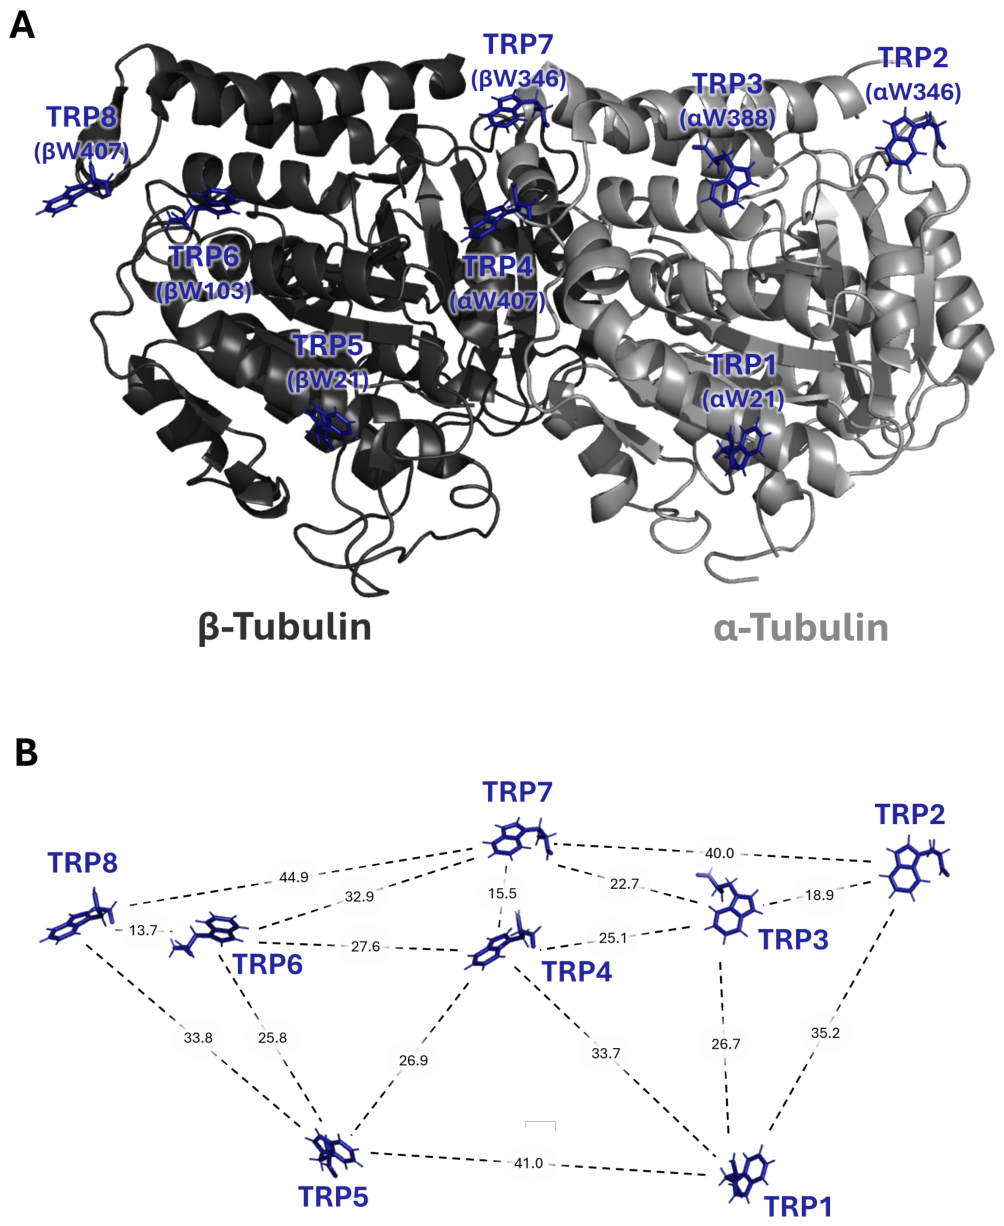

Table 1.
Binding site affinities (kcal/mol) for the top 5% highest-affinity ligands. Colchicine-site binding energies are highlighted, as this site yielded the lowest predicted binding energies for the top-ranked tryptamines.
Table 1.
Binding site affinities (kcal/mol) for the top 5% highest-affinity ligands. Colchicine-site binding energies are highlighted, as this site yielded the lowest predicted binding energies for the top-ranked tryptamines.
| Name | Paclitaxel | Colchicine | Peloruside | Vinblastine | Maytansine | Pironetin | Gatorbulin |
|---|---|---|---|---|---|---|---|
| Solypertine | -7.708 | -9.855 | -7.836 | -7.617 | -7.506 | -8.818 | -9.224 |
| 3-(Et-Indole) Norfentanyl | -7.793 | -9.661 | -7.514 | -6.923 | -7.312 | -8.832 | -8.708 |
| LSD | -7.358 | -9.565 | -7.752 | -7.048 | -7.388 | -7.740 | -7.671 |
| E-6837 | -8.322 | -9.538 | -8.082 | -7.746 | -7.685 | -8.115 | -9.004 |
| Ibogaine | -7.543 | -9.184 | -7.646 | -8.217 | -7.723 | -8.450 | -8.695 |
| Alpertine | -7.394 | -9.090 | -7.165 | -7.459 | -6.378 | -8.278 | -8.336 |
| Milipertine | -7.673 | -9.050 | -7.822 | -6.811 | -7.124 | -7.549 | -8.716 |
| Oxypertine | -7.856 | -9.038 | -7.816 | -7.243 | -7.214 | -8.556 | -8.889 |
| Idalopirdine | -7.044 | -9.008 | -6.834 | -6.537 | -6.995 | -8.465 | -7.336 |
| FGIN-1-27 | -7.275 | -8.912 | -6.521 | -6.745 | -6.879 | -7.768 | -8.031 |
| 5-MeO-34MPEMT | -6.924 | -8.824 | -6.071 | -5.555 | -6.174 | -7.678 | -6.898 |
| HIOC | -7.228 | -8.815 | -7.424 | -6.819 | -7.191 | -8.403 | -8.416 |
| Benzotript | -7.353 | -8.793 | -7.891 | -7.452 | -7.406 | -8.429 | -8.301 |
| PRO-LAD | -7.378 | -8.719 | -7.762 | -7.175 | -7.470 | -7.607 | -7.225 |
| E-6801 | -7.120 | -8.715 | -6.449 | -6.836 | -6.788 | -7.769 | -7.829 |
| Moschamine | -7.494 | -8.585 | -7.294 | -7.769 | -6.934 | -8.369 | -8.402 |
Table 2.
Diagonalized matrix of the tubulin tryptophan network. Coefficients with magnitude are shown in bold.
Table 2.
Diagonalized matrix of the tubulin tryptophan network. Coefficients with magnitude are shown in bold.
| Exciton | Energy () | TRP1 | TRP2 | TRP3 | TRP4 | TRP5 | TRP6 | TRP7 | TRP8 |
|---|---|---|---|---|---|---|---|---|---|
| 1 | 87.5 | -0.04 | 0.00 | 0.18 | -0.69 | -0.01 | -0.02 | 0.70 | -0.02 |
| 2 | 24.3 | -0.03 | 0.01 | 0.02 | -0.02 | 0.50 | 0.70 | 0.02 | 0.51 |
| 3 | 11.2 | 0.69 | 0.26 | -0.63 | -0.12 | -0.14 | 0.05 | 0.08 | 0.11 |
| 4 | 0.4 | -0.19 | 0.79 | -0.05 | 0.02 | 0.42 | -0.03 | 0.01 | -0.40 |
| 5 | -1.7 | 0.26 | -0.53 | -0.13 | -0.04 | 0.55 | 0.04 | 0.00 | -0.57 |
| 6 | -13.0 | 0.64 | 0.17 | 0.74 | 0.08 | 0.02 | 0.02 | -0.07 | -0.03 |
| 7 | -23.8 | 0.06 | -0.03 | -0.03 | 0.02 | 0.50 | -0.71 | 0.02 | 0.49 |
| 8 | -84.9 | 0.03 | -0.03 | -0.03 | 0.70 | -0.01 | 0.02 | 0.71 | -0.02 |
Table 3.
Summary of ligand-free-to-ligand-bound exciton mapping results for the B3LYP/6-311++G(d,p) calculations. For each ligand, the eight excitons of the ligand-free tubulin tryptophan network were mapped onto eight of the nine excitons of the corresponding ligand-containing Hamiltonian by maximizing the overlap on the normalized TRP1–TRP8 subspace. Ligand coeff. is the absolute coefficient of the ligand chromophore in the unmatched ligand state. Largest and Mean are the maximum and mean absolute matched-state energy shifts, where . Largest eigvec change and Mean eigvec change are the maximum and mean values of across the matched states and therefore quantify the overall reshaping of the tryptophan excitonic manifold.
Table 3.
Summary of ligand-free-to-ligand-bound exciton mapping results for the B3LYP/6-311++G(d,p) calculations. For each ligand, the eight excitons of the ligand-free tubulin tryptophan network were mapped onto eight of the nine excitons of the corresponding ligand-containing Hamiltonian by maximizing the overlap on the normalized TRP1–TRP8 subspace. Ligand coeff. is the absolute coefficient of the ligand chromophore in the unmatched ligand state. Largest and Mean are the maximum and mean absolute matched-state energy shifts, where . Largest eigvec change and Mean eigvec change are the maximum and mean values of across the matched states and therefore quantify the overall reshaping of the tryptophan excitonic manifold.
| Tryptamine | (nm) | (D) | Ligand coeff. | Interpretation | Largest () | Mean () | Largest eigvec change | Mean eigvec change |
|---|---|---|---|---|---|---|---|---|
| 3-(Et-Indole) Norfentanyl | 279.28 | 1.653 | 0.624 | appreciable mixing | 1.50 | 0.42 | 0.058 | 0.011 |
| 5-MeO-34MPEMT | 284.44 | 1.862 | 0.360 | appreciable mixing | 6.36 | 1.69 | 0.284 | 0.059 |
| Alpertine | 303.23 | 5.598 | 0.994 | mostly localized extra state | 1.68 | 0.47 | 0.001 | 0.001 |
| Benzotript | 274.38 | 2.001 | 0.664 | appreciable mixing | 4.44 | 1.10 | 0.223 | 0.047 |
| E-6801 | 284.72 | 0.885 | 0.560 | appreciable mixing | 1.15 | 0.36 | 0.053 | 0.013 |
| E-6837 | 302.27 | 1.756 | 0.999 | mostly localized extra state | 0.36 | 0.07 | 0.000 | 0.000 |
| FGIN-1-27 | 286.41 | 3.485 | 0.674 | appreciable mixing | 14.93 | 3.63 | 0.074 | 0.027 |
| HIOC | 290.00 | 2.036 | 0.653 | appreciable mixing | 1.21 | 0.50 | 0.086 | 0.014 |
| Ibogaine | 289.96 | 1.831 | 0.344 | appreciable mixing | 3.14 | 1.13 | 0.151 | 0.031 |
| Idalopirdine | 276.80 | 1.798 | 0.814 | appreciable mixing | 2.16 | 0.60 | 0.066 | 0.014 |
| LSD | 310.13 | 3.965 | 0.999 | mostly localized extra state | 0.86 | 0.17 | 0.000 | 0.000 |
| Milipertine | 290.74 | 1.835 | 0.388 | appreciable mixing | 2.57 | 0.78 | 0.146 | 0.030 |
| Moschamine | 286.54 | 1.713 | 0.651 | appreciable mixing | 0.79 | 0.24 | 0.062 | 0.009 |
| Oxypertine | 279.75 | 1.622 | 0.715 | appreciable mixing | 1.33 | 0.43 | 0.030 | 0.006 |
| PRO-LAD | 276.23 | 2.085 | 0.395 | appreciable mixing | 4.06 | 1.16 | 0.210 | 0.051 |
| Solypertine | 286.07 | 2.800 | 0.819 | appreciable mixing | 1.79 | 0.38 | 0.016 | 0.002 |
Table 4.
Summary of ligand-free-to-ligand-bound exciton mapping results for the B3LYP/AUG-cc-pVDZ calculations. Column definitions are the same as in Table 3.
Table 4.
Summary of ligand-free-to-ligand-bound exciton mapping results for the B3LYP/AUG-cc-pVDZ calculations. Column definitions are the same as in Table 3.
| Tryptamine | (nm) | (D) | Ligand coeff. | Interpretation | Largest () | Mean () | Largest eigvec change | Mean eigvec change |
|---|---|---|---|---|---|---|---|---|
| 3-(Et-Indole) Norfentanyl | 282.89 | 1.579 | 0.535 | appreciable mixing | 1.59 | 0.48 | 0.088 | 0.015 |
| 5-MeO-34MPEMT | 288.03 | 1.809 | 0.370 | appreciable mixing | 6.09 | 1.62 | 0.270 | 0.056 |
| Alpertine | 305.11 | 5.618 | 0.998 | mostly localized extra state | 0.95 | 0.28 | 0.001 | 0.000 |
| Benzotript | 277.12 | 2.030 | 0.292 | appreciable mixing | 4.45 | 1.45 | 0.251 | 0.056 |
| E-6801 | 310.29 | 1.247 | 1.000 | mostly localized extra state | 0.04 | 0.01 | 0.000 | 0.000 |
| E-6837 | 311.44 | 1.841 | 1.000 | mostly localized extra state | 0.08 | 0.03 | 0.000 | 0.000 |
| FGIN-1-27 | 289.13 | 3.518 | 0.674 | appreciable mixing | 14.87 | 3.64 | 0.074 | 0.027 |
| HIOC | 293.71 | 1.971 | 0.647 | appreciable mixing | 1.16 | 0.47 | 0.092 | 0.014 |
| Ibogaine | 292.27 | 1.793 | 0.352 | appreciable mixing | 2.97 | 1.09 | 0.150 | 0.030 |
| Idalopirdine | 280.61 | 1.771 | 0.815 | appreciable mixing | 2.11 | 0.61 | 0.061 | 0.013 |
| LSD | 314.50 | 3.983 | 1.000 | mostly localized extra state | 0.64 | 0.12 | 0.000 | 0.000 |
| Milipertine | 281.43 | 1.777 | 0.306 | appreciable mixing | 4.58 | 1.26 | 0.205 | 0.053 |
| Moschamine | 290.30 | 1.672 | 0.665 | appreciable mixing | 0.74 | 0.23 | 0.057 | 0.008 |
| Oxypertine | 281.74 | 2.258 | 0.490 | appreciable mixing | 1.59 | 0.54 | 0.094 | 0.021 |
| PRO-LAD | 279.59 | 2.007 | 0.395 | appreciable mixing | 3.86 | 1.10 | 0.228 | 0.051 |
| Solypertine | 289.85 | 2.866 | 0.739 | appreciable mixing | 1.86 | 0.51 | 0.086 | 0.013 |
Disclaimer/Publisher’s Note: The statements, opinions and data contained in all publications are solely those of the individual author(s) and contributor(s) and not of MDPI and/or the editor(s). MDPI and/or the editor(s) disclaim responsibility for any injury to people or property resulting from any ideas, methods, instructions or products referred to in the content. |
© 2026 by the authors. Licensee MDPI, Basel, Switzerland. This article is an open access article distributed under the terms and conditions of the Creative Commons Attribution (CC BY) license (http://creativecommons.org/licenses/by/4.0/).
Copyright: This open access article is published under a Creative Commons CC BY 4.0 license, which permit the free download, distribution, and reuse, provided that the author and preprint are cited in any reuse.