

Submitted:
05 May 2026
Posted:
07 May 2026
You are already at the latest version
Abstract
Australia is a country endowed with natural resources such as coal, lithium, rare earths amongst other high-level commodities, which attract global trade opportunities viable for boosting its economy. Amidst its natural resources, Australia has been viewed as a prosperous nation in view of its standing in the Commonwealth of Nations. Nonetheless, the country still faces numerous challenges ranging from floods, heatwaves, bushfires, cyclones, and drought amongst other forms of hazards. While such hazards reverse hardly-won strides of development, other inter-related aspects of vulnerability which limit attributes of social capital poses tremendous challenges which impact on pre, during and post disaster interventions. By using causal loop diagrams, this study takes a systemic approach towards exploring emerging system structures; interdependence and interconnectivity; and institutional pressures, to unravel factors influencing Australia’s vulnerability to hazards with the aim of facilitating concerted interventions for reducing vulnerability and ultimately, the risks impeding sustainable development.
Keywords:
vulnerability
; risks
; hazards
; risk reduction
; Australia
1. Introduction:
Empirical studies show that despite Australia’s robust approach towards disaster risks management, its systems are still vulnerable to hazards. A key example has been the recent 2026 bushfires that ravaged arable agricultural land in parts of New South Wales and Victoria. This was followed by severe flooding in parts of the Northern Territory. More so, the Sydney Bondi terror attack that led to the untimely fatality of affected individuals draws the attention of not just Australia, but the global community on the need for global peace and stability, harmony and sustained co-existence, which are key attributes of social capital. Although in response, the Australian government has launched major inquiries to investigate the possible causes, with its scope and policies passed into law hinged on addressing broader issues such as antisemitism1, hate speech and migration (Australian Government 2025). It is therefore crucial to note that while these are very crucial issues, there are other underlying issues, which are networked that may often spiral into natural or man-made hazards. For instance, the supply chain and fuel/energy reserve capacities of Australia and countries in the Asia-Pacific have also been tested with the ongoing conflict in the Middle East which caused a major supply blockade along the Strait of Hormuz – a critical passage for refined oil products supporting the region. Such circumstances have been known to cause fuel scarcity, which in turn presented difficulties for the Agro-allied industries to supply fresh food and other agricultural products largely affecting livelihoods and household incomes.
Consequently, this has led to food supply shortages and limited fuel for mobilising trade-related activities, including inflation in the cost of petroleum products which has in turn affected household income. Although in response, the government of Australia activated excise duty2 on petroleum products (Australian Government 2026a), the government also leveraged reserves, including sensitizing the public on precautionary measures3 to handle the situation (Australian Government 2026b), which includes using public transportation, patronization of hybrid or Electric Vehicles, and modern methods of managing fuel consumption amongst others.
A key approach towards understanding and identifying the nature, causes or effects of rapid or slow-onset disasters is the use of causal loop diagrams. According to Crabolu et al (2023) in order to solve the issue of complexity, bearing in mind, the interrelated nature of factors influencing a phenomenon – which in this case is Australia’s Vulnerability and susceptibility to seasonal hazard events leading to disasters should be explored. Attention to empirical studies have also proven to result in Key Performance Indicators (KPIs) being adopted as effective and as a facilitator of sustained informed-policy. In view of the foregoing, it could be noted that such studies have been drawn using a case-by-case approach.
According to Crabolu et al (2023) citing an example of the approach used in the tourism sector, these have also been conducted using linear methods of analysis which neglect the complexity of governance and policymaking (Ansell and Geyer 2017; Boulton et al 2015). This rationale is that ‘complexity’ stems from acknowledging that the use of KPIs do not follow an undisturbed, linear trajectory, which leads to policy change, but instead results in multiple interactions with the various components affecting the policy system (Parkhurst 2017). Despite the increasing use of complexity science to investigate policy problems (Baggio et al 2010; Suno Wu et al 2021), that are a few tools for systematically untangling multifaceted systems (Crabolu et al 2023). Thus, Causal Loop Diagrams highlight the core elements of a system, and the systems behaviours emerging from the interactions (Crabolu et al 2023). They visualise factors, their relationships and how they influence each other in a system. Under such scenarios, factors and relationships for a series of close-sequences of cause-and-effect relationships are simplified through what is referred to as feedback loops (Kirkwood 1998; Crabolu et al 2023).
This paper therefore builds on complexity science using causal loop diagrams and the Pressure and Release Model (Blaikie et al 2014) to unravel the underlying root dimensions of vulnerability to hazards with a view to exploring various ways through which concerted institutional interventions can be provided to address impending or residual risks. The exploratory study critically reviews literature using Scopus, EBSCO and Google scholar databases to identify the factors ‘influencing vulnerability to hazards in Australia’. This is further reinforced by using a graphic visualizer [i.e. Graphicviz -DOT] based on programmable codes from ‘Co-pilot software’ to unravel, interpret and assess emerging factors using Causal loop Diagram. The rationale was to consolidate on the findings from the critical review. All identified factors from the selected reviews were then manually coded and mapped to the PAR model and to justify themes, including the cause-and-effect interpretations.
2. Literature Review
2.1. Deconstructing Vulnerability and Disaster Risks: A Global Perspective
Vulnerability is socially constructed and is largely driven by root dimensions of risks such as limited accessibility to power, structures and resources within communities (Oliver-Smith et al 2017; Wisner et al 2014; Wisner 2022). It is based on the interactions between socio-political and economic systems or ideologies, which have rippling effects on individuals and communities (Wisner et al., 2014; Wisner 2022; Toinpre et al 2024; Toinpre et al 2025). While the magnification of the impact on vulnerable groups and communities are visible by virtue of physical, social, economic and environmental impacts, these issues are embedded in the level of institutional constraints and the persistence of disaster risks, which exacerbate the potential for communities to be affected by hazards (e.g. floods, earthquakes, tsunami, cyclones etc.). Although vulnerability as a phenomenon has been widely contested amongst academics and practitioners, it has been widely acknowledged as the characteristics of a person or group and their situation that influences their capacity to anticipate, cope with, resist and recover from the impact of a natural hazard (an extreme natural event or process) (Blaikie et al 2014; Wisner and Fordham 2014). Although it can be really daunting to classify people’s vulnerability given the highly complex and ambiguous nature of risks presented that exacerbates it, the risks associated with vulnerability is thus categorised into (i) economic (ii) environmental (iii) geopolitical (iv) societal and (v) technological by the World Economic Forum Report of 20254.
According to Blaikie et al (2014), vulnerability involves the combination of factors that determine the degree of an individual’s existence, livelihood, and assets put at risk by an identifiable event (or series or cascading events) in nature or in society. It can also be observed that these factors are inter-dependent and inter-connected, interacting with each other and mostly historic in causality. According to the World Economic Forum, the ten global risks that countries, (including Australia) may be face with include: (i) cost of living crisis (ii) extreme weather events (iii) geo-economic confrontation (iv) failure to mitigate climate change (v) erosion of social cohesion and societal polarisation (vi) large scale environmental damage incident (vii) failure of climate change adaptation (viii) widespread cybercrime and cyber insecurity (ix) natural resources crisis and (x) largescale involuntary migration, as depicted in Figure 1.
On the other hand, the United Nations5 has also described vulnerability as the conditions determined by physical, social economic and environmental factors or processes, which increase the susceptibility of an individual, a community, assets or systems to the impact of hazards (United Nations 2016). Others have defined vulnerability as a state of political and social powerlessness, a deprivation trap, physical weakness, isolation and income poverty (Wisner et al 2015; Oliver-smith et al 2017; Adger 2006). Although this phenomenon has been interpreted from several points of view, it denotes the degree to which a person or community’s social status (e.g. culturally and socially constructed in terms of roles, responsibilities, rights, duties, expectations concerning behaviour) influences differential impact by hazards and social processes (Oliver-smith et al 2017; Wisner et al 2015; Adger 2006).
2.2. How Communities Progress Towards Vulnerability
In order to understand risks in terms of people’s vulnerability in specific hazard situations, the Pressure and Release Model was developed as a simple tool for showing how disasters occur when natural hazards affect vulnerable people. Such vulnerable conditions are thus deeply rooted in social processes and underlying causes, which may be taken-for-granted or remote from the disaster itself (Blaikie et al 2014; Wisner et al 2015). The basis of the PAR idea is that disasters are intersections of two opposing forces: those processes generating the vulnerability on one side and the hazard event (slowly unfolding natural processes) on the other side. With increasing pressure on people arising from either side – from their vulnerability and from the impact of the hazards they experience, the reduction of the disaster risks creates a release to relieve the pressure and, vulnerability (Blaikie et al 2014; Wisner et al 2015).
“Vulnerability has thus two sides: an external side of risks, shocks, and stress to which an individual or household is subject; and an internal side which is defencelessness, meaning a lack of means to cope without damaging loss. (Chambers, 1989, p1)”
The root causes are centred around (i) social and economic structures (ii) ideologies (iii) history and culture – all of which seek to highlight the underlying dimensions under which people lack legitimate access – see Table 1. The root causes are also connected with the function of the state and the nature of the control exercised by the public sector, with good governance, rule of law and the capabilities of administration. The reverse of the Pressure and Release Model therefore depicts a transition towards safety. Vulnerability has a time dimension built into it as it can be measured in terms of damage to future livelihoods and assets and not just to what happens to them after hazard occurs (Adger 2006; Blaikie et al 2014; Devereux 2022)
As some groups are more prone to damage and losses than others, key variables that often come into play in distinguishing the magnitude of effect to such groups would be class/wealth, occupation, ethnicity, gender, disability and health status, age and immigration status, nature and extent of social network (Blaikie et al 2014; Australian Government 2018).
2.3. Exploring Australia’s Vulnerability to Disaster Risks
Australia currently ranks 23rd on the World Risk Index with an index of 21.90. Recent figures also indicate that vulnerability has dwindled overtime making it one of the region’s most resilient and formidable countries compared to its Pacific Island neighbours such as Vanuatu (ranking number one as highly vulnerable), Tonga, Papua New Guinea and the Solomon Islands. Australia has demonstrated how a low level of vulnerability can lower disaster risks (Bündnis Entwicklung Hilft / IFHV 2016; Bündnis Entwicklung Hilft / IFHV 2019). Nonetheless, as these events are often unforeseen or taken-for-granted, its impacts are often slow-onset in nature and go unnoticed in some instances, while others are rapid. For instance, extreme weather events became more frequent in the first quarter of 2025 as tropical hurricanes with speeds of up to 195Km/hr were witnessed and subsequent floods affected Eastern Australia receiving at least a month’s worth of rainfall in just two days (Bündnis Entwicklung Hilft / IFHV 2025).
Despite Australia’s existing capacity and resilience to natural hazards, the country is still plagued by seasonal bushfires, floods, droughts, cyclones etc. where the damages run into billions of dollars, which comes at a cost to the economy (Papathoma-Köhle et al 2022). Such events still keeps experts in suspense as to wealthier nations with robust economies can also become vulnerable to global shocks and the impacts of hazards (Blaikie et al 2014; Bündnis Entwicklung Hilft / IFHV 2020; Devereux 2022). According to the World Risk Report6 culminating 10yr data from 2016 to 2025 on the trends in Australia’s degree of vulnerability to hazards, it was found that Australia has performed relatively well in terms of vulnerability reduction (see Figure 2). However, much work needs to be done to empower communities and build capacity for addressing disaster risks (Birkmann et al (2022).
In a similar vein, the Australian government’s Measuring What Matters Wellbeing Statement7 draws on the Australian Disaster Resilience Index to demonstrate that 22% of its population live in areas of low resilience capacity, 52% in areas of moderate capacity, and 26% in areas of high capacity. This means that about 4.4 million people as of 2024 have been living in places with lower resilience capacity (Australian Government 2023). Similarly, the Index for Risk Management (INFORM)8 Risk Index has found that Australia is rated as a low risk area. This currently indicates an index score of 2.1 (see Figure 3).
For a country that is endowed with natural resources, it can be deduced that there needs to be a rationale for understanding how vulnerability intersects with risks and natural hazards to generate disasters specifically addressing these within the context of Australia.
2.4. What Actually Makes Australia Vulnerable to Hazards?
Given the wide range of impacts hazards pose on the natural and built environment, it can be deduced that addressing vulnerable conditions limits the interactions between these conditions and the risks, which exacerbate them. However, an understanding of the complex systems requires the ability to distil complexity into something which people are able to fathom and engage with (Australian Government 2018). People, housing and infrastructure and assets are most susceptible to the impacts of hazards and when they are located in hazard-prone areas, and as such when the standards to which they have been built does not meet contemporary or anticipated building standards and codes they become hazard-prone (Australian Government 2018) – see Table 2.
Although, with social dimensions of risks and vulnerability such as affordability, the wealthier branch of society can afford to live in safer areas compared to the less privileged or unaware counterparts. According to the National Resilience Taskforce’s Profiling Australia’s Vulnerability Report9, it was found that there are several factors, which still makes Australia vulnerable to hazards. In addition, the Australian Government’s Intergenerational Report10 focuses on the forces that shape the economy over the next 40 years. It recognises the risks to the economy as they reduce physical capital, decrease productivity, and disrupt economic activity and supply chains. The report estimates that expenditure through Disaster Recovery Funding Arrangements11 could increase 3 to 3.6 fold over the next 40 years, equating to a cumulative impact of $130 billion in today’s monetary value (Australian Government 2023). Table 3 shows some examples of natural/man-made hazard events in Australia.
Table 4 shows the highest temperatures recorded across States during the summer periods leading to heatwaves. Figure 4 also shows the average annual maximum temperatures across Australian cities.
These forms of hazards are assessed across geographic regions based upon states and territories detailing priority systems at risk that are usually prioritized for further assessment. These include: (i) Defence and national security (ii) economy, trade and finance (iii) First Nations Values and knowledge (iv) health and social support (v) infrastructure and built environment (vi) natural environment (vii) primary industries and food (viii) regional and remote communities (Australian Government 2024). Other factors remain values-based, behavioural, or culturally-motivated tendencies that make people more vulnerable to hazards. For instance, living in coastal areas with close proximity to areas susceptible to ocean surge, or coastal flooding may present risks. Conversely, those deciding to live in bushland areas may be at risk of bushfires.
Nonetheless, people may not understand certain risks before making certain choices on where to live or locations to invest. This may largely be determined by culture as a way of life in alignment with geographical location of ancestry of people which guides their sense of place or belonging. As disaster risk reduction is often capital intensive in such instances, people may seek to evacuate, be less prepared or less capable of addressing their own risks as majority of that is left at the mercy of the public sector. Subsequently, as interventions may be subject to government prioritisation, trade-offs are embedded in processes that incentivise decisions about the zoning of areas, in scoping, planning stages of land-use, during design, construction, sale and management of infrastructure assets (Australian Government, 2018). These factors are identified in Table 5.
The Human Vulnerability Index (HDI) focuses on indicators such as income, race, ethnicity, and education. It addresses health accessibility, communication and social networks. As part of understanding the impact of climate change, and weather extremes, the Australian Climate Service12 advances understanding of community vulnerability through the development of two indexes currently in beta version:
- i.
- Australian Climate Social Vulnerability Index (ACSVIβ)
- i.
- ii. Industry of Employment Diversity Index beta (IEDIβ)
These sets of indices are utilized to measure social and economic vulnerability in Australian communities. It can be opined that communities with higher social cohesion and internal structure have higher adaptive capacity compared to communities with lower social cohesion. Thus, the Australian Climate Social Vulnerability Index (ACSVI) is designed and developed to enable better understanding of relative social vulnerability in the context of changing social climate. It uses indicators such as: socio-economic factors; access to services; social cohesion; health and disability; housing; and transport. The IEDI on the other hand is designed to measure employment diversity of an area in combination with other indicators of economic vulnerability when forming policy or making funding decisions. It provides nationally consistent measures of how concentrated employment is available within industries. Reliance on fewer industries is likely to make communities more vulnerable, compared to a diversified economy with higher concentration of industries.
2.5. Progression Towards Safety, Resilience and Transformative Adaptation
A key concept influencing vulnerability have been identified capacity, which may reflect on several forms of interventions such as coping capacity; adaptive capacity; transformative capacity; development capacity etc. – all of which determine the degree of susceptibility to hazards and ability to bounce forward in the aftermath of a hazard event. The Australian Institute for Disaster Resilience’s Report on Australia’s Riskscape13 cites the International Federation of Red Cross and Red Crescent Societies and defines this capacity at the community level as one that:
- ▪
- Knows its risks, is healthy, and can meet its basic needs in terms of shelter, food, water, and sanitation.
- ▪
- Has economic opportunities
- ▪
- Has well maintained infrastructure and accessible services
- ▪
- Can manage natural assets
- ▪
- Is socially cohesive
- ▪
- Is connected
Achieving all these therefore requires capacity and awareness for individuals and communities to adapt transformatively.
3. Methodology
3.1. Philosophical Positioning and Method
The study employs a qualitative method. The underlying philosophy guiding the study takes a constructivist philosophical stance built on understanding the world and its complex reality presented by vulnerable conditions experienced in Australia, despite its robustness in terms of capacity and resources. Qualitative data can be obtained through textual analysis, reviews, observations, semi-structured interviews etc. (Creswell 2016; Flick 2018; Patton 2015). Although subjective, qualitative studies involve assumptions and research problems inquiring into the meaning individuals and groups ascribe to a societal or human problem (Creswell and Poth 2016). This study was aimed at exploring the root dimensions of Australia’s vulnerability to hazards and thus utilises a two-way approach. First is through the review of literature to understand the various perspectives of vulnerability as well as influencing factors, including theoretical underpinnings explaining this phenomenon. Secondly, given its complexity, the paper uses a systems-thinking approach to explore the cause-effect relationships using a Causal Loop Diagram to identify the possible interdependencies and relationships existing between them.
3.2. Research Strategy
As a qualitative exploratory study, the paper uses secondary qualitative data to investigate several factors influencing vulnerability using Australia as a single case study. As the main unit of analysis, careful critical literature search was conducted using Boolean operators in the databases in a manner that reflected possible causative factors of vulnerability, which were generic based on State or territory risk profile. Conversely, given the complex, uncertain and ambiguous nature of vulnerability and its interactions with disaster risks, this paper employs a systems-thinking approach built on a complexity-informed methodology to reflect the multidimensional perspectives of disaster risk and vulnerability reduction and management. By using a Causal Loop Diagram - a soft modelling technique used in complexity-informed evaluations (Fredericks et al 2008; Barbrook-Johnson et al 2021; Crabolu et al 2023), the paper enhances learning of complex systems to better explore vulnerability as a phenomenon.
The study utilises secondary data sourced from databases such as google scholar, Scopus and EBSCO. This paper therefore builds on complexity science using causal loop diagram and the Pressure and Release Model (Blaikie et al 2014; Crabolu et al 2023) to unravel the underlying root dimensions of Australia’s vulnerability to hazards with a view to exploring various ways through which concerted institutional interventions can be provided to address impending or residual risks. The exploratory study critically reviews literature using Scopus, EBSCO and Google scholar data bases to identify the factors ‘influencing vulnerability to hazards in Australia’. The search considered a time horizon of a 10-yr period from 2016-2025 to understand the possible issues associated with Australia’s vulnerability to seasonal hazards. This is further reinforced by using a graphic visualizer [i.e. Graphicviz - DOT] based on programmable codes from ‘Co-pilot software’ to unravel, interpret and assess emerging factors using Causal loop Diagram. The rationale was to consolidate on the findings from the critical review. All identified factors were manually coded and mapped to the PAR model to justify themes, including the cause-and-effect interpretations.
3.3. Data Collection, Search Strategy, Screening and Analysis
The study included publications that satisfied a set criterion based on transparency and replicability to strengthen the focus on ‘vulnerability’ literature, which is vast but scarcely looked at from a cause-effect perspective within the context of the Australian vulnerability-scape. The inclusion criteria, given the scope of the study were as follows: (i) studies published in English (ii) studies that have been peer reviewed (iii) studies published between 2016 and 2025 (iv) studies containing keywords. The exclusion criteria were as follows: (i) studies not published in English (ii) studies published before 2016 or after 2025 (iii) studies that did not contain keywords/search phrase (v) editorials, reviews, field notes.
4.1. Results from Critical Literature Review
In total, the search generated 2,286 documents, which included published books, book chapters, articles, conference papers, and reports [total (n=1,135)] for Scopus; [total (n=1,000)] for google scholar and [total (n=151)] for EBSCO. The process of considering inclusion-exclusion criteria ensured clarity in search for appropriate resources. Using the Boolean operators within the databases, the search string included ‘vulnerability’ OR ‘weakness’ AND ‘enablers’. Duplicates were removed using Endnote to fine-tune search outcomes. Selected documents were then added unto NVivo and analysed to obtain themes supplementing the Causal loop diagram factors to show interactions, relationships and interdependencies (see research framework- Figure 5). The selected papers were then manually coded and analysed to justify alignment with the Pressure and Release Model.
4. Results and Discussion
4.2. Causal Loop Diagram for Factors Influencing Vulnerability to Hazards in Australia
Unlike the traditional methods of constructing a Causal Loop Diagram, using open coding, axial coding, causality coding and causality mapping (Kim and Anderson 2012; Eker and Zimmerman 2016), the graphicviz uses iterations to transform program codes into a simple readable diagram. The causal loop diagrams were generated in two stages. Firstly, a command prompt was selected using co-pilot where the search phrase: “write a graphicviz code for factors influencing vulnerability to hazards in Australia” was entered and loaded unto graphicviz online version (see Figure 6).
Secondly, the search phrase: “write a graphicviz code for a causal loop diagram for factors influencing vulnerability to hazards in Australia”. These were then analysed to compare and contrast codes, which emerged to aid the selection of themes for the study.
The same procedure was employed for understanding the institutional pressures required to reduce vulnerability to hazards in Australia. Thus, the command prompt: “write a graphicviz code for a causal loop diagram of isomorphic pressures required to reduce vulnerability to hazards in Australia” was conducted on Co-pilot and program codes were added unto graphicviz to obtain Figure 7.
5. Discussion
- a. Deconstructing Causal loop diagram for factors influencing vulnerability to hazards in Australia
Extreme hazard events are exacerbated by factors such as climate change (+) and environmental degradation (+). For instance, poor solid waste management often leads to blocked drainage infrastructure and thus flooding eventually. Likewise eroded soils, deforestation and wetland destruction propels extreme hazard impact. Conversely, the effect of climate change manifested through temperature extremes lead to heatwaves and bushfires. Thus, both factors have a positive effect on the magnitude of hazards. Unchecked or rapid population growth and urbanization (+) also leads to settlement in high risk areas. Whereas with good land-use planning and governance (-), communities are likely to reside in high-risk areas. With extreme hazards comes impact which necessitates the need for better preparedness and mitigation (-) which reduces vulnerability (see Figure 6). The key idea is to illustrate the root dimensions as well as cause-effect factors influencing Australia’s vulnerability.
5.2. Exploring Pathways Toward Vulnerability Reduction and Transformative Adaptation: An Institutional Lens
“Institutions are social structures that have attained a high level of resilience and are composed of cultural-cognitive, normative and regulative elements that, together with associated activities and resources, offer stability and meaning to social life” (Scott, 2001: 48). Since several studies within the confines of disaster risk management have widely acknowledged that disasters are not natural but are consequences of anthropogenic activities triggered by human behaviours, then it can be opined that the interactions between vulnerability and risks leading to hazards are outcomes of our actions and inactions, which is shaped by our very own institutions. Thus, in distinguishing what institutions are, it is important to note that they culminate symbolic and relational systems, routines and artefacts (Scott 2001), which guide human behaviours and are significant in reducing risks and vulnerability – see Table 6.
There is limited knowledge amongst decision-makers and the public of how complex and highly changing systems interact across our society as extreme events also create systemic shocks that disrupt systems and quickly cascade to overwhelm the capacity of social, economic and natural systems to cope. By transformative adaptation, reference is made to the changes that fundamentally alter’s an entire system’s ecological and social properties and functions. It aims to reduce the root dimensions of vulnerability to climate change (Adger and Barnett 2009; Fedele et al 2019). Table 7 shows the codes that emerged from analysis of selected documents using the Nvivo software.
Resource access and knowledge were found to be the most influential factors determining vulnerability within communities. Although governance is an encompassing phenomenon that explains coordinated efforts to pull together resources to address risks, it’s use has been strictly related to institutional arrangements and policies reflecting the non-structural dimensions of risks and how governments’ responses exacerbate or reduces the risks amidst the cultural dimensions shaping how people view and perceive risks.
Figure 8 illustrates a multi-level framework showing the shared responsibility of vulnerability and risk reduction. Considering all spheres of society, including individuals and households, concerted efforts should be made to tackle the root dimensions of vulnerability, the dynamic pressures, and unsafe conditions of risks presented by the persistence of risks triggered by interactions between structures and processes. In a nutshell, given the vast use of the Pressure and Release Model, it is opined that reversing the root dimensions, dynamic pressures and unsafe conditions, simultaneously addresses the vulnerability in all its forms of progression – see Table 8.
5.3. Causal Loop Diagram of Isomorphic Pressures Required to Reduce Vulnerability to Hazards in Australia
Vulnerability to hazards in Australia has a positive effect on lessons management practices wherein hazard occurrences provides a basis for institutional learning (+). Learning from natural hazard occurrences provides opportunities for normative expectations and demands (pressures) (+) to uphold deeply entrenched professional standards and expert knowledge to address risks leading to disasters. Furthermore, it unravels policy limitations triggered by ambiguity and uncertainties in addressing risks thus requiring the need to mimic or emulate best practices and enhance lessons learned from communities that have successfully reduced their vulnerability (+). Coercive pressures (+) on the other hand is manifested through laws, regulations, building codes etc. and contributes positively to improved governance and compliance (+), as well as community and infrastructure resilience (+) where risk-sensitive land-use planning (+) is in effect. These factors (i.e. community and infrastructure resilience (-) and risk-sensitive land-use planning (-)) reduce vulnerability and improves a community’s capacity to cope before, during and in the aftermath of hazards (see Figure 7). Based on the foregoing, it can be deduced that core influencing factors of vulnerability cuts across resource access, knowledge, governance and culture. In view of the analysis conducted using Nvivo, it was found that resource access was more critical in reducing vulnerability compared to other factors broadly categorised. Where resources may be available, but when people lack access, then there is a likelihood of the magnification of risks leading to hazard impact.
6. Conclusion and Recommendation
The findings reiterate the fact that vulnerability exists in various shapes or forms. Most especially in the taken-for-granted aspects of social and structural dimensions of society. Factors influencing Australia’s vulnerability can best be unravelled by first identifying the root dimensions upon which the risk exacerbating factors have developed overtime, leading to dynamic pressures and unsafe conditions, which interact to magnify hazards. By using the causal loop diagram, it was inferred that environmental degradation and climate change are well known enablers and are key determinants of vulnerability in Australia. Risk-sensitive land-use planning influences settlement in hazard-prone areas wherein, the awareness of the impending risks has the propensity to ensure people do not reside in hazard-prone areas..
Although triggered by hazard events, lessons management acts as a strong panacea for incentivizing and investing in improved preparedness and mitigation. The limitation of the study lies in the ethos that there are still scarce studies focusing on vulnerability using cause-effect scenarios in an Australian context. Likewise, given the vast array of studies addressing vulnerability, there needs to be concerted efforts in understanding its underlying root dimensions to enable experts, governments and the academia to holistically address the key problems associated with this phenomenon bearing in mind it’s slow-on-set nature which lingers unnoticed.
| 1 | Australian Government (2025). Eliminating Antisemitism: Australian Government response to the Special Envoy’s Plan to Combat Antisemitism. Eliminating Antisemitism | Australian Government response to the Special Envoy’s Plan to Combat Antisemitism |
| 2 | Australian Government (2026a).Excise duty rates for fuel and petroleum products. Excise duty rates for fuel and petroleum products | Australian Taxation Office |
| 3 | Australian Government (2026b). Fact sheet: fuel excise relief measures from 1 April 2026. fact-sheet-fuel-excise-relief-measures-from-1-april-2026-2april2026.docx |
| 4 | World Economic Forum (2025). The Global Risks Report 2025: 20th Edition Insight Report. https://reports.weforum.org/docs/WEF_Global_Risks_Report_2025.pdf
|
| 5 | United Nations (2016). Report of the open-ended intergovernmental expert working group on indicators and terminology relating to disaster risk reduction. Seventy-first session. Agenda 19(c). https://www.preventionweb.net/files/50683_oiewgreportenglish.pdf?startDownload=true
|
| 6 | Bündnis Entwicklung Hilft/IFHV (2025): WorldRiskReport 2025. Focus: Floods. Berlin: Bündnis Entwicklung Hilft.. https://www.misereor.org/fileadmin/user_upload_misereororg/publication/en/worldriskreport-2025.pdf
|
| 7 | Australian Government (2023). Measuring What Matters: Australia’s First Wellbeing Framework. https://treasury.gov.au/sites/default/files/2023-07/measuring-what-matters-statement020230721_0.pdf
|
| 8 | INFORM (2026). Risk Facts and Figures. https://drmkc.jrc.ec.europa.eu/inform-index/INFORM-Risk
|
| 9 | Australian Government (2018). Profiling Australia’s Vulnerability: the interconnected causes and cascading effects of systemic disaster risk. Department of Home Affairs. Profiling Australia's Vulnerability: The interconnected causes and cascading effects of systemic disaster risk |
| 10 | Australian Government (2023). International Report 2023 Australia’s Future to 2063. https://www.aidr.org.au/media/11357/australias_riskscapes-2024_v10.pdf
|
| 11 | Disaster Recovery Funding Arrangements. https://www.nema.gov.au/our-work/disaster-recovery/disaster-recovery-funding-arrangements
|
| 12 | Australian Climate Service (2026). https://www.acs.gov.au/pages/vulnerability
|
| 13 | Australian Institute for Disaster Resilience (AIDR) (2024). Australia’s Riskscape: A companion to the Major Incidents Report 2023-24. https://www.aidr.org.au/media/11357/australias_riskscapes-2024_v10.pdf
|
References
- Adger, W. N. Vulnerability. Glob. Environ. Change 2006, 16, 268–281. [Google Scholar] [CrossRef]
- Adger, W. N.; Barnett, J. Four reasons for concern about adaptation to climate change. Environ. Plan. A 2009, 41, 2800–2805. [Google Scholar] [CrossRef]
- Ansell, C.; Geyer, R. Pragmatic complexity ’a new foundation for moving beyond ‘evidence-based policy making’? Policy Stud. 2017, 38, 149–167. [Google Scholar] [CrossRef]
- Australian Government (2026a).Excise duty rates for fuel and petroleum products. Excise duty rates for fuel and petroleum products | Australian Taxation Office.
- Australian Government (2026b). Fact sheet: fuel excise relief measures from 1 April 2026. fact-sheet-fuel-excise-relief-measures-from-1-april-2026-2april2026.docx. Available online:.
- Australian Government. Measuring What Matters: Australia’s First Wellbeing Framework. 2023. Available online: https://treasury.gov.au/sites/default/files/2023-07/measuring-what-matters-statement020230721_0.pdf.
- Australian Government. Profiling Australia’s Vulnerability: the interconnected causes and cascading effects of systemic disaster risk. Department of Home Affairs. Profiling Australia's Vulnerability: The interconnected causes and cascading effects of systemic disaster risk.
- Australian Institute for Disaster Resilience (AIDR). Australia’s Riskscape: A companion to the Major Incidents Report 2023-24. 2024, 8. Available online: https://www.aidr.org.au/media/11357/australias_riskscapes-2024_v10.pdf.
- Baggio, R.; Scott, N.; Cooper, C. Improving tourism destination governance: a complexity science approach. Tour. Rev. 2010, 65, 51–60. [Google Scholar] [CrossRef]
- Barbrook-Johnson, P.; Castellani, B.; Hills, D.; Penn, A.; Gilbert, N. Policy evaluation for a complex world: Practical methods and reflections from the UK Centre for the Evaluation of Complexity across the Nexus. Evaluation 2021, 27, 4–17. [Google Scholar] [CrossRef]
- Birkmann, J.; Jamshed, A.; McMillan, J. M.; Feldmeyer, D.; Totin, E.; Solecki, W.; et al. Understanding human vulnerability to climate change: A global perspective on index validation for adaptation planning. Sci. Total Environ. 2022, 803, 150065. [Google Scholar] [CrossRef] [PubMed]
- Blaikie, P.; Cannon, T.; Davis, I.; Wisner, B. At risk: natural hazards, people's vulnerability and disasters; Routledge, 2014. [Google Scholar]
- Boulton, J. G.; Allen, P. M.; Bowman, C. Embracing complexity: Strategic perspectives for an age of turbulence; OUP Oxford, 2015. [Google Scholar]
- Bündnis Entwicklung Hilft / IFHV. World Risk Report 2015: Food security. United Nations Institute for Environment and Human Security. UNDRR website. 2015. Available online: www.preventionweb.net/publication/worldriskreport-2015-focus-food-insecurity (accessed on 5 January 2025).
- Bündnis Entwicklung Hilft / IFHV. World Risk Report 2016: Logistics and Infrastructure. United Nations Institute for Environment and Human Security. UNDRR website. 2016. Available online: www.preventionweb.net/publication/world-risk-report2016-importance-infrastructure (accessed on 5 January 2025).
- Bündnis Entwicklung Hilft / IFHV. World Risk Report 2017: Analysis and Prospects. The Institute for International Law of Peace and Armed Conflict. UNDRR website. 2017. Available online: www.preventionweb.net/publication/world-riskreport-2020-focus-forced-displacement-and-migration (accessed on 5 January 2025).
- Bündnis Entwicklung Hilft / IFHV. World Risk Report 2018: Child Protection and Children’s Rights. The Institute for International Law of Peace and Armed Conflict. Reliefweb. 2018. Available online: https://reliefweb.int/report/world/world-risk-report-2018-focus-child-protection-and-childrens-rights.
- Bündnis Entwicklung Hilft / IFHV. World Risk Report 2019: Water Supply. The Institute for International Law of Peace and Armed Conflict. Reliefweb website. 2019. Available online: https://reliefweb.int/report/world/worldriskreport-2019-focus-water-supply (accessed on 5 January 2025).
- Bündnis Entwicklung Hilft / IFHV. World Risk Report 2020: Forced Displacement and Migration. The Institute for International Law of Peace and Armed Conflict. UNDRR website. 2020. Available online: www.preventionweb.net/publication/world-risk-report-2020-focus-forced-displacement-and-migration (accessed on 5 January 2025).
- Bündnis Entwicklung Hilft / IFHV. World Risk Report 2021: Focus: Social Protection. The Institute for International Law of Peace and Armed Conflict. UNDRR 18.Royal Commission into National Natural Disaster Arrangement Report of October 2020. 2021. Available online: www.royalcommission.gov.au/natural-disasters/report.
- Bündnis Entwicklung Hilft / IFHV. World Risk Report 2025: Digitalization. The Institute for International Law of Peace and Armed Conflict. Reliefweb website. 2022. Available online: https:// reliefweb.int/report/world/worldriskreport-2022-focus-digitalization (accessed on 5 January 2025).
- Bündnis Entwicklung Hilft / IFHV. World Risk Report 2023: Diversity. The Institute for International Law of Peace and Armed Conflict’. UNDRR website. 2023. Available online: www. preventionweb.net/publication/world-risk-report-2023-focus-diversity.
- Bündnis Entwicklung Hilft / IFHV. World Risk Report 2024: Multiple Crises. The Institute for International Law of Peace and Armed Conflict. Available online: https://reliefweb.int/report/world/worldriskreport-2024-focus-multiple-crises (accessed on 5 January 2025).
- Bündnis Entwicklung Hilft / IFHV. World Risk Report 2025: Floods. The Institute for International Law of Peace and Armed Conflict. UNDRR website. UNDRR, 2025. Available online: www.preventionweb.net/publication/documents-and-publications/world-risk-report-2025-focus-floods.
- Chambers, R. Editorial Introduction: Vulnerability, Coping and Policy. The Institute of Development Studies and Partner Organisations. Journal contribution. 1989, p. 25. Available online: https://onlinelibrary.wiley.com/doi/abs/10.1111/j.1759-5436.1989.mp20002001.x.
- Crabolu, G.; Font, X.; Eker, S. Evaluating policy complexity with causal loop diagrams. Ann. Tour. Res. 2023, 100, 103572. [Google Scholar] [CrossRef]
- Creswell, J. W.; Poth, C. N. Qualitative inquiry and research design: Choosing among five approaches; Sage publications, 2016. [Google Scholar]
- Commonwealth of Australia. Australia Bureau of Meteorology: average monthly and annual temperature maps. 2024; 28. Available online: https://www.bom.gov.au/climate/maps/averages/temperature/.
- Devereux, S. Putting the Vulnerable First. In Revolutionizing Development; Routledge, 2022; pp. 93–100. [Google Scholar]
- Eker, S.; Zimmermann, N. Using textual data in system dynamics model conceptualization. Systems 2016, 4, 28. [Google Scholar] [CrossRef]
- Fedele, G.; Donatti, C. I.; Harvey, C. A.; Hannah, L.; Hole, D. G. Transformative adaptation to climate change for sustainable social-ecological systems. Environ. Sci. Policy 2019, 101, 116–125. [Google Scholar] [CrossRef]
- Flick, U. Doing qualitative data collection–charting the routes. In The SAGE handbook of qualitative data collection; 2018; pp. 1–16. [Google Scholar]
- Fredericks, K. A.; Deegan, M.; Carman, J. G. Using system dynamics as an evaluation tool: Experience from a demonstration program. Am. J. Eval. 2008, 29, 251–267. [Google Scholar] [CrossRef]
- INFORM. Risk Facts and Figures. 2026. Available online: https://drmkc.jrc.ec.europa.eu/inform-index/INFORM-Risk.
- International Federation of Red Cross and Red Crescent Societies. Road Map to Community Resilience. Version 2. 2021. Available online: https://preparecenter.org/wp-content/uploads/2023/05/FINAL-Road-Map-to-Community-Resilience-v2_En.pdf.
- Kim, H.; Andersen, D. F. Building confidence in causal maps generated from purposive text data: mapping transcripts of the Federal Reserve. Syst. Dyn. Rev. 2012, 28, 311–328. [Google Scholar] [CrossRef]
- Kirkwood, C. W. System dynamics methods. In College of Business Arizona State University USA; 1998. [Google Scholar]
- Oliver-Smith, A.; Alcántara-Ayala, I.; Burton, I.; Lavell, A. The social construction of disaster risk: Seeking root causes. Int. J. Disaster Risk Reduct. 2017, 22, 469–474. [Google Scholar] [CrossRef]
- Otto, I. M.; Reckien, D.; Reyer, C. P.; Marcus, R.; Le Masson, V.; Jones, L.; et al. Social vulnerability to climate change: a review of concepts and evidence. Reg. Environ. Change 2017, 17, 1651–1662. [Google Scholar] [CrossRef]
- Papathoma-Köhle, M.; Schlögl, M.; Garlichs, C.; Diakakis, M.; Mavroulis, S.; Fuchs, S. A wildfire vulnerability index for buildings. Sci. Rep. 2022, 12, 6378. [Google Scholar] [CrossRef] [PubMed]
- Patton, M. Q. Qualitative research & evaluation methods: Integrating theory and practice; Sage publications, 2014. [Google Scholar]
- Parkhurst, J. The politics of evidence: from evidence-based policy to the good governance of evidence; Routledge, 2016. [Google Scholar]
- Parsons, M., Reeve, I., McGregor, J., Marshall, G., Stayner, R., McNeill, J. ... & Morley, P. (2021). Australian Disaster Resilience Index Volume I: State of Disaster Resilience Report.
- Toinpre, O.; Mackee, J.; Gajendran, T. Analysing disaster risk reduction organisational fields: pathways to resilience. Aust. J. Emerg. Manag. 2025, 40, 38–47. [Google Scholar]
- Toinpre, O.; Mackee, J.; Gajendran, T. Analysing institutional responses towards disaster risk reduction: Challenges and antecedents. Aust. J. Emerg. Manag. 2024, 39, 61–70. [Google Scholar]
- United Nations. Report of the open-ended intergovernmental expert working group on indicators and terminology relating to disaster risk reduction. Seventy-first session. Agenda 19(c). 2016. Available online: https://www.preventionweb.net/files/50683_oiewgreportenglish.pdf?startDownload=true.
- Wisner, B.; Fordham, M. Vulnerability and capacity. Glob. Environ. Change 2014, 857–863. [Google Scholar] [CrossRef]
- Wisner, B.; Gaillard, J. C.; Kelman, I. Framing disaster: Theories and stories seeking to understand hazards, vulnerability and risk. In Disaster prevention; Routledge, 2015; pp. 44–62. [Google Scholar]
- Wisner, B. Power writ small and large: How disaster cannot be understood without reference to pushing, pulling, coercing, and seducing. In Why vulnerability still matters; Routledge, 2022; pp. 171–191. [Google Scholar]
- Wu, J. S.; Barbrook-Johnson, P.; Font, X. Participatory complexity in tourism policy: Understanding sustainability programmes with participatory systems mapping. Ann. Tour. Res. 2021, 90, 103269. [Google Scholar] [CrossRef]
Figure 1.
Global risks landscape. Source: Adapted from World Economic Forum (2025).
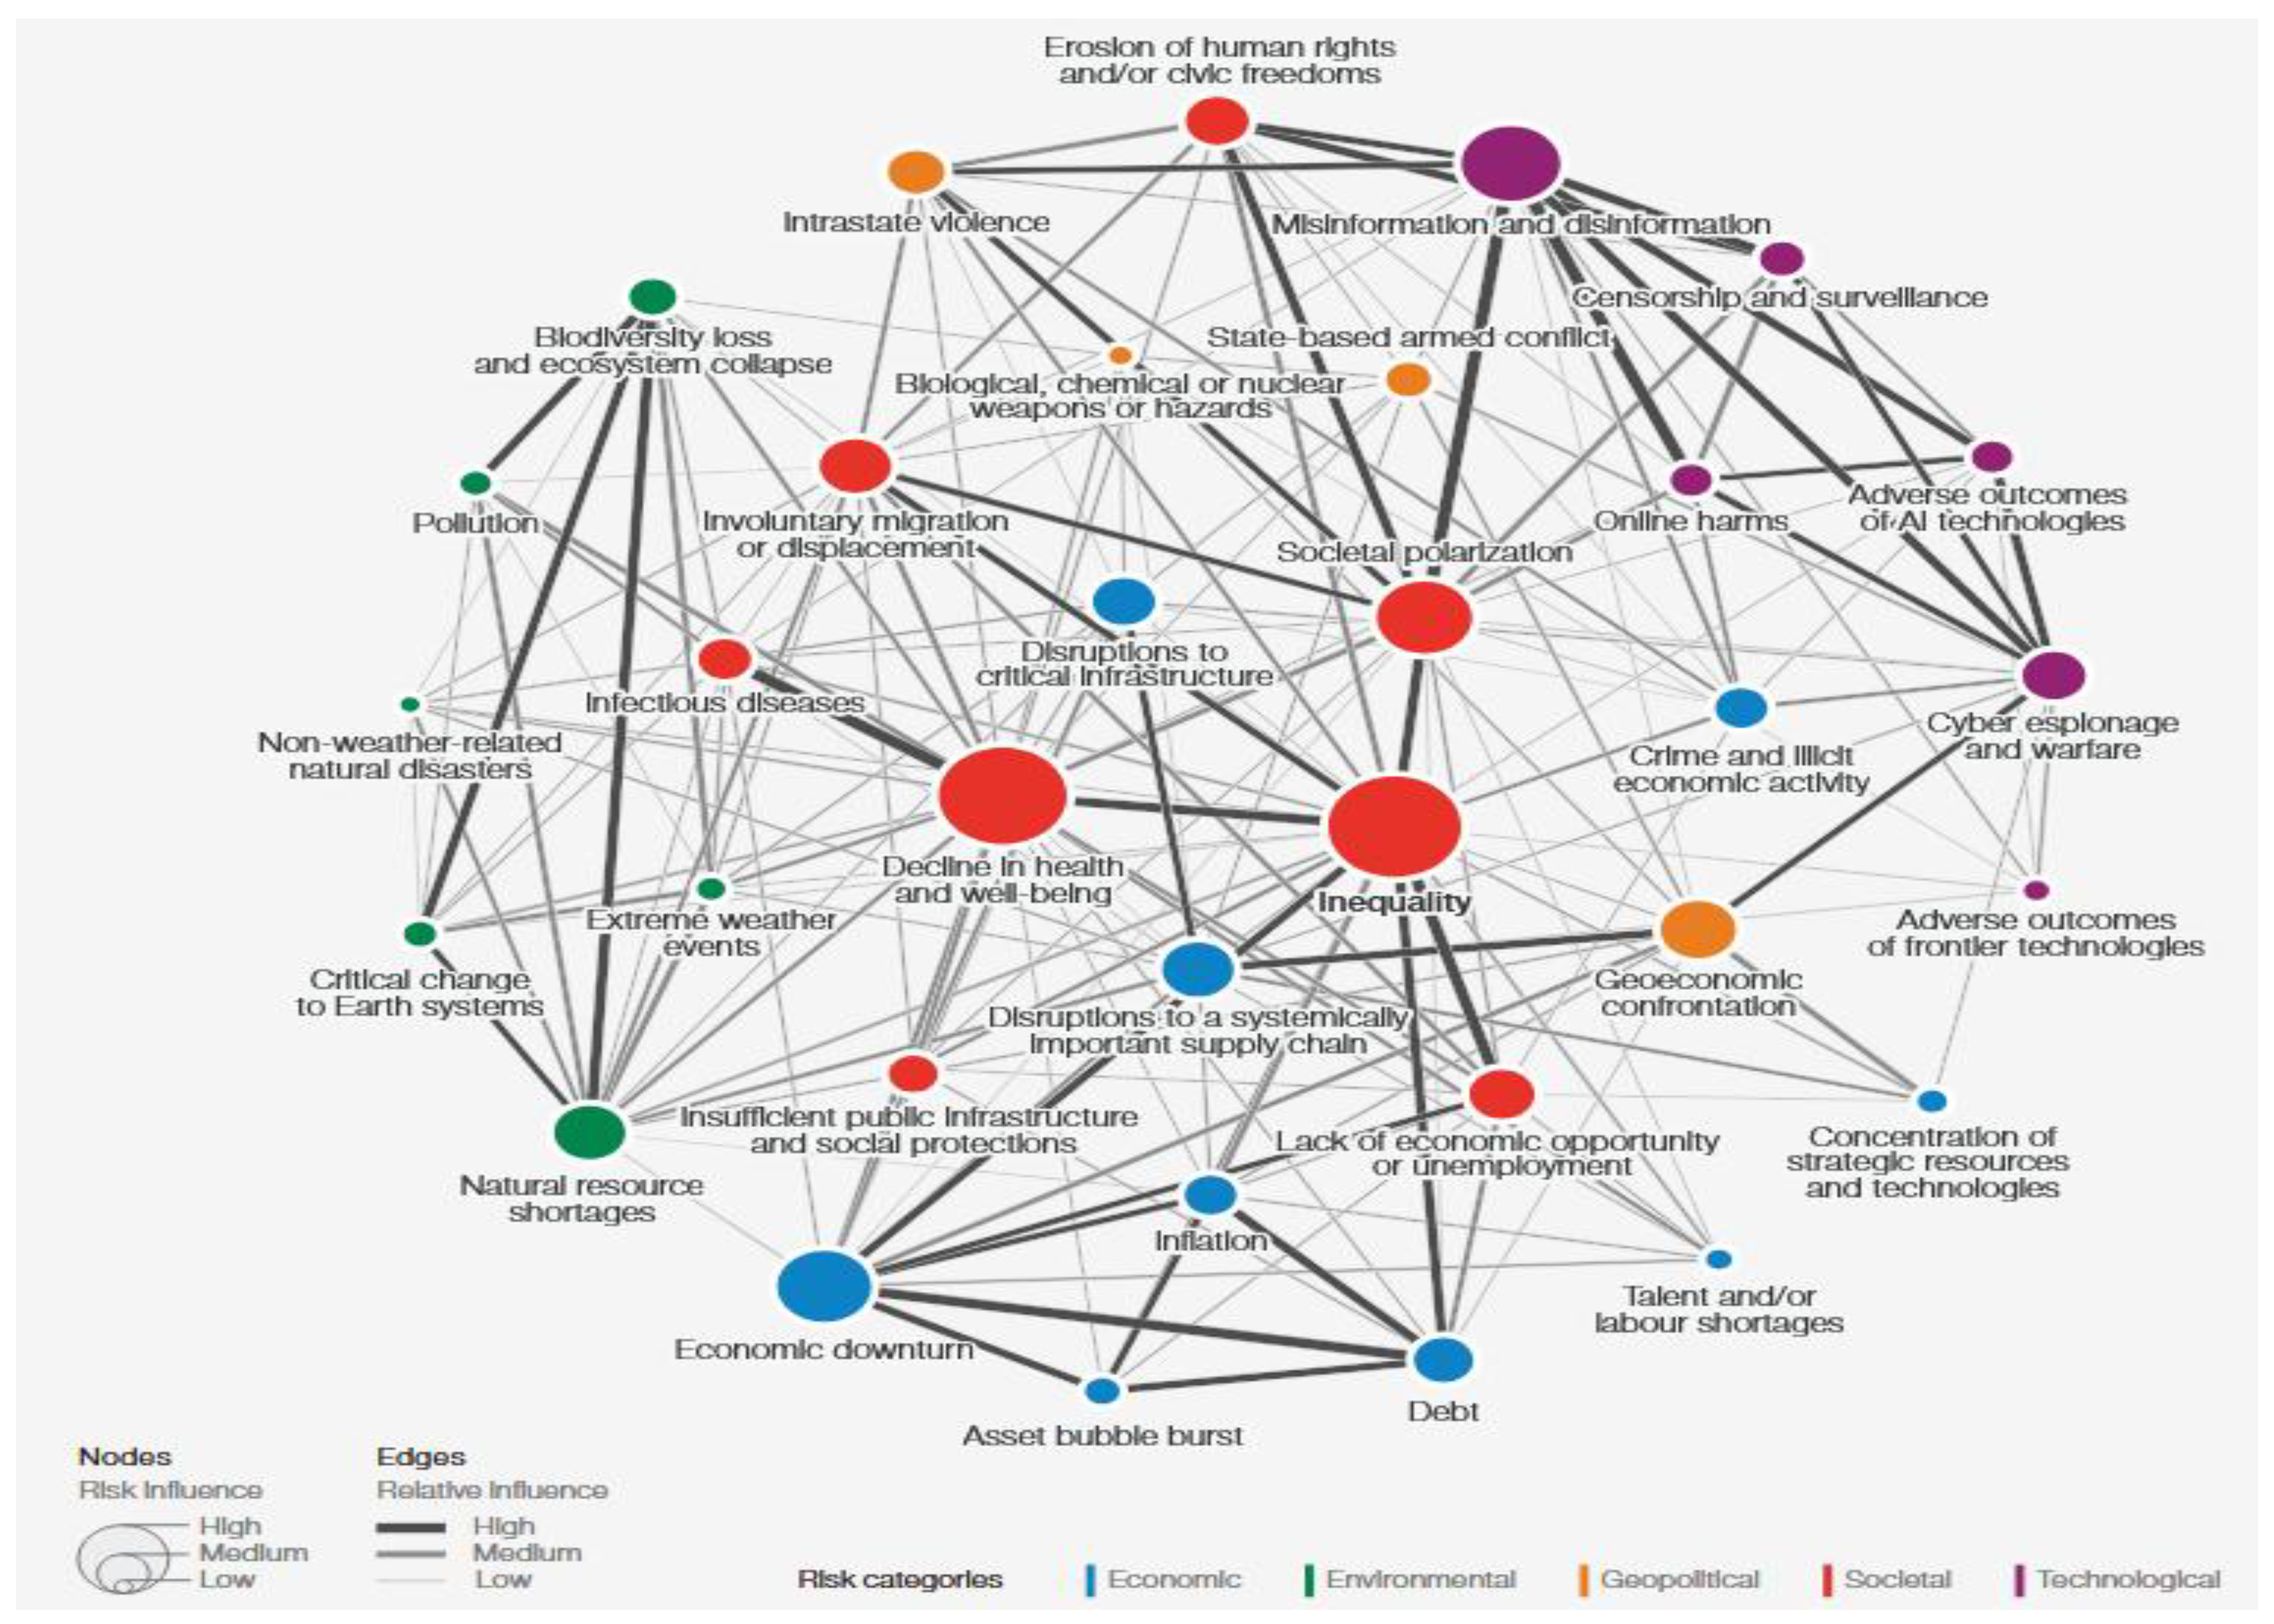
Figure 2.
Australia’s Vulnerability, and Capacity Trend (2016-2025). Source: Bündnis Entwicklung Hilft / IFHV (2016; 2017; 2018; 2019; 2020; 2021; 2022; 2023; 2024; 2025).
Figure 2.
Australia’s Vulnerability, and Capacity Trend (2016-2025). Source: Bündnis Entwicklung Hilft / IFHV (2016; 2017; 2018; 2019; 2020; 2021; 2022; 2023; 2024; 2025).
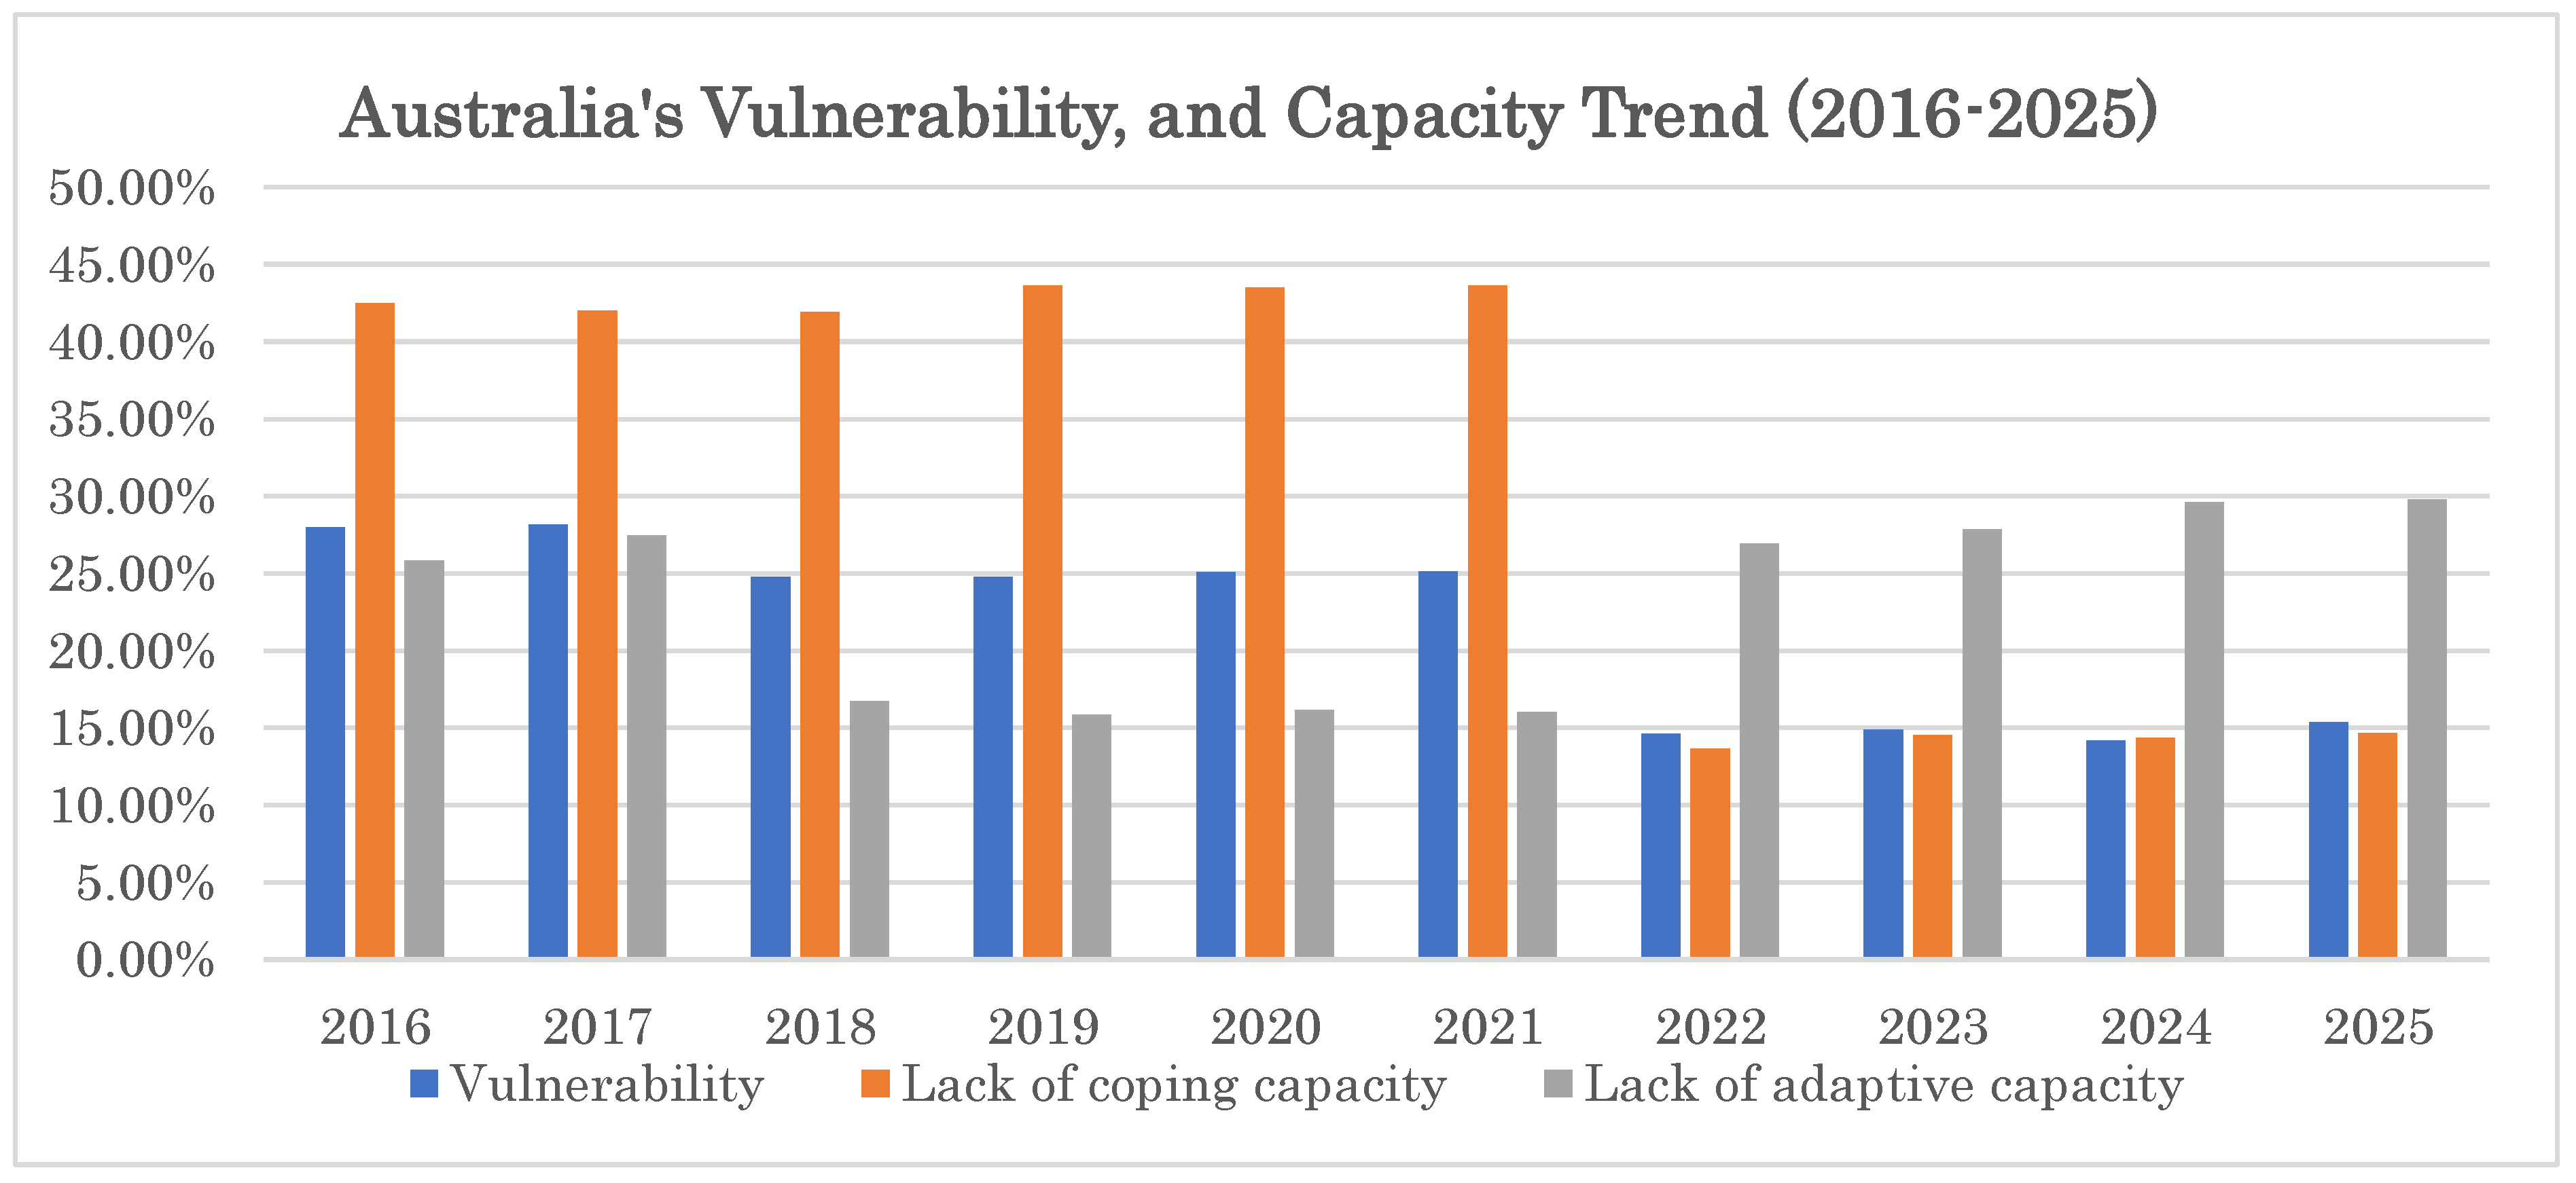
Figure 3.
Vulnerability Index Average Trend. Source: INFORM (2026).
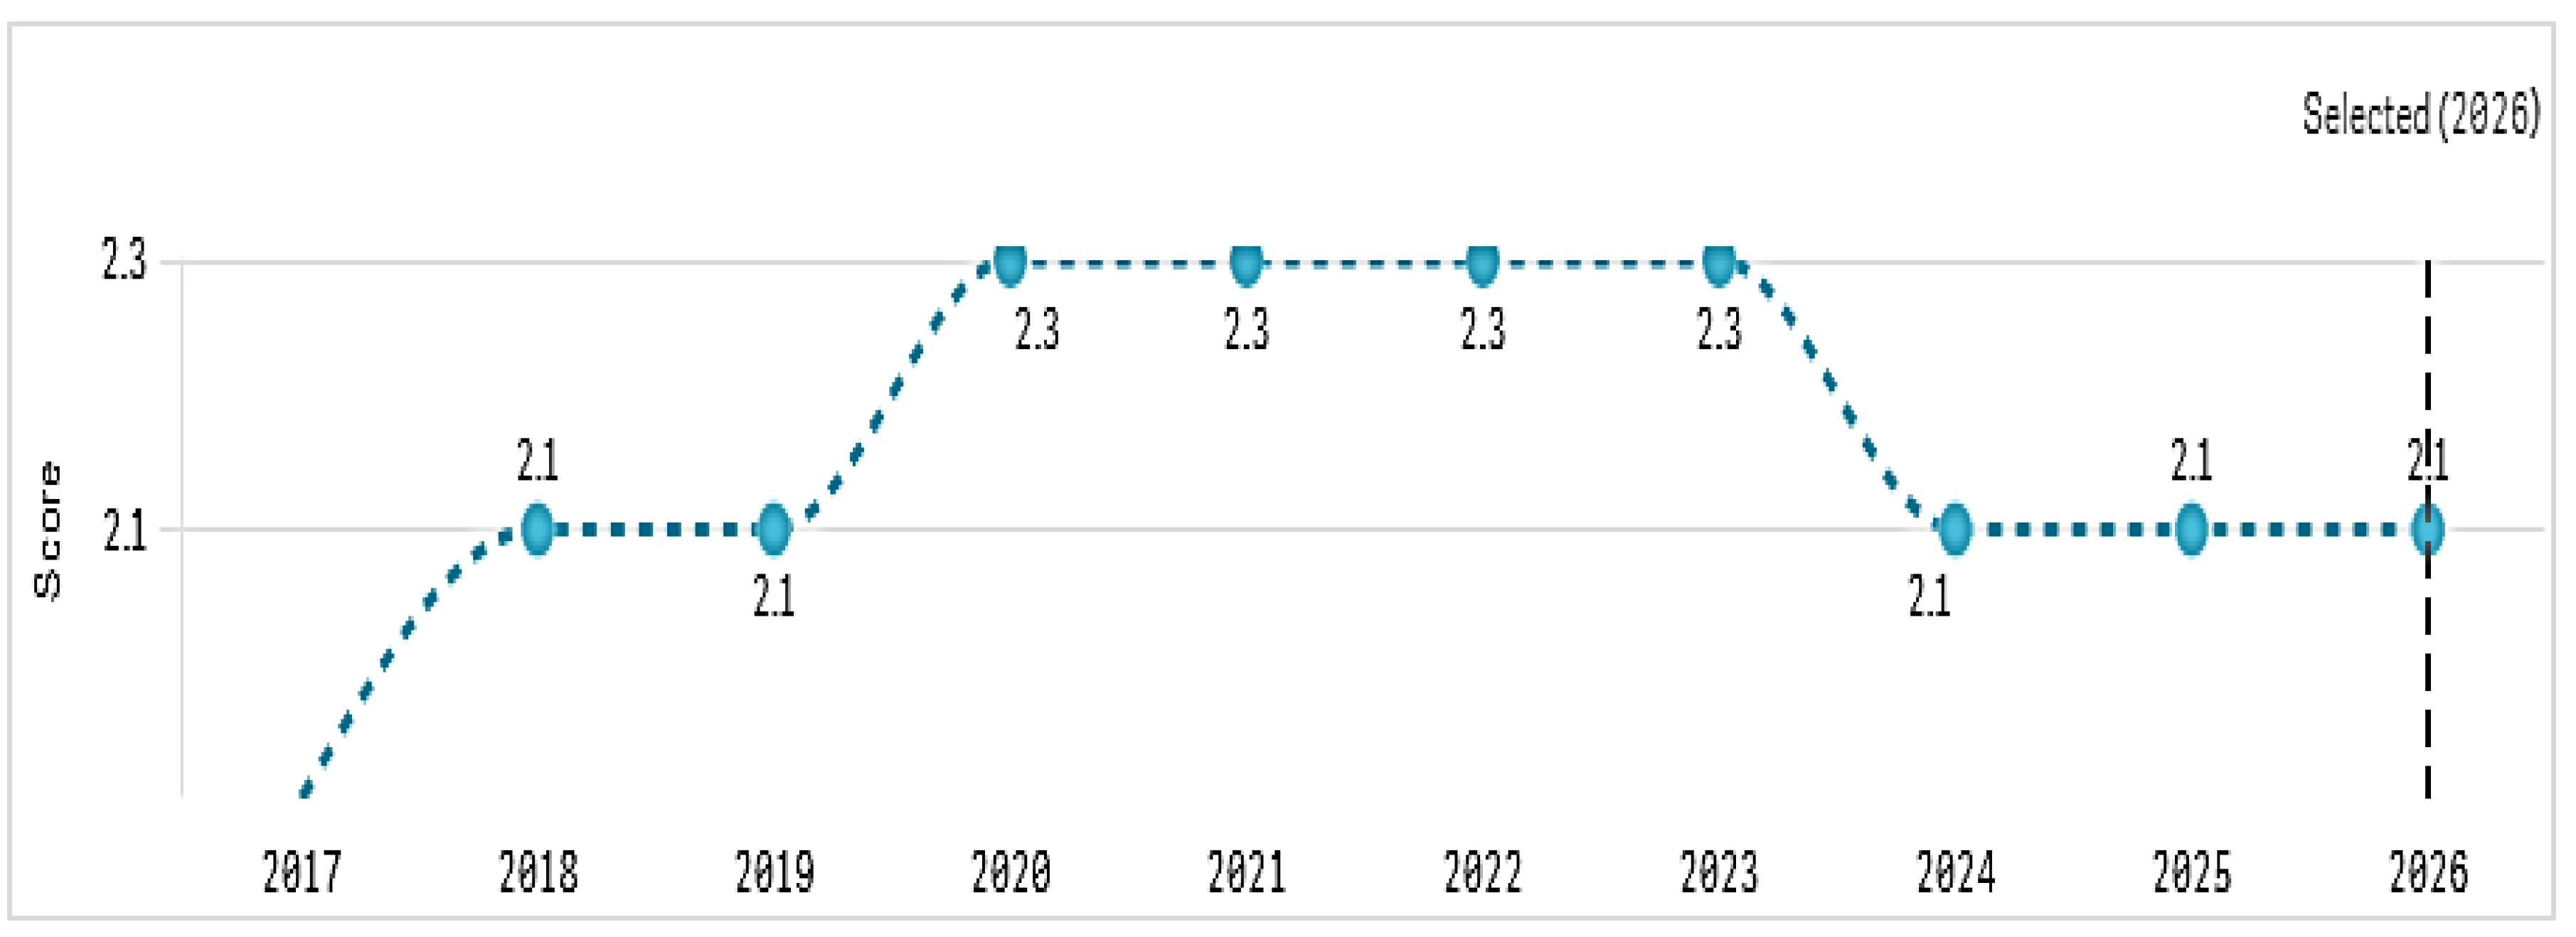
Figure 4.
Average annual maximum temperatures across Australian cities. Source: Commonwealth of Australia (2024).
Figure 4.
Average annual maximum temperatures across Australian cities. Source: Commonwealth of Australia (2024).
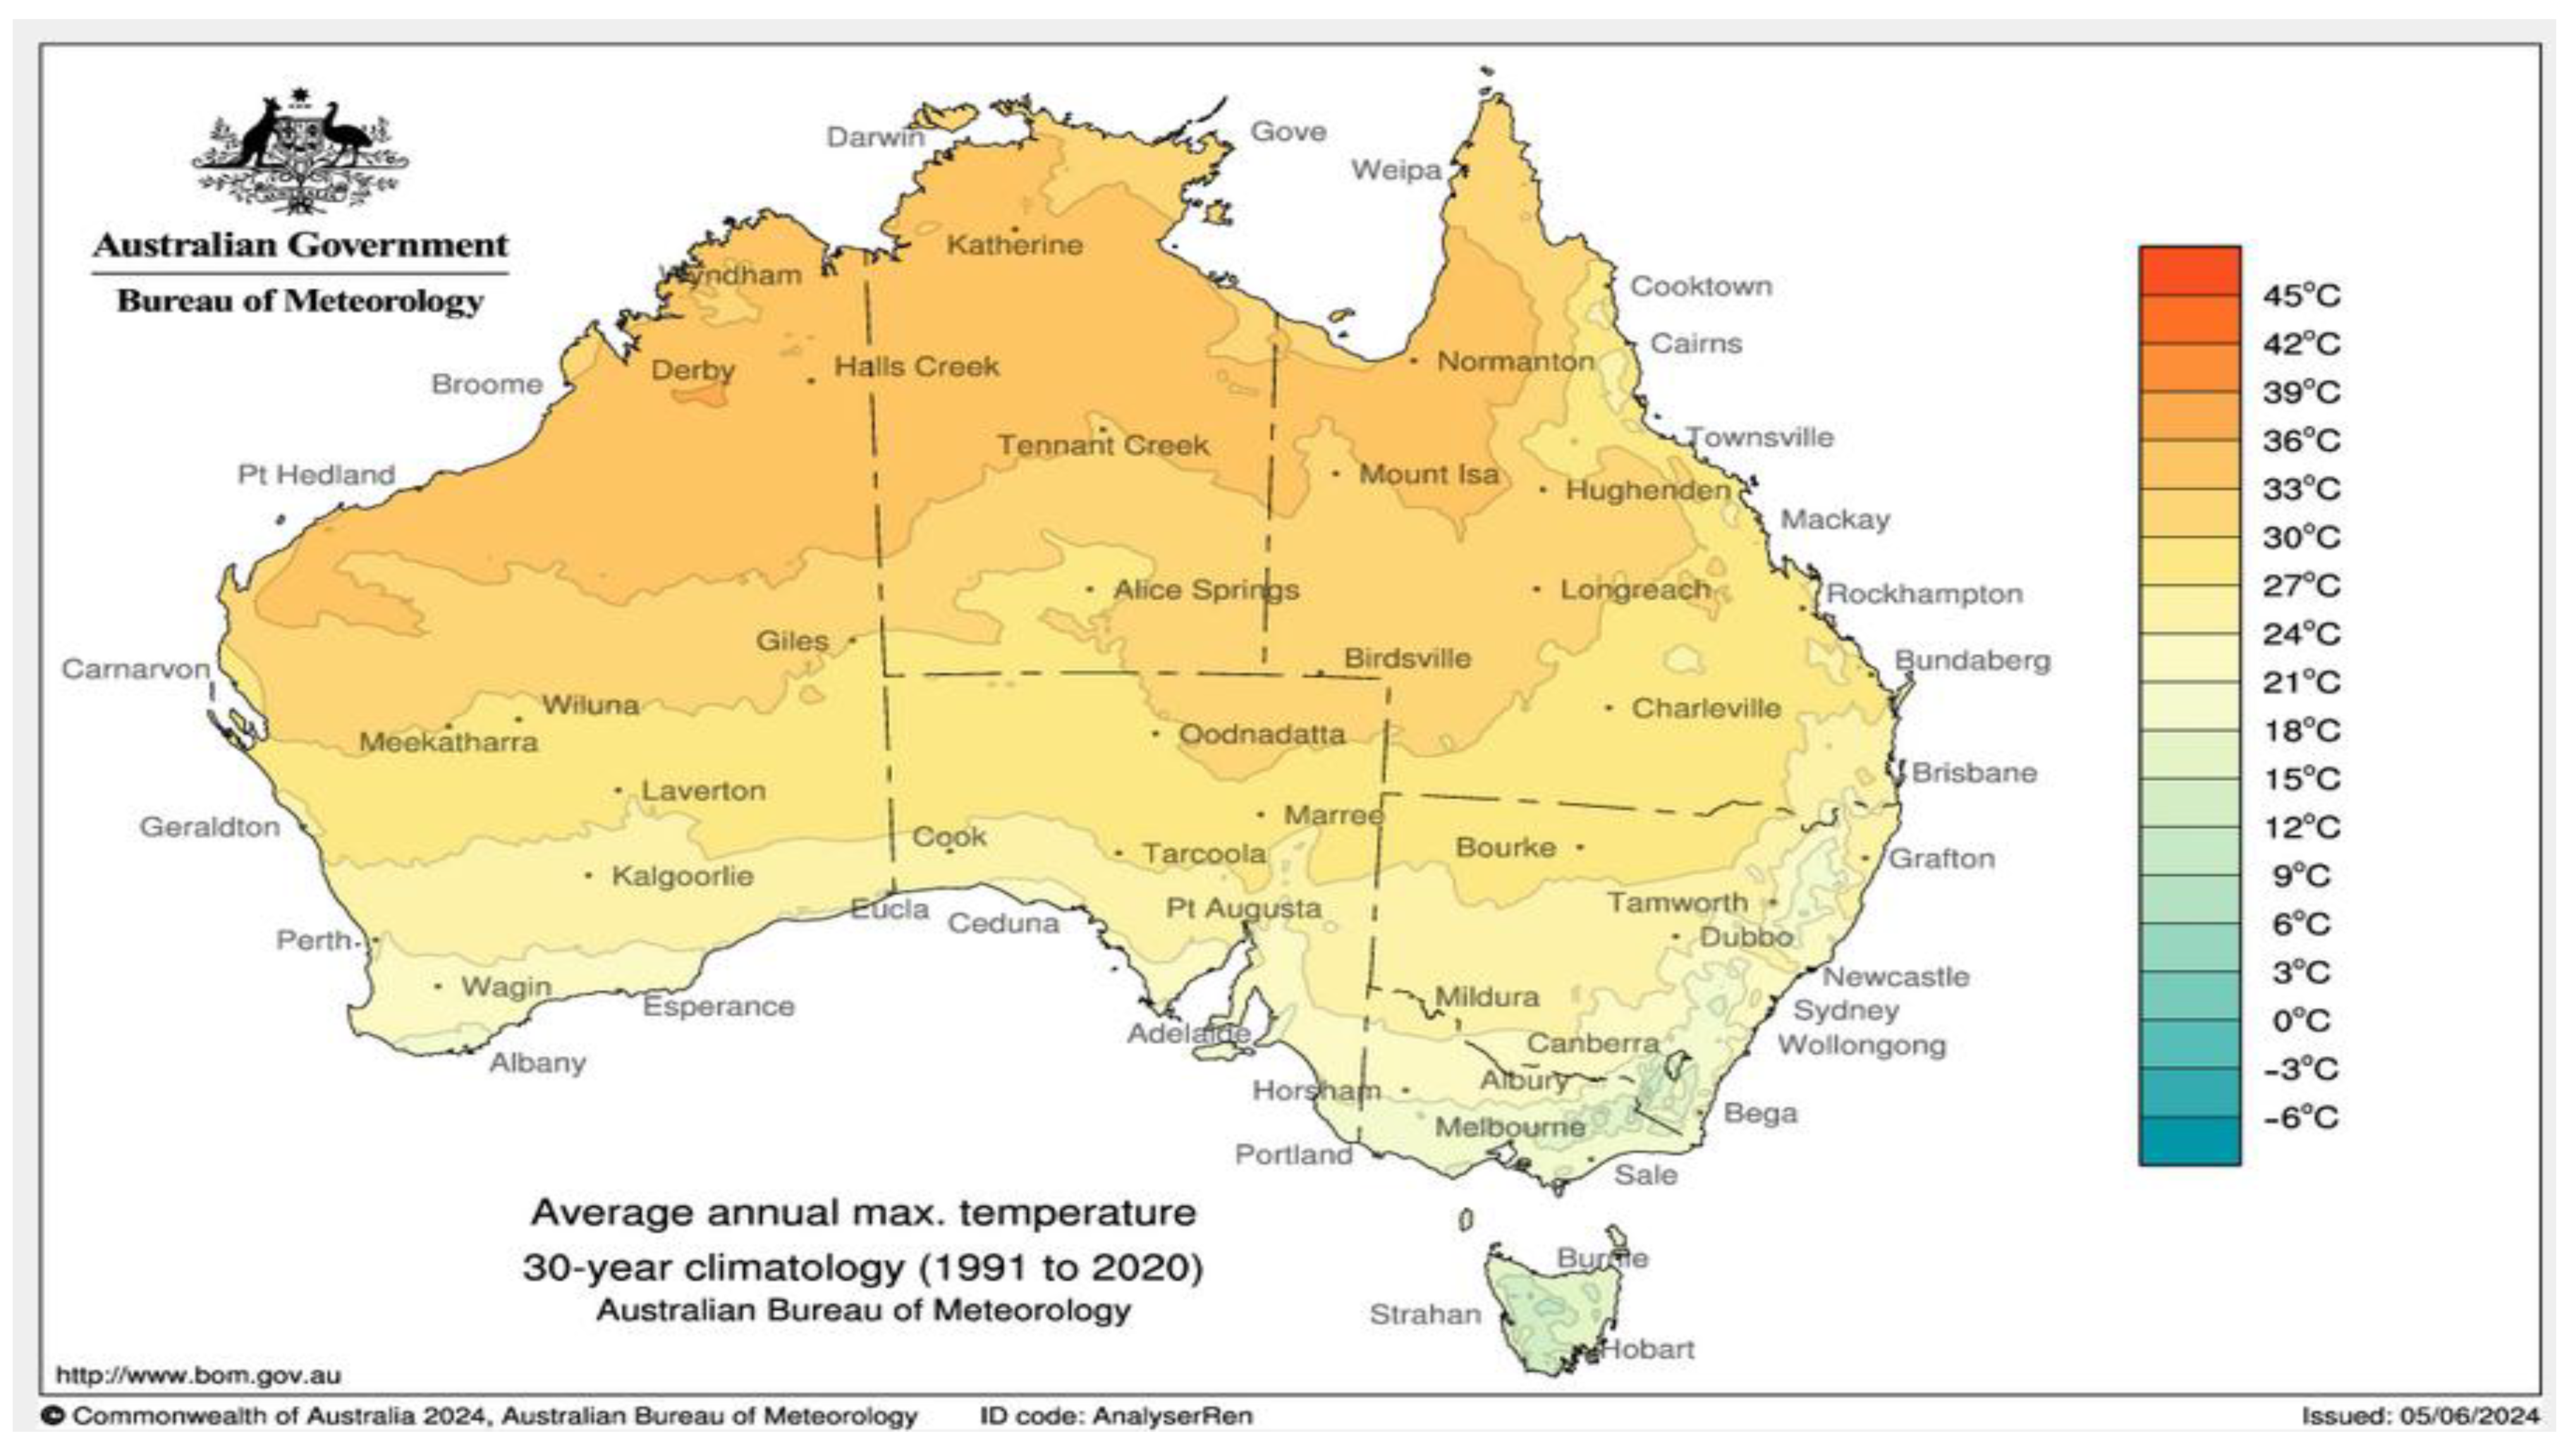
Figure 5.
Research framework.
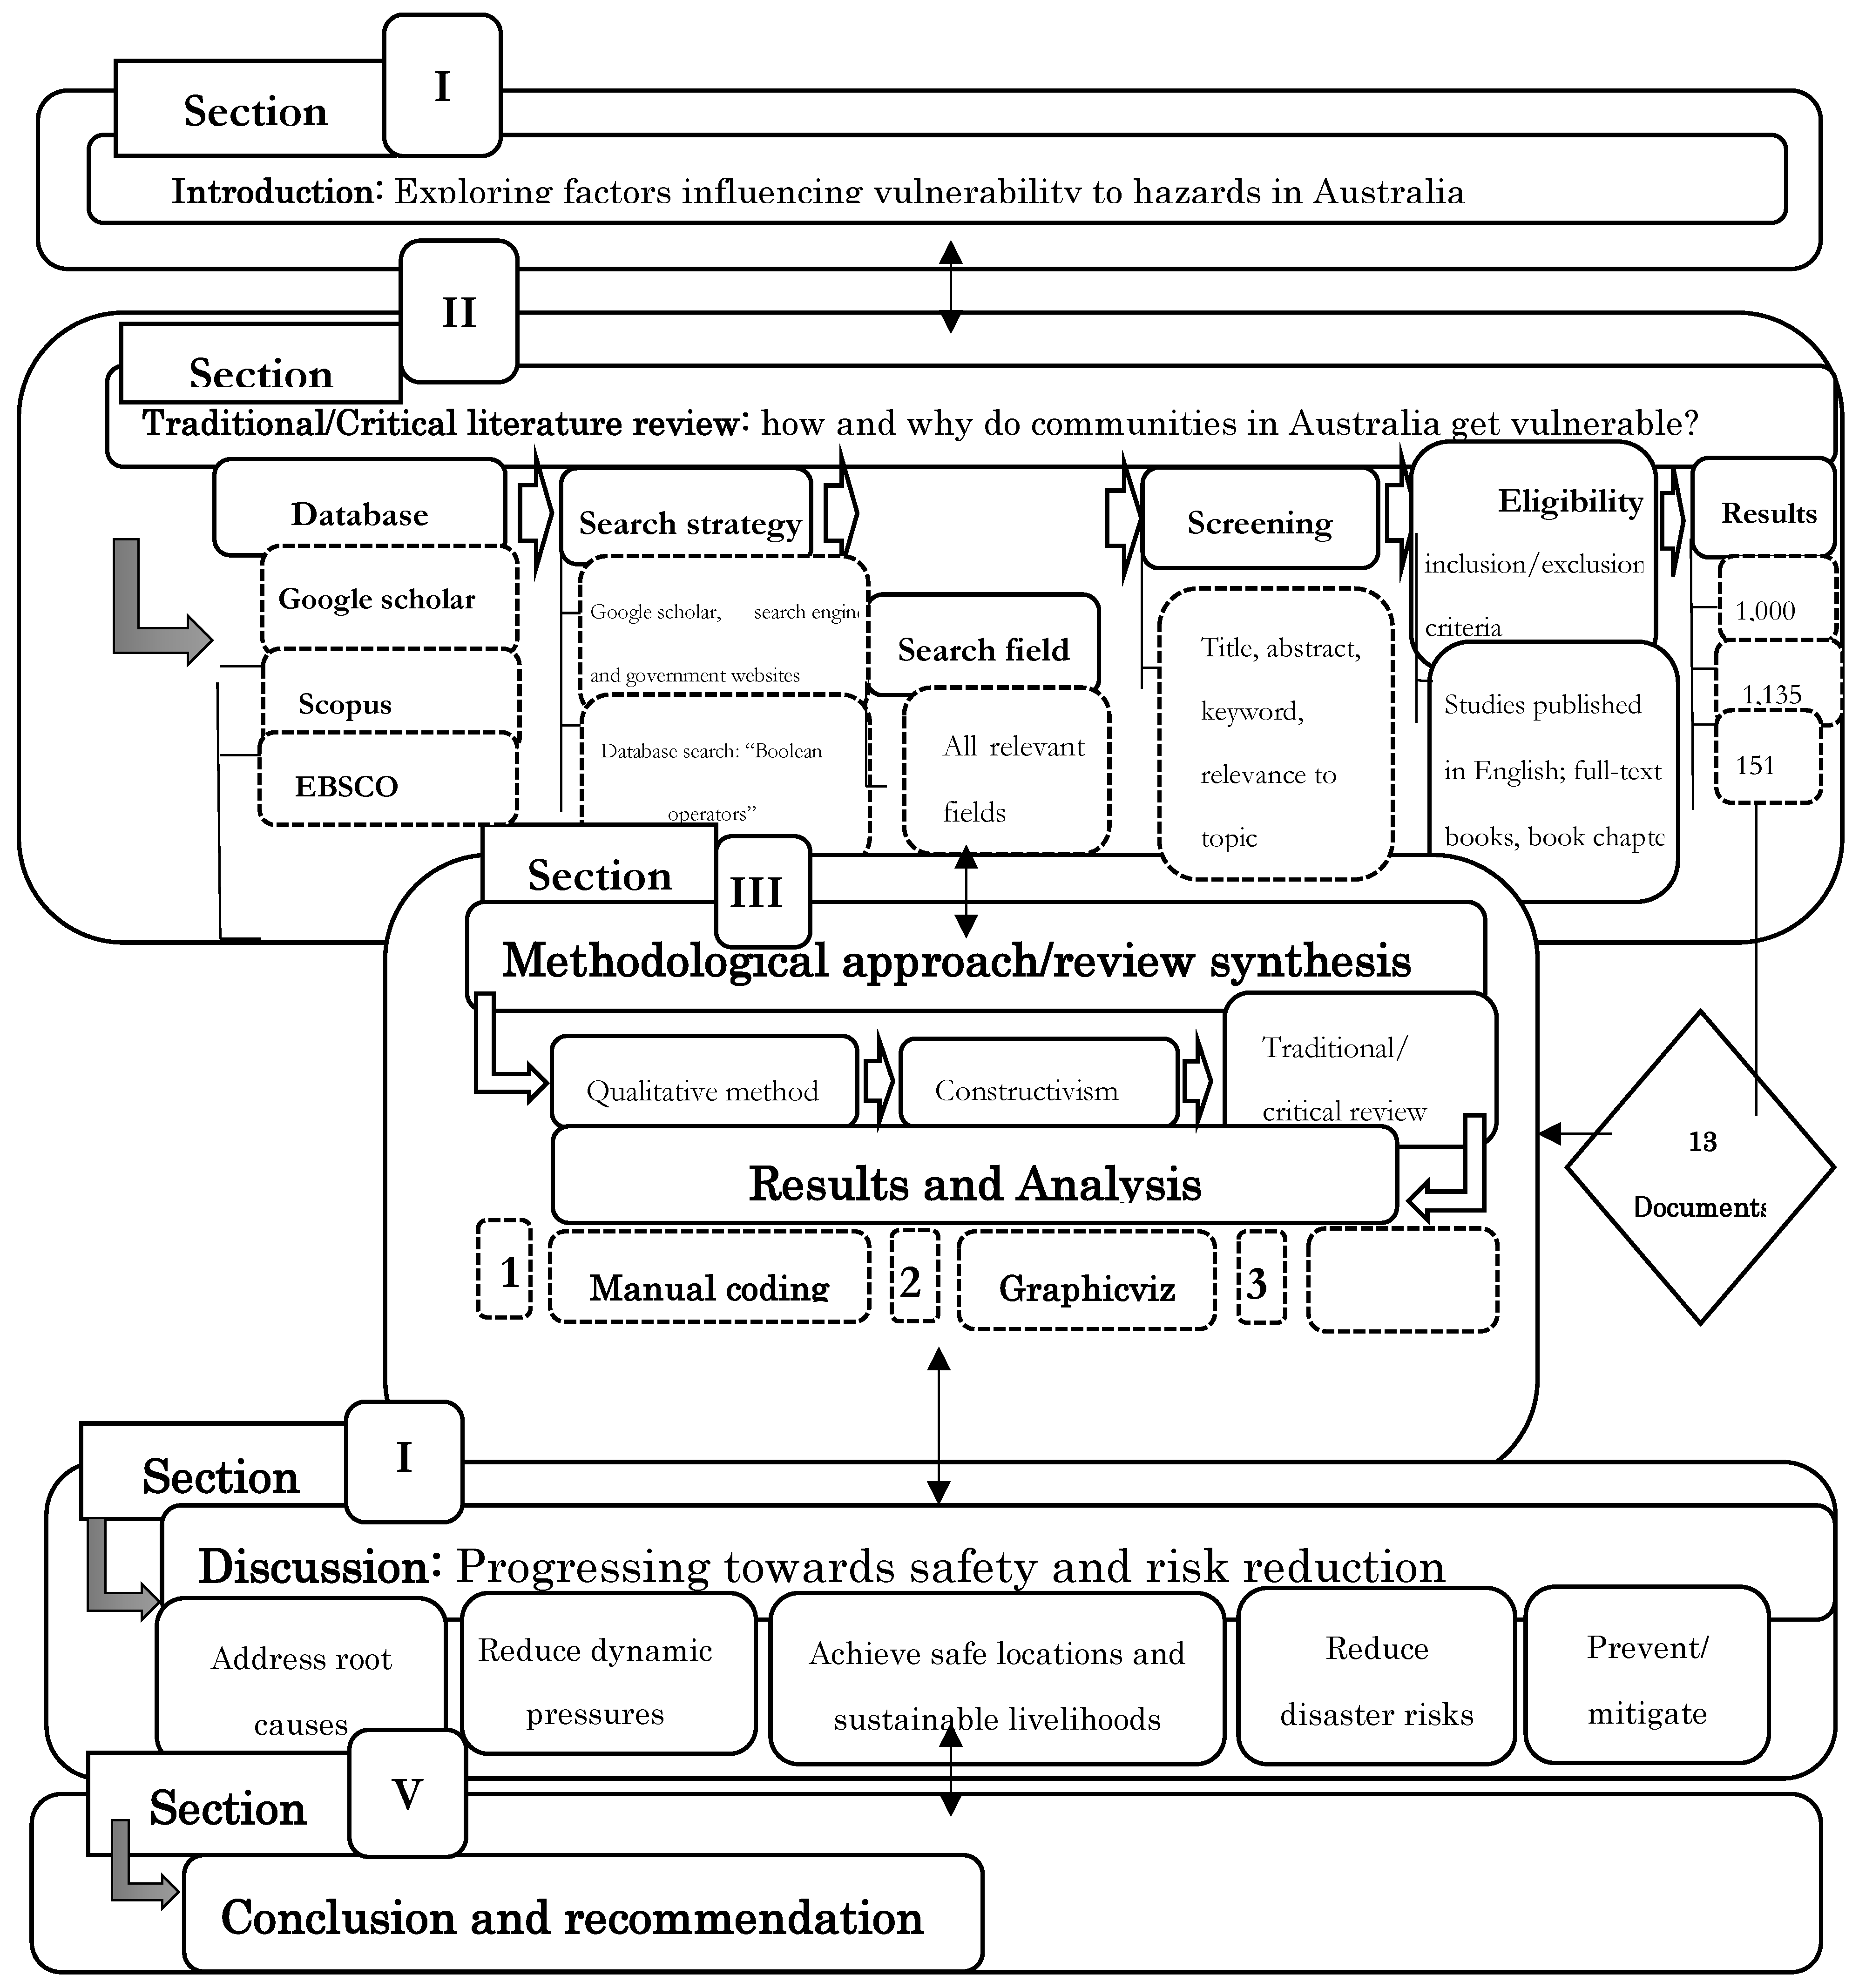
Figure 6.
Causal loop diagram for factors influencing vulnerability to hazards in Australia. Source: author.
Figure 6.
Causal loop diagram for factors influencing vulnerability to hazards in Australia. Source: author.
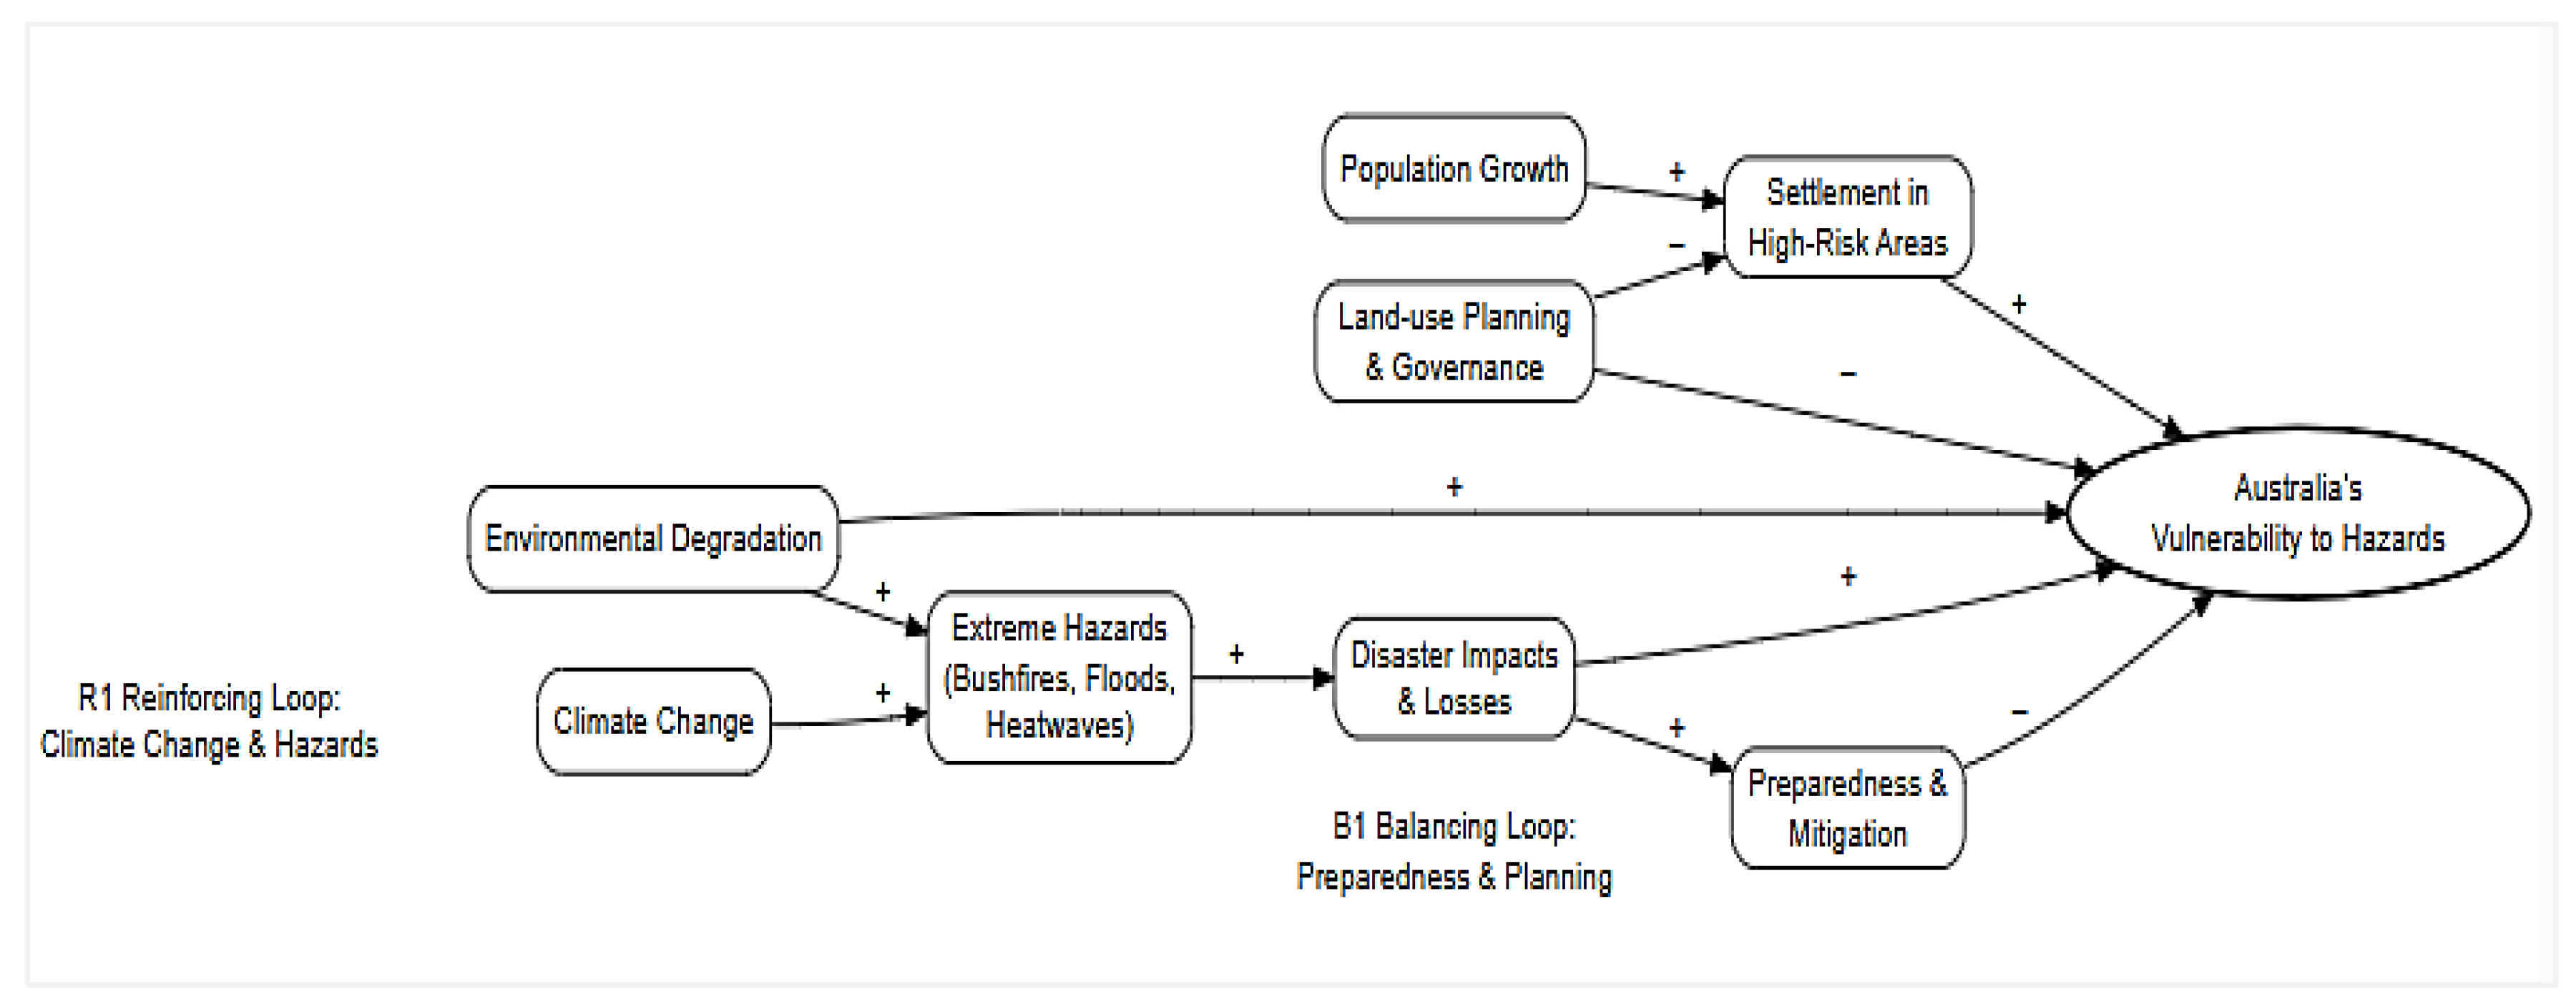
Figure 7.
Causal loop diagram of isomorphic pressures required to reduce vulnerability to hazards in Australia. Source: Author.
Figure 7.
Causal loop diagram of isomorphic pressures required to reduce vulnerability to hazards in Australia. Source: Author.
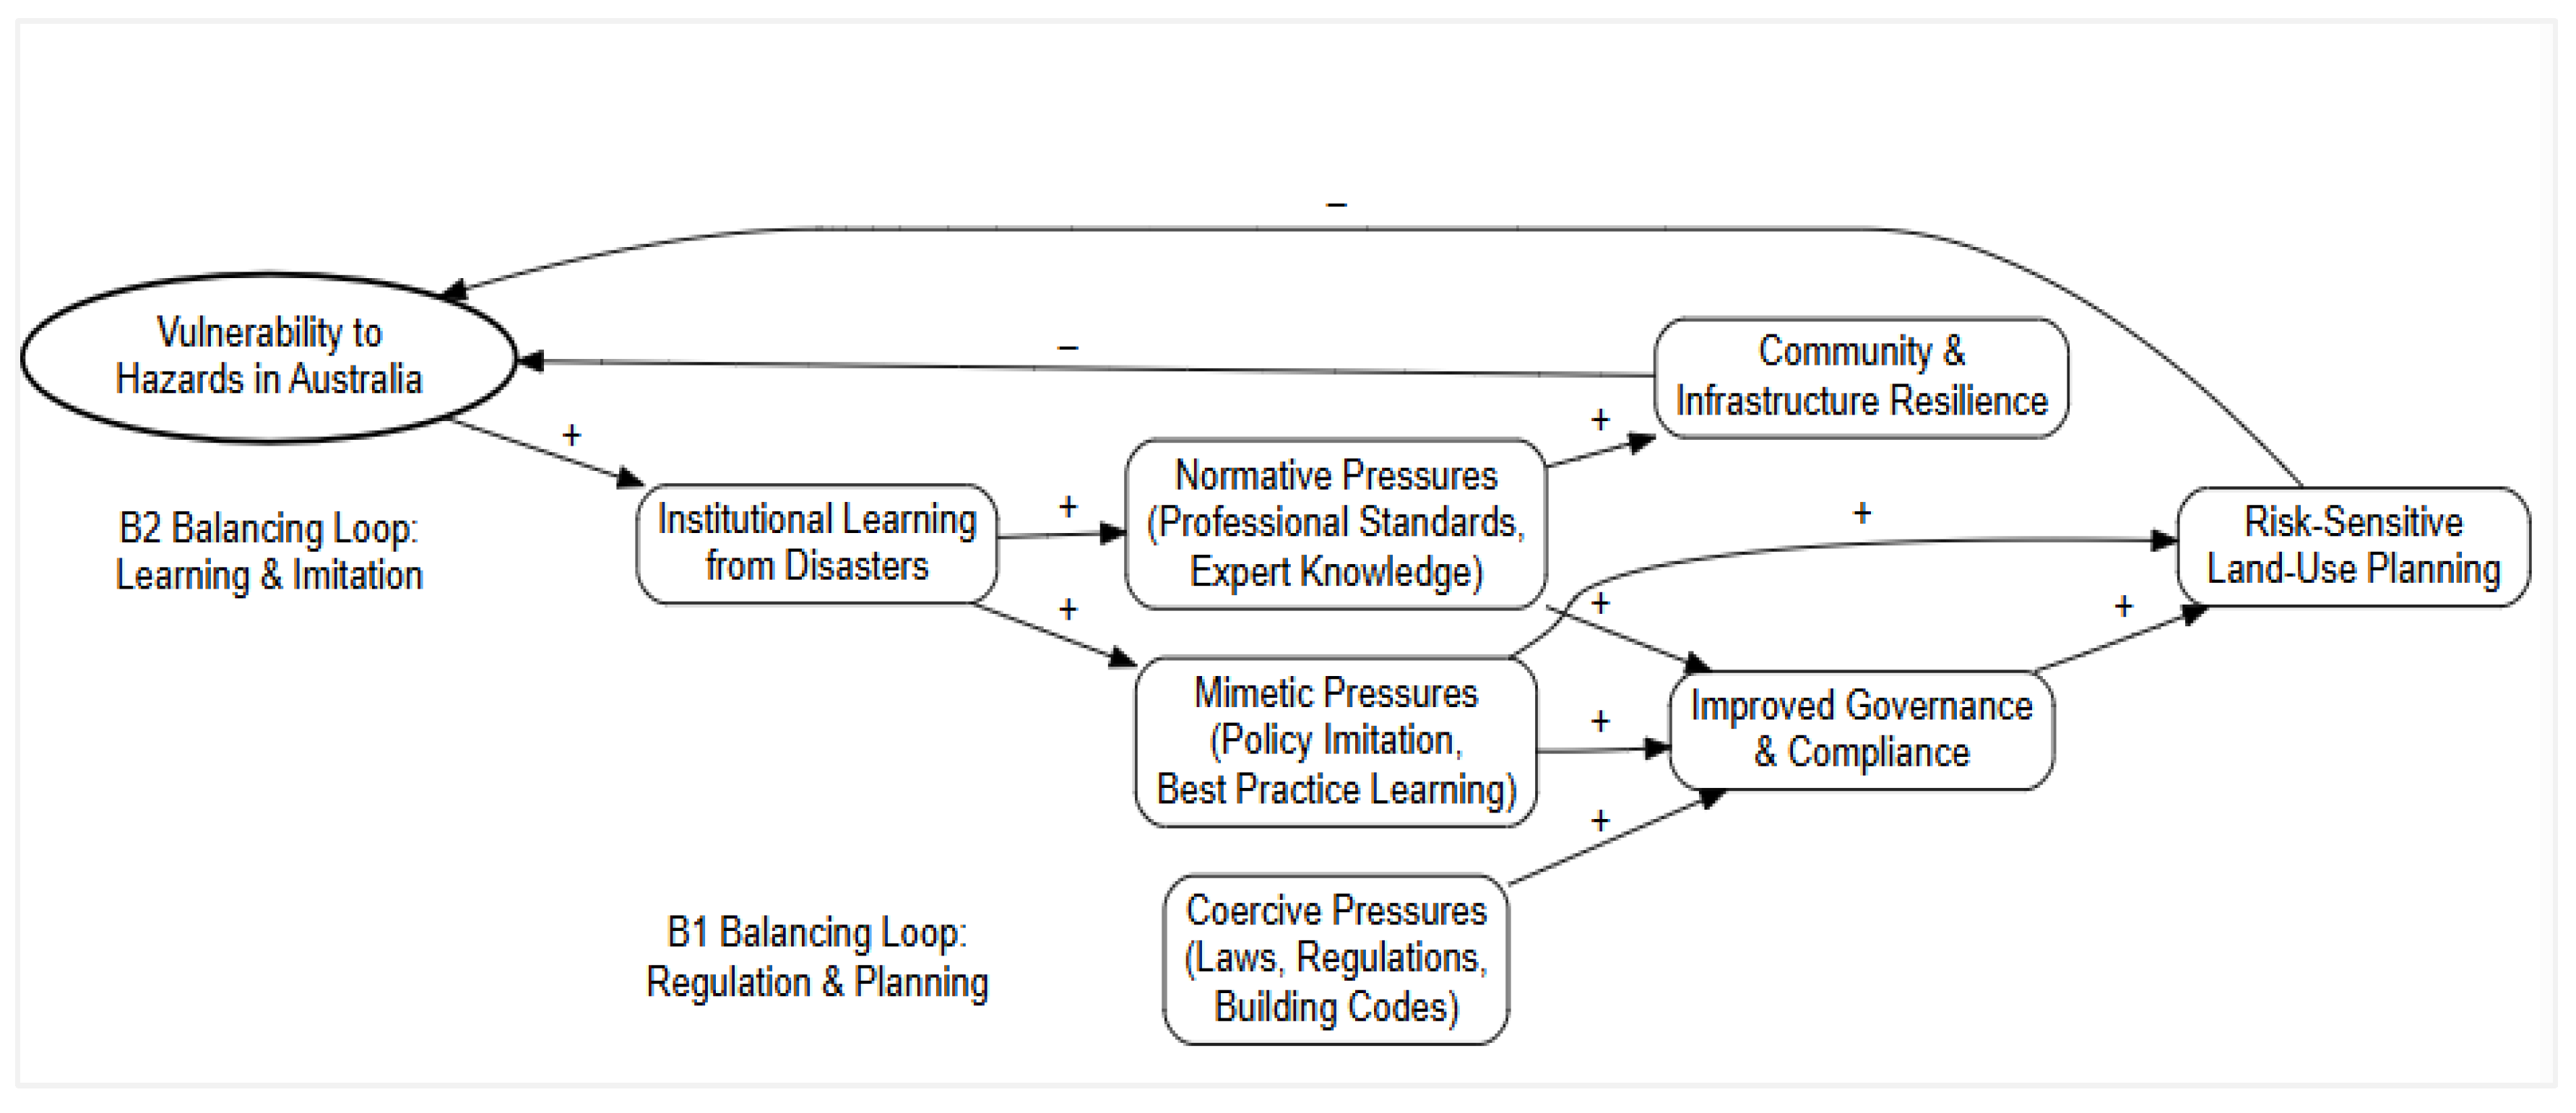
Figure 8.
Institutional antecedents driving vulnerability reduction and transformative adaptation. Source: authors.
Figure 8.
Institutional antecedents driving vulnerability reduction and transformative adaptation. Source: authors.
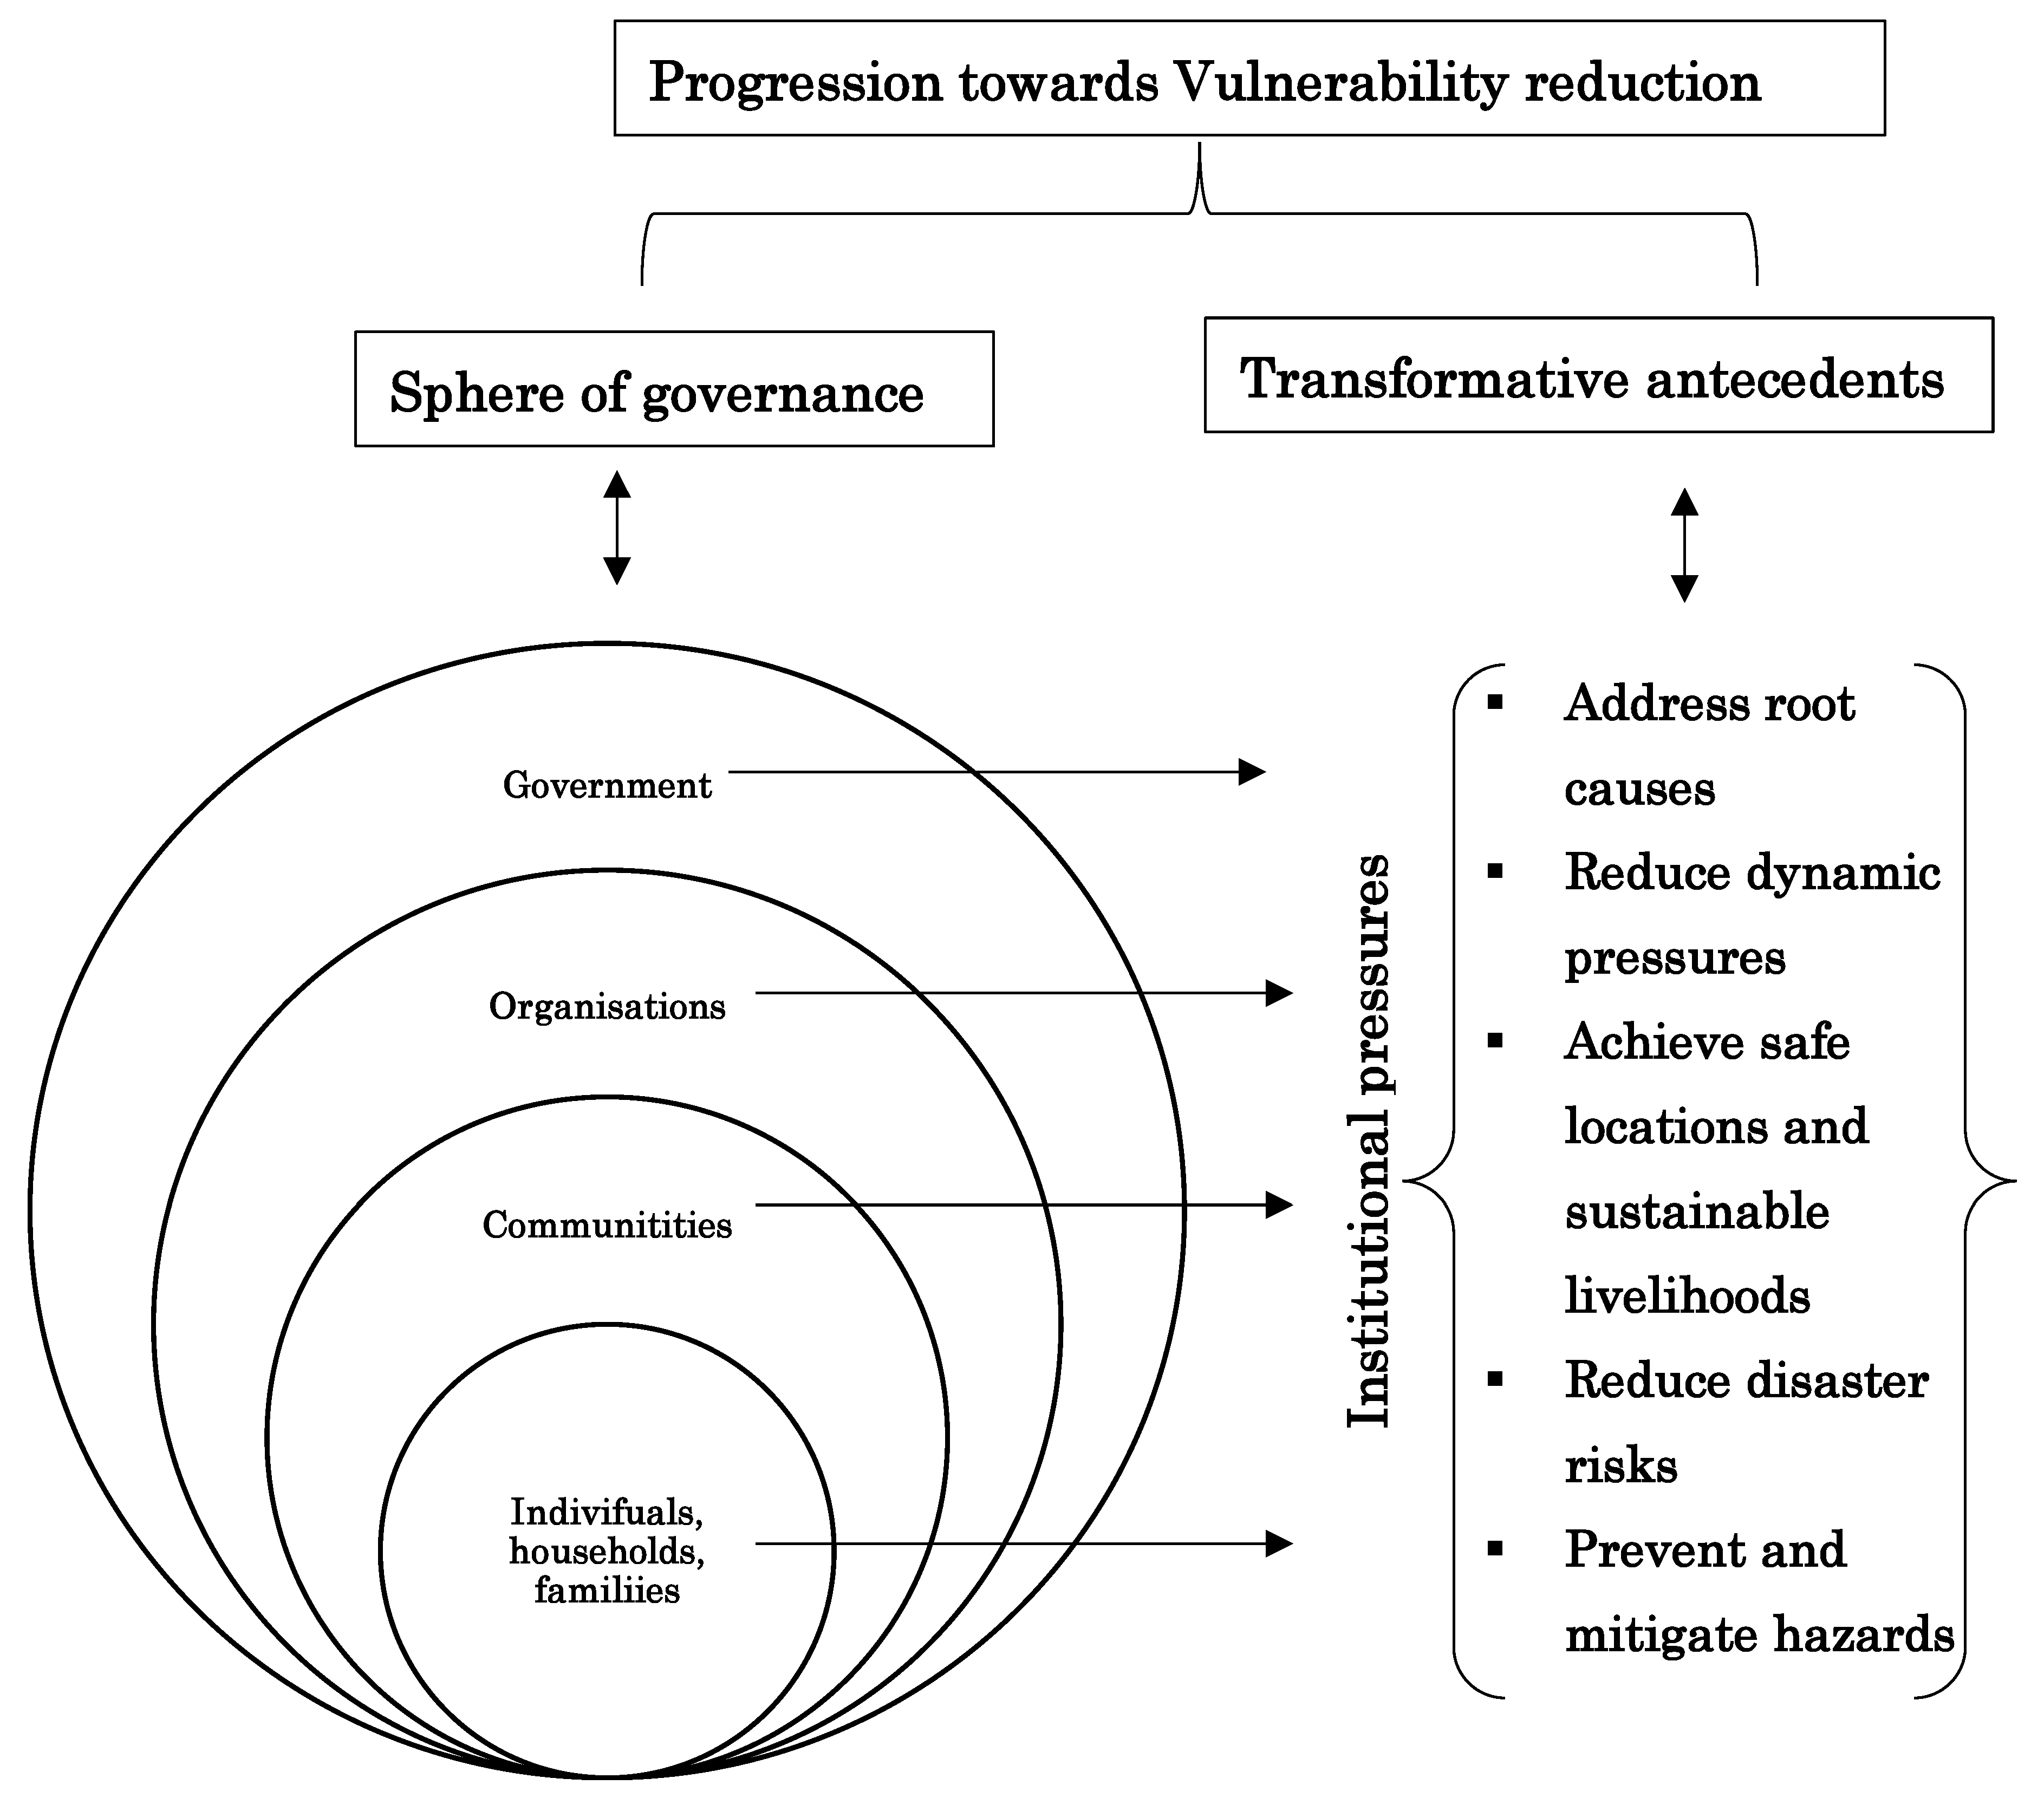

Table 1.
Factors influencing progression towards vulnerability.
| Progression towards vulnerability | How do communities become vulnerable? |
| Root dimensions |
|
| Dynamic pressures |
|
| Fragile livelihoods and unsafe conditions |
|
Source: Blaikie et al (2014).
Table 2.
Factors influencing Australia’s Vulnerability to hazards.
| Factors | Drivers |
|---|---|
|
|
|
|
|
|
Source: Australian Government (2018).
Table 3.
Examples of some natural/man-made hazard events in Australia.
| Date | Hazard type | Location of event | State |
|---|---|---|---|
| January 2026 | Bushfire | Eurobodalla and Bega Valley | New South Wales |
| 25 December 2025 | Bushfire | MidCoast Bushfire | New South Wales |
| 29 January 2026 | Bushfire | Port Stephens bushfire | New South Wales |
| 4 December 2025 | Bushfire | Southern Tasmanian Bushfires | Tasmania |
| 18 December 2019 | Heatwaves | Australia-wide (41.9ºC) | Australia-wide |
| 13 January 2022 | Heatwaves | Onslow heatwaves | Western Australia |
| 2 January 1960 | Heatwaves | Oodnadatta | South Australia |
| February 2026 | Flood | Big Rivers floods | Northern Territory |
| 25 December 2025 | Flood, Storm | South-East Queensland | Queensland |
| 24 February 2026 | Flood, Storm, Storm Surge | North-West Victorian Storms | Victoria |
| 15 January 2026 | Flood, Storm Surge, Landslide | Wye River-Lorne | Victoria |
| 13 March 2025 | Storm | Great Southern Region of Western Australia | Western Australia |
| 14 December 2025 | Terrorist Act | Bondi NSW Terrorist Act | New South Wales |
| 3 March 2025 | Tropical Cyclone Alfred | New South Wales |
Source: Australian Government (2026).
Table 4.
Highest temperature recorded across Australian States.
| State | Temperature (°C)s | Date | Location | Station no. |
|---|---|---|---|---|
| Western Australia | 50.7 | 13 January 2022 | Onslow Airport | 5017 |
| South Australia | 50.7 | 2 January 1960 | Oodnadatta Airport | 17043 |
| New South Wales | 50.1 | 11 January 1939 | Wilcannia Post Office | 46043 |
| Queensland | 49.5 | 24 December 1972 | Birdsville Police Station | 38002 |
| Victoria | 48.8 | 7 February 2009 | Hopetoun Airport | 77010 |
| Northern Territory | 48.3 | 2 January 1960 | Finke Post Office | 15526 |
| Tasmania | 42.2 | 30 January 2009 | Scamander | 92094 |
Source: Commonwealth of Australia (2024).
Table 5.
Factors influencing vulnerability to hazards.
| Attributes/Characteristics | Factors |
|---|---|
| ◾ Personal attributes | ◾ Health, income, age, gender, skills, networks, choices. |
| ◾ Infrastructure trends | ◾ Access, coverage, reliability |
| ◾ Community attributes | ◾ Networks, amenities, facilities |
| ◾ Economic trends | ◾ Growth or decline, employment level, innovation |
| ◾ Demographic trends | ◾ Age, immigration, gender |
| ◾ Environmental trends | ◾ Sustainability, diversity, pollution |
| ◾ Geographic attributes | ◾ Remoteness, topography, weather |
Source: Adapted from Australian Government (2018).
Table 6.
Relationships between institutional carriers and pillars.
| Institutional carriers | Regulative | Normative | Cultural cognitive |
|---|---|---|---|
| Symbolic systems |
|
|
|
| Relational systems |
|
|
|
| Routines |
|
|
|
| Artefacts |
|
|
|
Source: Scott (2001).
Table 7.
Nvivo codes generated from selected publications.
| Factors | Codes | Files | References |
|---|---|---|---|
| Factors influencing vulnerability | Resource access | 5 | 32 |
| Knowledge | 6 | 16 | |
| Governance | 3 | 14 | |
| Culture | 3 | 12 |
Table 8.
Pathway towards vulnerability reduction and safety in Australia.
| Progression towards safety | What we can do to reduce vulnerability |
|---|---|
| Address root causes |
|
| Reduce dynamic pressures |
|
| Achieve safe locations and sustainable livelihoods |
|
| Hazards prevention and mitigation |
|
Source: Blaikie et al (2014).
Disclaimer/Publisher’s Note: The statements, opinions and data contained in all publications are solely those of the individual author(s) and contributor(s) and not of MDPI and/or the editor(s). MDPI and/or the editor(s) disclaim responsibility for any injury to people or property resulting from any ideas, methods, instructions or products referred to in the content. |
© 2026 by the authors. Licensee MDPI, Basel, Switzerland. This article is an open access article distributed under the terms and conditions of the Creative Commons Attribution (CC BY) license (http://creativecommons.org/licenses/by/4.0/).
Copyright: This open access article is published under a Creative Commons CC BY 4.0 license, which permit the free download, distribution, and reuse, provided that the author and preprint are cited in any reuse.


