

Submitted:
02 May 2026
Posted:
06 May 2026
You are already at the latest version
Abstract
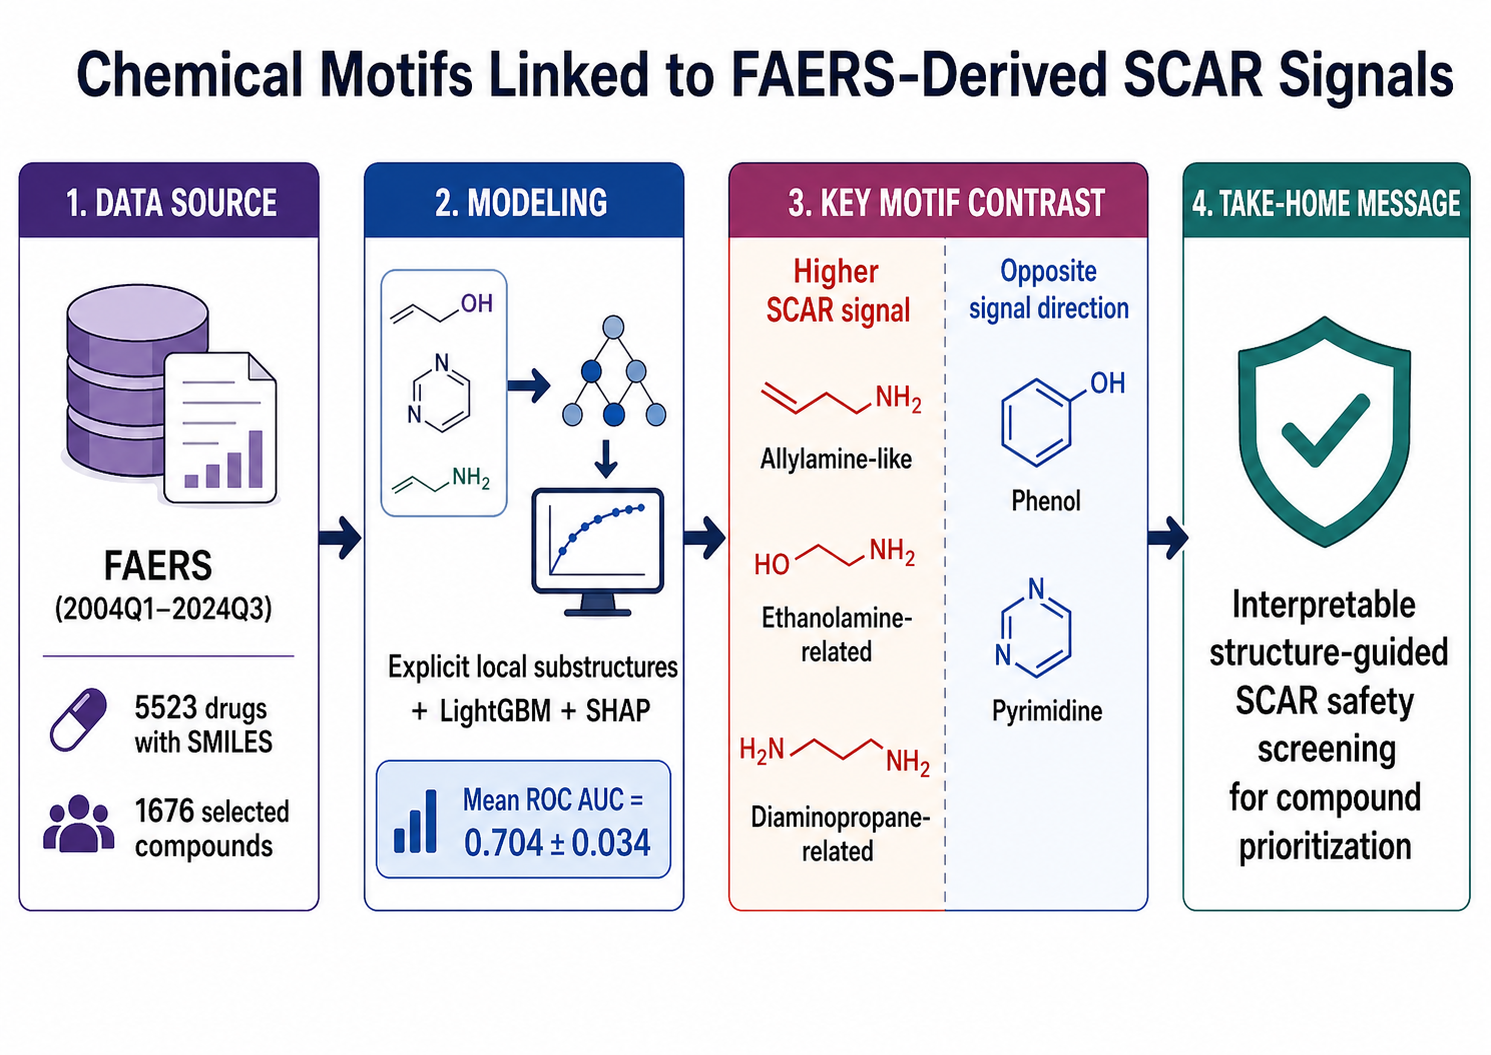
Severe cutaneous adverse reactions (SCARs) are rare, life-threatening drug hypersensitivity syndromes. Although pharmacovigilance can identify drugs disproportionately reported with SCARs, it does not reveal which local chemistries recur among them. To address this, we assessed whether drugs with disproportionate SCAR reporting in the FDA Adverse Event Reporting System (FAERS) share interpretable chemical motifs. We screened FAERS data from 2004Q1 to 2024Q3, identified 5523 drugs with available Simplified Molecular-Input Line-Entry System (SMILES) representations, and constructed a signal-enriched dataset of 1676 compounds with nominally significant broad-SCAR associations after excluding predefined therapeutic/supportive confounders. Compounds were assigned to positive-signal [natural logarithm of reporting odds ratio (lnROR) > 0, n = 1219] or nonpositive-signal (lnROR ≤ 0, n = 457) classes and encoded with 9753 explicitly mappable atom-centered local substructure descriptors. A light gradient boosting machine classifier evaluated using repeated nested cross-validation (six-fold outer × 50 repeats) achieved moderate but stable internal discrimination (mean area under the receiver operating characteristic curve = 0.7041 ± 0.0337). SHapley Additive exPlanations (SHAP) analysis revealed a clear fragment-level contrast: allylamine-like, ethanolamine, and diaminopropane-related motifs were associated with higher positive-signal class probability, whereas phenol and pyrimidine motifs were associated with corresponding lower probability. The phenol fragment (Oc1ccccc1) was the most influential feature overall (mean |SHAP| = 0.1727), followed by an allylamine-like fragment (0.1031). These findings suggest that broad-SCAR concern detected in the FAERS is not chemically random within the selected dataset. Overall, the proposed framework should be viewed not as a direct predictor of absolute clinical SCAR risk but as an interpretable structure-guided safety-screening approach to prioritize compounds and motif families for further SCAR-focused evaluation.
Keywords:
SCARs
; FAERS
; disproportionate reporting
; QSAR
; LightGBM
; SHAP
; chemical motifs
; pharmacovigilance
; safety screening
1. Introduction
1.1. Background: Severe Cutaneous Adverse Reactions
Severe cutaneous adverse reactions (SCAR) are rare, life-threatening drug hypersensitivity syndromes, including Stevens–Johnson syndrome (SJS), toxic epidermal necrolysis (TEN), drug reaction with eosinophilia and systemic symptoms (DRESS), and acute generalized exanthematous pustulosis (AGEP) [1]. These predominantly immune-mediated reactions extensively affect the skin and mucosa and can progress to systemic complications and death [2]. While SJS and TEN lie on a clinical severity spectrum defined by the extent of epidermal detachment and are associated with high mortality rates, DRESS and AGEP cause substantial acute morbidity and clinically important long-term sequelae [3,4,5].
The mechanisms underlying drug-induced SCARs are heterogeneous and unclear. According to the hapten hypothesis, reactive drug metabolites covalently modify self-proteins and generate neoantigens that trigger immune recognition [6]. Meanwhile, the pharmacological interaction (p–i) concept proposes that some drugs activate immune receptors through direct, noncovalent interactions without prior covalent binding [7]. In both frameworks, drug chemical structure is relevant as it influences bioactivation, covalent reactivity, or the molecular interactions preceding T-cell activation. Identifying structural patterns associated with SCAR-related signals therefore remains an important question at the intersection of pharmacovigilance, medicinal chemistry, and immunotoxicology.
1.2. Limitations of Current Approaches
Pharmacovigilance databases such as the FDA Adverse Event Reporting System (FAERS) support postmarketing signal detection by enabling analyses of drug–adverse event associations in extensive real-world reporting datasets [8]. However, FAERS-derived signals are based on disproportionality and do not directly quantify causal risk. Underreporting, stimulated reporting, reporting volume, therapeutic context, comedication, disease indication, and patient-level factors can all influence these signals [9]. While pharmacovigilance databases effectively identify drugs that are disproportionately reported with SCAR-related events, they cannot independently explain which molecular features may underlie those associations.
So far, traditional structure–activity relationship (SAR) studies of SCARs have generally focused on individual drug classes. For instance, reactive metabolites of sulfonamide antimicrobials have long been implicated in hypersensitivity reactions [10], while aromatic anticonvulsants have been linked to SCAR risk in specific human leukocyte antigen (HLA) backgrounds [11]. These class-specific findings are mechanistically important; however, they do not provide a broad, drug-class-agnostic view of structure–signal relationships across therapeutic areas. Computational approaches that systematically analyze chemical structures across many compounds serve as a useful complement, particularly for the exploratory identification of candidate structural patterns rather than the establishment of causal determinants of risk.
1.3. Computational Approaches to SCARs
Quantitative SAR (QSAR) modeling systematically links molecular descriptors to biological or toxicological endpoints [12]. In the context of adverse drug reactions (ADRs), QSAR models have been used to predict hepatotoxicity [13], cardiotoxicity [14], and skin sensitization [15]. However, compared with these established ADR endpoints, computational studies focused on SCARs remain limited and vary in endpoint definition, source database, and interpretability framework.
Nonetheless, several prior studies have demonstrated the applicability of in silico approaches to SCAR-related classification. For instance, Low et al. [16] combined molecular descriptors with pharmacovigilance-derived SJS labels from VigiBase and developed QSAR models to identify candidate structural alerts. Ambe et al. [17] applied deep neural networks to the Japanese Adverse Drug Event Report (JADER) database for broad SCAR prediction, demonstrating the utility of labels derived from spontaneous reports while prioritizing predictive performance over fragment-level interpretability. Li et al. [18] performed a comprehensive FAERS-based pharmacovigilance analysis of SCAR signals at the drug level; however, they did not implement a substructure-level QSAR framework.
Together, these studies establish that labels derived from pharmacovigilance data can support computational analyses of SCARs; however, they differ in source database, endpoint scope, descriptor representation, modeling strategy, and structural interpretability. Consequently, using pharmacovigilance databases as sources of endpoint labels for QSAR modeling has emerged as a pragmatic strategy for constructing datasets spanning diverse drug classes [19]. Notably, among descriptors, binary substructure fingerprints are particularly suited to interpretable QSAR modeling because each bit can, in principle, be mapped to an identifiable chemical motif [20]. Predefined key sets such as Molecular ACCess System (MACCS) keys [21] enable direct interpretation within a fixed vocabulary but have limited granularity. By contrast, common fixed-length circular fingerprints such as extended-connectivity fingerprints (ECFPs) [22] provide high structural resolution but reduce descriptor-level traceability through hashing. Explicitly enumerated atom-centered local substructure descriptors circumvent this trade-off by preserving a one-to-one mapping between each descriptor and a canonical Simplified Molecular-Input Line-Entry System (SMILES) string, making them particularly suitable for fragment interpretation based on SHapley Additive exPlanations (SHAP). Meanwhile, among gradient-boosted decision tree algorithms, light gradient-boosting machine (LightGBM) has performed strongly in QSAR tasks involving high-dimensional sparse binary features [23]. When paired with SHAP, this model can provide both predictive discrimination and chemically interpretable feature attribution [24].
1.4. Objective
This study aimed to identify recurring chemical motifs in drugs disproportionately reported with SCARs in the FAERS and to translate those motifs into interpretable safety hypotheses. Here, a “SCAR signal” refers to a drug-level disproportionality signal in the FAERS, meaning that broad SCARs are reported for a given drug more often than expected from the database’s background reporting distribution. Although this signal does not reflect incidence or establish causality, it serves as a practical surrogate for postmarketing concern about SCARs and can therefore support structure-based safety screening.
The specific research question was whether broad-SCAR-positive drugs in the FAERS share recognizable local chemistries that distinguish them from drugs on the opposite side of the same FAERS-based contrast. To address this question, we constructed an interpretable QSAR model using explicitly mappable local substructure descriptors and LightGBM. We then applied SHAP analysis to identify fragment motifs driving the separation between the two groups. The goal was not merely to classify signal direction statistically but to extract chemically explicit clues that could support early safety assessment, mechanistic interpretation, and prioritization of compounds for further SCAR-focused evaluation.
2. Results
2.1. Model Performance
A repeated nested cross-validation procedure (six-fold outer cross-validation repeated 50 times) yielded 300 outer-fold test evaluations. Table 1 summarizes the fold-level performance metrics across these 300 evaluations.
The model achieved a mean area under the receiver operating characteristic curve (ROC AUC) of 0.7041 ± 0.0337 and a mean precision–recall curve (PR AUC) of 0.8592 ± 0.0189. Its mean balanced accuracy was 0.6685 ± 0.0277, while its mean Matthews correlation coefficient (MCC) was 0.3167 ± 0.0509. Further, its sensitivity (SENS; 0.6984 ± 0.1151) was higher than its specificity (SPEC; 0.6386 ± 0.1190) on average, indicating that it was slightly more effective at identifying positive-signal compounds than at correctly classifying non-positive-signal compounds within the selected dataset. The larger fold-to-fold variation in sensitivity and specificity was consistent with class imbalance and endpoint-label heterogeneity.
Notably, the PR AUC should be interpreted relative to the positive-class prevalence of approximately 72.7% (1219/1676). A baseline classifier reflecting this prevalence would yield a PR AUC of approximately 0.73. The observed PR AUC of 0.8592 therefore indicates moderate improvement over this prevalence baseline, consistent with the ROC AUC results. Collectively, the above performance metrics indicate moderate internal ability to discriminate FAERS-derived SCAR signal direction within the selected, signal-enriched dataset, not clinically deployable prediction of absolute SCAR risk.
Figure 1 shows model-performance stability across the 50 repeated runs. Repeat-level mean ROC AUC ranged from 0.6859 to 0.7206 (overall mean = 0.7041, SD = 0.0080), and within-repeat standard deviation ranged from 0.0104 to 0.0631. Most repeats clustered within a relatively narrow band, indicating that the internal performance estimate was stable across repeated random data partitions. Notably, this stability supports the robustness of the internal random-split estimate but does not establish generalizability to external datasets or novel scaffolds.
2.2. Post Hoc Label-Randomization Check
A post hoc label-randomization check assessed whether the pooled out-of-fold prediction vector aligned with the observed labels more strongly than expected by chance. The pooled out-of-fold ROC AUC was 0.7177, compared with the mean fold-level ROC AUC of 0.7041 reported in Table 1. This difference emerges because the pooled statistic is derived from a single ROC curve constructed from all concatenated out-of-fold predictions, while the value listed in Table 1 is the arithmetic mean of 300 fold-specific ROC AUC values.
The null distribution from 1000 random label shuffles had a mean of 0.5013 and an SD of 0.0154, consistent with near-chance discrimination under random label assignment. The observed pooled out-of-fold ROC AUC exceeded all 1000 randomized values, yielding an empirical p-value of 0.001.
This result supports nonrandom alignment between the observed labels and pooled out-of-fold predictions. However, because randomization was applied to a fixed out-of-fold prediction vector and did not involve rerunning the full nested modeling pipeline for each permutation, the above result should be interpreted as a post hoc sanity check, not as a full pipeline-level permutation test.
2.3. Final Model for Interpretation
For the final interpretation model, hyperparameters were reoptimized on the full dataset, and the optimal number of boosting iterations was determined to be 116 by early stopping (internal cross-validated ROC AUC = 0.7244). Predicted probabilities were calibrated by Platt scaling with five-fold cross-validation, and a fixed classification threshold of 0.5 was applied. This refit model was used exclusively for feature-importance and SHAP analyses; the above repeated nested cross-validation results remain the primary internal estimate of discriminative performance.
2.4. Feature Importance
Table 2 lists the 10 descriptors with the highest LightGBM split count in the final interpretation model. Split count indicates how often a feature was used as a decision rule across the tree ensemble and therefore provides a simple measure of its utility for data partitioning.
Sub_12841 (phenol fragment; Oc1ccccc1) and Sub_5051 (pyrimidine fragment; c1cncnc1) were the most frequently employed features, each appearing in 16 splits. By contrast, Sub_106 (allylamine-like fragment; [C]C(=C)N) exhibited the highest total gain despite a lower split count, indicating that splits using this feature produced comparatively large improvements in the objective function.
Descriptor annotations, class-level prevalence values, and representative compounds are presented in Supplementary Table S3. Figure 2 shows the top 10 features by split count.
2.5. SHAP Analysis
SHAP analysis was performed on the final interpretation model to quantify each descriptor’s contribution to individual predictions. Table 3 presents the top 10 features ranked by mean absolute SHAP value.
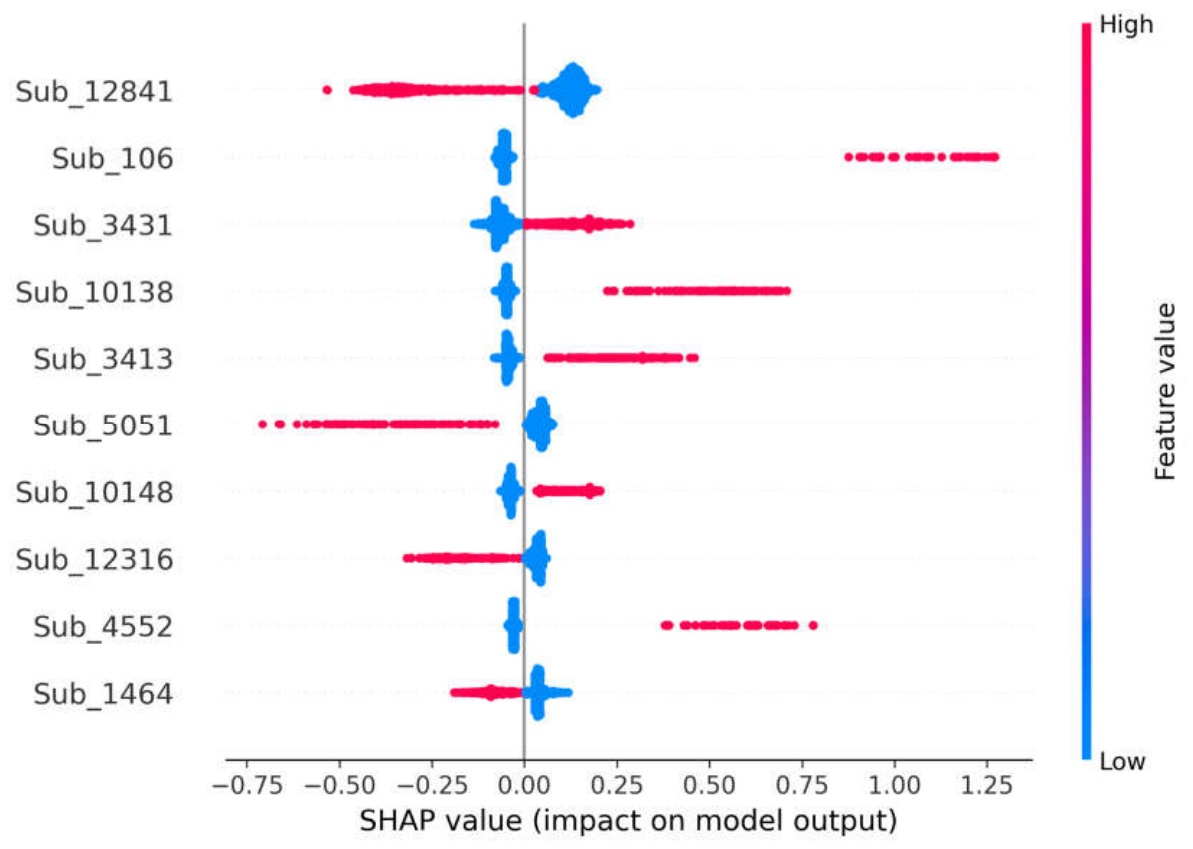
Among all features, Sub_12841 (phenol fragment) was the most influential, with the highest mean |SHAP| value (0.1727), followed by Sub_106 (allylamine-like fragment; 0.1031), Sub_3431 (ethanolamine fragment; 0.0846), and Sub_10138 (N-methyl-1,3-diaminopropane; 0.0832).
The SHAP beeswarm plot indicated the direction of the above effects. Specifically, Sub_106 ([C]C(=C)N), Sub_3431 (NCCO), Sub_10138 (CNCCCN), Sub_4552 ([CH]OC(C)OC), and Sub_10148 (CNCCO) were generally associated with higher positive-signal class probability, whereas Sub_12841 (Oc1ccccc1), Sub_5051 (c1cncnc1), and Sub_1464 ([C]CCC[CH]) were associated with lower positive-signal class probability.
These directionality assignments should be interpreted at the motif-family level, not as a strict one-to-one mechanistic hierarchy, because the descriptor space contains nested and potentially correlated local fragments. Supplementary Table S3 lists representative compounds containing the top-ranked motifs. Notably, several descriptors, including Sub_106 and Sub_1464, are open-valence fragment patterns generated by local-environment enumeration and therefore should be interpreted as partial motifs rather than fully resolved standalone moieties.
Figure 3.
SHAP beeswarm plot of the top 10 substructure descriptors. Each dot represents one compound. The horizontal position indicates the SHAP value, and the color indicates feature state (pink, present; blue, absent). Features with right-shifted pink dots are associated with higher positive-signal class probability, whereas features with left-shifted pink dots are associated with lower positive-signal class probability within the selected dataset.
Figure 3.
SHAP beeswarm plot of the top 10 substructure descriptors. Each dot represents one compound. The horizontal position indicates the SHAP value, and the color indicates feature state (pink, present; blue, absent). Features with right-shifted pink dots are associated with higher positive-signal class probability, whereas features with left-shifted pink dots are associated with lower positive-signal class probability within the selected dataset.
2.5.1. Comparison of SHAP and Split-Importance Rankings
Five features appeared in the SHAP and split-importance top 10 lists: Sub_12841 (phenol fragment), Sub_5051 (pyrimidine fragment), Sub_10138 (N-methyl-1,3-diaminopropane), Sub_3431 (ethanolamine fragment), and Sub_106 (allylamine-like fragment). Both methods ranked Sub_12841 as the most important feature overall.
Concurrently, they also emphasized different aspects of model behavior. Notably, split count reflects how often a feature is used as a decision boundary in the tree ensemble, whereas the SHAP analysis reflects the magnitude and direction of its contribution to individual predictions. For example, Sub_3413 (glycinamide fragment) ranked highly in SHAP analysis but did not appear in the split-count top 10 list, suggesting meaningful local effects despite less frequent usage for data partitioning. Conversely, several features ranked highly in split-count analysis but not in SHAP analysis, indicating frequent use for tree partitioning without correspondingly large per-sample effect sizes. This complementarity supports both interpretation modes for motif-family-level model interpretation.
2.6. Chemical Structures of Key Substructures
Figure 4 shows the chemical structures corresponding to the top-ranked descriptors identified by LightGBM split importance and SHAP analysis. Structure assignments were derived from the feature–SMILES mapping file (Supplementary Table S4). Notably, because several descriptors represent fragment-like local environments with open valences, the structures should be interpreted as partial motifs, not as fully resolved standalone chemical entities.
3. Discussion
3.1. Model Performance in Context
The key finding of this study is that broad-SCAR concern detected in the FAERS is not chemically random. With explicitly interpretable local substructure descriptors, the model achieved stable internal discrimination (mean ROC AUC = 0.7041 ± 0.0337) and indicated that drugs with disproportionate SCAR reporting were enriched in only a few recurring chemical motifs. Most importantly, allylamine-like, ethanolamine-related, and diaminopropane-related motifs characterized the disproportionate-reporting side of the contrast, whereas phenol and pyrimidine motifs characterized the opposite side.
Overall, the primary contribution is not simply classifier training but the translation of a pharmacovigilance contrast into a chemically interpretable motif pattern. In practical terms, this analysis moves beyond listing SCAR-associated drugs and answers a more useful question for medicinal chemistry and safety science: what types of local chemistry repeatedly characterize drugs that generate post-marketing SCAR concern?
Several sources of biological and reporting heterogeneity are nevertheless likely to remain beyond the scope of a structure-only model. These include pharmacological class composition, co-medication patterns, disease indication, exposure prevalence, reporting behavior, host immune status, and genetic susceptibility factors such as HLA background [25]. Accordingly, the model should be understood not as an attempt to fully explain SCAR pathogenesis or as a bedside risk-prediction tool but as a structure-guided framework for identifying compounds and motif families whose local chemistry warrants closer mechanistic or pharmacovigilance follow-up.
3.1.1. Position Relative to Previous Studies
Prior computational studies have demonstrated that pharmacovigilance-derived labels can support in silico analysis of SCAR-related outcomes. For instance, Low et al. [16] established this concept for SJS using VigiBase-derived labels and classical cheminformatics approaches. Ambe et al. [17] extended this concept to broad SCAR using JADER and deep learning, whereas Li et al. [18] provided a detailed FAERS-based pharmacovigilance characterization of SCAR at the drug level without fragment-level QSAR interpretation.
This study contributes a fragment-resolved FAERS-based perspective by linking the direction of broad-SCAR disproportionality to chemically traceable local motifs. Its value therefore lies less in predictive-performance benchmarking than in a chemically explicit, hypothesis-generating framework for interpreting FAERS-derived SCAR concern.
3.1.2. Descriptor Choice and Validation Design
The adopted descriptor representation was selected primarily for chemical traceability and interpretability. Because each retained descriptor mapped directly to a canonical fragment SMILES string, model-important features could be interpreted as recognizable local motifs rather than anonymous hashed bits. This property is particularly valuable for SHAP-based interpretation and for linking model behavior to plausible medicinal-chemistry and immunotoxicology hypotheses.
Notably, this study was not designed to benchmark alternative descriptor families or model classes. No direct comparison with MACCS, ECFPs, physicochemical descriptors, or simpler classifiers was performed. This choice reflected the primary focus on chemical interpretability through direct descriptor-to-SMILES traceability rather than predictive benchmarking. Whether the motif associations identified here remain stable across alternative descriptor and algorithm choices is an important question for future research. The repeated nested cross-validation design yielded an internally stable estimate under repeated random repartitioning of the selected dataset. Because random splitting may place structurally related compounds in both training and test partitions, this validation basis alone cannot support a claim of scaffold-level generalizability.
3.2. Structural Motifs Associated with Disproportionate SCAR Reporting
On the disproportionate-reporting side, the dominant pattern was not a single isolated fragment but a coherent motif family centered on allylamine-like, ethanolamine, and diaminopropane-related substructures. This suggests that drugs appearing as broad-SCAR-positive in the FAERS are enriched in local chemistries compatible with bioactivation, reactive-intermediate formation, or immune-relevant amine functionality. In other words, the model did not simply reflect individual drug identities; it extracted a recurring chemical pattern shared across multiple positive-signal compounds.
Among these examined motifs, the allylamine-like fragment (Sub_106; [C]C(=C)N) had the greatest SHAP magnitude. One possible interpretation is that allylamine-related local chemistry may be compatible with metabolic activation pathways that generate reactive intermediates capable of covalent protein modification. Such a mechanism is conceptually consistent with the hapten hypothesis of drug hypersensitivity, wherein drug-derived reactive species contribute to neoantigen formation and downstream T-cell activation [6,26,27]. However, the current data do not establish fragment-level causality, and the observed association may also reflect pharmacological class composition or reporting structure within the FAERS.
The ethanolamine (Sub_3431; NCCO), N-methyl-1,3-diaminopropane (Sub_10138; CNCCCN), and N-methylethanolamine (Sub_10148; CNCCO) motifs similarly indicate an amino-alcohol/diamine-rich motif family associated with higher positive-signal class probability. These functional groups may facilitate oxidative metabolism, reactive-intermediate formation, or immune-relevant interactions, including drug-mediated alteration of HLA-peptide repertoires [28]. Supplementary Table S3 lists representative compounds containing these motifs. These examples ground the motif family in recognizable drugs but should not be interpreted as proof of fragment-level causality.
The acetal-like fragment (Sub_4552; [CH]OC(C)OC) also had a positive-direction association. This observation is mechanistically difficult to interpret and warrants particular caution because the descriptor is a local open-valence motif rather than a complete functional-group assignment. Overall, the positive-direction features are best interpreted as candidate marker motifs associated with disproportionate SCAR reporting within the selected FAERS-derived dataset.
3.3. Structural Motifs Associated with the Opposite Side of the SCAR Contrast
Another important contribution of this study is that the model identified a clear counter pattern. Phenol was the strongest overall feature and, together with pyrimidine, consistently represented the opposite side of the FAERS-based SCAR contrast. This pattern is not merely a negative finding; it indicates that the model captured a chemically interpretable separation: one motif family characterized drugs with disproportionate SCAR reporting, whereas another characterized the comparator group.
The phenol result warrants special emphasis because phenol was the top SHAP feature in the entire model. At minimum, this indicates that phenol-containing local chemistry is a strong discriminator of the non-positive side of the present FAERS contrast. This observation should not be interpreted as evidence that phenol-containing drugs are intrinsically protective against SCARs. Within the selected dataset, the phenol motif instead served as a strong marker of the non-positive-signal side. Supplementary Table S3 lists representative compounds bearing this motif, and their distribution should be considered when interpreting this result. Several nonmutually exclusive explanations may apply. First, the phenol finding may partly reflect therapeutic-class composition in the selected dataset. Second, inverse or non-positive disproportionality in spontaneous-report data can also be conditioned by exposure prevalence, indication-specific reporting, comedication patterns, and differential use across patient groups, allowing a chemically common fragment to appear on the nonpositive side without implying biological protection. Third, phenolic chemistry may affect redox or reactive-intermediate behavior under some conditions [29]; however, the current observational design cannot isolate intrinsic chemical effects from dataset composition or reporting structure. Accordingly, the phenol finding is best interpreted as a data-driven negative-direction marker within the present FAERS-derived contrast, not as evidence of a protective effect.
The pyrimidine fragment (Sub_5051; c1cncnc1) warrants the same conservative interpretation. Its association with lower positive-signal class probability may reflect reduced susceptibility to specific bioactivation pathways, therapeutic-class composition, or both. Supplementary Table S3 lists representative compounds containing this motif. This study therefore identifies pyrimidine as part of the non-positive side of the chemical contrast but does not assign it a causal or protective role.
3.4. Comparison of SHAP and Split Importance
Comparing SHAP and split-count rankings clarified complementary aspects of model behavior. Notably, split count measures how often a feature is used to partition the feature space, whereas the SHAP value captures the magnitude and direction of its contribution to individual predictions. In tree-based models, SHAP/TreeSHAP provides local and global feature-attribution summaries for ensemble predictions [30], and explainable artificial intelligence is increasingly used in drug discovery to connect model behavior to chemically interpretable hypotheses [31]. The observed agreement between the two rankings, particularly for phenol, pyrimidine, ethanolamine, diaminopropane, and allylamine-like motifs, strengthens the interpretation that these motif families were central to the fitted model.
Meanwhile, their discrepancies also provide insights. Features that ranked highly by SHAP analysis but not by split count may have exerted strong local effects in specific regions of the descriptor space, whereas features ranked highly by split count but not by SHAP analysis may have served as frequent but lower-impact partitioning rules. However, because the descriptor space contains correlated and nested fragments, neither ranking should be overinterpreted at the level of a single isolated fragment. The most defensible interpretation is instead at the motif-family level.
3.5. Limitations
Several limitations of this study warrant acknowledgment.
FAERS-derived label limitation. Endpoint labels were derived from spontaneous-report pharmacovigilance data and therefore inherit known sources of bias, including under-reporting, stimulated reporting, comedication effects, confounding by indication, therapeutic pathway effects, and differential exposure prevalence [9]. The labels represent disproportionality-based associations in the FAERS rather than adjudicated causal SCAR risk.
Selection-dependent labeling and multiple testing. Only compounds with nominally significant drug-level associations (p < 0.05) were retained, while no multiple-testing correction was applied during screening. This choice was made to construct a sensitivity-oriented, signal-enriched subset for exploratory structure-signal analysis, but it also implies that some retained labels may reflect false positives or selection-dependent noise. The resulting classes should therefore be understood as analytical labels linked to the selected FAERS-derived dataset, not as definitive biological categories.
Analytical contrast-group limitation. The adopted non-positive-signal class is an analytical contrast group defined by reporting direction rather than a validated low-risk reference class. Accordingly, differences between the two classes should be interpreted as differences within a signal-enriched FAERS subset, not as contrasts between hazardous and clinically safe drugs.
Validation limitation. This study did not include scaffold-based splitting, cluster-based splitting, or external validation. Because random splitting may place structurally related compounds in training and test sets, the reported ROC AUC of approximately 0.70 should be treated as an internal random-split estimate and potentially an upper bound on generalization to novel chemical scaffolds. Similarly, the motif associations identified by SHAP analysis should be treated as dataset-specific hypotheses pending scaffold-based or external validation [32].
Label-randomization limitation. The statistical check reported in Section 3.2 was performed by shuffling labels against a fixed pooled out-of-fold prediction vector. The check therefore supports non-random alignment between observed labels and pooled predictions but should not be interpreted as a full pipeline-level permutation test.
Descriptor and interpretation limitations. The binary local-fragment descriptors encode only two-dimensional topological information and do not capture full three-dimensional geometry, stereochemical detail, or explicit host–drug interaction context. Furthermore, the descriptor set contains nested and correlated motifs, and several top-ranked features are open-valence fragment patterns rather than fully specified functional groups. The results are therefore most appropriately interpreted at the motif-family level.
Endpoint aggregation. SJS, TEN, DRESS, and AGEP were aggregated into a single broad-SCAR endpoint. Although this broad endpoint increases sample size and supports exploratory analysis, it may obscure subtype-specific structure–signal relationships.
Asymmetric confounder exclusion. The predefined exclusion of 31 therapeutic/supportive confounders was intentionally applied only when a compound showed a nominally significant positive association with the SCAR endpoint. This step reduced plausible treatment-related false positives but altered class composition asymmetrically by design.
Preprocessing and reproducibility limitations. Although a concise summary of the upstream FAERS preprocessing workflow and molecular standardization procedure is presented in the Supplementary Methods, the reproducibility of pharmacovigilance-derived structure-signal analyses remains sensitive to upstream choices such as name normalization, ingredient mapping, reporter-role filtering, deduplication, and structure standardization.
3.6. Future Directions
Several directions could reinforce the present framework. First, future studies should evaluate alternative label constructions, including multiple-testing-controlled labels, minimum case-count thresholds, and continuous or weighted formulations based on the natural logarithm of reporting odds ratio (lnROR) and its uncertainty. Second, scaffold-based and external validation will help determine whether the identified motif families generalize beyond repeated random partitions of the present dataset. Third, direct benchmarking against alternative descriptor families and baseline models would clarify the trade-off between predictive performance and chemical interpretability. Finally, integrating chemical descriptors with pharmacogenomic factors, particularly HLA genotype, and developing subtype-specific models for SJS/TEN, DRESS, and AGEP may provide a more mechanistically resolved overview of SCAR-associated structure–signal relationships.
4. Materials and Methods
4.1. Data Source and Endpoint Definition
Drug–adverse reaction association data were extracted from the FAERS for the first quarter of 2004 through the third quarter of 2024 (2004Q1–2024Q3). SCARs were defined using 21 preferred terms (PTs) from the Standardised MedDRA Query (SMQ) for severe cutaneous adverse reactions [33] in the Medical Dictionary for Regulatory Activities (MedDRA). The 21 PTs were acute generalised exanthematous pustulosis, AGEP–DRESS overlap, bullous haemorrhagic dermatosis, cutaneous vasculitis, dermatitis bullous, dermatitis exfoliative, dermatitis exfoliative generalised, drug reaction with eosinophilia and systemic symptoms, epidermal necrosis, erythema multiforme, erythrodermic atopic dermatitis, exfoliative rash, generalised bullous fixed drug eruption, oculomucocutaneous syndrome, severe cutaneous adverse reaction, SJS–TEN overlap, skin necrosis, Stevens–Johnson syndrome, target skin lesion, toxic epidermal necrolysis, and toxic skin eruption. These PTs were used exactly as defined by the MedDRA SMQ, without manual modification. This broad SMQ-based definition was adopted to maximize sensitivity in pharmacovigilance screening and therefore encompassed heterogeneous SCAR-related phenotypes rather than a single clinically homogeneous entity.
From the FAERS, 5523 unique drug substances with obtainable SMILES structural representations were initially identified. The SMILES representations were retrieved primarily from PubChem using normalized active ingredient names as query identifiers, and the structures were standardized to canonical non-isomeric SMILES, as described in the Supplementary Methods. Disproportionality analysis was performed at the PRIMARYID level. Duplicate PRIMARYID–drug and PRIMARYID–adverse-event records were collapsed before constructing the binary drug-presence and event-presence matrices, respectively. A report was classified as SCAR-positive if it contained at least one of the 21 constituent SCAR PTs. For each drug substance, a 2 × 2 contingency table was constructed across PRIMARYIDs, and the ROR, its natural logarithm (lnROR), and 95% confidence intervals were derived from this table [34]. Two-sided Fisher’s exact test p-values were calculated using the raw contingency tables. For ROR and confidence-interval calculations, continuity correction was applied uniformly to all contingency tables by adding 0.5 to all four cells.
Broader upstream FAERS preprocessing steps, including drug-name normalization, active-ingredient mapping, reporter-role filtering, and duplicate handling at the case/version level, were executed before the current modeling workflow. A concise summary of these preprocessing procedures is presented in the Supplementary Methods to improve reproducibility.
To suppress potential false-positive associations arising from therapeutic or supportive co-reporting, drug substances potentially associated with SCAR treatment, supportive care, or complication management and showing a statistically significant positive association with the SCAR endpoint (lnROR > 0 and Fisher’s exact test p < 0.05) were excluded from a predefined list. These excluded agents amounted to 31 and included glucocorticoid receptor agonists, immunosuppressants, a vasodilator, and antiviral agents. Clinical guidelines, systematic reviews, and case-series evidence supported the exclusion rationale; Supplementary Table S1 provides the full drug-level list with evidence sources. This exclusion step was intentionally asymmetric and applied only to compounds showing nominally significant positive associations with the SCAR endpoint.
After therapeutic confounders were excluded, only compounds with a statistically significant association with the SCAR endpoint (Fisher’s exact test p < 0.05) were retained for modeling, while compounds with p ≥0.05 were excluded. Each retained drug substance was then assigned a binary label based on the direction of its FAERS-derived association: compounds with lnROR >0 and p <0.05 were labeled positive-signal, whereas those with lnROR ≤0 and p <0.05 were labeled nonpositive-signal. This procedure yielded a final dataset of 1676 compounds, including 1219 positive-signal and 457 nonpositive-signal compounds.
Notably, this labeling scheme captures the direction of FAERS-derived disproportionality among statistically significant compounds and should not be interpreted as a direct estimate of absolute SCAR liability. The non-positive-signal class comprised compounds with a statistically significant inverse or non-positive association in the FAERS (lnROR ≤ 0, p < 0.05). Such inverse associations may arise from differential exposure patterns, indication-specific reporting, co-medication structure, or less frequent use in populations at high SCAR risk and should not be equated with intrinsic clinical safety. The non-positive-signal class therefore served as an analytical contrast group defined by reporting direction within the selected dataset, not as a validated low-risk reference class. Because compounds with p ≥0.05 were excluded, the resulting dataset was a signal-enriched subset rather than a comprehensive sample of all marketed drug substances. No multiple-testing correction was applied during drug screening. This choice prioritized sensitivity in constructing a signal-rich dataset for exploratory structure–signal analysis; accordingly, the resulting labels should be interpreted as selection-dependent analytical labels, not confirmatory drug-level pharmacovigilance signals.
4.2. Molecular Descriptors
Chemical structures were represented by binary substructure descriptors generated by an in-house program (Substructure_Descriptor v6; Y. Uesawa, 2025) implemented with the RDKit cheminformatics library [35]. For each molecule, atom-centered local environments were enumerated at radii of 1–4 bonds with RDKit’s FindAtomEnvironmentOfRadiusN function. Each environment was converted to a submolecule with PathToSubmol and expressed as a canonical non-isomeric SMILES string. The union of all unique fragment SMILES observed in the dataset defined the descriptor dictionary. Each compound was then encoded as a binary vector indicating the presence or absence of each fragment. After zero-frequency columns were removed, 9753 descriptors were retained for model development. Original feature identifiers were preserved for traceability; consequently, the retained descriptors had non-consecutive original IDs rather than sequentially renumbered IDs.
This descriptor representation was selected primarily for chemical traceability and interpretability. Compared with predefined key sets such as the MACCS [21], the dataset-adaptive descriptor space captured a broader range of motifs present in the studied chemical space. Compared with common fixed-length circular fingerprints such as ECFPs [22], each descriptor mapped one-to-one onto a canonical SMILES string, avoiding bit-collision ambiguity and enabling direct mapping from model-important features to identifiable chemical motifs. Notably, the present study was not designed to benchmark alternative fingerprint families; rather, the descriptor choice was made to support chemically explicit interpretation of model-important motifs.
4.3. Model Development
4.3.1. Algorithm
LightGBM, an efficient implementation of gradient-boosted decision trees, was used as the classification algorithm [23]. This model family was selected because it handles sparse, high-dimensional binary features and supports downstream SHAP-based interpretation. Early stopping with 100-round patience was used during training to reduce overfitting.
4.3.2. Hyperparameter Optimization
4.3.3. Class Imbalance Handling
The final modeling dataset contained 1219 positive-signal and 457 nonpositive-signal compounds. In LightGBM, scale_pos_weight scales the loss contribution of positive-class samples. Setting this parameter to 0.375 (457/1219) reduced the loss contribution of the majority positive-signal class and balanced loss weighting between the two classes during training.
4.3.4. Probability Calibration
Predicted probabilities were calibrated with Platt scaling (sigmoid method) [37]. During nested cross-validation, calibration was performed using four-fold internal cross-validation on each outer-training set. Meanwhile, for the final model, five-fold cross-validation calibration was applied. Notably, the four-fold cross-validation used for Platt-scaling calibration was independent of the six-fold inner cross-validation used for Optuna-based hyperparameter selection; however, both procedures were restricted to the outer-training partition and did not involve the held-out outer-test fold.
4.4. Model Validation
4.4.1. Repeated Nested Cross-Validation
Model performance was assessed using a repeated nested cross-validation design [38]. The outer loop comprised six-fold cross-validation repeated 50 times, producing 300 outer-fold test evaluations, while the inner loop used six-fold cross-validation for hyperparameter selection with Optuna. This nested design was intended to provide an internal estimate of discriminative performance while minimizing information leakage between model selection and evaluation on the outer test folds. Because random splits rather than scaffold-based splits were used, structurally related compounds may have appeared in both the training and test partitions. Therefore, the resulting performance estimates should be interpreted as internal estimates from random splits, not as evidence of scaffold-level generalizability.
4.4.2. Evaluation Metrics
For each outer fold, the following metrics were computed: ROC AUC, PR AUC, accuracy (ACC), balanced accuracy (BA), F1 score, MCC, SENS, and SPEC. Summary statistics, including the mean, standard deviation, minimum, maximum, and median, were computed for all 300 outer-fold test evaluations. Fold-level summary statistics are reported herein as the primary performance estimates. Separately, all out-of-fold predictions were concatenated into a single vector, and a pooled out-of-fold ROC AUC was also computed. This pooled statistic is reported separately where relevant and differs numerically from the arithmetic mean of the fold-level ROC AUC values.
4.4.3. Post Hoc Label-Randomization Check
The post hoc label-randomization check assessed whether the pooled out-of-fold prediction vector aligned with the observed labels more strongly than expected by chance. The out-of-fold predictions from the nested cross-validation pipeline were held fixed, class labels were randomly shuffled 1000 times, and ROC AUC was recalculated for each shuffle to generate a null distribution. The resulting empirical p-value should therefore be interpreted as a sanity check of alignment between the fixed out-of-fold predictions and observed labels, not as a full pipeline-level permutation test.
4.4.4. Final Model Construction
For model interpretation, a final model was constructed by rerunning Optuna-based hyperparameter optimization on the complete dataset and determining the number of boosting iterations with early stopping. Predicted probabilities were calibrated by Platt scaling with five-fold cross-validation, and a fixed classification threshold of 0.5 was applied. The final model hyperparameters are reported in Supplementary Table S5. This refit model was used only for interpretation and feature ranking; the repeated nested cross-validation results remain the primary internal performance estimates.
4.5. Model Interpretation
4.5.1. SHAP Analysis
SHAP values were computed for the final interpretation model to quantify each descriptor’s contribution to individual predictions. Features were ranked by mean absolute SHAP value (mean |SHAP|) across all samples. Because the descriptor space contained nested and potentially correlated local fragments, SHAP rankings were interpreted at the motif-family level rather than as a strict one-to-one mechanistic hierarchy.
4.5.2. LightGBM Feature Importance
Beyond SHAP analysis, LightGBM’s built-in feature-importance measures were extracted from the final model. Split count and total gain were recorded. The top 10 features ranked by split count were documented to complement the SHAP-based ranking.
4.5.3. Substructure Mapping
Each binary descriptor was mapped to its corresponding chemical substructure based on the feature–SMILES mapping file. Chemical drawings of the top-ranked descriptors were prepared for visual interpretation. For fragment-like descriptors with open valences, the resulting drawings were treated as partial local motifs, not fully resolved standalone chemical entities.
4.6. Software, Data Availability, and Reproducibility
All analyses were performed in Python 3.9.23 (conda-forge) on Windows 10. The major packages used were LightGBM 4.6.0, scikit-learn 1.6.1, Optuna 4.4.0, SHAP 0.48.0, NumPy 2.0.2, pandas 2.3.1, and matplotlib 3.9.4. A fixed random seed of 32 was used for all stochastic procedures. To improve reproducibility, a concise summary of the upstream FAERS preprocessing workflow and molecular standardization procedure is presented in the Supplementary Methods, including drug-name normalization, active-ingredient mapping, reporter-role filtering, deduplication rules, and structure-standardization steps. Supplementary Table S1 lists the excluded therapeutic/supportive confounders with rationale and evidence sources. Supplementary Table S2 lists the included compounds with class labels, lnROR, 95% confidence intervals, nominal p-values, and standardized SMILES. Supplementary Table S3 lists top-ranked features with class-level prevalence and representative compounds. Supplementary Table S4 provides the feature–SMILES mapping. Supplementary Table S5 reports the final model hyperparameters and training configuration.
5. Conclusions
This study addressed a practical question: do drugs with disproportionate SCAR reporting in the FAERS share recurring chemical motifs? The answer was yes. An interpretable QSAR model constructed from explicitly traceable local substructure descriptors revealed a distinct fragment-level contrast: allylamine-like, ethanolamine-related, and diaminopropane-related motifs characterized the disproportionate-reporting side, whereas phenol and pyrimidine motifs characterized the opposite side.
These findings suggest that FAERS-derived SCAR concern is not chemically featureless and that fragment-resolved QSAR analysis can extract structurally meaningful information from pharmacovigilance data. The present framework should therefore be viewed not as a direct predictor of absolute clinical SCAR risk but as an interpretable structure-guided safety-screening approach for identifying compounds and motif families that warrant closer SCAR-focused evaluation.
Supplementary Materials
The following supporting information can be downloaded at the website of this paper posted on Preprints.org. Supplementary Methods: Summary of the upstream FAERS preprocessing workflow and molecular standardization procedure. Supplementary Table S1: Excluded therapeutic/supportive confounders, with rationale and evidence sources for the 31 excluded compounds. Supplementary Table S2: Included compounds with class labels, lnROR, 95% confidence intervals, nominal p-values, and standardized SMILES. Supplementary Table S3: Top-ranked features with class-level prevalence and representative compounds. Supplementary Table S4: Full feature–SMILES mapping. Supplementary Table S5: Final model hyperparameters and training configuration.
Author Contributions
Conceptualization, Y.U.; methodology, Y.U.; software, Y.U.; validation, Y.U. and K.I.; formal analysis, Y.U. and K.I.; investigation, Y.U. and K.I.; resources, Y.U. and K.I.; data curation, Y.U., K.I. and M.A.; writing—original draft preparation, Y.U.; writing—review and editing, Y.U., K.I. and M.A.; visualization, K.I. and Y.U.; supervision, Y.U.; project administration, Y.U.; funding acquisition, Y.U. All authors have read and agreed to the published version of the manuscript.
Funding
This work was supported by the JSPS KAKENHI (grant number 22K06707).
Institutional Review Board Statement
Not applicable.
Informed Consent Statement
Not applicable.
Data Availability Statement
The underlying FAERS data are publicly available from the U.S. Food and Drug Administration. Supplementary materials accompany this manuscript. Additional analysis code and descriptor-mapping metadata are available from the corresponding author upon reasonable request.
Acknowledgments
Not applicable.
Conflicts of Interest
The authors declare no conflict of interest.
Generative AI Disclosure
During the preparation of this manuscript, the authors used ChatGPT (GPT-5.5 Pro, OpenAI) for assistance in creating and refining the graphical abstract. The authors reviewed, edited, and verified all AI-assisted graphical outputs, including scientific content, chemical representations, labels, and numerical values, and take full responsibility for the content of this publication.
Abbreviations
The following abbreviations are used in this manuscript:
| ADR | adverse drug reactions |
| AGEP | acute generalized exanthematous pustulosis |
| BA | balanced accuracy |
| DRESS | drug reaction with eosinophilia and systemic symptoms |
| FAERS | FDA Adverse Event Reporting System |
| HLA | human leukocyte antigen |
| JADER | Japanese Adverse Drug Event Report |
| LightGBM | light gradient-boosting machine |
| MCC | Matthews correlation coefficient |
| PT | preferred terms |
| SCAR | Severe cutaneous adverse reactions |
| SMILES | Simplified Molecular-Input Line-Entry System |
| SMQ | Standardised MedDRA Query |
| TEN | toxic epidermal necrolysis |
References
- Chung, W.-H.; Wang, C.-W.; Dao, R.-L. Severe cutaneous adverse drug reactions. J. Dermatol. 2016, 43, 758–766. [Google Scholar] [CrossRef] [PubMed]
- Pichler, W.J. Immune pathomechanism and classification of drug hypersensitivity. Allergy 2019, 74, 1457–1471. [Google Scholar] [CrossRef] [PubMed]
- Roujeau, J.-C.; Stern, R.S. Severe adverse cutaneous reactions to drugs. N. Engl. J. Med. 1994, 331, 1272–1285. [Google Scholar] [CrossRef]
- Cacoub, P.; Musette, P.; Descamps, V.; Meyer, O.; Speirs, C.; Finzi, L.; Roujeau, J.-C. The DRESS syndrome: A literature review. Am. J. Med. 2011, 124, 588–597. [Google Scholar] [CrossRef]
- Hsu, D.Y.; Brieva, J.; Silverberg, N.B.; Silverberg, J.I. Morbidity and mortality of Stevens–Johnson syndrome and toxic epidermal necrolysis in United States adults. J. Invest. Dermatol. 2016, 136, 1387–1397. [Google Scholar] [CrossRef]
- Park, B.K.; Pirmohamed, M.; Kitteringham, N.R. Role of drug disposition in drug hypersensitivity: A chemical, molecular, and clinical perspective. Chem. Res. Toxicol. 1998, 11, 969–988. [Google Scholar] [CrossRef] [PubMed]
- Pichler, W.J. The p-i concept: Pharmacological interaction of drugs with immune receptors. World Allergy Organ. J. 2008, 1, 96–102. [Google Scholar] [CrossRef]
- Sakaeda, T.; Tamon, A.; Kadoyama, K.; Okuno, Y. Data mining of the public version of the FDA Adverse Event Reporting System. Int. J. Med. Sci. 2013, 10, 796–803. [Google Scholar] [CrossRef]
- Bate, A.; Evans, S.J.W. Quantitative signal detection using spontaneous ADR reporting. Pharmacoepidemiol. Drug Saf. 2009, 18, 427–436. [Google Scholar] [CrossRef]
- Cribb, A.E.; Lee, B.L.; Trepanier, L.A.; Spielberg, S.P. Adverse reactions to sulphonamide and sulphonamide-trimethoprim antimicrobials: Clinical syndromes and pathogenesis. Advers. Drug React. Toxicol. Rev. 1996, 15, 9–50. [Google Scholar]
- Chung, W.-H.; Hung, S.-I.; Hong, H.-S.; Hsih, M.-S.; Yang, L.-C.; Ho, H.-C.; Wu, J.-Y.; Chen, Y.-T. Medical genetics: A marker for Stevens–Johnson syndrome. Nature 2004, 428, 486. [Google Scholar] [CrossRef] [PubMed]
- Cherkasov, A.; Muratov, E.N.; Fourches, D.; Varnek, A.; Baskin, I.I.; Cronin, M.; Dearden, J.; Gramatica, P.; Martin, Y.C.; Todeschini, R.; et al. QSAR modeling: Where have you been? Where are you going to? J. Med. Chem. 2014, 57, 4977–5010. [Google Scholar] [CrossRef]
- Ai, H.; Chen, W.; Zhang, L.; Huang, L.; Yin, Z.; Hu, H.; Zhao, Q.; Zhao, J.; Liu, H. Predicting drug-induced liver injury using ensemble learning methods and molecular fingerprints. Toxicol. Sci. 2018, 165, 100–107. [Google Scholar] [CrossRef] [PubMed]
- Cai, C.; Guo, P.; Zhou, Y.; Zhou, J.; Wang, Q.; Zhang, F.; Fang, J.; Cheng, F. Deep learning-based prediction of drug-induced cardiotoxicity. J. Chem. Inf. Model. 2019, 59, 1073–1084. [Google Scholar] [CrossRef]
- Alves, V.M.; Muratov, E.; Fourches, D.; Strickland, J.; Kleinstreuer, N.; Andrade, C.H.; Tropsha, A. Predicting chemically-induced skin reactions. Part I: QSAR models of skin sensitization and their application to identify potentially hazardous compounds. Toxicol. Appl. Pharmacol. 2015, 284, 262–272. [Google Scholar] [CrossRef]
- Low, Y.S.; Caster, O.; Bergvall, T.; Fourches, D.; Zang, X.; Norén, G.N.; Rusyn, I.; Edwards, R.; Tropsha, A. Cheminformatics-aided pharmacovigilance: Application to Stevens–Johnson syndrome. J. Am. Med. Inform. Assoc. 2016, 23, 968–978. [Google Scholar] [CrossRef]
- Ambe, K.; Ohya, K.; Takada, W.; Suzuki, M.; Tohkin, M. In silico approach to predict severe cutaneous adverse reactions using the Japanese Adverse Drug Event Report database. Clin. Transl. Sci. 2021, 14, 756–763. [Google Scholar] [CrossRef]
- Li, D.; Gou, J.; Zhu, J.; Zhang, T.; Liu, F.; Zhang, D.; Dai, L.; Li, W.; Liu, Q.; Qin, C.; et al. Severe cutaneous adverse reactions to drugs: A real-world pharmacovigilance study using the FDA Adverse Event Reporting System database. Front. Pharmacol. 2023, 14, 1117391. [Google Scholar] [CrossRef]
- Hammann, F.; Gutmann, H.; Vober, N.; Schellander, J.; Drewe, J. Prediction of adverse drug reactions using decision tree modeling. Clin. Pharmacol. Ther. 2010, 88, 52–59. [Google Scholar] [CrossRef]
- Cereto-Massagué, A.; Ojeda, M.J.; Valls, C.; Mulero, M.; Garcia-Vallvé, S.; Pujadas, G. Molecular fingerprint similarity search in virtual screening. Methods 2015, 71, 58–63. [Google Scholar] [CrossRef] [PubMed]
- Durant, J.L.; Leland, B.A.; Henry, D.R.; Nourse, J.G. Reoptimization of MDL keys for use in drug discovery. J. Chem. Inf. Comput. Sci. 2002, 42, 1273–1280. [Google Scholar] [CrossRef]
- Rogers, D.; Hahn, M. Extended-connectivity fingerprints. J. Chem. Inf. Model. 2010, 50, 742–754. [Google Scholar] [CrossRef] [PubMed]
- Ke, G.; Meng, Q.; Finley, T.; Wang, T.; Chen, W.; Ma, W.; Ye, Q.; Liu, T.-Y. LightGBM: A highly efficient gradient boosting decision tree. Adv. Neural Inf. Process. Syst. 2017, 30, 3146–3154. Available online: https://dl.acm.org/doi/10.5555/3294996.3295074.
- Lundberg, S.M.; Lee, S.-I. A unified approach to interpreting model predictions. Adv. Neural Inf. Process. Syst. 2017, 30, 4765–4774. Available online: https://dl.acm.org/doi/10.5555/3295222.3295230.
- Chung, W.-H.; Hung, S.-I.; Chen, Y.-T. Genetic predisposition of life-threatening antiepileptic-induced skin reactions. Expert Opin. Drug Saf. 2010, 9, 15–21. [Google Scholar] [CrossRef]
- Uetrecht, J. Idiosyncratic drug reactions: Current understanding. Annu. Rev. Pharmacol. Toxicol. 2007, 47, 513–539. [Google Scholar] [CrossRef]
- Naisbitt, D.J.; Williams, D.P.; Pirmohamed, M.; Kitteringham, N.R.; Park, B.K. Reactive metabolites and their role in drug reactions. Curr. Opin. Allergy Clin. Immunol. 2001, 1, 317–325. [Google Scholar] [CrossRef]
- Illing, P.T.; Vivian, J.P.; Dudek, N.L.; Kostenko, L.; Chen, Z.; Bharadwaj, M.; Miles, J.J.; Kjer-Nielsen, L.; Gras, S.; Williamson, N.A.; et al. Immune self-reactivity triggered by drug-modified HLA-peptide repertoire. Nature 2012, 486, 554–558. [Google Scholar] [CrossRef]
- Rice-Evans, C.A.; Miller, N.J.; Paganga, G. Structure-antioxidant activity relationships of flavonoids and phenolic acids. Free Radic. Biol. Med. 1996, 20, 933–956. [Google Scholar] [CrossRef] [PubMed]
- Lundberg, S.M.; Erion, G.; Chen, H.; DeGrave, A.; Prutkin, J.M.; Nair, B.; Katz, R.; Himmelfarb, J.; Bansal, N.; Lee, S.-I. From local explanations to global understanding with explainable AI for trees. Nat. Mach. Intell. 2020, 2, 56–67. [Google Scholar] [CrossRef]
- Jimenez-Luna, J.; Grisoni, F.; Schneider, G. Drug discovery with explainable artificial intelligence. Nat. Mach. Intell. 2020, 2, 573–584. [Google Scholar] [CrossRef]
- Tropsha, A. Best practices for QSAR model development, validation, and exploitation. Mol. Inform. 2010, 29, 476–488. [Google Scholar] [CrossRef] [PubMed]
- Medical Dictionary for Regulatory Activities (MedDRA). Introductory Guide for Standardised MedDRA Queries (SMQs), Version 27.1; International Council for Harmonisation of Technical Requirements for Pharmaceuticals for Human Use (ICH): Geneva, Switzerland, 2024. Available online: https://admin.meddra.org/sites/default/files/guidance/file/SMQ_intguide_27_1_English.pdf (accessed on 29 April 2026).
- van Puijenbroek, E.P.; Bate, A.; Leufkens, H.G.M.; Lindquist, M.; Orre, R.; Egberts, A.C.G. A comparison of measures of disproportionality for signal detection in spontaneous reporting systems for adverse drug reactions. Pharmacoepidemiol. Drug Saf. 2002, 11, 3–10. [Google Scholar] [CrossRef] [PubMed]
- Landrum, G. RDKit: Open-source cheminformatics software. Available online: https://www.rdkit.org/ (accessed on 9 April 2026). [CrossRef]
- Akiba, T.; Sano, S.; Yanase, T.; Ohta, T.; Koyama, M. Optuna: A next-generation hyperparameter optimization framework. In Proceedings of the 25th ACM SIGKDD International Conference on Knowledge Discovery & Data Mining (KDD ’19), Anchorage, AK, USA, 4–8 August 2019; ACM: New York, NY, USA, 2019; pp. 2623–2631. [Google Scholar] [CrossRef]
- Platt, J.C. Probabilities for SV machines. In Advances in Large Margin Classifiers; Smola, A.J., Bartlett, P., Schölkopf, B., Schuurmans, D., Eds.; MIT Press: Cambridge, MA, USA, 2000; pp. 61–74. [Google Scholar] [CrossRef]
- Varma, S.; Simon, R. Bias in error estimation when using cross-validation for model selection. BMC Bioinform. 2006, 7, 91. [Google Scholar] [CrossRef]
Figure 1.
Stability of nested cross-validation performance across 50 repeated runs. Each point represents one repeat, with the mean ROC AUC across the six outer folds on the y-axis and the corresponding within-repeat standard deviation on the x-axis. The narrow clustering of points indicates that the internal random-split performance estimate was stable across repeated data partitions.
Figure 1.
Stability of nested cross-validation performance across 50 repeated runs. Each point represents one repeat, with the mean ROC AUC across the six outer folds on the y-axis and the corresponding within-repeat standard deviation on the x-axis. The narrow clustering of points indicates that the internal random-split performance estimate was stable across repeated data partitions.
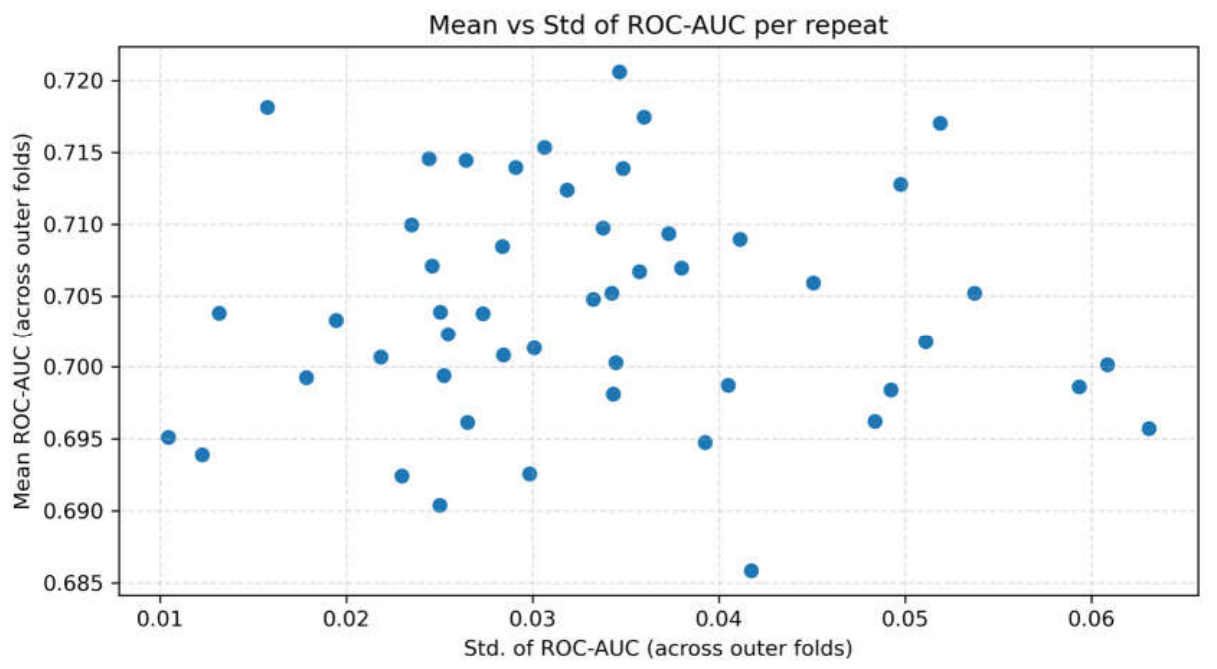
Figure 2.
Top 10 substructure descriptors ranked by LightGBM split count in the final interpretation model. Bar length indicates how often each feature was selected as a splitting variable. See Table 2 and Supplementary Table S4 for descriptor annotations and SMILES mappings.
Figure 2.
Top 10 substructure descriptors ranked by LightGBM split count in the final interpretation model. Bar length indicates how often each feature was selected as a splitting variable. See Table 2 and Supplementary Table S4 for descriptor annotations and SMILES mappings.
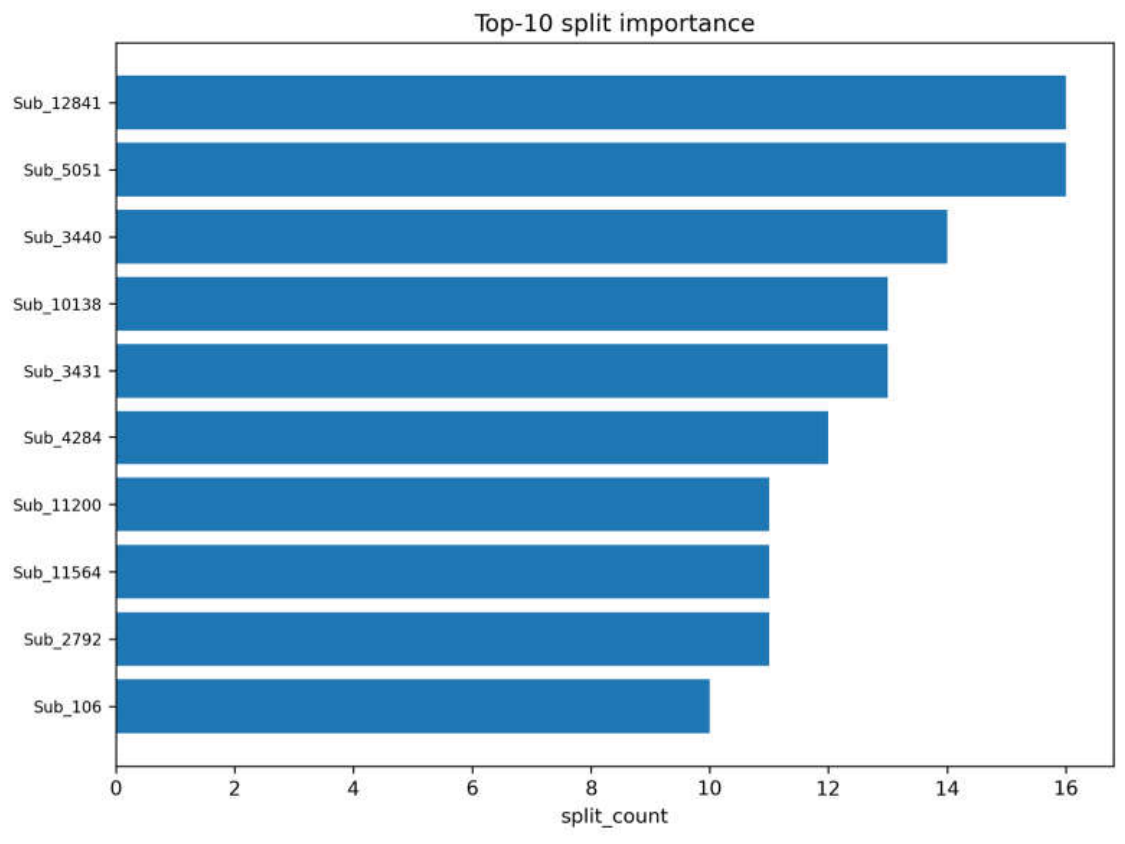
Figure 4.
Chemical structures of top-ranked substructure descriptors from LightGBM split importance and SHAP analysis. Upper panel: top 10 descriptors by LightGBM split count (Table 2). Lower panel: top 10 descriptors by mean absolute SHAP value (Table 3). Within each panel, descriptors descend in rank from left to right and then from top to bottom. The structures were drawn from canonical fragment SMILES documented in the feature–SMILES mapping file (Supplementary Table S4). Descriptors appearing in both panels indicate concordance between split-based feature usage and SHAP-based contribution magnitude. Because several descriptors represent fragment-like or open-valence local patterns extracted by atom-centered local substructure enumeration, the drawings should be interpreted as partial structural motifs, not fully resolved standalone chemical moieties. This applies particularly to Sub_106, Sub_1464, and Sub_4552.
Figure 4.
Chemical structures of top-ranked substructure descriptors from LightGBM split importance and SHAP analysis. Upper panel: top 10 descriptors by LightGBM split count (Table 2). Lower panel: top 10 descriptors by mean absolute SHAP value (Table 3). Within each panel, descriptors descend in rank from left to right and then from top to bottom. The structures were drawn from canonical fragment SMILES documented in the feature–SMILES mapping file (Supplementary Table S4). Descriptors appearing in both panels indicate concordance between split-based feature usage and SHAP-based contribution magnitude. Because several descriptors represent fragment-like or open-valence local patterns extracted by atom-centered local substructure enumeration, the drawings should be interpreted as partial structural motifs, not fully resolved standalone chemical moieties. This applies particularly to Sub_106, Sub_1464, and Sub_4552.
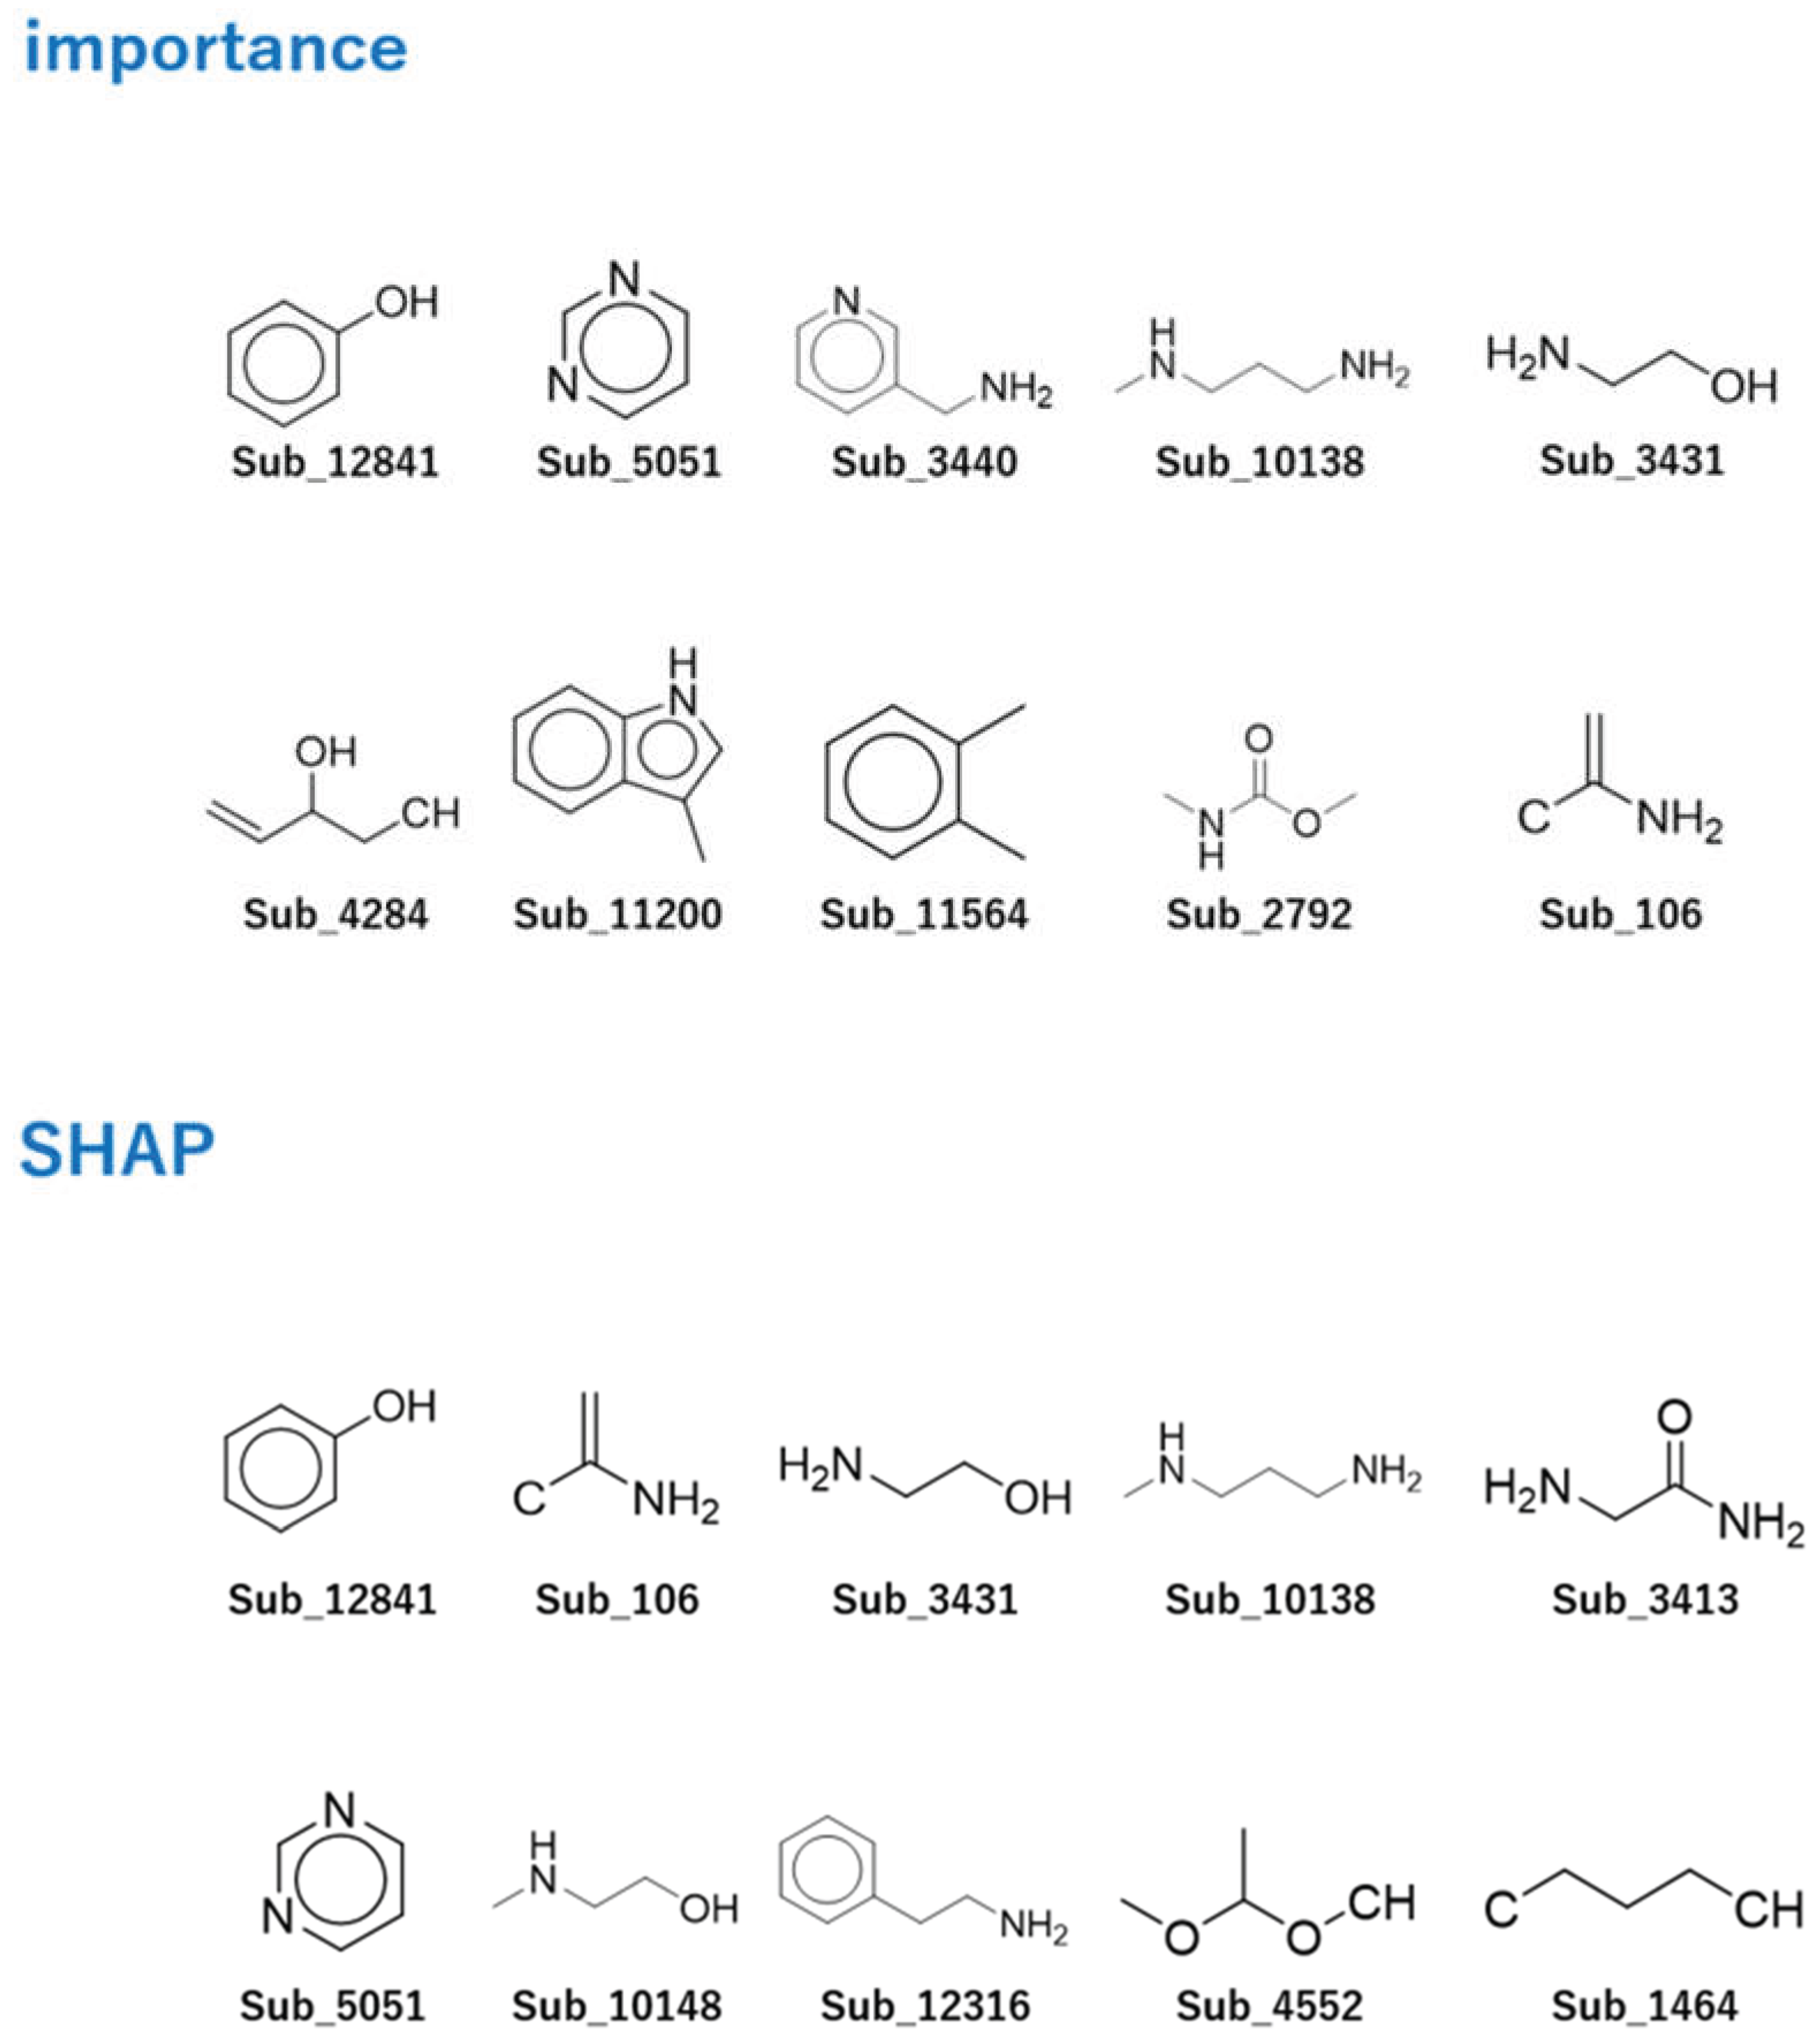

Table 1.
Summary of nested cross-validation performance across 300 outer-fold test evaluations. ROC AUC: area under the receiver operating characteristic curve; PR AUC: area under the precision–recall curve; ACC: accuracy; BA: balanced accuracy; F1: F1 score; MCC: Matthews correlation coefficient; SENS: sensitivity; SPEC: specificity.
Table 1.
Summary of nested cross-validation performance across 300 outer-fold test evaluations. ROC AUC: area under the receiver operating characteristic curve; PR AUC: area under the precision–recall curve; ACC: accuracy; BA: balanced accuracy; F1: F1 score; MCC: Matthews correlation coefficient; SENS: sensitivity; SPEC: specificity.
| Metric | Mean | SD | Min | Max | Median |
| ROC AUC | 0.7041 | 0.0337 | 0.5872 | 0.7971 | 0.7063 |
| PR AUC | 0.8592 | 0.0189 | 0.7910 | 0.9038 | 0.8599 |
| ACC | 0.6821 | 0.0569 | 0.4194 | 0.7957 | 0.6882 |
| BA | 0.6685 | 0.0277 | 0.5840 | 0.7691 | 0.6690 |
| F1 | 0.7561 | 0.0701 | 0.3415 | 0.8619 | 0.7662 |
| MCC | 0.3167 | 0.0509 | 0.1853 | 0.5140 | 0.3198 |
| SENS | 0.6984 | 0.1151 | 0.2069 | 0.9261 | 0.7094 |
| SPEC | 0.6386 | 0.1190 | 0.3026 | 0.9868 | 0.6406 |
Table 2.
Top 10 features by light gradient boosting machine (LightGBM) split count in the final interpretation model.
Table 2.
Top 10 features by light gradient boosting machine (LightGBM) split count in the final interpretation model.
| Rank | Feature | SMILES | Substructure Description | Split Count | Gain |
| 1 | Sub_12841 | Oc1ccccc1 | Phenol fragment | 16 | 63.5992 |
| 2 | Sub_5051 | c1cncnc1 | Pyrimidine fragment | 16 | 45.1674 |
| 3 | Sub_3440 | NCc1cccnc1 | Aminomethylpyridine fragment | 14 | 30.8971 |
| 4 | Sub_10138 | CNCCCN | N-Methyl-1,3-diaminopropane | 13 | 28.9546 |
| 5 | Sub_3431 | NCCO | Ethanolamine fragment | 13 | 23.5982 |
| 6 | Sub_4284 | [CH]CC(O)C=C | Allylic alcohol-like fragment | 12 | 34.8441 |
| 7 | Sub_11200 | Cc1c[nH]c2ccccc12 | 3-Methylindole fragment | 11 | 26.0074 |
| 8 | Sub_11564 | Cc1ccccc1C | o-Xylene fragment | 11 | 25.9274 |
| 9 | Sub_2792 | CNC(=O)OC | N-Methylcarbamate fragment | 11 | 23.5489 |
| 10 | Sub_106 | [C]C(=C)N | Allylamine-like fragment | 10 | 105.4242 |
Table 3.
Top 10 features ranked by mean absolute SHAP value in the final interpretation model.
| Rank | Feature | SMILES | Substructure Description | Mean |SHAP| |
| 1 | Sub_12841 | Oc1ccccc1 | Phenol fragment | 0.1727 |
| 2 | Sub_106 | [C]C(=C)N | Allylamine-like fragment | 0.1031 |
| 3 | Sub_3431 | NCCO | Ethanolamine fragment | 0.0846 |
| 4 | Sub_10138 | CNCCCN | N-Methyl-1,3-diaminopropane | 0.0832 |
| 5 | Sub_3413 | NCC(N)=O | Glycinamide fragment | 0.0754 |
| 6 | Sub_5051 | c1cncnc1 | Pyrimidine fragment | 0.0693 |
| 7 | Sub_10148 | CNCCO | N-Methylethanolamine fragment | 0.0574 |
| 8 | Sub_12316 | NCCc1ccccc1 | Phenethylamine fragment | 0.0564 |
| 9 | Sub_4552 | [CH]OC(C)OC | Acetal-like fragment | 0.0528 |
| 10 | Sub_1464 | [C]CCC[CH] | Aliphatic chain fragment | 0.0519 |
Table 4.
Hyperparameter search space for LightGBM optimization with Optuna.
| Hyperparameter | Type | Range/Values |
| num_leaves | Categorical | {8, 16, 32, 64, 128} |
| max_depth | Categorical | {−1, 4, 6, 8, 12} |
| learning_rate | Categorical | {0.01, 0.05, 0.1} |
| min_child_samples | Categorical | {5, 10, 20, 30, 40, 60, 80} |
| subsample | Continuous | [0.5, 1.0] |
| subsample_freq | Categorical | {0, 1, 5} |
| colsample_bytree | Continuous | [0.4, 1.0] |
| reg_alpha | Continuous | [1 x 10⁻⁸, 10.0] (log scale) |
| reg_lambda | Continuous | [1 x 10⁻⁸, 10.0] (log scale) |
| min_split_gain | Categorical | {0.0, 0.01, 0.05, 0.1} |
Disclaimer/Publisher’s Note: The statements, opinions and data contained in all publications are solely those of the individual author(s) and contributor(s) and not of MDPI and/or the editor(s). MDPI and/or the editor(s) disclaim responsibility for any injury to people or property resulting from any ideas, methods, instructions or products referred to in the content. |
© 2026 by the authors. Licensee MDPI, Basel, Switzerland. This article is an open access article distributed under the terms and conditions of the Creative Commons Attribution (CC BY) license (http://creativecommons.org/licenses/by/4.0/).
Copyright: This open access article is published under a Creative Commons CC BY 4.0 license, which permit the free download, distribution, and reuse, provided that the author and preprint are cited in any reuse.


