
Submitted:
03 May 2026
Posted:
05 May 2026
You are already at the latest version
Abstract
Background/Objectives: Indigenous children in La Guajira, Colombia, live in a context of structural vulnerability that may compromise growth and nutritional status. This study aimed to characterize anthropometric patterns and longitudinal nutritional changes in Wayúu children under five years of age. Methods: We conducted a prospective cohort study in 398 children from 27 Wayúu communities in Manaure, La Guajira, over an 8-month period. Anthropometric measurements were obtained by pediatricians and classified using standard indicators based on WHO growth references. A descriptive and bivariate analysis was performed for the full sample, and longitudinal changes were evaluated in a follow-up subgroup. Results: At baseline, 92.46% of children presented at least one nutritional alteration, and 89.95% had malnutrition or developmental delay. Stunting was the most frequent condition (89.95%), whereas acute malnutrition was less common. In the longitudinal subgroup, 41.67% of children worsened in at least one indicator, with a significant increase in nutritional risk over time. Older children showed worse weight-for-age and height-for-age indicators than younger children, while no significant differences were observed by sex. Conclusions: Wayúu children under five years in Manaure show a pattern dominated by chronic, symmetrical growth impairment with worsening anthropometric trajectories over time. These findings highlight the need for sustained, culturally adapted, and multisectoral strategies to prevent and manage childhood malnutrition in Indigenous populations.
Keywords:
child
; indigenous peoples
; infant nutrition disorders
; child nutrition disorders
; social determinants of health
; Colombia
1. Introduction
Malnutrition and its impact on early childhood development (ECD) are a priority for public health due to their effects on survival, neurodevelopment, future productivity, and social equity. Malnutrition and its implications extend beyond medical landscape, becoming a cross-cutting area of interest for societies and governments. Therefore, the Sustainable Development Goals emphasize the global commitment to combat malnutrition and reduce its impact on child development (Goal 2) [1,2].
ECD encompasses the period from gestation through the first 6–8 years of life. This stage is critical for the acquisition of physical, cognitive, emotional, and social skills that determine well-being across the life course, with implications at both individual and societal levels [3,4]. Approximately 80% of key developmental milestones occur during this period, and the brain reaches nearly 90% of its structural and functional development. Consequently, this period is particularly sensitive to adverse exposures such as food insecurity, recurrent infections, and psychosocial stress.
To achieve optimal development, the World Health Organization (WHO) and UNICEF promoted the “nurturing care” concept, which integrates the following components: good health, adequate nutrition, safety and protection, responsive caregiving, and opportunities for early learning [4,5,6,7]. However, these elements alone are insufficient. A supportive social and economic environment, which may either enhance or constrain child development, is required [4,5,8,9]. The impact of these social determinants is substantial: worldwide, an estimated 200 million children under five fail to reach their developmental potential due to poverty, food insecurity, limited access to healthcare, and inadequate early stimulation [10].
In Colombia, several populations experience similar conditions of deprivation and social vulnerability. Among them are Indigenous communities, particularly the Wayúu population in La Guajira. This community faces structural challenges that increase the risk of malnutrition and developmental disorders, including persistent poverty, chronic food insecurity, lack of access to drinking water and basic sanitation, residence in geographically dispersed rural areas with limited accessibility, cultural and language barriers to healthcare access, low educational attainment, structural discrimination, and limited local institutional capacity [11,12,13,14]. Additionally, the Wayúu population is affected by climate change, subsistence-based economies, migration, and fragile social protection systems, all of which further compromise access to adequate nutrition. These conditions create a detrimental environment that directly impacts child nutrition and development, perpetuating an intergenerational cycle of inequality and poor health outcomes [3,8,11,15,16].
Child development is intrinsically linked to nutritional status [4,6,17], which in turn varies according to socioeconomic and environmental conditions [3,8,14]. Consequently, it is essential to establish global reference standards defining optimal growth. The WHO Child Growth Standards represent a methodological milestone, derived from multicenter cohorts of healthy children raised under optimal conditions, describing how children should grow rather than how they grow in specific contexts [18,19]. These standards enable early detection of deviations and guide both clinical and population-level interventions, including in vulnerable populations such as the Wayúu, distinguishing between normal constitutional variation and growth alterations secondary to deprivation. They are critical tools for identifying nutritional risk, monitoring interventions, and evaluating recovery and developmental outcomes [10,18,20,21].
Given the impact of nutrition and social determinants on child development [8,17], and the vulnerability of populations such as the Wayúu [11,13], multiple governmental strategies have been implemented to reduce disparities. These include strengthening institutional presence, generating local data, implementing culturally sensitive primary care programs, integrating nutrition, health, education, and social protection, and promoting community empowerment to develop sustainable and culturally appropriate policies [2,22].
At the national level, the Colombian government established the Health Research Fund (FIS), administered by the Ministry of Science, Technology, and Innovation, to finance health research projects [23,24]. Through this mechanism, resources were allocated to the National Institute of Health (INS) to develop the project: “Community intervention for the prevention of maternal and perinatal morbidity and mortality under a sexual and reproductive health approach, and assessment of growth and development in Wayúu children in a region of La Guajira” (in Spanish, “Intervención comunitaria para la prevención de la morbimortalidad materna y perinatal bajo el enfoque de salud sexual y reproductiva; y valoración del crecimiento y desarrollo en niños y niñas del pueblo Wayúu de una región de La Guajira”). This project includes multiple phases, beginning with the characterization of population and nutritional status as a foundation for understanding structural vulnerabilities and guiding interventions.
Therefore, we aimed to identify growth and developmental patterns in a cohort of Wayúu children in La Guajira, Colombia, within a national governmental initiative to reduce child morbidity and mortality and strengthen ECD in vulnerable populations.
2. Materials and Methods
2.1. Study Design
This study is part of a governmental initiative that employed a mixed-methods approach, incorporating a qualitative component with a phenomenological and participatory action framework, and a quantitative component with a prospective cohort design.
This article presents the results of the quantitative analysis of the growth and development cohort of Wayúu children in La Guajira over an 8-month follow-up period (August 12, 2024, to March 28, 2025).
2.2. Study Population and Sample
We used a non-probabilistic sampling method (convenience sampling) to include study participants under five years from 27 communities in the municipality of Manaure, La Guajira, Colombia. In total, 398 children were included, representing:
- 3.38% of the population of the municipality of Manaure according to the 2018 census [26]
- 3.75% of children under 4 years in the dispersed rural population of Manaure
2.3. Inclusion and Exclusion Criteria
All children under five years (0 to 4 years) residing in the selected communities at the time of the community intervention were included. No exclusion criteria or recruitment restrictions were applied. Participants were evaluated in the presence of their legal guardians, and informed consent was obtained prior to data collection.
2.4. Variables and Data Collection
Anthropometric data were collected by a team of pediatricians using calibrated measurement instruments (stadiometer, scale, and Mid-Upper Arm Circumference [MUAC] tape) during clinical evaluations. Data were recorded in paper-based medical records and posteriorly were uploaded in a digital data collection form. Collected variables included sociodemographic characteristics and anthropometric measurements, classified according to standard definitions.
2.5. Statistical Analysis
A descriptive analysis of demographic and anthropometric variables was performed including all study participants’ data. A bivariate analysis was conducted to compare anthropometric indicators by sex. A subgroup of participants was follow-up and their changes were compared over time. Data storage and preliminary processing were performed using Microsoft Excel. Statistical analysis was conducted using SPSS version 21.
3. Results
A total of 398 children were included in the study: 216 boys and 182 girls, corresponding to a male-to-female ratio of 1.16 and a proportion of 54.3% male participants (Table 1). The median age was 2.65 years (IQR: 1.47–3.57) among boys and 2.76 years (IQR: 1.48–3.77) among girls, consistent with the sex distribution reported in the most recent departmental census.
Overall, age distribution was non-normal, with a median of 2.70 years (IQR: 1.48–3.67; range: 3.25 months to 5.05 years). The majority of participants (98.2%) were older infants and children aged between 6 months and 5 years, while only 1.8% were younger infants. Age distribution was similar across sexes (Figure 2).
Follow-up was achieved in 6.03% of cases (n = 24), and 12 children changed communities during the study period.
3.1. Baseline Nutritional Status
At the initial evaluation, more than 90% of participants presented at least one form of nutritional alteration. Except for 10 cases, all children exhibited some degree of developmental delay or established malnutrition.
The most prevalent condition was stunting (height-for-age deficit), affecting 60.1% of participants, followed by underweight (weight-for-age deficit) at 23.1%. In contrast, the prevalence of acute malnutrition (wasting) was low, at 3.5% according to weight-for-height and 2% according to MUAC.
These findings suggest a pattern of symmetrical growth impairment, which also affected head circumference, with nearly half of the children (46.48%) classified as having microcephaly (Table 2).
Overall, 92.46% of participants had at least one nutritional alteration, and 89.95% had some form of malnutrition or developmental delay.
In the follow-up subgroup (n = 24), there was a slight increase in the proportion of children with malnutrition or developmental delay (from 83.33% to 91.67%).
A heterogeneous pattern of change was observed:
- 75% of children showed changes in nutritional indicators
- 41.67% experienced worsening in at least one indicator
There was a predominance of increased risk of acute malnutrition and neurological risk (Figure 3).
Within-subject analysis showed:
- A statistically significant increase in nutritional risk between visits (83.33% vs. 91.67%, p = 0.02)
- No statistically significant change in neurological risk (25% vs. 50%, p = 0.61)
Graphical analysis (Figure 4) demonstrated a progressive negative trend in anthropometric indicators over time, with worsening z-scores for both weight-for-age and height-for-age as follow-up time increased.
3.3. Sex and Age Associations
No statistically significant differences were observed in nutritional alterations by sex. However, both underweight (global malnutrition) and stunting (chronic malnutrition) showed statistically significant associations with age. Children aged 2 to 4 years were more likely to present low weight or short stature for age, whereas younger infants were more likely to have normal anthropometric indicators. These findings are consistent with a direct correlation between increasing age and worsening nutritional status (Table 3).
4. Discussion
This analysis provides a characterization of the nutritional status of Wayúu children under five years of age in the municipality of Manaure, La Guajira. The findings reveal a critical public health situation, with prevalences of underweight (weight-for-age) and stunting (height-for-age) that are substantially higher than both national estimates and those reported in other high-risk populations, including Indigenous groups in Colombia. Although the prevalence of acute malnutrition (wasting) was lower, it remains approximately twice that reported in the most recent national nutritional survey [31].
Notably, these nutritional alterations were significantly associated with age, with higher prevalence observed among children older than two years. This pattern may be related to the cessation of breastfeeding and increased exposure to food insecurity and limited access to resources within their socioeconomic context [32,33,34,35]. The predominance of chronic malnutrition reflects a pattern of symmetrical growth impairment, characterized by generalized reduced body size and, in many cases, involvement of head circumference. This pattern is not fully captured by weight-for-height indicators or the conventional diagnosis of acute malnutrition, which benefits from standardized national treatment protocols [36]. In contrast, chronic malnutrition represents a distinct and potentially more severe public health challenge.
Recovery from chronic malnutrition or symmetrical growth delay is more difficult to achieve, and its consequences are more profound and long-lasting. These include detrimental effects on neurodevelopment, immune function, and overall functional capacity, with impacts that may persist into adulthood and old age [37,38,39]. Effective intervention requires not only addressing biological and individual-level factors, such as low birth weight, chronic infections (e.g., parasitic diseases), and familial short stature, all of which are present in this population and have been described in similar settings [40,41] —but also tackling the broader structural determinants.
In addition to the previously described socioeconomic factors [32,33,34,35], this population faces severe limitations in access to essential resources, which may exacerbate or perpetuate these biological risks. Evidence from national surveys on multidimensional poverty and nutritional status [25,31,42] indicates that both the municipality of Manaure and the department of La Guajira have some of the highest levels of food insecurity, limited access to basic services (including potable water, sanitation, and electricity), and lower per capita income compared to national averages. These conditions are well-established risk factors for chronic malnutrition [32,33,34,35] and act not only as causal drivers but also as reinforcing mechanisms that sustain biological vulnerabilities over time, ultimately contributing to a persistent cycle of poverty–malnutrition–poverty [32,33,34,35,40].
The longitudinal analysis, although limited to a small subgroup, reinforces these findings. The persistence of stunting and underweight, along with the progression toward worsening anthropometric indicators over time, suggests a pattern of growth stagnation rather than recovery. This dynamic is particularly concerning, as it indicates that affected children are not achieving catch-up growth, thereby increasing the likelihood of long-term adverse outcomes. Additionally, the high degree of internal migration between communities poses a significant challenge for continuity of care and follow-up, which must be considered in the design of future interventions.
While the study is primarily descriptive, it highlights the urgent need for sustained and comprehensive interventions in this population. Such strategies should not focus solely on short-term correction of specific anthropometric indicators but rather adopt a holistic and multisectoral approach aimed at addressing both the immediate and underlying determinants of malnutrition. This includes improving access to adequate nutrition, strengthening health services, enhancing ECD programs, and addressing structural inequities that disproportionately affect Indigenous communities.
The main limitations of this study include its observational design, which precludes causal inference between nutritional outcomes and the evaluated social, economic, and demographic factors. Additionally, follow-up of the cohort was limited due to geographic barriers and the semi-nomadic lifestyle of the population, which may have introduced selection bias in the longitudinal analysis.
Finally, while the findings may be generalizable to Indigenous communities in the Guajira Peninsula, they may not be directly extrapolated to other Indigenous or rural populations in Colombia with different sociocultural and geographic contexts.
5. Conclusions
Wayúu children in La Guajira, Colombia, exhibit a shift in nutritional patterns from predominantly acute malnutrition toward chronic, symmetrical growth impairment, necessitating a reorientation of prevention and control strategies for childhood malnutrition. Childhood malnutrition in this population results from the interaction between biological factors and structural socioeconomic determinants, which together exacerbate and perpetuate nutritional deficits over time.
Author Contributions
Conceptualization, S.B.-A. and A.F.M.-S.; methodology, P.B. and A.F.M.-S.; software, P.B.; validation, P.B., K.R. and A.F.M.-S.; formal analysis, P.B. and K.R.; investigation, K.R. and S.B.-A.; resources, S.B.-A.; data curation, P.B. and K.R.; writing—original draft preparation, P.B.; writing—review and editing, A.F.M.-S.; visualization, P.B.; supervision, S.B.-A.; project administration, A.F.M.-S.; funding acquisition, S.B.-A.. All authors have read and agreed to the published version of the manuscript.
Funding
This research was funded by the Colombian Ministry of Science, Technology, and Innovation (Ministerio de Ciencia, Tecnología e Innovación), as part of project project “Community intervention for the prevention of maternal and perinatal morbidity and mortality under a sexual and reproductive health approach, and assessment of growth and development in Wayúu children in a region of La Guajira,”. The APC was also funded by the Colombian Ministry of Science, Technology, and Innovation.
Institutional Review Board Statement
The study was conducted in accordance with the Declaration of Helsinki, and approved by the Institutional Ethics and Research Methodology Committee (CEMIN 19-2023, Act No. 21, July 14, 2023). .
Informed Consent Statement
Informed assent was obtained from all subjects involved in the study. Written informed consent was obtained from the patients’ parents or legal guardians to publish this paper.
Data Availability Statement
The data presented in this study are available on request from the corresponding author due to legal reasons.
Acknowledgments
The authors would like to thank Ana María Pertuz for her support, comments and insights regarding the Wayúu culture and society. During the preparation of this manuscript, the authors used ChatGPT 5.4 Thinking for the purposes of improve fluency and check grammatical mistakes. The authors have reviewed and edited the output and take full responsibility for the content of this publication.
Conflicts of Interest
The authors declare no conflicts of interest. The funders had no role in the design of the study; in the collection, analyses, or interpretation of data; in the writing of the manuscript; or in the decision to publish the results.
Abbreviations
The following abbreviations are used in this manuscript:
| BMI | Body Mass Index |
| ECD | Early Childhood Development |
| FIS | Health Research Fund (Fondo de Investigación en Salud) |
| INS | National Institute of Health (Instituto Nacional de Salud) |
| MUAC | Mid-Upper Arm Circumference |
| SPSS | Statistical Package for the Social Sciences |
| WHO | World Health Organization |
References
- OMC | Los Objetivos de Desarrollo del Milenio de las Naciones Unidas [Internet]. 29 Jan 2026. Available online: https://www.wto.org/spanish/thewto_s/coher_s/mdg_s/mdgs_s.htm.
- Objetivos y metas de desarrollo sostenible - Desarrollo Sostenible [Internet]. 30 Jan 2026. Available online: https://www.un.org/sustainabledevelopment/es/sustainable-development-goals/.
- Pérez-Escamilla, R. Food Security and the 2015–2030 Sustainable Development Goals: From Human to Planetary Health. Curr Dev Nutr 2017, 1(7), e000513. [Google Scholar] [CrossRef] [PubMed] [PubMed Central]
- Black, M.M.; Walker, S.P.; Fernald, L.C.H.; Andersen, C.T.; DiGirolamo, A.M.; Lu, C.; et al. Early childhood development coming of age: science through the life course. Lancet 2017, 389(10064), 77–90. [Google Scholar] [CrossRef] [PubMed] [PubMed Central]
- Richter, L.; Black, M.; Britto, P.; Daelmans, B.; Desmond, C.; Devercelli, A.; et al. Early childhood development: an imperative for action and measurement at scale. BMJ Glob Health 2019, 4 (Suppl 4), e001302. [Google Scholar] [CrossRef] [PubMed] [PubMed Central]
- Kalra, S.; Shah, D. Care Beyond Newborn Survival Including Child Health and Early Childhood Development; Mental and Psychological Health. Indian J. Pediatr. 2023, 90 (Suppl 1), 37–46. [Google Scholar] [CrossRef] [PubMed]
- Pierce, H. Nurturing Care for Early Childhood Development: Path to Improving Child Outcomes in Africa. Popul Res. Policy Rev. 2021, 40. [Google Scholar] [CrossRef]
- Likhar, A.; Baghel, P.; Patil, M. Early Childhood Development and Social Determinants. Cureus 2022, 14(9), e29500. [Google Scholar] [CrossRef] [PubMed] [PubMed Central]
- The complex approach of risk factors in the emergence of developmental disorders in children of young age | Bulletin of the Academy of Sciences of Moldova. Medical Sciences [Internet]. 30 Jan 2026. Available online: https://bulmed.md/bulmed/article/view/3740.
- Grantham-McGregor, S.; Cheung, Y.B.; Cueto, S.; Glewwe, P.; Richter, L.; Strupp, B. Developmental potential in the first 5 years for children in developing countries. The Lancet 2007, 369(9555), 60–70. [Google Scholar] [CrossRef] [PubMed]
- Bonet-Morón, J.; Hahn-De-Castro, L.W. La mortalidad y desnutrición infantil en La Guajiraa.
- Infografía de Refugiados y Migrantes Venezolanos - GIFMM Guajira – Enero, 2021 - Colombia | ReliefWeb [Internet]. 2021. Available online: https://reliefweb.int/report/colombia/infograf-de-refugiados-y-migrantes-venezolanos-gifmm-guajira-enero-2021.
- Resumen Situacional Local, GIFMM La Guajira (enero - abril 2021) - Colombia | ReliefWeb [Internet]. 2021. Available online: https://reliefweb.int/report/colombia/resumen-situacional-local-gifmm-la-guajira-enero-abril-2021.
- Puello, A. E.C.; Amador, A. C.E.; Luna, R. J.M. Determinantes sociales de salud en los agricultores del resguardo indígena Zenú. Rev. Univ. Ind. Santander Salud 2016, 48(1), 17–26. [Google Scholar] [CrossRef]
- Brockerhoff, M. The impact of rural-urban migration on child survival. Health Transit Rev Cult Soc Behav Determinants Health 1994, 4(2), 127–49. [Google Scholar] [PubMed]
- Brockerhoff, M. Child survival in big cities: The disadvantages of migrants. Soc. Sci. Med. 1995, 40(10), 1371–83. [Google Scholar] [CrossRef]
- Pérez-Escamilla, R.; Rizzoli-Córdoba, A.; Alonso-Cuevas, A.; Reyes-Morales, H. Avances en el desarrollo infantil temprano: desde neuronas hasta programas a gran escala. Bol. Méd Hosp. Infant México 2017, 74(2), 86–97. [Google Scholar] [CrossRef]
- Van Buuren, S.; Van Wouwe, J.P. WHO Child Growth Standards in action. Arch. Dis. Child. 2008, 93(7), 549–51. [Google Scholar] [CrossRef] [PubMed]
- Garza, C.; de Onis, M. Rationale for developing a new international growth reference. Food Nutr. Bull.;PubMed 2004, 25((1) Suppl, S5–14. [Google Scholar] [CrossRef] [PubMed]
- Rydz, D.; Shevell, M.I.; Majnemer, A.; Oskoui, M. Developmental screening. J. Child. Neurol. 2005, 20(1), 4–21. [Google Scholar] [CrossRef] [PubMed]
- Luna, S.M.; Rugeles, C.G.; Malagón, N.R.; Restrepo, C.G.; Jiménez, P.C.; Clavijo, K.O.; et al. EQUIPO METODOLÓGICO Y COORDINADOR.
- Plan Nacional de Desarrollo 2022-2026 [Internet]. 4 Feb 2026. Available online: https://www.dnp.gov.co:443/plan-nacional-desarrollo/pnd-2022-2026.
- Minciencias [Internet]. Evaluación institucional y de impacto del Fondo de Investigación en Salud (FIS). 4 Feb 2026. Available online: https://minciencias.gov.co/sala_de_prensa/evaluacion-institucional-y-impacto-del-fondo-investigacion-en-salud-fis.
- Minciencias [Internet] F.I.S. 4 Feb 2026. Available online: https://minciencias.gov.co/glosario/fis.
- DANE. DANE Censo poblaciones 2018., infografía Riohacha, La Guajira y otros municipios [Infografía] [Internet]. Colombia. Censo poblaciones 2018., infografía Riohacha, La Guajira y otros municipios. Available online: https://sitios.dane.gov.co/cnpv/app/views/informacion/fichas/44560.pdf.
- DANE - Censo Nacional de Población y Vivienda 2018 [Internet]. 16 Feb 2026. Available online: https://www.dane.gov.co/index.php/estadisticas-por-tema/demografia-y-poblacion/censo-nacional-de-poblacion-y-vivenda-2018.
- DANE - Estadísticas por tema [Internet]. 16 Feb 2026. Available online: https://www.dane.gov.co/index.php/estadisticas-por-tema.
- sitios.dane.gov.co/cnpv/#!/ [Internet]. 1 May 2026. Available online: https://sitios.dane.gov.co/cnpv/#!/.
- Ibarra, A.; Velasquez, Y.; Toro, Y. ANÁLISIS DE SITUACIÓN DE SALUD CON EL MODELO DE LOS DETERMINANTES SOCIALES DE SALUD; MANAURE, LA GUAJIRA [Informe alcaldía municipal] [Internet]. Alcadía de Manaure: Internet, 2016. Available online: https://manaureguajira.gov.co/Transparencia/PlaneacionGestionyControl/An%C3%A1lisis%20Situaci%C3%B3n%20de%20Salud%20Modelo%20de%20los%20Determinantes%20Sociales.pdf.
- Presentación [Internet]. 17 Feb 2026. Available online: https://www.manaureguajira.gov.co/MiMunicipio/Paginas/Presentacion.aspx.
- ENSIN: Encuesta Nacional de Situación Nutricional | Portal ICBF - Instituto Colombiano de Bienestar Familiar ICBF [Internet]. 16 Feb 2026. Available online: https://www.icbf.gov.co/nutricion/ensin-encuesta-nacional-de-situacion-nutricional#ensin3.
- Onambele, G.A.; Lawin, M.; Lokoyo, A.; Djralah, M.; Madindé, J.; Ayalé, A. Risk Factors for Chronic Malnutrition in Children Aged 6 to 23 Months in BOPA, Southwest Benin. Glob. J. Med. Res. 2023, 23(L1), 15–23. [Google Scholar] [CrossRef]
- Rachmi, C.N.; Agho, K.E.; Li, M.; Baur, L.A. Stunting, Underweight and Overweight in Children Aged 2.0–4.9 Years in Indonesia: Prevalence Trends and Associated Risk Factors. PLoS ONE 2016, 11(5), e0154756. [Google Scholar] [CrossRef]
- Obasohan, P.E.; Walters, S.J.; Jacques, R.; Khatab, K. Risk Factors Associated with Malnutrition among Children Under-Five Years in Sub-Saharan African Countries: A Scoping Review. Int J Environ Res Public Health 2020, 17(23), 8782. [Google Scholar] [CrossRef] [PubMed] [PubMed Central]
- Nahimana, A.; Karikurubu, J.F. Factors of Chronic Malnutrition in Children Less than Five Years of Age: A Study Conducted at Cibitoke Hospital, Burundi. Int. J. Adv. Multidiscip. Res. Stud. 2025, 5(2), 1–7. [Google Scholar] [CrossRef]
- Compilación Jurídica del ICBF - Resolución 2350 de 2020 MSPS [Internet]. 24 Mar 2026. Available online: https://www.icbf.gov.co/cargues/avance/compilacion/docs/resolucion_minsaludps_2350_2020.htm.
- Lelijveld, N.; Seal, A.; Wells, J.C.; Kirkby, J.; Opondo, C.; Chimwezi, E.; et al. Chronic disease outcomes after severe acute malnutrition in Malawian children (ChroSAM): a cohort study. Lancet Glob. Health;PubMed 2016, 4(9), e654–62. [Google Scholar] [CrossRef] [PubMed]
- Skinner, A.; Tester-Jones, M.C.; Carrieri, D. Undernutrition among children living in refugee camps: a systematic review of prevalence [Internet]; 1 Jun 2023. [Google Scholar] [CrossRef]
- Bhutta, Z.A.; Berkley, J.A.; Bandsma, R.H.J.; Kerac, M.; Trehan, I.; Briend, A. Severe childhood malnutrition. Nat. Rev. Dis. Primer 2017, 3(1), 17067. [Google Scholar] [CrossRef]
- Dlamini, G.H.; Tlou, B. Prevalence and associated risk factors of chronic malnutrition amongst children under five in Eswatini. Afr. J. Prim. Health Care Fam. Med. 2022, 14(1), 6. [Google Scholar] [CrossRef] [PubMed]
- Berhe, K.; Seid, O.; Gebremariam, Y.; Berhe, A.; Etsay, N. Risk factors of stunting (chronic undernutrition) of children aged 6 to 24 months in Mekelle City, Tigray Region, North Ethiopia: An unmatched case-control study. PLoS ONE 2019, 14(6), e0217736. [Google Scholar] [CrossRef] [PubMed]
- Lelijveld, N.; Seal, A.; Wells, J.; Kirkby, J.; Opondo, C.; Chimwezi, E. DANE DANE Nota estadística [Infografía] [Internet]. Colombia: DANE. Nota estadística - Inseguridad Alimentaria en Colombia. Available online: https://www.dane.gov.co/files/investigaciones/notas-estadisticas/NotaEstadistica-FIES-DANE-FAO-ene2024.pdf.
Figure 1.
Geographical location of the municipality of Manaure, La Guajira, Colombia.
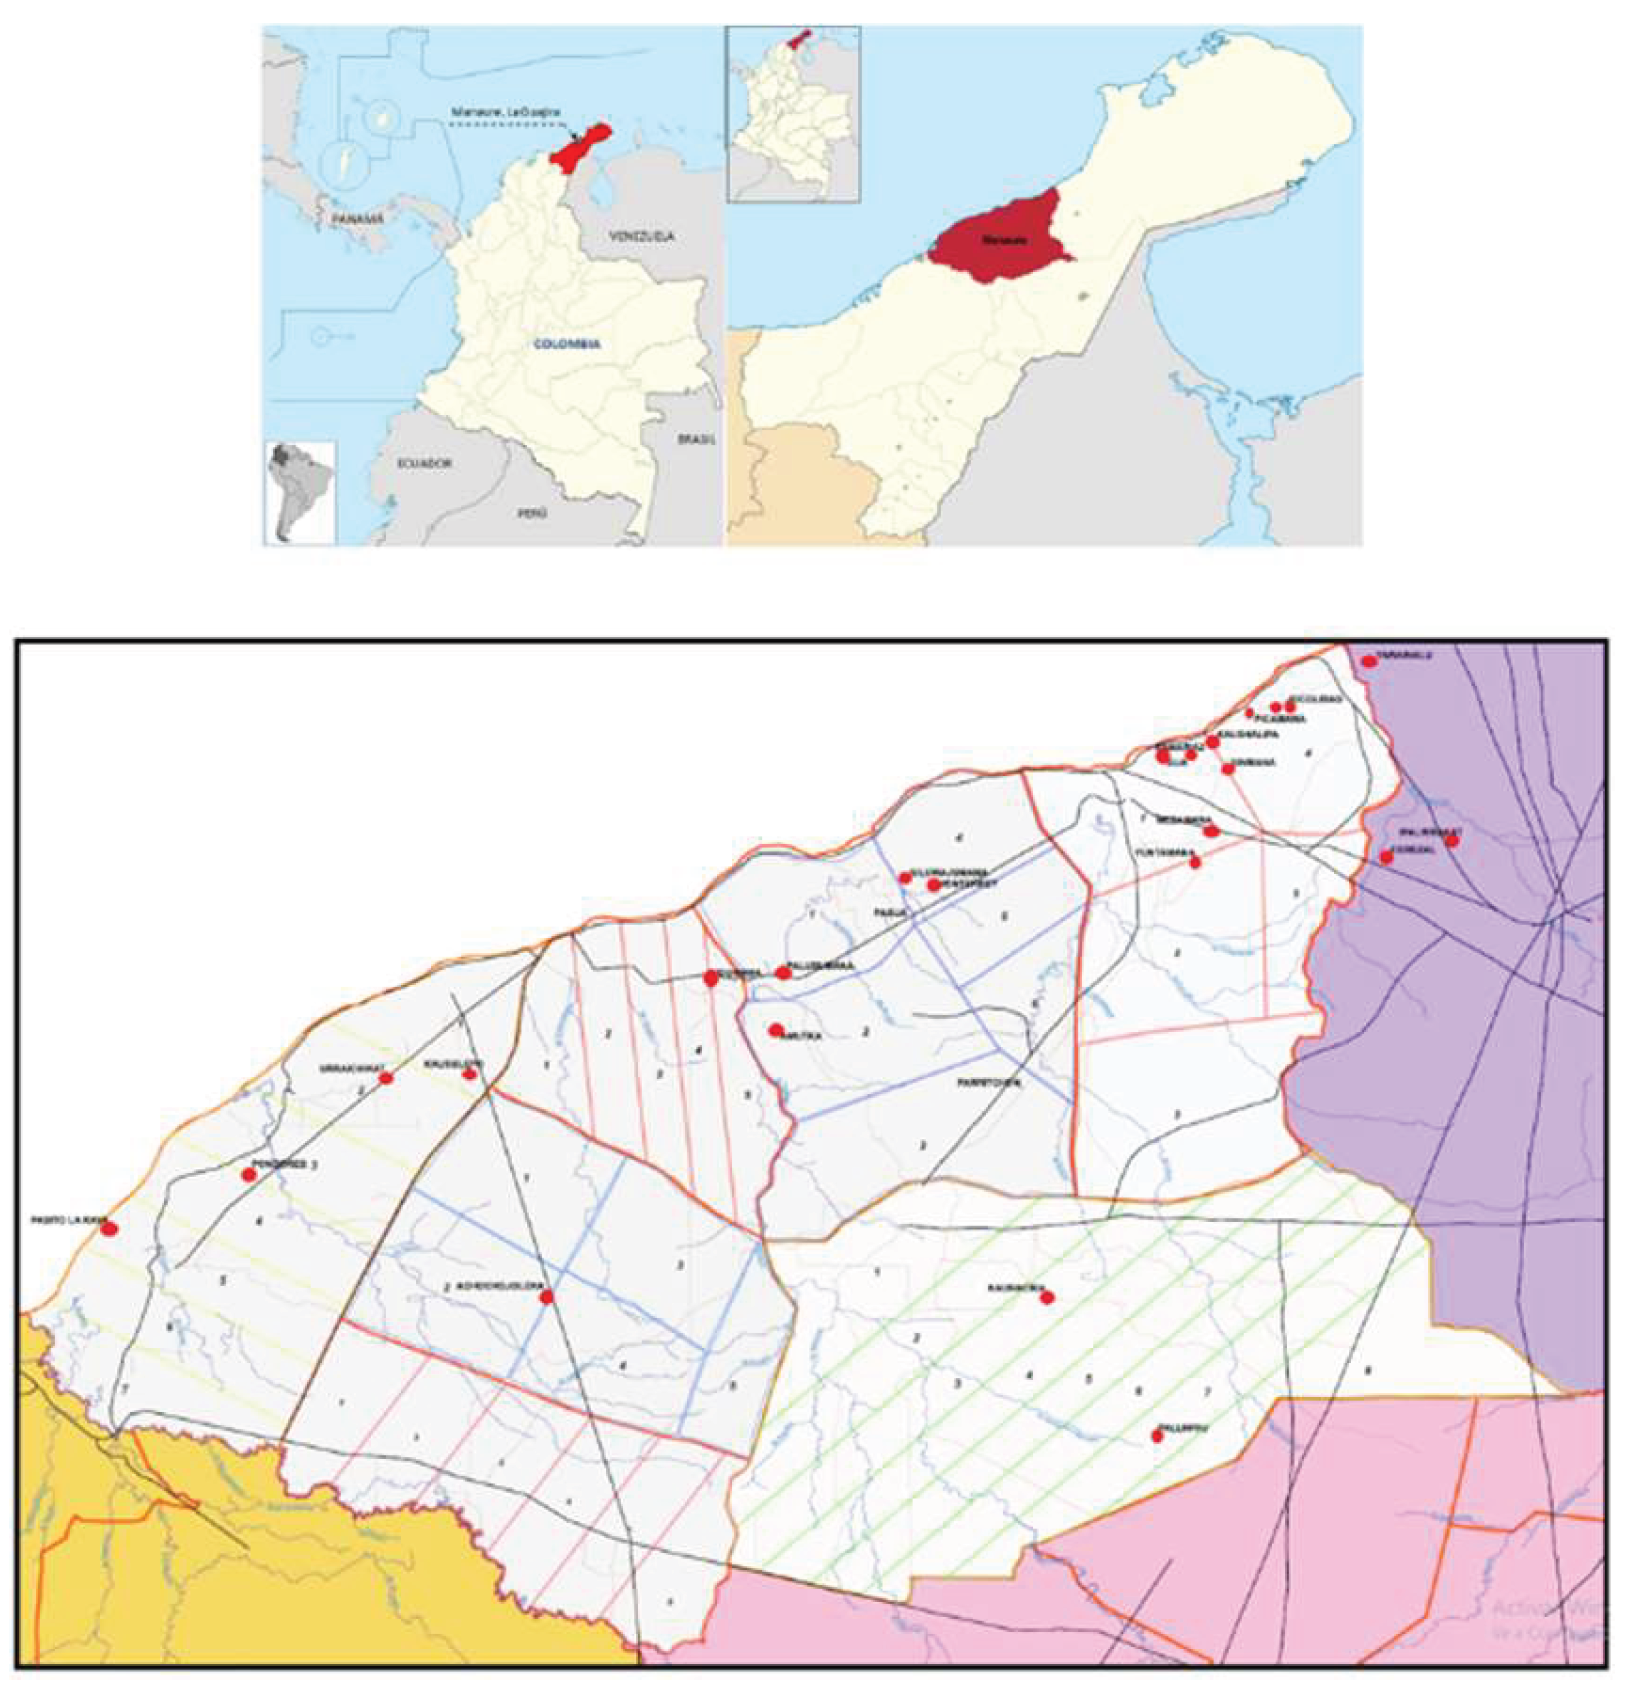
Figure 2.
Distribution of sex, age and nutrition disorders among Wayúu Indigenous children under five years from Manaure, La Guajira, Colombia.
Figure 2.
Distribution of sex, age and nutrition disorders among Wayúu Indigenous children under five years from Manaure, La Guajira, Colombia.
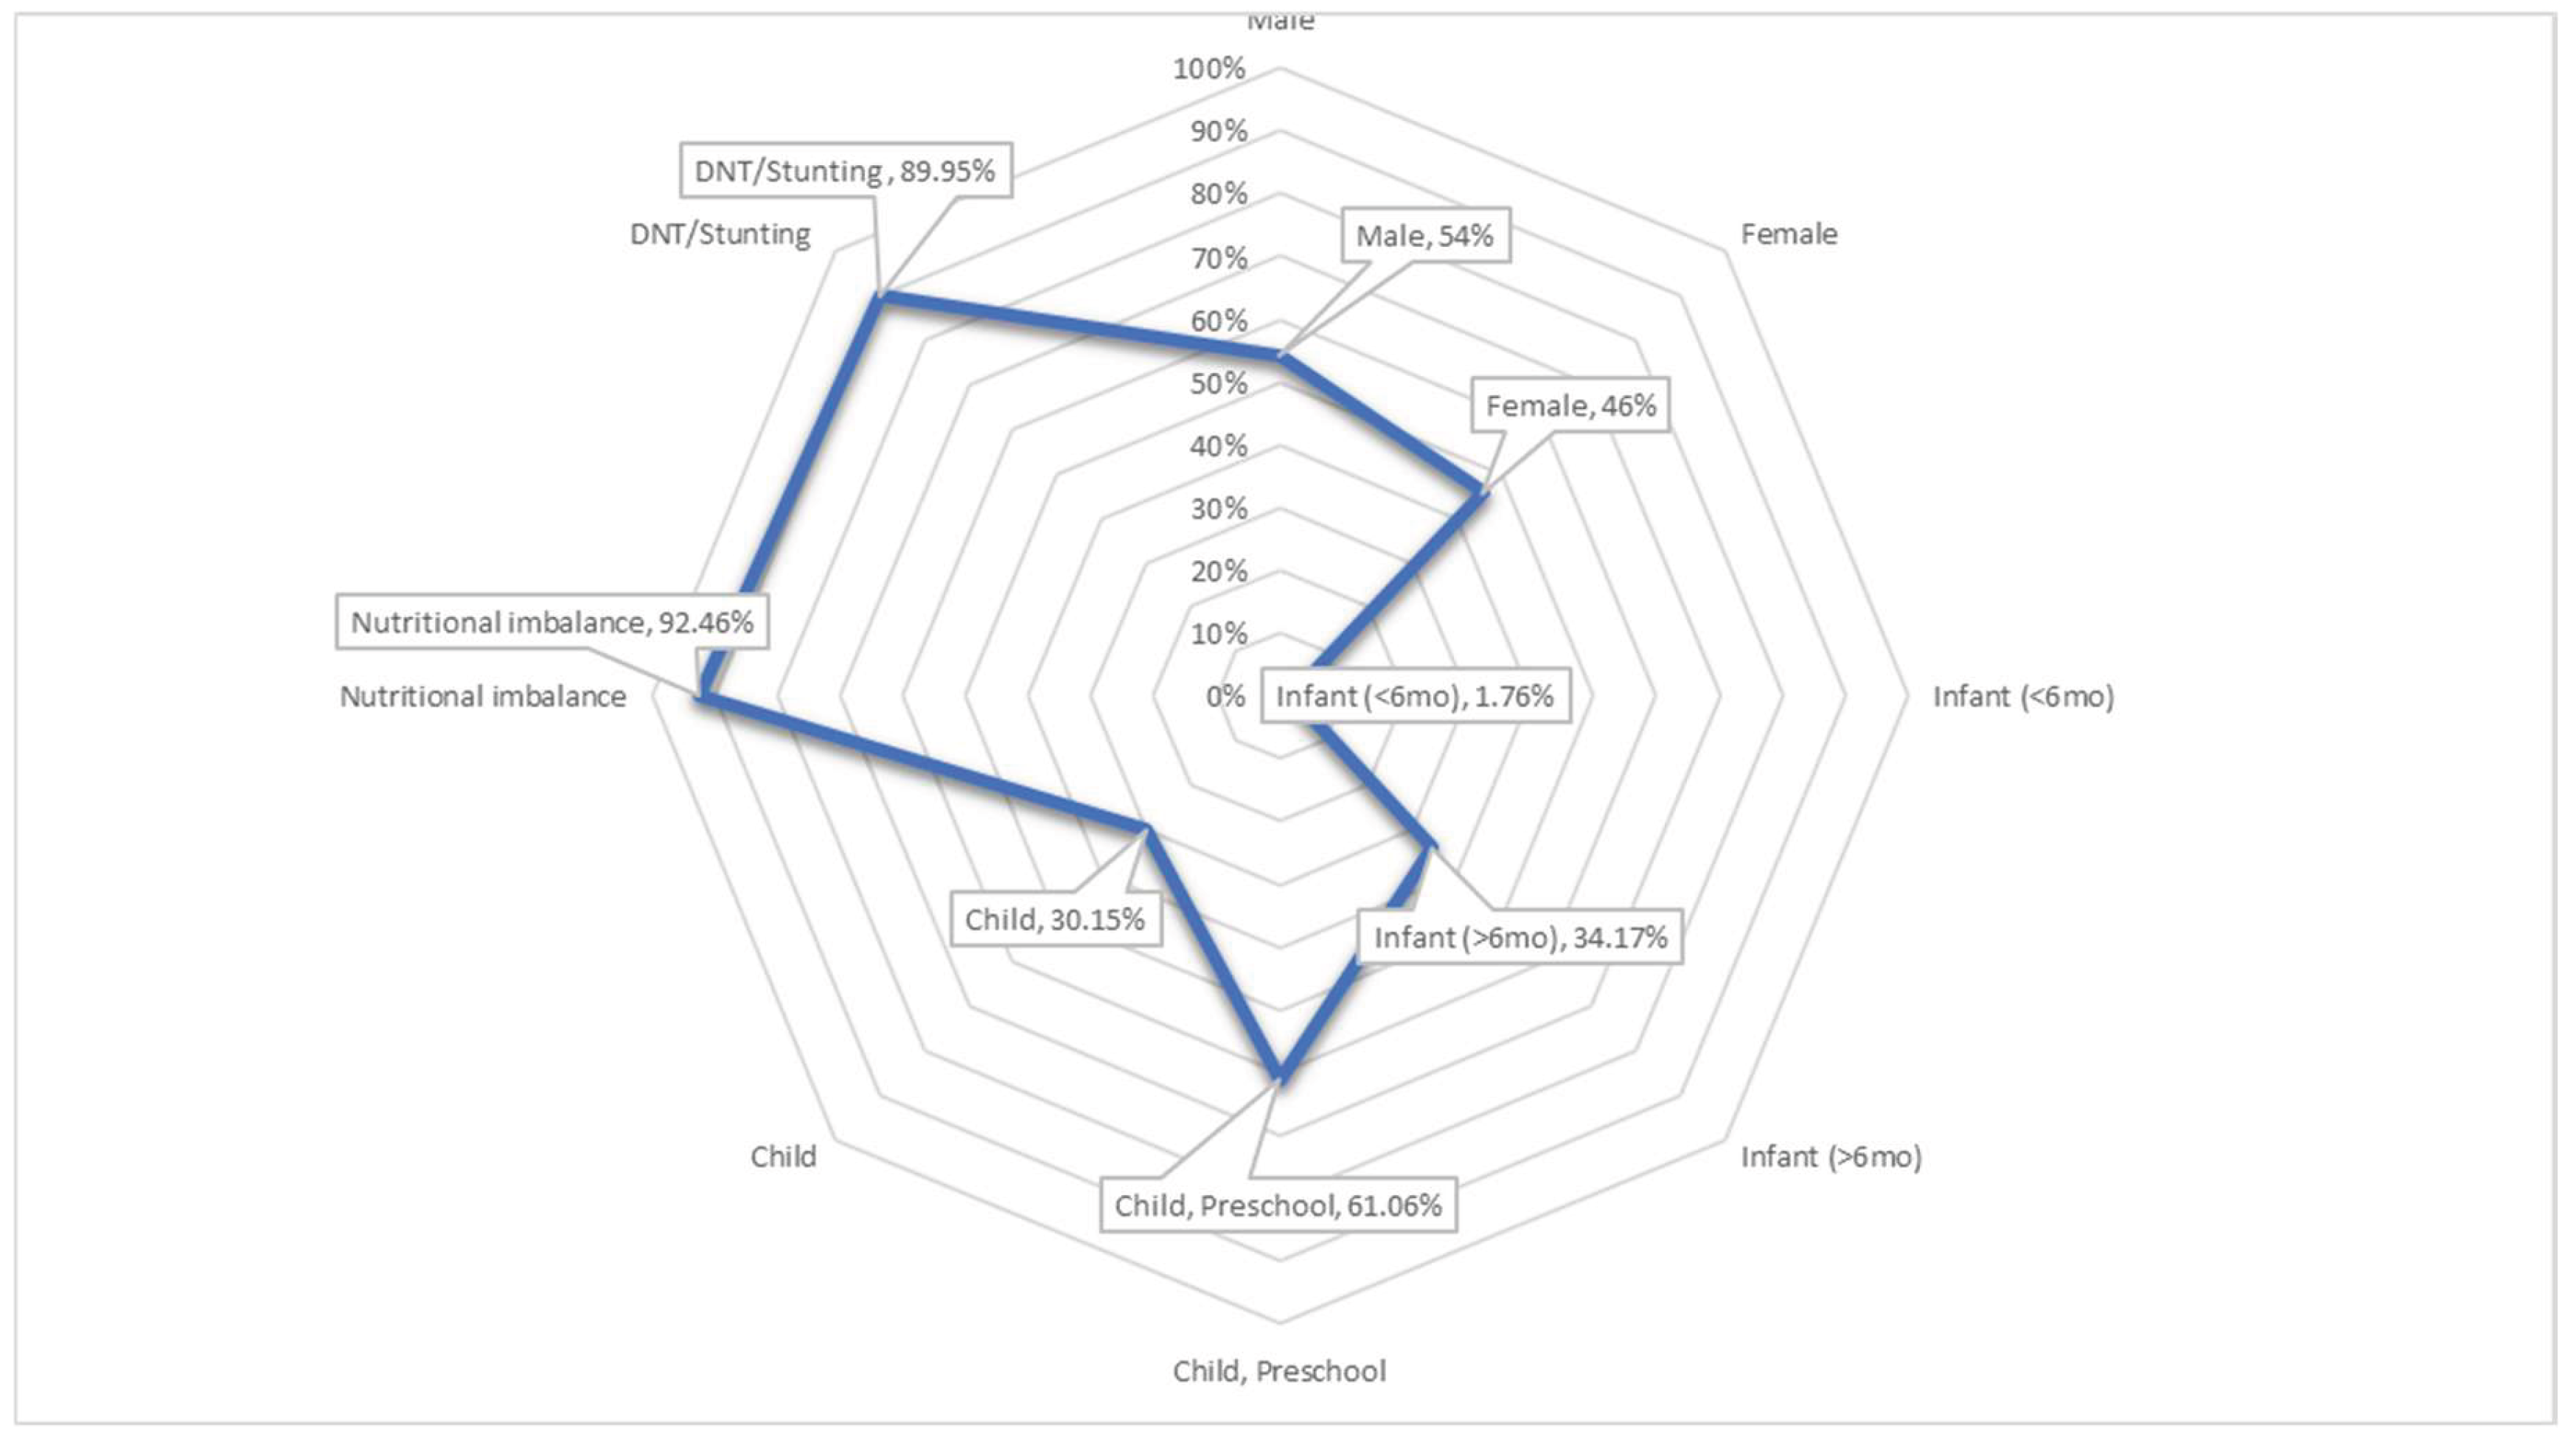
Figure 3.
Nutritional monitoring indicators for the longitudinal analysis subgroup of children.3.2. Longitudinal Follow-up.
Figure 3.
Nutritional monitoring indicators for the longitudinal analysis subgroup of children.3.2. Longitudinal Follow-up.
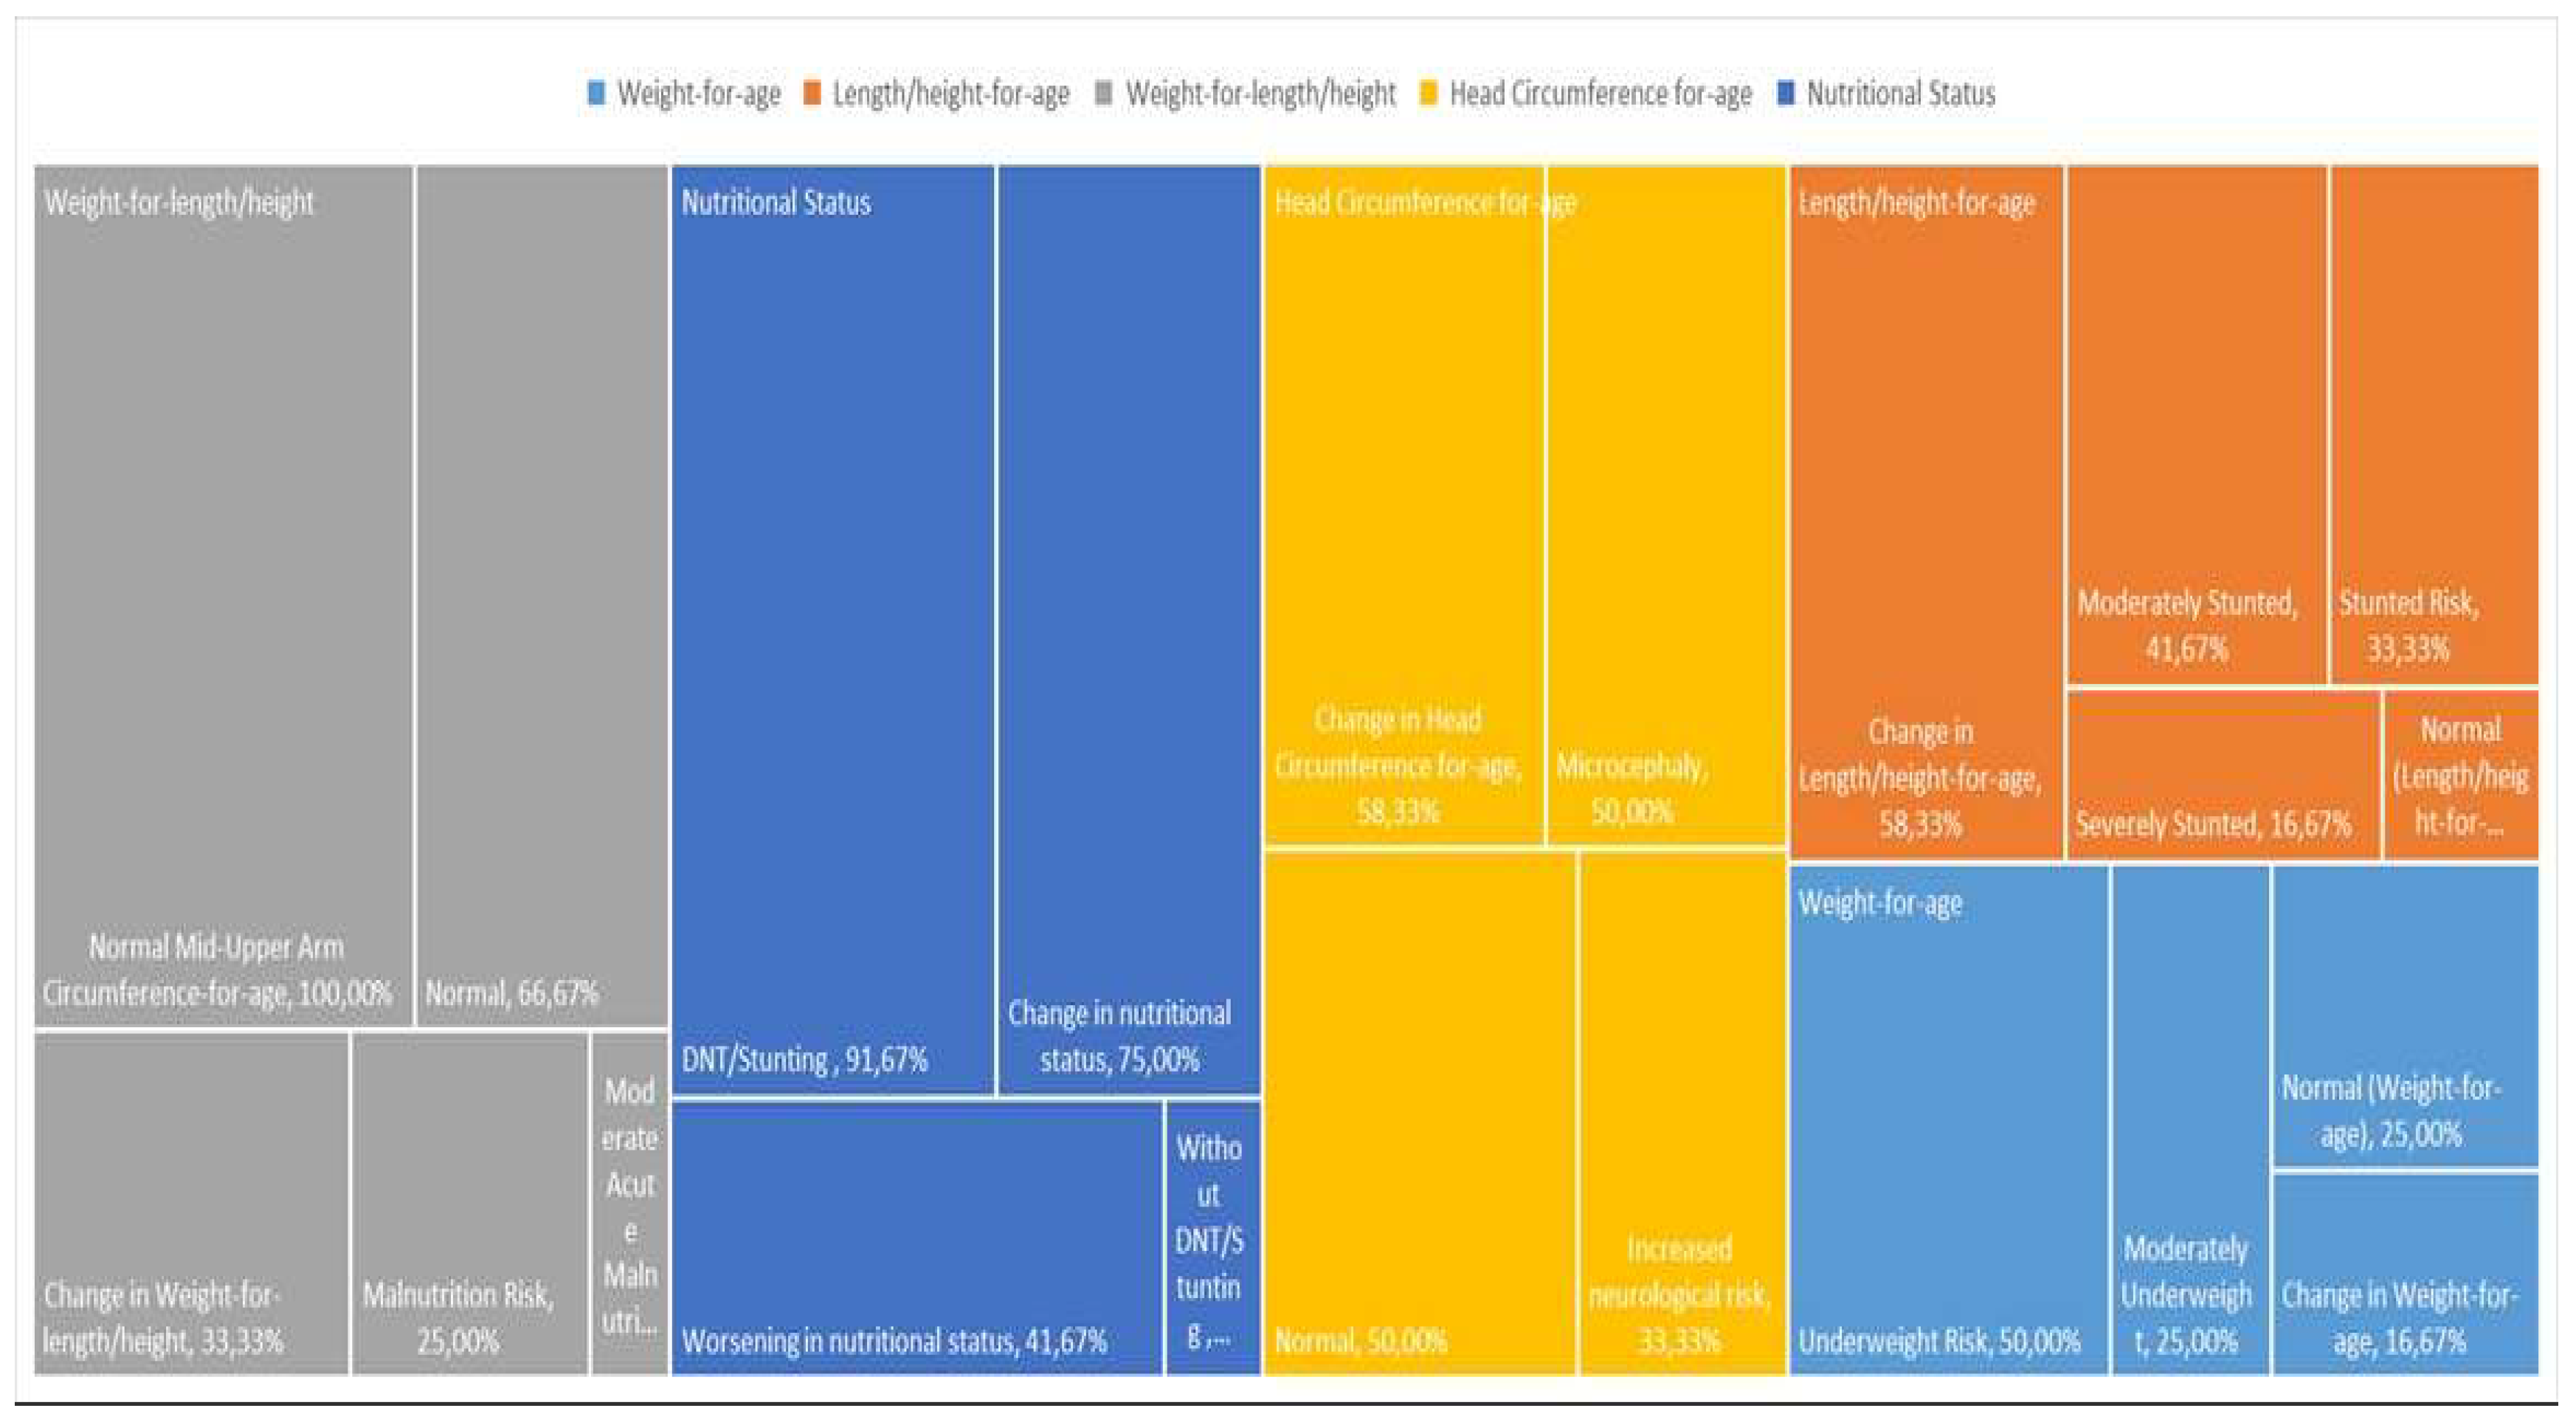
Figure 4.
Cumulative behavior of anthropometric indicators according to sex in the longitudinal analysis subgroup of children under 5 years of age. The graph shows the representation of the behavior of the different indicators, a: Corresponds to the sum behavior of the weight/age indicator in boys (blue) and girls (green) according to the days elapsed between their measurements; b: corresponds to the height-for-age indicator under the same conditions.
Figure 4.
Cumulative behavior of anthropometric indicators according to sex in the longitudinal analysis subgroup of children under 5 years of age. The graph shows the representation of the behavior of the different indicators, a: Corresponds to the sum behavior of the weight/age indicator in boys (blue) and girls (green) according to the days elapsed between their measurements; b: corresponds to the height-for-age indicator under the same conditions.
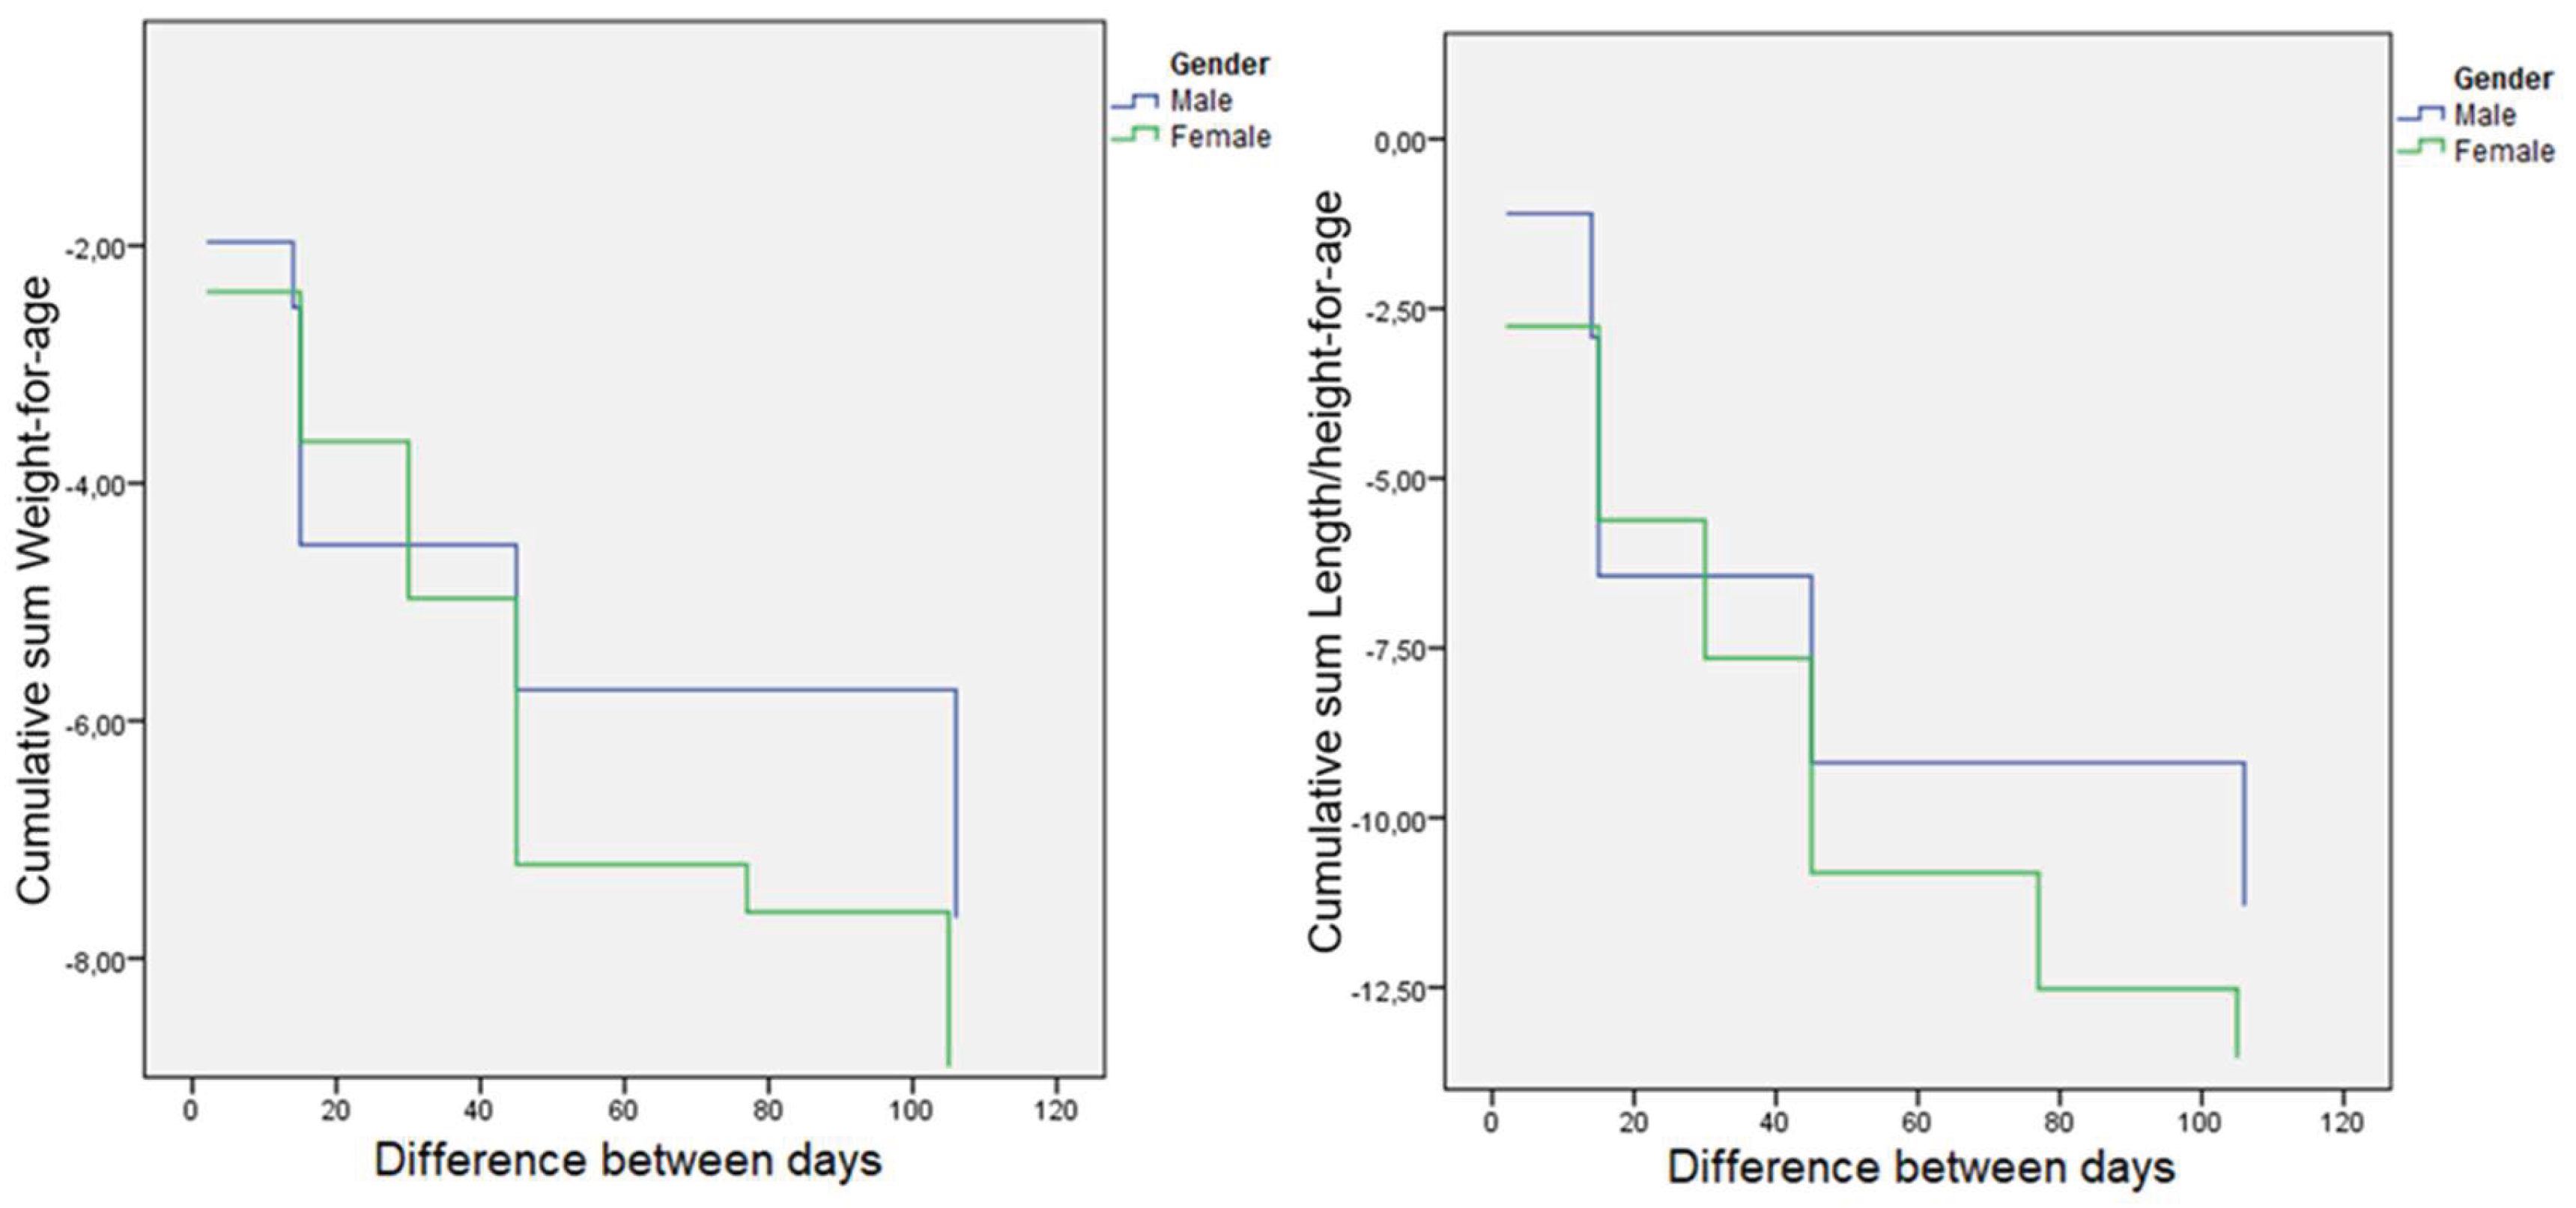

Table 1.
Distribution of study participants by sex and Indigenous community.
| Indigenous community | Gender | Total | ||||
|---|---|---|---|---|---|---|
| Male | Female | |||||
| n | % | n | % | n | % | |
| Amutka | 5 | 2,3% | 5 | 2,7% | 10 | 2,5% |
| Cerezal | 8 | 3,7% | 11 | 6,0% | 19 | 4,8% |
| Cousepa | 12 | 5,6% | 5 | 2,7% | 17 | 4,3% |
| Gija | 7 | 3,2% | 10 | 5,5% | 17 | 4,3% |
| Ichieen | 2 | ,9% | 3 | 1,6% | 5 | 1,3% |
| Ipalirrakat | 13 | 6,0% | 16 | 8,8% | 29 | 7,3% |
| Jocolobao | 6 | 2,8% | 4 | 2,2% | 10 | 2,5% |
| Joumana | 8 | 3,7% | 2 | 1,1% | 10 | 2,5% |
| Juluwayumana | 8 | 3,7% | 4 | 2,2% | 12 | 3,0% |
| Kasulepo | 6 | 2,8% | 5 | 2,7% | 11 | 2,8% |
| Kaurasira | 8 | 3,7% | 8 | 4,4% | 16 | 4,0% |
| Koushalipa | 7 | 3,2% | 7 | 3,8% | 14 | 3,5% |
| Mezamana | 17 | 7,9% | 6 | 3,3% | 23 | 5,8% |
| Monterrey | 12 | 5,6% | 11 | 6,0% | 23 | 5,8% |
| Palausumana | 1 | ,5% | 2 | 1,1% | 3 | ,8% |
| Paliwoo | 4 | 1,9% | 1 | ,5% | 5 | 1,3% |
| Parritchon | 5 | 2,3% | 6 | 3,3% | 11 | 2,8% |
| Pasito de la Raya | 14 | 6,5% | 12 | 6,6% | 26 | 6,5% |
| Pausa | 9 | 4,2% | 4 | 2,2% | 13 | 3,3% |
| Picamana | 4 | 1,9% | 9 | 4,9% | 13 | 3,3% |
| Polousira | 4 | 1,9% | 3 | 1,6% | 7 | 1,8% |
| Pondores | 5 | 2,3% | 6 | 3,3% | 11 | 2,8% |
| Sabana Larga | 7 | 3,2% | 0 | 0,0% | 7 | 1,8% |
| Samaria (2) | 15 | 6,9% | 9 | 4,9% | 24 | 6,0% |
| Sinmana | 5 | 2,3% | 6 | 3,3% | 11 | 2,8% |
| Urraichikat | 10 | 4,6% | 8 | 4,4% | 18 | 4,5% |
| Yuntamana | 14 | 6,5% | 19 | 10,4% | 33 | 8,3% |
| Total | 216 | 100,0% | 182 | 100,0% | 398 | 100,0% |
Table 2.
Nutrition indicators among Wayúu Indigenous children under five years from Manaure, La Guajira, Colombia.
Table 2.
Nutrition indicators among Wayúu Indigenous children under five years from Manaure, La Guajira, Colombia.
| Nutritional indicators | Category | n (p 50) |
% (ICR) |
|---|---|---|---|
| Nutritional imbalance | Yes | 368 | 92,46 |
| No | 30 | 7,54 | |
| Total | 398 | 100 | |
| DNT/Stunting | Yes | 358 | 89,95 |
| No | 40 | 10,05 | |
| Total | 398 | 100 | |
| Weight-for-age | -1,26 | -1,95 a -0,6 | |
| Weight-for-age classification | Severely Underweight | 21 | 5,28 |
| Moderately Underweight | 71 | 17,84 | |
| Underweight Risk | 148 | 37,19 | |
| Normal | 147 | 36,93 | |
| Overweight | 11 | 2,76 | |
| Total | 398 | 100 | |
| Length/height-for-age | -2,23 | -2,97 a -1,61 | |
|
Length/height-for-age classification |
Severely Stunted | 97 | 24,37 |
| Moderately Stunted | 142 | 35,68 | |
| Stunted Risk | 114 | 28,64 | |
| Normal | 39 | 9,80 | |
| Tall | 6 | 1,51 | |
| Total | 398 | 100 | |
| Weight-for-length/height | 0,05 | -0,66 a 0,64 | |
| Weight-for-length/height classification | Severe Acute Malnutrition | 3 | 0,75 |
| Moderate Acute Malnutrition | 11 | 2,76 | |
| Malnutrition Risk | 44 | 11,06 | |
| Normal | 325 | 81,66 | |
| Overweight | 8 | 2,01 | |
| Obese | 7 | 1,76 | |
| Total | 398 | 100 | |
| Mid-Upper Arm Circumference (cm) | 15 | 14 a 16 | |
| Mid-Upper Arm Circumference-for-age | -0,66 | -1,29 a 0,08 | |
| Mid-Upper Arm Circumference classification |
Severe Acute Malnutrition: | 1 | 0,25 |
| Moderate Acute Malnutrition | 7 | 1,77 | |
| Normal | 388 | 97,98 | |
| Total | 396 | 100 | |
| Undernutrition-related mortality risk | Yes | 1 | 0,28 |
| No | 356 | 99,72 | |
| Total | 357 | 100 | |
| Head Circumference for Age | -1,86 | -2,72 a -0,89 | |
| Head Circumference for-age classification | Microcephaly | 185 | 46,48 |
| Normal | 205 | 51,51 | |
| Macrocephaly | 8 | 2,01 | |
| Total | 398 | 100 | |
Table 3.
Anthropometric indicators by age and sex among Wayúu Indigenous children under five years from Manaure, La Guajira, Colombia.
Table 3.
Anthropometric indicators by age and sex among Wayúu Indigenous children under five years from Manaure, La Guajira, Colombia.
| Nutritional indicators | Category | n (p 50) |
%* (ICR) |
p |
|---|---|---|---|---|
| Weight-for-age classification | Severely Underweight | Male, 198 Female, 13 36,82 (months) |
3,70% 7,14% 23,73 - 50,53(months) |
0,56** <0,01++ (Spearman -0,225 / p: <0,01) |
| Moderately Underweight | Male, 41 Female, 30 34,85 (months) |
18,98% 16,48% 22,29 - 47,30 (months) |
||
| Underweight Risk | Male, 78 Female, 70 35,26 (months) |
36,11% 38,46% 22,57 - 44,74(months) |
||
| Normal | Male, 83 Female, 64 26,66 (months) |
38,43% 35,16% 12,00 - 41,81(months) |
||
| Overweight | Male, 6 Female, 5 12,62 (months) |
2,78% 2,75% 8,19 - 35,57 (months) |
||
| Length/height-for-age classification | Severely Stunted | Male, 53 Female, 44 31,76 (months) |
24,54% 24,18% 20,55 - 43,16(months) |
0,84** 0,04++ (Spearman -0,099* / p: 0,05) |
| Moderately Stunted | Male, 75 Female, 67 34,42 (months) |
34,72% 36,81% 20,18 - 44,58(months) |
||
| Stunted Risk | Male, 64 Female, 50 36,26 (months) |
29,63% 27,47% 15,65 - 44,90 (months) |
||
| Normal | Male, 22 Female, 17 25,64 (months) |
10,19% 9,34% 10,72 - 40,27 (months) |
||
| Tall | Male, 2 Female, 4 8,28 (months) |
0,93% 2,20% 7,26 - 14,46 (months) |
||
| Weight-for-length/height classification | Severe Acute Malnutrition | Male, 2 Female, 1 14,63 (months) |
0,93% 0,55% 14,46 - 55,69 (months) |
0,65** 0,49++ (Spearman -0,010 / p: 0,84) |
| Moderate Acute Malnutrition | Male, 8 Female, 3 25,21 (months) |
3,70% 1,65% 15,65 - 36,82 (months) |
||
| Malnutrition Risk | Male, 26 Female, 18 29,93 (months) |
12,04% 9,89% 20,91 - 3,47 (months) |
||
| Normal | Male, 171 Female, 154 33,23 (months) |
79,17% 84,62% 17,78 - 44,74 (months) |
||
| Overweight | Male, 4 Female, 4 15,06 (months) |
1,85% 2,20% 7,12 - 44,28 (months) |
||
| Obese | Male, 5 Female, 2 35,57 (months) |
2,31% 1,10% 12,62 - 37,74 (months) |
||
| Clasificación PC/E | Microcephaly | Male, 10 Female, 77 31,92 (months) |
50,0% 42,3% 19,26 - 43,82 (months) |
0,23** 0,34++ (Spearman -0,044 / p: 0,38) |
| Normal | Male, 105 Female, 100 33,23 (months) |
48,60% 54,90% 17,62 - 44,44 (months) |
||
| Macrocephaly | Male, 3 Female, 5 15,20 (months) |
1,4% 2,7% 7,73 - 39,32 (months) |
||
|
Neurological risk |
Yes | Male, 111 Female, 82 31,82 (months) |
51,39% 45,06% 18,54 - 43,82 (months) |
0,21** 0,74+ |
| No | Male, 105 Female, 100 33,23 (months) |
48,61% 54,94% 17,62 - 44,44 (months) |
||
| Nutritional imbalance | Yes | Male, 198 Female, 170 32,58 (months) |
91,67% 93,41% 18,61 - 44,36 (months) |
0,51** 0,14+ |
| No | Male, 18 Female, 12 28,24 (months) |
8,33% 6,59% 10,09 - 41,91 (months) |
||
| DNT/Stunting | Yes | Male, 194 Female, 164 33,33 (months) |
89,81% 90,11% 19,30 - 44,58 (months) |
0,92** 0,003+ |
| No | Male, 22 Female, 18 19,46 (months) |
10,19% 9,89% 8,14 - 39,45 (months) |
*% corresponding to the total for each gender separately. **X2-chi square. +U Mann-Whtiney. ++Kruskal-Wallis.
Disclaimer/Publisher’s Note: The statements, opinions and data contained in all publications are solely those of the individual author(s) and contributor(s) and not of MDPI and/or the editor(s). MDPI and/or the editor(s) disclaim responsibility for any injury to people or property resulting from any ideas, methods, instructions or products referred to in the content. |
© 2026 by the authors. Licensee MDPI, Basel, Switzerland. This article is an open access article distributed under the terms and conditions of the Creative Commons Attribution (CC BY) license (http://creativecommons.org/licenses/by/4.0/).
Copyright: This open access article is published under a Creative Commons CC BY 4.0 license, which permit the free download, distribution, and reuse, provided that the author and preprint are cited in any reuse.