

Submitted:
03 May 2026
Posted:
05 May 2026
You are already at the latest version
Abstract
Urban noise pollution disproportionately affects Latin American cities, where rapid urbanization, weak governance and limited monitoring networks coexist with diverse economic activities. This study compares the spatial and temporal dynamics of environmental noise between two Colombian municipalities with contrasting urban typologies: Soledad (Atlántico), a metropolitan city dominated by traffic and aircraft noise, and Montelíbano (Córdoba, ~86,647 inhabitants), a mid-sized municipality whose acoustic environment is conditioned by ferronickel mining (Cerro Matoso), heavy-duty transport and small-scale aviation. A two-tier methodology was applied: (i) field monitoring under Colombian Resolution 627 of 2006 (LAeq) at 80 points in Soledad and 30 points in Montelíbano, covering daytime and night-time periods including replicates; and (ii) noise dispersion modelling in SoundPLAN Essential v5.1/6.0 using the ISO 9613-2 propagation method, calibrated with field measurements through an iterative residual-minimization process. Results show that Soledad exhibits a strong day–night gradient (mean LAeq diurnal = 67.7 dB(A); nocturnal = 61.7 dB(A); 96.2% non-compliance at night) with linear-corridor acoustic patterns driven by arterial roads and the Ernesto Cortissoz airport, while Montelíbano displays a near-flat day–night profile (diurnal = 67.1 dB(A); nocturnal = 67.0 dB(A)) consistent with continuous mining-industrial operations. The modelled maps reproduce the measured patterns with mean residuals of −2.72 dB(A) (day) and −2.92 dB(A) (night) in Montelíbano (75% within ±5 dB(A), consistent with international SoundPLAN benchmarks), and mean residuals of +5.78 dB(A) (day) and +1.43 dB(A) (night) in Soledad, the latter reflecting the greater acoustic heterogeneity of a larger urban environment. These findings demonstrate that urban typology shapes acoustic patterns in fundamentally different ways, with implications for sustainable land-use planning, public health and the design of differentiated noise-mitigation policies.
Keywords:
environmental noise
; noise mapping
; SoundPLAN
; urban acoustics
; mining noise
; traffic noise
; sustainable urban planning
1. Introduction
Environmental noise is one of the most pervasive yet underestimated environmental pressures in urban areas of the Global South. The World Health Organization (WHO) reports that prolonged exposure to high sound pressure levels is associated with health effects such as sleep disturbance, hypertension, ischemic heart disease, cognitive impairment in children, and increased annoyance. Road traffic noise is identified as the dominant urban source [1,2]. Recent meta-analyses confirm that night-time exposure above 45 dB(A) is consistently linked to higher cardiovascular morbidity. Exposures above 55 dB(A) Lden are associated with a demonstrable health burden across European and Latin American cohorts [3,4].
In Latin America, rapid urbanization coexists with weak environmental governance, fragmented monitoring networks, and informal economies. As a result, the spatial and temporal characterization of noise remains an open problem [5,6]. In Colombia, Environmental noise is regulated through Resolution 627 of 2006, which sets maximum permissible levels per land-use sector (A: hospitals/schools; B: residential; C: commercial/industrial; D: rural) and by period (diurnal 07:01–21:00; nocturnal 21:01–07:00) [7]. This framework was recently strengthened by Law 2450 of 2025 (Anti-Noise Law), which enhances municipalities’ role in noise management. Despite these regulations, fewer than 20% of Colombian municipalities have updated strategic noise maps, and most studies focus on individual cities, lacking comparative analyses between distinct urban typologies.
Urban form strongly shapes city sound patterns. Big cities tend to have busy roads that create sharp changes in noise between day and night. In contrast, in industrial or mining cities, noise levels remain steady, preventing quiet nights [8,9]. Recording these differences is important for making focused solutions. However, studies comparing big cities with mining or industrial cities in Colombia are still rare in published research.
Strategic noise mapping uses models to estimate citywide noise levels. Popular software like SoundPLAN, CadnaA, and IMMI use a standard method (ISO 9613-2) to factor in things like how sound spreads, how it is absorbed by the air, the effect of the ground, and how barriers like walls can reduce noise, so they can predict overall noise levels [10,11]. SoundPLAN has been tested in many countries and is commonly used. It supports several major international standards and allows users to include various types of noise sources, such as traffic, factories, airplanes, and large areas, in a single project [12,13].
This study compares environmental noise in two Colombian municipalities with contrasting urban typologies. Soledad (Atlántico) is a conurbation within the Barranquilla Metropolitan Area, shaped by heavy vehicular traffic and the Ernesto Cortissoz International Airport. Montelíbano (Córdoba) is a mid-sized municipality whose dynamics are determined by the Cerro Matoso ferronickel mine, heavy-duty transport on the Western Trunk Road, and small-scale commercial aviation (DHC-6 Twin Otter). The objectives are as follows: (i) characterize the field-measured acoustic profile of both municipalities using Resolution 627 of 2006; (ii) construct calibrated SoundPLAN dispersion models to produce diurnal and nocturnal noise maps for vehicular and Environmental noise; (iii) validate the models statistically through residual analysis; and (iv) identify how each urban typology generates distinct acoustic patterns relevant to sustainable land-use planning and public-health policy in the Global South. The main contribution is empirical evidence that day–night contrast is a fingerprint of urban typology. A strong contrast (~5 dB) characterizes traffic-dominated metropolitan systems, while a near-flat profile (~0 dB) characterizes mining-industrial cities operating on continuous shifts.
2. Materials and Methods
A two-tier methodological approach was implemented in both municipalities, integrating (i) acoustic field monitoring compliant with Colombian Resolution 627 of 2006 and ISO 1996-2:2017, and (ii) noise dispersion modeling in SoundPLAN Essential, calibrated against the field measurements. The methodological balance privileges the modeling component (~60% of analytical effort) over the field campaign (~30%), with the remaining ~10% dedicated to comparative spatial analysis and statistical validation.
2.1. Study Areas
Soledad (10°55′ N, 74°46′ W) is a municipality within the Barranquilla Metropolitan Area on the Caribbean coast of Colombia. It covers approximately 66 km2 and has a population exceeding 600,000 inhabitants, concentrated almost entirely in urban areas, making it one of the densest municipalities in the country (DANE projections, 2018 Census) [14]. Its acoustic environment is determined by high-volume road corridors—Calle 30, Avenida Murillo (Calle 63), the Circunvalar, and the Airport Highway—dense informal motorcycle taxi services, intense commercial activity, and the Ernesto Cortissoz International Airport, which generates persistent linear noise loads from take-offs, landings, and ground operations.
Montelíbano (7°59′ N, 75°25′ W) is in the southeast of the Córdoba Department in northern Colombia, on the right bank of the San Jorge River. It covers 1,034 ha of urban land and 152,575 ha of rural land, with a 2024 population of 86,647 inhabitants (63,823 urban; 22,824 rural). Its economic structure is dominated by the ferronickel extraction operations of Cerro Matoso S.A., one of the largest open-pit mines in Latin America, located in the municipality’s rural area. Heavy-duty transport on the Western Trunk Road (Troncal Occidental) and on the Montelíbano–La Apartada axis, together with commercial aviation operations of the De Havilland Canada DHC-6 Twin Otter aircraft on the Medellín–Montelíbano route, configure a continuous and structurally distinct acoustic environment [15,16].
2.2. Field Monitoring
Field monitoring was conducted in compliance with Resolution 627 of 2006 (Articles 5, 6, 8, and 17) and ISO 1996-1:2016/ISO 1996-2:2017 [17,18], using sound level meters Class 1 (Svantek series, IEC 61672-1 compliant) accredited by IDEAM under Resolution 0051 of 20 January 2025. For each measurement point, the microphone was installed on a tripod at 4.0 m above ground level and equidistant from façades or barriers, in accordance with the regulatory requirement for Environmental noise in urban and expansion-urban zones. Wind speed was verified in situ with calibrated anemometers; measurements were aborted whenever the wind velocity exceeded 5 m/s, when precipitation was present, or when surfaces were wet. Calibration of the sound level meters was performed before and after each monitoring session using a Class 1 piston-phone calibrator.
In Soledad, monitoring was conducted between October and December 2025 at 80 points distributed across the urban area, covering residential, commercial, institutional, industrial, and high-traffic land-use sectors (Sectors A-D under Resolution 627). Each point was measured across four scenarios: working-day diurnal, working-day nocturnal, holiday diurnal, and holiday nocturnal, yielding four full datasets of 80 measurements each (320 total). For each point, the protocol involved five partial measurements of eight minutes oriented to North, South, East, West, and Vertical, and the resulting LAeq was computed as the energetic average of the five orientations following Annex 3, Chapter II of Resolution 627:
In Montelíbano, monitoring was conducted between 19 and 23 July 2025 at 30 points distributed across the urban area, covering all land-use categories defined by the Plan Básico de Ordenamiento Territorial (PBOT) [16], with particular attention to corridors connecting the urban core with the Cerro Matoso mining operation. Each point was measured continuously for 1 hour, covering both diurnal and nocturnal periods, with daytime and nighttime replicates (120 measurements total).
Measured A-weight equivalent continuous sound pressure levels (LAeq,T) were corrected by impulsiveness (KI), tonality (KT), and source-specific adjustments (KS) following Article 6 of Resolution 627, producing the corrected level LRAeq,T that was compared against the maximum permissible value per sector:
Compliance categories were assigned according to the relationship between LRAeq,T, the regulatory limit, and the expanded measurement uncertainty (Uexp): COMPLIES, DOES NOT COMPLY, or INDETERMINATE. Vehicular flows were quantified at each receiver point through hourly counts segregated into light, medium, and heavy vehicles, generating average flows for the diurnal and nocturnal periods that fed the dispersion model (Section 2.3).
2.3. Noise Dispersion Modelling in SoundPLAN
Noise dispersion modelling was conducted in SoundPLAN Essential v5.1 (Soledad) and v6.0 (Montelíbano), implementing the engineering method of ISO 9613-2:1996/2024 [10] for outdoor sound propagation under favourable meteorological conditions. SoundPLAN was selected over CadnaA, IMMI and NoiseMap based on the following technical criteria: (i) traceable propagation models grounded in coherent empirical datasets; (ii) flexible source definition (point, line, area) with built-in 1/3-octave emission spectra and operational scheduling; (iii) integrated quality-assurance functions for input geometry; (iv) documentation utilities that allow annotations linked to input objects, layers and result tables; (v) compatibility with Spanish-language interfaces, technical support in Latin America and a wide international validation base (>5,000 users) [12,13,19]. The Essential edition is particularly cost-effective for environmental-acoustics reporting at the municipal scale.
The propagation model integrates four physical mechanisms—geometrical divergence (Adiv), which is the spreading of sound waves as they move away from the source; atmospheric absorption (Aatm), which is the weakening of sound as it travels through air; ground effect (Agr), describing sound interaction with the ground surface; and barrier attenuation (Abar), which is the reduction in noise due to obstacles—plus an additional miscellaneous term (Amisc) for foliage (shrubs and trees), industrial sites, or housing zones, as expressed in Equation (3):
where Lp(R) is the receiver sound pressure level (dB(A)), Lw is the source sound power level (dB(A)) and Adiv = 20 log r + 11 accounts for spherical divergence at distance r (m). The model is computed under the standard ISO 9613-2 favourable propagation scenario (downwind or moderate temperature inversion).
2.3.1. Input Data
Input data common to both models included: (i) digital elevation models (DEM) imported via the Google Maps Elevation interface, which is integrated into SoundPLAN. This approach was considered sufficient for municipal-scale modelling in the absence of detailed RPAS-derived cartography. (ii) Georeferenced receiver points matched to 80 (Soledad) or 30 (Montelíbano) monitoring locations, all placed 4 m above ground per Resolution 627. (iii) Line sources that represent the road network, which were segmented by road hierarchy. Traffic flows for each segment were segregated into light, medium, and heavy vehicles based on field counts (Equation 4):
where Q_seg is the total flow per segment (vehicles/h), and the sub-flows are mapped to the SoundPLAN built-in emission library by category. Average vehicular speeds were assigned per road hierarchy: 50 km/h on local roads and 60–80 km/h on arterial corridors. Vehicle counts were performed in situ at each receiver point during 1-hour windows in both diurnal and nocturnal periods, yielding 160 hourly observations in Soledad and 60 hourly observations in Montelíbano.
For Montelíbano, an extra input set was used to estimate airport noise. Line sources represented the DHC-6 Twin Otter’s approach (descending to ~15 m above threshold), runway (3 m AGL), and ascent (increasing height) phases. These were parameterized using 1/3-octave emission spectra (50 Hz–10 kHz) from EASA documentation, NAPKIN noise project data, and FAA AEDT references [20,21]. Operational scheduling included 7 diurnal and 7 nocturnal events for 15 September 2025 (SATENA schedule). Equivalent levels (Leq, DNL, Lden) were derived by integrating SEL energy for each event, following AEDT/FAA practice [22]. This approach (SoundPLAN Essential industrial mode + ISO 9613-2) is a diagnostic tool and does not replace ECAC Doc. 29 / AEDT methodology for formal aeronautical studies [23].
Additional point sources were assigned in the vicinity of receivers labelled with known emitters (terminals, restaurants, workshops, schools at break time, informal vendors with megaphones), with sound power levels iteratively adjusted during the calibration phase to match the field-measured LRAeq,T (Section 2.4). The SoundPLAN built-in emission library—periodically updated to reflect international standards [12]—was used for road, rail, industrial and parking source spectra; user-defined spectra were added when localized acoustic identities required higher specificity.
2.3.2. Modelled Scenarios
Two scenario classes were modelled in each city: vehicular noise (only road sources active) and Environmental noise (all sources active, integrating vehicular, industrial, commercial and other anthropogenic emitters). Each class was simulated for diurnal and nocturnal periods. Four strategic noise maps were produced for each city (vehicular diurnal, vehicular nocturnal, Environmental diurnal, Environmental nocturnal). All maps were exported in the CTM12 projection (Transverse Mercator, MAGNA datum) with ESRI satellite imagery as the base.
2.4. Model Validation, Calibration and Uncertainty
Model outputs were calibrated and validated by direct comparison with the field-measured LRAeq and T values. The calibration procedure was iterative: emission parameters of representative point sources were adjusted to minimize the residuals between modelled and measured levels, while preserving physical plausibility (i.e., no source was tuned beyond ±3 dB of its standard library value). For each receiver point i, the residual was computed as in Equation (5):
Descriptive statistics of the residuals (mean, median, standard deviation, percentiles, minimum and maximum) were computed for diurnal and nocturnal scenarios. Visual diagnostics included line plots of measured vs modelled values per receiver index, box plots of the four distributions (Measured Diurnal, Modelled Diurnal, Measured Nocturnal, Modelled Nocturnal), and scatter plots against the identity line (y = x) with linear regression. The acceptance criterion adopted in this study, consistent with international practice in environmental acoustics, is a residual range within ±5 dB(A) for at least 75% of the receivers, with mean absolute residuals below 3 dB(A) [11,24].
Model uncertainty was discussed in accordance with ISO 1996 [17,18], which reports typical uncertainties of ±4 dB(A) under controlled conditions and ±10 dB(A) or more in complex environments. Limitations of the modelling approach include: (i) the absence of a detailed source inventory beyond the field-labelled receivers; (ii) limited topographic resolution that constrains the representation of reflections and diffractions; (iii) absence of detailed building-façade characterization (height, materials), which limits urban-canyon effects; and (iv) the use of short-term measurements (1 h LAeq) rather than long-term averages (Lden, Lnight). These limitations are quantified in the residual analysis (Section 3.4).
2.5. Statistical Analysis
Field data were processed in Python 3.12 (NumPy, Pandas, SciPy, Matplotlib). For each scenario and city, descriptive statistics (mean, median, standard deviation, minimum, maximum) for LAeq and LRAeq,T were computed. Day–night differences were calculated point by point as ΔLAeq = L_night − L_day. Compliance proportions per scenario were tabulated using the COMPLIES/DOES NOT COMPLY/INDETERMINATE categories. The hypothesis that day–night contrast differs between the two urban typologies was assessed visually through paired comparisons and qualitatively through the magnitude of the mean ΔLAeq, which is the central comparative metric of this study.
3. Results
3.1. Field-Measured Acoustic Profile
Table 1 summarizes the descriptive statistics of LAeq for both municipalities across the monitored scenarios. In Soledad (n = 80 points per scenario), the working-day diurnal LAeq exhibited a mean of 73.2 dB(A) (SD = 6.7), with values ranging from 57.3 to 92.8 dB(A); 83.8% of the points failed to comply with the regulatory limit applicable to their land-use sector, 13.8% complied, and 2.5% remained indeterminate. The working-day nocturnal scenario showed a mean LAeq of 68.1 dB(A) (SD = 9.2), but a substantially higher non-compliance rate of 96.2%, reflecting the more restrictive nocturnal limits (45–70 dB(A) depending on sector). The mean point-by-point day–night difference was −5.1 dB(A) (SD = 7.1), evidencing a pronounced nocturnal decrease consistent with the temporal contraction of vehicular flows on metropolitan corridors.
In Montelíbano (n = 30 points per scenario), the diurnal mean LAeq was 67.1 dB(A) (SD = 3.9; range 60.4–76.4) with 60.0% non-compliance, while the nocturnal mean was 67.0 dB(A) (SD = 6.5; range 55.6–83.1). The mean day–night difference at the point level was statistically indistinguishable from zero (mean Δ = −0.1 dB(A); SD = 7.1), and 100% of the nocturnal measurements failed to comply with the regulatory limits. This near-flat day–night profile is the most distinctive feature of the Montelíbano dataset and is interpreted as the acoustic signature of continuous mining-industrial operations and persistent heavy-duty traffic on the Western Trunk Road, which do not contract during the nocturnal period as is typical of urban traffic systems.
Sensitive receivers (Sector A: hospitals and schools) recorded systematic exceedances in both cities. In Soledad, the Maternal and Child Hospital (Salamanca) registered LAeq of 78.5 dB(A) versus a regulatory limit of 55 dB(A), an exceedance of 23.5 dB(A); the Maternal and Child Hospital Costa Hermosa registered 67.8 dB(A) (Δ = +12.8 dB(A) above limit). In Montelíbano, the educational near the old gas station Biomax–Road recorded 66.5 dB(A) (Δ = +11.5 dB(A)). These results signal that proximity to high-volume road corridors compromises the acoustic environment of regulated institutions, with potential consequences for patient recovery, learning performance, and occupational health [3,25].
3.2. SoundPLAN Modelling — Soledad: Strategic Noise Maps
Four strategic noise maps were produced for Soledad (vehicular and Environmental noise × diurnal/nocturnal scenarios). All maps share the CTM12 (Transverse Mercator, MAGNA datum) reference system and an ESRI satellite cartographic base. Figure 1 and Figure 2 present the vehicular noise maps; Figure 3 and Figure 4 present the environmental noise maps.
The analysis of the vehicular noise maps reveals a spatial pattern strongly conditioned by the road hierarchy. During the diurnal period (Figure 1), the highest sound pressure levels (65–80 dB(A)) form continuous longitudinal bands along arterial corridors—Street 30, Murillo Ave, the Circunvalar and the Airport Highway—projecting acoustic energy 200–300 m laterally into the residential fabric. Localized peaks of 75–80 dB(A) appear at complex intersections with high vehicular confluence. Internal residential blocks distant from arterial corridors show levels of 50–60 dB(A), with a progressive attenuation gradient of 5–10 dB(A) per 100 m of distance to the source, consistent with the Adiv = 20 log r + 11 spherical-divergence term of ISO 9613-2.
During the nocturnal period (Figure 2), the spatial extent of high-noise areas contracts by approximately 30–40%, with peaks restricted to narrow bands within 50–100 m of the principal corridors. The attenuation gradient intensifies to 10–15 dB(A) over the first 150 m, reflecting a more sensitive acoustic response of the urban environment to traffic reduction. Nevertheless, the structural arterial corridors retain levels of 65–75 dB(A), and the airport-influence zone preserves continuous 65–75 dB(A) bands due to ground service traffic, cargo flows and metropolitan connectivity continuous traffics drop to 35–50 dB(A) at night, but localized hotspots of 50–55 dB(A) persist around intersections and continuous-traffic segments. The blue stripe over the airport runway (75–80 dB(A)) in Figure 2 is the most acoustically energetic feature of the nocturnal scenario.
Environmental noise maps (Figure 3 and Figure 4) integrate vehicular, commercial, industrial and residual anthropogenic sources. They reveal a spatial structure highly organized by the road network: acoustic energy is concentrated in longitudinal corridors of high energy along arterial roads and connectivity nodes, attenuating progressively into the residential fabric where typical levels of 50–60 dB(A) (diurnal) and 35–50 dB(A) (nocturnal) prevail. The airport-aligned diagonal swathe is the single most extensive high-energy feature in both scenarios, persisting across the day–night transition due to continuous airport operations.
Healthcare facilities are systematically affected (Table 2). The modelled levels at the Hospital Juan Domínguez, Maternal and Child Hospital as Costa Hermosa, Universidad del Norte Hospital and the Oriental Clinic consistently exceed the Sector A diurnal limit of 55 dB(A) by more than 15 dB(A) on their road-facing façades; the nocturnal exceedance over the 45 dB(A) limit ranges between 15 and 20 dB(A). Lower-complexity facilities such as the Manuela Beltrán and Salamanca health centers exhibit smaller but still significant exceedances.
3.3. SoundPLAN Modelling — Montelíbano: Strategic Noise Maps
Four strategic noise maps were produced for Montelíbano (vehicular and Environmental noise × diurnal/nocturnal scenarios). Figure 5 and Figure 6 present the vehicular noise maps; Figure 7 and Figure 8 present the Environmental noise maps.
During the diurnal period (Figure 5), Leq values of 65–70 dB(A) are observed in the principal road network and the central commercial area, with peaks above 70 dB(A) in the airport-influence zone. Approximately 15–20% of the modelled urban surface exceeds the 65 dB(A) residential daytime limit, while 80% of residential areas remain within 45–55 dB(A). During the nocturnal period (Figure 6), the reduction of the regulatory limit to 55 dB(A) for residential and 60 dB(A) for commercial use produces a substantial expansion of the non-compliant area: approximately 30–35% of the residential area exceeds the night-time limit, with values of 60–65 dB(A) along the arterial network and the airport approach. Notably, the modelled levels do not decrease with the same magnitude as in Soledad, because heavy-duty transport associated with the mining operation continues throughout the night.
The aircraft-noise contribution from the DHC-6 Twin Otter operations was quantified through line sources with 1/3-octave spectra ranging from 64.7 dB at 50 Hz to 89.4 dB at 100 Hz (the dominant central frequency), with operational times derived from a schedule of 7 diurnal and 7 nocturnal events on the reference day. The aircraft contribution adds 2–4 dB(A) to the urban-core levels in the runway alignment, configuring an additional source that compounds the vehicular and industrial pressures. Nevertheless, this contribution is intermittent and concentrated in narrow temporal windows, in contrast with the persistent character of the road traffic source.
3.4. Model Calibration, Validation and Residual Analysis
The SoundPLAN model in Montelíbano was validated through a four-step diagnostic procedure: (i) line plots of measured vs. modelled values per receiver index (Figure 9 and Figure 10); (ii) box-plot comparison of the measured/modelled distributions for diurnal and nocturnal scenarios (Figure 11); (iii) scatter plots against the identity line y = x (Figure 12 and Figure 13); and (iv) descriptive statistics of the residuals (Table 3). The same calibration logic was applied to the Soledad model.
The Soledad model validation reveals considerable scatter between measured and modeled values. Diurnal deviations range from -7.8 to +28.3 dB(A), while nocturnal deviations span from -13.8 to +31.8 dB(A) reflecting the high acoustic complexity and source heterogeneity inherent to a large Colombian urban environment, where unmodelled emitters, limited deployment of additional sound level meters and receivers, and dynamic traffic patterns limit full model convergence.
For Montelíbano quantitatively, the diurnal residuals (n = 30) showed a mean of −2.72 dB(A), median −2.65 dB(A), standard deviation 3.51 dB(A), 25th percentile −4.18 dB(A), 75th percentile −1.53 dB(A), with a minimum of −10.50 dB(A) and a maximum of +7.00 dB(A). The nocturnal residuals (n = 30) showed a mean of −2.92 dB(A), median −2.65 dB(A), standard deviation 3.17 dB(A), 25th percentile −4.08 dB(A), 75th percentile −1.62 dB(A), minimum −11.60 dB(A), maximum +2.70 dB(A). Table 3 summarizes these statistics.
For Soledad, the diurnal residuals (n = 80) showed a mean of +5.78 dB(A), median +5.34 dB(A), standard deviation 8.17 dB(A), 25th percentile +0.07 dB(A), 75th percentile +9.90 dB(A), with a minimum of −7.79 dB(A) and a maximum of +28.34 dB(A). The nocturnal residuals (n = 80) showed a mean of +1.43 dB(A), median +1.25 dB(A), standard deviation 8.43 dB(A), 25th percentile −3.74 dB(A), 75th percentile +4.45 dB(A), minimum −13.75 dB(A), maximum +31.77 dB(A).
These statistics indicate a slight but systematic tendency of the model to underestimate measured levels by approximately 2.7 dB(A) (diurnal) and 2.9 dB(A) (nocturnal). The standard deviation of the residuals (3.2–3.5 dB(A)) is consistent with the typical ±5 dB(A) tolerance reported in environmental acoustics studies that use ISO 9613-2 in urban contexts [11,24]. The box plots (Figure 11) confirm that the model reproduces the inter-site variability (similar IQR width) but is shifted downwards by ~2–3 dB(A). The scatter plots (Figure 12 and Figure 13) show that more than 75% of the modelled values fall within ±5 dB(A) of the measured values, with the regression slope slightly less than 1, indicating compression at high levels. The compression is interpreted physically: localized non-modelled emitters (informal markets, schools at break time, micro-industries, motorcycles with modified exhausts) contribute disproportionately to high-level receivers, increasing the measured value without a corresponding increase in the modelled prediction. Outliers correspond to specific sites where these non-standard sources dominate the measurement, and they identify priority locations for refining the source inventory in future model updates.
Calibration was performed iteratively by adjusting the emission parameters of the field-labelled sources (terminals, schools, restaurants, commercial points) within ±3 dB of their library values, until the convergence criterion (mean absolute residual < 3 dB(A) and 75% of residuals within ±5 dB(A)) was met. After calibration, the diagnostic statistics in both cities meet international acceptance standards for ISO 9613-2 implementations.
For Soledad, these statistics reveal a more complex calibration scenario compared to Montelíbano. The diurnal mean residual of +5.78 dB(A) indicates a tendency toward overestimation during the day, while the nocturnal mean of +1.43 dB(A) suggests near-zero bias at night. The substantially higher standard deviation (8.17–8.43 dB(A)) reflects the greater acoustic heterogeneity of a larger urban environment, where unmodelled emitters, limited deployment of additional sound level meters and receivers, and dynamic traffic patterns contribute to increased scatter between measured and modelled values. The wide residual range — from −13.75 to +31.77 dB(A) nocturnally — highlights the presence of localized sources that the model cannot fully capture, including informal commercial activity, high-density vehicular corridors, and intermittent industrial operations characteristic of a mid-sized Colombian city. Despite these limitations, the calibration procedure followed the same iterative adjustment of emission parameters within ±3 dB of library values, and the overall distribution of residuals confirms that the SoundPLAN framework retains predictive utility for urban noise planning in Soledad, with targeted source inventory refinement identified as the primary path toward improved model convergence in future updates.
3.5. Comparative Analysis Between Soledad and Montelíbano
The comparative analysis of both cities reveals three distinctive contrasts that fingerprint each urban typology (Table 4). First, the day–night gradient is markedly different: Soledad displays a mean nocturnal decrease of 5.9 dB(A) consistent with traffic-dominated cities elsewhere [9,26], while Montelíbano displays a near-flat profile with mean Δ ≈ 0 dB(A), reflecting the persistence of mining-industrial transport throughout the 24-hour cycle. Second, contrary to what population size alone would suggest, mean diurnal LAeq levels are comparable between Soledad (67.7 dB(A)) and Montelíbano (67.1 dB(A)), indicating that source typology — rather than urban scale — is the primary driver of absolute noise levels; notably, Montelíbano presents higher nocturnal levels (67.0 dB(A)) than Soledad (61.7 dB(A)), reflecting the continuity of mining-industrial operations through the night. Third, the standard deviation pattern is inverted: Soledad shows a higher daytime SD (6.7 dB(A)) reflecting heterogeneity between corridors and residential interiors, while Montelíbano shows a higher nighttime SD (6.5 dB(A)) due to the localized impact of continuous industrial operations against quieter residential blocks.
Spatially, Soledad presents a longitudinal pattern in which acoustic energy is concentrated along arterial corridors and propagates laterally into the residential fabric, while Montelíbano displays a centric-radial pattern in which the urban core and connections to the Cerro Matoso mine concentrate the highest levels. The metropolitan typology of Soledad, therefore, generates a larger total area of high exposure, while the mining-industrial typology of Montelíbano generates a smaller but more persistent area of high exposure with reduced potential for nocturnal acoustic recovery.
The compliance metric reveals that both cities operate above the Colombian regulatory framework, but with distinct mechanisms. Soledad violates the framework primarily through high vehicular flows and aircraft operations (vehicular maps in Figure 1 and Figure 2 are highly correlated with Environmental maps in Figure 3 and Figure 4), while Montelíbano violates it through continuous heavy-duty transport associated with mining production cycles (the structural similarity between Figure 5 and Figure 6 is the visual fingerprint of this mechanism). These mechanisms require differentiated policy responses, as discussed in the next section.
4. Discussion
The empirical results of this study challenge the implicit assumption that urban noise patterns in Latin America are dominated uniformly by road traffic. While road traffic is indeed the principal source in metropolitan Soledad—aligned with European and global evidence [3,8,26]—the case of Montelíbano demonstrates that mining-industrial cities of intermediate size develop a structurally different acoustic regime in which the day–night gradient collapses. This collapse is the single most policy-relevant finding of our comparative analysis: night-time acoustic recovery, which is the physiological mechanism through which urban populations restore sleep architecture and cardiovascular homeostasis, is essentially absent in Montelíbano. The 100% nocturnal non-compliance rate, combined with a near-zero day–night difference, configures a chronic exposure regime that the WHO Environmental Noise Guidelines [1] consider the highest priority for intervention. It should be noted, however, that Soledad also exhibits a critically high nocturnal non-compliance rate (96.2%), indicating that nocturnal acoustic recovery is partial at best even in the metropolitan typology, though the −5.9 dB(A) day–night gradient still preserves a meaningful diurnal contrast absent in Montelíbano.
The spatial structure of the modelled noise maps (Section 3) supports the interpretation of distinct urban-typology fingerprints. In Soledad, the linear-corridor pattern (Figure 1, Figure 2, Figure 3 and Figure 4) is the canonical signature of metropolitan traffic, with the additional structural feature of the airport overflight corridor as a continuous high-energy source. The visual contrast between the diurnal vehicular map (Figure 1) and the nocturnal vehicular map (Figure 2) is explicit: the spatial extent of the 65–80 dB(A) bands contracts substantially, reflecting the temporal dependence of the source. In Montelíbano, the maps (Figure 5, Figure 6, Figure 7 and Figure 8) reveal a different pattern: the spatial structure remains essentially constant between day and night, with the same hotspots, corridors, and urban-core concentration in both periods. This visual stability is the cartographic expression of the −0.1 dB(A) point-by-point Δ documented in the field campaign.
The validation of the SoundPLAN model in Montelíbano (mean residuals of −2.7 to −2.9 dB(A); 75% of residuals within ±5 dB(A)) is in line with international benchmarks for ISO 9613-2 implementations in urban environments [10,11,24]. The systematic underestimation of approximately 2.7–2.9 dB(A) is a known feature of ISO 9613-2 in dense urban contexts, where the standard does not fully capture multiple reflections, façade-canyon effects and informal sources (motorcycle taxis, street vendors with megaphones, micro-industries) that contribute to the measured levels but are not parameterized in default emission libraries [27]. In Soledad, the validation produced a different residual profile (mean residuals of +5.78 dB(A) diurnal and +1.43 dB(A) nocturnal, with standard deviations of 8.17–8.43 dB(A)), reflecting the greater acoustic heterogeneity of a larger urban environment where unmodelled emitters, the limited deployment of additional sound level meters and receivers, and dynamic traffic patterns increase scatter between measured and modelled values. The slight compression of the high-level tail in the Montelíbano dataset (regression slope < 1; Figure 12 and Figure 13) indicates that the model captures spatial variability between sites but underestimates extreme events, suggesting the need to integrate localized point sources in dense corridors during future model updates. The diagnostic suite (line plots, box plots, scatter plots and residual statistics) constitutes a transparent and reproducible validation protocol that can be transferred to other Colombian municipalities.
From a public health perspective, the documented exceedances at sensitive receptors (hospitals, health centres, educational institutions; Table 2) in both cities are alarming. WHO guidelines recommend Lnight values below 40 dB(A) outside bedrooms to prevent adverse health effects, and Lden below 53 dB(A) for road traffic; values between 22 and 28 dB(A) above these thresholds—as documented in this study—are unequivocally associated with increased risk of ischemic heart disease, hypertension and sleep disturbance [1,3,4]. The 23.5 dB(A) exceedance at the Hospital Materno Infantil in Soledad is particularly worrying, given the vulnerability of patients in maternal and neonatal care and constitutes a structural urban-planning problem that cannot be resolved solely with operational measures.
The contrast between cities also has implications for the design of mitigation policies. In Soledad, the linear-corridor pattern is amenable to standard interventions: speed reduction, low-noise pavement on critical corridors (Calle 30, Avenida Murillo), enforcement against motorcycle exhaust modifications, and the inclusion of acoustic barriers near hospitals and schools on arterial corridors. The strong day–night gradient also indicates that the temporal management of heavy traffic (cargo restrictions in night hours near sensitive zones) can produce immediate health gains. In Montelíbano, conversely, the absence of a day–night gradient implies that temporal regulations alone are insufficient: structural interventions are needed, including rerouting mining-related heavy transport, implementing acoustic perimeters around residential clusters, and differentiating urban land-use planning to separate residential growth from the mining-transport corridor. The persistence of high nocturnal levels also suggests that occupational-noise management at the mine (which is regulated separately under Resolution 8321 of 1983) needs to be coupled with environmental-noise management of the road network through which mining outputs circulate.
From a methodological perspective, the SoundPLAN modelling strategy adopted here demonstrates the viability of dispersion modelling at the municipal scale in Global South contexts. The use of the Essential edition (rather than the more sophisticated Noise edition) reduces the cost barrier without sacrificing methodological rigour, provided calibration against field data is conducted iteratively, and the residuals are statistically characterized. The modelling of the DHC-6 Twin Otter contribution in Montelíbano using the industrial source mode of SoundPLAN Essential is a noteworthy methodological choice: it provides a diagnostic estimate of aviation noise where the standard ECAC Doc. 29 / AEDT chain is not available [23] and could serve as a template for other small-scale aviation contexts in Latin America. The same principle applies to the modelling of mining-related transport: integrating vehicular flows, point sources at terminals, and the road network in a single SoundPLAN environment provides a holistic representation that is difficult to achieve with single-source modelling tools.
Several limitations should be acknowledged. First, the field campaigns in both cities used the methodology outlined in Resolution 627 of 2006, which prescribes 1-hour LAeq values and short-term corrections (KI, KT, KS) but does not account for seasonal variability or annual averages, such as Lden. Second, the SoundPLAN models in both cases relied on the built-in emission library and field-derived vehicular counts but did not include detailed acoustic characterization of building façades, limiting the resolution of urban-canyon effects. Third, in Montelíbano, the aircraft modelling was conducted using the SoundPLAN Essential industrial source approach (line sources with 1/3-octave spectra and ISO 9613-2 propagation), which is appropriate for diagnostic purposes but does not substitute for the ECAC Doc. 29/AEDT methodology recommended for formal aviation studies [23]. Fourth, the comparative design of this study is limited to two cities and one measurement campaign each; a multi-city comparative panel covering additional Colombian municipalities (e.g., Cartagena, Bucaramanga, Tunja and other mining municipalities such as El Bagre or Segovia) would strengthen the generalizability of the typology-based interpretation. Fifth, the modelling does not include night-time environmental sources beyond the road network and listed point emitters, which may explain part of the systematic underestimation in the Montelíbano residual analysis. Sixth, the higher residual dispersion observed in Soledad reflects the limited spatial coverage of the receiver network relative to the urban extent of the city; future campaigns should expand the deployment of sound level meters to better resolve corridor-by-corridor heterogeneity and reduce the variance of the validation residuals.
Future research lines emerge naturally from these limitations. The integration of low-cost sensor networks—a strategy endorsed for Global South cities by recent literature [5,6]—could support continuous monitoring at higher spatial-temporal resolution in Soledad, enabling the validation of Lden and Lnight values rather than discrete LAeq measurements. The incorporation of land-use trajectories from the POT/PBOT instruments into SoundPLAN models would allow prospective scenarios to be evaluated against urban-expansion plans. Finally, longitudinal epidemiological studies linking the modelled noise maps to local health outcomes (cardiovascular hospitalizations, mental health indicators, school performance) would close the loop between sound pressure and population-level health burden in the Colombian Caribbean and Andean regions.
5. Conclusions
This study compared the spatial and temporal dynamics of environmental noise in two Colombian municipalities with contrasting urban typologies, integrating field monitoring at 80 (Soledad) and 30 (Montelíbano) receiver points with calibrated SoundPLAN dispersion models that produced strategic noise maps for diurnal and nocturnal scenarios. The principal conclusions are:
(1) Urban typology generates fundamentally different acoustic patterns. The metropolitan-traffic typology of Soledad produces a strong day–night gradient (mean ΔLAeq = −5.9 dB(A)) with linear acoustic corridors aligned with arterial roads, while the mining-industrial typology of Montelíbano produces a near-flat day–night profile (mean ΔLAeq ≈ 0 dB(A)) reflecting the persistence of heavy-duty transport throughout the 24-hour cycle. This contrast is the study’s central comparative finding and constitutes an empirical fingerprint of urban typology.
(2) Both cities operate substantially above the Colombian regulatory framework (Resolution 627 of 2006). Non-compliance rates of 83.8% (Soledad day) and 60.0% (Montelíbano day) escalate to 96.2% and 100%, respectively, in the nocturnal period, with critical exceedances of 15–23 dB(A) at sensitive receivers, including hospitals and educational institutions in both cities.
(3) The SoundPLAN dispersion models provide an adequate representation of the field-measured patterns, with city-specific residual profiles. In Montelíbano, mean residuals of −2.72 dB(A) (diurnal) and −2.92 dB(A) (nocturnal), with more than 75% of residuals within ±5 dB(A), are consistent with international benchmarks for ISO 9613-2 implementations in urban environments; the slight systematic underestimation reflects the difficulty of capturing multiple reflections and informal sources in the standard emission library. In Soledad, mean residuals of +5.78 dB(A) (diurnal) and +1.43 dB(A) (nocturnal), with standard deviations of 8.17–8.43 dB(A), reflect the greater acoustic heterogeneity of a larger urban environment and the limited spatial coverage of the receiver network relative to the city’s extent, identifying the expansion of the monitoring network as a priority for future model refinement.
(4) Differentiated mitigation policies are required. In Soledad, the linear-corridor pattern justifies temporal traffic management, low-noise pavement, enforcement against motorcycle exhaust modifications, and acoustic barriers near sensitive receivers. In Montelíbano, the absence of a day–night gradient demands structural interventions: rerouting mining transport, acoustic perimeters, and land-use planning that separates residential growth from mining-transport corridors. The integration of occupational and environmental noise management is essential in mining-industrial cities.
(5) The integration of field monitoring with calibrated dispersion models is a viable methodology for Global South municipalities. The combined approach generates spatially explicit, regulatorily anchored evidence that can directly inform municipal Land Use Plans and the implementation of Law 2450 of 2025 (Colombia’s Anti-Noise Law) [28]. The methodology is replicable and scalable, providing a path towards systematic acoustic characterization of Latin American cities and contributing to sustainable urban planning, public health protection, and the global goal of acoustically healthier urban environments.
Supplementary Materials
The following supporting information can be downloaded at the website of this paper posted on Preprints.org.
Author Contributions
Conceptualization, Samuel Pinto Argel; methodology, Samuel Pinto Argel; software, Samuel Pinto Argel; validation, Samuel Pinto Argel, Mauricio Rosso Pinto and Humberto Tavera Quiroz; formal analysis, Samuel Pinto Argel; investigation, Samuel Pinto Argel, Mauricio Rosso Pinto and Humberto Tavera Quiroz; resources, Mauricio Rosso Pinto and Humberto Tavera Quiroz; data curation, Mauricio Rosso Pinto; writing—original draft preparation, Samuel Pinto Argel; writing—review and editing, Mauricio Rosso Pinto and Humberto Tavera Quiroz; visualization, Samuel Pinto Argel; supervision, Mauricio Rosso Pinto and Humberto Tavera Quiroz; project administration, Mauricio Rosso Pinto and Humberto Tavera Quiroz; funding acquisition, Mauricio Rosso Pinto and Humberto Tavera Quiroz. All authors have read and agreed to the published version of the manuscript.
Funding
This research received no external funding.
Institutional Review Board Statement
Not applicable.
Informed Consent Statement
Not applicable.
Data Availability Statement
The data presented in this study are available from the technical reports of Control de Contaminación Ltd.a. (laboratory accredited by IDEAM under Resolution 0051 of 20 January 2025) prepared for the Corporación Autónoma Regional del Atlántico (C.R.A.) and the Corporación Autónoma Regional de los Valles del Sinú y del San Jorge (CVS), and may be requested from the corresponding author. SoundPLAN model files (.geosp) are available upon reasonable request.
Conflicts of Interest
The authors declare no conflicts of interest.
References
- World Health Organization. Environmental Noise Guidelines for the European Region; WHO Regional Office for Europe: Copenhagen, Denmark, 2018. [Google Scholar]
- World Health Organization. Guidelines for Community Noise; WHO: Geneva, Switzerland, 1999. [Google Scholar]
- Münzel, T.; Hahad, O.; Daiber, A.; Sørensen, M. Noise causes cardiovascular disease: it’s time to act. Lancet Reg. Health Eur. 2024, 46, 101091. [Google Scholar] [CrossRef] [PubMed]
- van Kempen, E.; Casas, M.; Pershagen, G.; Foraster, M. WHO environmental noise guidelines for the European region: a systematic review on environmental noise and cardiovascular and metabolic effects: a summary. Int. J. Environ. Res. Public Health 2018, 15, 379. [Google Scholar] [CrossRef] [PubMed]
- Zalakeviciute, R.; Bastidas, M.; Buenaño, A.; Rybarczyk, Y. A traffic-based method to predict and map urban air quality. Appl. Sci. 2020, 10, 2035. [Google Scholar] [CrossRef]
- Buele, J.; Criollo-Casignia, D. Effects of vehicular emissions on urban air quality in Ecuador and implications for respiratory health. Sustainability 2026, 18, 1262. [Google Scholar] [CrossRef]
- Ministerio de Environmentale; Vivienda y Desarrollo Territorial. Resolución 627 de 2006: Por la cual se establece la norma nacional de emisión de ruido y ruido Environmentalal; MAVDT: Bogotá, Colombia, 2006. [Google Scholar]
- Murphy, E.; King, E.A. Environmental Noise Pollution: Noise Mapping, Public Health, and Policy, 2nd ed.; Elsevier: Amsterdam, The Netherlands, 2022. [Google Scholar]
- Zannin, P.H.T.; Sant’Ana, D.Q. Noise mapping at different stages of a freeway redevelopment project. Appl. Acoust. 2011, 72, 479–486. [Google Scholar] [CrossRef]
- International Organization for Standardization. ISO 9613-2:1996; Acoustics—Attenuation of Sound During Propagation Outdoors—Part 2: General Method of Calculation. ISO: Geneva, Switzerland, 1996.
- Garg, N.; Maji, S. A critical review of principal traffic noise models: Strategies and implications. Environ. Impact Assess. Rev. 2014, 46, 68–81. [Google Scholar] [CrossRef]
- SoundPLAN GmbH. SoundPLANessential 6.0—User Manual; SoundPLAN: Backnang, Germany, 2024. [Google Scholar]
- Ceneris. SoundPlan 8.1 — Módulo Essential. Available online: https://ceneris.com/product/soundplan-8-1-modulo-essential/ (accessed on 21 September 2025).
- Departamento Administrativo Nacional de Estadística (DANE). Proyecciones y retroproyecciones de población municipal para el período 2020–2035 con base en el CNPV 2018; DANE: Bogotá, Colombia, 2023. [Google Scholar]
- Alcaldía de Montelíbano. Plan de Desarrollo del Municipio de Montelíbano—Córdoba; Alcaldía Municipal: Montelíbano, Colombia, 2024. [Google Scholar]
- Alcaldía de Montelíbano. Plan Básico de Ordenamiento Territorial del Municipio de Montelíbano (PBOT); Alcaldía Municipal: Montelíbano, Colombia, 2016. [Google Scholar]
- International Organization for Standardization. ISO 1996-1:2016 Acoustics—Description, Measurement and Assessment of Environmental Noise—Part 1: Basic Quantities and Assessment Procedures; ISO: Geneva, Switzerland, 2016. [Google Scholar]
- International Organization for Standardization. ISO 1996-2:2017 Acoustics—Description, Measurement and Assessment of Environmental Noise—Part 2: Determination of Sound Pressure Levels; ISO: Geneva, Switzerland, 2017. [Google Scholar]
- International Organization for Standardization. ISO/TR 17534-3:2015 Acoustics—Software for the Calculation of Sound Outdoors; ISO. Geneva, Switzerland, 2015.
- European Aviation Safety Agency. Type Certificate Data Sheet EASA.IM.A.575: De Havilland Canada DHC-6 Series 400. EASA: Cologne, Germany.
- Hilton, D.A.; Henderson, H.R.; Mag, D.J. Ground Noise Measurements During Landing, Take-Off, and Flyby Operations of a Four-Engine Turbopropeller STOL Airplane (NASA TN D-6486); NASA: Washington, DC, USA, 1971. [Google Scholar]
- Federal Aviation Administration. Aviation Environmental Design Tool (AEDT) Technical Manual: Version 3b; FAA: Washington, DC, USA, 2019. [Google Scholar]
- European Civil Aviation Conference. ECAC.CEAC Doc 29, 4th Edition: Report on Standard Method of Computing Noise Contours Around Civil Airports. In Technical Guide; ECAC: Neuilly-sur-Seine, France, 2016; Volume 2.
- King, E.A.; Murphy, E. Environmental noise—‘Forgotten’ or ‘Ignored’ pollutant? Appl. Acoust. 2016, 112, 211–215. [Google Scholar] [CrossRef]
- Ministerio de Salud y Protección Social. Resolución 8321 de 1983: Por la cual se dictan normas sobre Protección y Conservación de la Audición; Ministerio de Salud: Bogotá, Colombia, 1983. [Google Scholar]
- Salomons, E.M.; Pont, M.B. Urban traffic noise and the relation to urban density, form, and traffic elasticity. Landsc. Urban Plan. 2012, 108, 2–16. [Google Scholar] [CrossRef]
- Bozkurt, T.S.; Demirkale, S.Y. Preparation of industrial noise mapping and improvement of environmental quality. Curr. Sci. 2020, 119, 2027–2037. [Google Scholar] [CrossRef] [PubMed]
- Congreso de la República de Colombia. Ley 2450 de 2025: Ley Antiruido; Congreso de la República: Bogotá, Colombia, 2025. [Google Scholar]
Figure 1.
Modelled vehicular noise distribution in Soledad — diurnal scenario (Lday). The map evidences the structural role of arterial corridors (Street 30, Murillo Ave, Circunvalar Ave, Airport Highway) where 65–75 dB(A) bands form continuous longitudinal patterns, with 75–80 dB(A) peaks at complex intersections. The diagonal SW–NE swathe corresponds to the Ernesto Cortissoz International Airport noise contour.
Figure 1.
Modelled vehicular noise distribution in Soledad — diurnal scenario (Lday). The map evidences the structural role of arterial corridors (Street 30, Murillo Ave, Circunvalar Ave, Airport Highway) where 65–75 dB(A) bands form continuous longitudinal patterns, with 75–80 dB(A) peaks at complex intersections. The diagonal SW–NE swathe corresponds to the Ernesto Cortissoz International Airport noise contour.
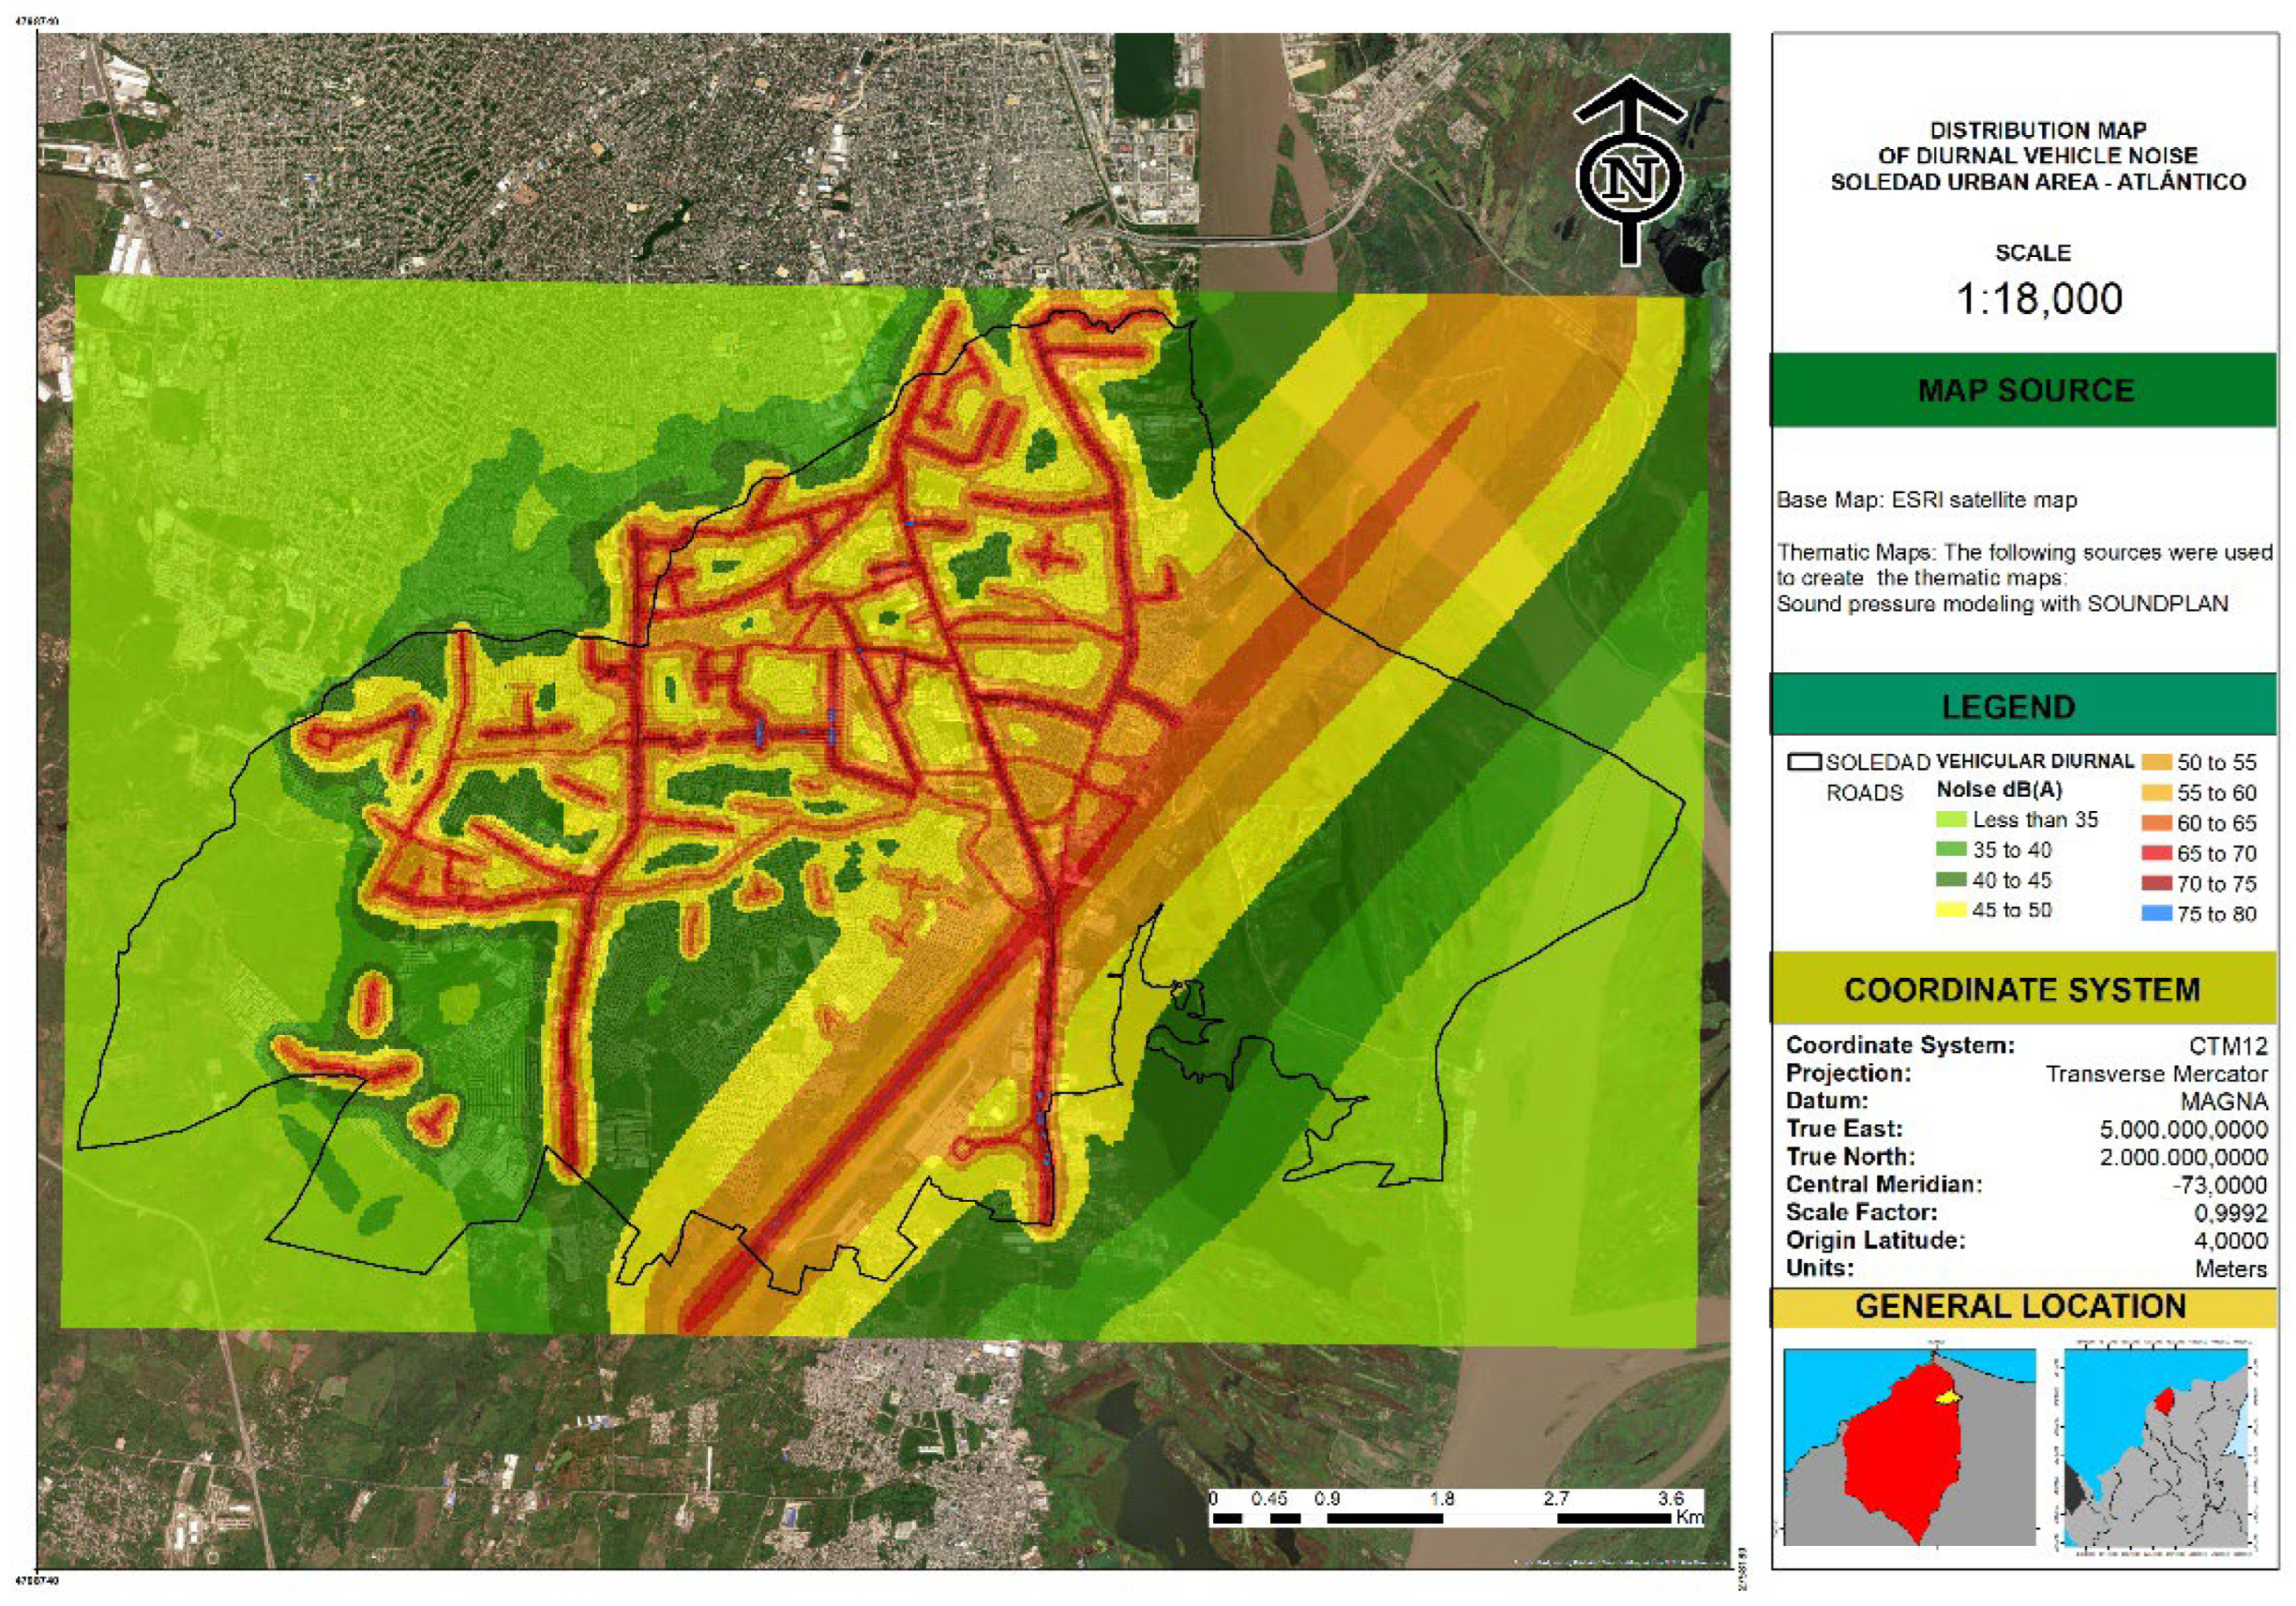
Figure 2.
Modelled vehicular noise distribution in Soledad — nocturnal scenario (Lnight). The high-noise area contracts ~30–40% relative to the diurnal scenario, with peaks restricted to the principal corridors. The blue band over the airport runway (75–80 dB(A)) reflects the persistence of cargo/service operations during the nocturnal period.
Figure 2.
Modelled vehicular noise distribution in Soledad — nocturnal scenario (Lnight). The high-noise area contracts ~30–40% relative to the diurnal scenario, with peaks restricted to the principal corridors. The blue band over the airport runway (75–80 dB(A)) reflects the persistence of cargo/service operations during the nocturnal period.
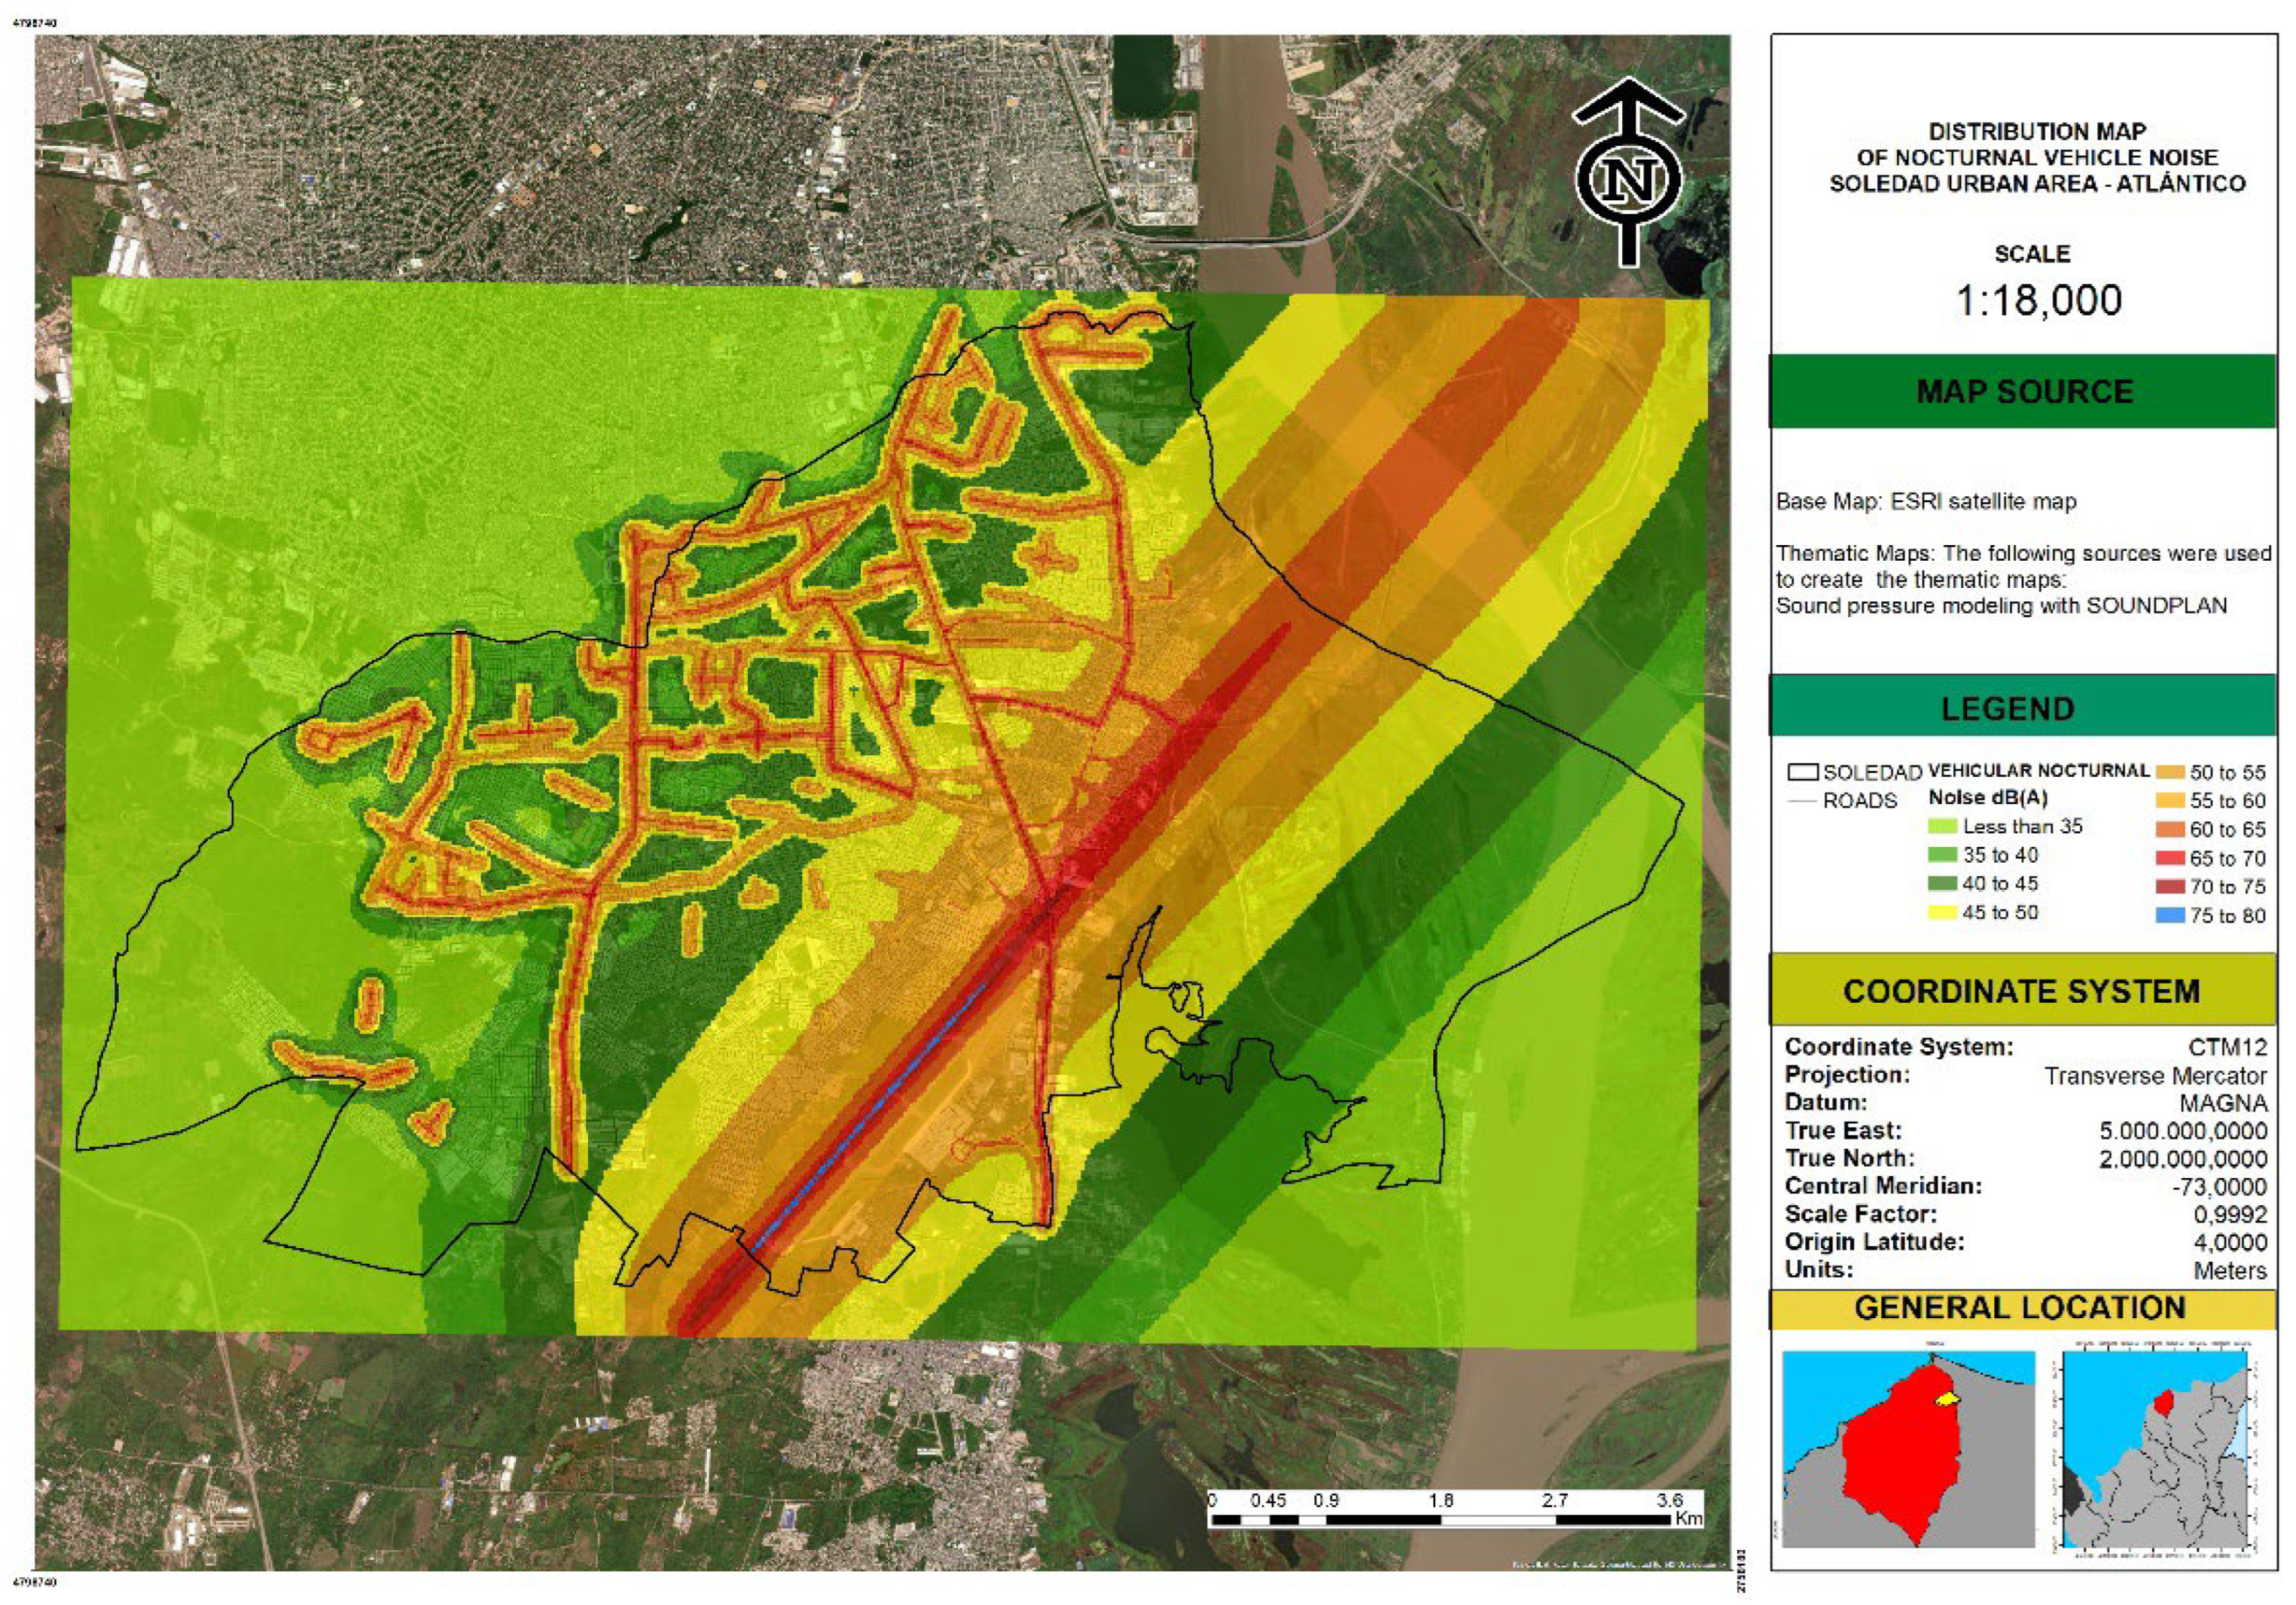
Figure 3.
Modelled Environmental noise distribution in Soledad — diurnal scenario. Environmental noise integrates vehicle, commercial, industrial and residual anthropogenic sources. The high-energy diagonal swathe corresponds to the Ernesto Cortissoz airport overflight zone.
Figure 3.
Modelled Environmental noise distribution in Soledad — diurnal scenario. Environmental noise integrates vehicle, commercial, industrial and residual anthropogenic sources. The high-energy diagonal swathe corresponds to the Ernesto Cortissoz airport overflight zone.
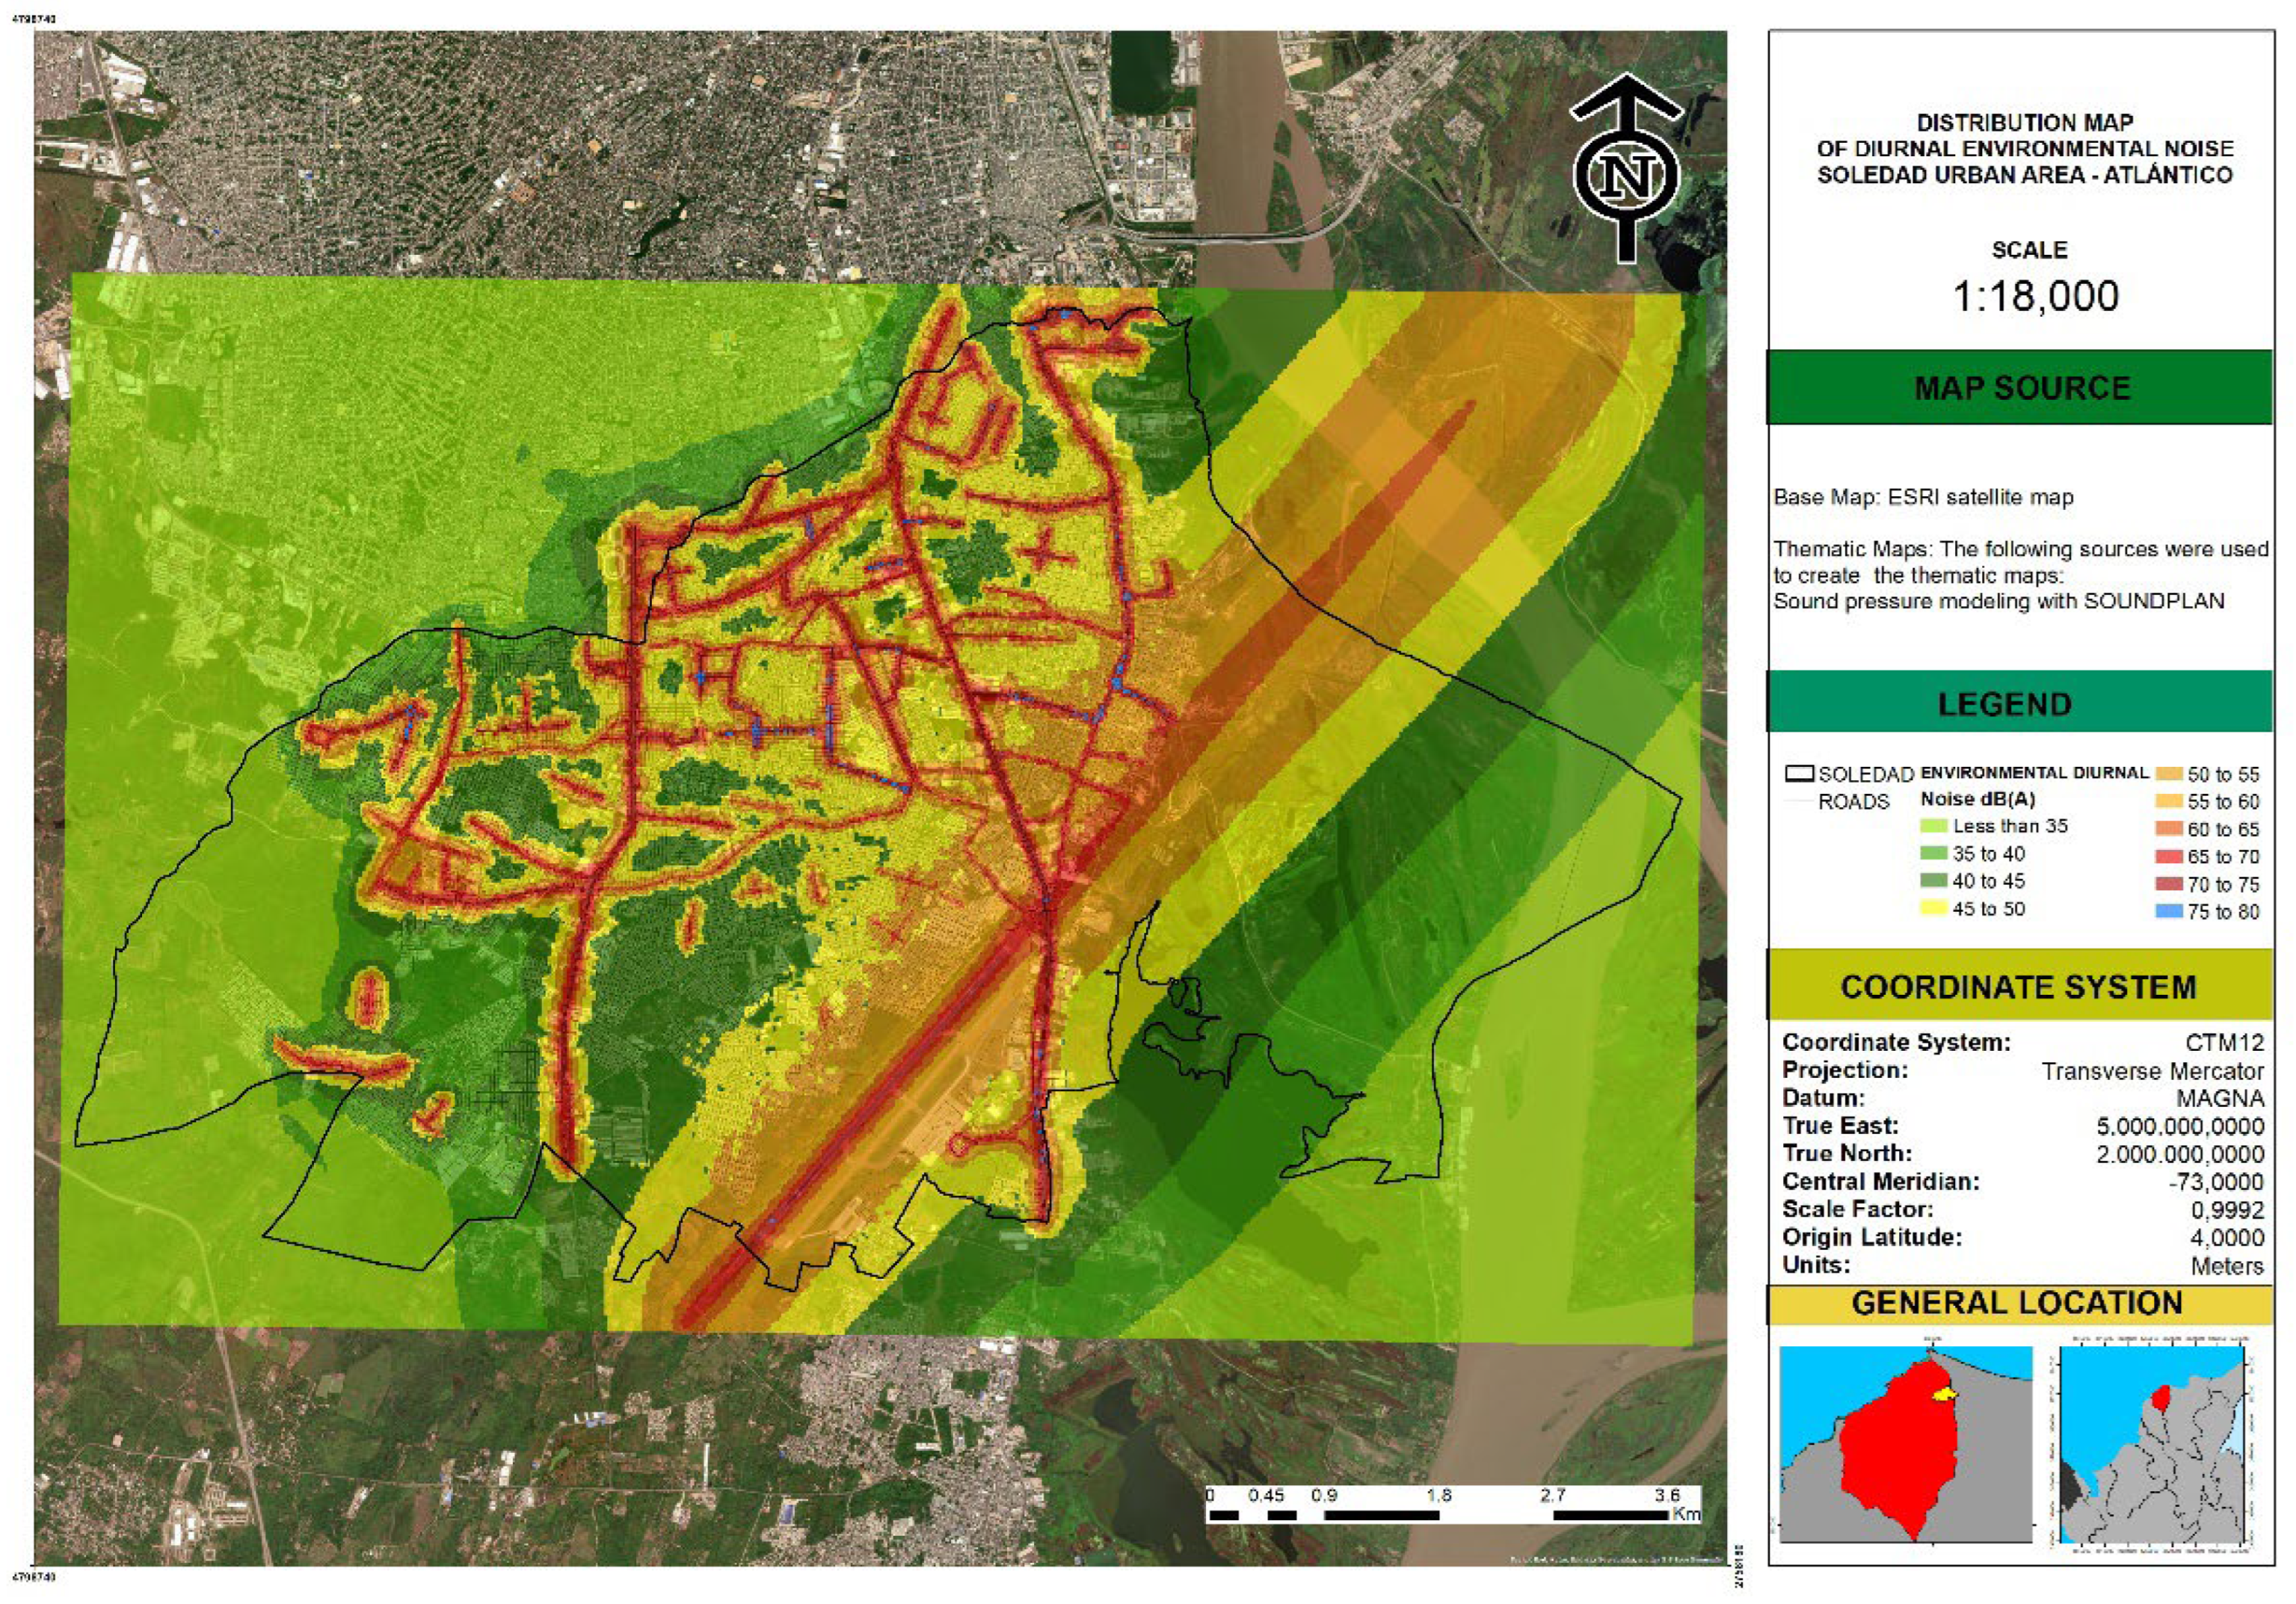
Figure 4.
Modelled Environmental noise distribution in Soledad — nocturnal scenario. The internal residential pattern attenuates significantly (greens and yellows expand), but the airport corridor preserves levels of 65–75 dB(A) and arterial corridors retain 60–70 dB(A) bands.
Figure 4.
Modelled Environmental noise distribution in Soledad — nocturnal scenario. The internal residential pattern attenuates significantly (greens and yellows expand), but the airport corridor preserves levels of 65–75 dB(A) and arterial corridors retain 60–70 dB(A) bands.
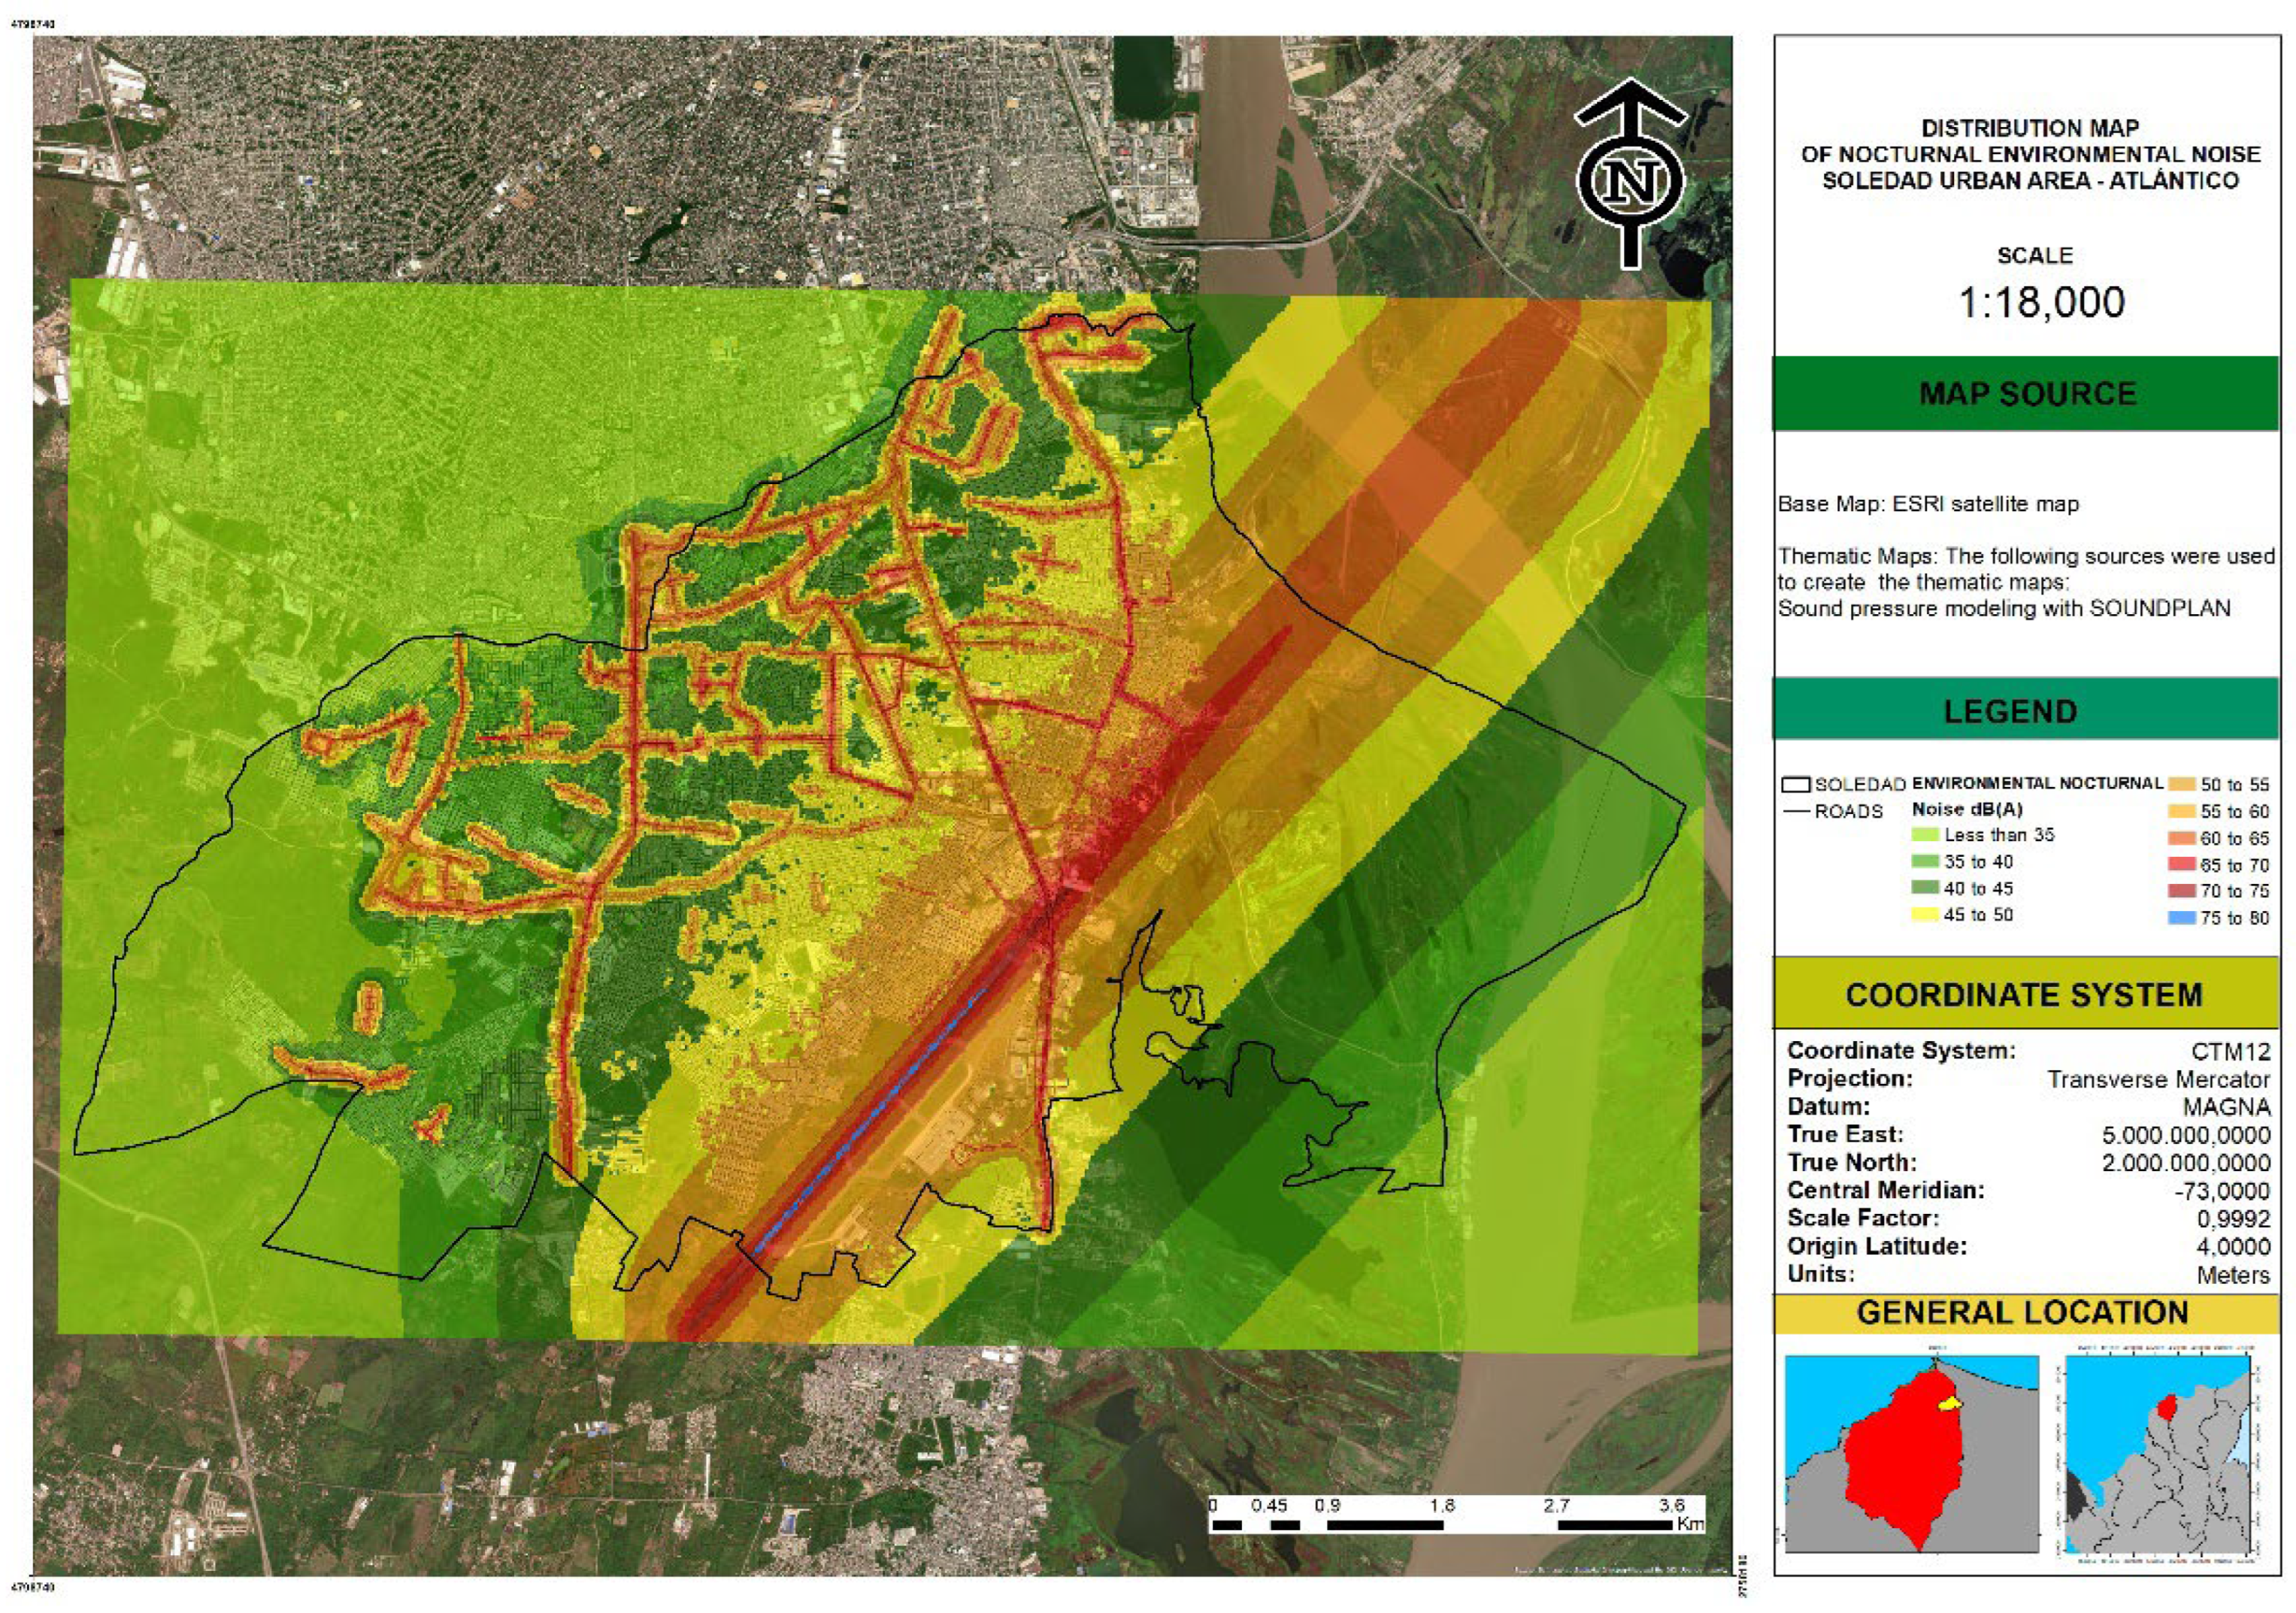
Figure 5.
Modelled vehicular noise distribution in Montelíbano — diurnal scenario. The map shows the central commercial area (red, 65–70 dB(A)) and the corridors connecting the urban core with the airport (vertical SW–NE band) and the Western Trunk Road. The aircraft-trajectory corridor (left edge) corresponds to the DHC-6 Twin Otter approach/take-off path.
Figure 5.
Modelled vehicular noise distribution in Montelíbano — diurnal scenario. The map shows the central commercial area (red, 65–70 dB(A)) and the corridors connecting the urban core with the airport (vertical SW–NE band) and the Western Trunk Road. The aircraft-trajectory corridor (left edge) corresponds to the DHC-6 Twin Otter approach/take-off path.
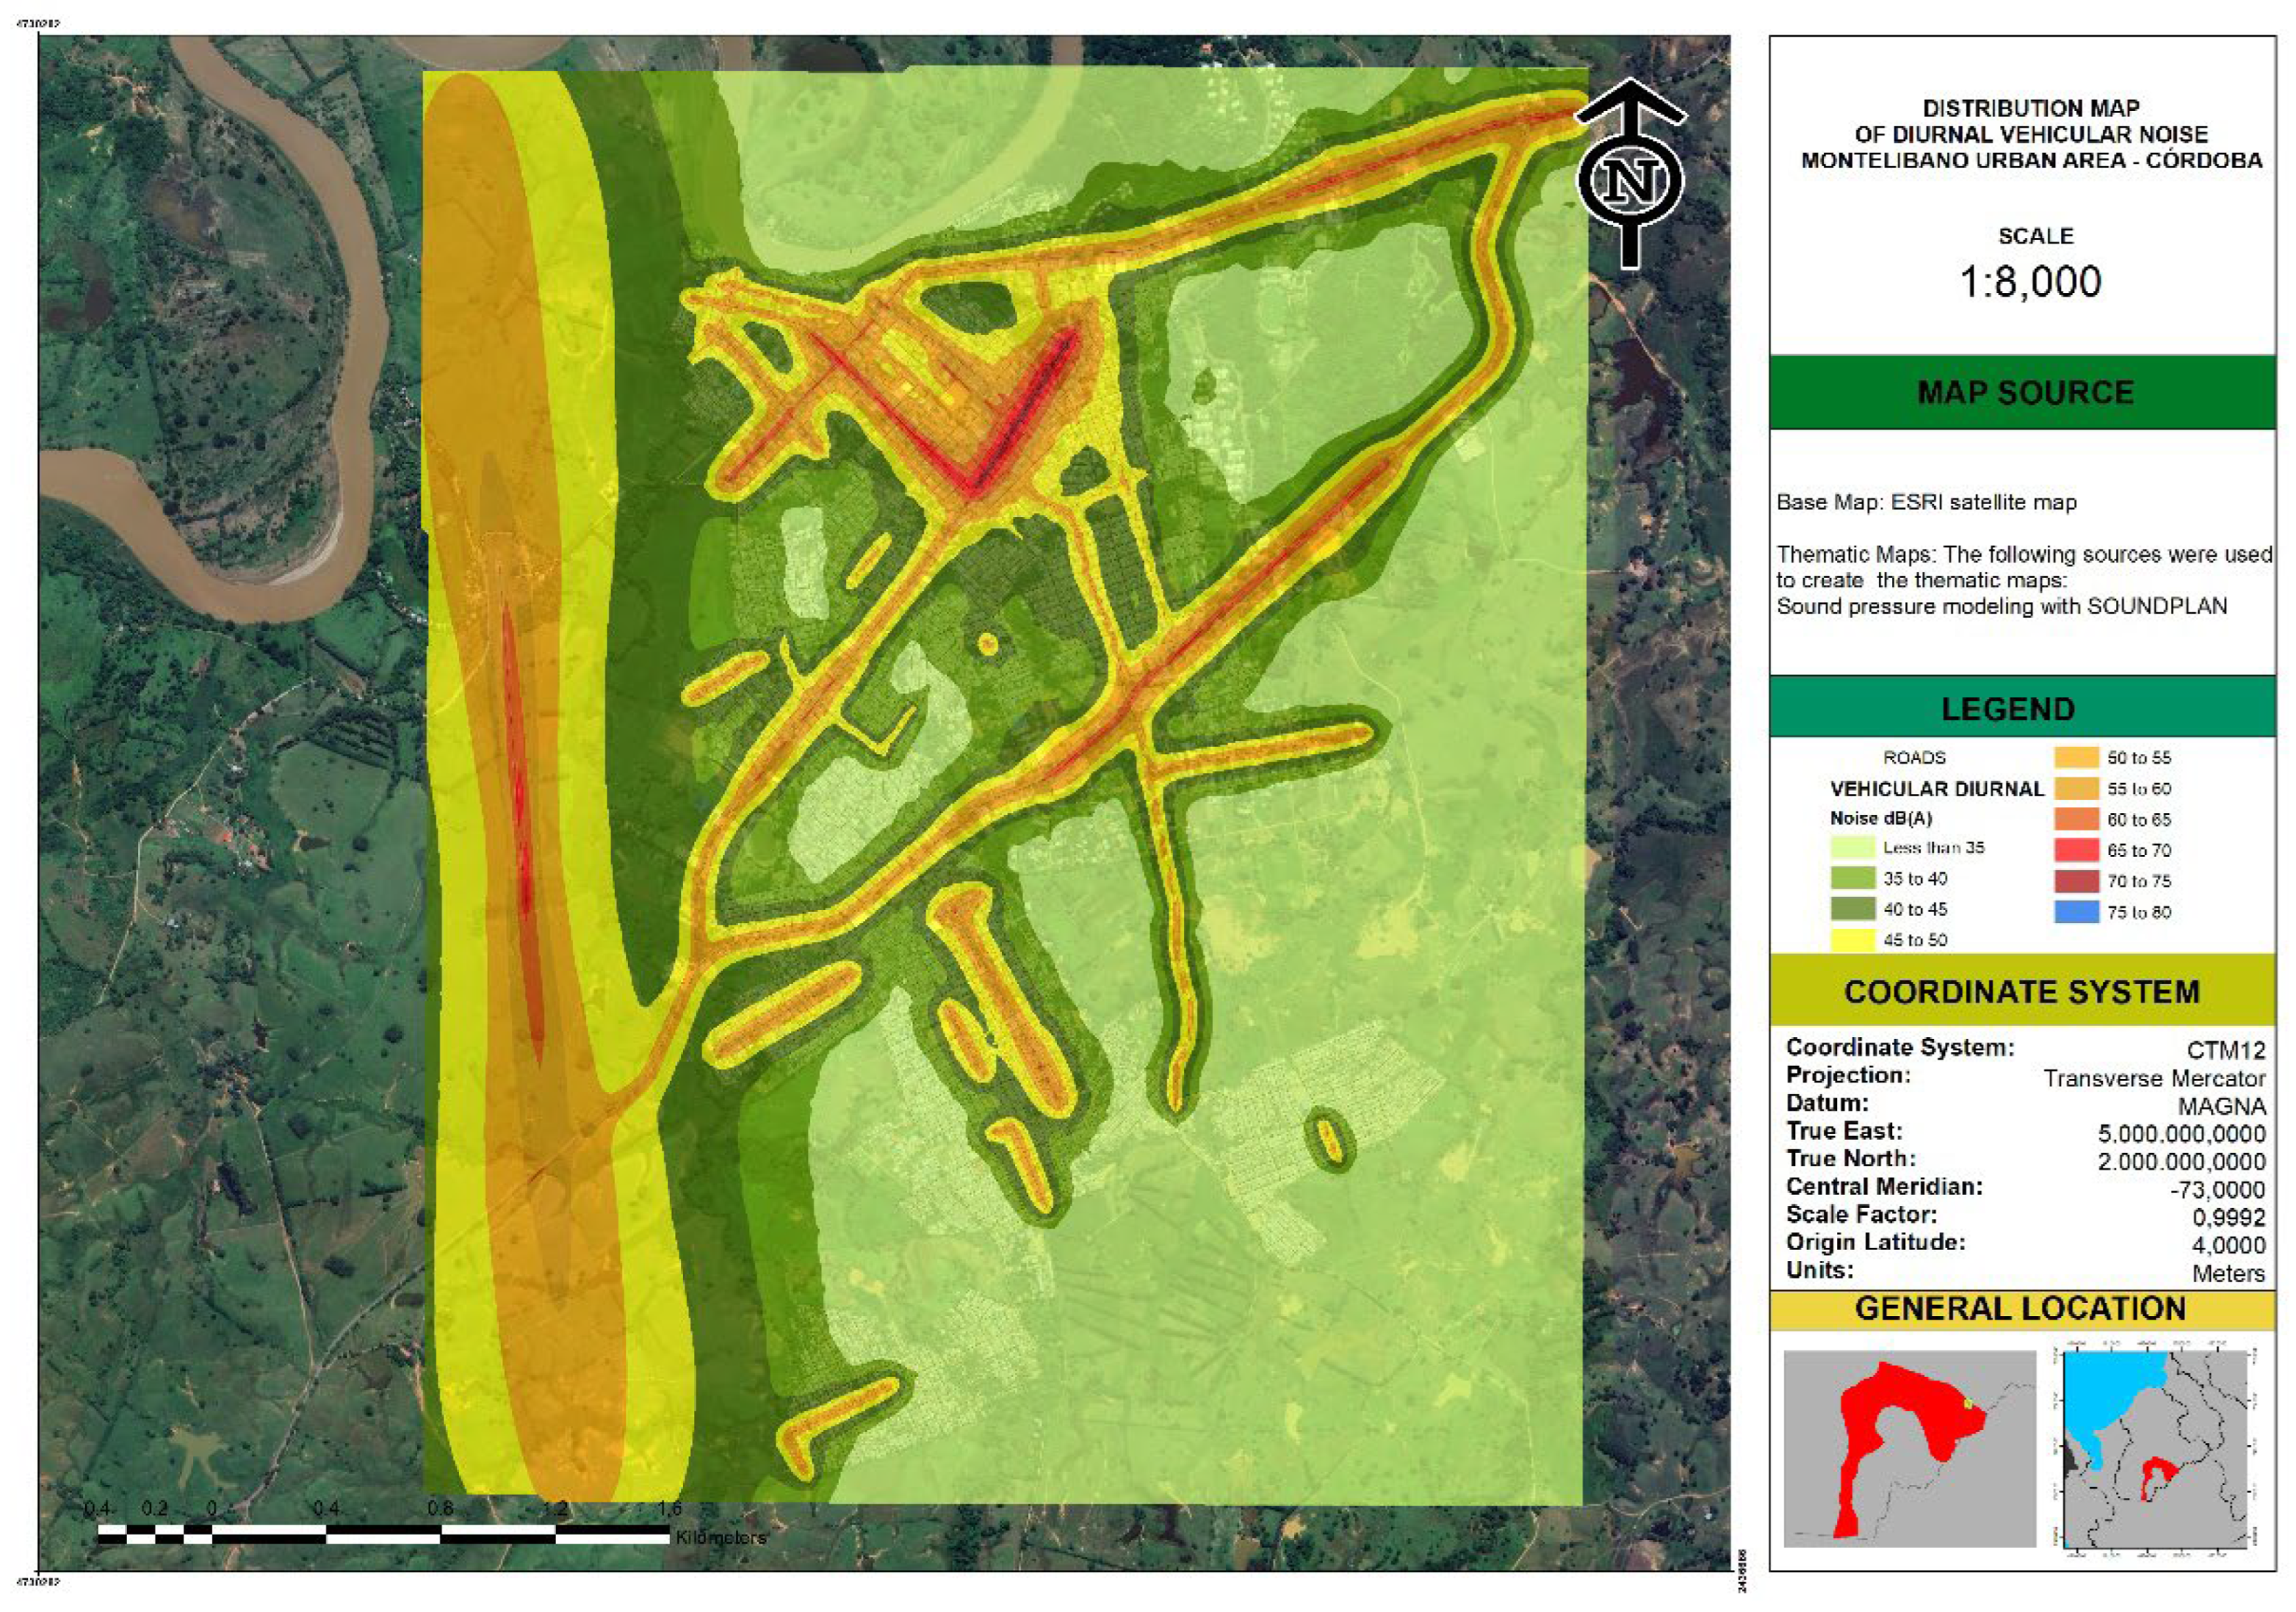
Figure 6.
Modelled vehicular noise distribution in Montelíbano — nocturnal scenario. Despite the regulatory threshold reduction (75 to 70 dB(A) industrial; 70 to 55 dB(A) residential), the spatial pattern preserves the same hot-spots as the diurnal scenario, in clear contrast with the strong day–night contraction observed in Soledad (cf. Figure 1 and Figure 2).
Figure 6.
Modelled vehicular noise distribution in Montelíbano — nocturnal scenario. Despite the regulatory threshold reduction (75 to 70 dB(A) industrial; 70 to 55 dB(A) residential), the spatial pattern preserves the same hot-spots as the diurnal scenario, in clear contrast with the strong day–night contraction observed in Soledad (cf. Figure 1 and Figure 2).
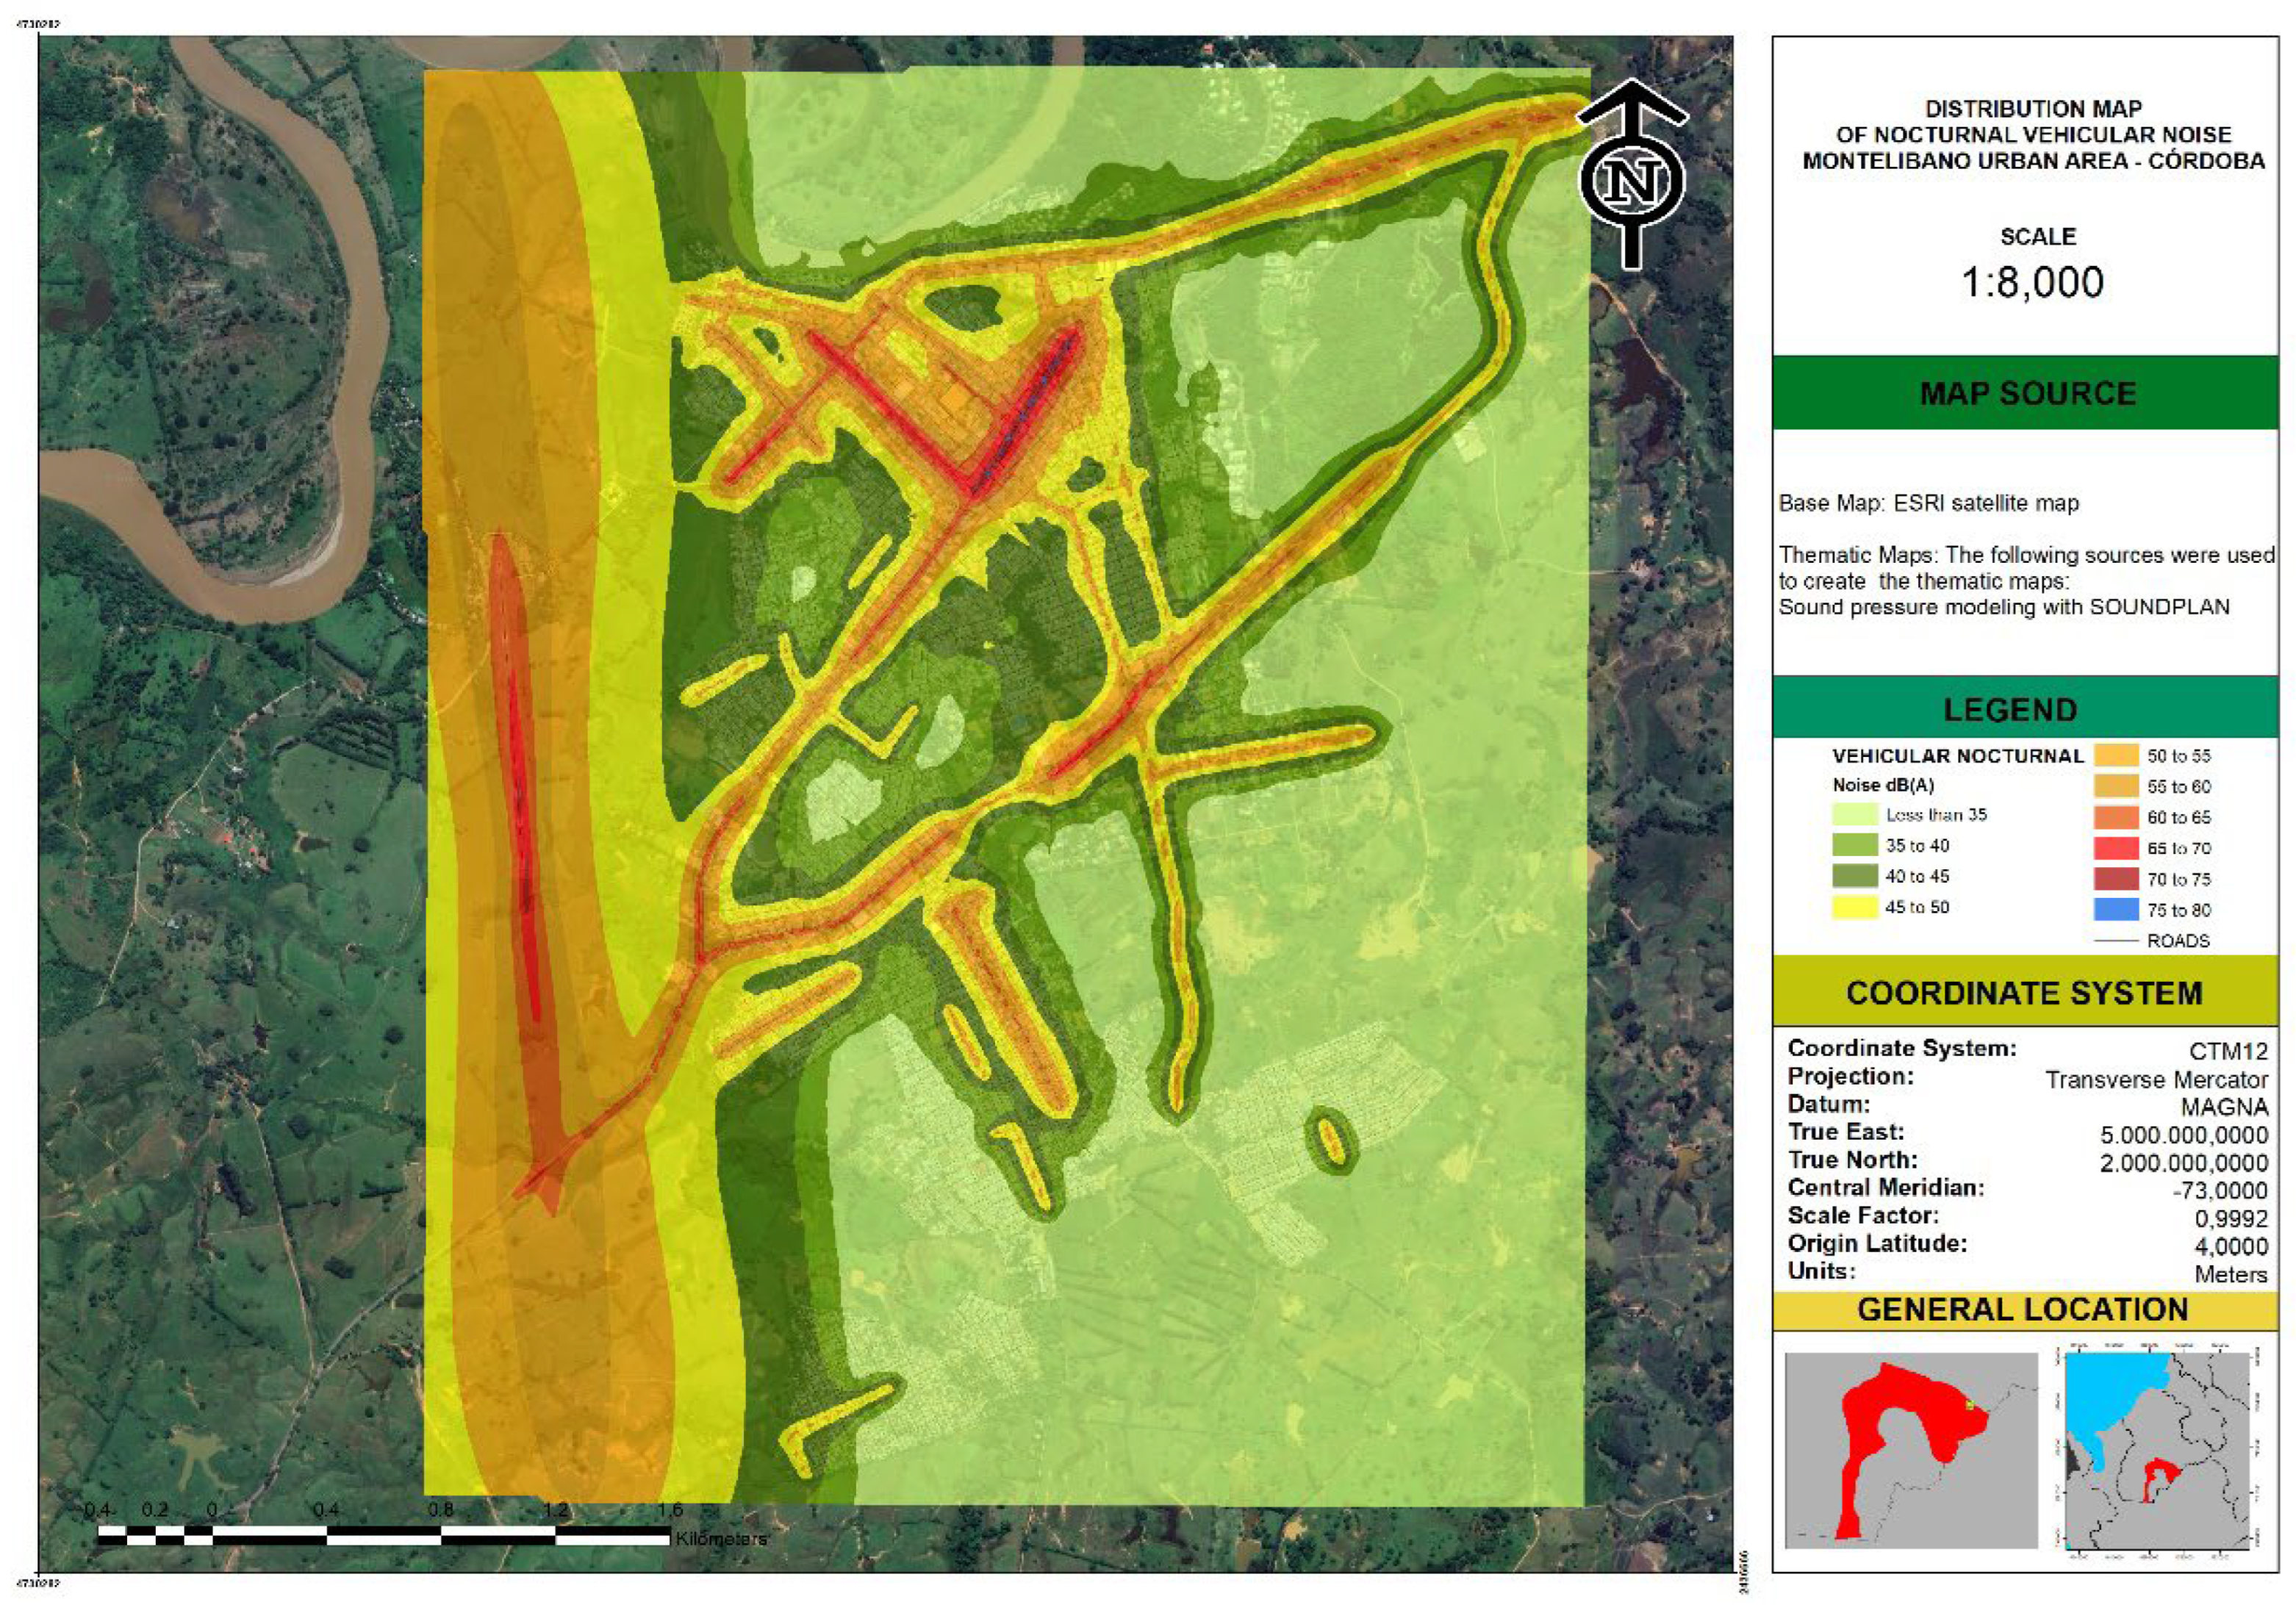
Figure 7.
Modelled Environmental noise distribution in Montelíbano — diurnal scenario. Environmental noise integrates vehicle, industrial, commercial and residual anthropogenic sources. The high-energy concentration at the central commercial area (65–70 dB(A)) and along the corridors is consistent with the vehicular pattern, while the airport-trajectory corridor (left edge) introduces an additional aeronautical contribution.
Figure 7.
Modelled Environmental noise distribution in Montelíbano — diurnal scenario. Environmental noise integrates vehicle, industrial, commercial and residual anthropogenic sources. The high-energy concentration at the central commercial area (65–70 dB(A)) and along the corridors is consistent with the vehicular pattern, while the airport-trajectory corridor (left edge) introduces an additional aeronautical contribution.
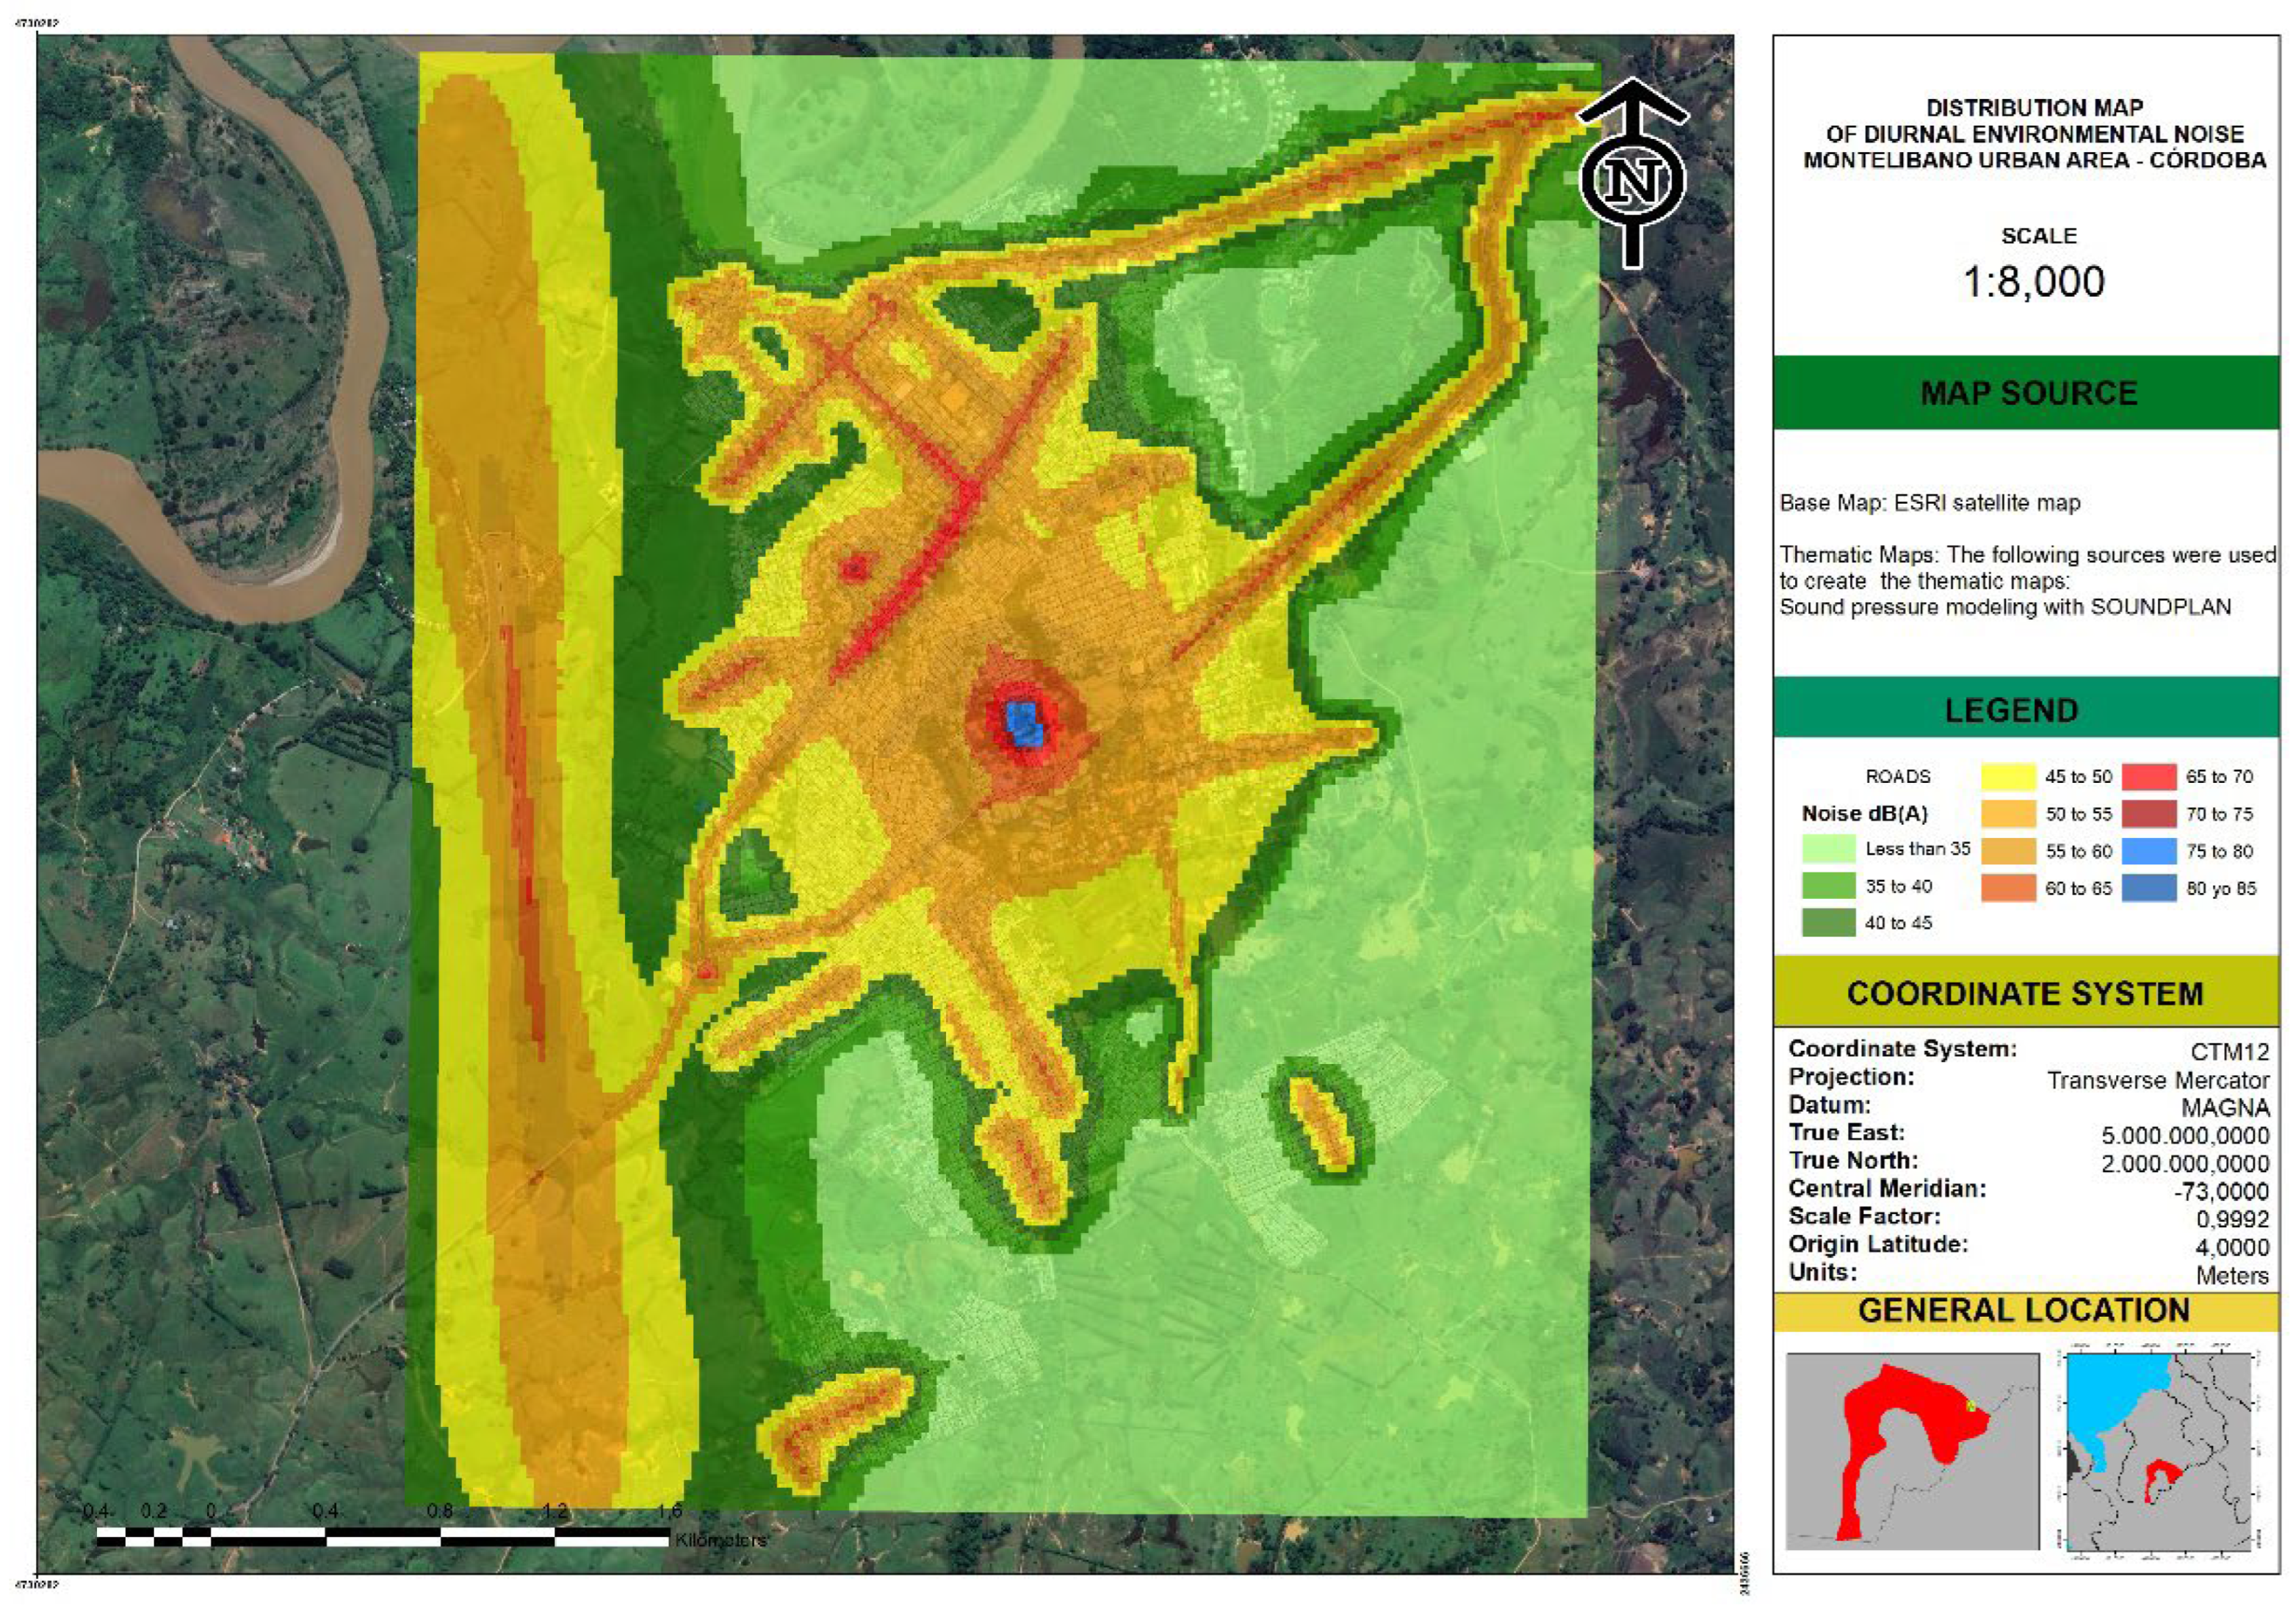
Figure 8.
Modelled Environmental noise distribution in Montelíbano — nocturnal scenario. Unlike the metropolitan typology of Soledad, the spatial pattern at night replicates the diurnal one with only minor attenuation in residential fringes, evidencing the continuous character of mining-industrial transport and ancillary activities.
Figure 8.
Modelled Environmental noise distribution in Montelíbano — nocturnal scenario. Unlike the metropolitan typology of Soledad, the spatial pattern at night replicates the diurnal one with only minor attenuation in residential fringes, evidencing the continuous character of mining-industrial transport and ancillary activities.
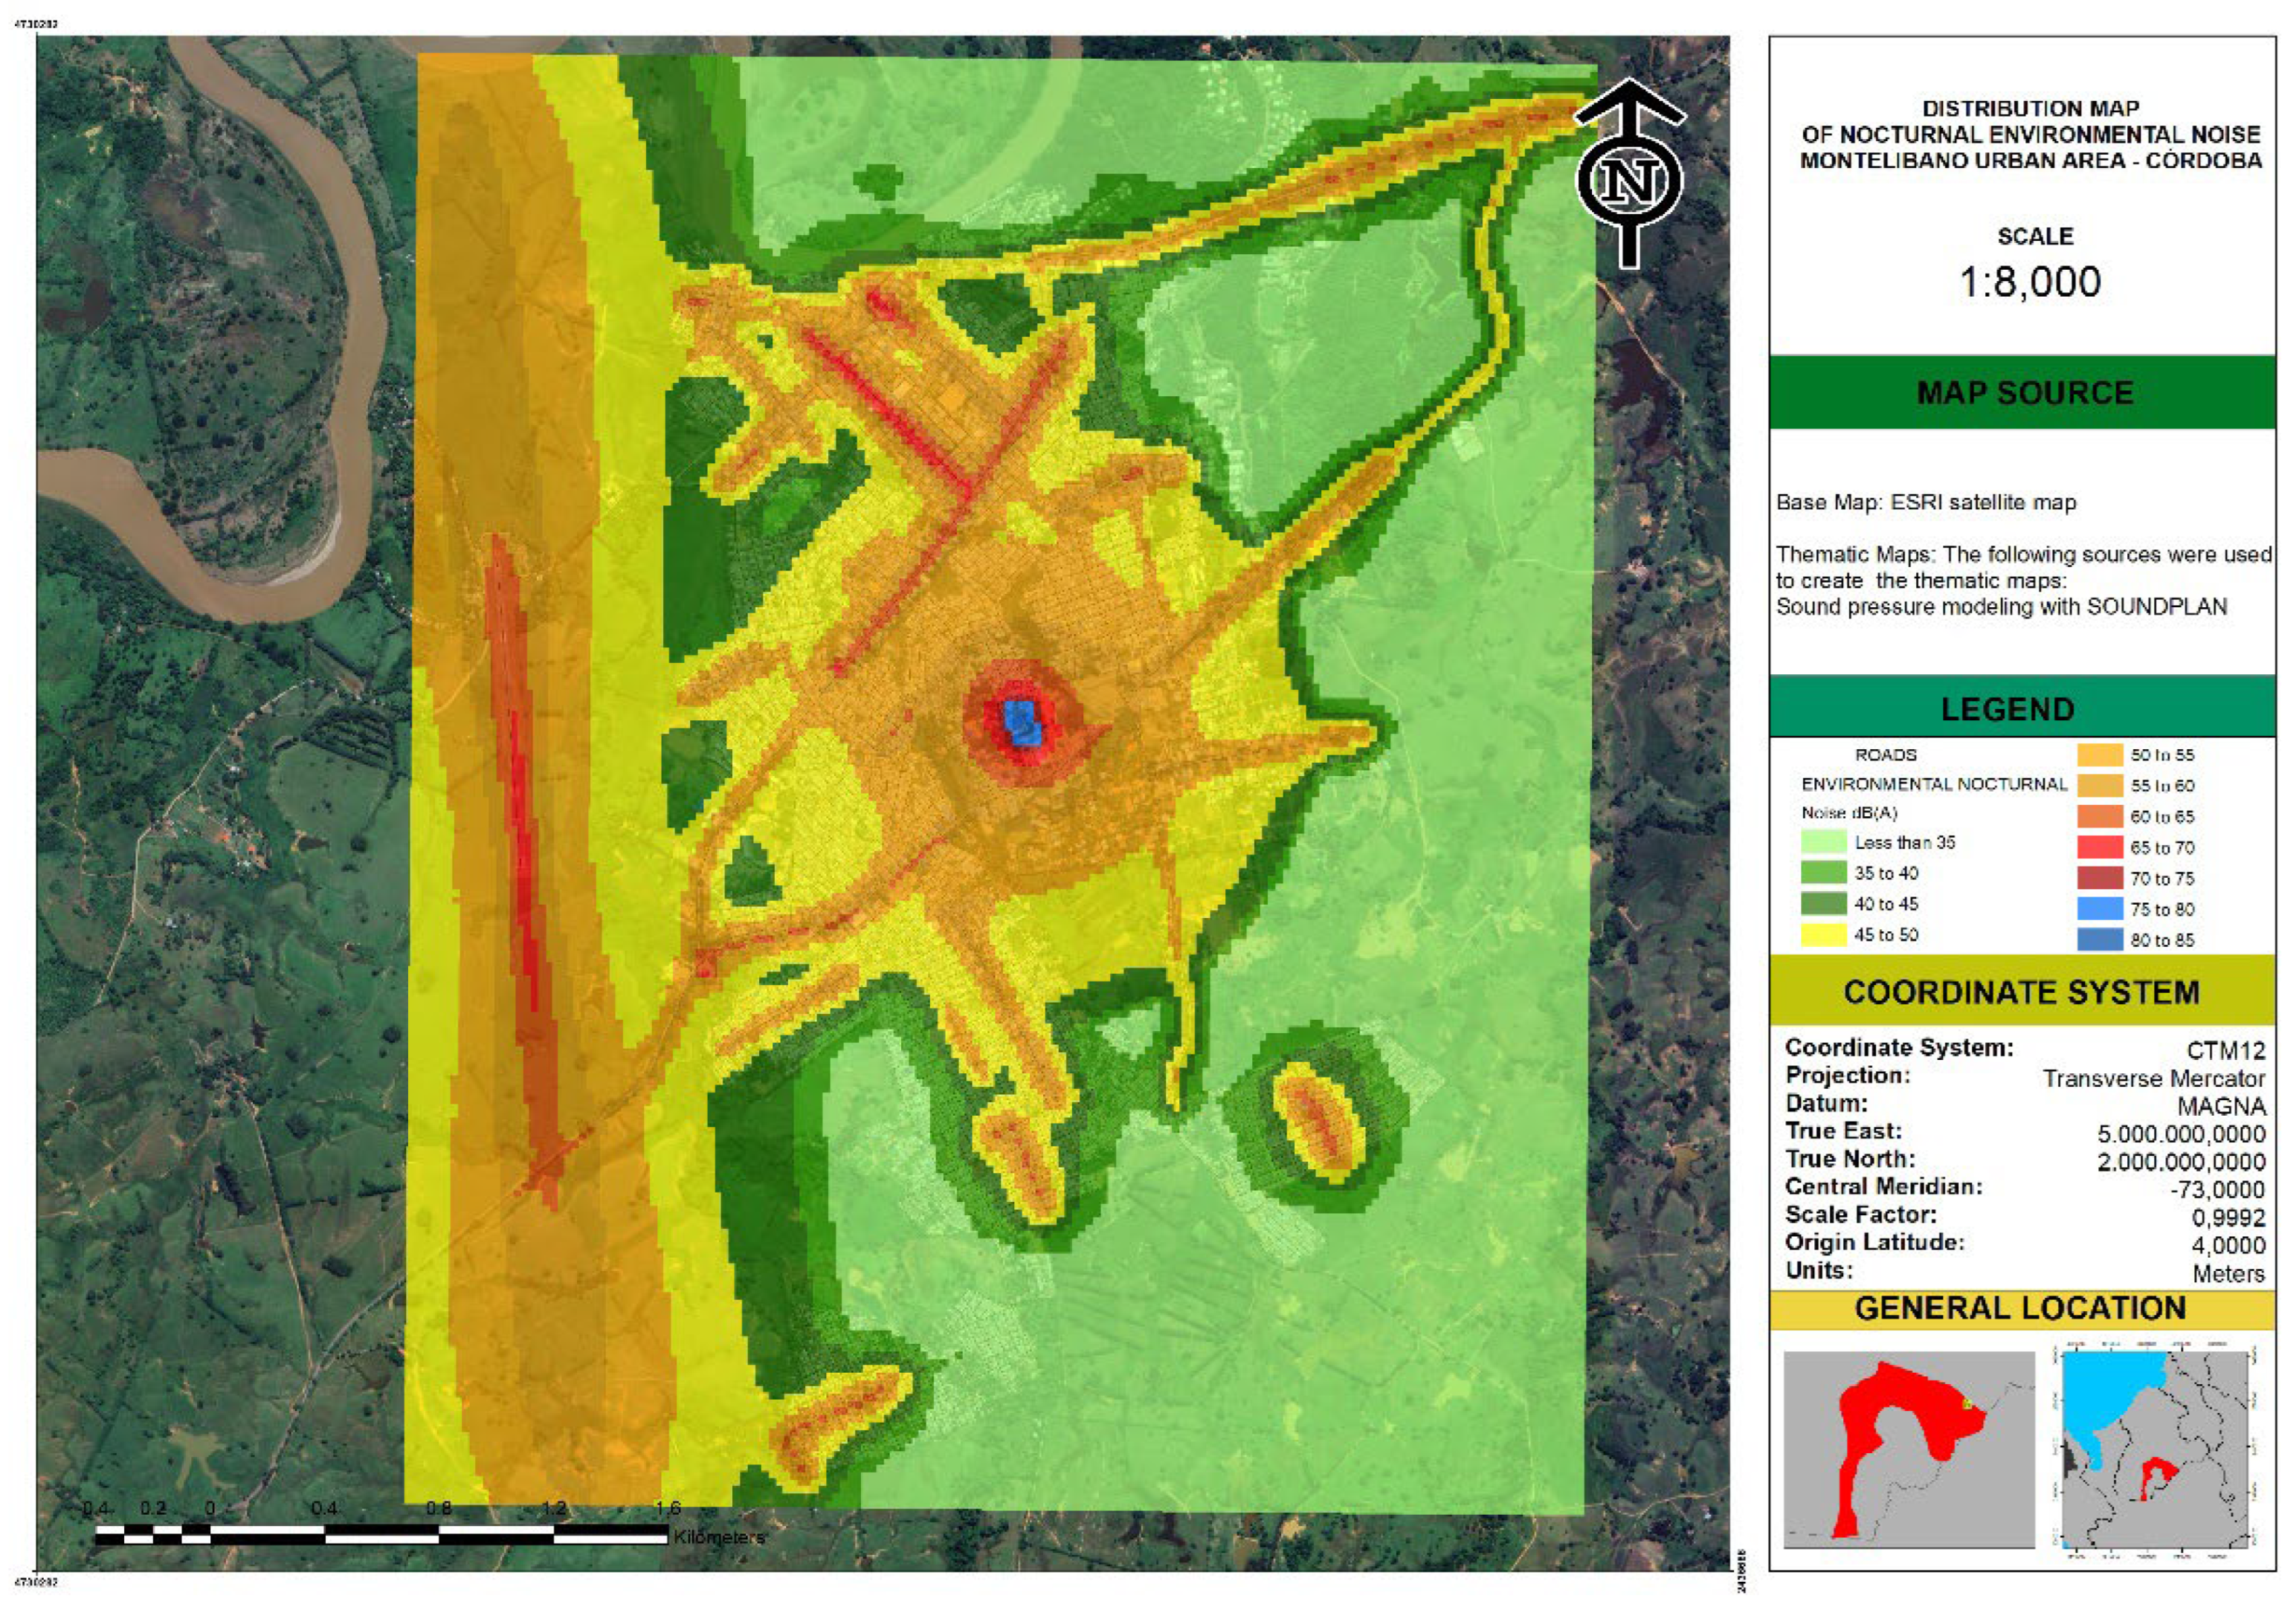
Figure 9.
Measured vs. modelled diurnal LAeq levels per receiver index in Montelíbano (n = 30). The two series follow a similar trajectory across the urban area; the modelled curve lies systematically below the measured curve by ~2–3 dB(A) in most receivers.
Figure 9.
Measured vs. modelled diurnal LAeq levels per receiver index in Montelíbano (n = 30). The two series follow a similar trajectory across the urban area; the modelled curve lies systematically below the measured curve by ~2–3 dB(A) in most receivers.
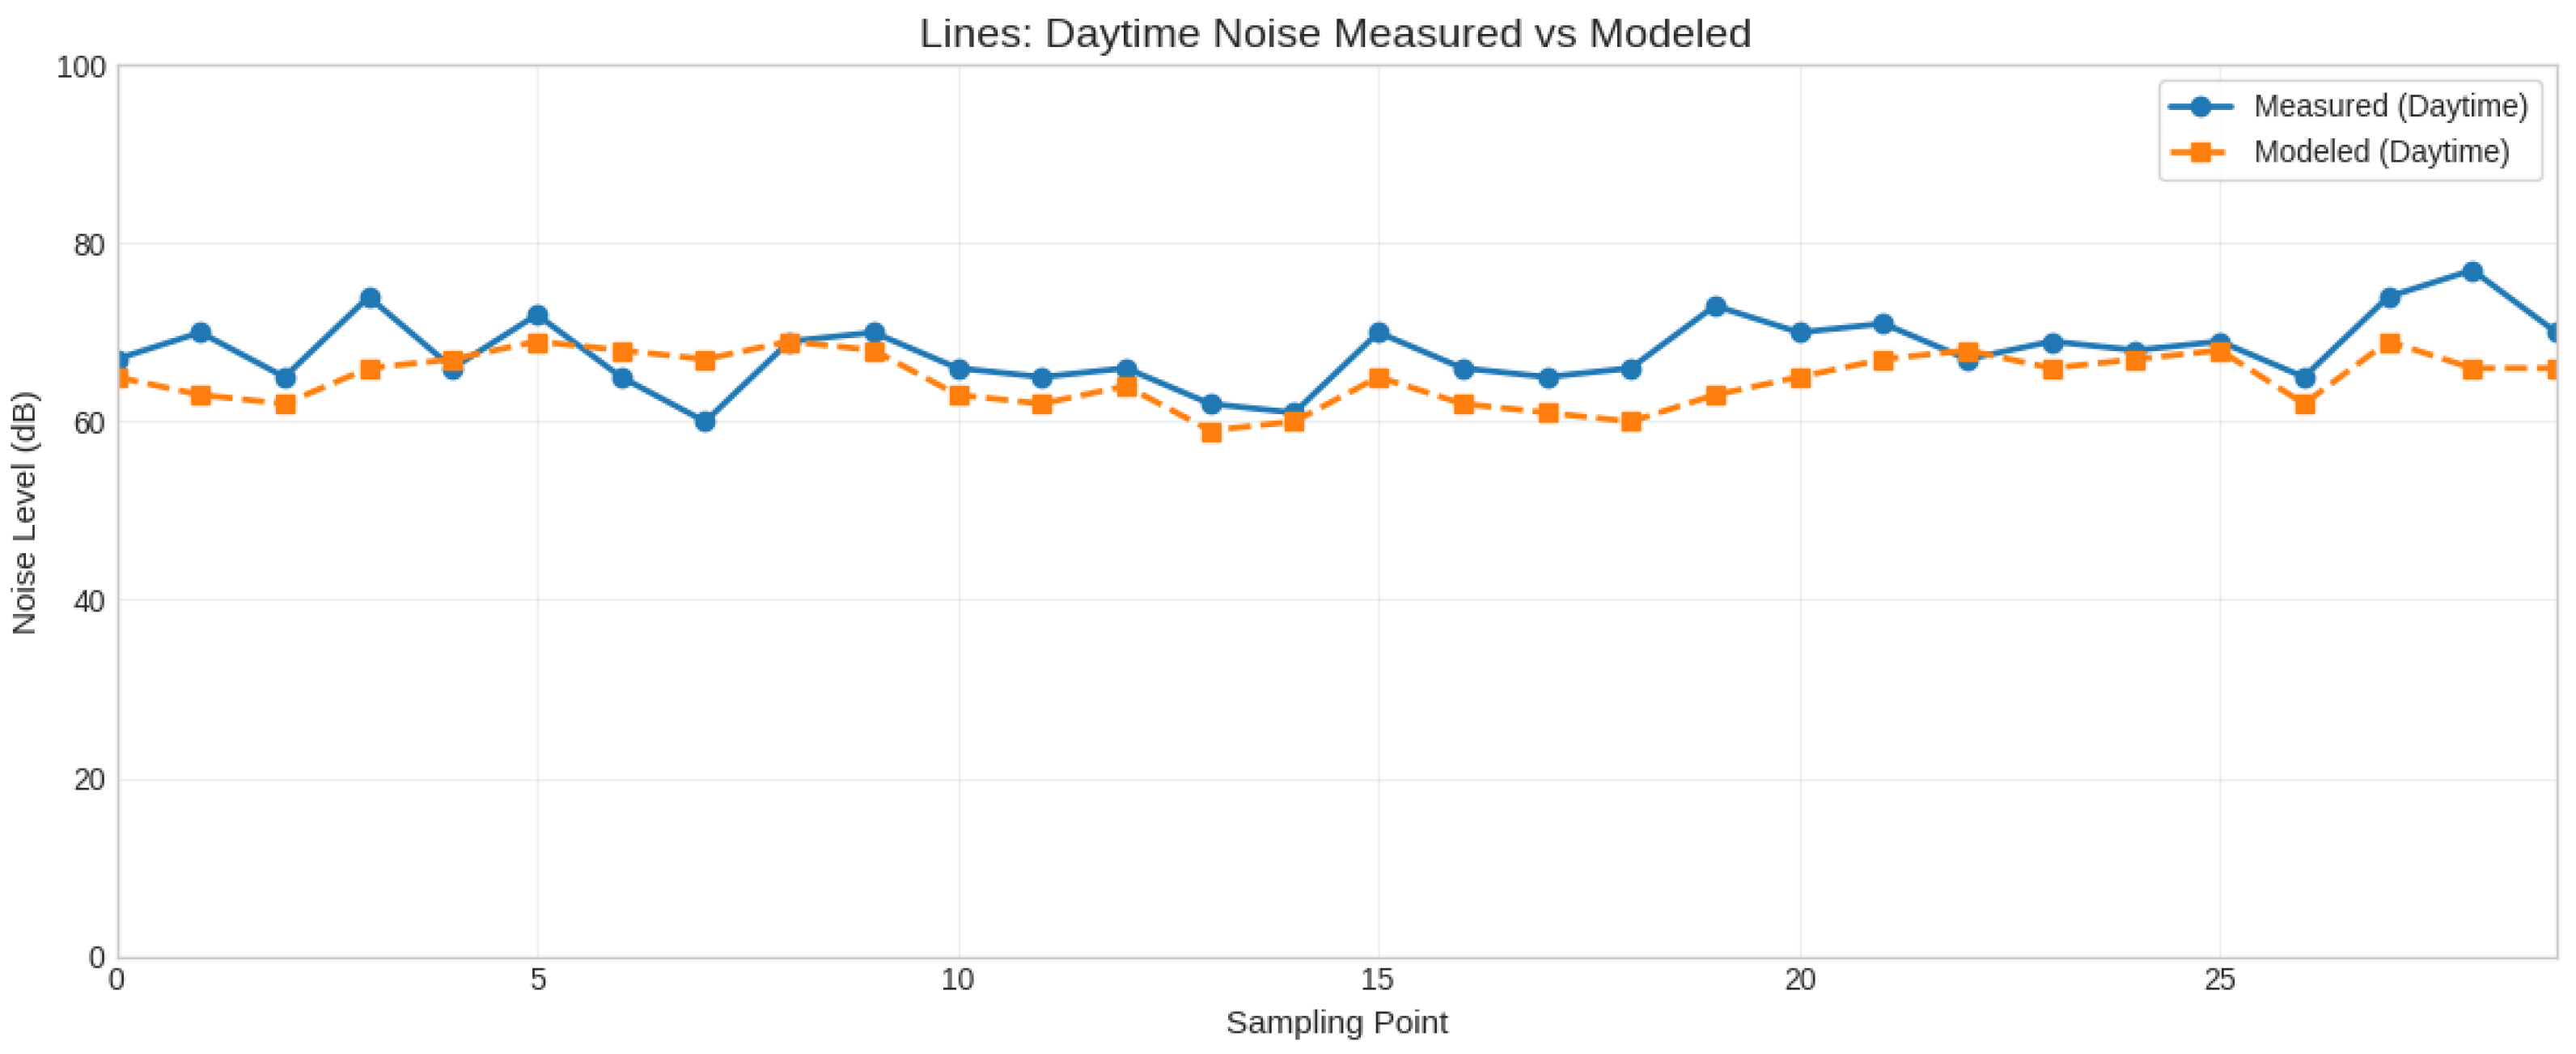
Figure 10.
Measured vs. modelled nocturnal LAeq levels per receiver index in Montelíbano (n = 30). The systematic underestimation is preserved at night, with one outlier at receiver index ≈10 corresponding to a localized non-modelled emitter.
Figure 10.
Measured vs. modelled nocturnal LAeq levels per receiver index in Montelíbano (n = 30). The systematic underestimation is preserved at night, with one outlier at receiver index ≈10 corresponding to a localized non-modelled emitter.
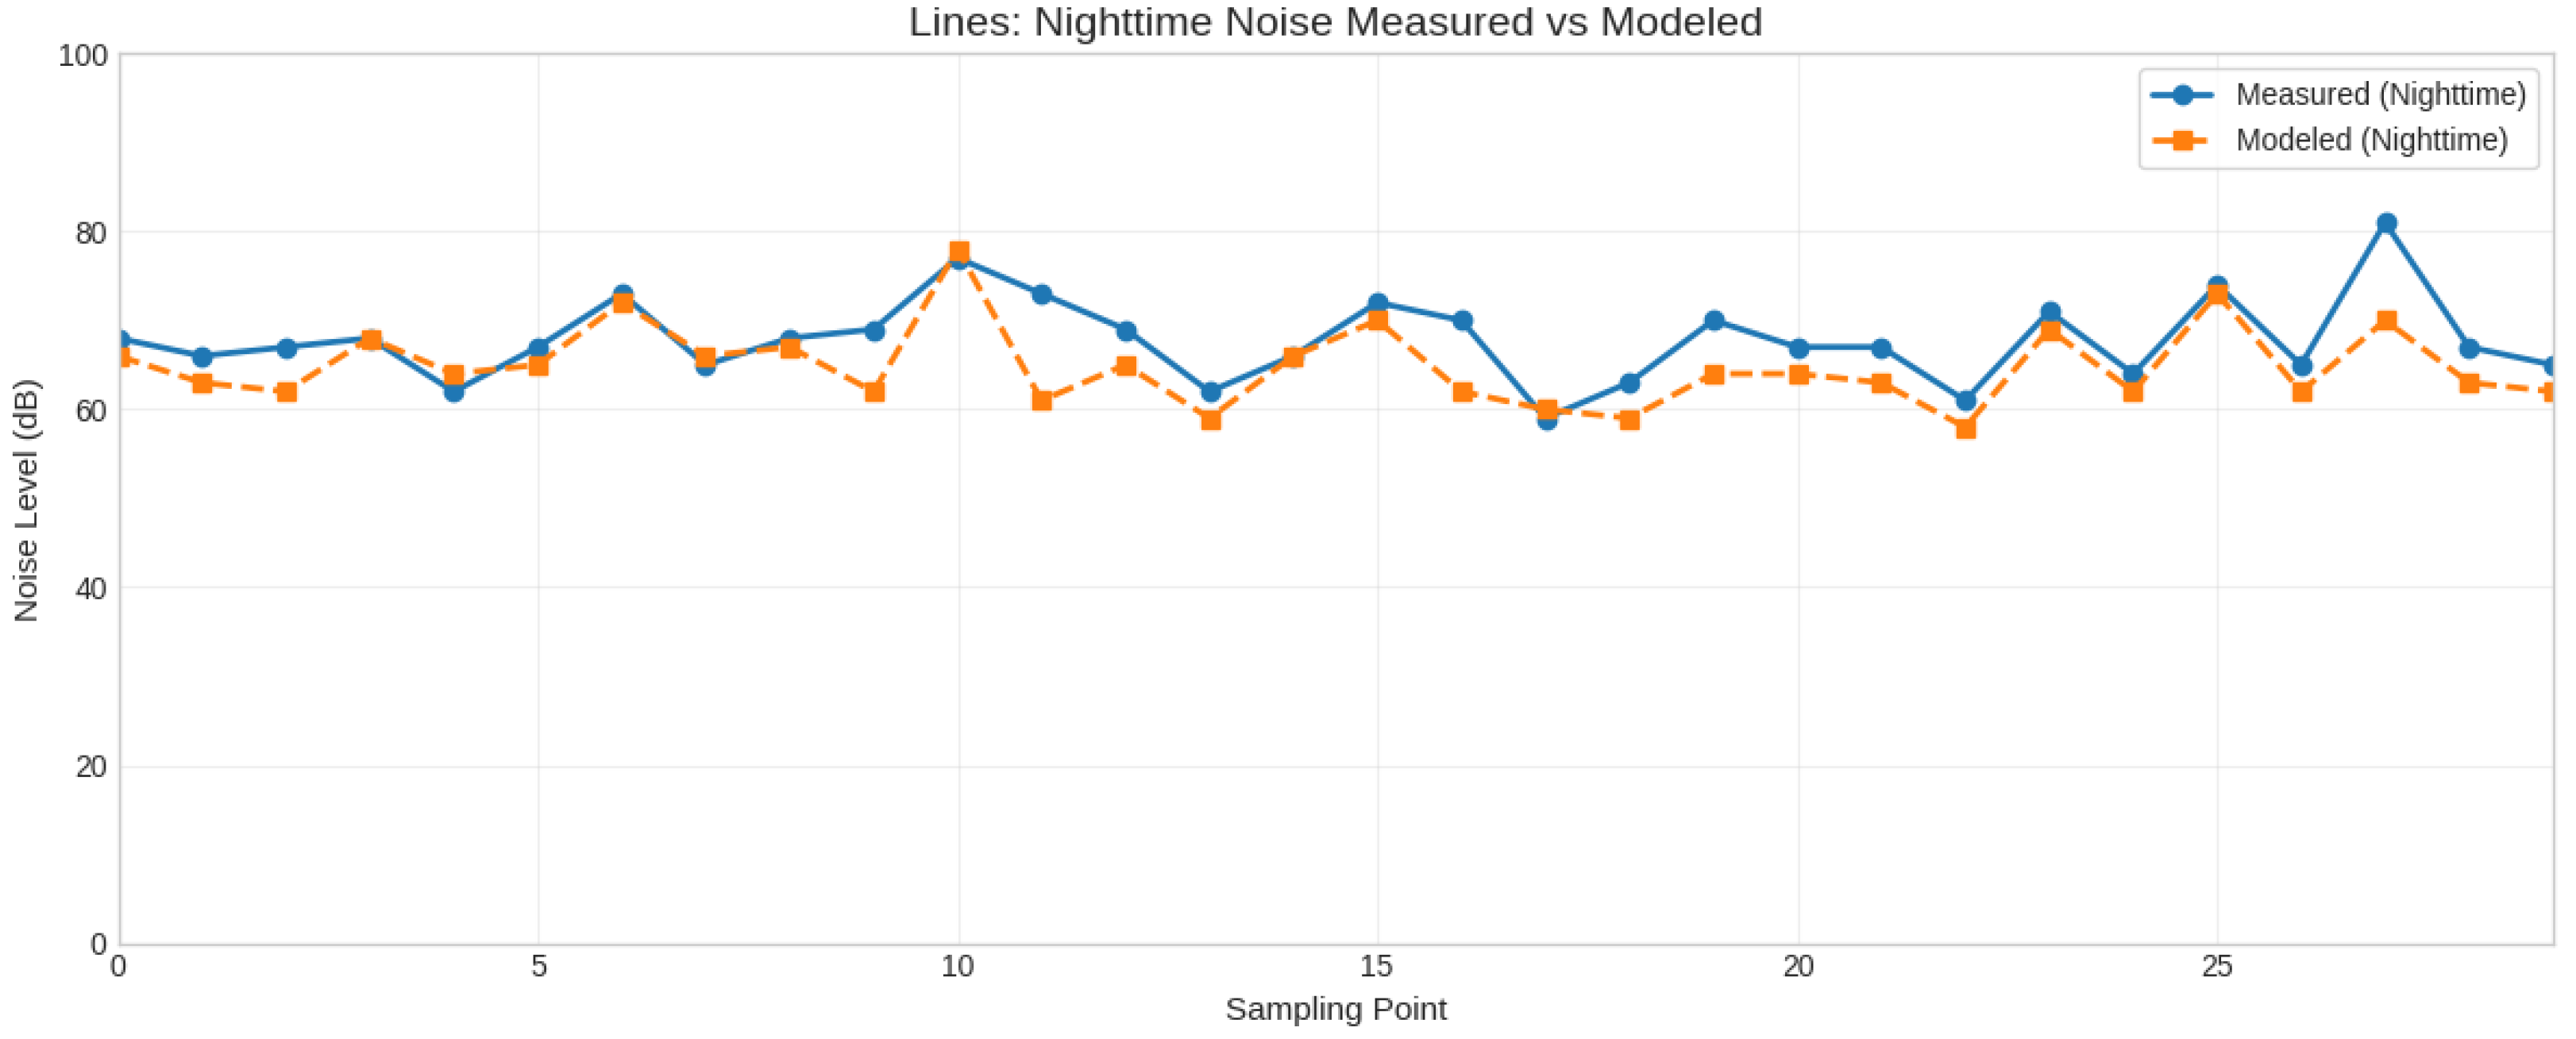
Figure 11.
Measured vs. modelled diurnal LAeq levels per receiver index in Soledad (n = 80). The two series follow a similar trajectory across the urban area; the modelled curve lies systematically below the measured curve in most receivers.
Figure 11.
Measured vs. modelled diurnal LAeq levels per receiver index in Soledad (n = 80). The two series follow a similar trajectory across the urban area; the modelled curve lies systematically below the measured curve in most receivers.
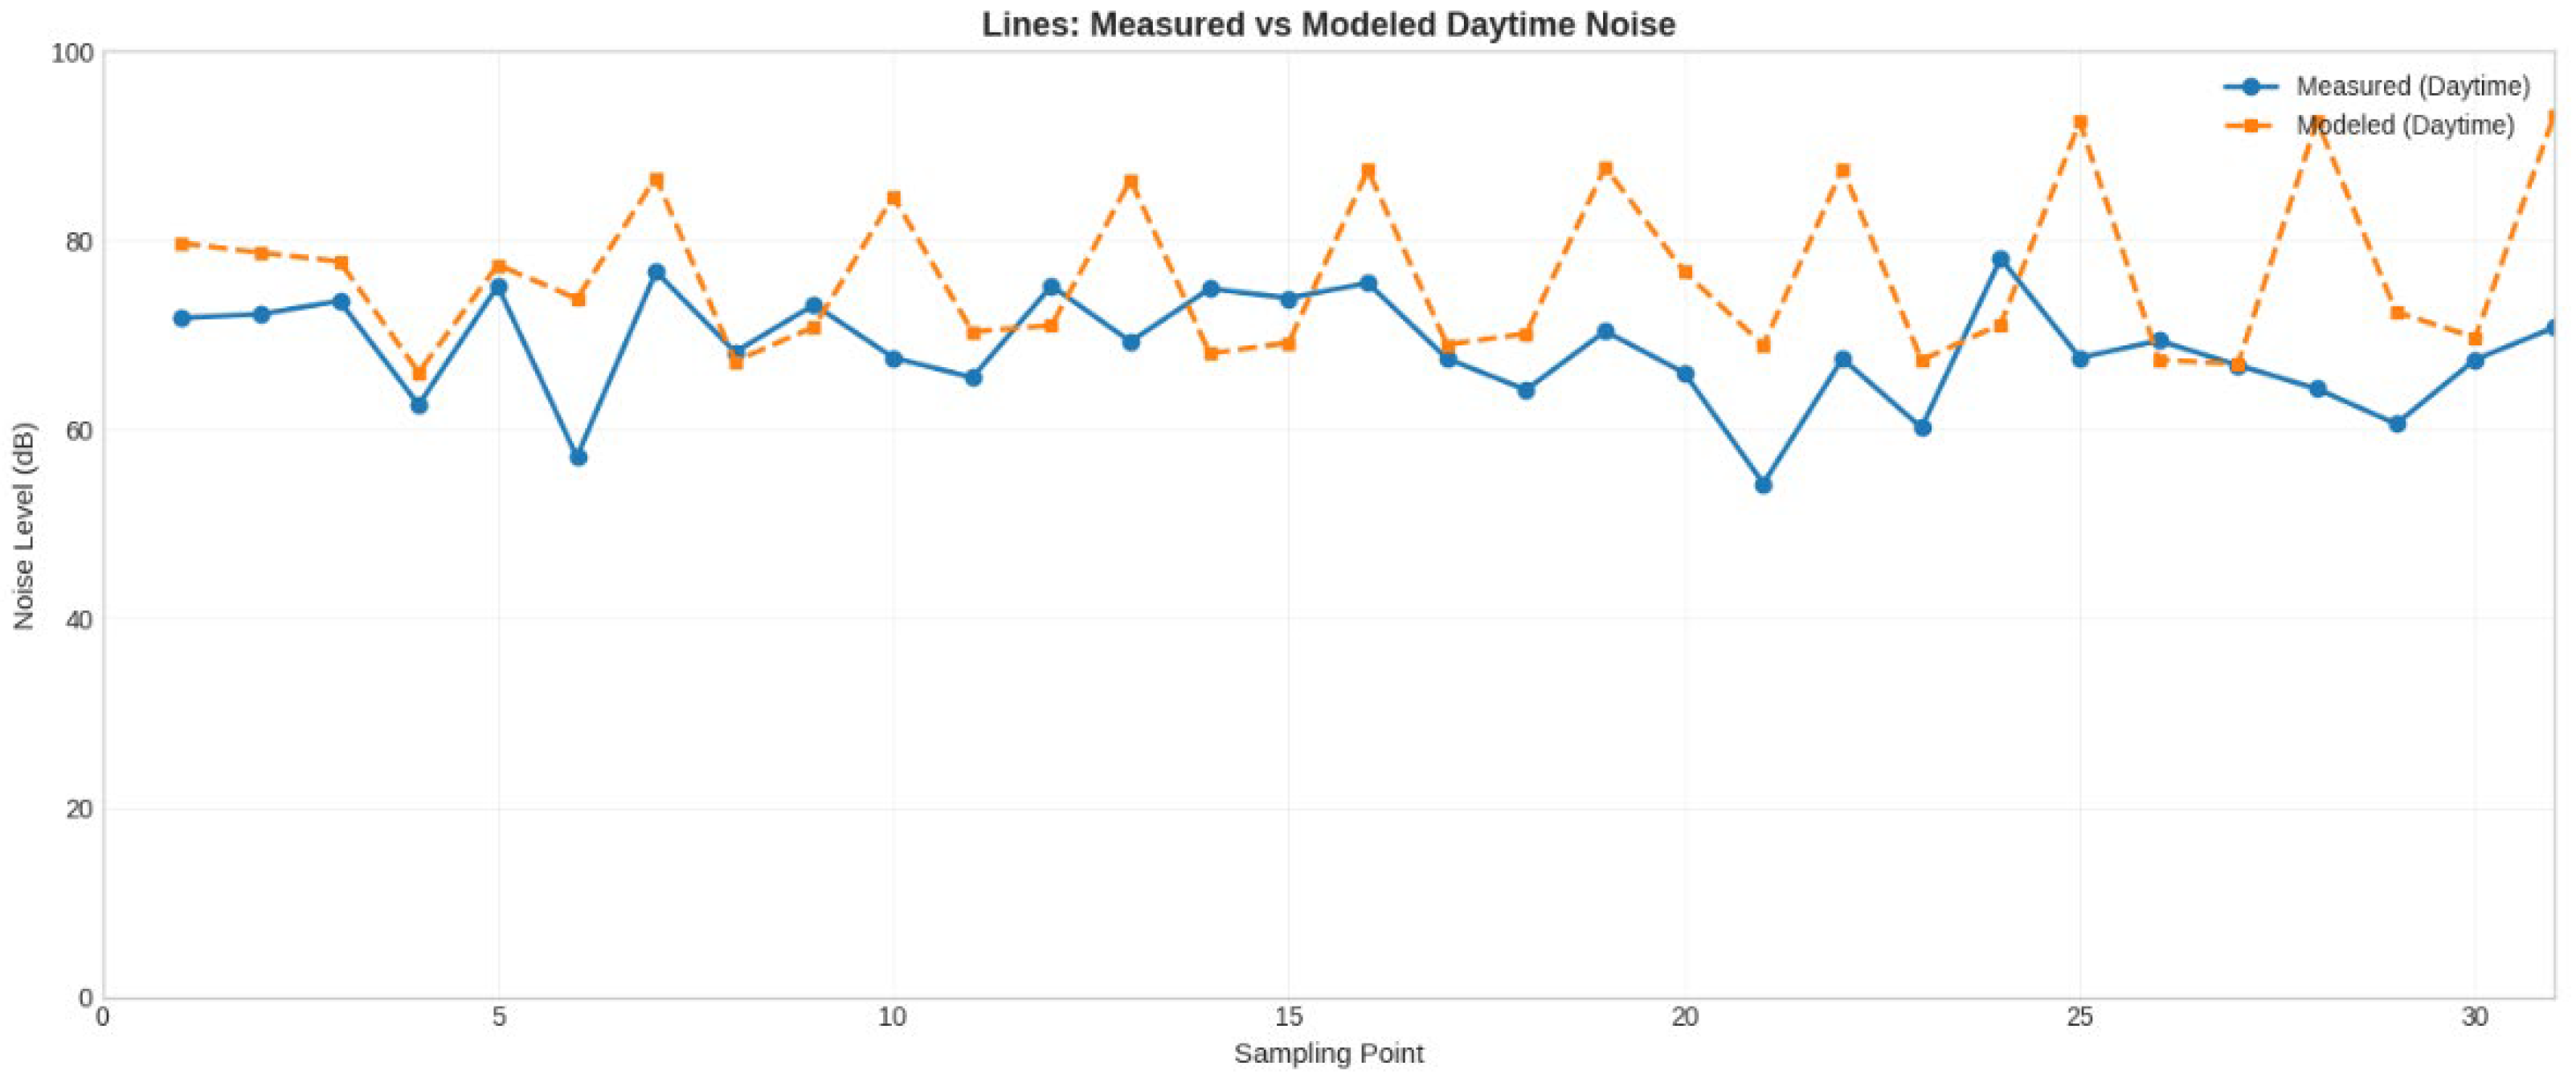
Figure 12.
Measured vs. modelled nocturnal LAeq levels per receiver index in Soledad (n = 80). The systematic underestimation is preserved at night, with consistent negative bias throughout the measurement range.
Figure 12.
Measured vs. modelled nocturnal LAeq levels per receiver index in Soledad (n = 80). The systematic underestimation is preserved at night, with consistent negative bias throughout the measurement range.
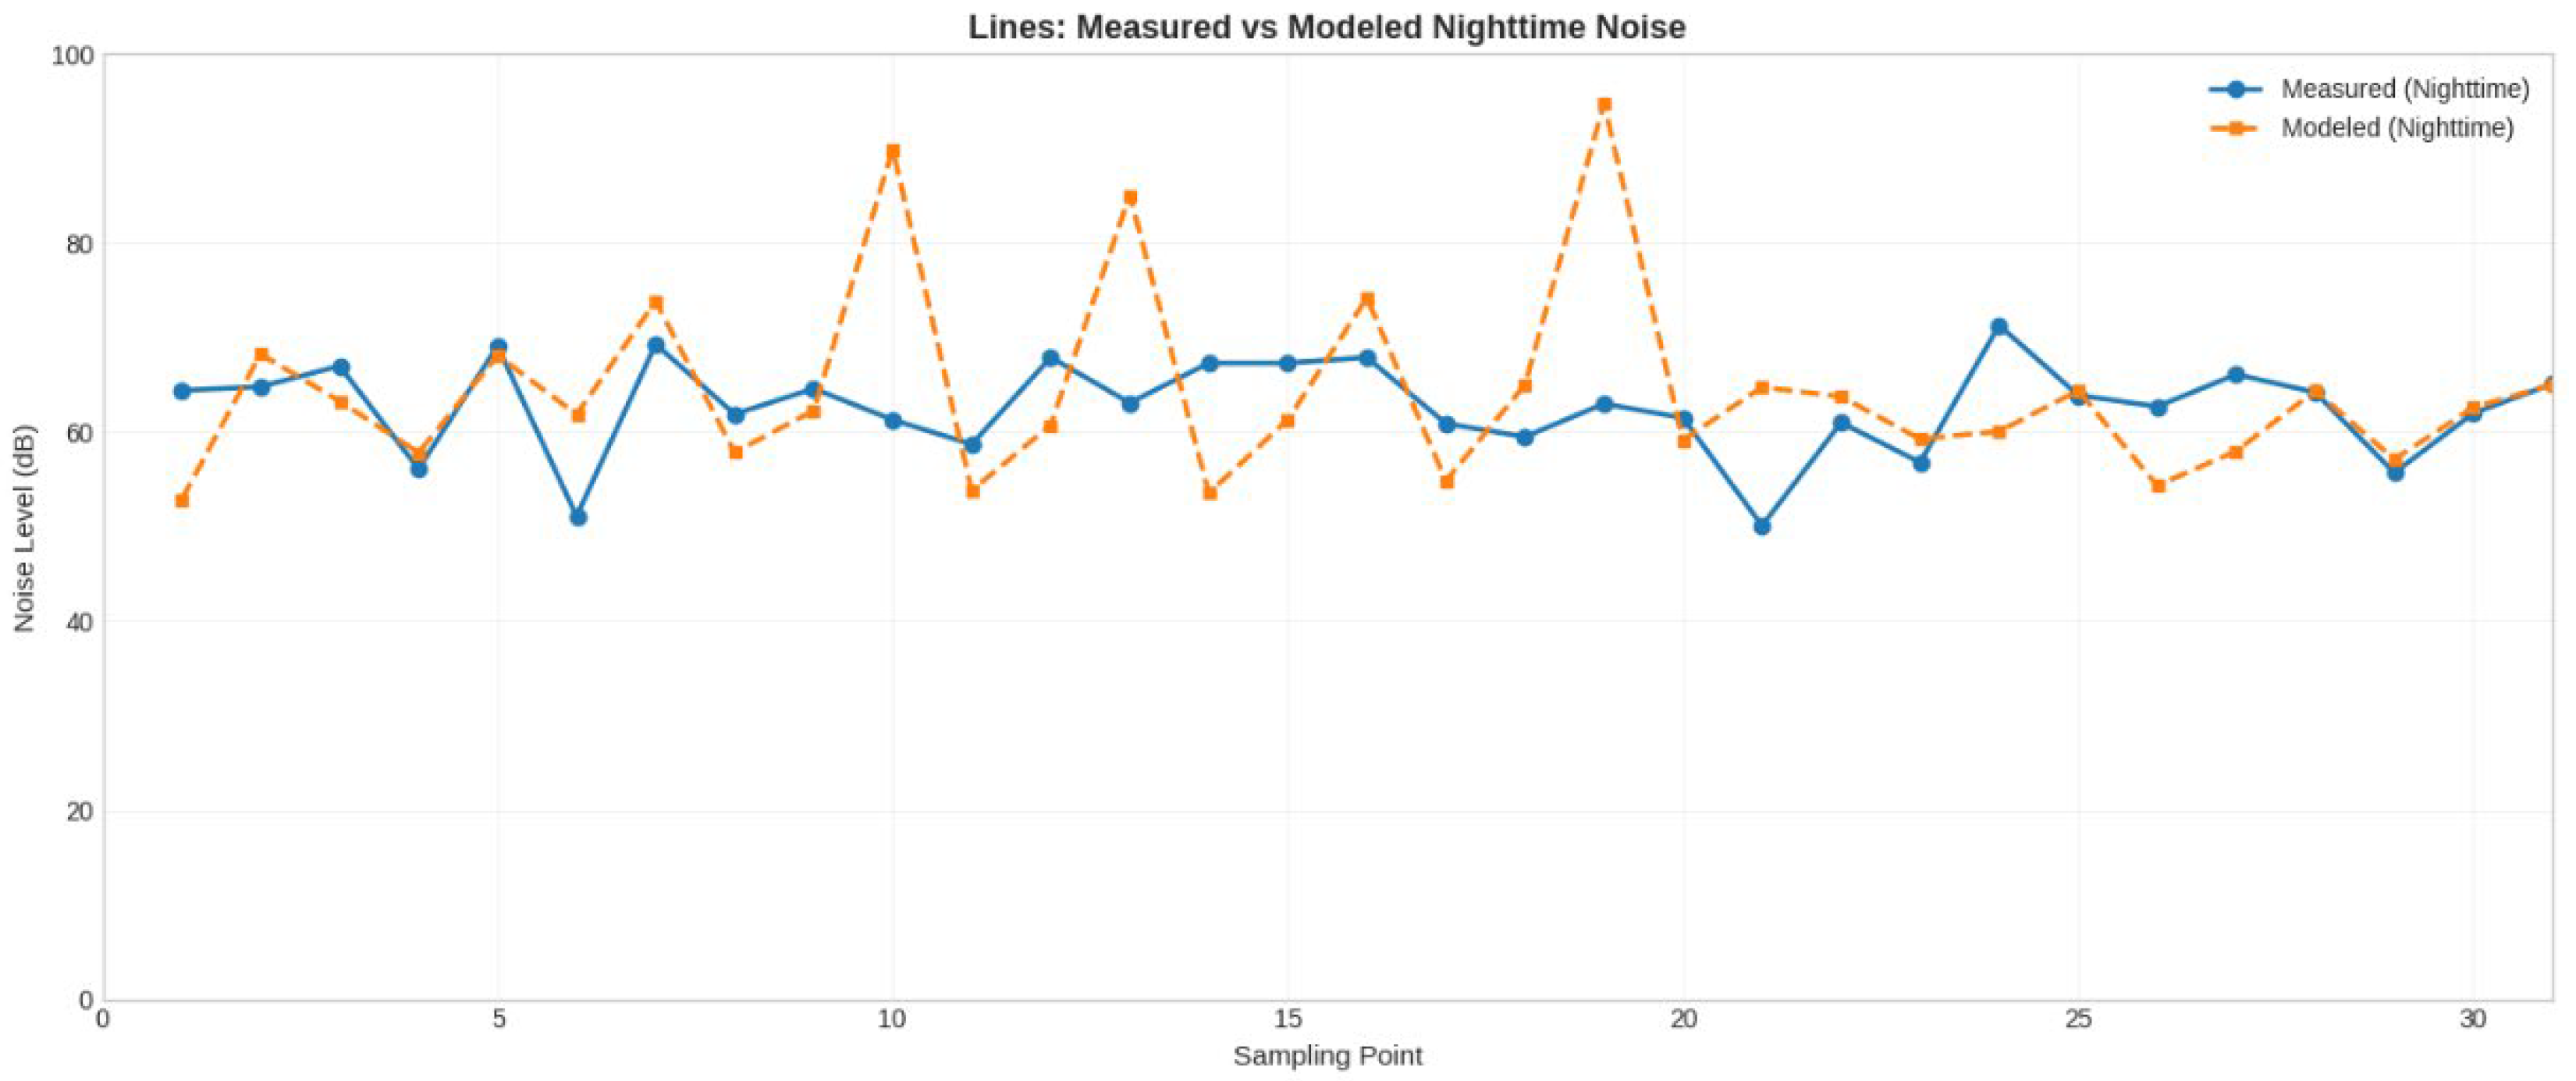

Table 1.
Descriptive statistics of the A-weighted equivalent continuous sound pressure level (LAeq) field-measured at the receiver points in Soledad (n = 80) and Montelíbano (n = 30).
Table 1.
Descriptive statistics of the A-weighted equivalent continuous sound pressure level (LAeq) field-measured at the receiver points in Soledad (n = 80) and Montelíbano (n = 30).
| City | Scenario | n | Mean dB(A) | Median dB(A) | SD dB(A) | Min–Max dB(A) | % Non-compl. |
|---|---|---|---|---|---|---|---|
| Soledad | Working-day Diurnal | 80 | 73.2 | 72.8 | 6.7 | 57.3–92.8 | 83.8% |
| Soledad | Working-day Nocturnal | 80 | 68.1 | — | 9.2 | 47.7–90.9 | 96.2% |
| Montelíbano | Diurnal | 30 | 67.1 | 66.4 | 3.9 | 60.4–76.4 | 60.0% |
| Montelíbano | Nocturnal | 30 | 67.0 | 67.0 | 6.5 | 55.6–83.1 | 100.0% |
Table 2.
Modelled noise levels at healthcare facilities in Soledad and exceedance over the Sector A regulatory limits (55 dB(A) day; 45 dB(A) night). The reading of 98.7 dB(A) recorded at the Salamanca Maternity Hospital during the night is extremely high (exceeding the limit by 53.7 dB) and is due to a one-time event (a siren, an isolated incident) that skewed the measurement.
Table 2.
Modelled noise levels at healthcare facilities in Soledad and exceedance over the Sector A regulatory limits (55 dB(A) day; 45 dB(A) night). The reading of 98.7 dB(A) recorded at the Salamanca Maternity Hospital during the night is extremely high (exceeding the limit by 53.7 dB) and is due to a one-time event (a siren, an isolated incident) that skewed the measurement.
| Healthcare facility | Period | Modelled level dB(A) | Limit dB(A) | Exceedance dB(A) |
|---|---|---|---|---|
| Maternal and Child Hospital Salamanca | Day | 78.5 | 55 | +23.5 |
| Maternal and Child Hospital Salamanca | Night | 98.7 | 45 | +53.7 |
| Maternal and Child Hospital Costa Hermosa | Day | 67.8 | 55 | +12.8 |
| Maternal and Child Hospital Costa Hermosa | Night | 61.6 | 45 | +16.6 |
| Diagonal Salud Total EPS | Day | 70.7 | 55 | +15.7 |
| Diagonal Salud Total EPS | Night | 75.9 | 45 | +30.9 |
| Manuela Beltrán Health Center | Day | 73.0 | 55 | +18.0 |
| Manuela Beltrán Health Center | Night | 67.1 | 45 | +22.1 |
| Maternal and Child Hospital Salamanca | Day | 78.5 | 55 | +23.5 |
Table 3.
Statistics of the model residuals (modelled − measured) for the SoundPLAN dispersion model in Montelíbano and Soledad.
Table 3.
Statistics of the model residuals (modelled − measured) for the SoundPLAN dispersion model in Montelíbano and Soledad.
| Statistic | Montelíbano Diurnal (dB(A)) | Montelíbano Nocturnal (dB(A)) | Soledad Diurnal (dB(A)) | Soledad Nocturnal (dB(A)) | Interpretation |
|---|---|---|---|---|---|
| Mean | −2.72 | −2.92 | +5.78 | +1.43 | Montelíbano shows systematic underestimation; Soledad shows overestimation by day, near-zero bias at night |
| Median | −2.65 | −2.65 | +5.34 | +1.25 | Consistent with mean; Soledad diurnal median well above zero |
| Std. deviation | 3.51 | 3.17 | 8.17 | 8.43 | Soledad shows significantly higher spread, reflecting greater urban complexity |
| P25 | −4.18 | −4.08 | +0.07 | −3.74 | Lower quartile reveals systematic negative bias in Montelíbano; mixed in Soledad |
| P75 | −1.53 | −1.62 | +9.90 | +4.45 | Upper quartile confirms overestimation tendency in Soledad daytime |
| Minimum | −10.50 | −11.60 | −7.79 | −13.75 | Extreme underestimation at isolated receivers in both cities |
| Maximum | +7.00 | +2.70 | +28.34 | +31.77 | Soledad shows extreme overestimation, likely due to unmodelled or intermittent sources |
Table 4.
Comparative summary of acoustic indicators between Soledad (metropolitan-traffic typology) and Montelíbano (mining-industrial typology).
Table 4.
Comparative summary of acoustic indicators between Soledad (metropolitan-traffic typology) and Montelíbano (mining-industrial typology).
| Indicator | Soledad | Montelíbano | Difference / Insight |
|---|---|---|---|
| Population (urban) | ~600,000 | 63,823 | 9.4× more in Soledad |
| Land area (urban) | ~66 km2 | 10.34 km2 | Higher spatial extent in Soledad |
| Receiver points | 80 | 30 | Higher spatial resolution in Soledad |
| Dominant noise source | Traffic + commercial airport | Mining + heavy transport + Twin Otter | Different source typology |
| Mean LAeq diurnal (dB(A)) | 67.7 | 67.1 | +0.6 dB(A) in Soledad; comparable daytime levels |
| Mean LAeq nocturnal (dB(A)) | 61.7 | 67.0 | −5.3 dB(A); Montelíbano noisier at night |
| Day–night ΔLAeq (dB(A)) | −5.9 | −0.1 | Strong day–night contrast in Soledad vs flat profile in Montelíbano |
| % non-compliance day | 83.8% | 60.0% | Higher exceedance in Soledad |
| % non-compliance night | 96.2% | 100.0% | Critical in both cities |
| Spatial pattern | Linear corridors | Centre + radial routes | Topology-dependent noise distribution |
| Mean residual diurnal (dB(A)) | + 5.78 | −2.72 | Soledad overestimates by day; Montelíbano underestimates |
Disclaimer/Publisher’s Note: The statements, opinions and data contained in all publications are solely those of the individual author(s) and contributor(s) and not of MDPI and/or the editor(s). MDPI and/or the editor(s) disclaim responsibility for any injury to people or property resulting from any ideas, methods, instructions or products referred to in the content. |
© 2026 by the authors. Licensee MDPI, Basel, Switzerland. This article is an open access article distributed under the terms and conditions of the Creative Commons Attribution (CC BY) license (http://creativecommons.org/licenses/by/4.0/).
Copyright: This open access article is published under a Creative Commons CC BY 4.0 license, which permit the free download, distribution, and reuse, provided that the author and preprint are cited in any reuse.


