

Submitted:
01 May 2026
Posted:
05 May 2026
You are already at the latest version
Abstract
Background: Patients with type 2 diabetes (T2D) frequently exhibit impaired erythrocyte deformability, which contributes to microvascular dysfunction. We previously reported that imeglimin, a mitochondrial-targeted antidiabetic agent, prolongs erythrocyte lifespan. This study investigated the effects of imeglimin on erythrocyte deformability and its clinical implications in patients with T2D. Methods: This post hoc analysis of the INFINITY study included 25 patients with T2D who completed 6 months of imeglimin treatment (2000 mg/day) followed by a 3-month follow-up. Erythrocyte deformability was evaluated using a microchannel array flow analyzer. Hematological parameters, glycemic markers, and vascular indices, including brachial-ankle pulse wave velocity (baPWV) and toe-brachial index (TBI), were also assessed. Results: Erythrocyte deformability, assessed by 3-month averages, showed an improvement trend at 1–3 months (P = 0.058) and a significant improvement at 4–6 months (P = 0.016) compared with baseline; this effect was reversed after discontinuation. Erythrocyte lifespan significantly increased by 10%–20% during treatment and persisted after discontinuation. Conversely, red blood cell count, hemoglobin, and hematocrit decreased during treatment and recovered post-discontinuation. At 6 months, baPWV increased and TBI decreased, both showing reversibility after treatment cessation. Conclusion: Imeglimin treatment significantly improved erythrocyte deformability in patients with T2D. Although this study did not definitively prove the direct clinical benefits of improved deformability on overall hemorheology or microvascular outcomes, these findings suggest that imeglimin exerts potential pleiotropic effects on circulatory function beyond glycemic control.
Keywords:
imeglimin
; hemorheology
; erythrocyte deformability
; erythrocyte lifespan
; type 2 diabetes
1. Introduction
Type 2 diabetes mellitus (T2D) is characterized by various hemorheological abnormalities, including increased blood viscosity, enhanced erythrocyte aggregation, and impaired erythrocyte deformability[1]. These alterations trigger microvascular dysfunction and play a pivotal role in the development and progression of diabetic complications, such as retinopathy, nephropathy, and neuropathy [2,3].
Erythrocyte deformability is a critical determinant of microcirculatory flow. Since capillary diameters are typically smaller than the resting diameter of an erythrocyte, erythrocytes must undergo substantial deformation to traverse the microvasculature [4]. Consequently, reduced erythrocyte deformability leads to increased flow resistance and diminished tissue perfusion [5]. Previous studies have demonstrated that patients with T2D exhibit impaired erythrocyte deformability compared with healthy individuals, with proposed mechanisms including hyperglycemia, oxidative stress, and alterations in erythrocyte membrane composition [1,6,7].
Imeglimin is a first-in-class oral antidiabetic agent with a novel mechanism of action that improves mitochondrial function [8,9]. It has been reported to increase the expression of nicotinamide phosphoribosyltransferase (NAMPT) in the salvage pathway within pancreatic β-cells, facilitating the conversion of nicotinamide (NAM) to nicotinamide mononucleotide (NMN). Subsequently, NMN is converted to NAD+ by NMN adenylyltransferase (NMNAT), which potentially enhances mitochondrial bioenergetics and insulin secretion [10]. Notably, NMNAT is also expressed in the cytosol of human erythrocytes [11]. In NMNAT-deficient mice, erythrocyte NAD+ concentrations are markedly reduced, and the erythrocyte lifespan is significantly shortened—from approximately 60 days in wild-type mice to about 10 days—accompanied by severe morphological abnormalities [12,13]. In a previous analysis of the INFINITY study, we demonstrated that imeglimin prolongs erythrocyte lifespan, which may result in relatively higher HbA1c levels compared to actual glycemic status [14].
Given these biological effects, imeglimin may directly influence erythrocyte function and hemorheology. However, its specific effects on erythrocyte deformability remain to be fully elucidated. Therefore, the present study aimed to investigate the impact of imeglimin treatment on erythrocyte deformability in patients with T2D using data from the INFINITY study.
2. Materials and Methods
2.1. Study Design
This was a prospective, single-arm, open-label exploratory clinical trial (INFINITY study) conducted at Naka Kinen Clinic, Japan. Participants received imeglimin (TWYMEEG®; 1,000 mg twice daily) for 6 months. A 2-month pre-observation period was used to establish baseline measurements, and a 3-month post-treatment follow-up period was included to assess potential reversibility of any treatment-related changes. During the observation and follow-up periods, no escalation or initiation of additional antidiabetic agents was allowed, except for continuation of stable doses of metformin or α-glucosidase inhibitors [15].
2.2. Participants
Eligible participants were adult patients with T2D who were either untreated or receiving stable therapy with α-glucosidase inhibitors and/or metformin.
A total of 30 patients were initially enrolled; however, one patient withdrew consent, resulting in a full analysis set (FAS) of 29 patients. Of these, four patients were excluded due to treatment discontinuation or poor compliance, yielding a per-protocol set (PPS) of 25 patients [14].
2.3. Measurement of Erythrocyte Deformability
Erythrocyte deformability was assessed using a microchannel array flow analyzer (MC-FAN; Optima Inc., Tokyo, Japan). Heparinized whole blood samples were introduced into the microchannel array, and the passage of blood cells through the channels was recorded under microscopy.
The time required for 100 μL of whole blood to pass through the microchannel array was used as an index of blood fluidity. The blood passage time for each patient was expressed after correction for the passage time of physiological saline. Measurements that could not be completed due to microthrombus formation or other technical factors during the passage of 100 μL of whole blood were assigned a maximum value of 120 seconds [16]. However, the inclusion of such 120-second values across three measurements within a 3-month period may increase data variability. To mitigate the impact of these short-term fluctuations, erythrocyte deformability was evaluated by calculating the mean of the two measurements with the smallest absolute difference within each 3-month interval. The rate of change from baseline was then determined based on these calculated mean values.
2.4. Laboratory Measurements
Fasting blood glucose (FBG), glycated hemoglobin (HbA1c), glycoalbumin (GA), body mass index (BMI), systolic and diastolic blood pressure (SBP and DBP), and pulse rate (PR) were evaluated as absolute values at baseline (0 months), and at 3 and 6 months after initiation of imeglimin treatment, as well as 3 months after treatment discontinuation.
Erythrocyte lifespan was assessed by measuring exhaled carbon monoxide (CO) concentrations using the Carbolizer system (Taiyo Co., Ltd., Osaka, Japan) and was calculated according to the method described by Strocchi et al. [17].
Erythrocyte lifespan (days) = K × hemoglobin (g/mL)/endogenous CO (ppm)
K = 1380 (conversion factor)
Erythrocyte lifespan and other hematological parameters, including red blood cell (RBC) count, and hematocrit, were expressed as percentage changes from baseline based on 3-month interval averages to evaluate temporal trends.
2.5. Vascular Measurements
Arteriosclerotic markers were assessed at baseline (0 months), after 6 months of imeglimin treatment, and at 3 months following treatment discontinuation. Arteriosclerosis was evaluated using brachial-ankle pulse wave velocity (baPWV) and toe-brachial index (TBI), measured with a volume-plethysmographic device (BP-203RPEIII; Omron Healthcare Co., Kyoto, Japan). Measurements of baPWV and TBI were performed by trained clinical technicians in a quiet and temperature-controlled clinical measurement room after the patient rested for >5 min in the supine position [18].
2.6. Statistical Analysis
The primary analysis was performed on the PPS as a sensitivity analysis. Data are presented as the mean ± standard deviation (SD) for 25 patients. Statistical significance of changes from baseline was evaluated using the paired t-test. No adjustments were made for multiple comparisons, and all P-values were treated as nominal. All statistical analyses were conducted using SAS version 9.4 (SAS Institute Inc., Cary, NC, USA). The correlations between the rates of change from baseline in erythrocyte deformability or erythrocyte lifespan and other clinical parameters were analyzed using Pearson’s correlation coefficients and linear regression analysis.
3. Results
3.1. Patient Characteristics and Changes in Laboratory and Clinical Parameters
The analysis included 25 patients (20 males) with T2D who completed 6 months of imeglimin treatment (2000 mg/day) followed by a 3-month post-treatment follow-up period. The mean age of the participants was 63.5 ± 11.4 years. At baseline (0 months), the clinical characteristics were as follows: BMI, 25.4 ± 3.1 kg/m² ; HbA1c, 7.5 ± 0.5%; GA, 18.7 ± 2.3%; SBP, 132.1 ± 15.6 mmHg ; DBP, 82.9 ± 11.5 mmHg ; and PR, 78.1 ± 11.5 beats/min. Regarding vascular indices, the baPWV was 1672.1 ± 412.5 cm/s , and the TBI was 0.835 ± 0.105.
Imeglimin treatment significantly improved glycemic markers in patients with T2D. Compared with baseline (0M), HbA1c decreased 6.9 ± 0.5% at 6 months (P < 0.01), and GA decreased 16.5 ± 1.9% (P < 0.01). FBG also showed a significant reduction during the 6-month treatment period (P < 0.05). After the 3-month discontinuation (9M), all glycemic markers returned to levels similar to baseline. No significant changes were observed in BMI, blood pressure, pulse rate, baPWV or TBI throughout the study.

Table 1.
Time-course of laboratory and clinical parameters.
| Parameter | N | Time (month) after imeglimin administration | |||
|---|---|---|---|---|---|
| 0 | 3 | 6 | 9 | ||
| FBG (mg/dL) | 25 | 146.0 ± 23.6 | 133.6 ± 18.2 * | 134.0 ± 24.3 * | 154.3 ± 35.2 |
| HbA1c (%) | 25 | 7.5 ± 0.5 | 7.0 ± 0.5 ** | 6.9 ± 0.5 ** | 7.6 ± 0.8 |
| GA (%) | 25 | 18.7 ± 2.3 | 17.0 ± 2.5 ** | 16.5 ± 1.9 ** | 18.8 ± 3.1 |
| BMI (kg/m2) | 25 | 25.4 ± 3.1 | 25.3 ± 3.2 | 25.3 ± 3.2 | 25.3 ± 3.0 |
| SBP (mmHg) | 25 | 132.1 ± 15.6 | 128.9 ± 13.4 | 132.7 ± 15.1 | 131.5 ± 12.6 |
| DBP (mmHg) | 25 | 82.9 ± 11.5 | 83.4 ± 12.1 | 82.7 ± 11.1 | 82.8 ± 9.6 |
| PR (beats/min) | 25 | 78.1 ± 11.5 | 78.0 ± 13.1 | 79.2 ± 11.4 | 79.7 ± 13.5 |
| baPWV (cm/s) | 25 | 1672.1 ± 412.5 | – | 1691.3 ± 446.1 | 1650.4± 368.3 |
| TBI | 25 | 0.835 ± 0.105 | – | 0.819 ± 0.107 | 0.847 ± 0.122 |
Data are presented as mean ± SD. 0M represents baseline; 3M and 6M represent points during imeglimin treatment. Nine months (9M) is a 3-month post-treatment follow-up period. – , not measured. * P < 0.05, ** P < 0.01 vs. baseline (0M) by paired t-test.
3.2. Effects on Erythrocyte Deformability
Erythrocyte deformability was evaluated as the time required for 100 μL of heparinized whole blood to pass through the microchannel array. Although initial measurements showed lower values compared to baseline, these differences did not reach statistical significance (Figure 1a). To minimize the impact of random fluctuations and short-term data variability, erythrocyte deformability was assessed using means calculated at fixed 3-month intervals. Using this approach, erythrocyte deformability showed an improvement trend at 1–3 months of imeglimin treatment (P = 0.058) and a significant improvement at 4–6 months (P = 0.016) compared with the pre-treatment period (-2 to 0 months). This effect was reversed after treatment discontinuation, as values returned toward baseline during the 7–9 month follow-up period (Figure 1b).
Representative microscopic images obtained by the MC-FAN system illustrated the functional changes in hemorheology throughout the study. At baseline (0M) and after the 3-month follow-up period (9M), various cellular components, including erythrocytes and potentially leukocytes or platelet aggregates, were observed to be trapped or delayed at the entrance of the microchannel slits, leading to frequent clogging. In contrast, during the imeglimin treatment period (3M and 6M), these cellular components appeared to pass through the slits more smoothly, with a noticeable reduction in microchannel obstruction (Figure 2). These visual observations were consistent with the quantitative improvement in blood passage time.
3.2. Hematological Parameters
Imeglimin treatment exerted distinct effects on erythrocyte dynamics. Evaluation of the percentage change from baseline revealed that erythrocyte deformability (blood passage time) significantly decreased by approximately 10% at 4–6 months, indicating an improvement, before returning to baseline levels after treatment discontinuation (7–9 months) (Figure 3a). In contrast, the erythrocyte lifespan showed a significant prolongation of 10–20% during the treatment period, and this effect persisted throughout the post-treatment follow-up period (7–9 months) (Figure 3b). Conversely, the percentage changes in RBC count, hemoglobin concentration, and hematocrit all showed a slight decrease during imeglimin administration, but recovered to baseline levels after discontinuation (7–9 months) (Figure 3c–e).
3.3. Vascular Indices
To evaluate alterations in vascular function during imeglimin treatment, the percentage changes in baPWV and TBI from baseline were calculated. The baPWV showed a slight increase (approximately 1%) at 6 months of imeglimin administration, but returned to baseline levels at 9 months, following a 3-month post-treatment period (Figure 4a). Similarly, the TBI showed a marginal decrease (approximately 1.4%) at 6 months but recovered toward baseline levels by 9 months (Figure 4b). None of these changes reached statistical significance, and all observations were reversible, returning to baseline values upon treatment cessation.
3.4. Correlation Analyses
To evaluate the relationships between changes in erythrocyte deformability or lifespan and other clinical indices during imeglimin treatment, Pearson’s correlation analysis was performed (Table 2). Regarding the rate of change in erythrocyte deformability, no significant correlations were observed with any of the parameters, including erythrocyte lifespan, vascular indices (baPWV and TBI), hematological indices, or vital signs. In contrast, the rate of change in erythrocyte lifespan showed significant positive correlations with hematological indices, namely RBC count (r = 0.320, P < 0.01), hemoglobin (r = 0.329, P < 0.01), and hematocrit (r = 0.277, P < 0.05).
4. Discussion
This study is the first to demonstrate that imeglimin improves red blood cell deformability in patients with type 2 diabetes mellitus. In addition, imeglimin treatment was associated with a prolongation of red blood cell lifespan, along with reductions in red blood cell count, hemoglobin levels, and hematocrit, suggesting pleiotropic effects on erythrocyte properties and dynamics. In contrast, no statistically significant changes were observed in baPWV or TBI, which are indicators of large-vessel structure and function. However, baPWV and TBI exhibited directional changes during imeglimin treatment—an increase in baPWV and a decrease in TBI—which returned toward baseline after treatment discontinuation. These findings suggest that the observed variations in these indices are unlikely to reflect structural vascular changes, but rather may be influenced by alterations in hemorheology and microcirculatory function.
From a hemorheological perspective, erythrocyte deformability is a major determinant of flow resistance in the microcirculation [19]. Because capillary diameters are smaller than erythrocyte size, a high degree of deformability is required for erythrocytes to efficiently deliver oxygen to tissues [19,20]. In patients with type 2 diabetes mellitus, erythrocyte deformability is known to be impaired due to hyperglycemia, oxidative stress, and alterations in membrane composition, which contribute to the progression of microvascular complications [1,6,7]. In the present study, assessment using a microchannel array flow analyzer (MC-FAN) demonstrated a significant reduction in whole blood passage time following imeglimin treatment, reflecting improved blood fluidity and, consequently, enhanced erythrocyte deformability. This finding is consistent with the microscopic observations (Figure 2), which showed a reduction in microchannel obstruction and clogging. Imeglimin has been reported to improve mitochondrial function and increase intracellular NAD⁺ levels in pancreatic β-cells, the liver, and skeletal muscle [9,10]. Notably, human erythrocytes also possess NMNAT, an enzyme involved in NAD⁺ biosynthesis [11,12]. Therefore, it is plausible that imeglimin enhances intracellular energy metabolism and antioxidant capacity in erythrocytes, thereby contributing to the maintenance or improvement of membrane flexibility.
In the present study, PWV and TBI showed numerical changes in the direction suggestive of vascular deterioration during the treatment period; however, these changes were not statistically significant and returned to baseline levels after treatment discontinuation, indicating reversibility. In general, PWV is a structural and functional indicator of large arteries that depends on arterial wall elasticity and blood pressure, whereas TBI reflects peripheral vascular tone and blood flow distribution. It is now widely recognized that PWV can vary acutely in response to changes in hemodynamic parameters such as blood pressure, heart rate, cardiac output, and peripheral vascular resistance [21,22,23]. In this study, SBP, DBP, and PR remained largely unchanged following imeglimin treatment. Although increases in blood pressure and peripheral resistance are known to elevate PWV [21], the observed changes in PWV in this study could not be explained by such acute hemodynamic alterations. Moreover, the reversible nature of these changes suggests that they do not reflect progression of structural arterial stiffness [24,25]. Experimental studies have also demonstrated a dissociation between PWV and actual arterial wall stiffness [25], indicating that PWV is influenced not only by structural factors but also by functional and dynamic determinants.
Based on these lines of evidence, the transient changes in baPWV and TBI observed in this study are unlikely to reflect structural worsening of arterial stiffness induced by imeglimin, but rather may represent redistribution of blood flow and dynamic circulatory responses associated with alterations in hemorheology. Specifically, improved erythrocyte deformability may reduce microcirculatory resistance and alter local blood flow distribution and shear stress, thereby influencing pressure wave propagation and wave reflection at the level of the macrocirculation [26,27]. Consequently, it is reasonable to interpret that these mechanisms led to the short-term fluctuations observed in PWV and TBI.
Furthermore, reductions in erythrocyte count and hemoglobin concentration may contribute to decreased blood viscosity, thereby influencing vascular resistance [26]. In contrast, the increase in mean corpuscular volume (MCV) [14] and the prolongation of erythrocyte lifespan (Figure 3b, [14]) may reflect improvements in erythrocyte membrane properties and metabolic status [28]. The prolongation of erythrocyte lifespan by imeglimin is further supported by experimental evidence demonstrating anti-hemolytic effects mediated by increased NAD⁺ levels in mouse models [12,13]. An extended erythrocyte lifespan may lead to an increased proportion of older erythrocytes, which could contribute to the observed increase in MCV. In the present study, no significant correlation was observed between the prolongation of erythrocyte lifespan and improvements in erythrocyte deformability (Table 2). This finding may reflect distinct underlying mechanisms, whereby lifespan extension is primarily associated with enhanced NAD⁺ metabolism and cellular survival, whereas improved deformability is related to alterations in the physical properties of the erythrocyte membrane. Additionally, erythrocyte lifespan showed a positive correlation with changes in erythrocyte count, hemoglobin concentration, and hematocrit. In this study, erythrocyte lifespan was estimated based on carbon monoxide (CO) production during erythrocyte degradation, using the formula proposed by Strocchi et al. [17], which incorporates hemoglobin concentration as a coefficient. This methodological aspect likely contributed to the observed positive correlations. Conversely, since hemoglobin levels decreased during imeglimin treatment, it is possible that the prolongation of erythrocyte lifespan was underestimated in this analysis.
Taken together, the present findings suggest that imeglimin primarily exerts its effects on hemorheology and microcirculatory function, with limited short-term impact on structural arterial stiffness in large vessels. These results support the notion that imeglimin may confer pleiotropic vascular protective effects beyond glycemic control. Further studies are warranted to elucidate the underlying mechanisms in greater detail.
This study has several limitations. First, it was a single-arm, single-center study with a relatively small sample size, which limits the generalizability of the findings. Second, the analyses of 3-month averages and erythrocyte deformability were exploratory in nature, and no adjustments for multiple comparisons were performed; therefore, the interpretation of statistical significance should be made with caution. Third, the assessment of hemorheology was limited to whole blood passage time as a surrogate of erythrocyte deformability, and more detailed rheological parameters, such as erythrocyte aggregation and plasma viscosity, were not evaluated. However, clinical studies have reported significant relationship between an increase in the whole blood passage time, which can be measured using MC-FAN, and cardiovascular risk factors or coronary artery disease [29,30,31]. Fourth, the mechanisms underlying the effects of imeglimin on erythrocytes could not be elucidated in this study. Future large-scale and long-term studies integrating these factors are warranted to further clarify the effects of imeglimin on hemorheology and vascular function.
5. Conclusions
Imeglimin treatment in patients with T2D improves erythrocyte deformability and may contribute to enhanced hemorheology. In contrast, the transient changes observed in baPWV and TBI are unlikely to reflect progression of structural arterial stiffness, but rather may represent reversible hemodynamic fluctuations associated with alterations in blood rheological properties. These findings suggest that imeglimin may provide therapeutic benefits beyond glycemic control, potentially contributing to the normalization of microcirculatory function through improvements in blood fluidity.
Author Contributions
Conceptualization, T.O. and M.K.; methodology, M.K.; software, M.K.; validation, T.O. and M.K.; formal analysis, M.K.; investigation, T.O., S.S., M.S., M.H., N. W., N. S. and S.D.; resources, T.O. and S.D.; data curation, K.O. and M.K.; writing—original draft preparation, M.K.; writing—review and editing, T.O.; visualization, M.K.; supervision, T.O.; project administration, M.K.; funding acquisition, T.O. All authors have read and agreed to the published version of the manuscript.
Funding
This study is funded by Sumitomo Pharma Co., Ltd, the manufacturer of imeglimin. The funders have no role in the study design, data collection, and analysis, decision to publish, or manuscript preparation.
Institutional Review Board Statement
The study was conducted in accordance with the Declaration of Helsinki and the Clinical Research Act of Japan. The trial was approved by the Certified Review Boards of Toho University (protocol code THU22002 and date of approval Nov 21, 2022) and later Saitama Medical University. The study protocol was registered in the Japan Registry of Clinical Trials (jRCTs031220489).
Informed Consent Statement
Informed consent was obtained from all subjects involved in the study. Specifically, the study physicians provided comprehensive explanations using written information and consent forms, and obtained voluntary written informed consent from all participants prior to their enrollment.
Data Availability Statement
The data supporting the findings of this study are available from the corresponding author upon reasonable request. Due to ethical restrictions and participant confidentiality, access to the data may be limited and will be provided in accordance with institutional guidelines and applicable data-sharing policies.
Acknowledgments
The authors wish to thank Akiko Haginoya and Misato Kojima for their technical assistance, Mari Sasaki and Yui Ito for their assistance with the research, Masaki Ito for his help with data collection, and all the physicians and staff members of the Naka Kinen Clinic.
Conflicts of Interest
T. Osonoi received research funding from Novo Nordisk Pharma Ltd., Takeda Pharmaceutical Co., Ltd., Ono Pharmaceutical Co., Ltd., Otsuka Pharmaceutical Co., Ltd., Eli Lilly Japan K.K., Bayer Yakuhin, Ltd., Kowa Pharmaceutical Co., Ltd., Fuji Yakuhin Co., Ltd., Mochida Pharmaceutical Co. Ltd., Sumitomo Pharma Co. Ltd., Hakubaku Co., Ltd., and Gilead Sciences, and honoraria for lectures from Novo Nordisk Pharma Co., Ltd., and Sumitomo Pharma Co. Ltd.. S. Shirabe received honoraria for lectures from Eli Lilly Japan K.K. The remaining authors declare that the research was conducted in the absence of any commercial or financial relationships that could be construed as a potential conflict of interest.
Abbreviations
The following abbreviations are used in this manuscript:
| baPWV | Brachial-ankle pulse wave velocity |
| BMI | Body mass index |
| CO | Carbon monoxide |
| DBP | Diastolic blood pressure |
| FAS | Full analysis set |
| FBG | Fasting blood glucose |
| GA | Glycoalbumin |
| HbA1c | Hemoglobin A1c |
| MCV | Mean corpuscular volume |
| NAM | Nicotinamide |
| NAMPT | Nicotinamide phosphoribosyltransferase |
| NMN | Nicotinamide mononucleotide |
| NMNAT | Nicotinamide mononucleotide adenylyltransferase |
| PPS | Per-protocol set |
| PR | Pulse rate |
| RBC | Red blood cell |
| SBP | Systolic blood pressure |
| SD | Standard deviation |
| T2D | Type 2 diabetes |
| TBI | Toe-brachial index |
References
- Shin, S.; Ku, Y.; Babu, N.; Singh, M. Erythrocyte deformability and its variation in diabetes mellitus. Indian J. Exp. Biol. 2007, 45, 121–128. [Google Scholar]
- Velcheva, I.; Damianov, P.; Antonova, N.; Stoyneva, Z.; Mantarova, S.; Dimitrova, V. Hemorheology and vascular reactivity in patients with diabetes mellitus type 2. Clin. Hemorheol. Microcirc. 2011, 49, 505–511. [Google Scholar] [CrossRef]
- Antonova, N.; Velcheva, I.; Paskova, V. Hemorheological and microvascular disturbances in patients with type 2 diabetes mellitus. Clin. Hemorheol. Microcirc. 2022, 81, 325–341. [Google Scholar] [CrossRef]
- Baskurt, O.K.; Meiselman, H.J. Blood rheology and hemodynamics. Semin. Thromb. Hemost. 2003, 29, 435–450. [Google Scholar] [CrossRef]
- Ebrahimi, S.; Bagchi, P. A computational study of red blood cell deformability effect on hemodynamic alteration in capillary vessel networks. Sci. Rep. 2022, 12, 4304. [Google Scholar] [CrossRef] [PubMed]
- Turpin, C.; Catan, A.; Guerin-Dubourg, A.; Debussche, X.; Bravo, S.B.; Álvarez, E.; Van Den Elsen, J.; Meilhac, O.; Rondeau, P.; Bourdon, E. Enhanced oxidative stress and damage in glycated erythrocytes. PLoS ONE 2020, 15, e0235335. [Google Scholar] [CrossRef] [PubMed]
- Pitocco, D.; Hatem, D.; Riente, A.; Giulio, M.M.; Rizzi, A.; Abeltino, A.; Serantoni, C.; Tartaglione, L.; Rizzo, E.; Paoli, L.L.; et al. Evaluating Red Blood Cells' Membrane Fluidity in Diabetes: Insights, Mechanisms, and Future Aspects. Diabetes Metab. Res. Rev. 2025, 41, e70011. [Google Scholar] [CrossRef] [PubMed]
- Theurey, P.; Vial, G.; Fontaine, E.; Monternier, P.A.; Fouqueray, P.; Bolze, S.; Moller, D.E.; Hallakou-Bozec, S. Reduced lactic acidosis risk with imeglimin: Comparison with metformin. Physiol. Rep. 2022, 10, e15151. [Google Scholar] [CrossRef] [PubMed]
- Hallakou-Bozec, S.; Vial, G.; Kergoat, M.; Fouqueray, P.; Bolze, S.; Borel, A.L.; Fontaine, E.; Moller, D.E. Mechanism of action of imeglimin: A novel therapeutic agent for type 2 diabetes. Diabetes Obes. Metab. 2021, 23, 664–673. [Google Scholar] [CrossRef]
- Hallakou-Bozec, S.; Kergoat, M.; Fouqueray, P.; Bolze, S.; Moller, D.E. Imeglimin amplifies glucose-stimulated insulin release from diabetic islets via a distinct mechanism of action. PLoS ONE 2021, 16, e0241651. [Google Scholar] [CrossRef]
- Stefano, M.D.; Galassi, L.; Magni, G. Unique expression pattern of human nicotinamide mononucleotide adenylyltransferase isozymes in red blood cells. Blood Cells Mol. Dis. 2010, 45, 33–39. [Google Scholar] [CrossRef]
- Hikosaka, K.; Ikutani, M.; Shito, M.; Kazuma, K.; Gulshan, M.; Nagai, Y.; Takatsu, K.; Konno, K.; Tobe, K.; Kanno, H.; et al. Deficiency of nicotinamide mononucleotide adenylyltransferase 3 (nmnat3) causes hemolytic anemia by altering the glycolytic flow in mature erythrocytes. J. Biol. Chem. 2014, 289, 14796–14811. [Google Scholar] [CrossRef]
- Yaku, K.; Okabe, K.; Gulshan, M.; Takatsu, K.; Okamoto, H.; Nakagawa, T. Metabolism and biochemical properties of nicotinamide adenine dinucleotide (NAD) analogs, nicotinamide guanine dinucleotide (NGD) and nicotinamide hypoxanthine dinucleotide (NHD). Sci. Rep. 2019, 9, 13102. [Google Scholar] [CrossRef]
- Osonoi, T.; Shirabe, S.; Saito, M.; Hosoya, M.; Watahiki, N.; Shiozawa, N.; Douguchi, S.; Ofuchi, K.; Katoh, M. Imeglimin may affect hemoglobin A1c accuracy via prolongation of erythrocyte lifespan in patients with type 2 diabetes mellitus: insights from the INFINITY clinical trial. Front. Endocrinol. 2025, 16, 1699591. [Google Scholar] [CrossRef]
- Osonoi, T.; Shirabe, S.; Saito, M.; Hosoya, M.; Douguchi, S.; Ofuchi, K.; Katoh, M. Comparative evaluation of clinical glycemic control markers treated with imeglimin and its effect on erythrocytes in patients with type 2 diabetes mellitus: study protocol of a single-arm, open-label, prospective, exploratory trial. Front. Pharmacol. 2023, 14, 1205021. [Google Scholar] [CrossRef] [PubMed]
- Shimada, S.; Hasegawa, K.; Wada, H.; Terashima, S.; Satoh-Asahara, N.; Yamakage, H.; Kitaoka, S.; Akao, M.; Shimatsu, A.; Takahashi, Y. High blood viscosity is closely associated with cigarette smoking and markedly reduced by smoking cessation. Circ. J. 2011, 75, 185–189. [Google Scholar] [CrossRef] [PubMed]
- Strocchi, A.; Schwartz, S.; Ellefson, M.; Engel, R.R.; Medina, A.; Levitt, M.D. A simple carbon monoxide breath test to estimate erythrocyte turnover. J. Lab. Clin. Med. 1992, 120, 392–399. [Google Scholar]
- Yamashina, A.; Tomiyama, H.; Takeda, K.; Tsuda, H.; Arai, T.; Hirose, K.; Koji, Y.; Hori, S.; Yamamoto, Y. Validity, reproducibility, and clinical significance of noninvasive brachial-ankle pulse wave velocity measurement. Hypertens. Res. 2002, 25, 359–364. [Google Scholar] [CrossRef]
- Barshtein, G.; Gural, A.; Arbell, D.; Barkan, R.; Livshits, L.; Pajic-Lijakovic, I.; Yedgar, S. Red Blood Cell Deformability Is Expressed by a Set of Interrelated Membrane Proteins. Int. J. Mol. Sci. 2023, 24, 12755. [Google Scholar] [CrossRef]
- Barshtein, G.; Ben-Ami, R.; Yedgar, S. Role of red blood cell flow behavior in hemodynamics and hemostasis. Expert Rev. Cardiovasc. Ther. 2007, 5, 743–752. [Google Scholar] [CrossRef] [PubMed]
- Obata, Y.; Mizogami, M.; Singh, S.; Nyhan, D.; Berkowitz, D.E.; Steppan, J.; Barodka, V. The Effects of Hemodynamic Changes on Pulse Wave Velocity in Cardiothoracic Surgical Patients. Biomed. Res. Int. 2016, 2016, 9640457. [Google Scholar] [CrossRef]
- Park, H.J.; Rho, T.H.; Park, C.S.; Jang, S.W.; Shin, W.S.; Oh, Y.S.; Lee, M.Y.; Cho, E.J.; Seung, K.B.; Kim, J.H.; et al. The relationship between the acute changes of the systolic blood pressure and the brachial-ankle pulse wave velocity. Korean J. Intern. Med. 2007, 22, 147–151. [Google Scholar] [CrossRef]
- Xiao, H.; Butlin, M.; Tan, I.; Avolio, A. Effects of cardiac timing and peripheral resistance on measurement of pulse wave velocity for assessment of arterial stiffness. Sci. Rep. 2017, 7, 5990. [Google Scholar] [CrossRef]
- Faconti, L.; Farukh, B.; McNally, R.; Webb, A.; Chowienczyk, P. Arterial Stiffness Can Be Modulated by Pressure-Independent Mechanisms in Hypertension. J. Am. Heart Assoc. 2019, 8, e012601. [Google Scholar] [CrossRef]
- McCallinhart, P.E.; Lee, Y.U.; Lee, A.; Anghelescu, M.; Tonniges, J.R.; Calomeni, E.; Agarwal, G.; Lincoln, J.; Trask, A.J. Dissociation of pulse wave velocity and aortic wall stiffness in diabetic db/db mice: The influence of blood pressure. Front. Physiol. 2023, 14, 1154454. [Google Scholar] [CrossRef]
- Baskurt, O.K.; Meiselman, H.J. Blood rheology and hemodynamics. Semin. Thromb. Hemost. 2003, 29, 435–450. [Google Scholar] [CrossRef]
- Secomb, T.W. Mechanics of blood flow in the microcirculation. Symp. Soc. Exp. Biol. 1995, 49, 305–321. [Google Scholar] [PubMed]
- von Tempelhoff, G.F.; Schelkunov, O.; Demirhan, A.; Tsikouras, P.; Rath, W.; Velten, E.; Csorba, R. Correlation between blood rheological properties and red blood cell indices (MCH, MCV, MCHC) in healthy women. Clin. Hemorheol. Microcirc. 2016, 62, 45–54. [Google Scholar] [CrossRef] [PubMed]
- Satoh, N.; Kotani, K.; Wada, H.; Himeno, A.; Shimada, S.; Sasaki, Y.; Yamada, K.; Shimatsu, A.; Hasegawa, K. Unfavorable blood rheology is closely associated with arterial stiffness in obese patients. Endocr. J. 2009, 56, 915–918. [Google Scholar] [CrossRef] [PubMed]
- Hitsumoto, T. Factors affecting impairment of blood rhe-ology in obese subjects. J. Cardiol. 2012, 60, 401–406. [Google Scholar] [CrossRef]
- Matsuo, K.; Ueda, Y.; Nishio, M.; Hirata, A.; Asai, M.; Nemoto, T.; Kashiwase, K.; Kodama, K. Thrombogenic potential of whole blood is higher in patients with acute coronary syndrome than in patients with stable coronary diseases. Thromb. Res. 2011, 128, 268–273. [Google Scholar] [CrossRef]
Figure 1.
Effects of imeglimin on erythrocyte deformability. Data are presented as mean ± SD. (a) Chronological changes in erythrocyte deformability measured as blood passage time (sec/100 μL). The green bar represents the 6-month imeglimin treatment period.; (b) Comparison of erythrocyte deformability using 3-month interval averages to mitigate data variability. A significant improvement compared to baseline (-2M to 0M) was observed during the 4–6 month treatment period (P = 0.016).
Figure 1.
Effects of imeglimin on erythrocyte deformability. Data are presented as mean ± SD. (a) Chronological changes in erythrocyte deformability measured as blood passage time (sec/100 μL). The green bar represents the 6-month imeglimin treatment period.; (b) Comparison of erythrocyte deformability using 3-month interval averages to mitigate data variability. A significant improvement compared to baseline (-2M to 0M) was observed during the 4–6 month treatment period (P = 0.016).
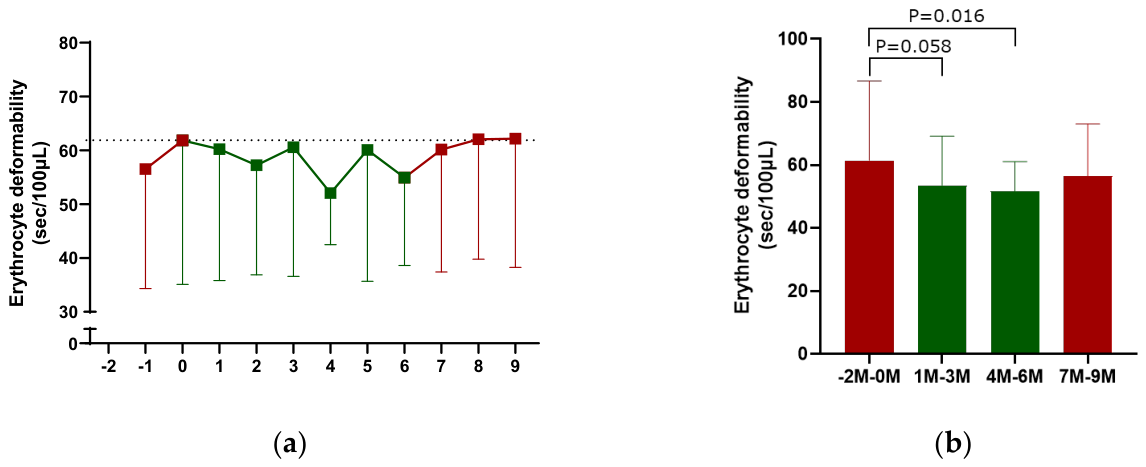
Figure 2.
Representative microscopic images of blood flow in the microchannel array. These images capture the passage of blood cells through the microchannel slits (7-µm wide, 30-µm long, and 4.5-µm deep) at baseline (0M), during imeglimin treatment (3M and 6M), and after the follow-up period (9M). At 0M and 9M, various cellular components, including erythrocytes, are caught at the slit inlets, reflecting impaired deformability and increased rheological resistance. Conversely, at 3M and 6M, imeglimin treatment appears to facilitate smoother transit of these cellular components through the channels, significantly reducing the occurrence of clogging.
Figure 2.
Representative microscopic images of blood flow in the microchannel array. These images capture the passage of blood cells through the microchannel slits (7-µm wide, 30-µm long, and 4.5-µm deep) at baseline (0M), during imeglimin treatment (3M and 6M), and after the follow-up period (9M). At 0M and 9M, various cellular components, including erythrocytes, are caught at the slit inlets, reflecting impaired deformability and increased rheological resistance. Conversely, at 3M and 6M, imeglimin treatment appears to facilitate smoother transit of these cellular components through the channels, significantly reducing the occurrence of clogging.
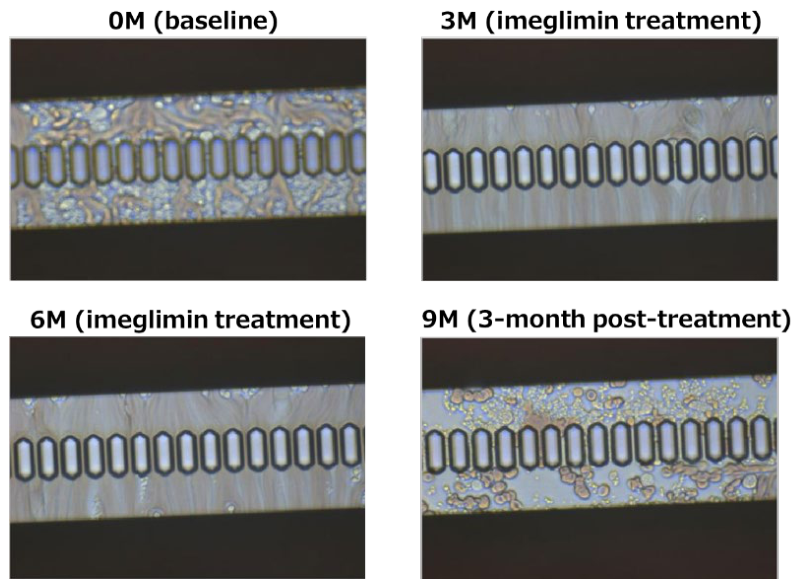
Figure 3.
Percentage changes in erythrocyte parameters and hematological indices from baseline. Data are presented as mean percentage change ± SD relative to baseline (0M) for 25 patients. The green bar indicates the 6-month imeglimin treatment period. (a) Erythrocyte deformability: Blood passage time significantly decreased by approximately 10% during the 4–6 month period, reflecting improved deformability. (b) Erythrocyte lifespan: Lifespan significantly increased by 10–20% during treatment and remained elevated during the follow-up period (7–9M). (c–e) Hematological indices: Percentage changes in RBC count (c), hemoglobin (d), and hematocrit (e). These parameters showed a slight, transient decrease during treatment but returned to baseline levels at 9M. * P < 0.05, ** P < 0.01 vs. baseline (-2M-0M) by paired t-test.
Figure 3.
Percentage changes in erythrocyte parameters and hematological indices from baseline. Data are presented as mean percentage change ± SD relative to baseline (0M) for 25 patients. The green bar indicates the 6-month imeglimin treatment period. (a) Erythrocyte deformability: Blood passage time significantly decreased by approximately 10% during the 4–6 month period, reflecting improved deformability. (b) Erythrocyte lifespan: Lifespan significantly increased by 10–20% during treatment and remained elevated during the follow-up period (7–9M). (c–e) Hematological indices: Percentage changes in RBC count (c), hemoglobin (d), and hematocrit (e). These parameters showed a slight, transient decrease during treatment but returned to baseline levels at 9M. * P < 0.05, ** P < 0.01 vs. baseline (-2M-0M) by paired t-test.
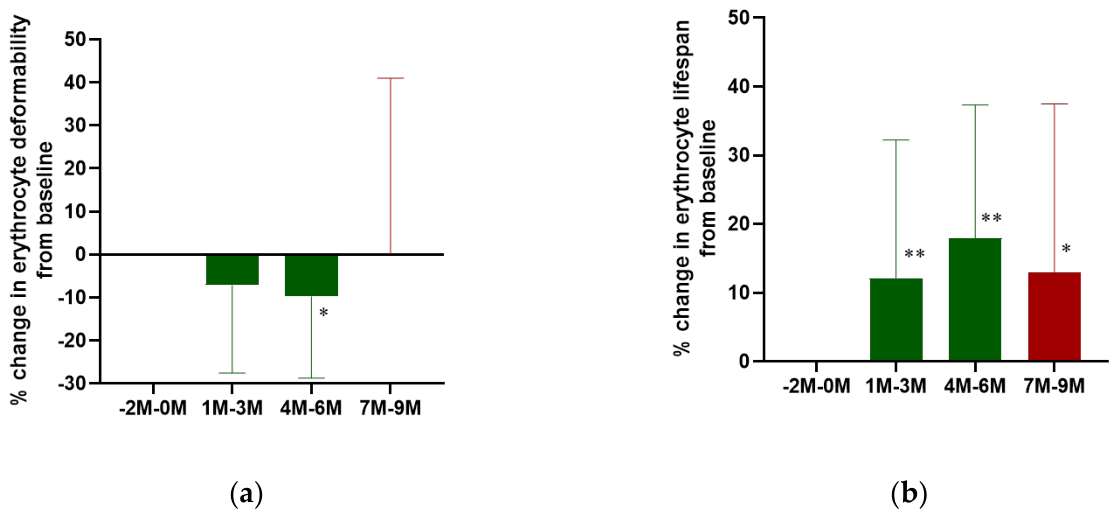
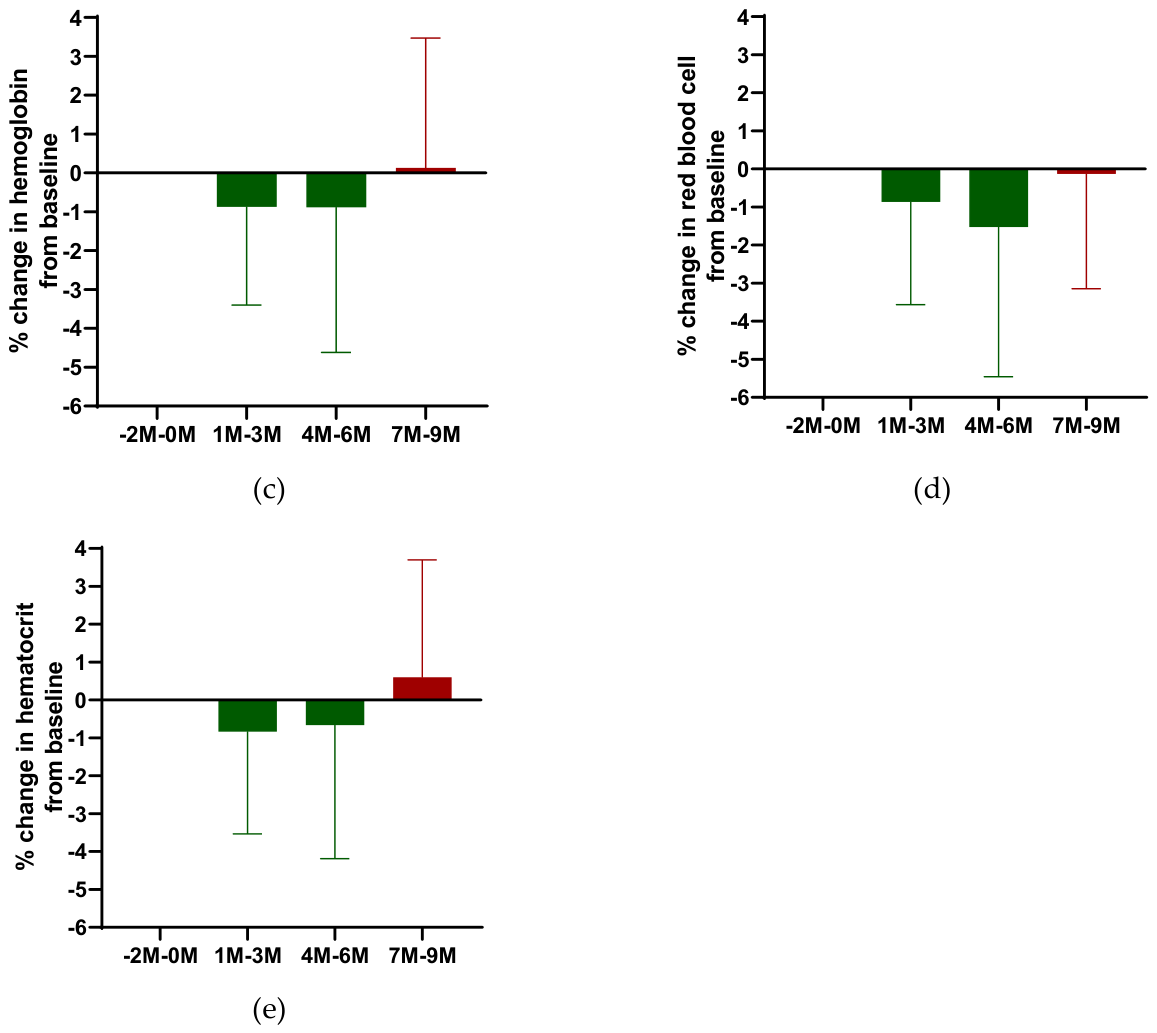
Figure 4.
Percentage changes in vascular indices from baseline. Data are presented as mean percentage change ±SD relative to baseline (0M) for 25 patients. The green bar indicates the 6-month imeglimin treatment period. (a) Percentage change in baPWV: A slight increase was observed at 6 months, which returned to baseline levels during the follow-up period (9M). (b) Percentage change in TBI: A slight decrease was observed at 6 months, followed by recovery toward baseline levels at 9M. No significant differences were observed compared with baseline (0M) at any time point.
Figure 4.
Percentage changes in vascular indices from baseline. Data are presented as mean percentage change ±SD relative to baseline (0M) for 25 patients. The green bar indicates the 6-month imeglimin treatment period. (a) Percentage change in baPWV: A slight increase was observed at 6 months, which returned to baseline levels during the follow-up period (9M). (b) Percentage change in TBI: A slight decrease was observed at 6 months, followed by recovery toward baseline levels at 9M. No significant differences were observed compared with baseline (0M) at any time point.
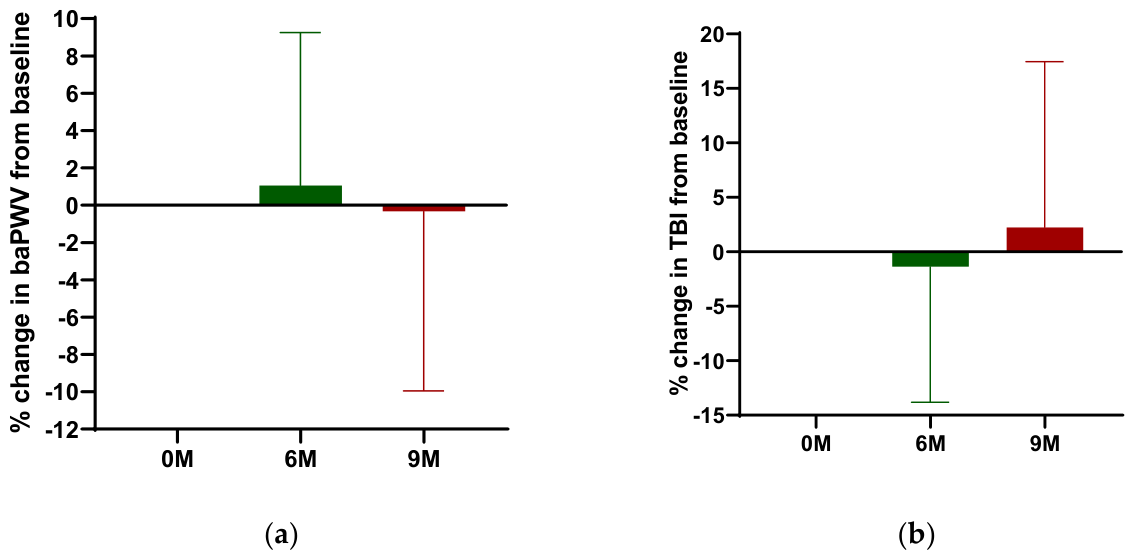
Table 2.
Correlations between changes in erythrocyte deformability or lifespan and other clinical indices.
Table 2.
Correlations between changes in erythrocyte deformability or lifespan and other clinical indices.
| Parameter | N | Erythrocyte deformability | Erythrocyte lifespan | |||
|---|---|---|---|---|---|---|
| r | P value | r | P value | |||
| Erythrocyte deformability | 25 | – | – | 0.061 | 0.604 | |
| Erythrocyte lifespan | 25 | 0.061 | 0.604 | – | – | |
| TBI | 25 | 0.209 | 0.144 | 0.0004 | 0.998 | |
| baPWV | 25 | 0.198 | 0.168 | 0.084 | 0.561 | |
| RBC count | 25 | 0.171 | 0.143 | 0.320 | 0.005 | |
| Hemoglobin | 25 | 0.187 | 0.109 | 0.329 | 0.004 | |
| Hematocrit | 25 | 0.146 | 0.212 | 0.277 | 0.016 | |
| SBP | 25 | -0.167 | 0.153 | 0.158 | 0.175 | |
| DBP | 25 | 0.008 | 0.946 | 0.205 | 0.078 | |
| PR | 25 | 0.226 | 0.051 | 0.141 | 0.229 | |
Data represent Pearson’s correlation coefficients (r).
Disclaimer/Publisher’s Note: The statements, opinions and data contained in all publications are solely those of the individual author(s) and contributor(s) and not of MDPI and/or the editor(s). MDPI and/or the editor(s) disclaim responsibility for any injury to people or property resulting from any ideas, methods, instructions or products referred to in the content. |
© 2026 by the authors. Licensee MDPI, Basel, Switzerland. This article is an open access article distributed under the terms and conditions of the Creative Commons Attribution (CC BY) license (http://creativecommons.org/licenses/by/4.0/).
Copyright: This open access article is published under a Creative Commons CC BY 4.0 license, which permit the free download, distribution, and reuse, provided that the author and preprint are cited in any reuse.