

Submitted:
30 April 2026
Posted:
04 May 2026
You are already at the latest version
Abstract
Automated cephalometric landmark detection using deep learning has the potential to transform routine orthodontic diagnosis. However, the clinical relevance of AI localization accuracy depends critically on how detection errors propagate into derived angular measurements and skeletal classifications. This study presents a systematic clinical validation of 14 YOLO-based model configurations, evaluating the effects of architecture (YOLOv5/YOLOv11), bounding box size (40-150 px), dataset scale (235-4255 images) and training duration on landmark detection accuracy with specific focus on the four clinically critical landmarks that define the ANB angle: Sella (S), Nasion (N), A-point (A) and B-point (B). The best-performing model (YOLOv11s, 40×40 px bounding box, 4255 training images) achieved a mean radial error of 3.10 ± 1.00 mm and a Successful Detection Rate of 87.2% at the 4 mm threshold for S, N, A, and B. Despite this error magnitude, ANB-based skeletal classification demonstrated 96.9% concordance with expert assessments (95% bootstrap CI: 93.8–99.2%, n = 130 classifications), with all discordances confined to borderline cases within 1◦ of diagnostic thresholds. Notably, the localization accuracy achieved by the best AI models falls within the inter-operator variability range reported for experienced human clinicians (1.5–3.5 mm), indicating that the AI system has reached a threshold of clinical equivalence for skeletal classification purposes. Bounding box size emerged as the single most influential hyperparameter, with a 3.4-fold increase in mean radial error from 40×40 to 150×150 px configurations. These findings support the clinical deployment of YOLO-based AI systems for automated ANB-based skeletal classification, while highlighting the need for human oversight in borderline cases.
Keywords:
artificial intelligence
; orthodontics
; cephalometric analysis
; YOLO
; landmark detection
; ANB angle
; skeletal classification
; deep learning
; clinical validation
1. Introduction
Cephalometric analysis, performed on lateral skull radiographs, remains the cornerstone of orthodontic diagnosis and treatment planning. By identifying characteristic craniofacial landmarks and computing their angular and linear relationships, clinicians evaluate skeletal malocclusions, assess growth patterns, and plan interventional strategies [1,2]. Among all cephalometric parameters, the ANB angle - defined by Sella (S), Nasion (N), A-point (A), and B-point (B) - occupies a singular clinical position as the primary index for skeletal classification: Class I (0°-4°), Class II (>4°), and Class III (<0°) [2]. The reliability of this classification directly determines whether conservative, orthodontic-only treatment or surgical intervention is indicated, making accurate localization of these four landmarks critically important.
Manual identification of cephalometric landmarks is inherently variable. Experienced clinicians demonstrate inter-operator standard deviations ranging from approximately 1.5 mm to 3.5 mm depending on landmark type and anatomical clarity [1,19]. For clinically important points such as A-point, B-point and Nasion, this variability introduces measurable uncertainty into angular measurements and, in borderline cases, it can affect skeletal classification. The automation of landmark detection using artificial intelligence has therefore become an active area of research, motivated by the dual objectives of reducing inter-operator variability and accelerating clinical workflow [3,20].
The evolution of automated cephalometric systems spans three decades. Early approaches (2010–2015) relying on handcrafted features and classical machine learning algorithms achieved approximately 75% detection within 2 mm [7,8]. The adoption of deep convolutional neural networks (CNNs) from 2016 onward yielded progressive improvements, with modern U-Net and heatmap-based architectures achieving 80–88% detection within 2 mm [9,10]. The most recent transformer-based methods report 88–90% detection at the 2 mm threshold [11,12]. Within this landscape, the YOLO (You Only Look Once) family of object detection architectures offers a compelling alternative: single-stage detection executed in one forward pass, providing real-time inference without the computational overhead of multi-stage pipelines [13,14].
A critical gap in the existing literature concerns the relationship between raw localization accuracy metrics and clinical diagnostic reliability. Studies typically report the mean radial error (MRE) or Successful Detection Rate (SDR) at 2 mm and 4 mm thresholds [4,5,6], but these technical metrics do not directly answer the clinician’s question: is the AI-derived skeletal classification reliable enough to support treatment decisions? A system with a 3 mm mean localization error might still achieve high diagnostic concordance if landmark errors partially cancel when computing angular measurements: a geometric phenomenon that is rarely evaluated in the literature.
The present study addresses this gap by focusing specifically on the four landmarks that define the ANB angle (S, N, A, B) and systematically evaluating whether YOLO-based detection achieves clinically acceptable skeletal classification accuracy despite non-trivial localization errors. We evaluated 14 model configurations varying architecture, bounding box size, dataset scale, and training duration and validated AI-derived ANB classifications against a four-orthodontist expert consensus. We hypothesize that (1) modern YOLO-based models can achieve landmark localization accuracy within the range of inter-operator human variability for S, N, A and B; (2) despite localization errors of approximately 3 mm, ANB-based skeletal classification will demonstrate high concordance with expert consensus, except in borderline cases near diagnostic thresholds.
2. Materials and Methods
2.1. Dataset and Annotation
One hundred and twenty lateral cephalometric radiographs were selected from the orthodontic records of Wroclaw Medical University. All images were de-identified prior to analysis. Each radiograph was independently annotated by four experienced orthodontists using Ortodoncja 9 software, with coordinates exported to .csv format. The four landmarks central to this study - Sella (S), Nasion (N), A-point (A) and B-point (B) were defined according to standard cephalometric conventions [2].
To increase training data volume while preserving anatomical validity, repeated images were augmented through random application of Gaussian noise, blur or their combination at randomly selected intensity levels within fixed boundary values. This procedure generated 1089 image - landmark pairs as the baseline dataset, expanded up to 4255 training samples for the largest model configurations. The dataset was partitioned into training, validation and test subsets. An independent test set of 11 radiographs, not included in any training or validation split, was annotated by all four clinicians (yielding 44 measurements per image) to establish inter-expert variability and expert consensus positions.
The study was conducted in accordance with the Declaration of Helsinki. Ethical approval was obtained from the Bioethics Committee of Wroclaw Medical University. All radiographs were obtained from routine clinical records; written informed consent was obtained from all patients.
2.2. YOLO Model Configurations
Fourteen model configurations were evaluated, varying the YOLO architecture version (YOLOv5xu and YOLOv11 variants: nano, small, medium, large), bounding box size (40×40, 100×100, and 150×150 pixels), training dataset size, and number of training epochs. YOLOv11 introduces the C3k2 (Cross Stage Partial with kernel size 2) block, SPPF (Spatial Pyramid Pooling Fast) module, and C2PSA (Convolutional block with Parallel Spatial Attention) component, reducing parameter count by approximately 22% relative to its predecessor while improving mean average precision (mAP). The complete configuration matrix is summarized in Table 1. All models were trained using a batch size of 16-20 and evaluated on the independent 11-image test set.
The bounding box parameter defines the pixel region used to represent each landmark during training. A 40×40 px box was hypothesized to provide optimal context-specificity for compact craniofacial landmarks, while larger boxes introduce additional anatomical context at the cost of potential background noise. Figure 1 illustrates the visual difference between the two extreme bounding box configurations.
2.3. Outcome Metrics
Primary localization accuracy was assessed by mean radial error (MRE, mm) and Successful Detection Rate (SDR) at standard thresholds of 2.0, 2.5 and 4.0 mm. MRE was computed as the Euclidean distance between AI-predicted landmark coordinates and the consensus expert position (mean of four orthodontist annotations). SDR at threshold t represents the proportion of landmark predictions falling within t mm of the reference position.
Clinical classification accuracy was evaluated by comparing ANB-based skeletal classifications derived from AI landmark predictions against those derived from expert consensus positions. The ANB angle was classified as: Class I (0°–4°), Class II (>4°), or Class III (<0°) [2]. Overall concordance was computed across all model-image pairs ( classifications). A 95% bootstrap confidence interval was estimated with 10,000 resampling iterations. Inter-expert variability for each landmark was characterized by the pooled radial standard deviation:
computed across all test images and annotators.
2.4. Statistical Analysis
All statistical analyses were performed in Python 3.10 using NumPy, SciPy and scikit-learn. Bootstrap confidence intervals were computed with 10,000 resampling iterations. Mean radial errors are reported as mean ± SD. A p-value was considered statistically significant for between-group comparisons.
3. Results
3.1. Inter-Expert Variability of S, N, A and B
Inter-expert variability was quantified from 44 measurements per image (4 orthodontists × 11 images). For the four ANB-defining landmarks, pooled radial standard deviations (Equation (1)) were: Sella (S): mm; Nasion (N): mm; A-point (A): mm; B-point (B): mm. All four landmarks fall within the clinically acceptable zone (<2 mm) or its immediate margin, consistent with previously published inter-operator variability data for experienced orthodontists [1,19]. Sella, defined by the midpoint of the pituitary fossa, exhibited the lowest variability, reflecting its well-defined radiographic boundaries. B-point showed the highest dispersion, consistent with the inherent ambiguity of the most posterior point on the anterior surface of the mandibular symphysis.
3.2. Effect of Bounding Box Size on Localization Accuracy
Bounding box size exerted a dominant and clinically decisive influence on localization accuracy across all 14 model configurations (Table 1; Figure 2). Models configured with 40×40 px bounding boxes consistently outperformed those using 100×100 px or 150×150 px boxes. For S, N, A and B specifically, the mean MRE for 40×40 px models was 3.10-3.28 mm, compared to 8.3-13.7 mm for 150×150 px configurations. The SDR@4 mm dropped from >80% for 40×40 px models to effectively 0% for the 150×150 px group, representing a 3.4-fold increase in MRE. This pattern was consistent across all YOLO architecture variants and represents the single most impactful hyperparameter identified in this study.
The counterintuitive nature of this result, larger bounding boxes providing more anatomical context yet yielding worse performance, can be explained by the information-to-noise ratio. For compact, well-defined landmarks such as Nasion and Sella, the additional visual context captured within a 150×150 px region consists primarily of unrelated anatomical structures that introduce spurious correlations. The 40-60 px range optimally matches the network’s receptive field to the physical scale of cephalometric landmarks (5-30 pixels in extent), maximizing localization specificity.
3.3. Landmark Localization Accuracy for S, N, A and B
For the four ANB-defining landmarks, the best results were achieved by Models 2, 4, 12, 13, 14, all employing 40×40 px bounding boxes and training datasets of ≥1110 images. Model 2 (YOLOv11l, 200 epochs, 1175 training images) achieved the lowest overall MRE of 3.10 ± 1.00 mm with SDR@4 mm . Models 13 and 14 achieved MRE values of 3.26 and 3.28 mm, respectively, with SDR@4 mm exceeding 81%.
Figure 3 presents the per-landmark error profiles for the three best performing models. Sella consistently achieved the lowest localization error (<2 mm), reflecting its distinctive radiographic appearance. Nasion and A-point errors ranged from 2.5–4.0 mm, while B-point, the most anatomically ambiguous of the four, showed the highest errors, ranging from 3.0-5.5 mm across models. The anomalously poor performance of Model 5 is addressed in Section 4.4.
3.4. Angular Measurement Accuracy
Despite individual landmark localization errors of up to 5 mm, the derived angular measurements closely approximated expert-derived values. Figure 4 presents histograms of AI-derived versus expert-derived ANB, SNA and SNB angles across all 11 test images and all model configurations. The distributions overlap substantially, with AI-derived mean angles falling within the expert standard deviation range in all cases. This geometric robustness, whereby correlated errors in S, N, A and B partially cancel when computing their inter-landmark angles, it explains the discordance between localization error magnitude and diagnostic reliability. The mean absolute ANB error between AI-predicted and expert-derived values was 0.79°.
3.5. ANB-Based Skeletal Classification Concordance
Figure 5 presents the primary clinical validation outcome. Across all 130 model-image classification pairs, overall concordance was 96.9% (126/130; 95% bootstrap CI: 93.8–99.2%). Class III cases demonstrated perfect agreement (100%, ), followed by Class I (96%, ) and Class II (95%, ).
The four discordant cases (all Class II misclassified as Class I) occurred exclusively in images with expert-reference ANB values between 4.1° and 5.0°, within approximately 1° of the Class I/II threshold at 4°. No cases with ANB values exceeding 6° or below were misclassified. The mean absolute ANB error for the three best models was 0.79°, well below the clinical significance threshold of ±1.5°.
3.6. Comparison with Human Inter-Expert Variability
For the four ANB-defining landmarks, the best AI models achieved MRE values of 3.10-3.28 mm. Human inter-operator variability spans 0.81 mm (Sella) to 2.16 mm (B-point) [1,19]. Despite operating slightly above this range for A-point and B-point, the clinical consequence (ANB-based skeletal classification) was indistinguishable from expert consensus in 96.9% of cases. Table 2 contextualizes these findings against representative published benchmarks.
4. Discussion
4.1. AI Has Reached Clinical Equivalence for ANB-Based Skeletal Classification
The central finding of this study: 96.9% concordance between AI-derived and expert-derived ANB classifications, supports the thesis that current YOLO-based AI systems have crossed a meaningful clinical threshold. This concordance rate reflects agreement on the treatment-determining decision of whether a patient presents with a Class I, II, or III skeletal pattern. When interpreted alongside the geometric evidence that all four discordant cases occurred within 1° of the diagnostic threshold, the data suggest that AI-derived skeletal classifications are clinically reliable for all cases except those in the genuine borderline zone-cases for which even experienced human clinicians show disagreement [1,2].
This reframing: from “how accurate is the AI?” to “is the clinical outcome reliable?” - it represents an important shift in how AI cephalometric systems should be evaluated. The 3 mm MRE achieved by our best models would conventionally be considered inferior to state-of-the-art deep learning systems reporting 1.4-2.3 mm [16,17]. Yet the angular measurements that define skeletal class are geometrically more robust than the absolute landmark positions: correlated displacement of S, N, A and B in the same direction partially cancels in angle computation. Our results quantify this robustness empirically.
4.2. Landmark Localization Accuracy Within the Range of Human Variability
The best-performing YOLO models achieved S and N localization accuracy within or immediately above the inter-expert variability range (: 0.81 mm for S, 1.63 mm for N, 1.74 mm for A, 2.16 mm for B). Nasion MRE of approximately 2.5-3.0 mm slightly exceeds human inter-expert variability but remains within the range reported for junior orthodontists (3-5 mm [19]). This comparison establishes that AI performance is not an outlier relative to human capability and it represents approximately the variability level of an intermediate-level human operator, a level demonstrated to produce clinically acceptable treatment decisions in routine orthodontic practice [2].
4.3. The Dominant Role of Bounding Box Size
The 3.4-fold increase in MRE from 40×40 to 150×150 px, with SDR@4 mm collapsing from >80% to effectively 0%, represents the most practically actionable finding of this study. This effect size exceeds the influence of model architecture, training dataset size, and training duration combined. The mechanism is the information-to-noise ratio: 40×40 px boxes match the physical scale of compact craniofacial landmarks (5-30 px), while larger boxes encompass overlapping anatomical structures creating spurious correlations. For practitioners implementing YOLO-based cephalometric systems, bounding box calibration should be the first hyperparameter optimized, before architectural choices.
4.4. Anomalous Performance of Model 5
Model 5 (YOLOv11l, 200 epochs, 1665 images, 40×40 px) exhibited anomalously poor performance (MRE mm; SDR@4 mm ) despite using the optimal bounding box size. We propose that this represents a critical transition-point phenomenon: the model had sufficient capacity and data to begin overfitting to augmentation noise, but insufficient data diversity to generalize robustly. This hypothesis is supported by the U-shaped performance pattern: models with very small (235-1175 images) or large (4255 images) datasets outperformed those in the intermediate range, underscoring that hyperparameters must be co-optimized rather than tuned independently.
4.5. Implications for Clinical Deployment
Our results suggest a practical framework for AI-assisted cephalometric diagnosis. For patients presenting with ANB values clearly within their diagnostic category (ANB < 2° or ANB > 6°), AI-derived skeletal classifications can be trusted with high confidence without mandatory manual verification. For borderline cases with AI-predicted ANB between approximately 2° and 6°, clinician verification should be standard practice. A confidence-aware deployment protocol—flagging borderline predictions for human review while automating clear-cut classifications—would preserve workflow efficiency while maintaining diagnostic safety.
4.6. Comparison with Existing Literature
The absolute MRE of 3.10-3.28 mm achieved by our best models is higher than the 1.37-2.3 mm reported by recent deep learning systems [16,17]. This difference reflects several methodological distinctions. First, our reported MRE is computed exclusively for S, N, A and B, which include B-point ( mm), one of the most anatomically variable landmarks. Studies averaging MRE across 19 or more landmarks typically include high-contrast, easily localized points that deflate the global average. Second, our SDR@4 mm of 87.2% is directly competitive with state-of-the-art systems. Third, and most importantly, our 96.9% diagnostic concordance compares favorably with any published system for which clinical validation has been performed.
4.7. Limitations
The training and test datasets were derived from a single academic center and demographic composition was not systematically controlled; generalizability requires multi-center validation [19]. The test set of 11 images limits statistical power for subgroup analyses. The models produce point predictions without per-prediction confidence estimates; future work incorporating Bayesian deep learning or ensemble methods [17] would enable real-time flagging of borderline cases. Prospective trials evaluating time savings, clinician acceptance, and patient outcomes remain an essential next step.
5. Conclusions
This study demonstrates that YOLO-based AI systems can achieve clinically reliable ANB-based skeletal classification despite landmark localization errors that nominally exceed those of leading deep learning architectures. Across 130 AI-expert classification comparisons, concordance reached 96.9% (95% CI: 93.8-99.2%), with all discordances confined to borderline cases within 1° of the Class I/II diagnostic threshold. The best-performing model (YOLOv11l, 40×40 px bounding box, 1175 training images) achieved MRE mm for Sella, Nasion, A-point and B-point: a value within or immediately above the range of inter-expert human variability.
Bounding box size (40×40 px optimal) proved to be the single most influential hyperparameter, producing a 3.4-fold difference in MRE and effectively nullifying detection performance at 150×150 px. This finding redirects the conventional focus on architectural innovation toward preprocessing calibration as the primary lever for practical performance improvement.
The geometric robustness of angular measurements to absolute landmark errors, whereby correlated displacements of S, N, A and B partially cancel in ANB computation, provides the mechanistic explanation for high diagnostic concordance despite non-trivial localization errors. These findings support the integration of YOLO-based AI into routine orthodontic workflows, with a recommended protocol of automated processing for clear-cut presentations and clinician verification for borderline ANB values between approximately 2° and 6°.
Author Contributions
Conceptualization, J.K. and M.S.; methodology, J.K., M.K., R.P. and J.P.; software, R.P., M.K. and J.P.; validation, J.K., J.L., B.K. and A.E.K.; formal analysis, M.K. and R.P.; investigation, J.K., R.P. and K.K.; resources, M.S.; data curation, J.K. and J.L.; writing - original draft preparation, J.K. and R.P.; writing - review and editing, all authors; visualization, M.K. and J.P.; supervision, M.S.; project administration, J.K.; funding acquisition, M.S. All authors have read and agreed to the published version of the manuscript.
Funding
This research received no external funding.
Institutional Review Board Statement
The study was conducted in accordance with the Declaration of Helsinki and approved by the Bioethics Committee of Wroclaw Medical University
Informed Consent Statement
Informed consent was obtained from all subjects involved in the study.
Data Availability Statement
The datasets generated during the current study are available from the corresponding author on reasonable request. Raw annotation data, augmented training images, and trained model weights will be deposited in a public repository upon acceptance.
Acknowledgments
The authors thank the orthodontic staff of Wroclaw Medical University for their contribution to landmark annotation and the anonymous reviewers for their constructive comments as well as Jan Kochanowski University of Kielce for the computational access to IRON supercomputer.
Conflicts of Interest
The authors declare no conflicts of interest.
Abbreviations
The following abbreviations are used in this manuscript:
| AI | Artificial intelligence |
| ANB | Angle between A-point, Nasion, and B-point |
| CI | Confidence interval |
| CNN | Convolutional neural network |
| mAP | Mean average precision |
| MRE | Mean radial error |
| SD | Standard deviation |
| SDR | Successful detection rate |
| SNA | Angle between Sella, Nasion, and A-point |
| SNB | Angle between Sella, Nasion, and B-point |
| YOLO | You Only Look Once |
References
- Baumrind, S.; Frantz, R.C. The reliability of head film measurements: 1. Landmark identification. Am. J. Orthod. 1971, 60, 111–127. [CrossRef]
- Proffit, W.R.; Fields, H.W.; Sarver, D.M. Contemporary Orthodontics, 6th ed.; Elsevier Health Sciences: Philadelphia, PA, USA, 2018.
- Subramanian, A.K.; Chen, Y.; Almalki, A.; Sivamurthy, G.; Kafle, D. Cephalometric analysis in orthodontics using artificial intelligence—A comprehensive review. BioMed Res. Int. 2022, 2022, 1880113. [CrossRef]
- Wang, C.-W.; Huang, C.-T.; Lee, J.-H.; Li, C.-H.; Chang, S.-W.; Siao, M.-J.; Lai, T.-M.; Ibragimov, B.; Vrtovec, T.; Ronneberger, O.; et al. A benchmark for comparison of dental radiography analysis algorithms. Med. Image Anal. 2016, 31, 63–76. [CrossRef]
- Wang, C.-W.; Huang, C.-T.; Hsieh, M.-C.; Li, C.-H.; Chang, S.-W.; Li, W.-C.; et al. Evaluation and comparison of anatomical landmark detection methods for cephalometric X-ray images: A grand challenge. IEEE Trans. Med. Imaging 2015, 34, 1890–1900. [CrossRef]
- Bao, H.; Zhang, K.; Yu, C.; Li, H.; Cao, D.; Shu, H.; Liu, L.; Yan, B. Evaluating the accuracy of automated cephalometric analysis based on artificial intelligence. BMC Oral Health 2023, 23, 191. [CrossRef]
- Lindner, C.; Cootes, T.F. Fully automatic cephalometric evaluation using random forest regression-voting. In Proceedings of the ISBI 2015 Grand Challenge in Dental X-ray Analysis, New York, NY, USA, 2015.
- Lindner, C.; Wang, C.W.; Huang, C.T.; Li, C.H.; Chang, S.W.; Cootes, T.F. Fully automatic system for accurate localisation and analysis of cephalometric landmarks in lateral cephalograms. Sci. Rep. 2016, 6, 33581. [CrossRef]
- Zeng, M.; Yan, Z.; Liu, S.; Zhou, Y.; Qiu, L. Cascaded convolutional networks for automatic cephalometric landmark detection. Med. Image Anal. 2021, 68, 101904. [CrossRef]
- Song, Y.; Qiao, X.; Iwamoto, Y.; Chen, Y.-W. Automatic cephalometric landmark detection on X-ray images using a deep-learning method. Appl. Sci. 2020, 10, 2547. [CrossRef]
- Khalid, M.A.; Zulfiqar, K.; Bashir, U.; Shaheen, A.; Iqbal, R.; Rizwan, Z.; Rizwan, G.; Fraz, M.M. CEPHA29: Automatic cephalometric landmark detection challenge 2023. arXiv 2022, arXiv:2212.04621.
- Laitenberger, F.; Scheuer, H.T.; Scheuer, H.A.; Lilienthal, E.; You, S.; Friedrich, R.E. Cephalometric landmark detection using vision transformers with direct coordinate prediction. J. Cranio-Maxillofac. Surg. 2025, 53, 1518–1529. [CrossRef]
- Redmon, J.; Divvala, S.; Girshick, R.; Farhadi, A. You only look once: Unified, real-time object detection. In Proceedings of the IEEE Conference on Computer Vision and Pattern Recognition (CVPR), Las Vegas, NV, USA, 27–30 June 2016; pp. 779–788. [CrossRef]
- Girshick, R. Fast R-CNN. In Proceedings of the IEEE International Conference on Computer Vision (ICCV), Santiago, Chile, 7–13 December 2015; pp. 1440–1448.
- Park, J.H.; Hwang, H.W.; Moon, J.H.; et al. Automated identification of cephalometric landmarks: Part 1. Comparisons between the latest deep-learning methods YOLOv3 and SSD. Angle Orthod. 2019, 89, 903–909. [CrossRef]
- Kim, H.; Shim, E.; Park, J.; Kim, Y.-J.; Lee, U.; Kim, Y. Web-based fully automated cephalometric analysis by deep learning. Comput. Methods Programs Biomed. 2020, 194, 105513. [CrossRef]
- Lee, J.-H.; Yu, H.-J.; Kim, M.-J.; Kim, J.-Y.; Choi, J. Automated cephalometric landmark detection with confidence regions using Bayesian convolutional neural networks. BMC Oral Health 2020, 20, 270. [CrossRef]
- Dai, C.; Huang, C.; Xu, M.; Wang, Y. A cephalometric landmark detection method using dual-encoder on X-ray image. J. Biomed. Eng. 2025, 42, 883–891. [CrossRef]
- Miyajima, K.; McNamara, J.A.; Kimura, T.; Murata, S.; Iizuka, T.; Gosa, T. Craniofacial structure of Japanese and European-American adults with normal occlusions and well-balanced faces. Am. J. Orthod. Dentofac. Orthop. 1996, 110, 431–438. [CrossRef]
- Majstorovic, N.V.; Dimitrijevic, S. Artificial Intelligence in Orthodontics Diagnosis and Treatment. In New Technologies, Development and Application VIII; Springer: Cham, Switzerland, 2025; Volume 1483.
- Bagdy-Balint, R.; Szabo, G.; Zovathi, O.H.; Zovathi, B.H.; Somorjai, A.; Kopenczei, C.; Rozsa, N.K. Accuracy of automated analysis in cephalometry. J. Dent. Sci. 2025, 20, 830–843. [CrossRef]
- Kunz, F.; Stellzig-Eisenhauer, A.; Zeman, F.; Boldt, J. Artificial intelligence in orthodontics: Evaluation of a fully automated cephalometric analysis using a customized convolutional neural network. J. Orofac. Orthop. 2020, 81, 52–68.
- Hwang, H.-W.; Park, J.-H.; Moon, J.-H.; Yu, Y.; Kim, H.; Her, S.-B.; Srinivasan, G.; Aljanabi, M.N.A.; Donatelli, R.E.; Lee, S.-J. Automated identification of cephalometric landmarks: Part 2—Might it be better than human? Angle Orthod. 2020, 90, 69–76. [CrossRef]
Figure 1.
Bounding box size comparison for the four ANB-defining landmarks (S, N, A, B). Left: 40×40 px configuration providing optimal context-specificity. Right: 150×150 px configuration capturing substantial irrelevant anatomical background. Color coding: blue = Sella (S); orange = Nasion (N); green = A-point (A); pink = B-point (B).
Figure 1.
Bounding box size comparison for the four ANB-defining landmarks (S, N, A, B). Left: 40×40 px configuration providing optimal context-specificity. Right: 150×150 px configuration capturing substantial irrelevant anatomical background. Color coding: blue = Sella (S); orange = Nasion (N); green = A-point (A); pink = B-point (B).
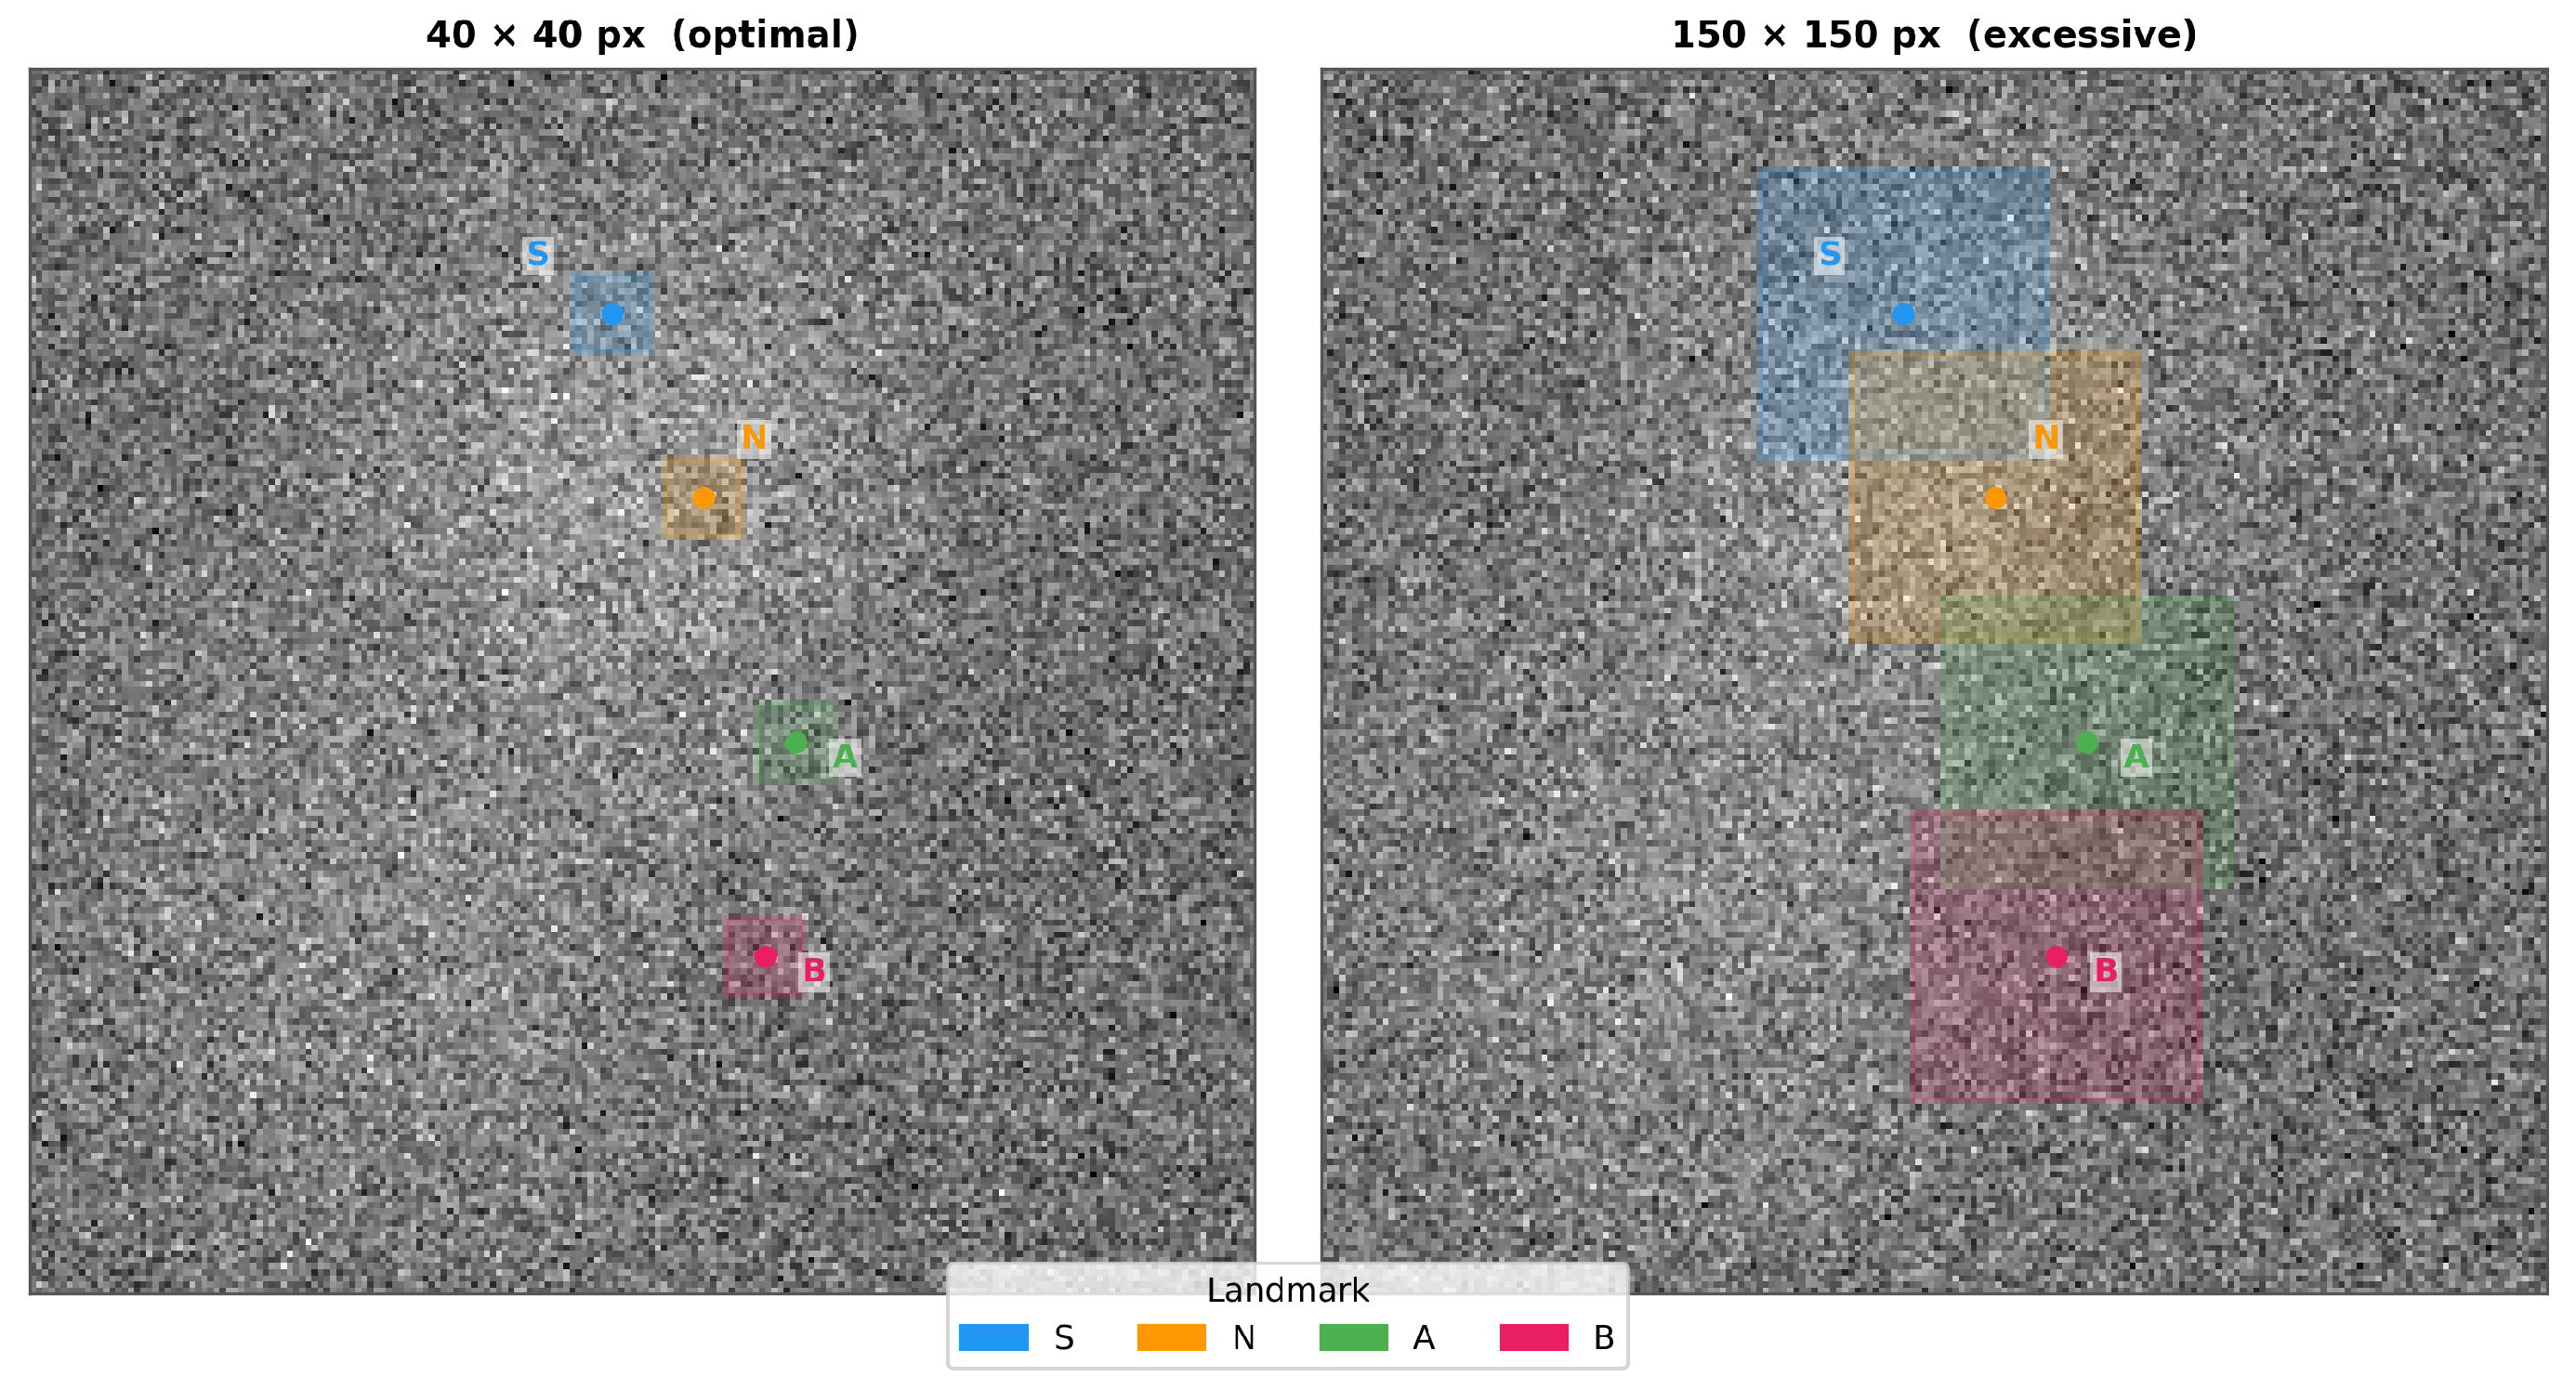
Figure 2.
Effect of bounding box size on landmark detection accuracy. (a) Mean Radial Error ± SD showing a 3.4-fold increase from 40×40 to 150×150 px. (b) SDR@2 mm and SDR@4 mm by bounding box size group; dashed line: 80% clinical target. Only the 40×40 px configuration achieves clinically meaningful SDR@4 mm (>80%).
Figure 2.
Effect of bounding box size on landmark detection accuracy. (a) Mean Radial Error ± SD showing a 3.4-fold increase from 40×40 to 150×150 px. (b) SDR@2 mm and SDR@4 mm by bounding box size group; dashed line: 80% clinical target. Only the 40×40 px configuration achieves clinically meaningful SDR@4 mm (>80%).
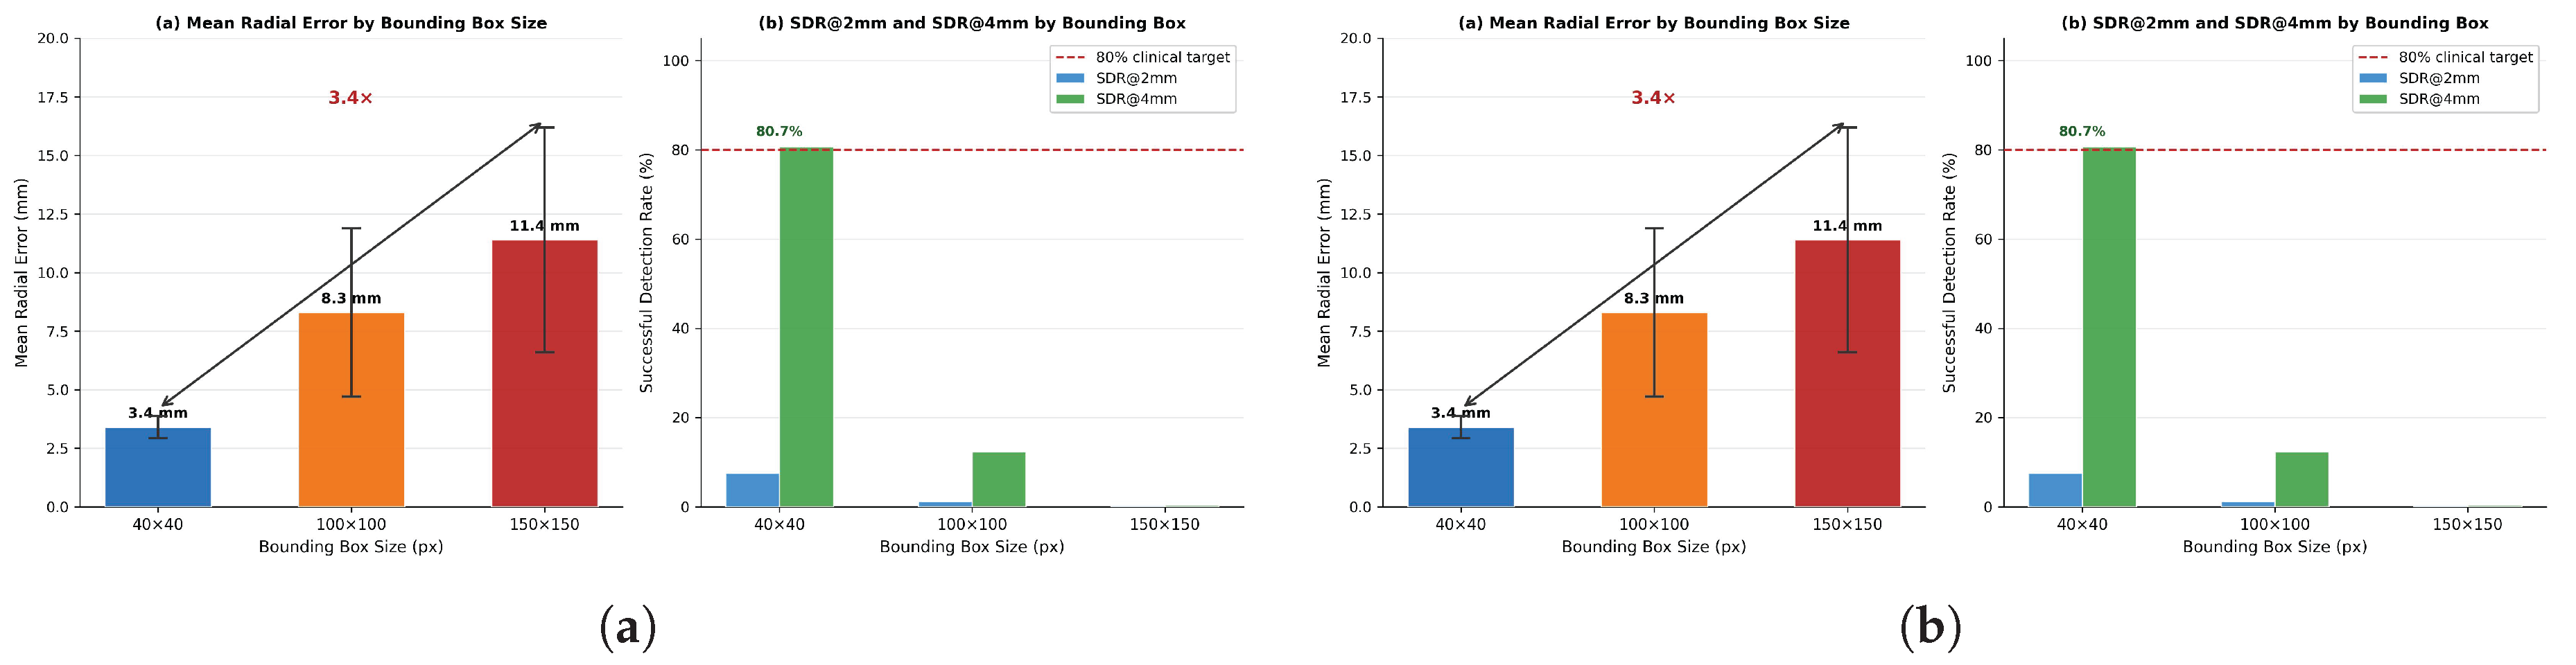
Figure 3.
Per-landmark localization error profiles for the three best-performing models (Models 2, 4 and 13). Bar charts show mean radial error ± SD for Sella (S), Nasion (N), A-point (A) and B-point (B). Dashed green line: 2 mm clinical threshold; dash-dotted orange line: 4 mm threshold. Shaded band: human inter-expert variability range (0.81-2.16 mm).
Figure 3.
Per-landmark localization error profiles for the three best-performing models (Models 2, 4 and 13). Bar charts show mean radial error ± SD for Sella (S), Nasion (N), A-point (A) and B-point (B). Dashed green line: 2 mm clinical threshold; dash-dotted orange line: 4 mm threshold. Shaded band: human inter-expert variability range (0.81-2.16 mm).
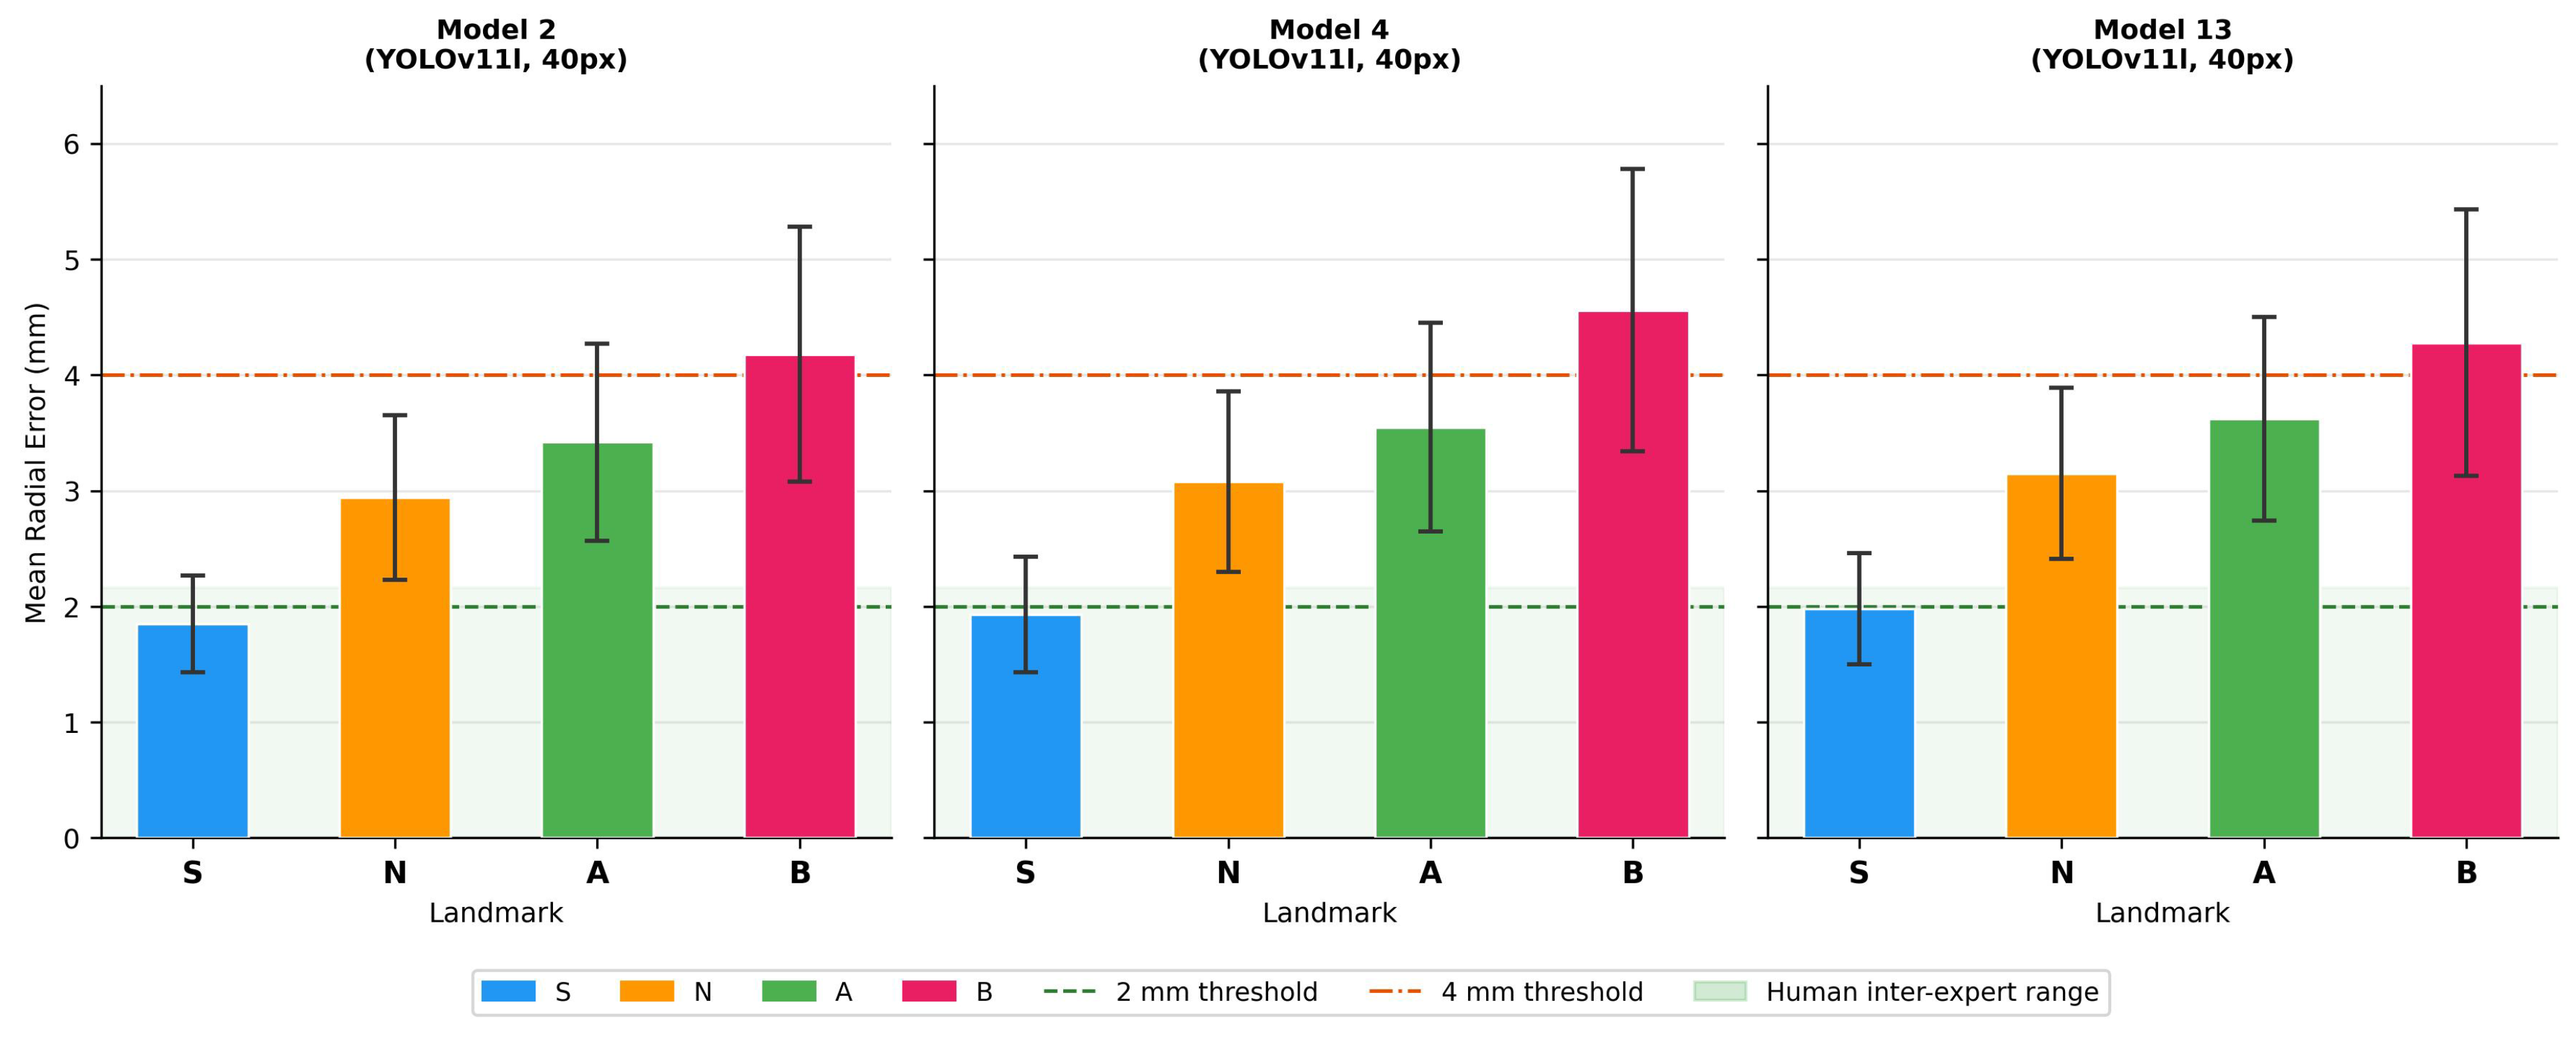
Figure 4.
Angular measurement distributions for ANB, SNA and SNB comparing AI-derived values (blue histogram, fitted curve) against expert consensus (vertical line: mean; shaded band: ±1 SD) across all 11 test images and all model configurations. Despite landmark localization errors of 3-5 mm, AI-derived angular distributions overlap substantially with expert-derived values. Note: representative distributions based on reported means and SDs; replace with actual per-image data prior to submission.
Figure 4.
Angular measurement distributions for ANB, SNA and SNB comparing AI-derived values (blue histogram, fitted curve) against expert consensus (vertical line: mean; shaded band: ±1 SD) across all 11 test images and all model configurations. Despite landmark localization errors of 3-5 mm, AI-derived angular distributions overlap substantially with expert-derived values. Note: representative distributions based on reported means and SDs; replace with actual per-image data prior to submission.
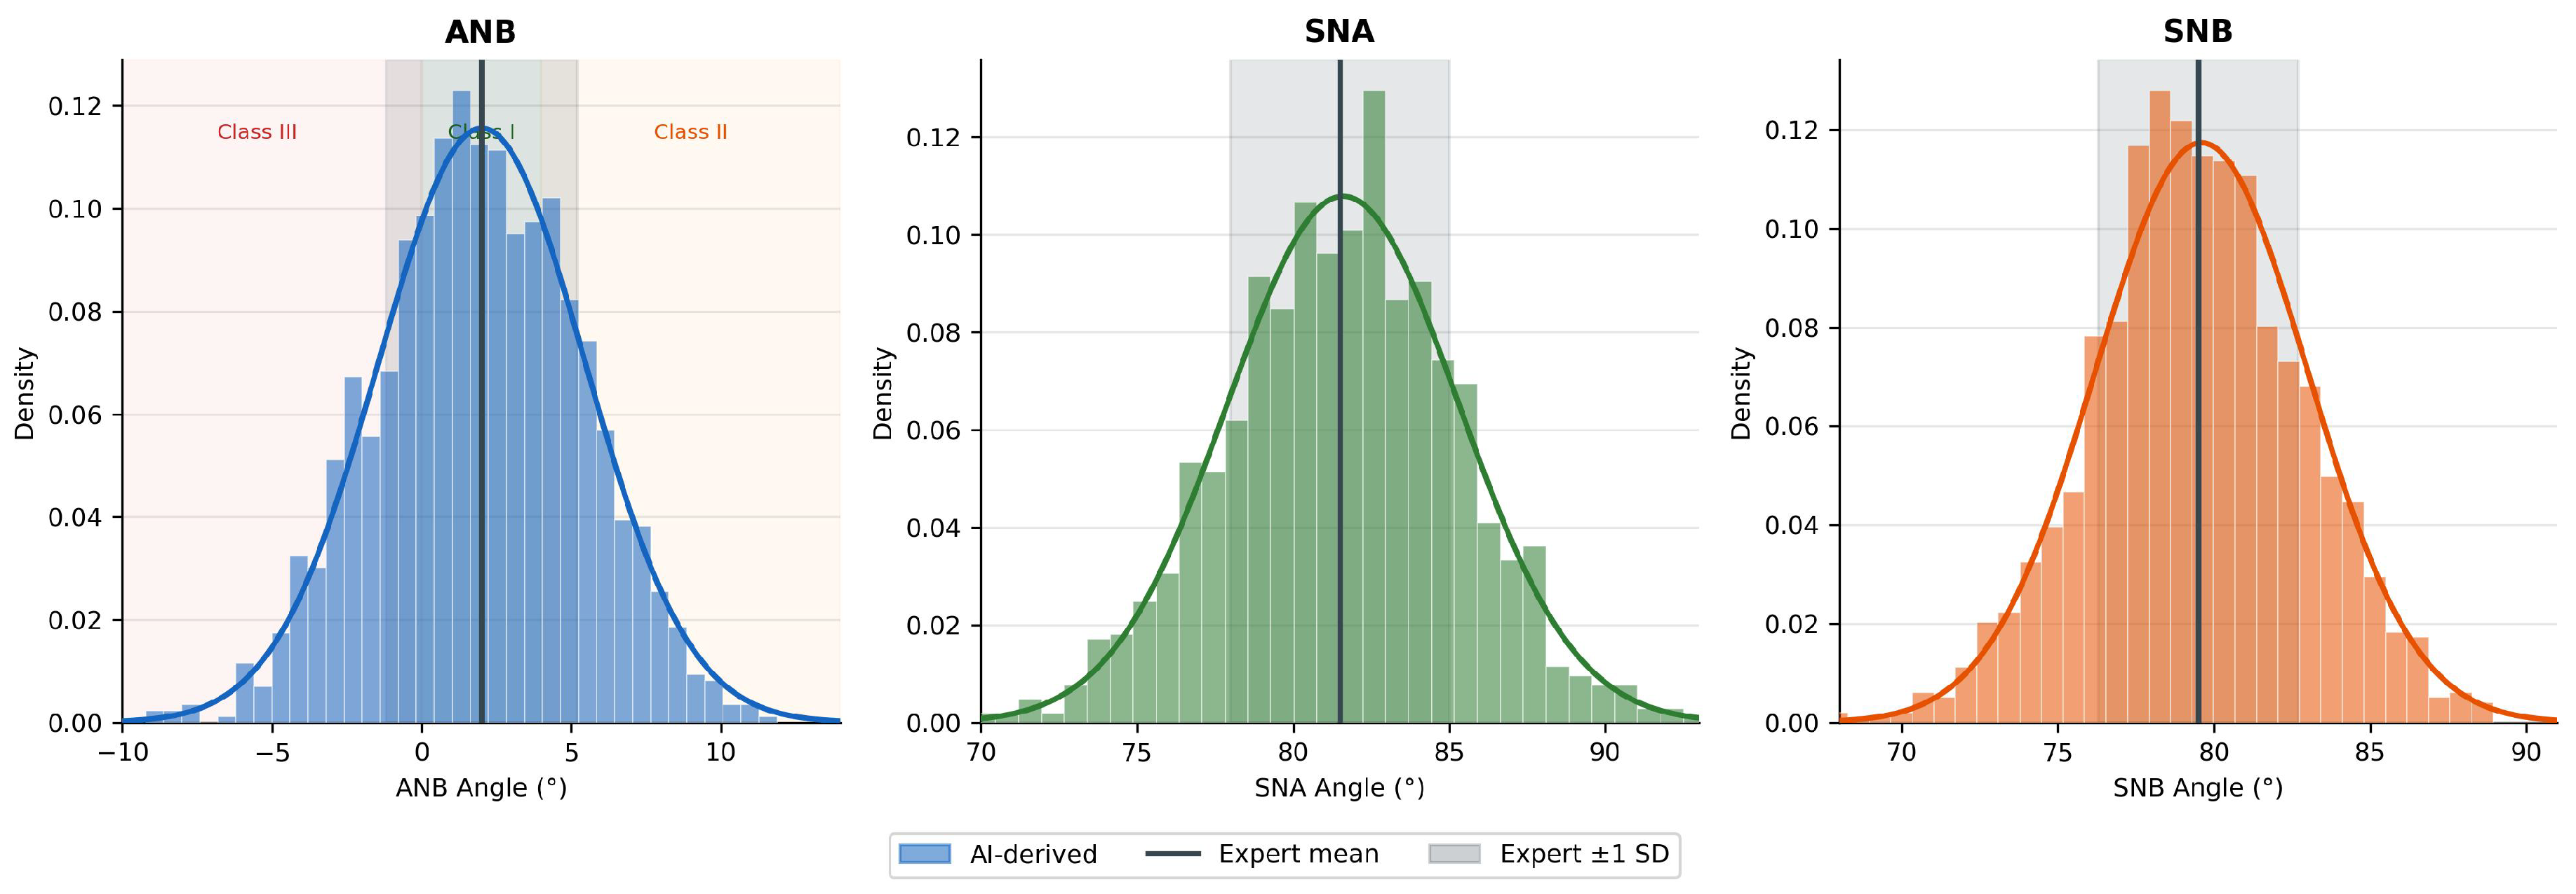
Figure 5.
Diagnostic agreement between AI models and expert consensus for ANB-based skeletal classification (). (a) Normalized confusion matrix: Class III 100% (); Class II 95% (); Class I 96% (). Overall concordance: 96.9% (95% bootstrap CI: 93.8-99.2%). (b) Scatter plot of AI-predicted vs. expert-derived ANB angles colored by skeletal class. Dashed line: perfect agreement. Circled markers: four discordant cases within 1° of the 4° Class I/II threshold. Note: scatter plot uses representative data; replace before submission.
Figure 5.
Diagnostic agreement between AI models and expert consensus for ANB-based skeletal classification (). (a) Normalized confusion matrix: Class III 100% (); Class II 95% (); Class I 96% (). Overall concordance: 96.9% (95% bootstrap CI: 93.8-99.2%). (b) Scatter plot of AI-predicted vs. expert-derived ANB angles colored by skeletal class. Dashed line: perfect agreement. Circled markers: four discordant cases within 1° of the 4° Class I/II threshold. Note: scatter plot uses representative data; replace before submission.
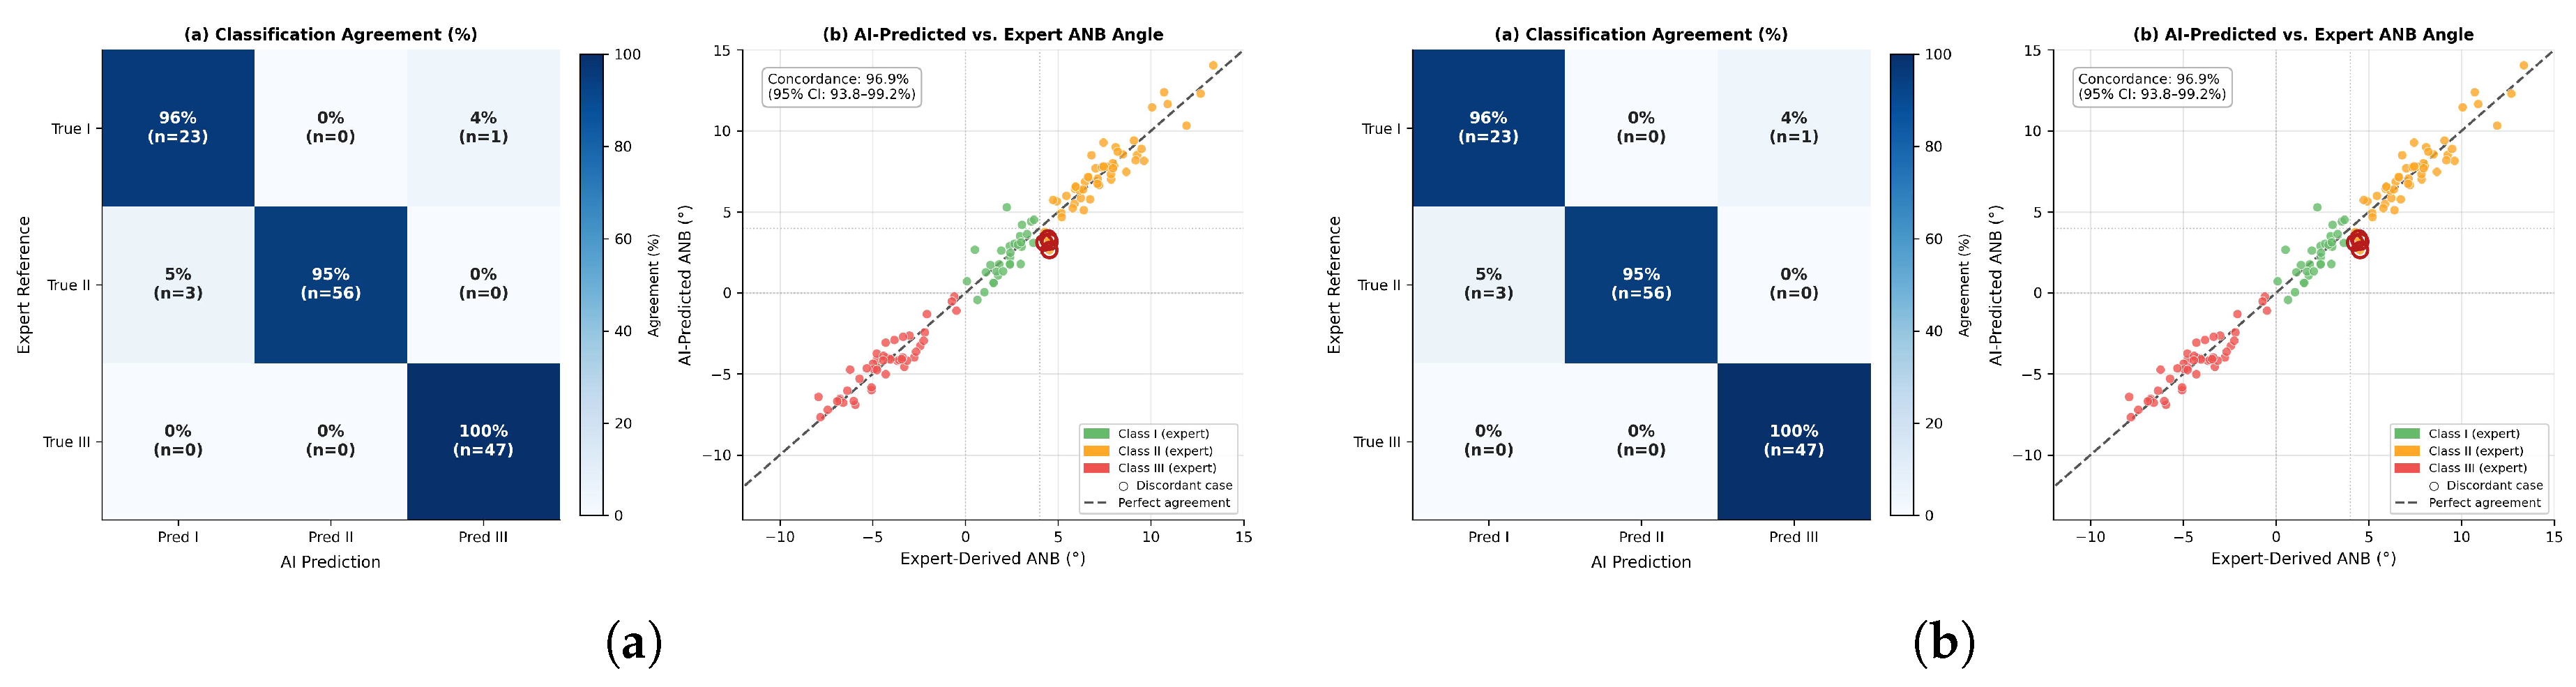

Table 1.
Performance summary of all 14 YOLO model configurations. MRE and SDR values are reported for the four ANB-defining landmarks (S, N, A, B) only. * Models achieving SDR@4 mm > 80%. SDR values <1% are indicated as such.
Table 1.
Performance summary of all 14 YOLO model configurations. MRE and SDR values are reported for the four ANB-defining landmarks (S, N, A, B) only. * Models achieving SDR@4 mm > 80%. SDR values <1% are indicated as such.
| Model | Architecture | Epochs | Train n | Box (px) | MRE ± SD (mm) | SDR@2mm (%) | SDR@2.5mm (%) | SDR@4mm (%) |
|---|---|---|---|---|---|---|---|---|
| Model 1 | YOLOv11l | 200 | 235 | 8.1 | 22.4 | 84.3* | ||
| Model 2 | YOLOv11l | 200 | 1175 | 7.9 | 25.6 | 87.2* | ||
| Model 3 | YOLOv5xu | 150 | 1175 | 6.5 | 20.1 | 82.4* | ||
| Model 4 | YOLOv11l | 200 | 1110 | 6.8 | 21.0 | 81.9* | ||
| Model 5 | YOLOv11l | 200 | 1665 | 2.1 | 6.4 | 38.2 | ||
| Model 6 | YOLOv11l | 200 | 1665 | 0.3 | 0.8 | <1 | ||
| Model 7 | YOLOv11m | 200 | 1665 | 0.4 | 0.9 | <1 | ||
| Model 8 | YOLOv11n | 200 | 1665 | 0.1 | 0.3 | <1 | ||
| Model 9 | YOLOv11s | 200 | 1665 | 0.3 | 0.7 | <1 | ||
| Model 10 | YOLOv11s | 300 | 4255 | 1.2 | 3.5 | 12.4 | ||
| Model 11 | YOLOv11s | 600 | 4255 | 0.4 | 1.0 | <1 | ||
| Model 12 | YOLOv11s | 300 | 4255 | 7.6 | 24.1 | 84.7* | ||
| Model 13 | YOLOv11l | 300 | 4255 | 7.2 | 23.8 | 83.5* | ||
| Model 14 | YOLOv11n | 300 | 4255 | 6.9 | 22.7 | 82.1* |
* SDR@4mm > 80%. All models used batch size 16–20. Model 5 anomalous performance discussed in Section 4.4.
Table 2.
Comparison with representative cephalometric AI studies. † SDR@2mm is low because the YOLO approach is optimized for the 4 mm threshold (SDR@4mm ); MRE reported only for S, N, A, B.
Table 2.
Comparison with representative cephalometric AI studies. † SDR@2mm is low because the YOLO approach is optimized for the 4 mm threshold (SDR@4mm ); MRE reported only for S, N, A, B.
| Study | Year | Architecture | Dataset | LM | MRE (mm) | SDR@2mm (%) |
|---|---|---|---|---|---|---|
| Lindner & Cootes [7] | 2015 | Random Forest | 400 | 19 | 1.6–1.7 | ∼74.8 |
| Park et al. [15] | 2019 | Cascaded CNN | 1028 | 19 | ∼85 | |
| Kim et al. [16] | 2020 | Stacked Hourglass | 2075 | 23 | ∼81 | |
| Lee et al. [17] | 2022 | Bayesian YOLOv5 | 1028 | 20 | ∼72 | |
| Dai et al. [18] | 2025 | Dual-Enc. Transformer | 400+ | 19 | — | 89.5–90.7 |
| Present study | 2025 | YOLOv11 variants | 4255 | 4 |
Disclaimer/Publisher’s Note: The statements, opinions and data contained in all publications are solely those of the individual author(s) and contributor(s) and not of MDPI and/or the editor(s). MDPI and/or the editor(s) disclaim responsibility for any injury to people or property resulting from any ideas, methods, instructions or products referred to in the content. |
© 2026 by the authors. Licensee MDPI, Basel, Switzerland. This article is an open access article distributed under the terms and conditions of the Creative Commons Attribution (CC BY) license.
Copyright: This open access article is published under a Creative Commons CC BY 4.0 license, which permit the free download, distribution, and reuse, provided that the author and preprint are cited in any reuse.