Submitted:
14 April 2026
Posted:
30 April 2026
You are already at the latest version
Abstract
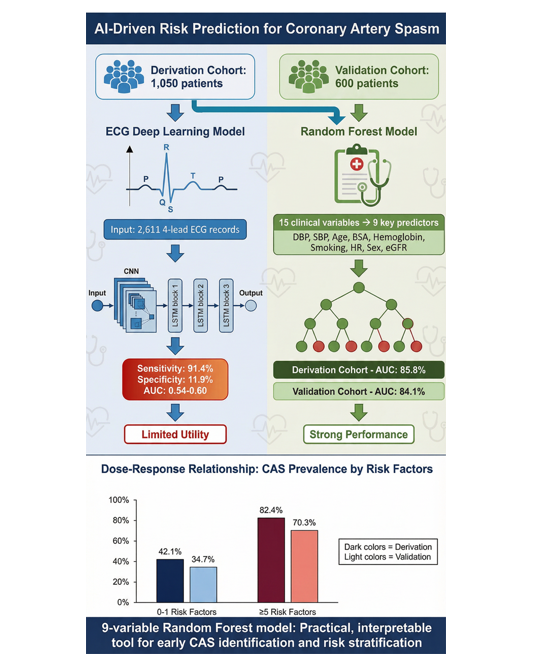
Background: Epicardial coronary artery spasm (CAS) is a frequent and important cause of myocardial ischemia. We aimed to develop and validate a noninvasive, artificial intelligence (AI)-driven risk score using routine clinical data to predict CAS in patients without obstructive coronary artery disease (CAD). Methods: Between September 2008 and March 2025, this retrospective study analyzed a derivation cohort of 1,050 patients and an external validation cohort of 600 patients who underwent intracoronary methylergonovine provocation testing. A Random Forest (RF) model was developed using 15 clinical variables and simplified to a 9-variable model. Additionally, a convolutional neural network-long short-term memory (CNN-LSTM) deep learning model was implemented to predict CAS from raw digital electrocardiogram data (2,611 electrocardiogram records). Results: The final 9-variable RF model, including predictors such as diastolic/systolic blood pressure, age, BSA, hemoglobin, smoking, heart rate, sex, and estimated glomerular filtration rate, demonstrated strong discriminatory power. The area under the curve was 85.8% (95% confidence interval [CI]: 85.8–89.9%) in the derivation cohort and 84.1% in the validation cohort (95% CI: 80.6–87.7%). A dose-response relationship was confirmed, with CAS prevalence increasing from 42.1% (0–1 risk factors) to 82.4% (≥5 risk factors). The electrocardiogram-based CNN-LSTM deep learning model achieved high sensitivity (91.4%) but limited specificity (11.9%), indicating strong detection capability for CAS. Conclusions: A 9-variable RF model provides a practical and accurate tool for early identification and risk stratification of CAS. The electrocardiogram deep learning model complements the RF model to improve clinical decisions and resource allocation in diagnosing CAS.
Keywords:
artificial intelligence
; coronary artery spasm
; risk prediction score
1. Introduction
Epicardial large coronary artery spasm (CAS) is characterized by pronounced vasoconstriction of vascular smooth muscle cells, leading to total or partial narrowing of the lumen and potentially resulting in stable or unstable angina, myocardial ischemia or infarction, and sudden cardiac death [1,2,3]. With rising public awareness of CAS, cardiology decisions are more complex, requiring effective diagnosis and better patient care. While the Framingham Heart Study created the first formulas for predicting cardiovascular risk [4], most traditional coronary artery disease (CAD) models exclude unstructured data such as heart rate, which may oversimplify coronary health and overlook important predictive variables. Smoking, age, and C-reactive protein are risk factors for CAS, but contrary to CAD, CAS is not linked to traditional risk factors such as obesity, diabetes, and hypertension, indicating pathophysiological differences between the 2 conditions [5]. On the other hand, while invasive provocative testing remains the gold standard for diagnosing CAS, noninvasive scoring systems can aid in earlier detection and guide treatment. Artificial intelligence (AI), incorporating computational algorithms to simulate and perform human problem solving and learning, is potentially useful in predicting cardiovascular outcomes, heart failure, arrhythmia and atherosclerotic/obstructive CAD. AI, digital technologies and precision medicine will shape the future of cardiology, especially coronary disorders. However, thus far, no AI-enabled algorithms but only one clinical score system in predicting CAS has achieved a high area under the curve of 0.952 [6], among which 3 score variables-namely asthma, ST-segment elevation, and the hyperventilation test-warrant consideration. First, fewer than 4% of CAS involve asthma [7]. Second, initial electrocardiograms (ECGs) may be normal during early-stage or mild CAS [5]. Third, ST-segment depression occurs more commonly than elevation in CAS [5]. Fourth, the hyperventilation provocative test demonstrates reduced sensitivity in infrequent CAS attacks and may trigger multi-vessel CAS [5]. Consequently, the scarcity of alternative CAS risk prediction models underscores the importance of further research on CAS.
Because CAS plays a critical role in rapid plaque progression [8] and given the increased risk of myocardial infarction and all-cause mortality, a large body of evidence and professional society guidelines have shown improved outcomes with early treatment of CAS [9,10]. The complexity of ECGs and the varied symptoms and risk factors in CAS patients have slowed AI adoption for CAS identification. CAS risk is typically assessed using factors such as age, sex, medical history, smoking exposure, C-reactive protein levels, symptoms, and ischemic electrocardiographic changes during attacks [5]. Multiple risk factors may appear concurrently in an individual and can interact to elevate the likelihood of developing CAS [5], indicating that adopting a multifactorial strategy is the best for prevention of CAS. Timely detection and precise prediction of CAS play a vital role in reducing cardiovascular events, particularly among people with several minor abnormalities. Most CAS subjects have ≤4 risk factors, and coronary risk estimates are generally more accurate for those with fewer risk factors.
While machine learning (ML) offers significant potential for better predicting patient outcomes than conventional risk factor methods, its application in healthcare is hindered by methodological gaps in areas like algorithm blending, data standardization, feature optimization, and model tuning. A random forest (RF)-based interpretable AI framework has been proposed for predicting heart disease [11]. Currently, AI can detect CAD by analyzing health records, medical images such as ECGs, and genetics, providing more comprehensive and accurate risk assessment and treatment recommendations than traditional risk scores [12]. However, a significant gap remains in using AI to identify undiagnosed CAS without obstructive CAD. To address this, we evaluated the performance of a RF algorithm using clinical data and blood tests from primary care, benchmarking it against existing methods to create a more robust tool for predicting large epicardial CAS and improving clinical detection of undiagnosed cases in patients without obstructive CAD.
2. Material and Methods
2.1. Study Population
This retrospective study analyzed a prospectively enrolled patient cohort (September 2008–March 2025), all managed by Dr. Ming-Yow Hung at Shuang Ho Hospital in both clinic and hospital settings, ensuring complete data, consistent clinical decisions, and minimal treatment variability. During this period, 1,050 consecutive individuals with suspected ischemic heart disease but without angiographic evidence of obstructive CAD underwent intracoronary methylergonovine provocation testing. Patients were grouped by whether or not they had CAS. CAS was diagnosed by rest angina, reversible ST-segment changes relieved with sublingual nitroglycerin, and a positive intracoronary methylergonovine test. The comparison group consisted of patients with atypical, non–exertion-related chest pain and negative provocation test results. The exclusion criteria included obstructive CAD, previous coronary angioplasty or myocardial infarction, coronary microvascular spasm, severe valvular heart disease, inflammatory manifestations probably associated with noncardiac diseases (e.g., infections and autoimmune disorders), liver disease/renal failure (serum creatinine level > 2.5 mg/dL), collagen disease, malignancy and missing blood samples (complete-case analysis). No patients demonstrated any allergic or hypersensitivity disorders. At Chang Gung Memorial Hospital, Keelung, Dr. Ming-Jui Hung managed another 600 consecutive patients who met the same enrollment criteria during this period. The larger hospital cohort was designated as the derivation cohort, whereas the smaller cohort served as the external validation cohort. Limiting each hospital to one attending physician ensured consistent decisions and reduced treatment variability in the study. The study was reviewed and approved by the Taipei Medical University–Joint Institutional Review Board (approval number 201011004) and Chang Gung Memorial Hospital Institutional Review Board (approval number 103-4592B). All patients gave written informed consent.
2.2. Clinical Data
Patients were assessed for the presence of the following cardiac risk factors: age, sex, cigarette smoking status, diabetes mellitus, hypercholesterolemia, and hypertension. Current smoking status was defined as at least 0.5 pack year and having smoked at least 1 cigarette within 3 weeks of cardiac catheterization. Patients were determined to have diabetes mellitus if they were currently on dietary treatment and/or medical therapy for diabetes mellitus. The average baseline self-measured home blood pressure was calculated from at least 12 seated systolic and diastolic readings taken over a minimum of 3 days, ideally across 7 days. Hypertension was defined as blood pressure of >130/80 mm Hg or receiving antihypertensive treatment. Hypercholesterolemia was diagnosed in patients with serum total cholesterol >200 mg/dL. All patients underwent echocardiography, when heart rates were recorded, before coronary angiography and within 2 weeks of the last angina.
2.3. Laboratory Analysis
Data for serum creatinine, estimated glomerular filtration rate, hemoglobin, hematocrit, platelet counts, white blood cell count, monocyte counts, blood glucose, hemoglobin A1c, total cholesterol, triglycerides, high-density lipoprotein and low-density lipoprotein were obtained on admission. The estimated glomerular filtration rate was calculated from the Japanese equation: glomerular filtration rate (mL/min per 1.73 m2)=194×serum creatinine−1.094×age−0.287 (if female, ×0.739) [13].
2.4. ECG Dataset Composition, Preprocessing, Model Architecture and Training Strategy
We implemented convolutional neural networks (CNNs)-long short-term memory (LSTM), namely the ECG-AI model, to predict CAS from raw digital ECG data. The parsing criteria for ECG was based on ≤90 days before coronary angiography. The dataset included 2,611 ECG records from Shuang Ho Hospital: 2,022 in the CAS group (77.4%) and 589 controls (22.6%). Because multiple ECGs per patient were available, data were partitioned at the record level into training, validation, and test sets using a 70%/10%/20% split (1,827/261/523 records), while maintaining the same class distribution across splits. Inputs consisted of synchronous 4-lead ECG signals with 2,952 time points per lead (input shape: 2,952 × 4) at standard gain (10 mm/mV). Signals were standardized using Z-score normalization (mean 0, standard deviation 1). To mitigate class imbalance during training, class weights were applied (control: 2.217; CAS: 0.646). Normalization parameters were stored for reproducibility (normalization_params_cnn_lstm.npz). A hybrid CNN–LSTM architecture (version v1) was implemented with 394,305 total parameters. The feature extraction module included three 1D convolutional blocks with kernel sizes of 7, 5, and 3 and filter sizes of 64, 128, and 256, respectively. Each block incorporated batch normalization, max pooling, and dropout (rate 0.30). Temporal dynamics were modeled using two stacked LSTM layers (128 units with return_sequences=True followed by 64 units), with dropout (rate 0.40) for regularization. The classification head consisted of a dense layer (64 units, ReLU), batch normalization, dropout (rate 0.50), and a sigmoid output node for binary classification. The model was trained using the Adam optimizer (initial learning rate 0.001) with binary cross-entropy loss, using a batch size of 32 for up to 100 epochs with early stopping. Validation area under the curve (val_auc) guided learning-rate scheduling and model selection. ReduceLROnPlateau was configured with monitor=val_auc, patience=5 epochs, factor=0.5, and min_lr=1×10⁻⁶. EarlyStopping monitored val_auc with patience=20 epochs and restore_best_weights=True. The final model was saved as final_cnn_lstm_model_v1.h5, and the best checkpoint by validation AUC was saved as best_cnn_lstm_model.h5.
2.5. Predictors of Interest
The objective of this study was to evaluate the utility and accuracy of a risk score—constructed from routinely available clinical measurements—to identify patients with undiagnosed CAS in the absence of obstructive CAD. Accordingly, we focused on candidate predictors that are widely used in clinical practice and incur minimal cost. A total of 15 variables were considered: age, sex, smoking status, body surface area (BSA), heart rate, systolic blood pressure (SBP), diastolic blood pressure (DBP), diabetes, hypertension, left ventricular ejection fraction, hemoglobin, estimated glomerular filtration rate (eGFR), platelet count, total cholesterol, and white blood cell count. Among these variables, we selected representative predictors from pairs of highly correlated measurements to avoid redundancy. Specifically, body surface area was chosen over body mass index; eGFR over serum creatinine; hemoglobin over hematocrit; and white blood cell count over monocyte count. For lipid parameters, total cholesterol was used as the representative measure. The variables highlighted in Table 1 are the last added to the model.
2.6. Coronary Angiography and Intracoronary Methylergonovine Testing
Coronary angiography was performed within 2 months of chest pain using the standard Judkins technique via a femoral or a radial approach. Nitrates and calcium antagonists were withdrawn for ≥24 hours before coronary angiography. The LV ejection fraction was calculated using Simpson’s method. Selective left and right coronary angiography were performed in multiple axial and hemiaxial projections. Obstructive CAD was defined as ≥50% diameter reduction in lumen caliber after administration of intracoronary nitroglycerin (100 μg) [14]. Intracoronary methylergonovine (Methergin®; Novartis, Basel, Switzerland) provocation testing was performed in succession if no obstructive CAD was found. Methylergonovine was administered stepwise (1, 5, 10, 30 μg) first into the right coronary artery and subsequently into the left coronary artery. Provocation testing for CAS was considered positive when there was a >70% reduction in luminal diameter compared to post intracoronary nitroglycerin and when there was associated angina and/or ST depression or elevation [5]. Provocation testing was stopped with intracoronary nitroglycerin 100-200 μg (Millisrol®; G. Pohl-Boskamp, Hohenlockstedt, Germany). The observation of reversal changes in the coronary artery diameter further confirmed the diagnosis of CAS. Spontaneous CAS was defined as the relief of >70% diameter stenosis after intracoronary nitroglycerin 100-200 μg administration.
2.7. RF Model
Over the past three decades, machine-learning methods—including support vector machines, boosted trees (such as adaptive boosting), and k-nearest neighbors—have advanced substantially. Since its introduction in 2001, RF has been remarkably successful as a general-purpose algorithm for both classification and regression [15]. Across diverse benchmarking studies, RF consistently ranks among the most stable and best-performing methods, demonstrating strong predictive accuracy, robustness to noise, and minimal risk of overfitting [16]. Notably, RF also overwhelmingly outperforms traditional statistical approaches such as single decision trees, linear discriminant analysis, and logistic regression. For these reasons, we selected RF as the predictive modeling approach for this study. An ensemble of 500 trees was constructed using mtry = 3 and a minimum of 75 observations allowed in terminal nodes. At each split, a randomly selected subset of predictors was evaluated to identify the optimal partition that maximized class separation. Individual predicted probabilities were obtained by averaging the tree-specific predictions across the entire forest. Variable importance (VIMP) scores were then used to rank the relative prognostic contributions of each predictor.
For selecting the final set of predictors in the RF model, we used VIMP rankings to identify the point at which the contribution of additional variables markedly diminished. In the initial RF model, predictors were ordered by VIMP from highest to lowest. When the VIMP values exhibited a pronounced drop at a particular rank (e.g., between the 9th and 10th variables out of 15), and the RF model constructed with the top 9 variables above that threshold already demonstrated strong discriminatory performance (e.g., AUC > 0.85), we selected that reduced set—such as a 9-variable RF model—as the final model (Figure 1).
2.8. Predictive Behavior Analysis of RF Variables
To examine how each of the 9 key predictors was associated with the risk of CAS, we generated partial dependence plots (PDPs) using established methodologies. These plots depict the nonlinear marginal effect of each individual predictor on outcome risk while holding all other variables constant. Among the 9 predictors, 2 were binary—current smoking and male sex—and both exhibited higher risk across the entire range of the PDPs (Figure 3). For the remaining 7 continuous predictors, we defined clinically meaningful thresholds based on both established clinical knowledge and the observed distributional patterns in the data. Specifically, risk factors were classified as DBP <70 mmHg, SBP <130 mmHg, age ≥60 years, body surface area between 1.7 and 2.0 m2, hemoglobin ≥13 g/dL, heart rate <60 bpm, and eGFR between 90 and 120 mL/min/1.73 m2 (Figure 3). These thresholds were therefore not arbitrarily selected but were derived by integrating the patterns observed in the PDPs with clinically grounded rationale.
2.9. Statistical Analysis
Comparisons of baseline demographic and clinical characteristics between groups (i.e., the derivation and validation cohorts; CAS vs. non-CAS control) were conducted using chi-square tests for categorical variables and independent samples t-tests for continuous variables. The 9-variable RF model was then applied to the independent validation cohort to assess external performance. To further examine the clinical relevance of the identified predictors, the entire study population was categorized into 5 groups according to the number of risk factors present (0–1, 2, 3, 4, and ≥5). The association between these strata and the likelihood of CAS was evaluated using univariable logistic regression, with individuals carrying no predictors (0–1 group) serving as the reference. In a separate analysis, the number of predictors was treated as an ordinal variable to assess the presence of a dose–response trend. RF model development and validation were performed in R version 4.4.1 using the “caret” package, while all remaining statistical analyses were conducted in SAS version 9.4 (SAS Institute, Cary, NC, USA). All tests were 2-tailed and P <0.05 was considered statistically significant.
3. Results
3.1. ECG Training Dynamics, Performance Evaluation and Confusion Matrix Analysis
The training process was halted after Epoch 31 by an automated early stopping process designed to prevent overfitting. The best model was identified at Epoch 11, where the training and validation metrics showed an optimal balance (validation AUC = 0.5436). Although later training cycles, such as Epoch 17, showed an increase in the validation AUC to 60.38%, this was accompanied by a significant drop in accuracy and higher loss, indicating overfitting of the training data. On a 523-sample test set, the model demonstrated a significant bias, achieving 73.42% accuracy but a low AUC of 0.5365. It excelled at identifying the CAS class with 91.4% sensitivity (370 true positives), but performed poorly on the control class, with only 11.9% specificity (14 true negatives). This imbalance resulted in a high false positive rate of 88.1%, as 104 control cases were misclassified as CAS, indicating the model tends to over-predict the CAS class (Table 1).
3.2. Patient Characteristics
In the derivation cohort, 50% of participants were male and the mean age was 56 years, whereas the validation cohort included a higher proportion of men (58%) and had a slightly older mean age of 57 years (Table 2).
Compared to the derivation cohort, the validation cohort had more smokers, smaller body surface area, faster heart rates, higher blood pressure, greater prevalence of diabetes and hypertension, higher left ventricular ejection fraction, poorer renal function, less favorable lipid profiles, lower platelet and monocyte counts, and higher white blood cell counts. It’s worth noting that the derivation cohort had a higher proportion of CAS (68%, 709 cases) compared to the validation cohort (48%, 289 cases). Due to significant variations in baseline characteristics and disease prevalence across the 2 cohorts, employing this independent validation cohort offers a robust and practical evaluation of the model’s external generalizability. The baseline characteristics of participants with and without CAS were presented in Table 3.
CAS, coronary artery spasm; eGFR, estimated glomerular filtration rate. Data are presented as frequency (percentage) or mean ± standard deviation.
3.3. RF Model Development and Predictor Selection
An initial 15-predictor RF model, developed from a derivation cohort of 1,050 patients (64% of 1,650 total), achieved a strong AUC of 87.8% (95% CI, 85.8–89.9) (Figure 1).
BSA indicated body surface area; DBP, diastolic blood pressure; eGFR, estimated glomerular filtration rate; LVEF, left ventricular ejection fraction; SBP, systolic blood pressure; WBC, white blood cell.
VIMP analysis identified DBP as the most influential predictor (Table 4), followed by SBP, age, BSA, hemoglobin, smoking status, heart rate, sex, and eGFR. To assess model parsimony, we analyzed RF models utilizing varying numbers of predictors (Table 5).
Based on these findings and a clear decline in VIMP after the ninth predictor, a more parsimonious 9-variable model was created, which demonstrated robust performance with an AUC of 85.8% (95% CI, 83.6–88.1) in the derivation set with a minor decrease of about 2% from the full model (Figure 2A). The 9-variable model’s robustness was confirmed through external validation on a cohort of 600 patients, yielding an AUC of 84.1% (95% CI, 80.6–87.7%) (Figure 2B).
Partial dependence analyses were also conducted to illustrate the functional links between each predictor and CAS risk (Figure 3).
3.4. Prognostic Implication of Identified Risk Factors
CAS risk assessment showed that event rates rose stepwise with more predictors, a trend seen in both derivation and validation cohorts (Figure 4).
In the derivation cohort, CAS prevalence increased with additional risk factors: 42.1% (0–1), 59.3% (2), 64.5% (3), 72.5% (4), and 82.4% (5 or more) (P for trend <0.001; Figure 4A). A comparable monotonic gradient was observed in the validation cohort, with CAS rates of 34.7%, 33.3%, 47.3%, 55.1%, and 70.3% across the respective strata (P for trend <0.001; Figure 4B). Notably, the validation cohort had different baseline characteristics and CAS prevalence compared to the derivation cohort, yet the consistent dose–response relationship in both groups highlights the model’s robustness and broad generalizability.
4. Discussion
The primary strength of the proposed ECG CNN-LSTM model lay in its high sensitivity (91% Recall for CAS), making this system suitable as a high-sensitivity preliminary screening tool. However, the model’s low specificity renders it unsuitable for standalone diagnostic use. To enhance risk prediction using the RF algorithm across diverse populations, the derivation cohort (68% CAS prevalence) and validation cohort (48% CAS prevalence) demonstrated significant baseline differences, providing a robust test of external generalizability. VIMP analysis of the initial 15 candidate predictors identified DBP, SBP, age, BSA, hemoglobin, smoking status, heart rate, sex, and eGFR as key predictors. This streamlined 9-variable model achieved an AUC of 85.8% (95% CI, 83.6–88.1%), only marginally lower than the full 15-variable model (87.8%), and maintained strong external validity with an AUC of 84.1% (95% CI, 80.6–87.7%). A clear dose-response relationship between the number of risk factors and CAS prevalence was observed in both cohorts (derivation: 42.1%–82.4%; validation: 34.7%–70.3%; P for trend <0.001). We demonstrated for the first time that a parsimonious 9-variable RF algorithm incorporating key hemodynamic and clinical predictors provides robust and generalizable risk stratification model for CAS prediction across diverse populations.
Recent advancements in AI and deep learning have significantly enhanced ECG interpretation, revealing diagnostic details that surpass the capabilities of human interpreters. This is particularly evident in the context of CAD, where the diagnostic accuracy of conventional ECG analysis has long been recognized as limited. A study by Mahmoodzadeh et al. involving 400 patients with suspected CAD reported a sensitivity of 51.5% and specificity of 66.1% for 12-lead ECGs, with AUCs ranging from 0.524 to 0.586, underscoring the challenges of diagnosing CAD from a resting ECG [17]. A deep learning model by Sun et al. demonstrated strong performance in ruling out CAD, achieving an AUC of 0.81 and a high sensitivity of 93%, despite a low specificity of 30%.17 With a 95% negative predictive value, it effectively rules out CAD and aligns with current guidelines [18]. Similarly, the ECG2CAD model developed by Kany et al. showed robust performance across large cohorts, with an AUC between 0.747 and 0.782 for detecting prevalent CAD [19]. Conversely, diagnosing CAS from a resting ECG is challenging due to the brief nature of spasm episodes. Our model, while conceptually ambitious in its attempt to detect CAS from ECGs recorded up to 90 days before angiography, is an academic proof-of-concept not yet suitable for clinical use. Its low AUC indicates a weak signal, although its high sensitivity suggests it may be capturing a non-specific pattern associated with CAS. Future work will focus on methodological improvements, such as re-train and validate the model using strict patient-level splits for accurate performance estimates, to enhance the model’s performance and generalizability.
ML models, particularly RF, excel at predicting individual disease outcomes by identifying complex, non-linear patterns in diverse datasets that traditional statistical methods often miss, especially in fields like cardiovascular disease. RF is well-suited for clinical data, which is often small and noisy, as it uses ensemble learning to reduce overfitting and improve stability. Unlike other ML models such as k-nearest neighbors, support vector machine, or Adaptive Boosting, RF requires minimal preprocessing and is less sensitive to noise and class imbalance, making it a reliable choice for disease prediction research [20]. While ML has been effective in predicting cardiovascular disease, prior CAS prediction studies have relied on traditional risk scoring rather than modern ML methods [6,21,22]. leaving a gap in the literature. Existing 3 diagnostic scores for CAS have limitations, such as over-reliance on hyperventilation tests [6], applicability to limited patient populations in acute coronary syndrome patients without persistent ST-segment elevation [22] or limited to a single Taiwanese center with no external validation, raising concerns about generalizability to diverse populations and real-world clinical settings [21]. Furthermore, methodological weaknesses in some studies, such as the use of random train-validation data splits [6,22], may lead to overly optimistic performance estimates. In contrast, the RF algorithm is widely recognized as a leading AI algorithm for its balanced combination of accuracy, robustness, and interpretability in disease prediction [23].
Hypertension is less common in CAS-induced angina than in classic angina [24], and several studies have linked low blood pressure, particularly low DBP, to an increased risk of CAS [25,26,27]. This is supported by our findings that non-hypertensive smokers are at a greater risk for CAS [2]. In rats, hypertension reduces coronary artery contractile responses to serotonin [28], and contractile smooth muscle cells, not synthetic ones, are mainly involved in CAS development [29]. Mechanistically, low blood pressure, particularly low DBP, may reduce coronary perfusion and enhance endothelin-induced constriction, contributing to CAS [30]. The higher heart rates and blood pressures observed in our validation cohort may reflect different pathophysiological profiles. Although the exact mechanism of CAS is unclear, stimulation of both sympathetic and parasympathetic systems can induce CAS, suggesting a link to autonomic dysregulation [31]. Right CAS often leads to inferior wall ischemia, bradycardia, and supra-His conduction disorders, while left CAS can cause infra-His blocks. As a result, sinus bradycardia is more common than sinus tachycardia in CAS [32], supporting our finding that CAS is associated with a slower resting heart rate [31,32].
Age, smoking, and male sex are significant risk factors for CAS,1 with smoking having a stronger effect on younger individuals and men [33,34]. Smoking promotes CAS through various pathways, including inflammation, endothelial dysfunction, and increased blood viscosity [35,36]. However, a substantial portion of CAS patients are non-smokers (ranging from 25% to over 60% in some studies) [21,25,34], and there are notable differences in CAS prevalence between populations with similar smoking rates, suggesting the influence of other genetic or environmental factors [37]. Men are more prone to epicardial CAS than women [2,5], which may be partly due to a higher prevalence of smoking [38]. In cases of nonobstructive CAD, men are more likely to experience epicardial CAS, while women more frequently have microvascular CAS. Studies show that middle-aged women have higher resting coronary blood flow and smaller coronary arteries than men [39], likely due to differences in cardiac autonomic regulation [40], leading to a lower coronary flow reserve [41]. For a given level of coronary stenosis, women often exhibit a higher fractional flow reserve than men due to sex-based differences in vasomotion [42], despite similar microvascular resistance indices in both sexes with ischemia and nonobstructive CAD [41]. The higher prevalence of epicardial CAS in men than in women may be attributed to reduced resting coronary flow, lack of estradiol-induced vasodilation, lower fractional flow reserve, and higher smoking rates.
BSA is a more accurate indicator of metabolic mass than body mass index and is an independent predictor of coronary artery size and cardiovascular risk [43]. Higher BSA may lead to higher insulin secretion [44], which can lead to insulin resistance [45] and endothelial dysfunction, both of which are linked to CAS [46,47]. Therefore, BSA is a valuable clinical variable for assessing coronary inflammation and related cardiac risks.
Hemoglobin inhibits endothelium-dependent relaxation [48]. In patients with JAK2V617F myeloproliferative neoplasms, oxidative stress from erythrocyte-derived microvesicles increase the risk of myocardial infarction even without significant CAD [49]. Both low and high hemoglobin levels are associated with worse outcomes in CAD, following a J-shaped curve [50]. Conversely, mild anemia can be beneficial in cases of cerebral spasm by lowering blood viscosity [48]. In non–ST-segment elevation acute coronary syndrome, patients with CAS tend to have higher hemoglobin levels than those with obstructive CAD [22,51]. Our previous research indicated a dose-dependent effect of hemoglobin on CAS development in women but not in men [36], suggesting that hormonal differences may play a role [52,53].
In patients with acute coronary syndrome, those with CAS tend to have a higher eGFR than those with obstructive CAD [22,51,54]. We previously demonstrated that non-diabetic CAS patients have higher glycated hemoglobin levels than non-diabetic non-CAS controls [55]. While CAS and coronary microvascular dysfunction are viewed as points along a continuum, recent studies suggest a link between high glycated hemoglobin, elevated eGFR and coronary microvascular dysfunction, indicating a connection between insulin resistance, glomerular hyperfiltration, and CAS [55,56]. The proposed hypothesis is that metabolic dysregulation, indicated by high glycated hemoglobin levels, contributes to glomerular hyperfiltration, coronary microvascular dysfunction and CAS. However, a low eGFR could also be a risk factor for CAS [57]. Further study is needed to clarify how these factors interact and which eGFR levels increase the risk of CAS compared to obstructive CAD.
Unlike previous CAS prediction scores, which had limitations such as reliance on tests with moderate sensitivity or applicability restricted to acute coronary syndrome, this RF model uses widely available clinical data and offers external validation across populations with different baseline characteristics and CAS prevalence. However, this study had several limitations. First, ECG records were split at the record level rather than the patient level, while multiple ECGs per patient were common; consequently, ECGs from the same patient may have appeared in both training and test sets, introducing information leakage and potentially inflating apparent performance. Improvements such as patient-level data splitting, data augmentation, alternative loss functions and performance on external cohorts are needed for clinical applicability. The CNN-LSTM ECG model suffered from overfitting and class imbalance, resulting in low specificity and high false-positive rates. Second, despite the use of class weights to address data disparities, AI-enabled CNN-LSTM hybrid architecture for the detection of CAS using ECG demonstrated a bias towards the majority CAS class. This is further highlighted by the low specificity of 11.9%, which implies a high rate of false alarms and could lead to unnecessary secondary examinations if the model were used as a standalone diagnostic tool. Future work will focus on improving specificity through advanced data augmentation, incorporating Focal Loss, and exploring attention mechanisms to better balance the classification performance. Third, traditional methods assume linear relationships and often require strict handling of missing data, whereas ML can flexibly model complex, non-linear patterns with fewer restrictions.19 Despite their capabilities, ML methods encounter similar issues with confounders and bias as traditional analyses. Selection bias can still affect how broadly results apply, no matter the method used. Misclassifying exposures or predictors due to self-reporting, poor measurement, or limited historical data can lower a model’s predictive accuracy, especially if errors are systematic. Fourth, if cardiovascular events rise, all risk estimation systems will underestimate risk. Recalibration is needed when accurate, contemporary data on event rates and risk factors are available. Fifth, this study used data from Asian centers, so its findings may not apply to other populations. Additional research with more diverse ethnic and racial groups is needed for validation.
5. Conclusions
We created 2 machine learning models for CAS risk prediction. A CNN-LSTM model using raw 4-lead ECG signals showed potential for first-stage large-scale population screening with 73.4% accuracy and 91% recall, but its low specificity limits standalone use. To improve CAS risk prediction across diverse populations, a RF model was trained and validated on cohorts with significant different baseline characteristics and CAS prevalence (68% and 48%), streamlining 15 candidates into 9 key predictors: DBP, SBP, age, BSA, hemoglobin, smoking, heart rate, sex, and eGFR. This parsimonious model achieved an AUC of 85.8%, comparable to the complex 15-variable model (87.8%), with strong external validity (AUC 84.1%). A significant dose-response relationship between risk factors and CAS prevalence was identified in both cohorts, thereby validating its utility for clinical risk stratification. This ML approach balances accuracy and interpretability, aiding clinicians in early CAS diagnosis and prevention while demonstrating the value of explainable AI in healthcare.
Author Contributions
Conceptualization, M.-J.H. and M.-Y.H.; Methodology, IY Chen, Y.-N.L. and M.-Y.H.; Formal Analysis, Y.-N.L., C.H. and M.-Y.H.; Investigation, N.G.K., P.H., C.-T.Y.; Data Curation, M.-J.H. and M.-Y.H.; Writing—Original Draft Preparation, M.-J.H. and M.-Y.H.; Writing—Review and Editing, M.-Y.H.; Funding Acquisition: C.-T.Y. and M.-Y.H. All authors have read and agreed to the published version of the manuscript.
Funding
This research was funded by National Science Council of Taiwan (NSTC 112-2314-B-038-104-MY3) and Taipei Medical University (114TMU-SHH-13) to Ming-Yow Hung.
Institutional Review Board Statement
The study was conducted in accordance with the Declaration of Helsinki, and was approved by the Taipei Medical University-Joint Institutional Review Board (approval number: 201011004; date of approval: 20 December 2010).
Informed Consent Statement
Patient consent was waived due to this study being a retrospective analysis that does not use patient images. All patient information has been delinked and anonymized.
Data Availability Statement
The data presented in this study are not publicly available due to privacy and ethical restrictions but are available from the corresponding author upon reasonable request.
Acknowledgments
We thank Alfred Hsing-Fen Lin and Zoe Ya-Jhu Syu for their assistance in statistical analysis. We also thank the intellectual support from Taiwan Society of Coronary Artery Spasm.
Conflicts of Interest
The authors declare no conflicts of interest.
Nonstandard Abbreviations and Acronyms
AI: artificial intelligence; AUC: area under the curve; CAD: coronary artery disease; CAS: coronary artery spasm; CNN: convolutional neural networks; DBP: diastolic blood pressure; ECG: electrocardiogram; eGFR: estimated glomerular filtration rate; ML: machine learning; LSTM: long short-term memory; RF: random forest; SBP: systolic blood pressure; VIMP: variable importance.
References
- Hung, M.J.; Hsu, K.H.; Chang, N.C.; Hung, M.Y. Increased Numbers of Coronary Events in Winter and Spring Due to Coronary Artery Spasm: Effect of Age, Sex, Smoking, and Inflammation. J. Am. Coll. Cardiol. 2015, 65, 2047–2048. [Google Scholar] [CrossRef]
- Hung, M.Y.; Hsu, K.H.; Hung, M.J.; Cheng, C.W.; Cherng, W.J. Interactions among gender, age, hypertension and C-reactive protein in coronary vasospasm. Eur. J. Clin. Invest. 2010, 40, 1094–1103. [Google Scholar] [CrossRef]
- Teragawa, H.; Orita, Y.; Oshita, C.; Uchimura, Y. Intracoronary Thrombogenicity in Patients with Vasospastic Angina: An Observation Using Coronary Angioscopy. Diagnostics. 2021, 11, 1632. [Google Scholar] [CrossRef] [PubMed]
- Bitton, A.; Gaziano, T.A. The Framingham Heart Study’s impact on global risk assessment. Prog. Cardiovasc. Dis. 2010, 53, 68–78. [Google Scholar] [CrossRef] [PubMed]
- Hung, M.J.; Hu, P.; Hung, M.Y. Coronary artery spasm: review and update. Int. J. Med. Sci. 2014, 11, 1161–1171. [Google Scholar] [CrossRef] [PubMed]
- Lin, Y.; Qin, H.; Chen, R.; Liu, Q.; Liu, H.; Dong, S. A comprehensive clinical diagnostic score system for prediction of coronary artery spasm in patients with acute chest pain. Int. J. Cardiol. Heart Vasc. 2019, 22, 205–209. [Google Scholar] [CrossRef]
- Hung, M.J.; Mao, C.T.; Hung, M.Y.; Chen, T.H. Impact of Asthma on the Development of Coronary Vasospastic Angina: A Population-Based Cohort Study. Medicine . 2015, 94, e1880. [Google Scholar] [CrossRef]
- Sakamoto, I.; Mohri, M.; Yamamoto, H. Images in cardiovascular medicine. Rapid progression of coronary atherosclerosis by coronary artery spasm leading to acute coronary syndrome. Circulation 2009, 119, 2233–2234. [Google Scholar] [CrossRef]
- Vrints, C.; Andreotti, F.; Koskinas, K.C.; Rossello, X.; Adamo, M.; Ainslie, J.; Banning, A.P.; Budaj, A.; Buechel, R.R.; Chiariello, G.A.; et al. ESC Scientific Document Group. 2024 ESC Guidelines for the management of chronic coronary syndromes. Eur. Hear. J. 2024, 45, 3415–3537. [Google Scholar] [CrossRef]
- Vervaat, F.E.; de Vos, A.; Schenk, J.; Tonino, P.A.L.; Wijnbergen, I.F. Treatment Modalities for Angina with Non-Obstructive Coronary Arteries (ANOCA): A Systematic Review and Meta-Analysis. J. Clin. Med. 2025, 14, 4069. [Google Scholar] [CrossRef]
- Kailasanathan, N.; Ezhilarasan, G.; Selvarajan, S.; Dhanaraj, R.K.; Pamucar, D.; Shankar, N. Heart disease prediction with a feature-sensitized interpretable framework for the Internet of Medical Things sensors. Front. Digit. Heal. 2025, 7, 1612915. [Google Scholar] [CrossRef] [PubMed]
- Yu, M.Y.; Yoo, H.Y.; Han, G.I.; Kim, E.J.; Son, Y.J. Comparing the Performance of Machine Learning Models and Conventional Risk Scores for Predicting Major Adverse Cardiovascular Cerebrovascular Events After Percutaneous Coronary Intervention in Patients With Acute Myocardial Infarction: Systematic Review and Meta-Analysis. J. Med. Internet Res. 2025, 27, e76215. [Google Scholar] [CrossRef]
- Matsuo, S.; Imai, E.; Horio, M.; Yasuda, Y.; Tomita, K.; Nitta, K.; Yamagata, K.; Tomino, Y.; Yokoyama, H.; Hishida, A. Collaborators developing the Japanese equation for estimated GFR. Revised equations for estimated GFR from serum creatinine in Japan. Am. J. Kidney Dis. 2009, 53, 982–992. [Google Scholar] [CrossRef]
- Sharaf, B.L.; Williams, D.O.; Miele, N.J.; McMahon, R.P.; Stone, P.H.; Bjerregaard, P.; Davies, R.; Goldberg, A.D.; Parks, M.; Pepine, C.J.; et al. A detailed angiographic analysis of patients with ambulatory electrocardiographic ischemia: results from the Asymptomatic Cardiac Ischemia Pilot (ACIP) study angiographic core laboratory. J. Am. Coll. Cardiol. 1997, 29, 78–84. [Google Scholar] [CrossRef]
- Biau, G.; Scornet, E. A random forest guided tour. TEST 2016, 25, 197–227. [Google Scholar] [CrossRef]
- Delgado, M.F.; Cernadas, E.; Barro, S.; Amorim, D. Do we need hundreds of classifiers to solve real world classification problems? J. Mach. Learn. Res. 2014, 15, 3133–3181. [Google Scholar]
- Mahmoodzadeh, S.; Moazenzadeh, M.; Rashidinejad, H.; Sheikhvatan, M. Diagnostic performance of electrocardiography in the assessment of significant coronary artery disease and its anatomical size in comparison with coronary angiography. J. Res. Med. Sci. 2011, 16, 750–755. [Google Scholar]
- Sun, R.; Zhu, X.; Lin, S.; Shi, M.; Yu, X.; Liu, C.; Yue, Y.; Zeng, J.; Zhao, Y.; Wang, X.; et al. Development and validation of a deep-learning algorithm for rule-in and rule-out coronary artery disease based on electrocardiogram without evidence of myocardial ischemia. Int. J. Cardiol. Heart Vasc. 2025, 60, 101772. [Google Scholar] [CrossRef]
- Kany, S.; Friedman, S.F.; Al-Alusi, M.; Khurshid, S.; Rämö, J.T.; Pipilas, D.; Pirruccello, J.P.; Reeder, C.; Philippakis, A.A.; Ho, J.E.; et al. Electrocardiogram-Based Artificial Intelligence to Identify Coronary Artery Disease. JACC Adv. 2025, 4, 102041. [Google Scholar] [CrossRef]
- Atias, D.; Ashri, S.; Goldbourt, U.; Benyamini, Y.; Gilad-Bachrach, R.; Hasin, T.; Gerber, Y.; Obolski, U. Machine learning in epidemiology: An introduction, comparison with traditional methods, and a case study of predicting extreme longevity. Ann. Epidemiol. 2025, 110, 23–33. [Google Scholar] [CrossRef] [PubMed]
- Lee, Y.C.; Chen, I.Y.; Hung, M.J.; Yeh, C.T.; Kounis, N.G.; Hu, P.; Hung, M.Y. Prediction of Coronary Artery Spasm in Patients Without Obstructive Coronary Artery Disease Using a Comprehensive Clinical, Laboratory and Echocardiographic Risk Score. J. Clin. Med. 2025, 14, 8721. [Google Scholar] [CrossRef]
- Gohbara, M.; Iwahashi, N.; Okada, K.; Ogino, Y.; Hanajima, Y.; Kirigaya, J.; Minamimoto, Y.; Matsuzawa, Y.; Nitta, M.; Konishi, M.; et al. A Simple Risk Score to Differentiate Between Coronary Artery Obstruction and Coronary Artery Spasm of Patients With Acute Coronary Syndrome Without Persistent ST-Segment Elevation. Circ. J. 2022, 86, 1509–1518. [Google Scholar] [CrossRef] [PubMed]
- Mohanty, P.K.; Francis, S.A.J.; Barik, R.K.; Roy, D.S.; Saikia, M.J. Leveraging Shapley Additive Explanations for Feature Selection in Ensemble Models for Diabetes Prediction. Bioengineering 2024, 11, 1215. [Google Scholar] [CrossRef]
- Sato, I.; Tomita, M.; Ohe, T.; Haze, K.; Shimomura, K. Age-related changes of clinical features and prevalences of coronary risk factors in Japanese patients with vasospastic angina. Chest 1986, 89, 12–19. [Google Scholar] [CrossRef]
- Sugiishi, M.; Takatsu, F. Cigarette smoking is a major risk factor for coronary spasm. Circulation 1993, 87, 76–79. [Google Scholar] [CrossRef] [PubMed]
- Chen, K.Y.; Rha, S.W.; Li, Y.J.; Poddar, K.L.; Jin, Z.; Minami, Y.; Saito, S.; Park, J.H.; Na, J.O.; Choi, C.U.; et al. Impact of hypertension on coronary artery spasm as assessed with intracoronary acetylcholine provocation test. J. Hum. Hypertens. 2010, 24, 77–85. [Google Scholar] [CrossRef]
- Morita, S.; Mizuno, Y.; Harada, E.; Nakagawa, H.; Morikawa, Y.; Saito, Y.; Katoh, D.; Kashiwagi, Y.; Yoshimura, M.; Murohara, T.; et al. Differences and interactions between risk factors for coronary spasm and atherosclerosis--smoking, aging, inflammation, and blood pressure. Intern. Med. 2014, 53, 2663–2670. [Google Scholar] [CrossRef]
- Tschudi, M.R.; Lüscher, T.F. Age and hypertension differently affect coronary contractions to endothelin-1, serotonin, and angiotensins. Circulation 1995, 91, 2415–2422. [Google Scholar] [CrossRef]
- Fukuda, N.; Hu, W.Y.; Satoh, C.; Nakayama, M.; Kishioka, H.; Kubo, A.; Kanmatsuse, K. Contribution of synthetic phenotype on the enhanced angiotensin II-generating system in vascular smooth muscle cells from spontaneously hypertensive rats. J. Hypertens. 1999, 17, 1099–1107. [Google Scholar] [CrossRef] [PubMed]
- Clozel, J.P.; Sprecher, U. Influence of low perfusion pressure on effect of endothelin on coronary vascular bed. Am. J. Physiol. 1991, 260, H893–H901. [Google Scholar] [CrossRef]
- Kim, H.; Cho, S.H.; Cho, K.I.; Kim, B.J.; Im, S.I.; Heo, J.H. Blunted heart rate recovery is associated with coronary artery spasm in patients with suspected vasospastic angina. Clin. Hypertens. 2017, 23, 24. [Google Scholar] [CrossRef]
- Hung, M.J.; Yeh, C.T.; Kounis, N.G.; Koniari, I.; Hu, P.; Hung, M.Y. Coronary Artery Spasm-Related Heart Failure Syndrome: Literature Review. Int. J. Mol. Sci. 2023, 24, 7530. [Google Scholar] [CrossRef]
- Hung, M.Y.; Hsu, K.H.; Hung, M.J.; Cheng, C.W.; Kuo, L.T.; Cherng, W.J. Interaction between cigarette smoking and high-sensitivity C-reactive protein in the development of coronary vasospasm in patients without hemodynamically significant coronary artery disease. Am. J. Med. Sci. 2009, 338, 440–446. [Google Scholar] [CrossRef]
- Hung, M.J.; Hsu, K.H.; Hu, W.S.; Chang, N.C.; Hung, M.Y. C-reactive protein for predicting prognosis and its gender-specific associations with diabetes mellitus and hypertension in the development of coronary artery spasm. PLoS ONE 2013, 8, e77655. [Google Scholar] [CrossRef] [PubMed]
- Hung, M.Y.; Wu, Y.H.; Bamodu, O.A.; Chen, X.; Lin, Y.K.; Hu, P.; Chang, N.C.; Pang, J.S.; Yeh, C.T. Activation of the monocytic α7 nicotinic acetylcholine receptor modulates oxidative stress and inflammation-associated development of coronary artery spasm via a p38 MAP-kinase signaling-dependent pathway. Free Radic. Biol. Med. 2018, 120, 266–276. [Google Scholar] [CrossRef] [PubMed]
- Hung, M.Y.; Hsu, K.H.; Hu, W.S.; Chang, N.C.; Huang, C.Y.; Hung, M.J. Gender-specific prognosis and risk impact of C-reactive protein, hemoglobin and platelet in the development of coronary spasm. Int. J. Med. Sci. 2013, 10, 255–264. [Google Scholar] [CrossRef]
- Pristipino, C.; Beltrame, J.F.; Finocchiaro, M.L.; Hattori, R.; Fujita, M.; Mongiardo, R.; Cianflone, D.; Sanna, T.; Sasayama, S.; Maseri, A. Major racial differences in coronary constrictor response between japanese and caucasians with recent myocardial infarction. Circulation 2000, 101, 1102–1108. [Google Scholar] [CrossRef]
- Takaoka, K.; Yoshimura, M.; Ogawa, H.; Kugiyama, K.; Nakayama, M.; Shimasaki, Y.; Mizuno, Y.; Sakamoto, T.; Yasue, H. Comparison of the risk factors for coronary artery spasm with those for organic stenosis in a Japanese population: role of cigarette smoking. Int. J. Cardiol. 2000, 72, 121–126. [Google Scholar] [CrossRef]
- Corban, M.T.; Prasad, A.; Gulati, R.; Lerman, L.O.; Lerman, A. Sex-specific differences in coronary blood flow and flow velocity reserve in symptomatic patients with non-obstructive disease. EuroIntervention 2021, 16, 1079–1084. [Google Scholar] [CrossRef] [PubMed]
- Mehta, P.K.; Bess, C.; Elias-Smale, S.; Vaccarino, V.; Quyyumi, A.; Pepine, C.J.; Bairey Merz, C.N. Gender in cardiovascular medicine: chest pain and coronary artery disease. Eur. Heart J. 2019, 40, 3819–3826. [Google Scholar] [CrossRef] [PubMed]
- Kobayashi, Y.; Fearon, W.F.; Honda, Y.; Tanaka, S.; Pargaonkar, V.; Fitzgerald, P.J.; Lee, D.P.; Stefanick, M.; Yeung, A.C.; Tremmel, J.A. Effect of Sex Differences on Invasive Measures of Coronary Microvascular Dysfunction in Patients With Angina in the Absence of Obstructive Coronary Artery Disease. JACC Cardiovasc. Interv. 2015, 8, 1433–1441. [Google Scholar] [CrossRef]
- Hoshino, M.; Hamaya, R.; Kanaji, Y.; Kanno, Y.; Hada, M.; Yamaguchi, M.; Sumino, Y.; Hirano, H.; Horie, T.; Usui, E.; et al. Sex Differences in Long-Term Outcomes in Patients With Deferred Revascularization Following Fractional Flow Reserve Assessment: International Collaboration Registry of Comprehensive Physiologic Evaluation. J. Am. Heart Assoc. 2020, 9, e014458. [Google Scholar] [CrossRef]
- Kim, S.G.; Apple, S.; Mintz, G.S.; McMillan, T.; Caños, D.A.; Maehara, A.; Weissman, N.J. The importance of gender on coronary artery size: in-vivo assessment by intravascular ultrasound. Clin. Cardiol. 2004, 27, 291–294. [Google Scholar] [CrossRef] [PubMed]
- van Vliet, S.; Koh, H.E.; Patterson, B.W.; Yoshino, M.; LaForest, R.; Gropler, R.J.; Klein, S.; Mittendorfer, B. Obesity Is Associated With Increased Basal and Postprandial β-Cell Insulin Secretion Even in the Absence of Insulin Resistance. Diabetes 2020, 69, 2112–2119. [Google Scholar] [CrossRef]
- Janssen, J.A.M.J.L. Hyperinsulinemia and Its Pivotal Role in Aging, Obesity, Type 2 Diabetes, Cardiovascular Disease and Cancer. Int. J. Mol. Sci. 2021, 22, 7797. [Google Scholar] [CrossRef] [PubMed]
- Shinozaki, K.; Suzuki, M.; Ikebuchi, M.; Takaki, H.; Hara, Y.; Tsushima, M.; Harano, Y. Insulin resistance associated with compensatory hyperinsulinemia as an independent risk factor for vasospastic angina. Circulation 1995, 92, 1749–1757. [Google Scholar] [CrossRef]
- Shimabukuro, M.; Shinzato, T.; Higa, S.; Chibana, T.; Yoshida, H.; Nagamine, F.; Murakami, K.; Takasu, N. Enhanced insulin response relates to acetylcholine-induced vasoconstriction in vasospastic angina. J. Am. Coll. Cardiol. 1995, 25, 356–361. [Google Scholar] [CrossRef]
- Schechter, A.N.; Gladwin, M.T. Hemoglobin and the paracrine and endocrine functions of nitric oxide. N. Engl. J. Med. 2003, 348, 1483–1485. [Google Scholar] [CrossRef] [PubMed]
- Poisson, J.; Tanguy, M.; Davy, H.; Camara, F.; El Mdawar, M.B.; Kheloufi, M.; Dagher, T.; Devue, C.; Lasselin, J.; Plessier, A.; et al. Erythrocyte-derived microvesicles induce arterial spasms in JAK2V617F myeloproliferative neoplasm. J. Clin. Investig. 2020, 130, 2630–2643. [Google Scholar] [CrossRef]
- Shah, A.D.; Nicholas, O.; Timmis, A.D.; Feder, G.; Abrams, K.R.; Chen, R.; Hingorani, A.D.; Hemingway, H. Threshold haemoglobin levels and the prognosis of stable coronary disease: two new cohorts and a systematic review and meta-analysis. PLoS Med. 2011, 8, e1000439. [Google Scholar] [CrossRef]
- Nakayama, N.; Kaikita, K.; Fukunaga, T.; Matsuzawa, Y.; Sato, K.; Horio, E.; Yoshimura, H.; Mizobe, M.; Takashio, S.; Tsujita, K.; et al. Clinical features and prognosis of patients with coronary spasm-induced non-ST-segment elevation acute coronary syndrome. J. Am. Heart Assoc. 2014, 3, e000795. [Google Scholar] [CrossRef] [PubMed]
- Schwertz, D.W.; Penckofer, S. Sex differences and the effects of sex hormones on hemostasis and vascular reactivity. Heart Lung 2001, 30, 401–426; quiz 427-8. [Google Scholar] [CrossRef]
- Arant, C.B.; Wessel, T.R.; Olson, M.B.; Bairey Merz, C.N.; Sopko, G.; Rogers, W.J.; Sharaf, B.L.; Reis, S.E.; Smith, K.M.; Johnson, B.D.; et al. National Heart, Lung, and Blood Institute Women’s Ischemia Syndrome Evaluation Study. Hemoglobin level is an independent predictor for adverse cardiovascular outcomes in women undergoing evaluation for chest pain: results from the National Heart, Lung, and Blood Institute Women’s Ischemia Syndrome Evaluation Study. J. Am. Coll. Cardiol. 2004, 43, 2009–2014. [Google Scholar] [CrossRef]
- Satoh, S.; Omura, S.; Inoue, H.; Mori, T.; Takenaka, K.; Numaguchi, K.; Mori, E.; Aso, A.; Nakamura, T.; Hiyamuta, K. Clinical impact of coronary artery spasm in patients with no significant coronary stenosis who are experiencing acute coronary syndrome. J. Cardiol. 2013, 61, 404–409. [Google Scholar] [CrossRef]
- Hung, M.J.; Chang, N.C.; Hu, P.; Chen, T.H.; Mao, C.T.; Yeh, C.T.; Hung, M.Y. Association between Coronary Artery Spasm and the risk of incident Diabetes: A Nationwide population-based Cohort Study. Int. J. Med. Sci. 2021, 18, 2630–2640. [Google Scholar] [CrossRef]
- Takir, M.; Telci Caklili, O.; Betul Ozcan, F.; Atici, A.; Caliskan, M. Is there an association between glomerular hyperfiltration and coronary flow velocity reserve in patients with gestational diabetes history? Biomol. Biomed. 2025, 25, 1345–1350. [Google Scholar] [CrossRef] [PubMed]
- Koga, S.; Ikeda, S.; Nakata, T.; Yasunaga, T.; Takeno, M.; Koide, Y.; Maemura, K. Low glomerular filtration rate is associated with high prevalence of vasospastic angina. Circ. J. 2011, 75, 1691–1695. [Google Scholar] [CrossRef] [PubMed]
Figure 1.
The relative importance of initial random forest model in the derivation cohort.

Figure 2.
Discriminative performance of the initial and final random forest models in the derivation cohort (A), and performance of the final random forest model in the validation cohort (B). AUC, area under the curve; CI, confidence interval.
Figure 2.
Discriminative performance of the initial and final random forest models in the derivation cohort (A), and performance of the final random forest model in the validation cohort (B). AUC, area under the curve; CI, confidence interval.

Figure 3.
Partial dependence plots derived from the final random forest model in the derivation cohort, including diastolic blood pressure (A), systolic blood pressure (B), age (C), body surface area (D), hemoglobin (E), smoking (F), heart rate (G), sex (H) and estimated glomerular filtration rate (I). The light red–shaded area indicates the range along the X-axis where the probability of CAS is relatively higher. CAS, coronary artery spasm.

Figure 4.
The probability of CAS stratified by the number of predictors in the (A) derivation and (B) validation cohorts. Variables based on the thresholds from the partial dependence plots were determined from the partial dependence plots. CAS, coronary artery spasm; CI, confidence interval; OR, odds ratio.


Table 1.
Classification report by class in the test set.
| Class | Precision | Recall | F1-Score | Support |
|---|---|---|---|---|
| Control | 0.29 | 0.12 | 0.17 | 118 |
| Coronary artery spasm | 0.78 | 0.91 | 0.84 | 405 |
| Weighted average | 0.67 | 0.73 | 0.69 | 523 |
Table 2.
Baseline characteristics of derivation and validation sets.
| Derivation (n = 1,050) | Validation (n = 600) | |||||
|---|---|---|---|---|---|---|
| Variable | Available number |
Frequency (%) or mean ± SD |
Available number |
Frequency (%) or mean ± SD |
P value | |
| Male sex* | 1,050 | 522 (49.7) | 600 | 346 (57.7) | 0.002 | |
| Age, year* | 1,050 | 56.3 ± 12.8 | 600 | 57.1 ± 11.9 | 0.190 | |
| Smoking* | 1,050 | 264 (25.1) | 600 | 199 (33.2) | <0.001 | |
| Body mass index, kg/m2 | 1,049 | 26.1 ± 4.3 | 600 | 25.8 ± 3.8 | 0.259 | |
| Body surface area, m2* | 1,049 | 1.76 ± 0.20 | 600 | 1.73 ± 0.19 | 0.004 | |
| Vital sign | ||||||
| Heart rate, beats/min* | 1,045 | 69.4 ± 11.9 | 593 | 72.2 ± 13.2 | <0.001 | |
| Systolic blood pressure, mmHg* | 1,050 | 122.5 ± 18.9 | 597 | 132.7 ± 21.1 | <0.001 | |
| Diastolic blood pressure, mmHg* | 1,050 | 74.7 ± 10.8 | 597 | 77.8 ± 11.9 | <0.001 | |
| Comorbidity | 1,050 | 600 | ||||
| Diabetes mellitus* | 127 (12.1) | 116 (19.3) | <0.001 | |||
| Hypertension* | 354 (33.7) | 263 (43.8) | <0.001 | |||
| Left ventricular ejection fraction, %* | 1,040 | 65.2 ± 7.3 | 600 | 67.2 ± 9.6 | <0.001 | |
| Laboratory results | ||||||
| Serum creatinine, mg/dL | 1,050 | 0.86 ± 0.32 | 600 | 1.04 ± 0.38 | <0.001 | |
| eGFR, mL/min/1.73 m2* | 1,050 | 91.9 ± 23.9 | 600 | 76.8 ± 21.6 | <0.001 | |
| Hemoglobin, g/dL* | 1,048 | 13.6 ± 1.6 | 457 | 13.5 ± 1.7 | 0.570 | |
| Hematocrit, % | 1,048 | 40.0 ± 4.5 | 457 | 40.0 ± 4.6 | 0.932 | |
| Total cholesterol, mg/dL* | 1,046 | 172.2 ± 37.9 | 595 | 203.7 ± 39.4 | <0.001 | |
| Low-density lipoprotein, mg/dL | 1,001 | 101.3 ± 31.9 | 205 | 144.9 ± 35.9 | <0.001 | |
| High-density lipoprotein, mg/dL | 1,002 | 46.0 ± 12.7 | 206 | 36.4 ± 12.8 | <0.001 | |
| Platelet counts, 109/L* | 1,048 | 230.4 ± 59.3 | 456 | 219.5 ± 61.8 | 0.001 | |
| White blood cell count, 106/L* | 1,048 | 6843 ± 1752 | 459 | 7083 ± 2027 | 0.020 | |
| Monocyte counts, 106/L | 1,046 | 495.5 ± 168.2 | 415 | 432.1 ± 187.8 | <0.001 | |
| Coronary artery spasm | 1,050 | 709 (67.5) | 600 | 289 (48.2) | <0.001 | |
eGFR, estimated glomerular filtration rate. Data are presented as frequency (percentage) or mean ± standard deviation. *Included in the random forest analysis, yielding final valid sample sizes of 1,033 in the derivation cohort and 451 in the validation cohort.
Table 3.
Baseline characteristics of enrolled patients according to CAS in the derivation and validation cohorts.
Table 3.
Baseline characteristics of enrolled patients according to CAS in the derivation and validation cohorts.
| Derivation (n = 1,050) | Validation (n = 600) | ||||||
|---|---|---|---|---|---|---|---|
| Variable | CAS (n = 709) |
Non-CAS (n = 341) |
P value | CAS (n = 289) |
Non-CAS (n = 311) |
P value | |
| Male sex | 388 (54.7) | 134 (39.3) | <0.001 | 199 (68.9) | 147 (47.3) | <0.001 | |
| Age, year | 57.2 ± 12.1 | 54.4 ± 14.0 | 0.001 | 57.7 ± 12.3 | 56.6 ± 11.6 | 0.263 | |
| Smoking | 204 (28.8) | 60 (17.6) | <0.001 | 127 (43.9) | 72 (23.2) | <0.001 | |
| Body mass index, kg/m2 | 26.1 ± 4.2 | 26.0 ± 4.6 | 0.591 | 25.8 ± 3.7 | 25.8 ± 4.0 | 0.937 | |
| Body surface area, m2 | 1.76 ± 0.20 | 1.74 ± 0.21 | 0.056 | 1.74 ± 0.18 | 1.71 ± 0.19 | 0.036 | |
| Vital sign | |||||||
| Heart rate, beats/min | 68.6 ± 11.7 | 71.3 ± 12.1 | 0.001 | 71.6 ± 12.8 | 72.8 ± 13.5 | 0.265 | |
| Systolic blood pressure, mm-Hg | 120.5 ± 17.8 | 126.8 ± 20.5 | <0.001 | 130.6 ± 20.3 | 134.7 ± 21.7 | 0.017 | |
| Diastolic blood pressure, mm-Hg | 73.4 ± 10.4 | 77.3 ± 11.0 | <0.001 | 76.0 ± 11.3 | 79.5 ± 12.1 | <0.001 | |
| Comorbidity | |||||||
| Diabetes mellitus | 88 (12.4) | 39 (11.4) | 0.650 | 54 (18.7) | 62 (19.9) | 0.698 | |
| Hypertension | 246 (34.7) | 108 (31.7) | 0.332 | 121 (41.9) | 142 (45.7) | 0.350 | |
| Left ventricular ejection fraction, % | 65.6 ± 7.1 | 64.6 ± 7.7 | 0.042 | 66.2 ± 9.1 | 68.2 ± 9.9 | 0.012 | |
| Laboratory results | |||||||
| Serum creatinine, mg/dL | 0.85 ± 0.26 | 0.87 ± 0.42 | 0.448 | 1.04 ± 0.35 | 1.04 ± 0.41 | 0.871 | |
| eGFR, mL/min/1.73 m2 | 91.8 ± 22.0 | 92.0 ± 27.3 | 0.919 | 78.1 ± 21.8 | 75.6 ± 21.4 | 0.152 | |
| Hemoglobin, g/dL | 13.7 ± 1.5 | 13.2 ± 1.6 | <0.001 | 13.8 ± 1.5 | 13.2 ± 1.8 | <0.001 | |
| Hematocrit, % | 40.5 ± 4.2 | 38.9 ± 4.9 | <0.001 | 40.7 ± 4.1 | 39.2 ± 5.0 | 0.001 | |
| Total cholesterol, mg/dL | 172.6 ± 37.6 | 171.4 ± 38.7 | 0.629 | 201.7 ± 39.7 | 205.6 ± 39.0 | 0.230 | |
| Low-density lipoprotein, mg/dL | 102.0 ± 31.6 | 99.7 ± 32.4 | 0.281 | 144.3 ± 38.0 | 145.4 ± 33.7 | 0.838 | |
| High-density lipoprotein, mg/dL | 45.4 ± 12.3 | 47.3 ± 13.3 | 0.031 | 35.6 ± 11.7 | 37.1 ± 13.8 | 0.415 | |
| Platelet counts, 109/L | 231.0 ± 59.5 | 229.0 ± 59.0 | 0.616 | 227.0 ± 62.8 | 211.8 ± 59.9 | 0.008 | |
| White blood cell count, 109L | 6892 ± 1790 | 6740 ± 1667 | 0.188 | 7532 ± 2146 | 6616 ± 1784 | <0.001 | |
| Monocyte counts, 103/L | 502.9 ± 171.4 | 479.9 ± 160.7 | 0.038 | 495.2 ± 207.0 | 367.4 ± 139.3 | <0.001 | |
Table 4.
Variable importance in the derivation cohort using the initial random forest model with 15 predictors.
Table 4.
Variable importance in the derivation cohort using the initial random forest model with 15 predictors.
| Feature | VIMP (%) | Rank of VIMP |
|---|---|---|
| Diastolic blood pressure | 11.38 | Top 1 |
| Systolic blood pressure | 10.09 | Top 2 |
| Age | 8.56 | Top 3 |
| Body surface area | 7.73 | Top 4 |
| Hemoglobin | 7.39 | Top 5 |
| Smoking | 5.82 | Top 6 |
| Heart rate | 5.37 | Top 7 |
| Sex | 5.34 | Top 8 |
| Estimated glomerular filtration rate | 4.62 | Top 9 |
| Hypertension | 1.75 | Top 10 |
| Platelet counts | 0.29 | Top 11 |
| Total cholesterol | 0.24 | Top 12 |
| Left ventricular ejection fraction | -0.04 | Top 13 |
| Diabetes mellitus | -0.77 | Top 14 |
| White blood cell count | -1.31 | Top 15 |
VIMP, variable importance.
Table 5.
The performance of random forest models with different number of predictors according to variable importance in the derivation cohort.
Table 5.
The performance of random forest models with different number of predictors according to variable importance in the derivation cohort.
| Feature numbers | AUC, % (95% CI) |
|---|---|
| All (15 features) | 87.8 (85.8 to 89.9) |
| Top 14 features | 87.9 (85.9 to 90.0) |
| Top 13 features | 87.3 (85.2 to 89.4) |
| Top 12 features | 86.3 (84.1 to 88.6) |
| Top 11 features | 86.7 (84.5 to 88.9) |
| Top 10 features | 86.1 (83.8 to 88.3) |
| Top 9 features* | 85.8 (83.6 to 88.1) |
| Top 8 features | 85.2 (82.8 to 87.5) |
| Top 7 features | 85.9 (83.7 to 88.2) |
| Top 6 features | 85.0 (82.7 to 87.3) |
| Top 5 features | 83.4 (80.9 to 85.9) |
| Top 4 features | 82.1 (79.5 to 84.7) |
| Top 3 features | 80.8 (78.2 to 83.5) |
| Top 2 features | 77.1 (74.2 to 80.0) |
| Top 1 features | 65.5 (61.9 to 69.1) |
AUC, area under the curve; CI, confidence interval. *The finally selected model.
Disclaimer/Publisher’s Note: The statements, opinions and data contained in all publications are solely those of the individual author(s) and contributor(s) and not of MDPI and/or the editor(s). MDPI and/or the editor(s) disclaim responsibility for any injury to people or property resulting from any ideas, methods, instructions or products referred to in the content. |
© 2026 by the authors. Licensee MDPI, Basel, Switzerland. This article is an open access article distributed under the terms and conditions of the Creative Commons Attribution (CC BY) license (http://creativecommons.org/licenses/by/4.0/).
Copyright: This open access article is published under a Creative Commons CC BY 4.0 license, which permit the free download, distribution, and reuse, provided that the author and preprint are cited in any reuse.


