Submitted:
21 April 2026
Posted:
23 April 2026
You are already at the latest version
Abstract
Digitalization of European enterprises is a prerequisite for their long-term success and competitiveness. Within the framework of the European Green Deal and the United Nations Sustainable Development Goals (SDGs), digitalization is increasingly linked to key objectives such as Decent Work and Economic Growth, Industry, Innovation and Infrastructure, Responsible Consumption and Production, and Climate Action. This study examines the level of digitalization in European small and medium-sized enterprises (SMEs), with a particular focus on Slovenia. It evaluates the position of Slovenian companies relative to the EU average and explores the relationship between digital maturity and the achievement of sustainability goals. The research combines qualitative and quantitative approaches. In-depth interviews with SME managers were used to identify key digitalization parameters, which guided as the basis for selection of relevant indicators from the Eurostat survey on ICT usage (2020–2024). In total, 558 indicators were analysed at the country level, with a subset of 60 sustainability-relevant indicators examined in detail. Additionally, the study analyses the relationship between the Digital Economy and Society Index (DESI) and the SDG Index across EU Member States. These findings contribute to a better understanding of the role of digitalization in the context of sustainable development.
Keywords:
Artificial Intelligence (AI)
; Sustainable Digital Transformation (SDT)
; Digital transformation (DT)
; Small and Medium Enterprises (SME)
; Sustainable Development Goals (SDG)
; Information and Communications Technology (ICT)
; The Digital Economy Society Index (DESI) and SDG Index
1. Introduction
The rapid technological progress of recent decades has fundamentally reshaped business operations across all industries. For small, and medium-sized enterprises (SMEs), digital transformation is no longer merely a driver of competitiveness but a prerequisite for long-term resilience, environmental responsibility, and sustainable growth. In September 2015, the UN announced the 17 Sustainable Development Goals (SDG) as a basis for the 2030 Agenda for Sustainable Development [1]. In the context of the European Green Deal and the UN 2030 Agenda for Sustainable Development, digitalisation plays a dual role: it enhances operational efficiency while simultaneously enabling more sustainable production, consumption, and governance models.
Despite its strategic importance, European SMEs continue to face significant barriers to digital transformation, including limited digital competences, constrained financial resources, fragmented access to technological solutions, and insufficient strategic guidance [2]. These constraints not only slow down digital adoption but also hinder SMEs from contributing effectively to key Sustainable Development Goals (SDG), particularly “Decent Work and Economic Growth” (SDG 8), “Industry, Innovation and Infrastructure” (SDG 9), “Responsible Consumption and Production” (SDG 12), and “Climate Action” (SDG 13).
Beyond improving productivity and competitiveness, the approached explicitly links digital adoption to sustainability outcomes. For example, digital supply-chain integration can enhance resource efficiency (SDG 12), AI-driven energy optimisation can reduce carbon intensity (SDG 13), cloud-based collaboration tools can lower material consumption and travel-related emissions, and data-driven decision-making can foster innovation ecosystems aligned with SDG 9.
The research addresses the challenge of effectively linking the digital transformation of SMEs with the achievement of sustainability goals.
Following a comprehensive review of scientific literature, a qualitative research framework was developed to collect data from management structures in micro, small, and medium-sized enterprises. To and quantitative research
The purpose of this research was to examine how SMEs management perceives the relationship between different dimensions of digital transformation and their impact on the achievement of (individual) sustainable development goals.
The research is based on in-depth interviews with SME managers, through which we explored the links between specific areas of digital transformation and their contribution to achieving sustainable goals. These interviews provided valuable insights into managerial perspectives, decision-making processes, and the strategic importance attributed to digital transformation in the context of sustainability.
Based on this, key indicators were identified and selected from existing big data sources (Eurostat) that have a significant impact on the achievement of sustainability goals.
The research further incorporates a comparative benchmarking analysis between Slovenia and the EU average across multiple digital adoption indicators and examine the correlation between DESI scores and selected SDG goals.
The digital transformation of enterprises is a central policy objective of the European Union, reflected in the Digital Decade programme and the Digital Economy and Society Index (DESI). In line with the Digital Decade Policy Programme 2030, the Digital Economy and Society Index (DESI) is based on a set of indicators providing a multi-dimensional, detailed picture of the collective annual progress made by the EU towards the 2030 goals [3,4].
Understanding where individual member states stand relative to the EU average is essential for designing targeted support measures. This study focuses on EU and Slovenia—a small, open economy whose enterprises operate in a highly competitive Single Market environment. This framework also includes the SDG index.
The objective of this research is threefold: (1) analyse the views of micro, small and medium-sized enterprise management on the connection between digital transformation and the SDGs, (2) define areas of digital transformation in relation to individual sustainable development goals (3) to aggregate and systematise the Eurostat ICT Usage Survey microdata for the 2020–2024 period, (4) to quantify the gap between Slovenian enterprises and the EU average across selected digital-adoption indicators and (5) to investigate whether higher levels of digitalisation are statistically associated with better sustainability outcomes across the 27 EU member states. Specifically, examine the correlation between DESI scores and four SDG sub-indices identified at interviews with SME management.
2. Literature Review and Hypotheses Development
Small and medium sized enterprises (SMEs) have been well studies and the conclusion about their economic importance is unified and not anymore arguable. As explained in [3], the same applies for very small, micro companies, which no matter how small they are, have their impact on the domestic economy as well. In the European Union (EU), they represent 99% of all businesses from almost all economic sectors and generate more than a half of the EU’s GDP [4]. Related to this, the MSMEs in the EU have reached a level of around 70% of digital intensity, among which Nordic countries Finland and Denmark have the higher scores (93% and 90% respectively) and Southern-Eastern Europe like Greece and Bulgaria the lowest (53% and 50%). For a comparison the digital intensity of larger businesses is 98% [5].
2.1. Digital Transformation
The term digital transformation describes the use of different types of digital technologies to bring about substantial changes in the properties of an organization.
Digitalization, meaning the use and integration of digital technologies in physical production processes, is a key component of the Fourth Industrial Revolution, or Industry 4.0 [6]. For the manufacturing SMEs to be able to compete on a global scale, they need to be more flexible, adaptive to new changes and highly responsive, which the adoption of Industry 4.0 allows [7]. More precisely, the newly available technology like IoT, Artificial Intelligence (AI), Machine Learning (ML) and even more advanced technology like robotics help SMEs to achieve better work efficiency by automation of business processes [8]. However, the adoption of Industry 4.0 in the European SMEs is still limited [9].
The Industry 4.0 readiness is measured using different measurement models. Some of the most popular are: Digital Readiness Assessment Maturity (DREAMY) which includes the technological and cultural aspects in the assessment; Smart Manufacturing Readiness Level model which relies on companies’ readiness for changes; Industry 4.0 Maturity Model (I4.0-MM) relies on companies’ strengths and weaknesses [10].
2.2. Sustainable Development Goals
The Sustainable Development Goals (SDGs), also known as the Global Goals, were adopted by the United Nations in 2015 as a universal call to action to end poverty, protect the planet, and ensure that by 2030 all people enjoy peace and prosperity [https://www.undp.org/sustainable-development-goals].
The UN Sustainable Development Goals (SDGs) were designed to offer an ambitious roadmap with which to address a wide range of globally pressing social, economic, and environmental threats and challenges. For each SDG, different world regions confront their unique issues and challenges and showcase different types of solutions and levels of progress. Although the SDGs offer a shared language and a standard set of indicators for measuring development, the current level of progress reveals no one-size-fits-all model of success [11].
The short titles of the 17 SDGs are: 1. No poverty, 2. Zero hunger, 3. Good health and well-being, 4. Quality education, 5. Gender equality, 6. Clean water and sanitation, 7. Affordable and clean energy, 8. Decent work and economic growth, 9. Industry, innovation and infrastructure, 10. Reduced inequalities, 11. Sustainable cities and communities, 12. Responsible consumption and production, 13. Climate action, 14. Life below water, 15. Life on land, 16. Peace, justice, and strong institutions, 17. Partnerships for the goals.
2.3. The Impact of Digitalization on Sustainable Development Goals
To achieve more sustainable performance, many of enterprises are adopting different digital solutions [12]. The rapid development of digital technologies, especially Information and Communication Technology (ICT) had an enormous influence on the society and economy. ICT is improving the quality of life by providing easier access to information, influences on social connection, education, healthcare and other aspects of life [13]. In the business environment, it has been used in both the manufacturing companies and in the service companies [14]. It is becoming an imperative nowadays if companies want to achieve a competitive advantage on the market. However, the introduction of digital technologies in the larger companies is much easier than in the smaller enterprises [15].
Similarly, Bansal (2005) [17], conceptualized corporate sustainability as the ability of firms to address short-term economic, environmental, and social needs while safeguarding long-term benefits in these dimensions. Under the guidance of sustainable development principles, firms are expected to pursue not only economic growth, but also the balanced integration of economic, environmental, and social objectives
Recent studies documenting the concrete environmental impacts of digitalization reveal the depth of this transformation. Research by Chen [16/17] and Ma et al. [16/34] demonstrates the mechanisms through which digital solutions reduce ecological footprints, whether by optimizing industrial processes or replacing physical activities with virtual alternatives. Moreover, as Skvarciany et al. [16/18] observe, digitalization creates a virtuous cycle of environmental awareness, where democratized access to information on pollution and resource consumption stimulates more responsible citizen behaviours, from adopting renewable energy to reducing water waste.
Benefits of Industry 4.0 can be divided by the three pillars of stainability, as argued by [20]. In this regard, AI and IoT solutions contribute to environmental benefits such as reduce carbon emissions, energy use, and waste. Blockchain influence on the social dimension of sustainability by providing transparency, supporting fair Labor practices. And the predictive analyses and more informed decisions help in the economic aspect by costs reduction and processes optimization [21].
There is limited literature directly examining the relationship between AI and firms’ SDP. Existing studies primarily investigate the environmental implications of AI, including its effects on energy efficiency, emissions reduction, green development, and green innovation, thus offering valuable insights [22].
2.4. Hypotheses
In the context of the ongoing digital and sustainable transformation, SMEs are increasingly adopting a wide range of digital technologies, which are progressively demonstrating their strategic value. Digitalisation has become a key driver of organisational performance, operational efficiency, and long-term competitiveness, while also enabling more sustainable business practices. In this regard, digital transformation contributes to broader sustainability objectives by supporting more efficient resource use, fostering innovation, and enabling environmentally and socially responsible business models. Existing studies further indicate that advanced digital tools including artificial intelligence can enhance decision making and support SMEs in achieving competitive advantages.
In this research, digital transformation is conceptualised as a multidimensional process, within which AI represents one of the enabling technologies. The research examines how the integration of digital tools, supported by AI and data-driven approaches, contributes to sustainable digital transformation in micro, small, and medium-sized enterprises. Furthermore, the study incorporates a survey based managerial perception analysis, investigating how SME decision makers perceive the relationship between digitalisation and the attainment of sustainability objectives. This perception-based perspective is complemented by an empirical benchmarking analysis using Eurostat ICT Usage Survey data (2020–2024), enabling a comparison between Slovenia and the EU average across multiple digital adoption indicators.
By combining subjective (managerial perceptions) and objective (secondary data benchmarking) evidence, the study provides a more comprehensive understanding of how digital transformation processes can be aligned with sustainability objectives. Particular attention is given to how digitalisation supports the assessment of enterprise maturity, the identification of appropriate technological solutions, and the alignment of transformation pathways with sustainability-oriented performance metrics.
Based on the above, we formulated the following hypotheses:
Hypotheses 1 (H1):
Digitalization has a significant positive impact on the achievement of Sustainable Development Goals (SDGs), particularly within small and medium-sized enterprises (SMEs).
3. Materials and Methods
3.1. Research Design
This study employs a mixed-methods research design to investigate the relationship between digitalization and the achievement of Sustainable Development Goals (SDGs). The research approach integrates three complementary components, enabling both depth of understanding and empirical validation:
- a structured state-of-the-art literature review examining the impact and interconnections between digitalization and SDG achievement,
- a qualitative data collection method based on semi-structured interviews,
- a quantitative analysis based on secondary data sources (Eurostat, DESI index, SDG index).
The literature review provides the conceptual foundation of the study by identifying key theoretical frameworks, existing empirical findings, and research gaps related to digital transformation and sustainability. It also supports the development of the interview protocol and the selection of relevant indicators for quantitative analysis.
The qualitative component, based on in-depth interviews with SME management (CEOs and project managers), aims to capture expert perspectives on the relationship between digitalization and SDG achievement. Specifically, the interviews are designed to:
(1) assess the perceived impact of digital technologies on sustainability outcomes, and
(2) identify which SDGs are most significantly influenced by digital transformation within organizational contexts.
This approach allows for a deeper understanding of managerial thinking, strategic priorities, and real-world challenges faced by SMEs when integrating digital and sustainable practices.
The quantitative component complements the qualitative findings by analysing selected indicators from secondary data sources, including Eurostat datasets, the Digital Economy and Society Index (DESI), and the SDG Index. Based on insights from the literature review and interviews, key indicators were identified and used to examine broader patterns and relationships between digitalization and sustainability performance at the macro level.
SMEs represent the primary focus of this study due to their central role in the European economy, accounting for most businesses and employment. At the same time, SMEs face specific challenges and opportunities in the context of digital transformation, such as limited resources, varying levels of digital maturity, and increasing pressure to adopt sustainable practices. Their growing involvement in digitalization processes makes them a highly relevant subject for analysing the contribution of digital transformation to the achievement of SDGs.
By combining qualitative insights with quantitative evidence, this mixed-methods approach ensures a more comprehensive and robust analysis of the research problem.
3.2. Data Collection
3.2.1. Qualitative Data Collection Method with Semi-Structured Interviews
Source
Primary data were collected through semi-structured interviews with managers of micro, small, and medium-sized enterprises (SMEs) in Slovenia. The selected respondents represented key decision-makers within their organizations, ensuring relevant insights into strategic orientations, digital transformation processes, and sustainability-related practices. The sampling approach aimed to include companies with varying levels of digital maturity and different industry backgrounds to provide a more comprehensive understanding of the research topic.
Structure
The interviews followed a semi-structured format, combining predefined questions with open-ended discussion to capture in-depth insights into managerial perspectives on digital transformation and sustainability. The interview guide was designed based on the literature review and covered key thematic areas, including digital technologies adoption, organizational processes, strategic decision-making, and perceived links between digital transformation and sustainability goals. This flexible structure allowed respondents to elaborate on their experiences, while ensuring comparability across interviews.
Scope
As part of the study, semi-structured interviews were conducted with representatives of ten companies, including four service-oriented firms, three manufacturing companies, and three companies specializing in digitalization services. The interviews were carried out individually at the companies’ headquarters. In most cases, the interviews were supported by long-term collaboration in the field of digital transformation, which enabled a deeper understanding of organizational processes and decision-making practices (except for two digital service providers).
This approach ensured a comprehensive and in-depth insight into managerial perspectives on the relationship between digitalization and sustainability.
The interview protocol covered several key areas, including the current level of digitalization within the company and the perceived relationship between specific digitalization parameters and sustainability outcomes. The primary objective was to assess respondents’ perceptions regarding the contribution of digitalization to the achievement of sustainability goals.
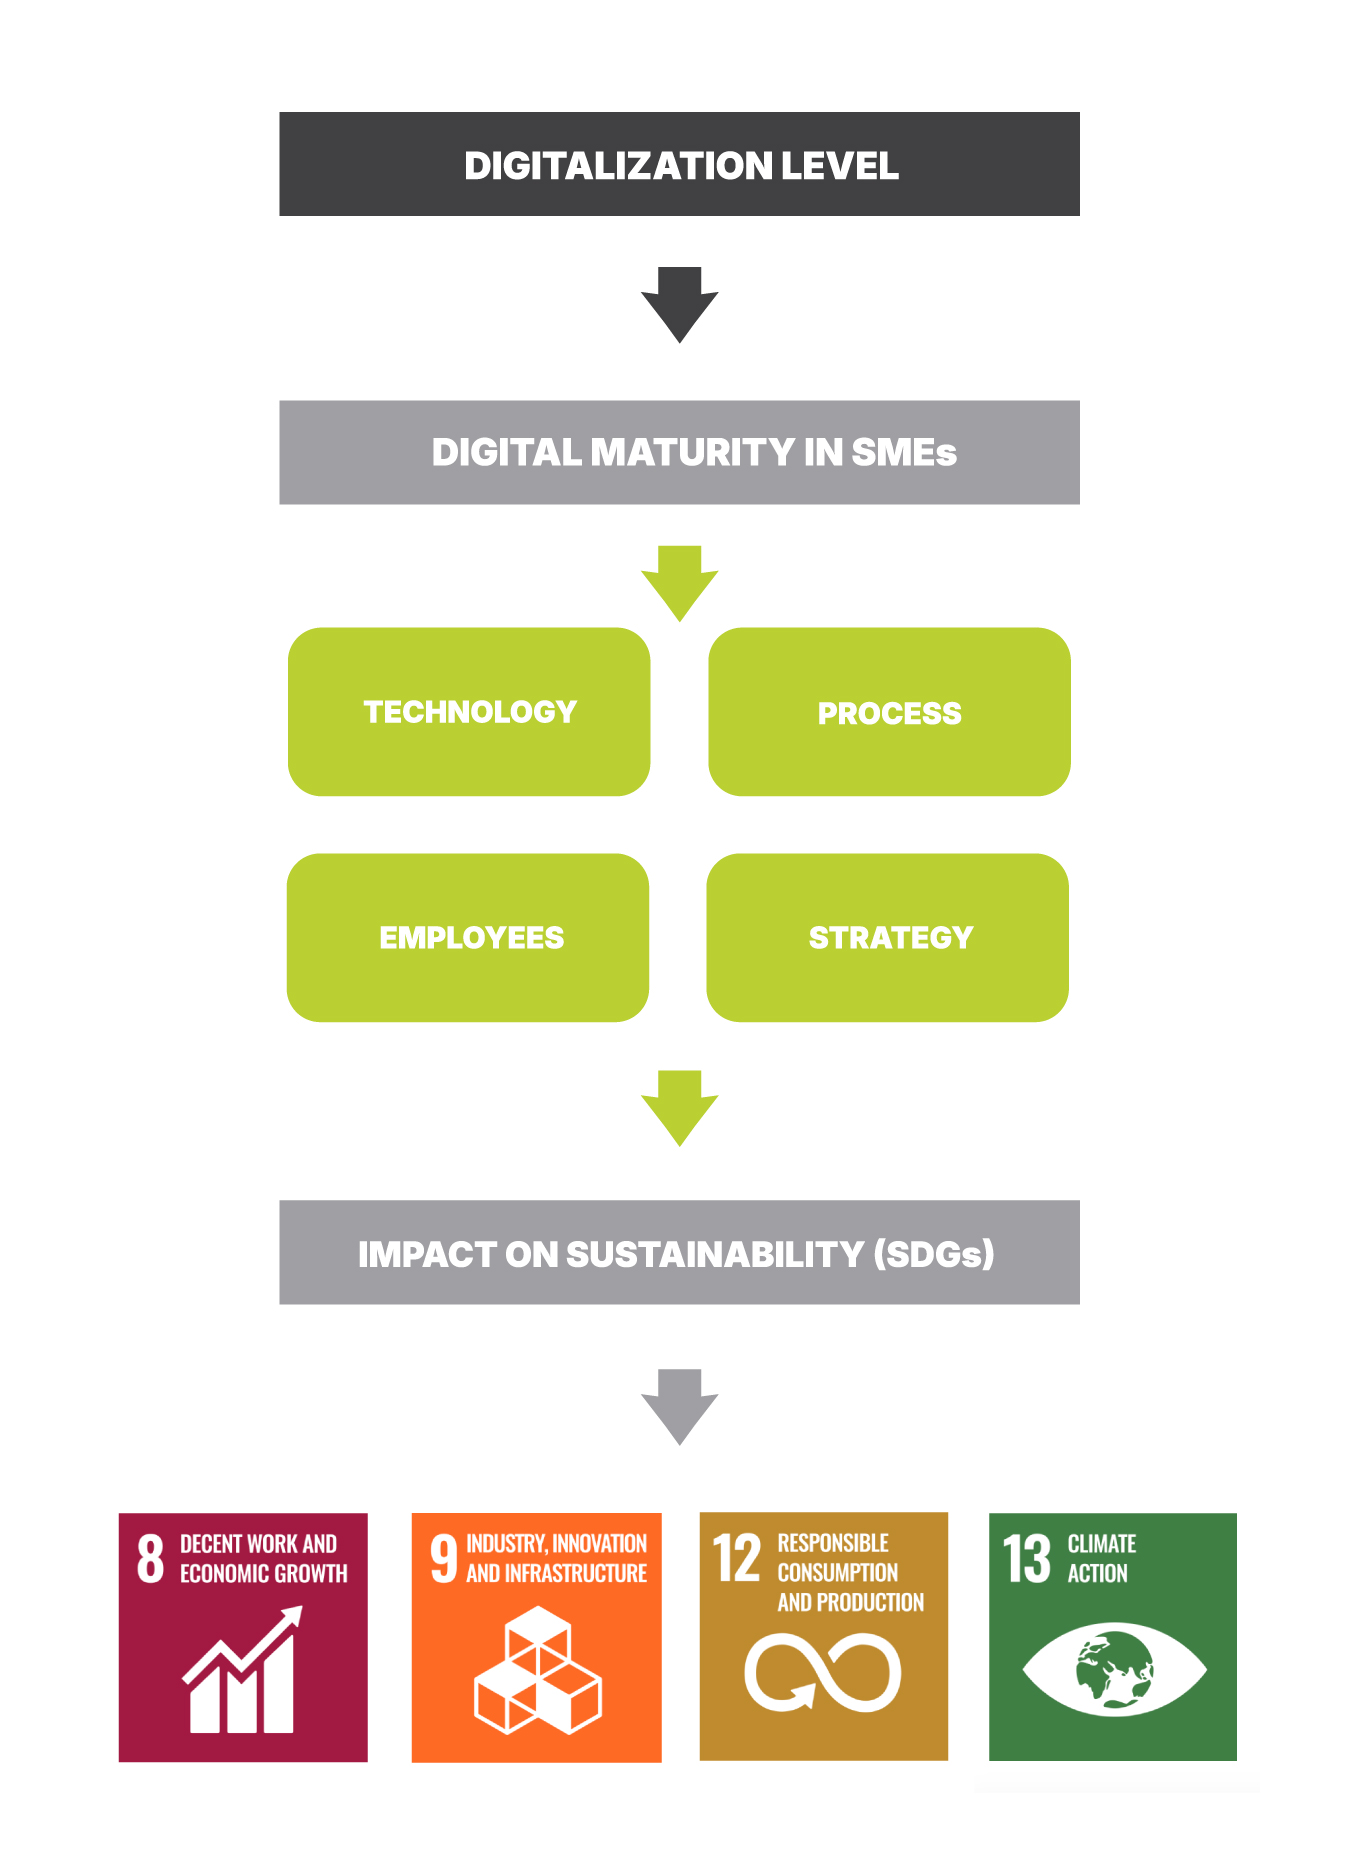
For analytical purposes, digitalization was structured into four key dimensions: tools (technologies, processes, data, and strategy). Furthermore, the interviews explored different types of impacts of these digital dimensions on sustainability, including the existence of an impact, its timing (short-term vs. long-term), its nature (direct vs. indirect), and its perceived strength.
Each interview lasted between 45 and 90 minutes, was recorded with prior consent of the participants, and subsequently transcribed for further qualitative analysis.
3.2.2. Quantitative Analysis Based on Secondary Data
Quantitative Analysis Based on Secondary Data Sources - Eurostat
Source
The data originates from the Eurostat Unit G4 (Innovation and Digitalisation) comprehensive database of the ICT Usage Surveys for Enterprises - https://ec.europa.eu/eurostat/web/digital-economy-and-society/database/comprehensive-database [28]. The database is distributed as two Microsoft Access files covering the periods 2009–2016 and 2017–2025. This study exclusively uses the 2017–2025 file (SDMXE 2017–2025 v251210.mdb), further filtered to survey years 2020 and later.
Structure
The database contains 18 relational tables. The two principal tables are:
- Indicators — a metadata table of 2,076 indicators, each identified by a numeric key and mapped to the corresponding Eurostat variable code and a human-readable caption.
- DataWithAggregates — approximately 15 million observation rows. Each row records a single indicator value for a given enterprise unit, survey year, country, enterprise-size class, economic activity, and statistical unit of measurement.
Supporting dimension tables (Countries, Years, EntSizes, Units, Activities, Regions) provide the look-up values for the coded foreign keys. The country dimension includes 33 countries and aggregates (EU-27, euro area, etc.); Slovenia is coded as IdCountry = 29.
Scope
The analysis covers all indicators for which at least one observation exists in the year range 2020–2024 (IdYear ≥ 20). After aggregation, 558 distinct indicators remained. Of these, 544 had data for Slovenia; the remaining 14 lacked Slovenian observations. Between 17 and 33 European countries contributed data per indicator, depending on survey coverage.
For the purposes of this article, 60 key indicators were identified that, in companies opinion (interviews), represent the greatest impact or indicator in linking the digital transformation of SMEs with sustainability. The selection was also guided by the connection of digital tools, sustainability in the case of manufacturing companies, which by the nature of their work have a greater impact on the environment.
Methods
Per-Indicator Aggregation
For each of the 558 / 60 indicators, the raw observation values were aggregated across all enterprise units, years, and measurement units. Four summary statistics were computed:
- Arithmetic mean of the raw values (mean value), providing a continuous central-tendency measure.
- Binary mean: each value was rounded to 0 or 1 (threshold 0.5), and the mean of these binary scores was taken. This approximates the share of observations exceeding the midpoint.
- Categorical mean: each value was mapped to an ordinal scale 0–3 using quartile-based thresholds ([0, 0.25) → 0; [0.25, 0.5) → 1; [0.5, 0.75) → 2; [0.75, 1.0] → 3), and the mean category was computed.
- Observation count: the number of non-null records per indicator.
This aggregation was performed twice: once for the full EU dataset (all countries) and once for Slovenia alone.
Country-Level Benchmarking
To compare Slovenia against the EU, a country-level aggregation was constructed. For each (indicator, country) pair, the mean of all raw values was computed, yielding a single summary value per indicator per country. The EU average for each indicator was then defined as the unweighted arithmetic mean across all countries with data for that indicator. This country-level averaging gives equal weight to each member state, preventing bias from countries with larger survey samples.
Interpretation of the EU Average
The EU average reported throughout this study represents the mean adoption rate (or mean indicator value) computed across all participating European countries for a given indicator and time. Because each indicator value is typically expressed as a proportion (e.g. the share of enterprises that use a given technology), the EU average can be interpreted as the typical adoption level across the European Union. For example, an EU average of 0.45 for a given indicator means that, on average across EU countries, 45% of enterprises exhibit the measured behaviour.
Importantly, the EU average is an unweighted country mean rather than an enterprise-weighted mean. Each country contributes equally regardless of the number of enterprises surveyed or its economic size. This design choice ensures that the benchmark reflects the typical national adoption level, not the level that would prevail if all EU enterprises were pooled together (which would be dominated by large economies such as Germany, France, and Italy). When Slovenia’s value exceeds the EU average, it indicates that Slovenian enterprises adopt the technology at a higher rate than what is typical for an EU country; conversely, a value below the EU average signals relative under-adoption.
Three benchmark metrics were derived for each indicator:
Gap: the signed difference between Slovenia’s mean and the EU mean.
Gap = SLO_Value − EU_Mean
- A positive gap indicates that Slovenia outperforms the EU average; a negative gap indicates underperformance.
- Percentile rank: Slovenia’s position within the distribution of country-level means, expressed on a 0–100 scale. A percentile of 100 means Slovenia has the highest value among all countries; 0 means the lowest.
- Country count: the number of European countries with data for the indicator, providing a measure of the robustness of each comparison.
Interpretation of Negatively Worded Indicators
A substantial share of Eurostat ICT Usage indicators is negatively worded because measure the proportion of enterprises that do not adopt a given technology (e.g. ‘enterprises do not use AI technologies for accounting’). For such indicators, a high value means lower actual adoption. When interpreting benchmarking metrics, this inversion must be accounted for: a high percentile rank on a negatively worded indicator signals that Slovenia has lower adoption than most EU countries, which constitutes a weakness rather than a strength. Conversely, a low percentile on a negatively worded indicator indicates higher adoption, i.e. a relative strength.
Among the 60 indicators selected for detailed analysis (Section 5), 26 are negatively worded. This duality is explicitly addressed in the narrative summaries: wherever a negatively worded indicator is discussed, the text clarifies the correct interpretation.
Identification of Strengths and Weaknesses
Indicators were classified as relative strengths if Slovenia’s percentile rank was at or above 80 (top quintile among EU countries). The resulting subset isolates the areas where Slovenian enterprises demonstrably outperform most of their European peers.
Thematic Super-Group Analysis
To move beyond individual indicators and identify broader thematic patterns, indicators were grouped into “super-groups”, clusters of semantically related indicators covering a single digitalisation domain (e.g. e-commerce, cloud computing, AI adoption, ICT security). For each super-group, the EU average and the Slovenian average were computed as the arithmetic means of the respective indicator-level values, and the gap was derived as their difference.
The 20 super-groups with the most extreme gaps were selected: the 10 with the most negative gap (weaknesses) and the 10 with the most positive gap (strengths). This ranking was visualised in a bar chart to provide an intuitive overview of Slovenia’s relative position.
Selected Indicators for Detailed Analysis
The selection of indicators was based on data obtained through in-depth semi-structured interviews. From the full set of 558 indicators, a curated subset of 60 indicators was selected for detailed analysis. The selection focused on policy-relevant dimensions of enterprise digitalisation and was designed to capture a balanced representation of key digital domains. These include e-invoicing, big data analytics, ICT specialist employment and training, enterprise resource planning (ERP), artificial intelligence, the Internet of Things (IoT), robotics and 3D printing, ICT security, cloud computing, e-commerce, remote work, social media, environmental sustainability of ICT, and digital intensity indices.
The selection process was guided not only by analytical relevance but also by the objective of linking digital transformation to sustainability outcomes. The chosen indicators reflect dimensions that directly or indirectly contribute to the achievement of the United Nations Sustainable Development Goals (SDGs), particularly SDG 8 (Decent Work and Economic Growth), SDG 9 (Industry, Innovation and Infrastructure), SDG 12 (Responsible Consumption and Production), and SDG 13 (Climate Action). For instance, digital supply-chain integration and ERP systems can enhance resource efficiency and transparency (SDG 12), AI and IoT applications can support energy optimisation and emissions reduction (SDG 13), while ICT skills development and innovation capacity contribute to sustainable economic growth and industrial modernisation (SDGs 8 and 9).
Of the 60 selected indicators, 18 were additionally chosen for graphical presentation in the final publication to visually illustrate the most policy-significant and sustainability-relevant patterns. For each indicator, the table below reports the EU average, the Slovenian value (where available from the country-level benchmark), the calculated gap (Slovenia minus EU average), and Slovenia’s percentile rank among EU countries. Where country-level benchmarking was not available, the EU-wide aggregated mean is reported instead.
Tools and Software
The analysis was conducted in Python 3.12 using the pandas library for data manipulation, aggregation, and statistical computation. The primary data processing was executed in a Jupyter Notebook environment (IPython kernel). The source database was accessed via the mdbtools library for reading Microsoft Access (.mdb) files. Visualisations were produced using the matplotlib library. The present report was generated programmatically using the python-docx library.
The data source is the Eurostat Comprehensive Database for the ICT Usage Surveys, published by Eurostat Unit G4 — Innovation and Digitalisation, and available at: https://ec.europa.eu/eurostat/web/digital-economy-and-society/database/comprehensive-database.
Quantitative Analysis Based on Secondary Data Sources - DESI Index, SDG Index).
The digital transformation of European economies has been a central policy objective of the European Union, formalised through the Digital Compass 2030 strategy and monitored annually via the Digital Economy and Society Index (DESI). Simultaneously, the EU and its member states are committed to achieving the United Nations Sustainable Development Goals (SDGs), which provide a comprehensive framework for measuring societal progress across economic, social, and environmental dimensions.
This report investigates whether higher levels of digitalisation are statistically associated with better sustainability outcomes across the 27 EU member states. Specifically, we examine the correlation between DESI scores and four SDG sub-indices that span complementary dimensions of sustainability: decent work and economic growth (SDG 8), industry, innovation and infrastructure (SDG 9), responsible consumption and production (SDG 12), and climate action (SDG 13).
The analysis is guided by one central research hypothesis: H1 — Digitalisation has a significant positive impact on the achievement of Sustainable Development Goals (SDGs), particularly within small and medium-sized enterprises (SMEs). This is tested directly using the DESI–SDG correlation analysis described below.
Source
Two primary data sources are used in this study:
The Digital Economy and Society Index (DESI) is a composite indicator compiled annually by the European Commission. It measures the digital performance of EU member states across four dimensions: connectivity, human capital, integration of digital technology, and digital public services. DESI data for all 27 EU member states were obtained from the European Commission's Digital Decade DESI visualisation tool for the reference year 2022, as this is the last available aggregate DESI index with explicitly provided methodology, before changes to the standard were put in effect.
The Sustainable Development Goal (SDG) index scores were obtained from the Transformation Center's SDG tracking platform. Four SDG sub-indices were selected: SDG 8 (Decent Work and Economic Growth), SDG 9 (Industry, Innovation and Infrastructure), SDG 12 (Responsible Consumption and Production), and SDG 13 (Climate Action). These four indices were chosen because they represent sustainability dimensions most plausibly linked to digitalisation through theoretical channels such as productivity, innovation, resource efficiency, and the carbon footprint of digital infrastructure. Statistical testing was conducted on both the most recent SDG data
Structure and Scope
The DESI dataset (desi_aggregated.csv) contains 27 rows — one per EU member state — and six columns: country (ISO 3166-1 alpha-2 code), and five score columns representing the four DESI sub-dimensions and the composite index: hc (Human Capital), conn (Connectivity), idt (Integration of Digital Technology), dps (Digital Public Services), and desi (composite DESI score). Scores reflect the 2022 reference year, the last year for which a fully comparable composite index was available before methodology changes were introduced. DESI composite scores across the 27 member states range from approximately 14.9 to 43.4.
The SDG dataset (SDG_filtered.csv) contains 675 rows covering all 27 EU member states across 25 annual time points (2000–2024), and six columns: a row index, Country (full name), year, and four SDG sub-index scores: goal8 (Decent Work and Economic Growth), goal9 (Industry, Innovation and Infrastructure), goal12 (Responsible Consumption and Production), and goal13 (Climate Action). For the correlation analysis, only the 2022 and 2024 rows are used, yielding two working tables of 27 observations each. The datasets are joined on country, mapping ISO alpha-2 codes in the DESI file to full country names in the SDG file.
Methods
For each combination of year and SDG index, we compute the Spearman rank-order correlation coefficient (ρ) between the DESI score and the respective SDG score across all 27 EU member states. Spearman's ρ was chosen over Pearson's r because it makes no assumption about the normality of the underlying distributions and is robust to outliers — both important considerations given the relatively small sample size (n = 27) and the composite nature of the indices.
The Spearman correlation coefficient ranges from −1 (perfect negative rank association) to +1 (perfect positive rank association), with 0 indicating no monotonic relationship. Statistical significance is assessed using a two-tailed t-test on the Spearman correlation, with a significance threshold of α = 0.05. P-values below this threshold indicate that the observed correlation is unlikely to have arisen by chance under the null hypothesis of no association.
The analysis is implemented in Python using the scipy.stats.spearmanr function, which returns both the correlation coefficient and the two-tailed p-value. All data preprocessing, correlation calculations, and visualisations are produced in a reproducible Jupyter notebook.
Tools and Software
The analysis was conducted in Python 3.12 using the pandas library for data manipulation and the scipy library (scipy.stats.spearmanr) for statistical computation. All data processing and analysis steps were executed in a Jupyter Notebook environment. Visualisations were produced using the matplotlib library. The full analysis pipeline, including data preprocessing, correlation calculations, and chart generation, is documented in a reproducible Jupyter notebook available in the project’s public GitHub repository at https://github.com/ivoh644/SDG_DESI.
The primary data sources were obtained directly from their respective public platforms: DESI scores from the European Commission’s Digital Decade DESI visualisation tool, available at https://digital-decade-desi.digital-strategy.ec.europa.eu/datasets/des, and SDG index scores from the Transformation Center’s SDG tracking platform, available at https://dashboards.sdgindex.org/explorer/. No proprietary databases or licensed tools were used; the analysis is fully reproducible using open-source software and publicly available data.
Github repository for reproducibility purposes: https://github.com/ivoh644/SDG_DESI
4. Results
4.1. Qualitative Analysis Data
Digital Maturity of Participating Companies
The quantitative analysis is based on a sample of ten respondents, representing small and medium-sized enterprises (SMEs) operating in different sectors. The respondents occupy managerial and decision-making positions, which ensures that the collected data reflects strategic as well as operational perspectives on digital transformation. In terms of organizational structure, the sample includes micro, small, and medium-sized enterprises, allowing for a comparative understanding of how company size may influence both digital maturity and sustainability orientation. Although the sample size is limited, it is appropriate for exploratory research and provides valuable insights into emerging patterns.
The findings indicate that the overall level of digitalization among the participating companies is relatively high. All respondents emphasized the presence of modern technological infrastructure supported by appropriate security systems. Except for one company operating in the tourism services sector, all firms reported the use of advanced digital technologies, such as cloud computing and IoT solutions.
Most companies actively collect and analyse data and incorporate data-driven insights into their decision-making processes. However, the use of artificial intelligence remains relatively limited, primarily confined to marketing activities and the preparation of promotional materials.
In terms of business processes, most respondents reported a high degree of digitalization and assessed their employees as possessing solid digital competencies. Only one company reported the use of robotics, with the main barriers being not financial constraints but the need for significant adjustments to existing operational processes. Additionally, several companies highlighted a degree of internal resistance among employees toward further digital transformation.
Self-assessment of digital maturity varies across the sample, ranging from low to good, with four companies positioning themselves at a higher level of digital maturity.
Relationship between Digitalization Parameters and the Achievement of SDGs
In the second part of the interview, the analysis focused on identifying perceived relationships between specific digitalization parameters and the Sustainable Development Goals (SDGs). To ensure consistency and reduce interpretation bias, all respondents were systematically presented with the full set of 17 SDGs. Each goal was introduced verbally and accompanied by a brief standardized summary to support a uniform understanding across participants.
This structured approach enabled comparability of responses and minimized potential discrepancies arising from differing prior knowledge of the SDG framework, thereby strengthening the validity and reliability of the collected data.
In response to questions related to key digitalization parameters: productivity, employment, innovation, digital infrastructure, reduction of consumption and waste, reduction of CO₂ emissions, and employee competencies, company representatives consistently identified a strong perceived impact of digitalization on selected Sustainable Development Goals (SDGs). The most prominent links were observed for SDG 6 (Clean Water and Sanitation), SDG 7 (Affordable and Clean Energy), SDG 8 (Decent Work and Economic Growth), SDG 9 (Industry, Innovation and Infrastructure), SDG 12 (Responsible Consumption and Production), and SDG 13 (Climate Action).
These results suggest that respondents primarily associate digital transformation with operational efficiency, resource optimization, and technological advancement. Digital tools and data-driven decision-making were perceived as key enablers for reducing resource consumption and emissions (SDG 12, SDG 13), while simultaneously supporting productivity growth and innovation capacity (SDG 8, SDG 9). The linkage to SDG 6 and SDG 7 further reflects the perceived role of digital technologies in improving resource management and energy efficiency.
Overall, the findings indicate that companies tend to recognize the contribution of digitalization mainly in economically and environmentally oriented SDGs, while social dimensions of sustainability appear to be less prominently perceived. This highlights a potential gap in understanding the broader systemic impact of digital transformation on sustainable development.
In the case of productivity, two key goals SDG 8 (Decent Work and Economic Growth) and SDG 9 (Industry, Innovation and Infrastructure) were consistently identified by all interviewees as strongly linked to digitalization. In addition, several respondents also associated productivity related digitalization with SDG 6 (Clean Water and Sanitation), SDG 7 (Affordable and Clean Energy), SDG 12 (Responsible Consumption and Production), and SDG 13 (Climate Action).
Regarding employment, SDG 8 was identified by 9 out of 10 interviewees, while SDG 9 was mentioned by 8 out of 10 respondents, indicating a strong perceived relationship between digitalization, Labor market dynamics, and innovation capacity. Other SDGs associated with employment included SDG 12 and SDG 13, although these were referenced less frequently.
In the field of innovation, all interviewees agreed that digitalization has a very strong impact on SDG 9 (Industry, Innovation and Infrastructure), with slightly weaker but still notable links to SDG 8 (Decent Work and Economic Growth) and SDG 12 (Responsible Consumption and Production).
A similar pattern was observed in the case of digital infrastructure, where respondents most frequently associated its impact with SDG 8, SDG 9, SDG 12, and SDG 13 (Climate Action), indicating a broad perception of its relevance across economic and environmental dimensions. Company management also linked the reduction of consumption to a wider range of goals, specifically SDG 6 (Clean Water and Sanitation), SDG 7 (Affordable and Clean Energy), SDG 8, SDG 9, SDG 12, and SDG 13, highlighting the role of digitalization in improving resource efficiency and sustainability performance. The reduction of waste was consistently perceived as having a direct impact on SDG 12 and SDG 13, a pattern that was equally emphasized in the context of reducing CO₂ emissions, where respondents identified a clear and immediate connection to environmental sustainability goals.
Finally, digital competencies of employees were perceived as a critical factor, with the strongest impact attributed to SDG 9 (identified by 9 out of 10 interviewees), followed by SDG 8 (8 out of 10 interviewees). Additionally, half of the respondents also recognized a link between employee competencies and SDG 12, suggesting that workforce capabilities play an important role in enabling more sustainable production and consumption practices.
In assessing the strength of influence of individual digital parameters on the achievement of Sustainable Development Goals (SDGs), innovation emerged as the most impactful factor. In addition, interviewees identified digital infrastructure, productivity, digital competencies, and consumption reduction as parameters exerting strong or very strong influence.
Regarding the mechanisms through which digitalization contributes to SDG achievement, process optimization was perceived as the most influential, with 9 out of 10 participants attributing a strong impact. This was followed by digital tools and digital competencies, each recognized by 8 out of 10 respondents. In contrast, digital strategy was perceived as having the least immediate impact.
Further analysis focused on the influence of parameter groups on specific SDGs. Within the technology dimension, four key parameters were examined: (1) the use of artificial intelligence for optimizing energy and material consumption, (2) IoT sensors for monitoring and reducing energy losses, (3) cloud computing for infrastructure dematerialization, and (4) blockchain for supply chain transparency. These parameters were associated with multiple SDGs. AI and IoT solutions were perceived to have the strongest impact on goals related to industry, responsible consumption, and climate action, while cloud computing was primarily linked to economic and industrial outcomes. Blockchain was mainly associated with economic growth and industrial innovation.
Within the process dimension, automation aimed at waste reduction was identified as having a strong impact on environmental and industrial goals, while digital supply chains were recognized as influencing economic, industrial, and environmental dimensions. The role of digital twins was acknowledged primarily in relation to economic and industrial performance, although with a comparatively weaker overall impact.
The employee dimension, particularly digital competencies and training was perceived as highly relevant, with the strongest influence attributed to goals related to economic growth, innovation, and responsible consumption.
In the strategy dimension, responses varied more widely; however, more than half of the participants still identified a strong impact on key economic, industrial, and environmental SDGs. Strategic elements such as data-driven decision-making and the integration of sustainability considerations into investment planning were particularly emphasized.
When distinguishing between direct and indirect impacts, technological parameters were predominantly perceived as having direct effects on SDG achievement. A similar pattern was observed for process-related parameters, except for digital twins, which were generally considered to have an indirect impact. Employee-related and strategic parameters were also largely associated with direct effects, especially in the context of decision-making and planning processes.
In terms of the time horizon, most parameters were associated with medium- to long-term impacts. Among them, process automation for waste reduction was identified as the most influential, followed by digitalization of supply chains, while digital twins were perceived as having the lowest impact.
Key barriers to digitalization and subsequent SDG achievement identified by interviewees include financial constraints, insufficient digital competencies, limited data availability, unclear strategic direction, and employee resistance to change. Furthermore, differences across industries and the level of digital maturity were seen as critical factors influencing digitalization, whereas company size was not considered a significant determinant.
Most respondents (7 out of 10) agreed that certain SDGs are more dependent on digitalization than others. At the same time, 8 out of 10 participants disagreed with the statement that digitalization has negative effects on SDG achievement. Finally, strong consensus was observed regarding the statement that digitalization has a direct and significant impact on SDGs, which was confirmed by 9 out of 10 participants, while one respondent provided a neutral assessment.
4.2. Quantitative Analysis
4.2.1. Quantitative Analysis Based on Secondary Data Sources - Eurostat
Among the 60 selected indicators, the following patterns emerge. In the area of artificial intelligence, Slovenian enterprises show a mixed profile. On the positive side, AI use for logistics places Slovenia at the 81.8th percentile, well above the EU average. However, several negatively worded indicators reveal important weaknesses; the indicator “enterprises do not use AI for accounting or finance” places Slovenia at the 97th percentile, meaning that Slovenian enterprises have a much lower AI adoption in this domain compared to other included countries. The indicator “enterprises do not use AI for production or services” (69.7th percentile) also points to a lower adoption in that area, though the difference is moderate. In terms of barriers, “lack of relevant AI expertise” (38.5th percentile) suggests that skill gaps are a lesser constraint in Slovenia than in most EU countries.
Slovenia performs well in ICT training and specialist employment; “training provision for personnel” ranks at the 81.8th percentile, and the combined indicator of employing ICT specialists with training is equally high. The negatively worded indicator “have not provided training” for other staff (18.2nd percentile) additionally supports this interpretation. Therefore, Slovenia has higher training provisions than most EU countries, with only 18% of compared countries showing even greater training adoption.
Regarding electronic invoicing, the negatively worded indicator “did not send automated e-invoices” places Slovenia at the 12.1st percentile. Hence, Slovenia has one of the highest e-invoicing adoption rates in the EU, with only 12% of compared countries showing higher adoption. This confirms its strong e-invoicing performance. Conversely, the indicator “enterprises sending paper invoices” (97.0th percentile) reveals that Slovenian enterprises send paper invoices at a higher rate than nearly all EU countries. Although this indicator is positively worded, a high value is undesirable from a digitalisation perspective, as it signals that paper invoicing persists alongside electronic alternative leaving the digitalization process incomplete.
Website-based customer support presents a notable gap. The negatively worded indicator “website has no chat service” places Slovenia at the 97th percentile, meaning that Slovenian enterprises have lower chat-service adoption than 97% of compared countries. The corresponding positive indicator (“website provides chat service”) confirms this as Slovenia ranks at the 0th percentile.
Robotics and IoT indicators, many of which lack country-level benchmarks, show EU-wide adoption rates that remain low (below 20% for most service-robot applications). The environmental sustainability indicators reveal that a substantial share of enterprises across the EU do not implement measures to reduce paper usage (37.0%) or ICT energy consumption (58.1%), highlighting an area for potential policy intervention.
Mobile device provision (90.9th percentile) and the use of external ICT suppliers (78.8th percentile) are additional areas where Slovenia exceeds the EU norm, reflecting a services-oriented approach to ICT management.
4.2.2. Quantitative Analysis Based on Secondary Data Sources - DESI Index, SDG Index).
Correlation Coefficients and Significance Tests
Table 1 summarises the Spearman correlation coefficients and associated p-values for all four SDG indices in both reference years.
Visualisations
The following figures illustrate the data and statistical results from multiple perspectives. Figure 1, Figure 2, Figure 3, Figure 4 and Figure 5 present the DESI scores by country, the Spearman correlation coefficients, and the associated p-values for both reference years. Figure 6 and Figure 7 show the raw SDG sub-index scores for each member state in 2022 and 2024 respectively. Figure 8 and Figure 9 display rank-order scatter plots — one panel per SDG index — in which each point represents a member state positioned by its DESI rank (horizontal axis) and SDG rank (vertical axis), with a fitted regression line indicating the direction and strength of the Spearman association.
Interpretation
SDG 8 — Decent Work and Economic Growth
The correlation between DESI and SDG 8 is weakly positive in both years (ρ = 0.12 in 2022; ρ = 0.08 in 2024) but fails to reach statistical significance at α = 0.05 in either year (p = 0.57 and p = 0.71, respectively). This result is somewhat surprising given the theoretical expectation that digitalisation supports productivity, labour market formalisation, and access to financial services — all of which feed into SDG 8 indicators. One possible explanation is that SDG 8 captures a broad set of economic and labour outcomes, some of which are driven by factors largely unrelated to digitalisation, such as sectoral composition and labour market institutions. The absence of a significant association does not preclude a relationship, but it suggests that any effect is too weak or heterogeneous to be detected in this cross-sectional sample of 27 countries.
SDG 9 — Industry, Innovation and Infrastructure
The strongest correlation in the analysis is observed between DESI and SDG 9, which is also the most conceptually proximate pairing. SDG 9 measures progress in infrastructure development, industrialisation, and innovation — domains in which digital technologies play a direct and measurable role. High-DESI countries tend to have advanced digital infrastructure, higher R&D investment, and more innovation-driven economies, which are precisely the indicators captured by SDG 9. The consistency of this relationship across both 2022 and 2024 reinforces its robustness.
SDG 12 — Responsible Consumption and Production
A statistically significant negative correlation is found between DESI and SDG 12 in both years (ρ = −0.57 in 2022; ρ = −0.59 in 2024; p < 0.01 in both). Higher-DESI countries — which tend to be wealthier, high-consumption economies — score worse on the SDG 12 index, which penalises excessive material consumption, high waste generation, and unsustainable production patterns. This suggests that the productivity and affluence gains associated with digitalisation come with a sustainability cost in terms of consumption intensity: more digitalised EU member states have not, on average, decoupled economic activity from resource use to the degree that SDG 12 demands. The consistency and significance of this negative relationship across both years is a notable policy-relevant finding.
SDG 13 — Climate Action
The correlation between DESI and SDG 13 is negative in both years (ρ = −0.38 in 2022; ρ = −0.41 in 2024) and is the weakest in magnitude among the four indices. It does not reach statistical significance in 2022 (p = 0.06), but crosses the α = 0.05 threshold in 2024 (p = 0.04). The negative direction of the association — where higher-DESI countries tend to score lower on SDG 13 — likely reflects the same confound as SDG 12: more digitalised countries tend to be high-income economies with large industrial footprints and historically higher per-capita emissions. Climate action performance is driven by a complex set of factors including energy mix, geographic endowment, and political will, none of which are captured by the DESI framework. The marginal significance in 2024 warrants attention but should not be over-interpreted from a cross-sectional sample of 27 countries.
Temporal Comparison: 2022 vs 2024
Comparing results across the two reference years reveals a broadly consistent picture. The ranking of correlations by absolute magnitude is the same in both years (SDG 9 > SDG 12 > SDG 13 > SDG 8), and the direction of each association is unchanged. The one notable development is that the correlation for SDG 13 crossed the significance threshold in 2024 (p = 0.04), having narrowly missed it in 2022 (p = 0.06). This may reflect a modest strengthening of the relationship as digitalisation and high-consumption economies diverged further from lower-DESI countries in their climate performance scores. The stability of results for SDG 9 and SDG 12 across years reinforces confidence in those findings, while the SDG 8 association remains persistently non-significant.
5. Discussion & Conclusions
5.1. Qualitative Analysis Data
The findings confirm that digitalization is perceived by SMEs as a key driver of sustainable development, particularly in relation to economic and environmental outcomes. The strongest links were identified with SDG 8, SDG 9, SDG 12, and SDG 13, indicating that companies associate digital transformation primarily with efficiency, innovation, and resource optimization.
Process optimization emerged as the most important mechanism through which digitalization contributes to sustainability, followed by digital tools and employee competencies. This highlights the importance of operational improvements and human capital in achieving sustainability outcomes. In contrast, digital strategy was perceived as less impactful, suggesting a gap between strategic intent and practical implementation.
The results also show that advanced technologies such as artificial intelligence are still used to a limited extent, mainly in marketing, indicating that many SMEs remain at an intermediate stage of digital maturity. Key barriers include insufficient digital competencies, unclear strategic direction, and resistance to change, alongside financial constraints.
Furthermore, companies tend to focus primarily on economic and environmental aspects of sustainability, while social dimensions remain less recognized. This points to a need for a more holistic understanding of sustainability within digital transformation processes.
This study demonstrates that digitalization plays a significant role in supporting the achievement of Sustainable Development Goals in SMEs. Digital technologies, data-driven decision-making, and employee competencies contribute most strongly to improvements in efficiency, innovation, and resource management.
However, the results also reveal important limitations, including the limited adoption of advanced technologies and the insufficient integration of strategic and social sustainability aspects. The impact of digitalization is therefore not only technological but also organizational and managerial in nature.
For practice, the findings highlight the need to strengthen digital competencies, improve strategic alignment, and adopt a more integrated approach linking digitalization with sustainability objectives.
Overall, digitalization represents a significant but not yet fully exploited opportunity for advancing sustainable development in SMEs.
5.2. Quantitative Analysis Based on Secondary Data Sources - DESI Index, SDG Index).
In this study we provide a comprehensive quantitative assessment of the digital-tool adoption of Slovenian enterprises relative to other European Union members, covering 558 indicators across 544 comparable dimensions. The principal findings are as follows.
Slovenia is positioned close to the EU median. With a mean percentile of 53.6 and a near-zero mean gap (+0.004). Slovenian enterprises are, on average, neither significantly ahead nor behind their European peers. The distribution of gaps is symmetric and narrow (SD = 0.058), indicating broad alignment rather than systemic divergence.
Artificial intelligence adoption presents a nuanced picture. Slovenia ranks at the 100th percentile for AI adoption in ICT security, multi-purpose AI use, and image-recognition AI, showing clear strengths that suggest early-mover advantages. However, our analysis of the 60 selected indicators reveals that negatively worded AI indicators (e.g. ‘do not use AI for accounting’ at the 97th percentile) point to specific domains where AI adoption falls below the EU average. The overall AI picture is thus one of selective strength rather than uniform leadership.
Electronic invoicing is markedly above the EU average. The overall adoption of automated e-invoicing (gap +0.269) is among the largest positive gaps observed. This likely reflects national regulatory mandates that accelerated the transition to electronic invoicing.
Domestic e-commerce is a notable weakness. Turnover from domestic web sales, and the share of enterprises selling to the home market via their own websites or apps, fall substantially below the EU average. This could reflect the small size of the domestic market or lower consumer propensity for online purchasing.
Internet advertising and customer-support channels are underutilised. Slovenian enterprises spend significantly less on targeted online advertising than the EU average, and website-based chat services for customer support are among the rarest in the EU (0th percentile). These gaps could constrain e-commerce growth potential and customer engagement.
Indicators of supply-chain digitalisation show a mixed result. Automated electronic SCM processing is a clear strength, yet the broader indicator of electronic information sharing (inventories, demand forecasts) reveals the largest thematic weakness. This duality suggests that while infrastructure for SCM automation exists, its application to demand-side information sharing remains underdeveloped.
An important methodological note: roughly half of the surveyed indicators are negatively worded (measuring the absence of adoption). High percentile ranks on such indicators indicate lower actual adoption by Slovenian enterprises. This distinction is critical for correct policy interpretation and has been explicitly addressed in this report.
As our study finds, the digitalization process in Slovenia appears to be inconsistent, with some areas widely adopting digital alternatives, while others remain completely analogue. Therefore, Slovenian enterprises still need to further embrace technological advancements to fully benefit form Industry 4.0. Our findings provide a strong empirical basis for both academic and policy interventions that should be employed to overcome the remaining barriers in technology adoption. For example, this is the basis in which our subsequent phase of this research which will focus on the development of a digital-tool configurator that will recommend enterprise-specific digitalisation strategies based on company size, sector, current tool portfolio, and the gaps identified in this study. Through a collective effort of academia, policy and industry, we believe that Slovenia can fully embrace both the concept of Industry 4.0 and its benefits, becoming more efficient and globally competitive.
Limitations and Future Work
Several limitations should be noted. Firstly, the EU average was computed as an unweighted mean of country-level values. While this ensures equal representation of each member state, it does not account for differences in economic size or number of enterprises. A GDP-weighted or enterprise-weighted average could yield different rankings.
Secondly, 14 of the 558 indicators lacked Slovenian data entirely, and the country coverage per indicator varies from 17 to 33 countries. Comparisons based on fewer countries are inherently less robust.
Lastly, the thematic super-group assignment was performed manually based on semantic similarity. A more rigorous approach (e.g. cluster analysis or factor analysis on the indicator correlation matrix) could provide a data-driven grouping.
Future work will extend this analysis by (a) applying machine-learning methods to identify optimal digital-tool combinations, and (b) building prototype intelligent decision-support system for sustainable digital transformation that translates these findings into actionable recommendations for individual enterprises.
5.3. Quantitative Analysis Based on Secondary Data Sources - DESI Index, SDG index).
With respect to H1 — that digitalisation has a significant positive impact on SDG achievement — the analysis does not confirm this broadly. Across the four SDG dimensions examined, only SDG 9 (industry, innovation and infrastructure) shows a statistically significant positive association with DESI in both reference years, indicating a potential connection that warrants further investigation. The remaining associations are either negative or non-significant: SDG 12 (responsible consumption and production) shows a significant negative correlation in both years, reflecting higher consumption footprints in more digitalised, higher-income economies; SDG 13 (climate action) shows a negative correlation that crossed the significance threshold only in 2024; and SDG 8 (decent work and economic growth) shows a weak positive but consistently non-significant association. The strongest and most robust finding is for SDG 9, consistent with the direct conceptual alignment between digital and innovation-related indicators, though confirmation would require further studies.
These findings have implications for EU policy design. While the Digital Decade strategy and the European Green Deal are often pursued in parallel, this analysis suggests that their intersection is uneven and in some dimensions adverse. Digitalisation is strongly associated with innovation-led sustainability gains (SDG 9) but also with higher consumption intensity and weaker climate action performance (SDG 12, SDG 13). Policymakers should not assume that digital progress automatically translates into broad-based sustainability improvements; dedicated instruments targeting consumption patterns and climate action remain essential alongside the digital transition.
Future work should consider longitudinal panel analysis to assess causal relationships, as well as disaggregated DESI sub-dimensions to identify which specific aspects of digitalisation drive sustainability gains most strongly.
Abbreviations
The following abbreviations are used in this manuscript:
| AI | Artificiale Intelligence |
| SME | Micro, Small and Medium Enterprises |
| UN | The United Nations |
| SDG | Sustainable Development Goals |
| ICT | Information and Communications Technology |
| DESI | The Digital Economy and Society Index |
| EU | European Union |
| GDP | Gross Domestic Product |
| SLO | Slovenia |
| IoT | The Internet of Things |
| SCM | Supply Chain Management |
References
- United Nations. Sustainability development knowledge platform. 2016. Available online: https:// sustainabledevelopment.un.org/sdgs.
- Orobosa Idemudia, S.; Kelvin Chima, O.; Ezeilo, O.; Monday Ojonugwa, B.; Ochefu Michael Olumuyiwa Adesuyi, A. Digital Infrastructure Barriers Faced by SMEs in Transitioning to Smart Business Models. International Journal of Scientific Research in Science, Engineering and Technology 2023, 353–370. [Google Scholar]
- Eurostat. Digitalisation in Europe – 2025 edition. European Commission. European Commission, 2025. Available online: https://ec.europa.eu/eurostat/web/interactive-publications/digitalisation-2025.
- European Commission. Digital Decade 2025: DESI methodological note. n.d. Available online: https://digital-strategy.ec.europa.eu/en/library/digital-decade-2025-desi-methodological-note.
- Varga, J. Defining the economic role and benefits of micro, small and medium-sized enterprises in the 21st century with a systematic review of the literature. Acta Polytechnica Hungarica 2021, 18(11), 209–228. [Google Scholar] [CrossRef]
- Moeuf, A.; Lamouri, S.; Pellerin, R.; Tamayo-Giraldo, S.; Tobon-Valencia, E.; Eburdy, R. Identification of critical success factors, risks and opportunities of Industry 4.0 in SMEs. International Journal of Production Research 2020, 58(5), 1384–1400. [Google Scholar] [CrossRef]
- Ustundag, A.; Cevikcan, E. Industry 4.0: managing the digital transformation; Springer: Cham, 2018; p. 286. [Google Scholar]
- Dutta, G.; Kumar, R.; Sindhwani, R.; Singh, R. K. Digital transformation priorities of India’s discrete manufacturing SMEs–a conceptual study in perspective of Industry 4.0. Competitiveness Review: An International Business Journal 2020, 30(3), 289–314. [Google Scholar] [CrossRef]
- Kumar, P.; Bhamu, J.; Sangwan, K. S. Analysis of barriers to Industry 4.0 adoption in manufacturing organizations: An ISM approach. Procedia Cirp 2021, 98, 85–90. [Google Scholar] [CrossRef]
- Dossou, P. E.; Laouénan, G.; Didier, J. Y. Development of a sustainable industry 4.0 approach for increasing the performance of SMEs. Processes 2022, 10(6), 1092. [Google Scholar] [CrossRef]
- Sever, S. Duygu; Tok, Evren; Sellami, Abdel Latif. Sustainable Development Goals in a Transforming World: Understanding the Dynamics of Localization. 2025. [Google Scholar] [CrossRef]
- Zioło, M.; Bąk, I.; Spoz, A. Theoretical framework of sustainable value creation by companies. What do we know so far? Corporate Social Responsibility and Environmental Management 2023, 30(5), 2344–2361. [Google Scholar] [CrossRef]
- Yu, W.; Liu, Q.; Chavez, R.; Zheng, L. Does training provision matter? Unravelling the impact of digital transformation on environmental sustainability. Information Technology & People 2025, 38(2), 1089–1109. [Google Scholar]
- Aksentijević, N. K.; Ježić, Z.; Zaninović, P. A. The effects of information and communication technology (ICT) use on human development-A macroeconomic approach. Economies 2021, 9(3), 128–140. [Google Scholar] [CrossRef]
- Brodny, J.; Tutak, M. Digitalization of small and medium-sized enterprises and economic growth: Evidence for the EU-27 countries. Journal of Open Innovation: Technology, Market, and Complexity 2022, 8(2), 67. [Google Scholar] [CrossRef]
- Chopra, M.; Singh, S.K.; Gupta, A.; Aggarwal, K.; Gupta, B.B.; Colace, F. Analysis & Prognosis of Sustainable Development Goals Using Big Data-Based Approach During COVID-19 Pandemic. Sustain. Technol. Entrep. 2022, 1, 100012. [Google Scholar] [CrossRef]
- Chen, L. How CO2 Emissions Respond to Changes in Government Size and Level of Digitalization? Evidence from the BRICS Countries. Environ. Sci. Pollut. Res. 2022, 29, 457–467. [Google Scholar] [CrossRef] [PubMed]
- Ma, Q.; Tariq, M.; Mahmood, H.; Khan, Z. The Nexus Between Digital Economy and Carbon Dioxide Emissions in China: The Moderating Role of Investments in Research and Development. Technol. Soc. 2022, 68, 101910. [Google Scholar] [CrossRef]
- Omol, E.; Abuonji, P.; Mburu, L. SMEs’ digital maturity: analyzing influencing factors and the mediating role of environmental factors. Journal of Innovative Digital Transformation 2025, 2(1), 19–36. [Google Scholar] [CrossRef]
- United Nations Department of Economic and Social Affairs. Micro-, small and medium-sized enterprises (MSMEs) and their role in achieving the Sustainable Development Goals (SDGs); UN DESA, 2020; Available online: https://sdgs.un.org/publications/micro-small-and-medium-sized-enterprises-msmes-and-their-role-achieving-sustainable.
- Kumar, R.; Gaur, A.; Kulkarni, M. S.; Kumar, S.; Pandhare, V.; Kumar Lad, B. Industry 4.0 readiness assessment for micro small and medium-sized enterprises (MSMEs). In IET Conference Proceedings CP885 (Vol. 2024, No. 11, pp. 146-152). Stevenage, UK: The Institution of Engineering and Technology. Systems 13. 496. October 2024. [Google Scholar]
- Zhou, C. The Impact of Artificial Intelligence on the Sustainable. Development Performance of Chinese Manufacturing Enterprises. June 2025. [Google Scholar]
Figure 1.
DESI scores for all 27 EU member states (2022). Countries are ranked from highest to lowest DESI score.
Figure 1.
DESI scores for all 27 EU member states (2022). Countries are ranked from highest to lowest DESI score.

Figure 2.
Spearman correlation coefficients between DESI and each of the four SDG sub-indices, 2022. Blue bars indicate positive correlations; the dashed line marks zero.
Figure 2.
Spearman correlation coefficients between DESI and each of the four SDG sub-indices, 2022. Blue bars indicate positive correlations; the dashed line marks zero.

Figure 3.
Spearman correlation coefficients between DESI and each of the four SDG sub-indices, 2024. The pattern is consistent with 2022: SDG 9 remains strongly positive, SDG 12 and SDG 13 negative.
Figure 3.
Spearman correlation coefficients between DESI and each of the four SDG sub-indices, 2024. The pattern is consistent with 2022: SDG 9 remains strongly positive, SDG 12 and SDG 13 negative.

Figure 4.
Figure 4. P-values of the Spearman correlation tests, 2022. Red bars exceed the 0.05 significance threshold (dashed line); only SDG 9 and SDG 12 are statistically significant.
Figure 4.
Figure 4. P-values of the Spearman correlation tests, 2022. Red bars exceed the 0.05 significance threshold (dashed line); only SDG 9 and SDG 12 are statistically significant.

Figure 5.
P-values of the Spearman correlation tests, 2024. SDG 9, SDG 12, and SDG 13 fall below the 0.05 threshold; SDG 8 remains non-significant.
Figure 5.
P-values of the Spearman correlation tests, 2024. SDG 9, SDG 12, and SDG 13 fall below the 0.05 threshold; SDG 8 remains non-significant.

Figure 6.
SDG sub-index scores (SDG 8, 9, 12, 13) for all 27 EU member states, 2022. Each panel shows country-level variation in the respective sustainability dimension.
Figure 6.
SDG sub-index scores (SDG 8, 9, 12, 13) for all 27 EU member states, 2022. Each panel shows country-level variation in the respective sustainability dimension.

Figure 7.
SDG sub-index scores (SDG 8, 9, 12, 13) for all 27 EU member states, 2024. Distributions are broadly similar to 2022, with marginal changes in SDG 13 scores.
Figure 7.
SDG sub-index scores (SDG 8, 9, 12, 13) for all 27 EU member states, 2024. Distributions are broadly similar to 2022, with marginal changes in SDG 13 scores.

Figure 8.
Rank-order scatter plots of DESI rank vs. SDG rank for all four sub-indices, 2022. Each point represents an EU member state; the regression line indicates the direction of the Spearman association.
Figure 8.
Rank-order scatter plots of DESI rank vs. SDG rank for all four sub-indices, 2022. Each point represents an EU member state; the regression line indicates the direction of the Spearman association.

Figure 9.
Figure 9. Rank-order scatter plots of DESI rank vs. SDG rank for all four sub-indices, 2024. Results are consistent with 2022, confirming the temporal robustness of the observed associations.
Figure 9.
Figure 9. Rank-order scatter plots of DESI rank vs. SDG rank for all four sub-indices, 2024. Results are consistent with 2022, confirming the temporal robustness of the observed associations.


Table 1.
Spearman correlation coefficients between DESI and SDG indices for 27 EU member states (2022 and 2024). Significance level α = 0.05. Green shading indicates statistically significant results.
Table 1.
Spearman correlation coefficients between DESI and SDG indices for 27 EU member states (2022 and 2024). Significance level α = 0.05. Green shading indicates statistically significant results.

Disclaimer/Publisher’s Note: The statements, opinions and data contained in all publications are solely those of the individual author(s) and contributor(s) and not of MDPI and/or the editor(s). MDPI and/or the editor(s) disclaim responsibility for any injury to people or property resulting from any ideas, methods, instructions or products referred to in the content. |
© 2026 by the authors. Licensee MDPI, Basel, Switzerland. This article is an open access article distributed under the terms and conditions of the Creative Commons Attribution (CC BY) license (http://creativecommons.org/licenses/by/4.0/).
Copyright: This open access article is published under a Creative Commons CC BY 4.0 license, which permit the free download, distribution, and reuse, provided that the author and preprint are cited in any reuse.


