

Submitted:
08 April 2026
Posted:
21 April 2026
You are already at the latest version
Abstract
The selection of locations for logistics distribution centers poses a significant challenge in logistics network planning. Traditional methods often demonstrate limited accuracy in solutions and a tendency to become trapped in local optima when addressing large-scale, multi-constraint location models. To address these shortcomings, this study introduces a firefly algorithm enhanced by genetic mutation strategies (GVFA) to optimize the location of distribution centers. Within the framework of the standard firefly algorithm, we incorporate an adaptive step-size decay mechanism and a mutation operator. The movement step size adjusts dynamically based on iteration counts, while a mutation probability of 5\% is implemented to maintain population diversity, effectively reducing the risk of premature convergence. A specialized boundary-handling strategy ensures that the search process remains within the feasible solution space, guiding the population toward the global optimum. Experiments were conducted using latitude-longitude coordinates and logistics demand data from 159 Cainiao Post stations in Hengyang City, resulting in the construction of a location model aimed at minimizing total costs. The findings confirm the efficiency and stability of our method in optimizing distribution center locations, thereby providing a novel intelligent optimization approach for the siting of logistics distribution centers.
Keywords:
logistics distribution center
; location optimization
; firefly algorithm
; genetic mutation
; adaptive step size
1. Introduction
The rapid growth of e-commerce and the logistics sector has made the efficiency and cost control of distribution systems a fundamental corporate competency [1,2]. As critical nodes within logistics networks, the placement of distribution centers significantly influences transportation costs, service efficiency, and overall system reliability. Traditional location methods, such as the center-of-gravity and analytic hierarchy process, often struggle to address the dynamics and complexities of contemporary logistics when tackling multi-objective, large-scale problems, primarily due to model oversimplification or limited solving capacity [3,4,5,6]. Therefore, the application of intelligent optimization algorithms for achieving efficient and precise location decisions is of considerable theoretical and practical importance. The firefly algorithm (FA), a swarm intelligence optimization technique that emulates the flashing and attraction behaviors of fireflies, was introduced by Professor Yang at Cambridge University in 2009 [7]. This algorithm progressively directs the population toward the global optimum by comparing individual brightness and updating positions, offering advantages such as a limited number of parameters, ease of operation, and favorable convergence properties. It has been successfully applied in areas such as image processing, path planning, and multi-objective optimization. However, the standard FA has notable limitations, including sensitivity to initial values and a propensity to converge to local optima when addressing high-dimensional, multimodal problems [8,9,10]. This study proposes enhancements to the FA tailored to the specific characteristics of the distribution center location problem and applies these improvements within this context.
1.1. Motivation
The location of logistics distribution centers represents a classic NP-hard combinatorial optimization problem. The primary objective is to minimize total construction and transportation costs while satisfying customer demand. As the distribution network expands, the solution space increases exponentially, complicating the ability of traditional optimization methods to yield satisfactory solutions within a reasonable timeframe. While intelligent optimization algorithms, such as ant colony and genetic algorithms, have been employed in this domain, they often encounter challenges, including slow convergence and limited solution accuracy. The Firefly Algorithm (FA), a relatively recent addition to swarm intelligence techniques, has exhibited strong global search capabilities in multi-objective optimization. However, its application to logistics distribution center location remains underexplored, lacking systematic model development and empirical validation.
1.2. Our Approach
This study develops a logistics distribution center location model aimed at minimizing total costs, which is addressed through an enhanced firefly algorithm that incorporates genetic mutation strategies (GVFA). To improve algorithm performance, we implemented a dynamic step-size mechanism alongside a genetic mutation strategy. The step-size factor adjusts according to the iteration count and the distance between individuals, thereby balancing global exploration with local exploitation. Additionally, a mutation operator is introduced to augment population diversity and mitigate the risk of premature convergence. Utilizing coordinate and logistics demand data from 159 Cainiao Post stations in Hengyang City as a sample, we established a normalized coordinate system and simulated the actual demand distribution, thereby validating the algorithm’s effectiveness and robustness in optimizing multi-center distribution locations.
2. Related Work
The positioning of logistics distribution centers is crucial for enhancing the efficiency, cost-effectiveness, and sustainability of logistics networks. As application scenarios become more complex, the development of tailored models that integrate domain-specific characteristics, along with the use of effective intelligent algorithms, has emerged as a key area of research.
Scholars have extensively investigated various constraints in domain-specific modeling. Tong (2022) developed a cost-oriented, two-layer location-routing coordination model specifically designed for the high-cost nature of maritime ship logistics [11]. In the context of regional logistics network optimization, Huang et al. (2022) employed a particle swarm algorithm to resolve a constrained p-median model aimed at achieving a balanced facility layout [12]. To tackle demand uncertainty and emergencies, Lei et al. (2023) proposed a hybrid decision-making model that addresses probabilistic uncertain linguistic information for the siting of medical logistics centers [13]. Additionally, Wang et al. (2023) constructed a multi-objective optimization model for the layout of large-scale distribution centers during the pandemic [14]. Emergency logistics prioritizes timeliness; thus, Li et al. (2023) and Cao et al. (2023) modified the jellyfish search algorithm and genetic algorithm, respectively, by incorporating time satisfaction as a critical factor in their models [15,16]. Moreover, the focus on green and sustainable practices is increasing, as evidenced by Zhang et al. (2024), who integrated carbon emission costs into cold-chain logistics location models [17].
Metaheuristic algorithms are extensively utilized for their effectiveness in addressing complex optimization problems, including particle swarm optimization [12], jellyfish search algorithm [15], genetic algorithm [16], and grey wolf optimizer [10]. The complexity of model structures is also increasing; for example, Wang et al. (2024) implemented a bi-level programming model that captures hierarchical corporate decision-making [18]. A prominent trend is the integration of traditional optimization algorithms with artificial intelligence techniques, as demonstrated by Liu et al. (2024), who combined deep reinforcement learning with swarm intelligence to tackle multi-objective agricultural logistics optimization [19].
A review of the current literature indicates that, despite significant advancements in model specialization and algorithm application, the majority of research emphasizes either the direct application or singular modification of existing algorithms. This highlights a need for greater integration and innovation within algorithmic search mechanisms, particularly in achieving a balance between global and local search capabilities and enhancing robustness for high-dimensional, complex models. This identified gap motivates our development of a novel hybrid algorithm that combines genetic mutation mechanisms with the attraction dynamics of the firefly algorithm.
3. Proposed Methodology
3.1. Problem Description
Using the Cainiao Post stations in Hengyang City as a case study, the city comprises N station sites that serve dual functions as demand points—receiving parcels from outside the city—and supply points—dispatching parcels outward. The objective is to select M stations from these existing sites to serve as distribution centers, which will be responsible for collecting and dispatching parcels within their designated regions. This study focuses on the selection of several sites from the existing stations to establish logistics distribution centers, with the aim of minimizing two key objectives: total transportation cost and maximum response time, the latter measured by the longest service distance. The following constraints are imposed:
- Each station can be served by only one distribution center.
- The distance between sites is computed using Euclidean distance, under the assumption of a fixed traffic network.
- Transportation costs are directly proportional to distance, with variations in parcel weight disregarded.
- The construction cost and daily fixed operating cost for each distribution center remain constant.
3.2. Mathematical Model
Based on the preceding description, the problem is formulated as a continuous-space location-allocation optimization model aimed at minimizing total costs. The mathematical model is defined as follows:
where:
Z: Target value for final delivery optimization.
M: Number of distribution centers.
F: Construction cost and average daily fixed operating cost per distribution center.
: Total delivery transportation cost.
: Maximum service distance (response time metric).
: Optimal value for minimizing transportation cost.
: Optimal value for minimizing maximum distance.
: Weighting coefficient reflecting priority of cost objectives.
: Set of all Cainiao Stations.
: Set of candidate distribution centers (identical to the station set).
c: Transportation cost coefficient per unit distance per unit parcel.
: Euclidean distance from station to candidate center.
: Daily average total parcel processing volume of station.
: Whether station is served by distribution center.
: Maximum distance from all stations to their serving distribution centers.
: Indicator for establishing a distribution center at site k.
3.3. Algorithm Implementation
The standard firefly algorithm optimizes by simulating the luminous attraction behavior among individual fireflies. To enhance its performance for the location problem [20], we introduce two improvement mechanisms: an adaptive step-size strategy and a diversity-preserving mutation, resulting in an improved firefly algorithm integrated with genetic variation strategies (GVFA).
The fixed step size in the standard FA can include oscillations near the optimum in later iterations, thereby impairing convergence precision, while an excessively small step size can hinder convergence. To address this issue, we propose a dynamic, variable step size: the step size decreases as the iteration count and the distance between fireflies increase. For example, substituting the constant step size factor with facilitates rapid convergence initially and stabilization near the optimum later, effectively balancing convergence speed and precision. The displacement formula for the FA with a dynamic variable step size is given by Equation (3).
In this equation, and denote the current spatial positions of fireflies i and j at time t, is the attractiveness of firefly, k is a constant, is the Euclidean distance between fireflies i and j, is a random number uniformly distributed on [0,1].
To enhance population diversity, a mutation operation with probability is applied to selected individuals. For each chosen individual, its position vector is reinitialized to a random value within the feasible boundaries. This mechanism ensures that a segment of the population preserves advantageous positions while permitting new individuals to explore alternative regions, thereby maintaining a balance between exploitation and exploration.
The algorithm procedure is as follows:
Step 1. Input: Demand point coordinates, demand volumes, algorithm parameters (population size S, maximum iterations , , , , , etc.).
Step 2. Data Preprocessing: Normalize demand point coordinates.
Step 3. Initialization: Randomly generate initial positions for S fireflies. Calculate each firefly’s objective function value (total cost) and brightness.
Step 4. Iterative Optimization:
a. Rank fireflies by brightness.
b. For each firefly i, traverse all brighter fireflies j. Calculate attraction and movement step size using Equation (3), then update firefly i’s position.
c. Apply boundary handling to the updated position.
d. Execute mutation operation with probability .
e. Recalculate all fireflies’ objective function values and brightness.
f. Record the current best solution.
Step 5. Output: After iterations conclude, output the global best solution (optimal distribution center locations) and the corresponding minimum total cost.
4. Experiments and Results Analysis
To assess the effectiveness of the proposed multi-objective distribution center location model and the enhanced Genetic Variation Firefly Algorithm (GVFA) in a real-world urban logistics context, systematic simulations were performed utilizing empirical data from 159 Cainiao Post stations in Hengyang City, China, which handle a total daily parcel volume of 66,820 items. The experimental environment was established using VMware Workstation Pro virtual machine software, operating on an Ubuntu 64-bit OS with 16 GB of RAM. Python was utilized as the programming language within the PyCharm platform. Algorithm parameters were set as follows: firefly population size = 60, light absorption coefficient = 0.12, initial step-size factor = 0.6, base attractiveness = 0.15, mutation probability = 0.05, and maximum iterations = 200. To ensure robustness, each scenario for different numbers of distribution centers (K = 1 – 7) was independently run 20 times, with results averaged.
The optimization results across varying numbers of distribution centers (K) illustrate a distinct trade-off between cost and efficiency. As depicted in Figure 1, transportation costs decrease markedly with an increase in K, falling from 217,720.25 CNY for K=1 to 82,330.78 CNY for K=7, primarily due to shorter service distances. Conversely, the fixed costs associated with distribution centers rise linearly, leading to a nonlinear trend in total costs Figure 2. Notably, total costs reach a minimum of 152,330.78 CNY at K=7, reflecting a reduction of approximately 33.1% compared to the single-center scenario (K=1). The change in cost per parcel further corroborates this observation Figure 3: at K=7, the per-parcel cost is 2.2832 CNY/item, representing the most substantial improvement relative to the single-center scheme (3.4080 CNY/item). Beyond K=4, the pace of cost reduction diminishes, with a slight rebound noted between K=4 and K=5, indicating diminishing marginal returns.
In terms of spatial efficiency, the maximum delivery distance decreases significantly as K increases Figure 4. For K=1, the maximum distance is 40.88 km; however, for K=3, it reduces to 7.44 km, reflecting an 81.8% reduction. This substantial decrease enhances both end-point service responsiveness and coverage balance. Regarding algorithm performance, the convergence curves of the weighted objective function Figure 5 stabilize within 50 iterations across all K values, with K=3 yielding the lowest weighted objective value of 1.0189. This result indicates optimal performance in balancing transportation costs, fixed costs, and delivery distances. The runtime for each scenario ranges from approximately 23.5 to 23 seconds Table 1, underscoring the algorithm’s computational efficiency and scalability.
A comprehensive analysis of the optimal configuration (K=3, Figure 6) reveals that the three distribution centers serve 186, and 72 stations, processing daily volumes of 32,039,660, and 26,840 parcels, respectively. The overall average delivery distance is 2.82 km. In this configuration, fixed costs account for only 16.8% of the total expenses, while transportation costs dominate at 83.2%, thereby optimizing operational expenditures while managing infrastructure investments. Moreover, the maximum delivery distance of 7.44 km remains within a reasonable range, effectively balancing service accessibility with vehicle routing efficiency.
In summary, through systematic simulation experiments, this study demonstrates that, under multi-objective constraints that consider both fixed and transportation costs, the optimal number of distribution centers for the Cainiao Post station network in Hengyang City is three. This configuration achieves an optimal balance between economic efficiency and spatial performance, providing empirical evidence and decision support for the planning and design of similar urban logistics networks. Future research could incorporate more complex factors, such as dynamic demand and time-varying traffic network characteristics, to enhance the model’s applicability in real-world scenarios.
5. Conclusions
This study addresses the intricate optimization challenge of distribution center location within urban logistics networks by proposing an enhanced firefly algorithm integrated with genetic mutation strategies (GVFA). The primary innovation involves the incorporation of an adaptive, dynamically decaying movement step size alongside a low-probability mutation operator within the standard firefly algorithm framework. These enhancements effectively balance global exploration with local exploitation capabilities, thereby significantly reducing the risk of premature convergence. Additionally, a specially designed boundary-handling mechanism ensures that the search process remains confined within the feasible solution space, thereby improving optimization stability and solution quality.
Empirical research utilizing actual coordinates and parcel volume data from 159 Cainiao Post stations in Hengyang City facilitated the construction and resolution of a multi-objective location model. This model aims to minimize both transportation and fixed costs while adhering to service distance constraints. Simulation results demonstrate that the proposed GVFA exhibits commendable convergence speed and robustness in addressing this large-scale discrete optimization problem, efficiently approximating the Pareto front. A systematic analysis of cost structures and spatial efficiency across varying numbers of distribution centers (K=1 to 7) revealed that the system achieves optimal comprehensive performance at K=3. This configuration results in the lowest total cost (178,247.44 CNY), reduces per-parcel distribution costs by 21.7% compared to the single-center scheme, and decreases the maximum delivery distance by 81.8%, thereby achieving an optimal balance between operational economy and service accessibility.
The primary contributions of this work are threefold. First, it presents an efficient and stable novel intelligent framework for addressing logistics distribution center location problems. Second, through a comprehensive empirical case analysis, it clarifies the nonlinear trade-off between fixed and transportation costs, as well as the law of diminishing marginal returns related to the number of distribution centers, thereby offering a quantitative basis for decision-making in logistics network planning. Third, it demonstrates the practical value of enhanced heuristic algorithms in solving complex location problems constrained by real-world factors.
Future research may advance in several directions. First, dynamic and time-varying customer demands, along with traffic conditions, could be integrated into the model to improve the real-time adaptability of scheduling schemes. Second, the model could be expanded to include multiple sustainability objectives, such as environmental impact and energy consumption, thereby creating a more comprehensive evaluation system. Finally, at the algorithmic level, integrating machine learning methods could utilize historical data to predict optimal parameter configurations, further enhancing optimization efficiency and intelligence. The model and methodology proposed in this study offer robust theoretical and practical support for the refined planning and operational management of smart city logistics systems.
Funding
This research was supported by the Hunan Provincial Natural Science Foundation Project under Grant No. 2025JJ70160, and the Scientific Fund of Hunan Provincial Education Department under Grant No. 23A0629.
References
- Schorung, Matthieu; Lecourt, Thibault; Dablanc, Laetitia. Assessing the spatial footprint of e-commerce logistics differentiating the types of warehouses. Journal of Transport and Land Use 2024, 17(1), 647–674. [Google Scholar] [CrossRef]
- Jayarathna, Chamari Pamoshika; Agdas, Duzgun; Dawes, Les; Yigitcanlar, Tan. Multi-objective optimization for sustainable supply chain and logistics: A review. Sustainability 2021, 13(24), 13617. [Google Scholar] [CrossRef]
- Güven Güney, Büşra; Yüzer, Mehmi; et al. Location Criteria for E-Commerce Logistics Facilities: A Scale-Sensitive Analysis. Sustainability 2025, 17(22), 10115. [Google Scholar] [CrossRef]
- Özder, Emir Hüseyin. A Sustainable Multi-Criteria Decision-Making Framework for Online Grocery Distribution Hub Location Selection. Processes 2025, 13(6), 1653. [Google Scholar]
- Huang, Qian; Zheng, Guijun; Pan, Shuangli; Liao, Huiyu; Jiang, Zehua. Layout optimization of multi-level cold chain storage facilities in agricultural producing areas considering type and capacity constraints. Plos one 2025, 20(2), e0313062. [Google Scholar] [CrossRef] [PubMed]
- Dou, Shuihai; Liu, Guanyi; Yang, Yubo. A new hybrid algorithm for cold chain logistics distribution center location problem. IEEE Access 2020, 8, 88769–88776. [Google Scholar] [CrossRef]
- Yang, Xin-She. Firefly algorithms for multimodal optimization. In International symposium on stochastic algorithms; Springer, 2009; pp. 169–178. [Google Scholar]
- Zhang, D.L.; Xia, H.W.; Zhang, C.X.; Ma, G.C.; Wang, C.H. Improved firefly algorithm and its convergence analysis. J. Syst. Eng. Electron 2022, 44, 1291–1300. [Google Scholar]
- Priya, Banu; Maheshwari, Danyal. Adaptive firefly algorithm for resource allocation and modified advanced encryption standard algorithm for hypervisor attack detection on cloud computing. Salud, Ciencia y Tecnología-Serie de Conferencias 2024, 3, 933. [Google Scholar] [CrossRef]
- Suleiman, Abdulkarim Bashir; Donfack, Kana Armand Florentin; Muhammad, Abdulkarim; Haruna, Muhammad Jumare. A Multilevel Digital Image Thresholding Technique Based on an Enhanced Firefly Algorithm with Neighborhood Attraction. Journal of Computing Theories and Applications 2025, 2(4), 572–587. [Google Scholar] [CrossRef]
- Tong, Haolin. Research on the site selection and path layout of the logistics distribution center of marine ships based on a mathematical model. Archives of Transport 2022, 63. [Google Scholar] [CrossRef]
- Huang, Yingyi; Wang, Xinyu; Chen, Hongyan. Location selection for regional logistics center based on particle swarm optimization. Sustainability 2022, 14(24), 16409/MDPI. [Google Scholar] [CrossRef]
- Lei, Fan; Cai, Qiang; Liao, Ningna; Wei, Guiwu; He, Yan; Wu, Jiang; Wei, Cun. TODIM-VIKOR method based on hybrid weighted distance under probabilistic uncertain linguistic information and its application in medical logistics center site selection. Soft Computing 2023, 27(13), 8541–8559. [Google Scholar] [CrossRef] [PubMed]
- Wang, Luchen; Tian, Ye; Xiang, Xiaoshu; Zhang, Xingyi. Optimizing Large-Scale Distribution Center Locations During the COVID-19 Quarantine. In 2023 IEEE Congress on Evolutionary Computation (CEC); IEEE, 2023; pp. 1–8. [Google Scholar]
- Li, Ping; Fan, Xingqi. The application of the improved jellyfish search algorithm in a site selection model of an emergency logistics distribution center considering time satisfaction. Biomimetics 2023, 8(4), 349. [Google Scholar] [CrossRef] [PubMed]
- Cao, Jinjing; Fang, Huang. An improved genetic algorithm with density-guiding operator based on the location selection model of emergency logistics center. In Journal of Physics: Conference Series; IOP Publishing, 2023; Vol. 2665, No. 1, p. 012005. [Google Scholar]
- Zhang, Liyi; Fu, Mingyue; Fei, Teng; Lim, Ming K; Tseng, Ming-Lang. A cold chain logistics distribution optimization model: Beijing-Tianjin-Hebei region low-carbon site selection. Industrial Management & Data Systems 2024, 124(11), 3138–3163. [Google Scholar]
- Wang, Lei; Liu, Guangjun; Hamam, Habib. Enhancing logistics optimization: A double-layer site-selection model approach. Journal of Organizational and End User Computing (JOEUC) 2024, 36, 1–15. [Google Scholar] [CrossRef]
- Liu, Huan; Zhang, Jizhe; Zhou, Zhao; Dai, Yongqiang; Qin, Lijing. A deep reinforcement learning-based algorithm for multi-objective agricultural site selection and logistics optimization problem. Applied Sciences 2024, 14(18), 8479. [Google Scholar] [CrossRef]
- Behjat, Amir; Maurer, Nathan; Chidambaran, Sharat; Chowdhury, Souma. Adaptive neuroevolution with genetic operator control and two-way complexity variation. IEEE Transactions on Artificial Intelligence 2022, 4(6), 1627–1641. [Google Scholar] [CrossRef]
Figure 1.
Comparison of Transportation Cost Convergence Curves for Different K Values.
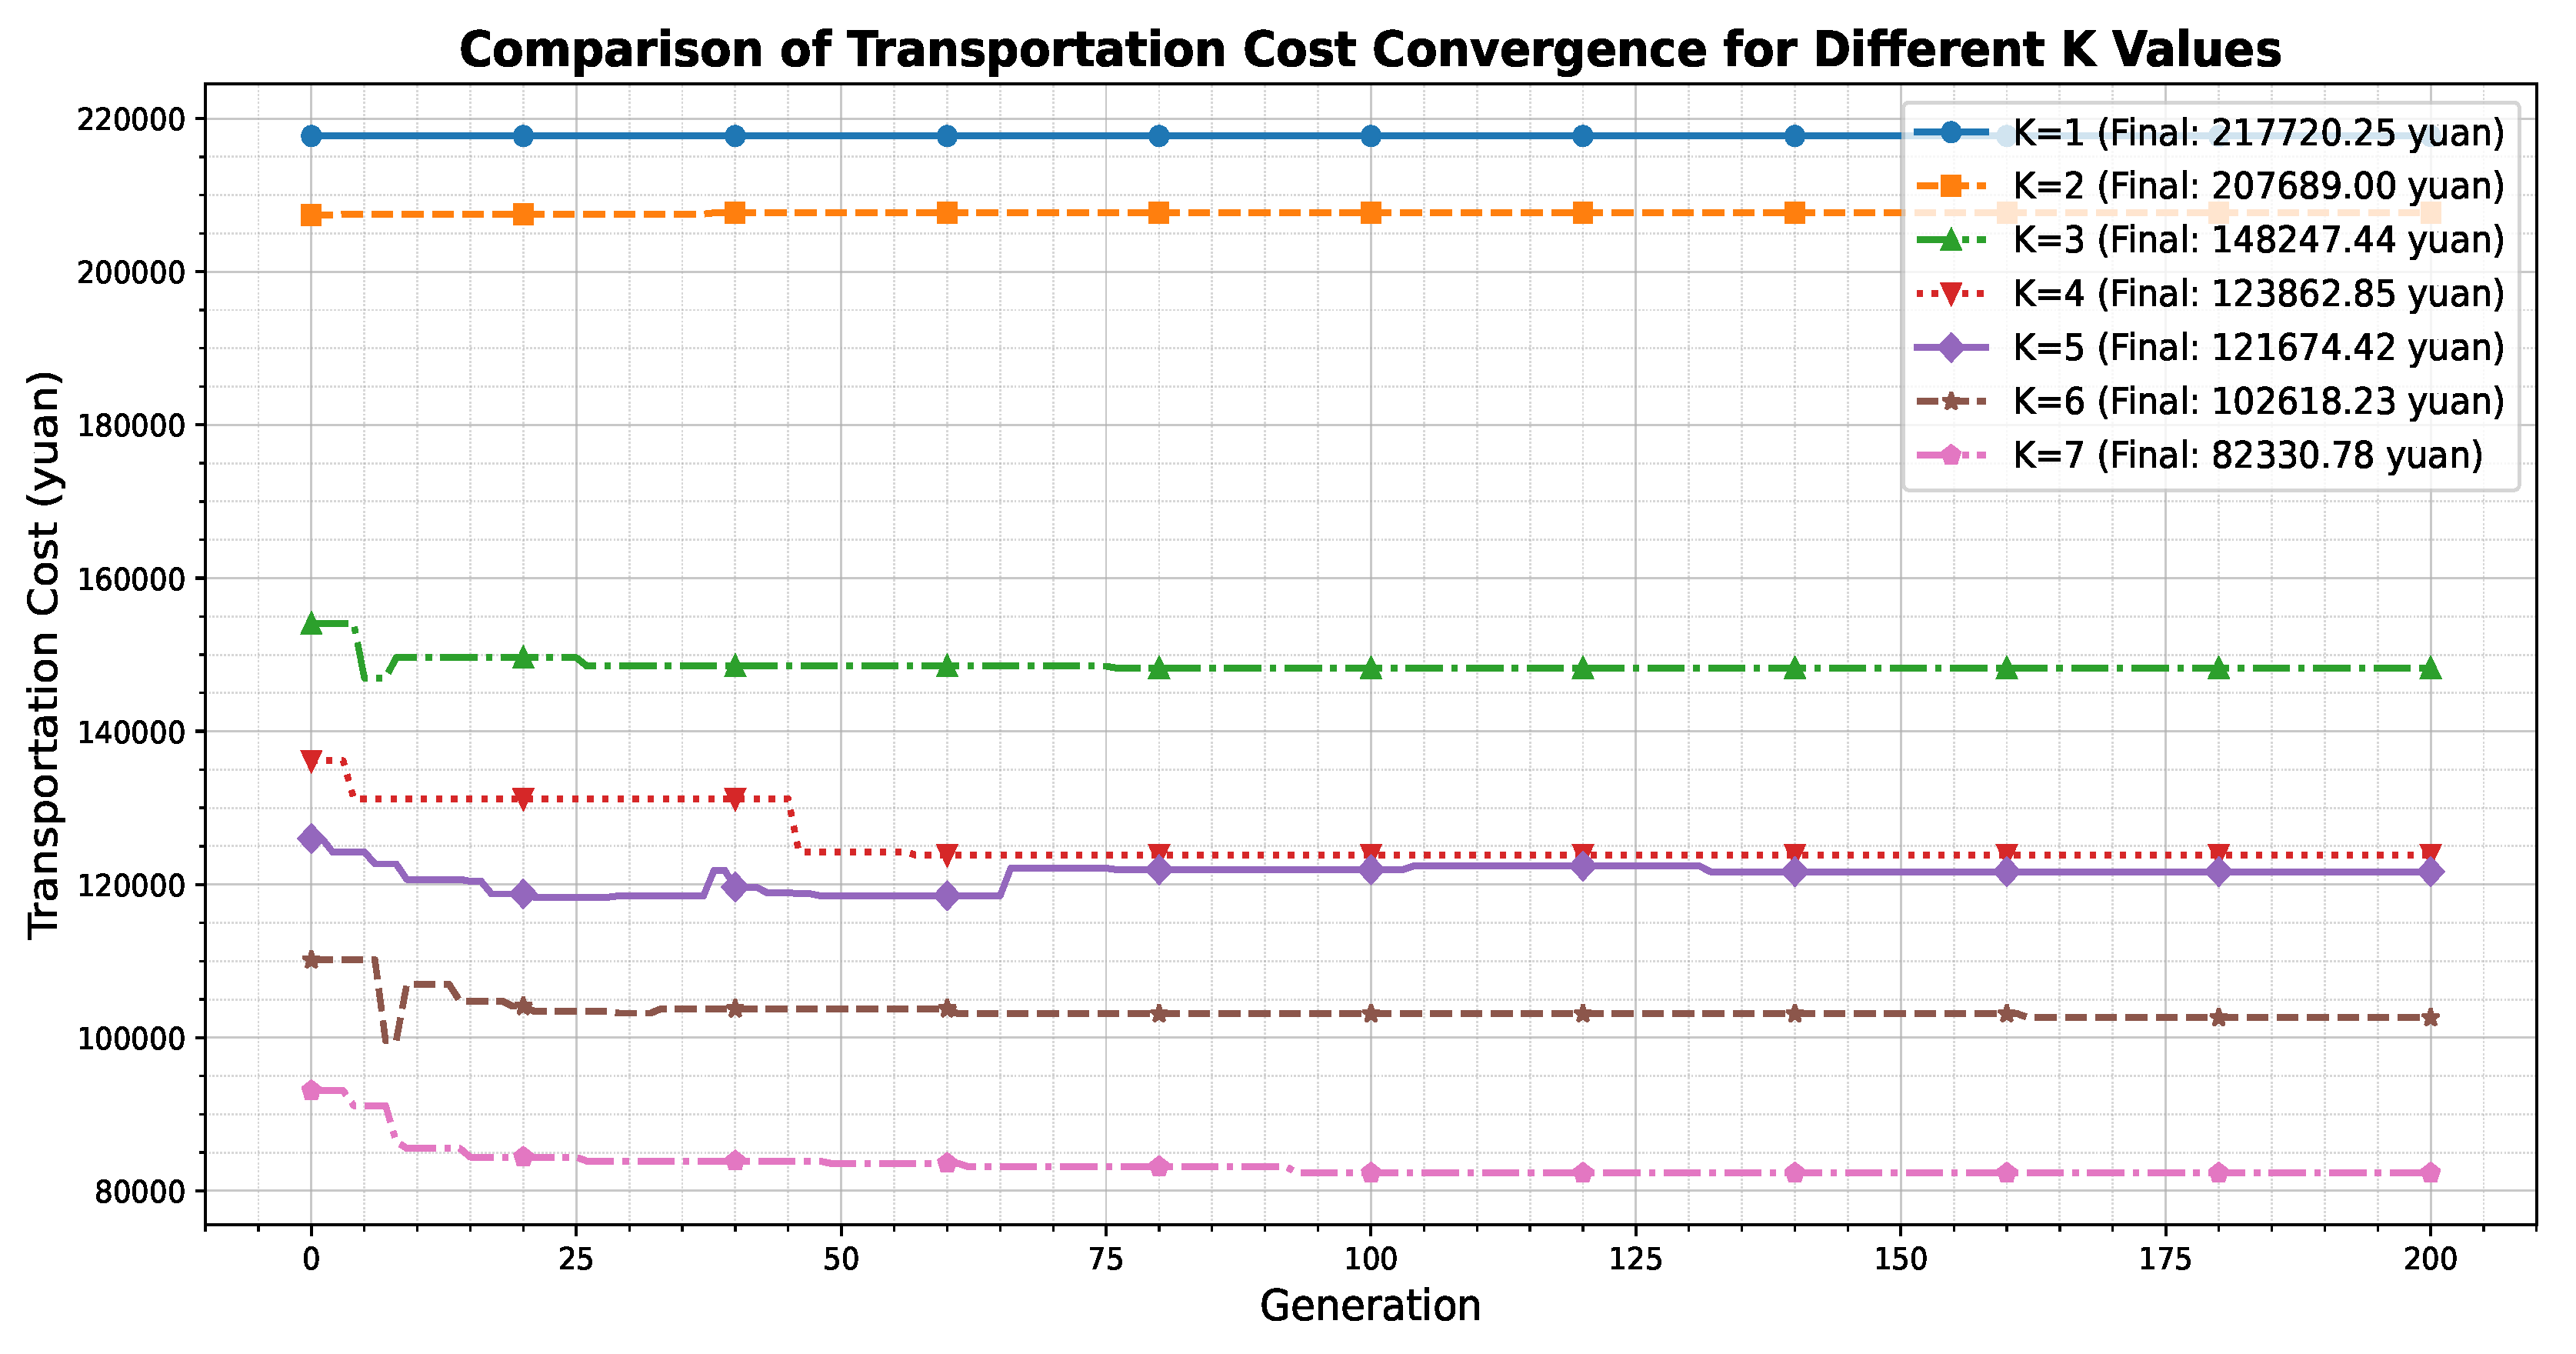
Figure 2.
Comparison of Total Cost Convergence Curves for Different K Values (with Fixed Cost).
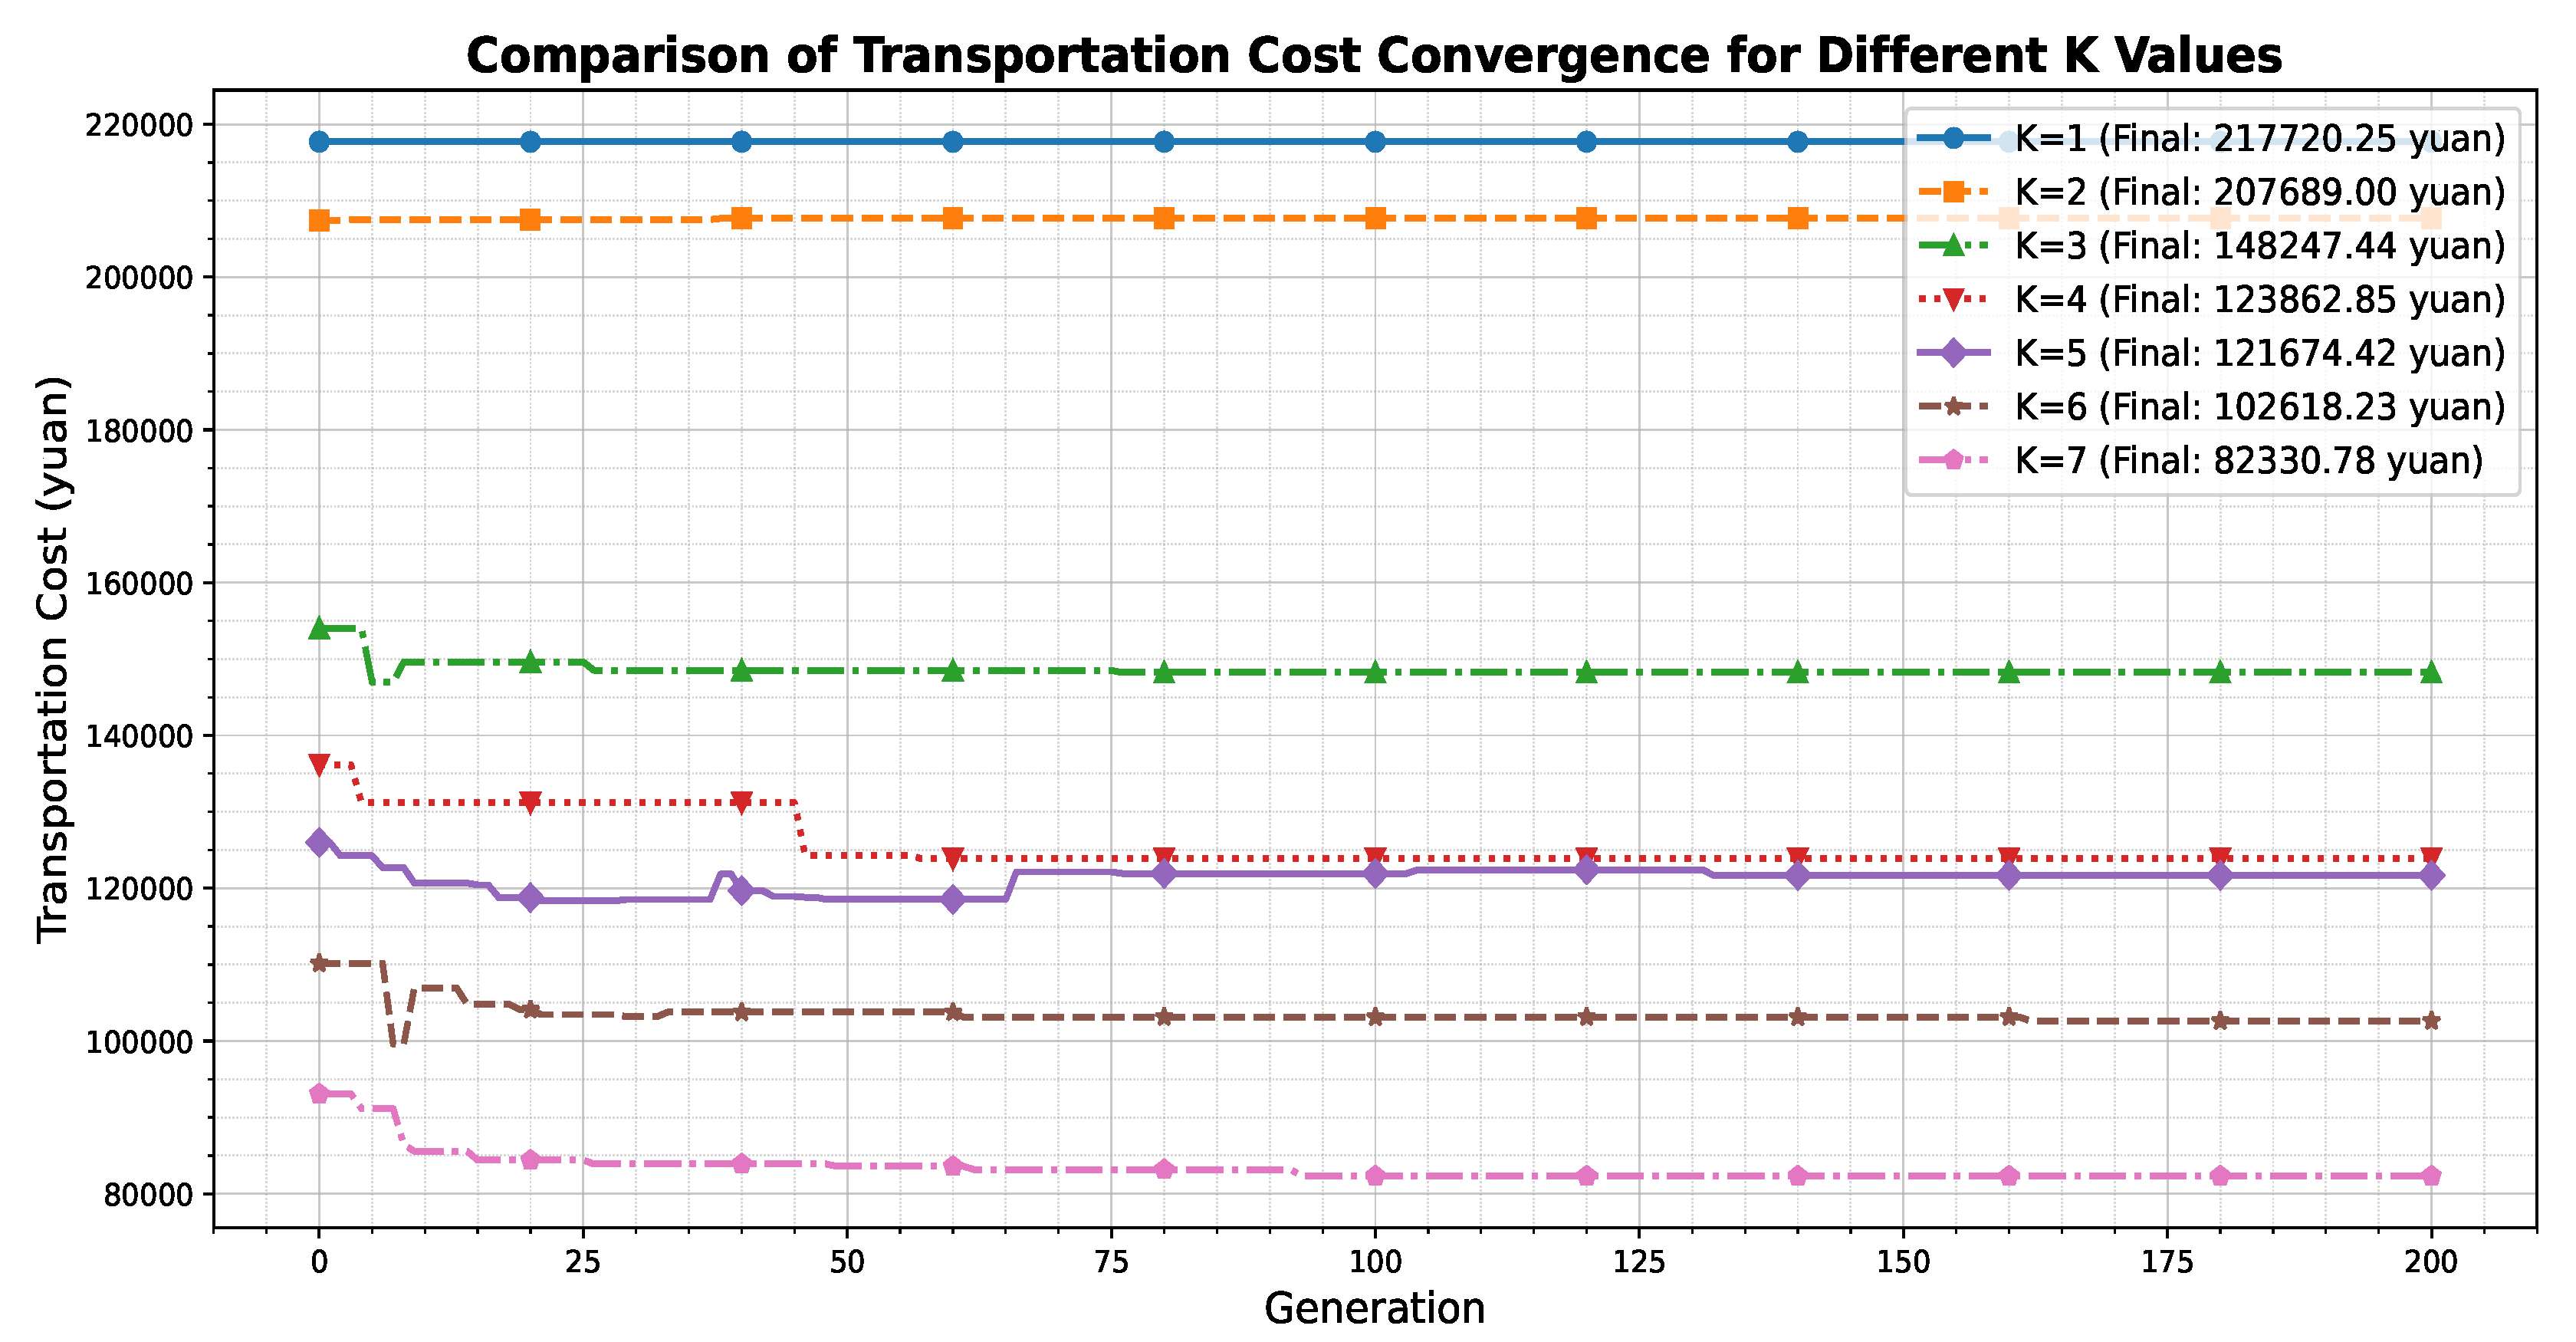
Figure 3.
Comparison of Per Parcel Convergence Curves for Different K Values (with Fixed Cost).
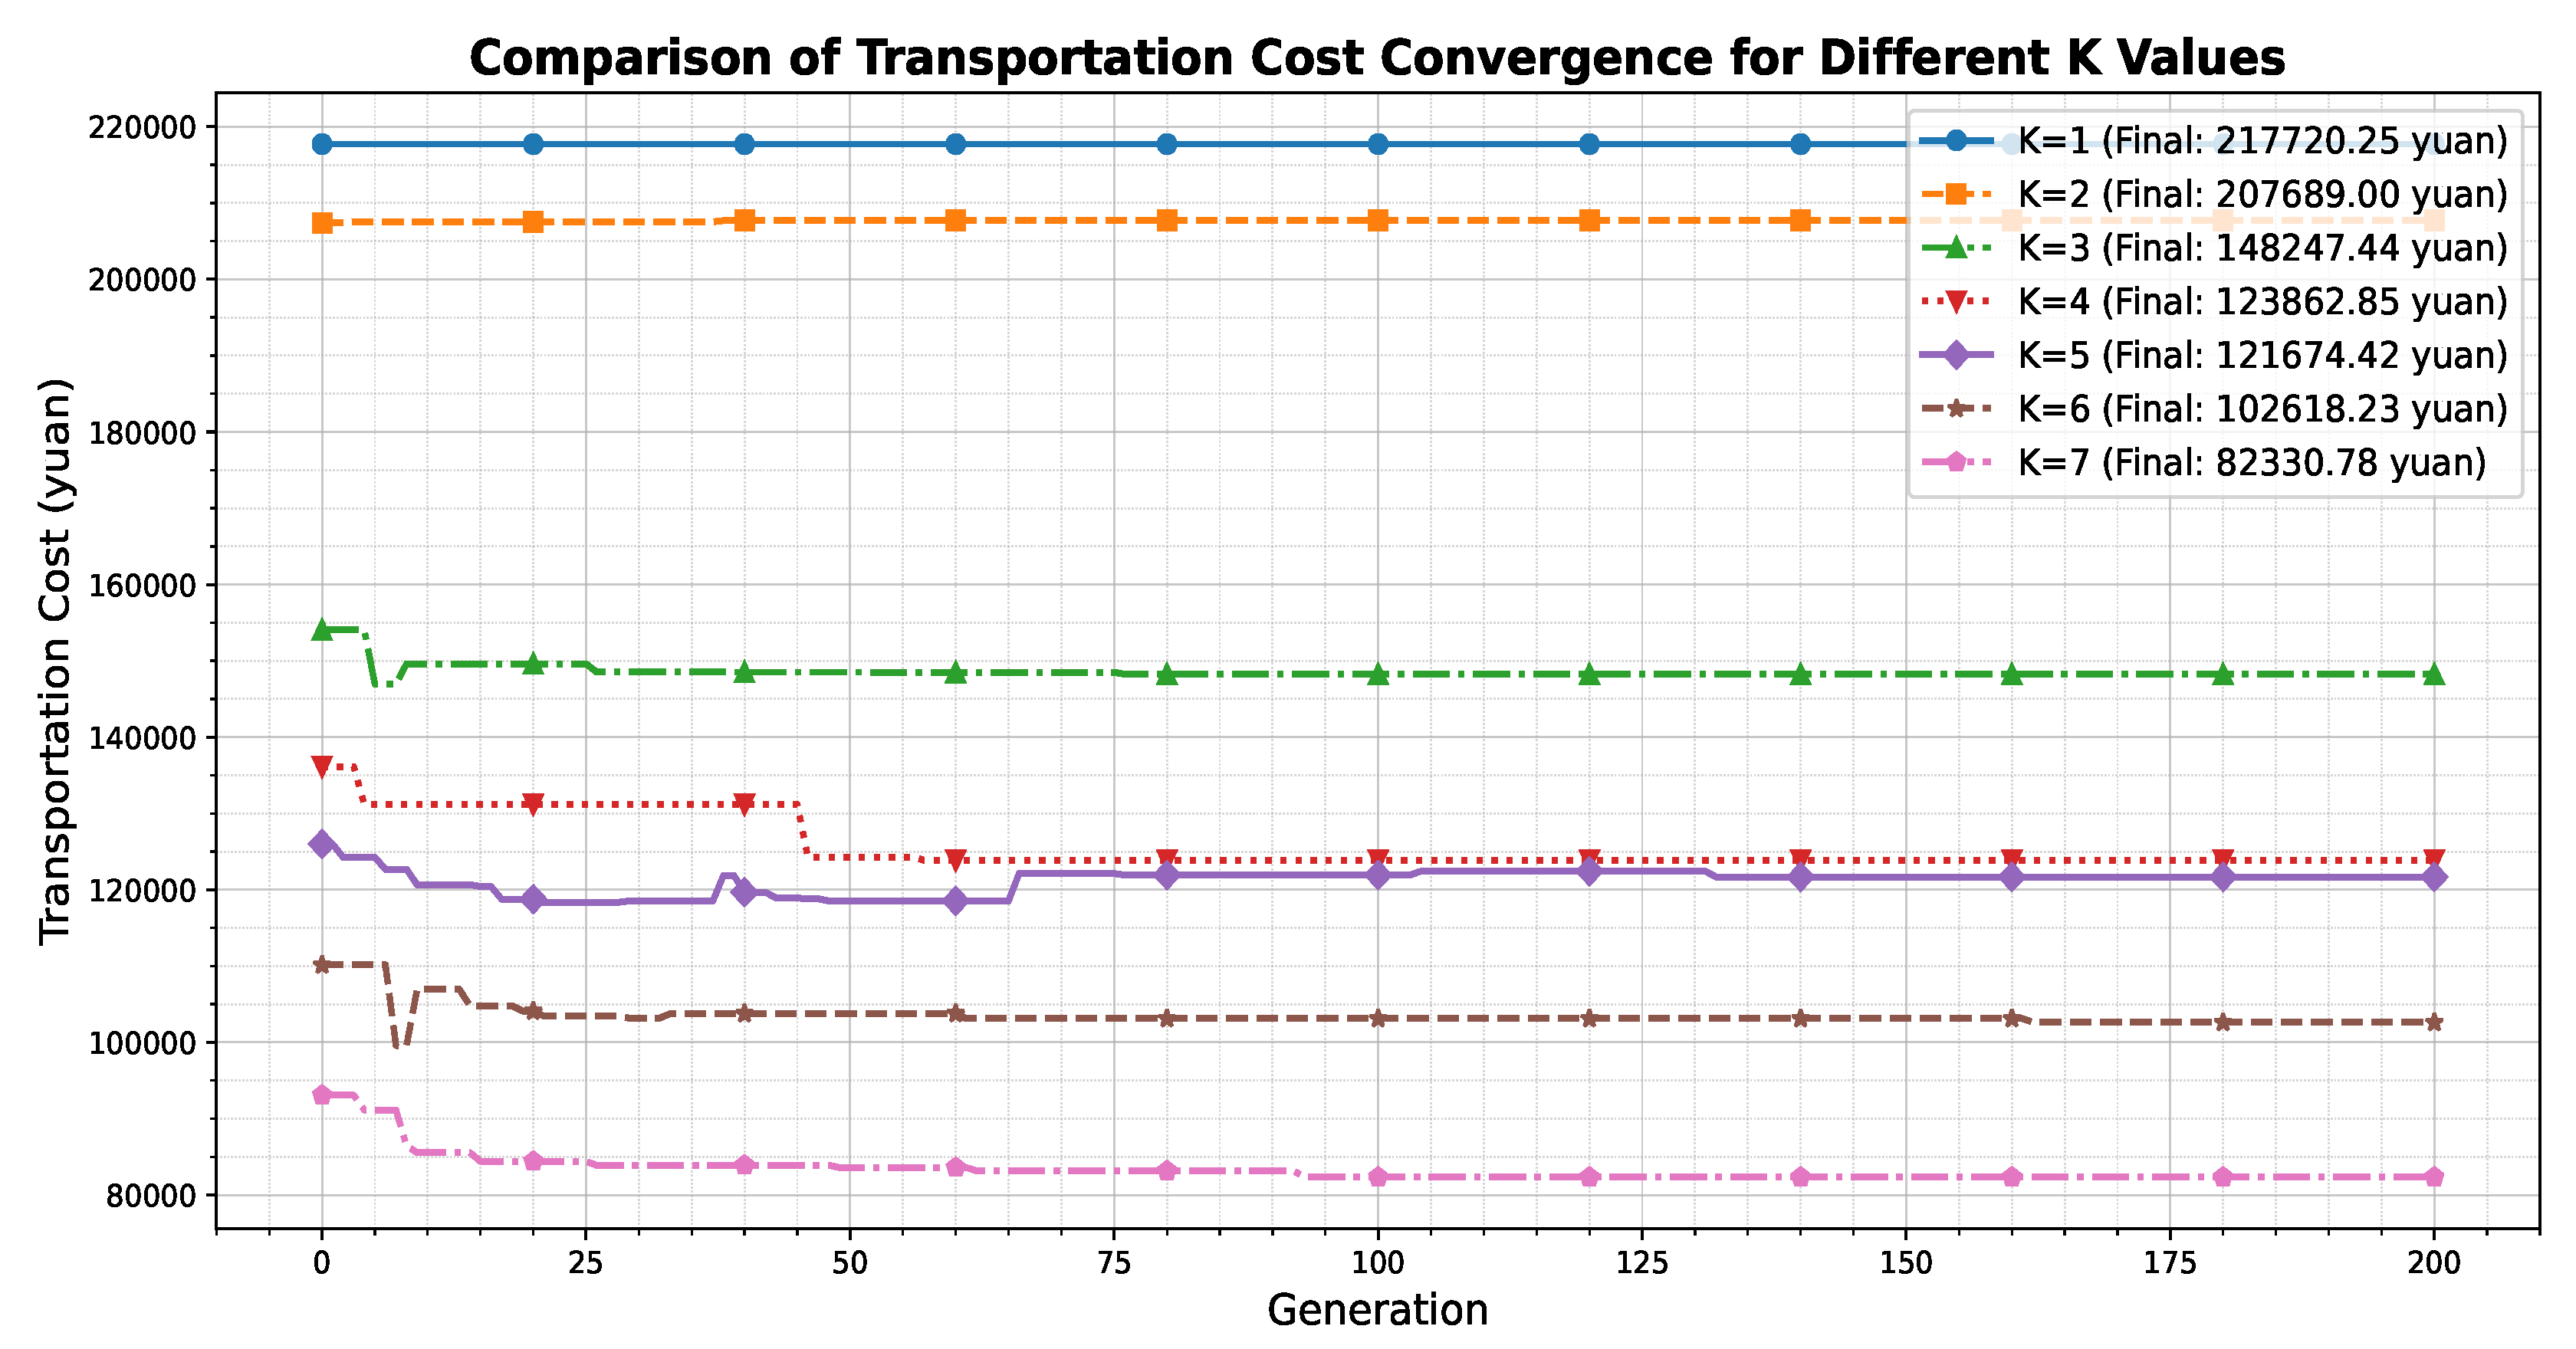
Figure 4.
Final weighted objective, total cost, Final cost, and Final maximum distance versus K value.
Figure 4.
Final weighted objective, total cost, Final cost, and Final maximum distance versus K value.
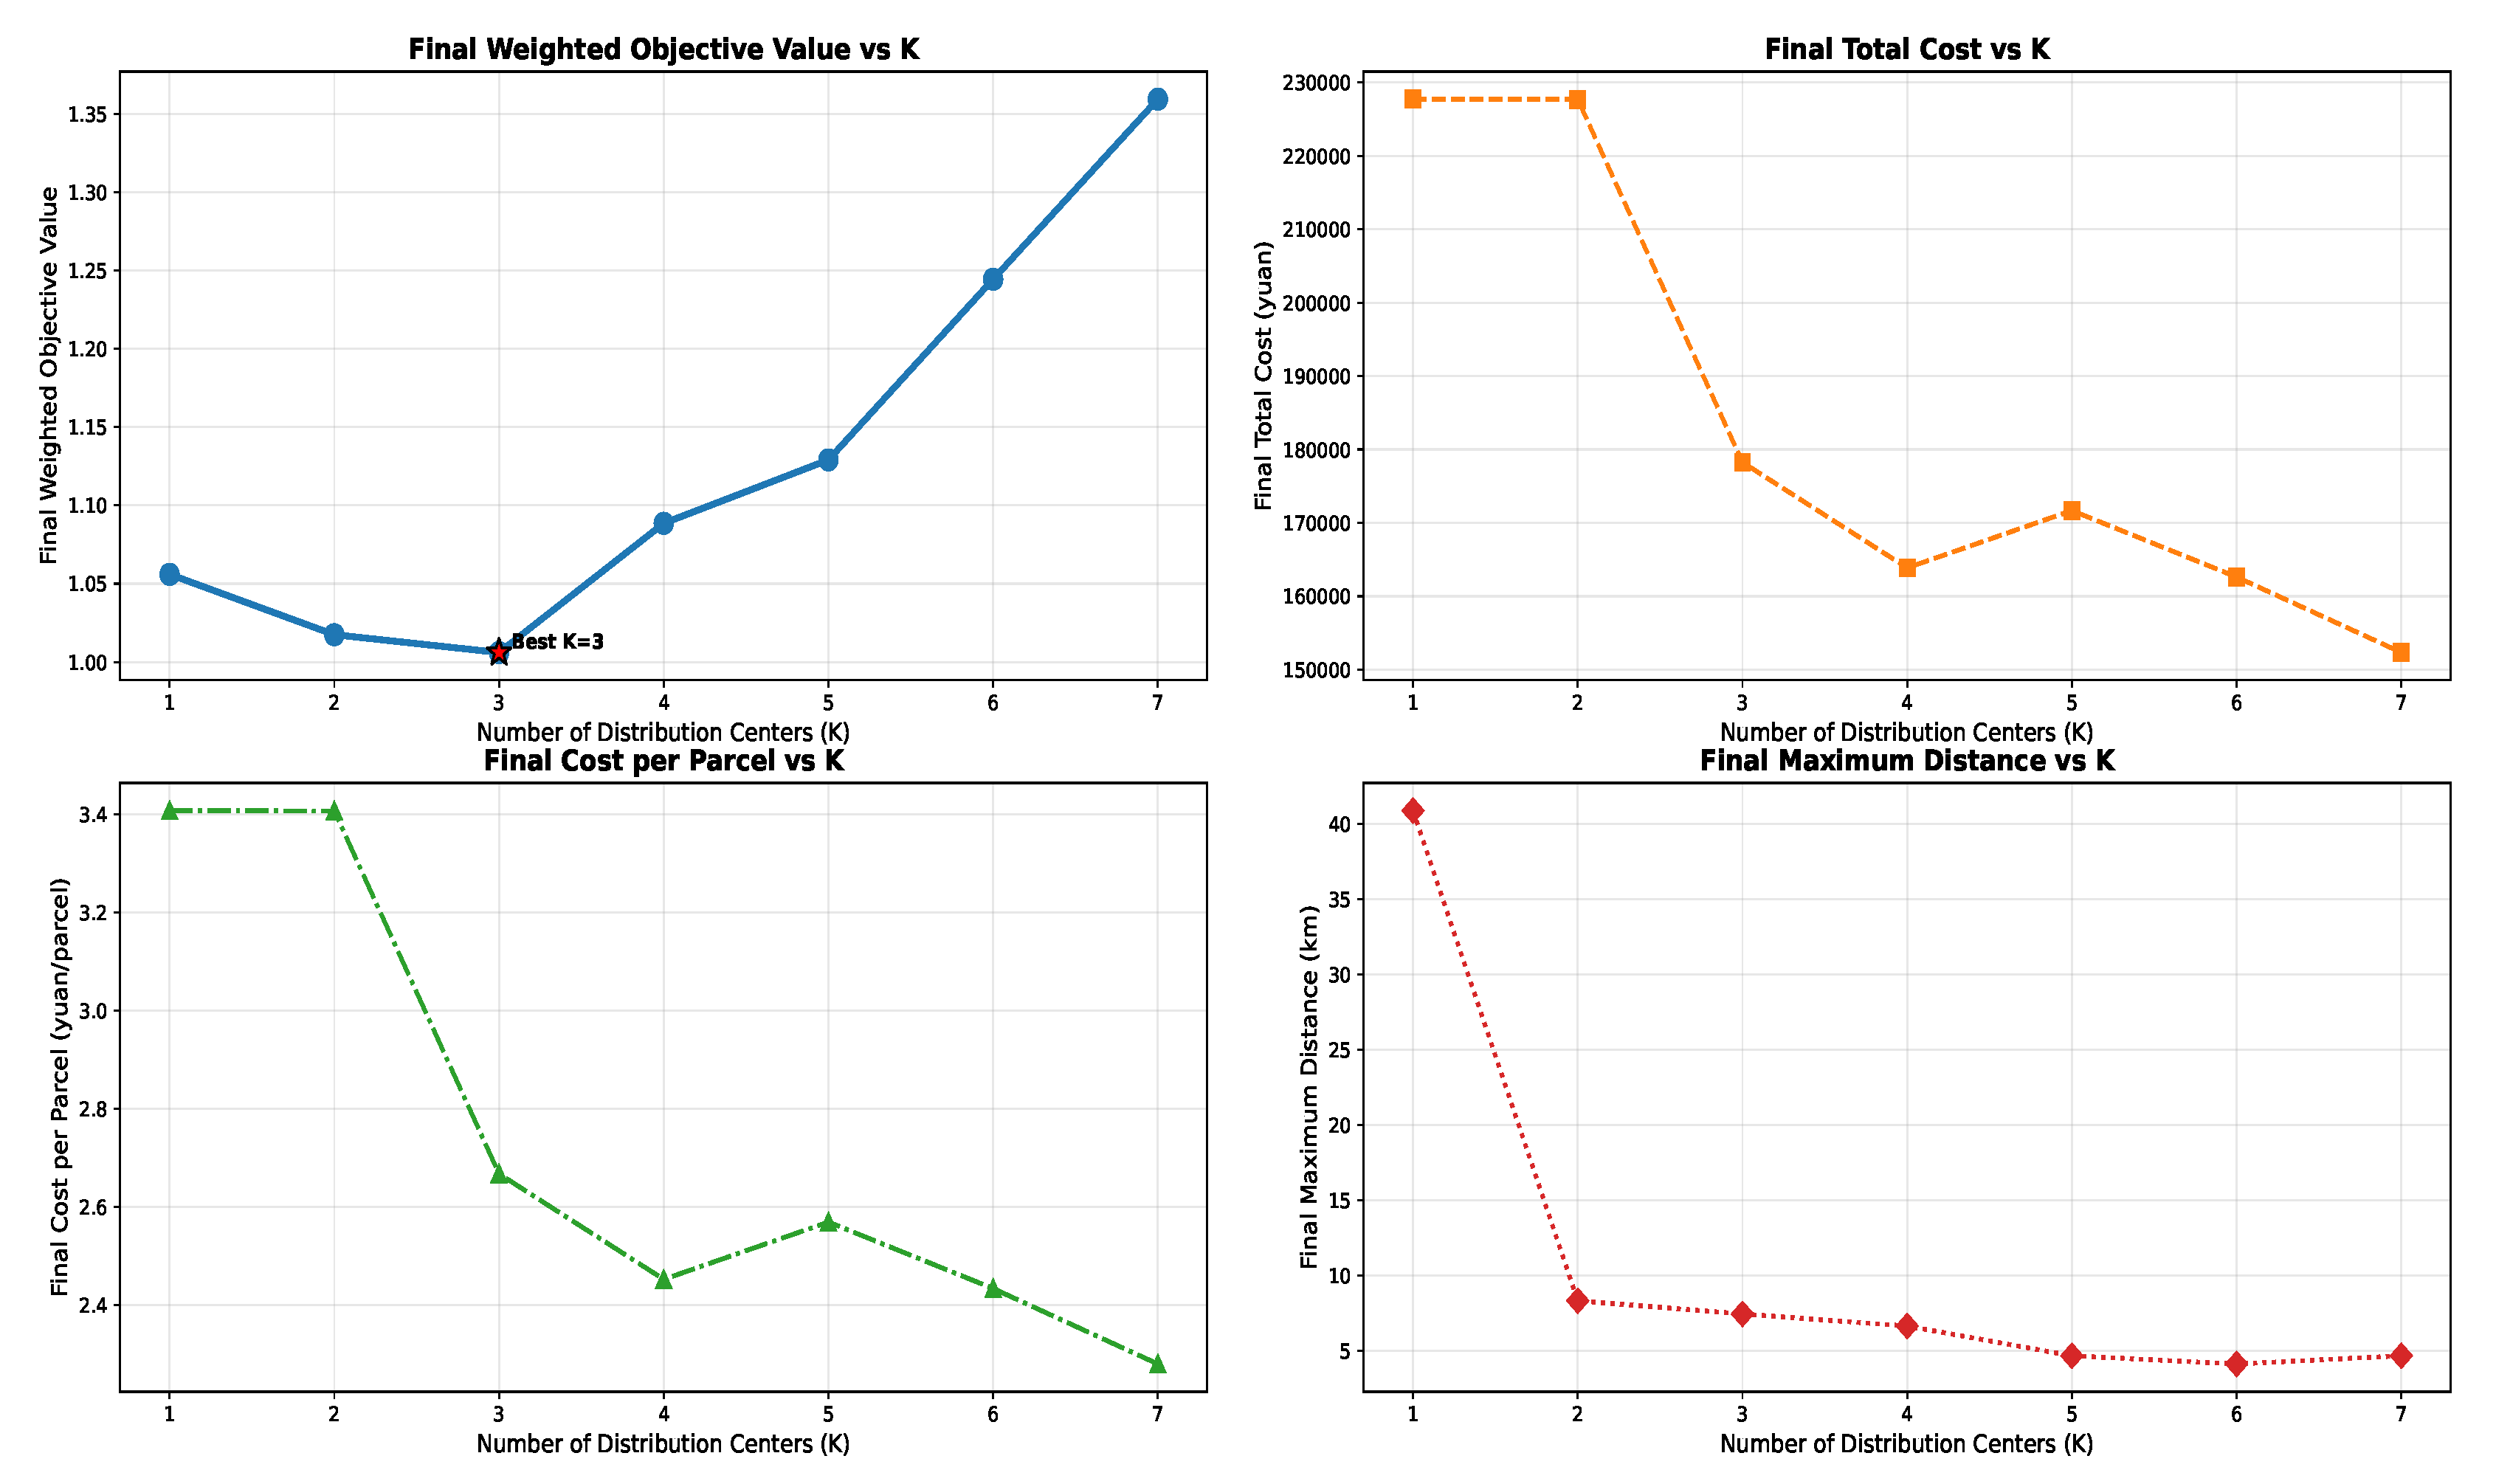
Figure 5.
Comparison of Weighted Objective Function Convergence Curves for Different K Values (with Fixed Cost).
Figure 5.
Comparison of Weighted Objective Function Convergence Curves for Different K Values (with Fixed Cost).
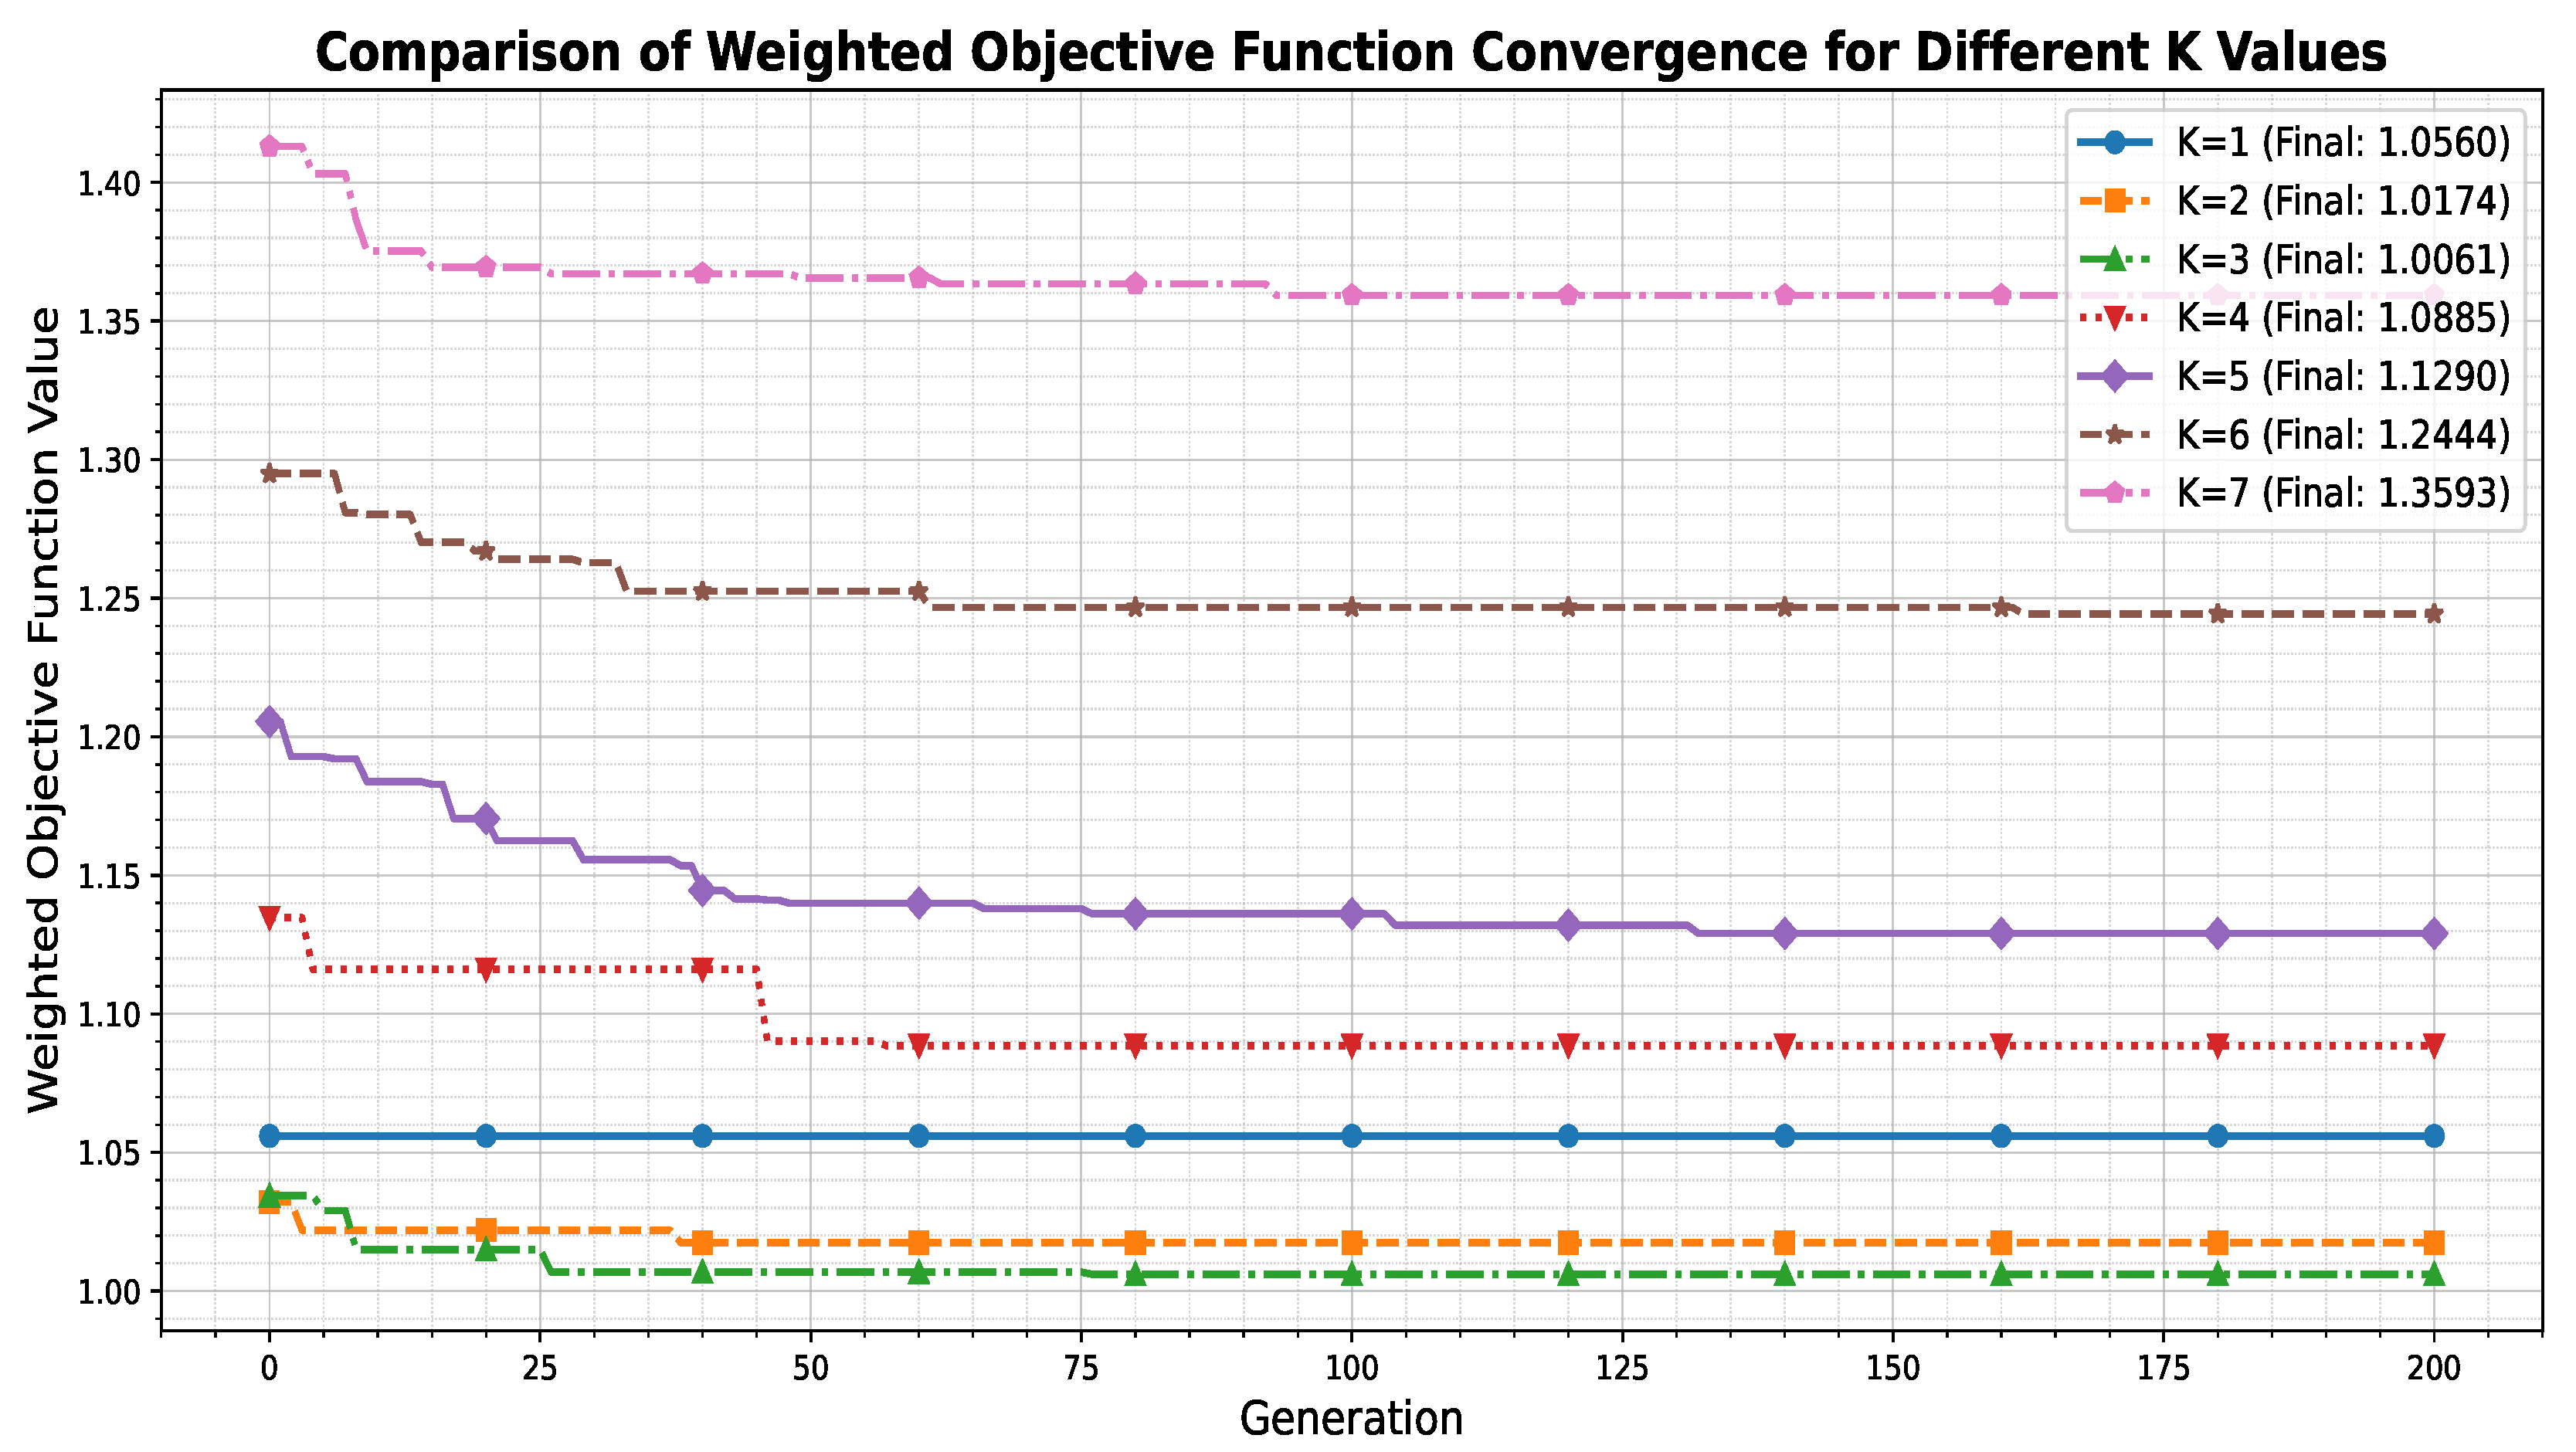
Figure 6.
Distribution Centers Allocation Map (K=3,with Fixed Cost).
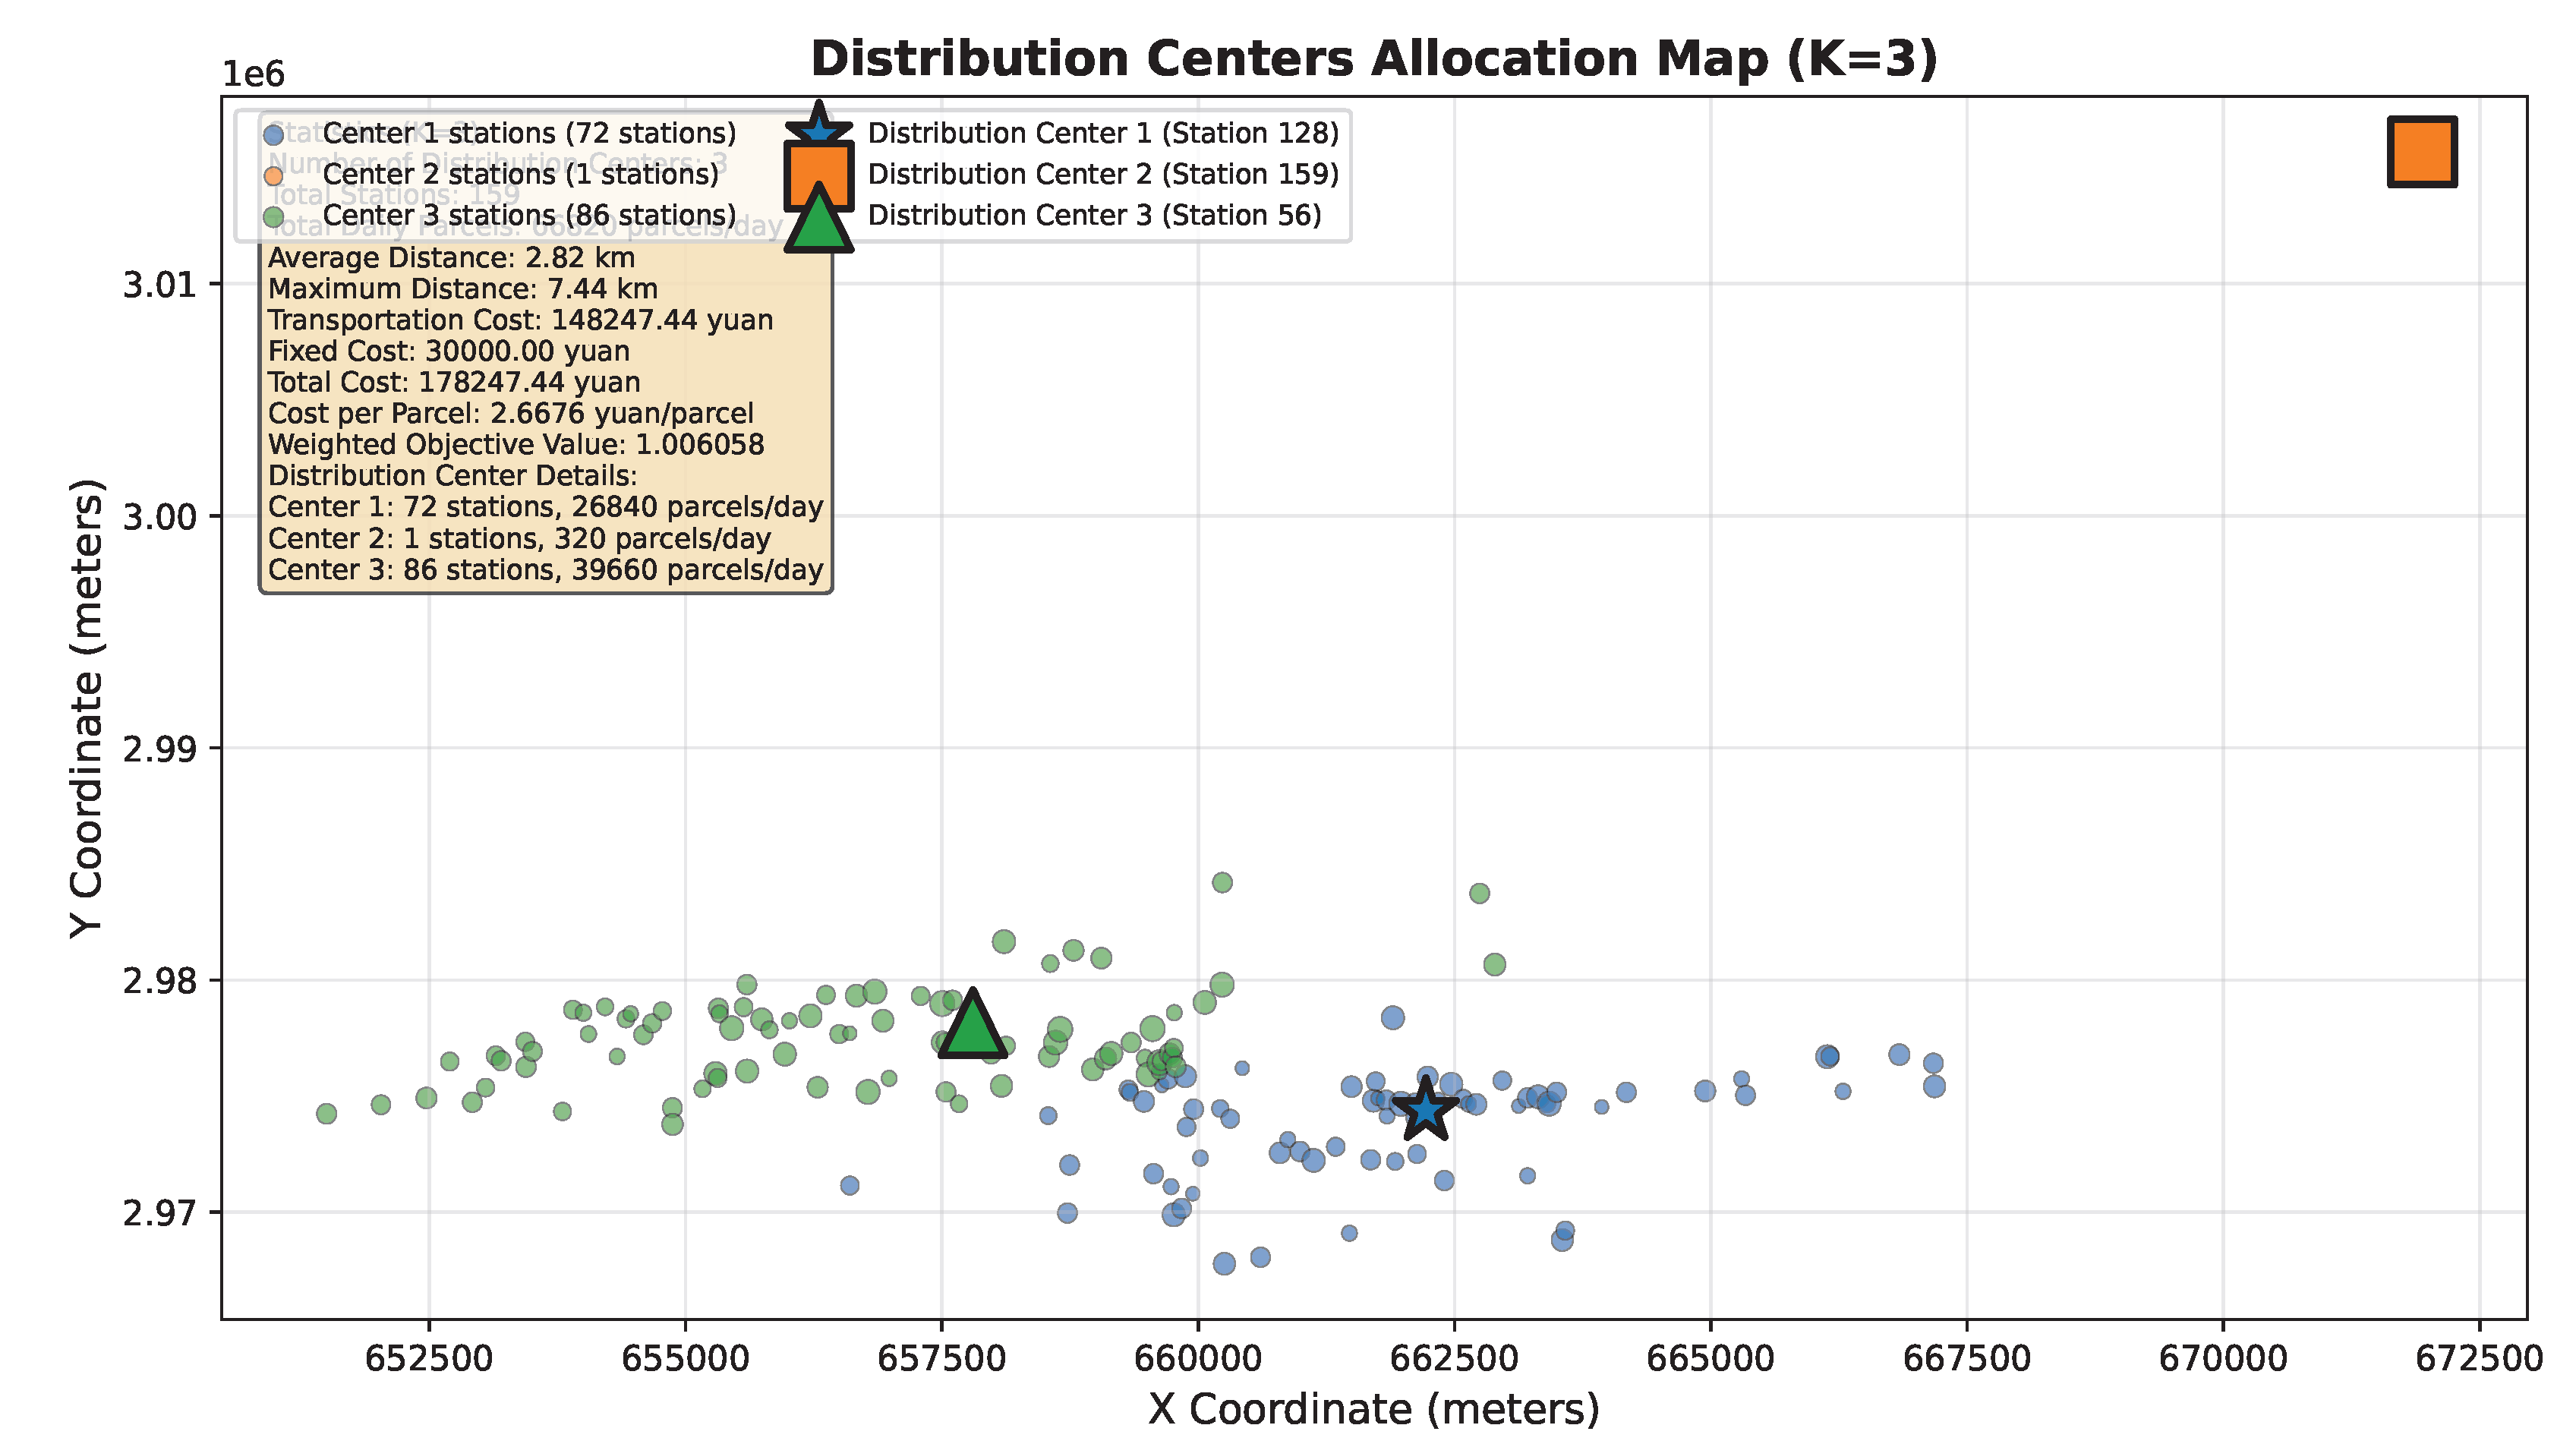

Table 1.
Algorithm Running Time Comparison for Different K Values.
| Number of Distribution Centers (K) | 1 | 2 | 3 | 4 | 5 | 6 |
|---|---|---|---|---|---|---|
| Running Time(seconds) | 22.3 | 22.5 | 22.5 | 22.7 | 22.7 | 22.8 |
Disclaimer/Publisher’s Note: The statements, opinions and data contained in all publications are solely those of the individual author(s) and contributor(s) and not of MDPI and/or the editor(s). MDPI and/or the editor(s) disclaim responsibility for any injury to people or property resulting from any ideas, methods, instructions or products referred to in the content. |
© 2026 by the authors. Licensee MDPI, Basel, Switzerland. This article is an open access article distributed under the terms and conditions of the Creative Commons Attribution (CC BY) license (http://creativecommons.org/licenses/by/4.0/).
Copyright: This open access article is published under a Creative Commons CC BY 4.0 license, which permit the free download, distribution, and reuse, provided that the author and preprint are cited in any reuse.


