
Submitted:
17 June 2026
Posted:
25 June 2026
You are already at the latest version
Abstract
This study examines the relationship between environmental, social, and governance (ESG) disclosure and corporate tax avoidance among Vietnamese non-financial listed firms (2020-2024). Using panel data regression, we find the composite ESG index and its individual environmental (E), social (S), and governance (G) dimensions are negatively associated with tax avoidance. Crucially, we identify two distinct moderating effects. As expected, financial constraints weaken the mitigating impact of ESG. More intriguingly, we uncover a highly surprising finding: state ownership also significantly attenuates this effect, highlighting complex institutional nuances in emerging economies. Furthermore, by developing machine learning models to forecast tax avoidance, we demonstrate that incorporating ESG variables substantially improves predictive accuracy compared to baseline models. This research contributes novel evidence from an evolving market, offering practical implications for policymakers, investors, and firms regarding the interplay of sustainable governance, concentrated ownership, and tax transparency.
Keywords:
ESG disclosure
; corporate tax avoidance
; financial constraints
; state ownership
; machine learning
; Vietnam
1. Introduction
Environmental (E), Social (S), and Governance (G) factors have become increasingly important dimensions of corporate reporting and evaluation since their formalization by the United Nations in 2004. Frameworks such as the Global Reporting Initiative (GRI) provide standardized indicators that allow stakeholders to assess firms’ environmental impact, social responsibility, and governance quality in a more systematic manner. ESG disclosure is widely regarded as an important mechanism for enhancing corporate transparency, reducing information asymmetry, and improving the quality of financial decision-making. More importantly, ESG reporting may also function as an informational channel that reduces corporate opacity, thereby enabling stakeholders to better detect aggressive financial reporting behaviors, including tax avoidance practices (Laguir et al., 2015).
From a broader governance perspective, corporate responsibility extends beyond environmental and social concerns to include financial obligations to the state. In this context, ESG disclosure may serve as a monitoring mechanism that enhances the visibility of firms’ financial behavior, particularly in relation to tax compliance. Prior literature suggests that improved transparency through ESG reporting can potentially constrain opportunistic tax behavior by increasing scrutiny from stakeholders and regulators.
Corporate tax behavior is commonly categorized into tax avoidance and tax evasion. Tax evasion refers to illegal activities aimed at concealing taxable income, whereas tax avoidance involves the use of legal accounting strategies - such as revenue recognition, expense allocation, and asset valuation choices - to minimize tax liabilities (Armstrong et al., 2015; Dyreng et al., 2010). However, the boundary between legitimate tax planning and aggressive tax avoidance is often blurred in practice, particularly when tax-motivated reporting approaches regulatory limits (Chen et al., 2010; Hanlon & Heitzman, 2010). As a result, tax avoidance has become a central topic in accounting and finance research. Empirically, corporate tax avoidance is widely captured by the Effective Tax Rate (ETR), which reflects the actual tax burden borne by a firm relative to its pre-tax accounting income. A lower ETR compared to the statutory corporate tax rate implies a wider tax gap, indicating that the firm has actively utilized tax deductions, exemptions, or aggressive planning strategies to minimize its tax liabilities.
The relationship between ESG performance and corporate tax avoidance remains theoretically plausible but empirically inconclusive. On the one hand, firms with stronger ESG engagement are expected to exhibit lower levels of tax avoidance due to increased stakeholder scrutiny, reputational concerns, and a long-term orientation toward sustainable value creation. On the other hand, ESG disclosure may also be strategically used as a legitimacy or reputational tool, potentially allowing firms to mask opportunistic behaviors such as aggressive tax planning (Firmansyah et al., 2025; Montenegro, 2021; Tran et al., 2023; Yanto et al., 2025). This mixed evidence suggests that the ESG-tax avoidance nexus is complex and likely contingent on institutional environments and firm-specific characteristics.
This issue is particularly relevant in emerging economies such as Vietnam, where institutional frameworks for sustainability reporting and tax governance are still evolving. Vietnam has committed to achieving net-zero emissions by 2050 at COP26, reflecting its long-term orientation toward sustainable development. In parallel, the legal framework for ESG disclosure has gradually been strengthened through regulations such as Decree 155/2020/NĐ-CP and Circular 96/2020/TT-BTC issued by the Ministry of Finance, which require listed firms to disclose environmental and social information in their annual reports. These regulations represent an important step toward institutionalizing sustainability reporting; however, ESG disclosure remains partially standardized and is still largely less comprehensive compared to more advanced markets such as the European Union or Singapore. Consequently, ESG reporting in Vietnam may still vary significantly in depth and quality, raising the question of whether such disclosures truly reflect substantive corporate behavior or merely symbolic compliance.
At the same time, corporate income tax (CIT) remains a critical source of state revenue and a key instrument of fiscal governance in Vietnam’s rapidly developing economy. During the 2020–2024 period, the standard statutory CIT rate in Vietnam was maintained at 20%. However, this period was also characterized by significant economic volatility and the implementation of various temporary tax relief policies by the government to support post COVID-19 recovery. Such a dynamic tax environment arguably provided firms with greater opportunities and incentives to engage in aggressive tax planning, thereby widening the gap between the statutory rate and their actual ETR. The coexistence of increasing ESG reporting requirements and ongoing concerns about tax compliance during this specific timeframe creates a unique institutional setting in which to examine whether ESG disclosure effectively constrains corporate tax avoidance or functions primarily as a symbolic “box-ticking” mechanism.
Against this background, this study investigates the effect of ESG implementation on corporate tax avoidance in Vietnam. Furthermore, it examines whether this relationship is moderated by financial constraints and state ownership. Financially constrained firms may face stronger incentives to engage in tax planning to alleviate liquidity pressures, while state ownership may enhance monitoring intensity and align corporate behavior with public policy objectives. In addition to traditional econometric analyses, this study employs advanced machine learning algorithms to evaluate whether the integration of ESG data significantly enhances the predictive accuracy of models designed to detect tax avoidance behavior.
This study contributes to the literature in four main ways. First, it provides empirical evidence on the ESG-tax avoidance relationship in an emerging market characterized by evolving sustainability disclosure regulations. Second, it contributes to the ongoing debate on whether ESG disclosure functions as a substantive governance mechanism or a symbolic legitimacy tool in shaping corporate tax behavior. Third, it offers policy-relevant implications by suggesting that strengthening mandatory ESG disclosure requirements may enhance corporate transparency, improve tax compliance, and support fiscal sustainability. Fourth, it introduces a methodological innovation by utilizing machine learning models, demonstrating that non-financial ESG metrics serve as valuable predictive features that significantly improve the forecasting accuracy of corporate tax anomalies.
The remainder of this paper is organized as follows. Section 2 reviews the relevant literature. Section 3 develops the theoretical framework and hypotheses. Section 4 describes the research methodology. Section 5 presents the empirical results. Section 6 discusses the findings. Section 7 provides policy implications and recommendations, and Section 8 concludes the study.
2. Literature Review
The relationship between the level of ESG disclosure and corporate tax avoidance has attracted in-creasing scholarly attention worldwide. Although the number of studies on this issue has grown substantially, the empirical evidence remains inconclusive. Prior research has largely developed along two contrasting perspectives, reflecting the complex nature of this relationship: the ethical conduct perspective and the opportunistic conduct perspective.
The Ethical Conduct Perspective
Grounded in stakeholder theory and legitimacy theory, the ethical conduct perspective argues that firms pursuing strong ESG strategies tend to comply more fully with their tax obligations. Under this view, tax payment is regarded as a fundamental contribution to public infrastructure. Consequently, firms with strong ethical values recognize the severe reputational risks associated with tax avoidance and strive to maintain consistency between their publicly stated ESG commitments and transparent tax practices (Carolina et al., 2023). Empirical evidence supporting this ethical perspective is well-documented, particularly in Western and highly regulated global markets. The meta-analysis of 61 global studies conducted by Widuri et al. (2024) provides robust support for a persistent negative relationship between ESG performance and tax avoidance on a global scale. In closely monitored global industries, such as insurance, Bressan (2023) provides evidence that firms with strong ESG commitments accept higher actual tax burdens and prioritize long-term legitimacy over short-term profitability.
However, when shifting the focus to Asia, a distinct institutional divide emerges. Strong support for the ethical perspective is primarily confined to highly developed Asian economies characterized by rigorous regulatory oversight akin to Western standards. For instance, Yoon et al. (2021) confirm that in South Korea, firms with higher ESG scores exhibit significantly lower levels of tax aggressiveness. Similarly, extending beyond traditional Western contexts to the BRICS nations, Du and Li (2023) find that higher ESG performance constrains tax avoidance. This suggests that the ethical alignment between ESG and tax compliance is not universally applicable, but rather contingent upon highly developed regulatory frameworks and strong stakeholder scrutiny.
The Opportunistic Conduct Perspective
In sharp contrast to findings in mature Western economies, the opportunistic conduct perspective suggests that ESG is frequently exploited by firms as a concealment mechanism for tax avoidance. Grounded in agency theory, this perspective posits that managers strategically disclose positive ESG reports to build “moral capital” This acts as a form of insurance, alleviating public pressure and diverting the attention of tax authorities while the firm quietly implements high-risk tax avoidance strategies to maximize cash flows (Firmansyah et al., 2025).
Crucially, this opportunistic behavior appears to be the dominant narrative in developing or emerging economies, particularly within Southeast Asia, where institutional monitoring systems often remain incomplete or are undergoing transition. Unlike their Western counterparts, firms in these Asian contexts exhibit a reciprocal, opportunistic mechanism. Yanto et al. (2025), in their study of Indonesia and Malaysia, reveal that firms not only use high ESG scores to protect their public image while engaging in aggressive tax avoidance, but they also deliberately avoid taxes to retain the cash necessary to finance costly ESG projects. This finding emphasizes a major geographic divergence: in emerging Asian contexts, ESG and tax avoidance operate as parallel strategic tools to manipulate stakeholder perceptions, rather than reflecting the genuine ethical commitments often observed in Western studies.
Furthermore, this East-West divergence is strongly moderated by internal conditions unique to the Asian institutional environment. When firms face financial constraints, survival pressures often override ethical commitments (Syahputri, 2025). In Southeast Asia, these dynamics are heavily influenced by distinct ownership structures. Duong and Huang (2022) highlighted this by including State-Owned Enterprise (SOE) status as a crucial control variable when examining capital structure and tax avoidance. The prevalence of SOEs and family-owned conglomerates in Asia creates unique financial behaviors and governance challenges that fundamentally differentiate Asian ESG implementation from Western corporate models.
Research Gaps
The synthesis of these two perspectives reveals critical research gaps driven by geographical, institutional, and methodological differences, setting the stage for deeper exploration.
First, there is inconsistent evidence between developed and emerging Asian economies, highlighting the predominance of evidence from Western and developed-market settings in the literature. While studies in developed Asian nations, such as the research conducted by Yoon et al. (2021), validate the ethical culture perspective, evidence from emerging Asian markets tends to support the opportunistic agency perspective (Montenegro, 2021; Yanto et al., 2025). This geographic theoretical divergence creates a clear need to investigate why emerging Asian markets deviate from global ethical trends.
Second, there is a lack of sufficient examination regarding specific institutional and financial factors within the emerging Asian context. Current research frequently imposes Western theoretical frameworks onto Asian contexts without considering critical local characteristics. Among these contextual factors, state ownership and financial constraints deserve particular attention because they are prominent features of the Vietnamese market and may significantly influence how ESG disclosure affects tax avoidance (Ngo, 2024; Syahputri, 2025; Yanto et al., 2025). Furthermore, while Western studies often focus on large, widely-held listed firms, they overlook the distinct governance characteristics of state-controlled entities and financially constrained firms, both of which remain prevalent among listed companies in Vietnam (Bressan, 2023; Duong & Huang, 2022; Firmansyah et al., 2025; Nguyen et al., 2018).
Third, empirical evidence from Vietnam is highly limited, compounded by broader data limitations typical of emerging markets. Currently, corporate ESG information in Vietnam is mostly presented in a raw format within annual reports; standalone sustainability reporting is not universally mandatory, and comprehensive ESG scoring has not yet been standardized by authoritative bodies. Vietnam, as a rapidly growing transition economy with a distinct regulatory environment, requires specific empirical verification to determine if it aligns with the opportunistic trends of its ASEAN neighbors (Van & Ly, 2021). Methodologically, the lack of long-term ESG data in emerging markets means short-term designs often fail to capture the evolution of tax regulations (Carolina et al., 2023; Firmansyah et al., 2025).
Most importantly, previous domestic studies, such as those by Ha and Quyen (2017) and Khương and Trang (2021), have not rigorously tested this relationship. These studies primarily provide descriptive discussions of ESG practices and reporting activities, rather than offering rigorous empirical evidence on how ESG-related disclosure influences corporate tax avoidance. Despite ongoing tax administration reforms, tax authorities in Vietnam continue to face challenges in monitoring all taxable activities and preventing tax evasion. Reports from tax authorities and international organizations indicate that tax losses and non-compliance remain persistent concerns, particularly in the context of increasingly complex corporate transactions. Consequently, understanding whether ESG disclosure constrains tax avoidance behavior becomes especially relevant in the Vietnamese setting. Therefore, investigating the relationship between ESG disclosure and corporate tax avoidance using standardized ESG measures, while accounting for the moderating effects of state ownership and financial constraints, may help address these gaps and provide one of the first comprehensive empirical examinations of this issue in Vietnam.
3. Theoretical Framework and Hypotheses Development
3.1. Theoretical Framework
Stakeholder Theory
Mitchell et al. (1997) define stakeholders, in a narrow sense, as groups upon which an organization depends for its survival. Accordingly, firms are expected not only to maximize shareholder wealth but also to create value for multiple stakeholder groups. Effective governance relies on identifying and classifying stakeholders based on three attributes: power, legitimacy, and urgency, which form latent, expectant, and definitive stakeholder groups, the latter receiving the highest managerial priority. In the context of this study, Stakeholder Theory suggests that firms committed to ESG principles view tax payments as a fundamental social responsibility rather than a mere financial cost. Consequently, these firms are less likely to engage in aggressive tax avoidance, striving instead to balance the interests of the state, society, and shareholders.
Agency Theory
Agency theory describes the contractual relationship between principals and agents, in which managers are delegated authority to perform services and make decisions on behalf of shareholders (Jensen & Meckling, 1976; Ross, 1977). The separation of ownership and control creates incentive problems and conflicts of interest due to differences in risk preferences and information asymmetry (Fama, 1980; Jensen & Meckling, 1976). These conflicts can be mitigated by separating decision management from decision control, strengthening the monitoring role of the board of directors, and relying on market discipline mechanisms (Eisenhardt, 1989; Fama, 1980; Fama & Jensen, 1983). Applied to our research, tax avoidance creates financial opacity that managers can exploit, increasing agency costs. Here, ESG disclosure serves as an effective internal governance mechanism that reduces information asymmetry, thereby constraining opportunistic tax avoidance behavior - though state ownership may complicate these inherent agency conflicts.
Political Cost Theory
Watts and Zimmerman (1978) argue that large firms are more exposed to political scrutiny, taxation, and regulatory pressure. Consequently, firms may engage in earnings management by selecting accounting policies that reduce reported profits and by increasing corporate social responsibility activities to mitigate political costs. In this study’s specific context, Political Cost Theory helps explain the behavior of highly scrutinized entities, particularly state-owned enterprises in Vietnam. These firms may utilize ESG disclosure as a strategic tool to manage political visibility and maintain governmental legitimacy, a dynamic that significantly alters the traditional relationship between sustainability reporting and tax avoidance.
3.2. Hypotheses Development
The theoretical mechanism linking ESG disclosure and corporate tax avoidance is primarily driven by either opportunistic or ethical motives. While firms might opportunistically use ESG as a façade to conceal aggressive tax practices, the prevailing ethical perspective posits that socially responsible firms view tax compliance as a fundamental civic obligation rather than merely a financial cost. To mitigate the reputational risks associated with tax scandals, a strong ESG commitment is expected to encourage firms to align their tax behavior with their declared ethical standards (Yoon et al., 2021). Building upon this dominant ethical framework, this study proposes the following hypothesis:
H1:
ESG disclosure is negatively associated with tax avoidance among non-financial firms listed on the Vietnamese stock market.
While an aggregate ESG score reflects overall sustainability commitments, it may obscure the distinct mechanisms of its underlying pillars due to informational offsetting. Specifically, the G pillar is expected to constrain aggressive tax practices directly through enhanced internal monitoring and oversight. Conversely, the E and S pillars may discourage tax avoidance indirectly by heightening legitimacy concerns and reputational pressures from broader stakeholders. Because each pillar operates through distinct theoretical channels to foster corporate accountability, this study proposes the following hypotheses:
H2:
Environmental disclosure (E) is negatively associated with tax avoidance among non-financial firms listed on the Vietnamese stock market.
H3:
Social disclosure (S) is negatively associated with tax avoidance among non-financial firms listed on the Vietnamese stock market.
H4
: Governance disclosure (G) is negatively associated with tax avoidance among non-financial firms listed on the Vietnamese stock market.
While strong ESG engagement generally promotes ethical tax compliance, severe financial constraints can fundamentally alter managerial priorities. When external capital is scarce or costly, the urgent need for internal liquidity often supersedes long-term sustainability and reputational goals. Under such intense financial pressure, managers may be compelled to prioritize immediate cash-flow survival, making the retention of cash through aggressive tax savings a highly attractive alternative source of financing. Consequently, as financial constraints intensify, the immediate necessity for internal funding is expected to overshadow the ethical commitments of ESG, thereby dampening its restraining effect on corporate tax avoidance. Building on this theoretical tension, this study proposes the following hypothesis:
H5:
Financial constraints weaken the negative relationship between ESG disclosure and tax avoidance among non-financial firms listed on the Vietnamese stock market.
In private firms, voluntary ESG disclosure serves as a primary mechanism to build legitimacy and signal ethical tax compliance. Conversely, state-owned enterprises (SOE) are already subject to strict institutional oversight and government monitoring. Because this strong pre-existing discipline inherently constrains aggressive tax practices, it significantly reduces the necessity of relying on ESG as a supplementary governance tool. Consequently, state ownership is expected to crowd out the incremental disciplinary effect of ESG commitments on corporate tax behavior. Building on this logic, the study proposes the following hypothesis:
H6:
State ownership weakens the negative relationship between ESG disclosure and tax avoidance among non-financial firms listed on the Vietnamese stock market.
By identifying complex, non-linear patterns within high-dimensional datasets, machine learning (ML) techniques offer predictive capabilities that traditional linear models often miss. From an informational perspective, integrating the baseline capacity indicated by financial metrics with the incremental, non-financial signals of ESG disclosures generates a more comprehensive profile of corporate behavior. Consequently, utilizing ML algorithms to combine these dual data sources is expected to not only predict tax avoidance effectively but also significantly enhance predictive accuracy compared to models relying solely on financial indicators. Based on this logic, the study proposes the following hypotheses:
H7a:
Machine learning models utilizing financial data and non-financial data can effectively predict tax avoidance behavior among non-financial firms listed on the Vietnamese stock market.
H7b:
The integration of ESG disclosure data significantly improves the predictive accuracy of these models compared to relying on financial data alone.
4. Research Methodology
4.1. Research Models
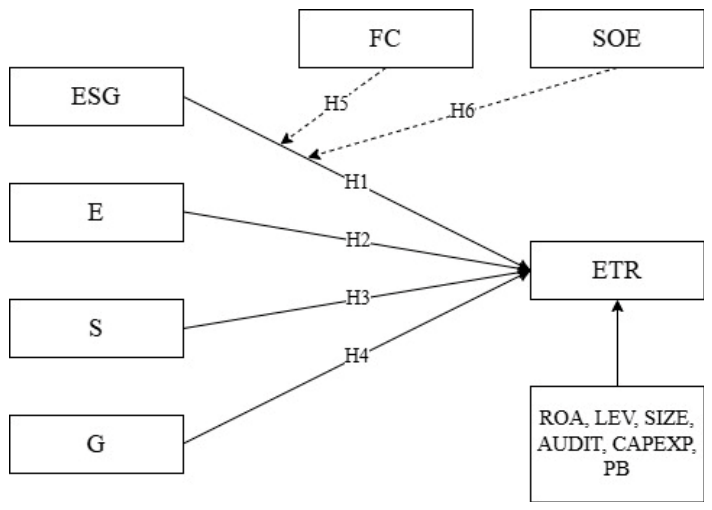
Models examining the effect of ESG on tax avoidance and the moderating effects
where:
+ ETRit: effective tax rate of firm i at time t
+ ESGit: overall ESG score of firm i at time t
+ FCit: proxy for the level of financial constraints of firm i at time t
+ SOEit: proxy for state ownership of firm i at time t
+ Controlit: control variables of firm i at time t, including ROA (Return on Assets), LEV (Leverage), SIZE, AUDIT (Big4 audit firm), CAPEXP (capital expenditure), and PB (Price-to-Book ratio)
+ β0: intercept term
+ β1, β2, β3, βk: regression coefficients
+ εit: random error term
+ i: firm i in the sample; t: current year
Figure 1.
Research model (Source: Developed by the authors).
Models examining the effects of the individual dimensions of ESG on tax avoidance
where:
+ ETRit: effective tax rate of firm i at time t
+ Eit: environmental score of firm i at time t
+ Sit: social score of firm i at time t
+ Git: governance score of firm i at time t
+ Controlit: control variables of firm i at time t, including ROA, LEV, SIZE, AUDIT, CAPEXP, and PB
+ β0: intercept term
+ β1, βk: regression coefficients
+ εit: random error term
Dependent variable
This study uses ETR (Effective Tax Rate) as a proxy for tax avoidance because ETR reflects the ratio of reported corporate income tax expense to pre-tax accounting profit. This measure has also been employed in prior studies (Sambuaga & Felicia, 2024; Syahputri, 2025; Yuwono & Mustikasari, 2022).
ETR represents the actual tax rate borne by firms. When ETR approximates the statutory corporate income tax rate under current tax law, the firm can be considered compliant with tax regulations and less likely to engage in tax avoidance. Conversely, if ETR is lower than the statutory corporate income tax rate, this may suggest that the firm is engaging in tax avoidance. Therefore, the lower the ETR, particularly when it is substantially below the statutory rate or below that of comparable firms, the more it implies that the firm is reducing its tax burden through tax-planning strategies such as exploiting tax incentives, claiming legitimate deductions, structuring transactions, and selecting the timing of revenue and expense recognition.
Independent variables
The four independent variables are the levels of ESG implementation, measured through the scores obtained after analyzing the ESG, related criteria disclosed by firms in their ESG reports, including the overall ESG score, the environmental score (E), the social score (S), and the corporate governance score (G). ESG indicators are measured based on the standards of the Global Reporting Initiative (GRI).
To convert ESG disclosures into quantitative data, the study employs a three-point scoring system to assess the extent of disclosure: 0 if no information is disclosed; 0.5 if the disclosure is partial, qualitative, or merely symbolic; 1 if the disclosure is complete and includes quantitative data or relevant substantive information.
The ESG evaluation in this study is based on 32 disclosure criteria adapted from the GRI Sustainability Reporting Standards (2016 version), comprising 10 environmental, 6 social, and 16 governance indicators. Each pillar’s score is determined by dividing its total obtained points by the number of indicators within that category. The composite ESG score is subsequently calculated as the unweighted average across all 32 criteria. By design, this approach implicitly weights each ESG dimension based on its indicator count, reflecting the relative breadth of each pillar rather than imposing equal weights.
To ensure longitudinal consistency across the entire 2020–2024 observation period, the GRI 2016 framework is applied uniformly throughout the study. This approach is highly justified as the core disclosure requirements regarding environmental impacts, labor practices, and governance metrics remain fundamentally identical between the GRI 2016 and the updated GRI 2021 Universal Standards; the latter primarily introduced structural refinements rather than shifting the substantive nature of the indicators. Consequently, maintaining the GRI 2016 framework mitigates measurement bias while preserving the validity of the data. Furthermore, these selected criteria were carefully aligned with the local regulatory context, specifically matching the disclosure requirements mandated by Vietnam’s Circular No. 96/2020/TT-BTC.
Control variables
In examining the impact of ESG on tax avoidance among non-financial firms, the inclusion of control variables is necessary to isolate the effects of other firm-specific factors that may influence tax avoidance but are not the main focus of the study. This helps reduce omitted-variable bias and allows the results to be interpreted as the effect of ESG on tax avoidance after holding other relevant firm characteristics constant.
Specifically, firm size (SIZE) is controlled for because larger firms often possess greater resources, more complex structures, and more sophisticated tax-planning strategies, while also being subject to greater external scrutiny. SIZE is measured as the natural logarithm of total assets in order to capture scale differences and normalize the data.
Profitability (ROA) is included to control for operating performance, as the level of profit directly affects tax obligations and firms’ incentives for tax planning. More profitable firms may face different incentives regarding aggressive tax behavior; thus, ROA helps disentangle the effect of ESG from that of business performance.
Leverage (LEV) controls for the tax shield effect of debt, since interest expenses are tax-deductible and may mechanically reduce taxable income. This helps avoid confounding the effect of capital structure with that of intentional tax avoidance.
Audit quality (AUDIT) is included because firms audited by Big4 audit firms are generally subject to stricter monitoring and higher compliance standards, which may constrain risky tax strategies. The dummy variable AUDIT therefore captures differences in the degree of external monitoring.
Capital expenditure (CAPEXP) reflects the level of investment in long-term assets and the potential tax effect of depreciation expenses, thereby helping control for the effect of asset investment on ETR.
Finally, growth opportunity (PB) controls for market expectations and the characteristics of growth firms, as pressures related to reputation, valuation, and financial policy may affect the extent to which such firms engage in tax avoidance. Including PB in the model helps isolate the impact of ESG from that of growth prospects.
Moderating variables
Financial constraints (FC) and state ownership (SOE) are included as moderating variables in the research model. Risk-shifting theory, proposed by Bulow and Shoven (1978), suggests that when firms fall into financial distress, the likelihood of tax avoidance may increase. In such circumstances, shareholders and managers are more likely to accept higher-risk behavior (Eberhart & Senbet, 1993; Maksimovic & Titman, 1991). FC is calculated using the formula developed by Edwards et al. (2016). The inclusion of FC as a moderator allows the study to test whether financial constraints alter the relationship between ESG and tax avoidance. A higher FC value indicates stronger financial health, whereas a lower FC value suggests that the firm may be at greater risk of distress.
In addition, SOE is used as a moderating dummy variable, equal to 1 if the firm is state-owned, defined as the State holding at least 50% of total charter capital, and 0 otherwise.
4.2. Variable Measurements and Data Collections
This study uses both financial and non-financial data collected directly from audited annual financial statements and annual reports of non-financial firms listed on the HOSE and HNX stock exchanges during the period 2020-2024. The 2020-2024 period is considered appropriate because it clearly reflects ESG-related corporate behavior in a context where policy frameworks and market pressures had become relatively well established following the issuance of Circular No. 96/2020/TT-BTC by the Vietnamese government, which regulates information disclosure obligations for public companies and listed firms on the Vietnamese stock market.
This circular requires firms to disclose financial and non-financial information fully, promptly, and transparently in order to protect investors and improve market efficiency. Notably, it also encourages firms to disclose information related to sustainable development, including environmental, social, and governance (ESG) factors, either through sustainability reports or integrated annual reports. This regulation has contributed to promoting transparency, accountability, and a corporate orientation toward sustainable development in Vietnam.
According to Rajput et al. (2023), an appropriate sample size is essential to obtaining accurate and reliable results in machine learning research. Therefore, this study adopts a purposive sampling method combined with screening criteria to ensure the relevance and reliability of the data. Specifically, firms operating in the financial, banking, insurance, and securities sectors are excluded from the sample due to their distinctive operational mechanisms, financial structures, and regulatory environments, which could affect the comparability of tax avoidance behavior with that of non-financial firms.
In addition, the study retains only firms with complete financial statements and annual reports throughout the research period. After the screening process, the final sample consists of 118 non-financial firms with complete annual financial statements and annual reports over five years, yielding a balanced panel dataset of 590 observations, which serves as the basis for both regression analyses and predictive modeling in the subsequent stages.
ESG information was manually collected and scored by the authors based on GRI criteria. Each firm was independently scored by two raters, after which the results were compared. In cases of scoring discrepancies, the research team collectively discussed and resolved the differences in order to refine and clarify the criteria. Through this process, the team established a unified scoring protocol applicable to all firms in the sample, thereby ensuring the objectivity of the data.
The choice of self-constructed ESG scoring based on the GRI framework stems from the fact that there is currently no universally standardized and mandatory ESG measurement system, particularly in emerging markets such as Vietnam. In a context where secondary ESG data from international rating agencies remain limited and do not comprehensively cover domestic listed firms, this approach allows for a more accurate reflection of firms’ actual ESG disclosure practices while ensuring compatibility with Vietnam’s institutional setting and the developmental stage of its stock market.
Below is the summary table of the definitions and calculation methods of the dependent, independent, control, and qualitative variables included in the research model examining the impact of ESG on corporate tax avoidance.

Table 1.
Measurement of variables used in the model.
| Variable | Symbol | Measurement | Reference |
| Effective Tax Rate | ETR | (Sambuaga & Felicia, 2024; Syahputri, 2025; Yuwono & Mustikasari, 2022) | |
| Overall ESG Score | ESG | Where:+: Score of criterion i+: Total number of criteria according to the standard | (Widiastutik et al., 2024) |
| Environmental Score | E | (Widiastutik et al., 2024) | |
| Social Score | S | (Widiastutik et al., 2024) | |
| Governance Score | G | (Widiastutik et al., 2024) | |
| Return on Assets | ROA | (Sambuaga & Felicia, 2024; Syahputri, 2025; Velte, 2023; Yoon et al., 2021) | |
| Firm Size | SIZE | (Sambuaga & Felicia, 2024; Syahputri, 2025; Velte, 2023) | |
| Leverage | LEV | (Syahputri, 2025; Velte, 2023; Yoon et al., 2021) | |
| Audit Quality | AUDIT | Dummy variable: 1 if the firm is audited by a Big 4 firm, 0 otherwise | (Gaaya et al., 2017; Richardson et al., 2013) |
| Capital Expenditure | CAPEXP | Capital expenditures/Total assets | (Yoon et al., 2021) |
| Price-to-Book | PB | Market value of equity/Book value of equity | (Yoon et al., 2021) |
| Financial Constraints | FC |
Where: + X1: Working Capital/Total Assets + X2: Retained Earnings/Total Assets + X3: EBIT/Total Assets + X4: Market Value of Equity/Book Value of Total Debt + X5: Revenue/Total Assets |
(Edwards et al., 2016) |
| State Ownership | SOE | Dummy variable: 1 if it is a State-Owned Enterprise, 0 otherwise | (Li et al., 2025) |
(Source: Compiled by the authors).
4.3. Data Processing Methods
This study simultaneously employs both traditional econometric linear regression techniques and machine learning methods in order to enhance the comprehensiveness and robustness of the findings in evaluating the predictability of tax avoidance behavior based on ESG factors and control variables. Machine learning algorithms can flexibly learn from data and identify hidden patterns and relationships more effectively, thereby improving predictive accuracy (Goodfellow et al., 2016).
Figure 2 summarizes the process of applying these machine learning algorithms to predict firms’ tax avoidance behavior in the following year.
In addition to econometric analysis, machine learning techniques are applied to evaluate the predictive performance of ESG-related variables in explaining corporate tax avoidance behavior. Five algorithms are considered, namely CatBoost, XGBoost, LightGBM, Extra Trees, and Random Forest. The dataset is split into training (80%) and testing (20%) sets. A 5-fold cross-validation procedure combined with GridSearch optimization is used to tune hyperparameters and prevent overfitting. Model performance is evaluated using R², Mean Squared Error (MSE), Root Mean Squared Error (RMSE), and Mean Absolute Error (MAE). The best-performing model is then selected, and a comparison between models with and without ESG variables is conducted to assess the incremental contribution of ESG factors in predicting corporate tax avoidance.
5. Research Results
5.1. Description of the Research Sample
Industry composition of the sample firms
Following the Global Industry Classification Standard (GICS), the final research sample of 118 non-financial companies listed on the Vietnamese stock market is categorized into nine distinct industry groups. Among these, capital-intensive industries and those with substantial impacts on the environment and the economy - such as Industrials (21.19%), Materials (15.25%), Real Estate (13.56%), and Energy (11.86%) - account for the largest proportions. Due to their high exposure to environmental risks, regulatory pressures, and business cycle fluctuations, these sectors have clear incentives to leverage ESG disclosure as a strategic tool to reinforce legitimacy and manage risk.
At the same time, the inclusion of Consumer Staples, Consumer Discretionary, Information Technology, and Health Care broadens the scope of the analysis to firms characterized by high levels of intangible assets, strong dependence on brand reputation, and significant pressure from stakeholders. This diversity creates considerable internal variation in emission intensity and environmental risk, asset structure and the ability to recognize accounting profits, dependence on capital markets and investors, and pressure from customers and the public.
The industrial composition of the sample broadly reflects the sectoral distribution of the Vietnamese stock market while ensuring the presence of industries with differing levels of environmental risk, asset structure, and business cycle characteristics. Because the relationship between ESG and corporate tax avoidance is substantially influenced by industry characteristics, a sample spanning multiple sectors helps reduce bias arising from concentration in a homogeneous segment and enhances the generalizability of the findings within the context of listed non-financial firms in Vietnam.
Ownership structure of the sample firms
In terms of ownership, the sample includes 42 state-owned enterprises (SOEs) and 76 private firms, accounting for 35.6% and 64.4% of the total sample, respectively. This structure reflects the growing role of the private sector in Vietnam’s stock market, while also indicating that state-capital firms continue to play an important role in many key industries.
The coexistence of these two ownership groups in the sample allows the study to examine differences in ESG transparency incentives and tax strategies under varying degrees of monitoring and organizational objectives. In a context where the ESG regulatory framework in Vietnam is not yet fully mandatory, ownership structure may serve as an important moderating factor. Therefore, the presence of a sufficiently large proportion of both ownership groups enhances the explanatory value and contextual relevance of the research model.
5.2. Descriptive Statistics
The descriptive statistics table presents the mean, standard deviation, minimum value, and maximum value of the variables in the research model, including the dependent variable ETR, the independent variable ESG, the moderating variable FC representing the level of financial constraints, and the control variables.
Table 2.
Descriptive statistics of the sample.
| Variable | Obs | Mean | Std.Deviation | Min | Max |
| ETR | 590 | 0.199 | 0.135 | 0 | 1 |
| ESG | 590 | 0.463 | 0.170 | 0.049 | 0.887 |
| E | 590 | 0.407 | 0.238 | 0 | 0.900 |
| S | 590 | 0.495 | 0.229 | 0.083 | 0.917 |
| G | 590 | 0.489 | 0.181 | 0.063 | 0.938 |
| FC | 590 | 3.752 | 3.532 | 0.339 | 18.774 |
| ROA | 590 | 0.076 | 0.078 | -0.038 | 0.393 |
| LEV | 590 | 0.474 | 0.196 | 0.085 | 0.845 |
| SIZE | 590 | 15.429 | 1.829 | 11.489 | 19.862 |
| CAPEXP | 590 | 0.033 | 0.046 | 0 | 0.221 |
| PB | 590 | 1.887 | 1.215 | 0.311 | 6.351 |
(Source: Authors’ calculations).
Descriptive analysis of variables
The dependent variable, ETR, has a mean value of 19.9%, which is slightly below the statutory corporate income tax rate in Vietnam (20%). This suggests that sample firms tend to optimize their tax obligations through tax incentives or other legitimate tax-planning activities, reflecting a moderate rather than aggressive level of tax avoidance.
Among the three ESG pillars, the social dimension (0.495) and governance dimension (0.489) demonstrate higher levels of disclosure quality than the environmental dimension (0.407). This pattern is consistent with the Vietnamese institutional context, where corporate governance and social responsibility have been increasingly emphasized, while environmental compliance pressures remain relatively limited compared with those in developed economies.
Regarding the moderating variable, FC has a mean value of 3.752, which falls within the safe zone according to Altman’s benchmark. Relative to prior studies on emerging markets, this value suggests that the sampled firms generally maintain stable financial conditions and do not exhibit severe financial distress.
The control variables also present several notable characteristics. ROA averages 7.6%, indicating a moderate level of profitability, while LEV averages 0.474, suggesting that debt financing accounts for approximately 47.4% of total assets. SIZE has a mean value of 15.429, implying that the sample mainly consists of medium-sized and large firms. In addition, CAPEX averages 3.3%, indicating relatively modest fixed-asset investment, whereas PB averages 1.887, suggesting that market value generally exceeds book value and reflecting positive investor expectations regarding firms’ growth prospects.
Dispersion analysis
The standard deviation of ETR is 0.135, with values ranging from 0 to 1. Although the range is relatively wide, the dispersion is not excessive relative to the mean, indicating that most observations are concentrated around the statutory tax rate. ESG exhibits a standard deviation of 0.170, ranging from 0.049 to 0.887, which indicates substantial variation in ESG practices across firms. Among the three pillars, the environmental dimension shows the highest dispersion (0.238), reflecting considerable heterogeneity in environmental disclosure. The social (0.229) and governance (0.181) dimensions also display relatively broad variation across firms.
FC presents a standard deviation of 3.532, which is close to its mean value of 3.752, with observations ranging from 0.339 to 18.774. This wide distribution indicates substantial differences in firms’ financial conditions. From a methodological perspective, such variation enhances the ability to detect moderating effects in interaction models involving ESG and FC.
The control variables also demonstrate considerable heterogeneity. ROA ranges from -3.8% to 39.3%, indicating the coexistence of both loss-making and highly profitable firms. LEV varies from 8.5% to 84.5%, reflecting substantial differences in debt financing practices. PB ranges from 0.311 to 6.351, suggesting notable variation in market valuation, while SIZE spans from 11.489 to 19.862, indicating significant differences in firm size across the sample.
5.3. Correlation Matrix Analysis
Table 3 presents the correlation matrix for all variables used in the analysis. Examining pairwise correlations helps identify potential multicollinearity concerns and provides preliminary evidence regarding the direction and strength of the relationships among the variables prior to the regression estimations.
The results reported in Table 3 show that most correlation coefficients among the independent variables, moderating variables, and control variables are relatively low, generally remaining below 0.6 in absolute value. Following Gujarati (2004), multicollinearity is unlikely to be a serious concern when pairwise correlations among explanatory variables do not exceed 0.8. As all observed coefficients remain below this threshold, the correlation matrix provides preliminary evidence that multicollinearity is unlikely to affect the subsequent regression analyses.
Relatively strong correlations are observed between ESG and its component dimensions, particularly E (0.801) and S (0.810). This outcome is expected because ESG is constructed as a composite measure incorporating environmental, social, and governance performance. To reduce potential multicollinearity concerns, separate regression models are estimated for each ESG dimension.
The study also includes interaction terms between ESG and the moderating variables SOE and FC. Although interaction terms may mechanically increase correlations among explanatory variables (Aiken & West, 1991), the correlation matrix does not reveal any excessively high correlations involving the moderating variables.
The correlation results further provide initial insights into the relationship between ESG and corporate tax avoidance. ESG is positively correlated with ETR (0.192) at the 1% significance level. Given that a higher ETR generally indicates a lower degree of corporate tax avoidance, this finding is consistent with the view that stronger ESG engagement is associated with less aggressive tax behavior among non-financial firms.
A similar pattern is observed across the individual ESG dimensions. E, S, and G are all positively correlated with ETR, with coefficients of 0.122, 0.151, and 0.161, respectively, and all are statistically significant. This suggests that the association between ESG and tax behavior is broadly consistent across environmental, social, and governance activities.
For the moderating variables, both SOE (-0.092) and FC (-0.103) are negatively and significantly correlated with ETR. In pairwise terms, state-owned enterprises and firms facing greater financial constraints tend to report lower effective tax rates.
Nevertheless, the correlation matrix only reflects bivariate relationships and does not control for the influence of other firm characteristics. Consequently, the moderating roles of SOE and FC, as well as the direction and significance of the proposed relationships, require further examination through multivariate regression analysis.
5.4. Model Selection Tests for Panel Regression
To identify the most appropriate panel-data estimation approach, a series of model selection tests is performed among Pooled OLS, the Fixed Effects Model (FEM), and the Random Effects Model (REM). Following standard panel-data procedures, the F-test, Breusch–Pagan LM test, and Hausman test are used to determine the preferred specification.
The model selection results are reported in Table 4. The F-test and Breusch-Pagan LM test are statistically significant across all model specifications, indicating that panel-data estimators are more appropriate than pooled OLS for the dataset. These findings suggest the presence of unobserved firm-specific effects that should be taken into account in the estimation process.
To determine the preferred panel-data estimator, the Hausman test is employed to compare the Fixed Effects Model (FEM) and the Random Effects Model (REM). The test results are statistically insignificant across all models, with p-values exceeding the conventional 5% significance level. Accordingly, the null hypothesis cannot be rejected, implying that REM provides a more suitable specification for the data. Based on these results, REM is selected as the primary estimation method for the subsequent regression analyses.
Nevertheless, selecting the appropriate panel-data estimator does not eliminate all potential econometric concerns. In corporate finance research, panel datasets are frequently subject to heteroskedasticity and serial correlation, which may affect the consistency of statistical inference. Therefore, additional diagnostic tests are conducted before estimating the final models to ensure the robustness and reliability of the empirical results.
5.5. Diagnostic Tests for Model Defects and Remedies
5.5.1. Multicollinearity Test
Multicollinearity is examined using the Variance Inflation Factor (VIF), and the results are reported in Table 5.
The VIF results indicate a relatively high degree of stability among the explanatory variables. For the baseline models from M(1) to M(4), the VIF values remain low, generally ranging from 1.02 to 1.73. In particular, the ESG variable records a VIF of only 1.09, while the control variables also exhibit low VIF values, mostly below 2. The mean VIF values for these models range from 1.37 to 1.38, suggesting that multicollinearity is unlikely to be a concern in the baseline specifications.
For models M(5) and M(6), the inclusion of the interaction terms ESG×FC and ESG×SOE increases the VIF values of several variables. Specifically, FC and ESG×FC in model M(5) record VIF values of 9.62 and 9.74, respectively, while SOE and ESG×SOE in model M(6) show VIF values of 8.13 and 7.81. This pattern is expected because interaction terms are mechanically constructed from their component variables, resulting in structural multicollinearity. Nevertheless, all reported VIF values remain below the conventional threshold of 10, indicating that multicollinearity is not sufficiently severe to distort coefficient estimates or compromise statistical inference.
Consistent with Allison (2012), such structural multicollinearity does not invalidate the interpretation of interaction effects. In addition, the continuous variables were mean-centered prior to constructing the interaction terms in order to mitigate multicollinearity and improve the robustness of the estimation results. Overall, the VIF results provide no evidence of serious multicollinearity in the estimated models.
5.5.2. Tests for Autocorrelation and Heteroskedasticity
Following the model selection procedure, additional diagnostic tests are conducted to examine heteroskedasticity and autocorrelation in the panel-data models.
As reported in Table 6, the Breusch-Pagan test results are statistically significant across all model specifications, indicating the presence of heteroskedasticity. This finding suggests that the variance of the error terms is not constant across observations, which is common in corporate finance panel-data studies due to differences in firm characteristics and operating scales.
In contrast, the Wooldridge test results are statistically insignificant for all models, as the p-values exceed the 5% significance level. Therefore, the null hypothesis of no first-order autocorrelation cannot be rejected, indicating that serial correlation does not appear to be a serious concern in the dataset.
Overall, the diagnostic results suggest that while the models are affected by heteroskedasticity, there is no evidence of serious autocorrelation. To address this issue and improve the reliability of statistical inference, the study employs cluster-robust standard errors at the firm level in the final regression estimations.
5.6. Empirical Results
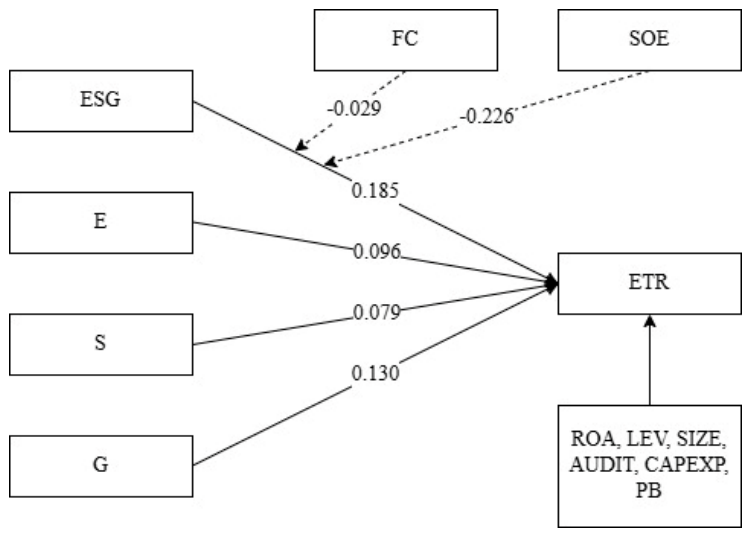
After correcting for heteroskedasticity, the research team tested the hypotheses using the REM model with robust standard errors. The regression coefficients are summarized in the following figure:
Figure 3.
Regression results of the proposed model (Source: Authors’ elaboration).
5.6.1. Results for Independent Variables
The regression results indicate that ESG has a positive and statistically significant effect on ETR, with a coefficient of 0.185 at the 1% significance level. Since a higher ETR reflects lower levels of tax avoidance, the findings suggest that firms with stronger ESG disclosure tend to engage less in tax avoidance activities. Accordingly, Hypothesis H1 is supported.
Table 7.
Effects of ESG and ESG pillars on ETR.
| Relationship | Coefficient | Std. Error |
| ESG -> ETR | 0.185*** | 0.061 |
| E -> ETR | 0.096*** | 0.035 |
| S -> ETR | 0.079** | 0.035 |
| G -> ETR | 0.130*** | 0.049 |
Notes: *, **, *** indicate statistical significance at the 10%, 5%, and 1% levels, respectively. (Source: Authors’ calculations).
Regarding the Environmental (E) pillar, the coefficient is positive (0.096) and statistically significant at the 1% level, indicating that firms with stronger environmental commitments tend to report higher ETRs and exhibit lower levels of tax avoidance. This finding supports Hypothesis H2 and suggests that environmental responsibility is associated with greater tax transparency.
Similarly, the Social (S) pillar shows a positive and statistically significant relationship with ETR, with a coefficient of 0.079 at the 5% significance level. This result implies that firms emphasizing social responsibility and stakeholder relationships are less likely to engage in aggressive tax practices, thereby supporting Hypothesis H3.
For the Governance (G) pillar, the coefficient is 0.130 and statistically significant at the 1% level. The results indicate that stronger governance mechanisms contribute to constraining tax avoidance behavior by enhancing monitoring effectiveness and corporate transparency. This finding is consistent with the argument that sound governance structures discourage opportunistic financial decisions and excessive tax-risk strategies. Therefore, Hypothesis H4 is supported.
5.6.2. Results for Moderating Variables
Moderating Effect of FC
The regression results indicate that ESG has a positive and statistically significant effect on ETR, with a coefficient of 0.185 at the 1% significance level. Since a higher ETR generally reflects lower levels of tax avoidance, the positive coefficient suggests that firms with stronger ESG disclosure are less likely to engage in tax avoidance activities. This finding provides support for Hypothesis H1.
Regarding the E pillar, the estimated coefficient is positive (0.096) and statistically significant at the 1% level. The result indicates that firms with stronger environmental performance tend to report higher ETRs, suggesting lower levels of tax avoidance. Therefore, Hypothesis H2 is supported and the evidence points to a positive association between environmental responsibility and tax transparency.
The S pillar also exhibits a positive and statistically significant relationship with ETR, with a coefficient of 0.079 at the 5% significance level. This finding suggests that firms placing greater emphasis on social responsibility tend to engage less in tax avoidance behavior. Accordingly, the empirical evidence supports Hypothesis H3.
Table 8.
Moderating effect of FC and SOE.
| Relationship | Coefficient | Std. Error |
| ESG x FC -> ETR | -0.029** | 0.013 |
| ESG x SOE -> ETR | -0.226* | 0.125 |
Notes: *, **, *** indicate statistical significance at the 10%, 5%, and 1% levels, respectively. (Source: Authors’ calculations).
For the G pillar, the coefficient is positive (0.130) and statistically significant at the 1% level. The results suggest that stronger governance mechanisms are associated with higher ETRs and lower levels of tax avoidance. One possible explanation is that effective governance enhances oversight and transparency, thereby limiting opportunities for aggressive tax practices. Consequently, Hypothesis H4 is supported.
Moderating Effect of SOE
The interaction term between ESG and state ownership (ESG×SOE) is negative and statistically significant, with a coefficient of -0.226. This result suggests that state ownership weakens the positive relationship between ESG and ETR. In other words, although ESG disclosure is associated with lower levels of tax avoidance, this effect appears to be less pronounced in state-owned enterprises.
One possible explanation lies in the distinct institutional characteristics of SOEs. Compared with private firms, state-owned enterprises are generally subject to stronger government oversight and often pursue broader political and social objectives alongside economic goals. Under such conditions, ESG disclosure may play a less important monitoring and signaling role in shaping corporate tax behavior. As a result, the ability of ESG to constrain tax avoidance is relatively weaker among SOEs than among privately owned firms. Overall, these findings provide empirical support for Hypothesis H6, suggesting that state ownership moderates the relationship between ESG and tax avoidance by weakening the tax-constraining effect of ESG.
5.6.3. Results for Control Variables
In addition to the main independent and moderating variables, the model also incorporates control variables to ensure robustness and accuracy. The empirical results show that the control variables generally exhibit significant effects and are consistent with prevailing financial theories.
Table 9.
Effects of Control Variables on ETR.
| Variable | M(1) | M(2) | M(3) | M(4) | M(5) | M(6) |
| AUDIT | 0.030 | 0.034 | 0.028 | 0.032 | 0.032 | 0.029 |
| SIZE | -0.007 | -0.005 | -0.004 | -0.006 | -0.008 | -0.006 |
| PB | 0.010** | 0.010** | 0.011** | 0.010** | 0.008 | 0.010** |
| LEV | 0.076** | 0.073** | 0.073** | 0.083** | 0.097*** | 0.075** |
| CAPEXP | 0.013 | 0.020 | 0.022 | 0.028 | 0.023 | 0.006 |
| ROA | -0.336*** | -0.341*** | -0.343*** | -0.331*** | -0.325*** | -0.313*** |
Notes: *, **, *** indicate statistical significance at the 10%, 5%, and 1% levels, respectively. (Source: Authors’ calculations).
AUDIT exhibits positive but statistically insignificant coefficients across all model specifications, suggesting that audit quality does not significantly influence ETR in the research context. This finding implies that differences in audit quality may not substantially affect firms’ tax compliance behavior.
ROA shows a negative and statistically significant relationship with ETR, with coefficients ranging from -0.343 to -0.313. Since lower ETR values indicate greater tax avoidance, the results suggest that more profitable firms are more likely to engage in tax-planning activities aimed at reducing tax burdens. This finding is consistent with prior studies arguing that highly profitable firms possess stronger incentives and greater resources to implement tax optimization strategies.
LEV exhibits a positive and statistically significant association with ETR across most model specifications. This result suggests that firms with higher leverage ratios tend to report higher ETRs and lower levels of tax avoidance. One possible explanation is that highly leveraged firms are subject to stronger monitoring by creditors and financial institutions, thereby constraining aggressive tax strategies.
Similarly, PB shows a positive and statistically significant relationship with ETR in most models, indicating that firms with higher market valuations tend to engage less in tax avoidance behavior. This finding may reflect stronger reputational concerns and greater pressure to maintain transparency toward investors.
In contrast, SIZE has a negative but statistically insignificant effect on ETR. This result may reflect the coexistence of two opposing effects: larger firms are subject to greater public scrutiny and regulatory oversight, while simultaneously possessing greater resources and expertise to implement sophisticated tax-planning strategies.
Finally, CAPEXP exhibits a positive but statistically insignificant relationship with ETR. This finding suggests that capital expenditure does not exert a decisive influence on tax avoidance behavior among the sampled firms. Similar evidence is documented by Liu and Cao (2007) for Chinese listed firms.
5.7. Machine Learning for Predicting Corporate Tax Avoidance
5.7.1. Model Evaluation and Selection
Table 10 reports the predictive performance of several machine learning algorithms under two model specifications: models excluding ESG variables and models incorporating ESG information. For the baseline specification without ESG variables, XGBoost demonstrates the strongest predictive performance, while Random Forest and LightGBM exhibit comparatively weaker results. When ESG variables are included, the predictive performance of all models generally improves. Under this specification, CatBoost achieves the highest explanatory power and the lowest prediction errors among the evaluated algorithms.
More importantly, the results consistently show that the inclusion of ESG variables enhances model performance. This finding suggests that ESG-related information provides additional explanatory value beyond traditional financial indicators when predicting corporate tax avoidance behavior. The improvement in predictive accuracy also indicates that non-financial disclosure captures aspects of corporate behavior that may not be fully reflected in conventional financial measures. Overall, the findings highlight the relevance of ESG disclosure as an informative non-financial factor in understanding and predicting tax avoidance behavior among Vietnamese firms.
5.7.2. Assessment of Variable Contributions in the Model
Table 11 presents the variable importance results from the ESG-integrated CatBoost model. ROA emerges as the most influential predictor, accounting for 35.50% of total variable importance, followed by the overall ESG score (10.35%). This finding highlights the importance of both firm profitability and ESG disclosure in explaining corporate tax avoidance behavior.
Among the ESG dimensions, the Social pillar exhibits the highest contribution, followed by Governance and Environmental factors. The result suggests that stakeholder-related considerations and social responsibility may play a relatively important role in shaping corporate tax behavior in the Vietnamese context.
Several control variables, including financial constraints and firm size, also contribute meaningfully to the prediction model, whereas state ownership exhibits relatively limited predictive importance. Taken together, the results reinforce the view that ESG disclosure contains relevant information for understanding and predicting corporate tax avoidance behavior in an emerging market setting.
6. Recommendations
Recommendations for government and regulatory authorities
For ESG to become an effective instrument for controlling tax avoidance and enhancing financial transparency, the State needs to establish a coherent legal framework that shifts from merely encouraging ESG disclosure to making it mandatory, particularly with respect to quantitative indicators and sector-specific requirements. Specifically, while Vietnam’s Circular No. 96/2020/TT-BTC mostly requires qualitative descriptions regarding labor policies or environmental commitments, it lacks the standardized quantitative metrics found in the GRI framework. Most notably, GRI 207 (Tax) mandates explicit disclosures of corporate tax strategies and country-by-country financial reporting - elements entirely absent in Circular 96. Furthermore, Circular 96 lacks granular, audited metrics on wage gaps (GRI 405) and value-chain environmental impacts (GRI 305 Scope 3).
Integrating these specific international metrics into the domestic legal framework is crucial; it prevents firms from exploiting regulatory gaps to engage in “tax-washing” and provides the necessary structured data to fuel predictive machine learning models for early tax risk detection. At the same time, an independent assurance mechanism for ESG reports should be introduced in order to limit greenwashing and ensure the reliability of disclosed information. In addition, regulatory authorities should promote the integration of ESG data into the tax administration system and combine tax incentives with ESG compliance conditions in order to encourage transparent corporate behavior. Strengthening monitoring, standardizing disclosure practices, and implementing a systematic roadmap for incorporating ESG into tax administration are also necessary. Moreover, attention should be given to capacity building and the application of advanced technologies, such as machine learning, in data analysis in order to detect risks at an early stage, thereby improving tax administration efficiency and promoting sustainable development.
Recommendations for firms
In the context of growing demands for sustainable development, firms need to move from a symbolic ESG approach toward embedding ESG into their core governance strategy. Crucially, since the Governance (G) pillar exhibits the strongest impact on mitigating tax avoidance, firms must prioritize strengthening their internal control frameworks and financial transparency. At the same time, ESG strategies should be designed in accordance with sectoral characteristics and resource capacity, with an emphasis on substantive integration rather than symbolic compliance. Regarding data integrity, firms must internalize that their ESG metrics are no longer just qualitative signals but are increasingly integrated into predictive machine learning algorithms alongside financial data.
Therefore, rather than using disclosure as a cosmetic tool to mask aggressive tax positions, management should focus on the rigorous accuracy of their reported data to mitigate the risk of being flagged for tax anomalies. Finally, firms experiencing high financial constraints must resist short-term tax minimization, as the resulting loss of corporate legitimacy could severely hinder their long-term survival and stakeholder confidence.
Recommendations for investors
In a context where ESG reporting frameworks in Vietnam still lack standardization and transparency, investors should shift from a passive approach to a more proactive and cautious mode of assessment. Specifically, investors should develop independent ESG evaluation criteria, prioritize quantitative metrics that are verifiable and comparable rather than relying on purely qualitative narrative disclosures, and compare ESG commitments with actual tax behavior in order to identify risks of greenwashing or tax-washing. Furthermore, investors should exercise their role as active owners by engaging in monitoring and influencing corporate behavior, including maintaining strategic dialogue with management on ESG and tax responsibility issues, and using voting rights to promote higher standards of governance and transparency. Such an approach not only helps reduce investment risk but also contributes to improving the quality of the capital market and promoting sustainable development.
7. Conclusions
This study provides robust evidence that ESG disclosures significantly mitigate corporate tax avoidance among Vietnamese listed firms (2020-2024). Extending Stakeholder and Agency theories, we find that substantive ESG engagement acts as a critical internal governance mechanism that curtails agency conflicts, rather than a symbolic CSR proxy. However, this disciplining effect is substantially attenuated when firms face severe financial constraints or operate under state ownership, where immediate liquidity pressures and institutional mandates override sustainability commitments.
Methodologically, this research advances beyond traditional econometric limits by employing machine learning. Using the CatBoost algorithm, we demonstrate that integrating ESG metrics vastly improves the predictive accuracy of tax avoidance models. Emerging as the second most powerful predictor after profitability (ROA), ESG exhibits profound predictive power. This empirically verifies ESG as a credible signal of transparency and a superior tool for forecasting opaque tax behavior, rather than a facade for tax-washing.
These findings yield actionable implications. Policymakers and tax authorities should transition toward mandatory ESG reporting, leveraging these disclosures for tax audit risk assessments. Investors must utilize ESG scores as critical due diligence tools to identify greenwashing and evaluate underlying tax compliance risks. Meanwhile, corporate managers should embrace substantive ESG integration to mitigate the legal and reputational risks of aggressive tax strategies.
References
- Aiken, L. S.; West, S. G. Multiple regression: Testing and interpreting interactions; 1991. [Google Scholar] [CrossRef]
- Allison, P. When can you safely ignore multicollinearity. Stat. Horiz. 2012, 5(1), 1–2. [Google Scholar]
- Armstrong, C. S.; Blouin, J. L.; Jagolinzer, A. D.; Larcker, D. F. Corporate governance, incentives, and tax avoidance. J. Account. Econ. 2015, 60(1), 1–17. [Google Scholar] [CrossRef]
- Bressan, S. ESG, Taxes, and Profitability of Insurers. Sustainability 2023, 15(18), 13937. [Google Scholar] [CrossRef]
- Bulow, J. I.; Shoven, J. B. The Bankruptcy Decision. Bell J. Econ. 1978, 9(2), 437–456. [Google Scholar] [CrossRef]
- Carolina, V.; Gunawan, Y. W.; Tedya, R. Can ESG Performance Moderate The Effect of Tax Avoidance on Corporate Risk? Ris. Akunt. Dan Keuang. Indones. 2023, 8(1), 63–71. [Google Scholar] [CrossRef]
- Chen, S.; Chen, X.; Cheng, Q.; Shevlin, T. Are family firms more tax aggressive than non-family firms? J. Financ. Econ. 2010, 95(1), 41–61. [Google Scholar] [CrossRef]
- Du, M.; Li, Y. Tax avoidance, CSR performance and financial impacts: evidence from BRICS economies. Int. J. Emerg. Mark. 2023, 19(10), 3303–3328. [Google Scholar] [CrossRef]
- Duong, T.-Q.; Huang, Y.-C. The mediation effects of tax avoidance between ESG and cost of debt, firm value: evidence from ASEAN listed corporations. J. Entrep. Bus. Econ. 2022, 10(2S2), 201–232. [Google Scholar]
- Dyreng, S.; Hanlon, M.; Maydew, E. L. The Effects of Executives on Corporate Tax Avoidance. Account. Rev. 2010, 85(4), 1163–1189. [Google Scholar] [CrossRef]
- Eberhart, A. C.; Senbet, L. W. Absolute Priority Rule Violations and Risk Incentives for Financially Distressed Firms. Financ. Manag. 1993, 22(3), 101–116. [Google Scholar] [CrossRef]
- Edwards, A.; Schwab, C.; Shevlin, T. Financial Constraints and Cash Tax Savings. Account. Rev. 2016, 91(3), 859–881. [Google Scholar] [CrossRef]
- Eisenhardt, K. M. Agency Theory: An Assessment and Review. Acad. Manag. Rev. 1989, 14(1), 57–74. [Google Scholar] [CrossRef] [PubMed]
- Fama, E. F. Agency Problems and the Theory of the Firm. J. Political Econ. 1980, 88(2), 288–307. [Google Scholar] [CrossRef] [PubMed]
- Fama, E. F.; Jensen, M. C. Separation of Ownership and Control. J. Law. Econ. 1983, 26(2), 301–325. [Google Scholar] [CrossRef]
- Firmansyah, A.; Pratama, H. P.; Valensa, M. F. ESG risk and tax avoidance: Signaling insights from Indonesian public firms. Educoretax 2025, 5(3), 370–380. [Google Scholar] [CrossRef]
- Gaaya, S.; Lakhal, N.; Lakhal, F. Does family ownership reduce corporate tax avoidance? The moderating effect of audit quality. Manag. Audit. J. 2017, 32. [Google Scholar] [CrossRef]
- Goodfellow, I.; Bengio, Y.; Courville, A. Deep learning; MIT press: Cambridge, 2016; Vol. 1. [Google Scholar]
- Gujarati, D. N. Basic econometrics; McGraw-Hill Companies, 2004. [Google Scholar]
- Ha, N. T. T.; Quyen, P. G. The Relationship between State Ownership and Tax Avoidance Level: Empirical Evidence from Vietnamese Firms. J. Asian Bus. Strategy 2017, 7(1), 1–12. [Google Scholar] [CrossRef]
- Hanlon, M.; Heitzman, S. A review of tax research. J. Account. Econ. 2010, 50(2), 127–178. [Google Scholar] [CrossRef]
- Jensen, M. C.; Meckling, W. H. Theory of the firm: Managerial behavior, agency costs and ownership structure. J. Financ. Econ. 1976, 3(4), 305–360. [Google Scholar] [CrossRef]
- Khương, N. V.; Trang, N. T. Hành vi tránh thuế và chi phí sử dụng nợ: Nghiên cứu thực nghiệm tại Việt Nam. Kinh Tế V.à Phát Triển 2021, (284), 44–52. [Google Scholar]
- Laguir, I.; Staglianò, R.; Elbaz, J. Does Corporate Social Responsibility Affect Corporate Tax Aggressiveness? In Political Economy: Fiscal Policies & Behavior of Economic Agents eJournal; 2015. [Google Scholar]
- Li, W.; Li, T.; Zhu, H. Annual report audit, ESG report assurance and audit quality: Evidence from the same accounting firm. China J. Account. Res. 2025, 18, 100434. [Google Scholar] [CrossRef]
- Liu, X.; Cao, S. Determinants of corporate effective tax rates: evidence from listed companies in China. Chin. Econ. 2007, 40(6), 49–67. [Google Scholar] [CrossRef]
- Maksimovic, V.; Titman, S. Financial Policy and Reputation for Product Quality. Rev. Financ. Stud. 1991, 4(1), 175–200. [Google Scholar] [CrossRef]
- Mitchell, R. K.; Agle, B. R.; Wood, D. J. Toward a Theory of Stakeholder Identification and Salience: Defining the Principle of Who and What Really Counts. Acad. Manag. Rev. 1997, 22(4), 853–886. [Google Scholar] [CrossRef]
- Montenegro, T. M. Tax Evasion, Corporate Social Responsibility and National Governance: A Country-Level Study. Sustainability 2021, 13, 11166. [Google Scholar] [CrossRef]
- Ngo, D. Corporate Social Responsibility Impact on Tax Avoidance: Empirical Evidence from Vietnam. Ianna J. Interdiscip. Stud. 2024, 6(2), 115–130. [Google Scholar] [CrossRef]
- Nguyen, M.; Bensemann, J.; Kelly, S. Corporate social responsibility (CSR) in Vietnam: a conceptual framework. Int. J. Corp. Soc. Responsib. 2018, 3(1), 9. [Google Scholar] [CrossRef]
- Rajput, D.; Wang, W.-J.; Chen, C.-C. Evaluation of a decided sample size in machine learning applications. BMC Bioinform. 2023, 24(1), 48. [Google Scholar] [CrossRef] [PubMed]
- Richardson, G.; Taylor, G.; Lanis, R. The impact of board of director oversight characteristics on corporate tax aggressiveness: An empirical analysis. J. Account. Public Policy 2013, 32(3), 68–88. [Google Scholar] [CrossRef]
- Ross, S. A. The Determination of Financial Structure: The Incentive-Signalling Approach. Bell J. Econ. 1977, 8(1), 23–40. [Google Scholar] [CrossRef]
- Sambuaga, E.; Felicia, D. The Effect of Women’s Role on Board, ESG Performance, and Tax Avoidance. Society 2024, 12, 61–73. [Google Scholar] [CrossRef]
- Syahputri, A. The Impact of ESG Performance and Financial Constraint on Tax Avoidance: Evidence From ASEAN 5. J. Din. Akunt. 2025, 17(1), 102–117. [Google Scholar] [CrossRef]
- Tran, K.; Truong, M.; Tú, B.; Duong, P.; Huynh, M.; Nguyen, T. Firm Risk and Tax Avoidance in Vietnam: Do Good Board Characteristics Interfere Effectively? Risks 2023, 11(2), 39. [Google Scholar] [CrossRef]
- Van, H. V.; Ly, K. C. Does rising corporate social responsibility promote firm tax payments? New perspectives from a quantile approach. Int. Rev. Financ. Anal. 2021, 77, 101857. [Google Scholar] [CrossRef]
- Velte, P. Sustainable institutional investors, corporate sustainability performance, and corporate tax avoidance: Empirical evidence for the European capital market. Corp. Soc. Responsib. Environ. Manag. 2023, 30(5), 2406–2418. [Google Scholar] [CrossRef]
- Watts, R. L.; Zimmerman, J. L. Towards a Positive Theory of the Determination of Accounting Standards. Account. Rev. 1978, 53(1), 112–134. [Google Scholar] [CrossRef]
- Widiastutik, R.; Iqbal, S.; Rusydi, M. The Moderating Roles Of Environmental, Social and Governance Disclosures On Company Ownership Structure And Tax Avoidance. J. Reviu Akunt. Dan Keuang. 2024, 14, 442–458. [Google Scholar] [CrossRef]
- Widuri, R.; Subroto, B.; Saraswati, E.; Rusydi, M. K. Meta Analysis of The Relationship Between Corporate Social Responsibility and Tax Aggressiveness. Rev. De Gestão Soc. E Ambient. 2024, 18(5), 1–21. [Google Scholar] [CrossRef]
- Yanto, H.; Hajawiyah, A.; Baroroh, N. The reciprocal effect of environmental, social, and governance (ESG) practices and tax aggressiveness in Indonesian and Malaysian companies. Probl. Perspect. Manag. 2025, 23(1), 339. [Google Scholar] [CrossRef]
- Yoon, B.; Lee, J. H.; Cho, J. The Effect of ESG Performance on Tax Avoidance—Evidence from Korea. Sustainability 2021, 13, 6729. [Google Scholar] [CrossRef]
- Yuwono, A.; Mustikasari, E. The effect of tax avoidance and tax risk on firm risk. Indones. Account. Rev. 2022, 12(2), 223–230. [Google Scholar] [CrossRef]
Figure 2.
Predictive model of tax avoidance behavior (Source: Developed by the authors).
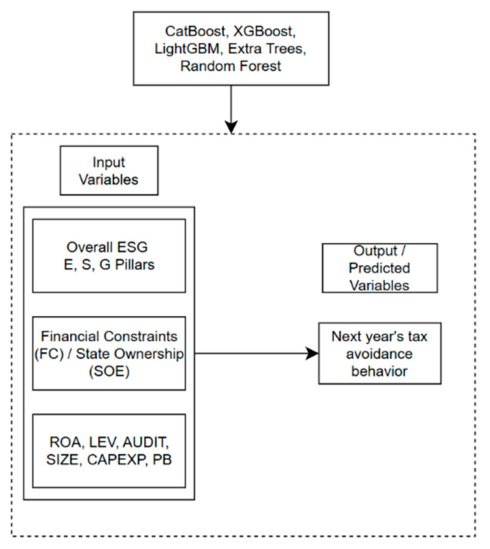
Table 3.
Correlation matrix.
| Variable | ETR | ESG | E | S | G | SOE | FC | Audit | LEV | PB | CapExp | Size | ROA |
| ETR | 1 | ||||||||||||
| ESG | 0.192*** | 1 | |||||||||||
| E | 0.122*** | 0.801*** | 1 | ||||||||||
| S | 0.151*** | 0.810*** | 0.512*** | 1 | |||||||||
| G | 0.161*** | 0.747*** | 0.358*** | 0.437*** | 1 | ||||||||
| SOE | -0.092** | -0.209*** | -0.165*** | -0.187*** | -0.130*** | 1 | |||||||
| FC | -0.103** | -0.056 | -0.015 | -0.048 | -0.059 | 0.119*** | 1 | ||||||
| Audit | 0.120*** | 0.171*** | 0.089** | 0.184*** | 0.142*** | 0.022 | -0.071* | 1 | |||||
| LEV | 0.221*** | 0.097** | 0.091** | 0.079* | 0.039 | -0.112*** | -0.551*** | 0.128*** | 1 | ||||
| PB | 0.076* | 0.110*** | 0.101** | 0.091** | 0.067 | -0.153*** | 0.343*** | 0.136*** | -0.055 | 1 | |||
| CapExp | 0.018 | 0.059 | 0.024 | 0.074* | 0.050 | -0.043 | -0.060 | 0.040 | 0.019 | -0.068* | 1 | ||
| Size | 0.128*** | 0.269*** | 0.197*** | 0.246*** | 0.194*** | -0.027 | -0.312*** | 0.520*** | 0.390*** | 0.088** | 0.058 | 1 | |
| ROA | -0.203*** | -0.024 | 0.011 | -0.022 | -0.035 | 0.039 | 0.546*** | -0.058 | -0.525*** | 0.327*** | 0.054 | -0.299*** | 1 |
Notes: *, **, *** indicate statistical significance at the 10%, 5%, and 1% levels, respectively (Source: Authors’ calculations).
Table 4.
Results of panel-data model selection tests.
| Statistical Test | M(1) | M(2) | M(3) | M(4) | M(5) | M(6) |
| F-test | 0.000*** | 0.000*** | 0.000*** | 0.000*** | 0.000*** | 0.000*** |
| Breusch - Pagan LM | 0.000*** | 0.000*** | 0.000*** | 0.000*** | 0.000*** | 0.000*** |
| Hausman |
0.287 | 0.203 | 0.720 | 0.565 | 0.470 | 0.373 |
| Selected Model | REM | REM | REM | REM | REM | REM |
Notes: *, **, *** indicate statistical significance at the 10%, 5%, and 1% levels, respectively (Source: Authors’ calculations).
Table 5.
Summary of VIF of variables.
| Variable | M(1) | M(2) | M(3) | M(4) | M(5) | M(6) |
| ESG | 1.09 | 2.39 | 1.70 | |||
| E | 1.05 | |||||
| S | 1.08 | |||||
| G | 1.05 | |||||
| FC | 9.62 | |||||
| SOE | 8.13 | |||||
| ESGxFC | 9.74 | |||||
| ESGxSOE | 7.81 | |||||
| ROA | 1.65 | 1.66 | 1.65 | 1.65 | 1.77 | 1.66 |
| LEV | 1.53 | 1.53 | 1.52 | 1.53 | 1.77 | 1.54 |
| SIZE | 1.73 | 1.71 | 1.71 | 1.70 | 1.77 | 1.74 |
| AUDIT | 1.40 | 1.40 | 1.40 | 1.40 | 1.40 | 1.40 |
| CAPEXP | 1.03 | 1.02 | 1.03 | 1.03 | 1.03 | 1.03 |
| PB | 1.21 | 1.21 | 1.21 | 1.20 | 1.34 | 1.24 |
| VIF mean | 1.38 | 1.37 | 1.37 | 1.37 | 3.43 | 2.92 |
(Source: Authors’calculations).
Table 6.
Summary of model diagnostic test results.
| Statistical Test | M(1) | M(2) | M(3) | M(4) | M(5) | M(6) |
| Breusch-Pagan | ||||||
| P-value | 0.000*** | 0.000*** | 0.000*** | 0.000*** | 0.000*** | 0.000*** |
| Woodridge | ||||||
| P-value | 0.3174 | 0.4526 | 0.3082 | 0.4001 | 0.2077 | 0.4292 |
Notes: The table reports p-values for the Breusch–Pagan and Wooldridge diagnostic tests (Source: Authors’calculations).
Table 10.
Performance comparison of machine learning models.
| Prediction model | Algorithm | R² | MSE | RMSE | MAE |
| Model without ESG variables | XGBoost | 0.3814 | 0.0061 | 0.0778 | 0.0601 |
| Extra Trees | 0.3745 | 0.0061 | 0.0783 | 0.0576 | |
| CatBoost | 0.3459 | 0.0064 | 0.08 | 0.0606 | |
| Random Forest | 0.2004 | 0.0078 | 0.0885 | 0.0629 | |
| LightGBM | 0.1837 | 0.008 | 0.0894 | 0.0631 | |
| Model with ESG variables | CatBoost | 0.5292 | 0.0046 | 0.0679 | 0.0502 |
| XGBoost | 0.5014 | 0.0049 | 0.0699 | 0.0528 | |
| LightGBM | 0.4615 | 0.0053 | 0.0726 | 0.0552 | |
| Extra Trees | 0.3897 | 0.006 | 0.0773 | 0.0563 | |
| Random Forest | 0.3012 | 0.0068 | 0.0827 | 0.0623 |
(Source: Authors’ calculations).
Table 11.
Variable importance in the prediction model.
| Variables | Contributions (%) | Variables | Contributions (%) | |
| ROA | 35.50 | CAPEXP | 5.01 | |
| ESG | 10.35 | AUDIT | 4.89 | |
| LEV | 9.60 | PB | 4.76 | |
| S | 8.14 | G | 3.94 | |
| FC | 6.85 | E | 3.13 | |
| SIZE | 6.81 | SOE | 1.01 |
(Source: Authors’ calculations).
Disclaimer/Publisher’s Note: The statements, opinions and data contained in all publications are solely those of the individual author(s) and contributor(s) and not of MDPI and/or the editor(s). MDPI and/or the editor(s) disclaim responsibility for any injury to people or property resulting from any ideas, methods, instructions or products referred to in the content. |
© 2026 by the authors. Licensee MDPI, Basel, Switzerland. This article is an open access article distributed under the terms and conditions of the Creative Commons Attribution (CC BY) license.
Copyright: This open access article is published under a Creative Commons CC BY 4.0 license, which permit the free download, distribution, and reuse, provided that the author and preprint are cited in any reuse.