Preprint
Article

This version is not peer-reviewed.

Using ARIMA Forecast for Scenario Projections to Compare Funding Mechanisms in the Singaporean Arts Sector

Submitted:

10 April 2026

Posted:

13 April 2026

You are already at the latest version

Abstract

This study uses Autoregressive Integrated Moving Average (ARIMA) forecasting models and regression analysis to explore the impact of three government funding mechanisms on financial sustainability in Singapore’s arts and heritage sector. Based on data obtained from the Ministry of Culture, Community and Youth (MCCY) for FY (FY refers to “Financial Year”, which is generally from 1 April to 31st March of the following year) 2022-2024, we modelled three funding scenarios: direct organisational grants (Scenario A), citizen-directed cultural vouchers (Scenario B), and a hybrid model combining both approaches (Scenario C). The results showed that while direct funding provides the most significant immediate capacity increase, a hybrid model provides a better balance between organisational stability and demand, thereby offering a more sustainable pathway for sector development. Our study makes a methodological contribution by illustrating the application of ARIMA forecasting to cultural policy evaluation, and compared the outcome of supply-side and demand-side interventions in the cultural sector.

Keywords: 
;  ;  ;  ;  ;  ;  
Subject: 
Arts and Humanities  -   Art

1. Introduction

Financial sustainability is a persistent problem across arts and heritage institutions, where a post-COVID-19 pandemic return to pre-pandemic operations and programme delivery has relied heavily on government support. Policymakers have to address how public funding can be used most effectively to enhance sectoral sustainability while fostering long-term audience engagement. This report addresses a key policy issue: how can government investment be designed to maximize financial sustainability within the arts and heritage sector?
Singapore’s arts and heritage sector provides an insightful case study. After sharp post-pandemic recoveries in FY2023, the sector contracted modestly in FY2024, raising questions about what are the effective mechanisms to fund and stabilize the sector towards growth. The SG Culture Pass distributed by the Singapore government, providing SGD100 worth of credits for citizens to participate in arts and heritage activities, is an example of demand-side policy intervention compared to traditional supply-side intervention such as direct organisational grants. Thus, this facilitates a comparison of supply- and demand-side funding approaches.
The paper provides three main contributions towards the cultural policy literature. First, it applies ARIMA forecasting models to the scenario-based assessment of policy action in the arts and cultural sector, address the backdrop of methodological gaps in predictive cultural economics. Second, it quantifies efficiency differentials between direct organisational funding and citizen-directed voucher schemes; thus, providing evidence-based input for policy design. Third, it assesses the hybrid funding model where organisational capacity-building is balanced with demand stimulation, providing a framework for sustainable sector development.

2. Literature Review and Theoretical Framework

2.1. Financial Sustainability in the Cultural Sector

Financial sustainability in arts and heritage organisations encompasses the capacity to maintain operations, deliver programming, and adapt to changing environments without excessive dependence on volatile revenue streams (Loots, Betzler & Bille., et al., 2022). Existing literature identifies multiple dimensions of sustainability, including revenue diversification, workforce stability, and audience development (Müller & Grieshaber, 2024). However, empirical studies examining how different funding mechanisms influence these dimensions remain limited, particularly in Asian contexts.

2.2. Supply-Side Versus Demand-Side Cultural Funding

Cultural economics distinguishes between supply-side interventions (direct grants to organisations) and demand-side interventions (subsidies to consumers) Scott-Lennox, Blau, & Reid (1993). Supply-side funding provides immediate operational stability and enables long-term planning, but may not stimulate audience demand or encourage organisational innovation. Demand-side funding activates public participation and channels resources toward organisations with strong public appeal, but introduces revenue unpredictability and potential inequities across organisation types.
The theoretical trade-offs between these approaches have been extensively discussed (Throsby, 1994), yet empirical comparisons using predictive modelling remain scarce. This study addresses this gap by employing forecasting techniques to project sector-level outcomes under alternative funding scenarios.

2.3. Forecasting in Cultural Policy Analysis

ARIMA models for time series prediction have been applied in economic policy evaluation but are not widely used in the analysis of cultural policy. ARIMA models work effectively in situations where there is limited data history because such models tend to identify any existing trends in the data while taking into consideration the uncertainty of the data through confidence limits. This work is applicable in the analysis of the cultural sector.

3. Data and Context

3.1. Data Source and Coverage

This research makes use of administrative data from the Ministry of Culture, Community, and Youth1 in Singapore for the total number of arts and heritage organizations registered in the country for the financial years 2022, 2023, and 2024. It should be noted that the total income, total number of employees, as well as total employee costs are provided for the relevant sectors. Although the three-year period allows for a certain degree of complex models, such a period is significant as it allows for recovery from the aftermath of the pandemic (2022-2023) as well as a phase of stability in the period of 2023-2024.

3.2. Sector Trends and Context

Table 1 presents the observed sector trends across the study period.
The sector experienced robust recovery from FY2022 to FY2023, with income growth of 15.14%, employee growth of 9.86%, and employee cost growth of 5.78%. However, FY2024 saw modest contraction across all indicators: income declined 2.53%, employees declined 3.84%, and employee costs declined 1.38%. This suggests the sector reached a post-pandemic peak in FY2023 before stabilising at a slightly lower equilibrium in FY2024.
Notably, average employee salary in the art and heritage sector increased from S$86,977 in FY2023 to S$89,204 in FY2024 despite overall contraction. This reflects a structural shift in workforce composition, with organisations retaining higher-paid specialist and managerial roles while reducing lower-paid or temporary positions. This pattern is consistent with sector stabilisation rather than crisis, as organisations prioritise core capacity over expansion.

3.3. Policy Scenarios

There were three funding models simulated, with a S$150 million public investment in each:
Scenario A: Direct Organisational Funding
All $150 million goes to arts and heritage institutions as operational funding. That is a purely supply-side policy with 100% pass-through efficiency.
Scenario B: Citizen-Directed Funding
Funding of $150 million is allocated to citizens in the form of cultural vouchers, inspired by the SG Culture Pass scheme. An average pass-through rate of 60%, using global evidence for voucher redemption rates and with some understanding of the spending behaviour of the sector, would generate S$90 million for the organisations as earned income.
Scenario C : Hybrid Model
A total contribution of S$150 million is shared equally, with S$75 million channelled through direct grants and another S$75 million through citizen vouchers. This results in a total organisational income boost of S$120 million using the 60% pass-through rate (S$75 million direct + S$45 million voucher contribution).

4. Methodology

4.1. Modelling Approach

A multi-method forecasting framework is applied, where ARIMA time-series models are combined with regression-based scenario analysis. Approaching the problem in three stages:
Stage 1 - Baseline Forecasting
ARIMA models were fitted to historical data for employees, employee costs, and income to establish baseline projections for FY2025 absent policy intervention.
Stage 2 - Regression Modelling
Linear regression models were estimated to quantify relationships between income and both employment and employee costs. Such models allow scenario-based projections that make changes in income levels translate into workforce implications.
Stage 3 - Scenario Projection
For each scenario, the model adjusted baseline income projections according to the assumed uplift under that scenario, and projected the employment and cost outcomes through the regression models.

4.2. ARIMA Model Specification

ARIMA models that could minimize both Akaike Information Criterion (AIC) and Bayesian Information Criterion (BIC) were chosen. Due to the small time series data (three years), it is observed that the models agree on a simpler form that does not experience overfitting.
In the case of the employee forecast series, the AIC of 44.34 and BIC of 42.54 suggested that the selected model achieved a good balance between model fit and simplicity. Additionally, residual analysis revealed that the residuals were not significantly autocorrelated, implying that the autoregression extracted sufficient information about the data.

4.3. Regression Model Specification

Two regression models were estimated:
Employment Model
Total Employees = β₀ + β₁(Total Income) + ε
Employee Cost Model
Total Employee Costs = β₀ + β₁(Total Income) + ε
There was good fit for the employment model with AIC = 38.13 and BIC = 35.43, implying a close association between income levels and employment. The employee cost model had higher values of AIC (95.15) and BIC (92.45), suggesting greater variability in the cost structure of various organizations with respect to staff salary scales, seniority, and contracts. Both models were adequate for scenario forecasting.

4.4. Robustness Checks

Several robustness checks were conducted to validate model reliability. ACF plots for ARIMA models did not show any statistically significant autocorrelation, which supports the specification of the model. Forecasts from ARIMA, exponential smoothing, and regression approaches all shared similar directional findings, indicating the stabilisation of the sector, which supported the findings and ensuring cross-model consistency.
Projections for Scenario B were tested across alternative pass-through rates from 40% to 80%. Models responded smoothly and proportionally, indicating stability of the model behaviour. Even when accounting for the limitations of the short time series, the robustness checks supported the consistency of the economic forecasting model.

5. Results

5.1. Baseline Projections

Table 2 presents baseline ARIMA forecasts for FY2025 absent policy intervention.
The model did not detect strong upward or downward momentum, projecting stability around 5,236 employees and S$1.179 billion in income. The relatively narrow confidence intervals suggest low volatility, indicating the sector is unlikely to experience dramatic expansion or contraction absent significant policy intervention.
This baseline projection indicates that the sector has transitioned from recovery mode to a new steady state. The contraction observed in FY2024 appears to represent adjustment to a sustainable operating level rather than the beginning of prolonged decline.

5.2. Scenario Projections

Table 3 presents projected outcomes under the three funding scenarios for FY2025.
The similar predictions for FY2025 are consistent with the ARIMA assessment that the sector had achieved equilibrium after the post-pandemic volatility. The model did not identify substantial upward or downward trending and predicts an equilibrium of 5,236 employees and S$1.179 billion in revenues. The narrow confidence intervals implied low volatility, indicating the sector is unlikely to experience dramatic expansion or contraction in the absence of drastic government policy intervention.
The baseline projection showed that the sector has transited from the recovery phase to the new steady state. The contraction in FY2024 was likely a correction, indicating that a sustainable operating level was achievedm rather than the start of a prolonged decline.

5.2. Scenario Projections

Table 3 illustrates the expected results in the three funding options for FY2025.

5.3. Comparative Analysis of Scenarios

Scenario A
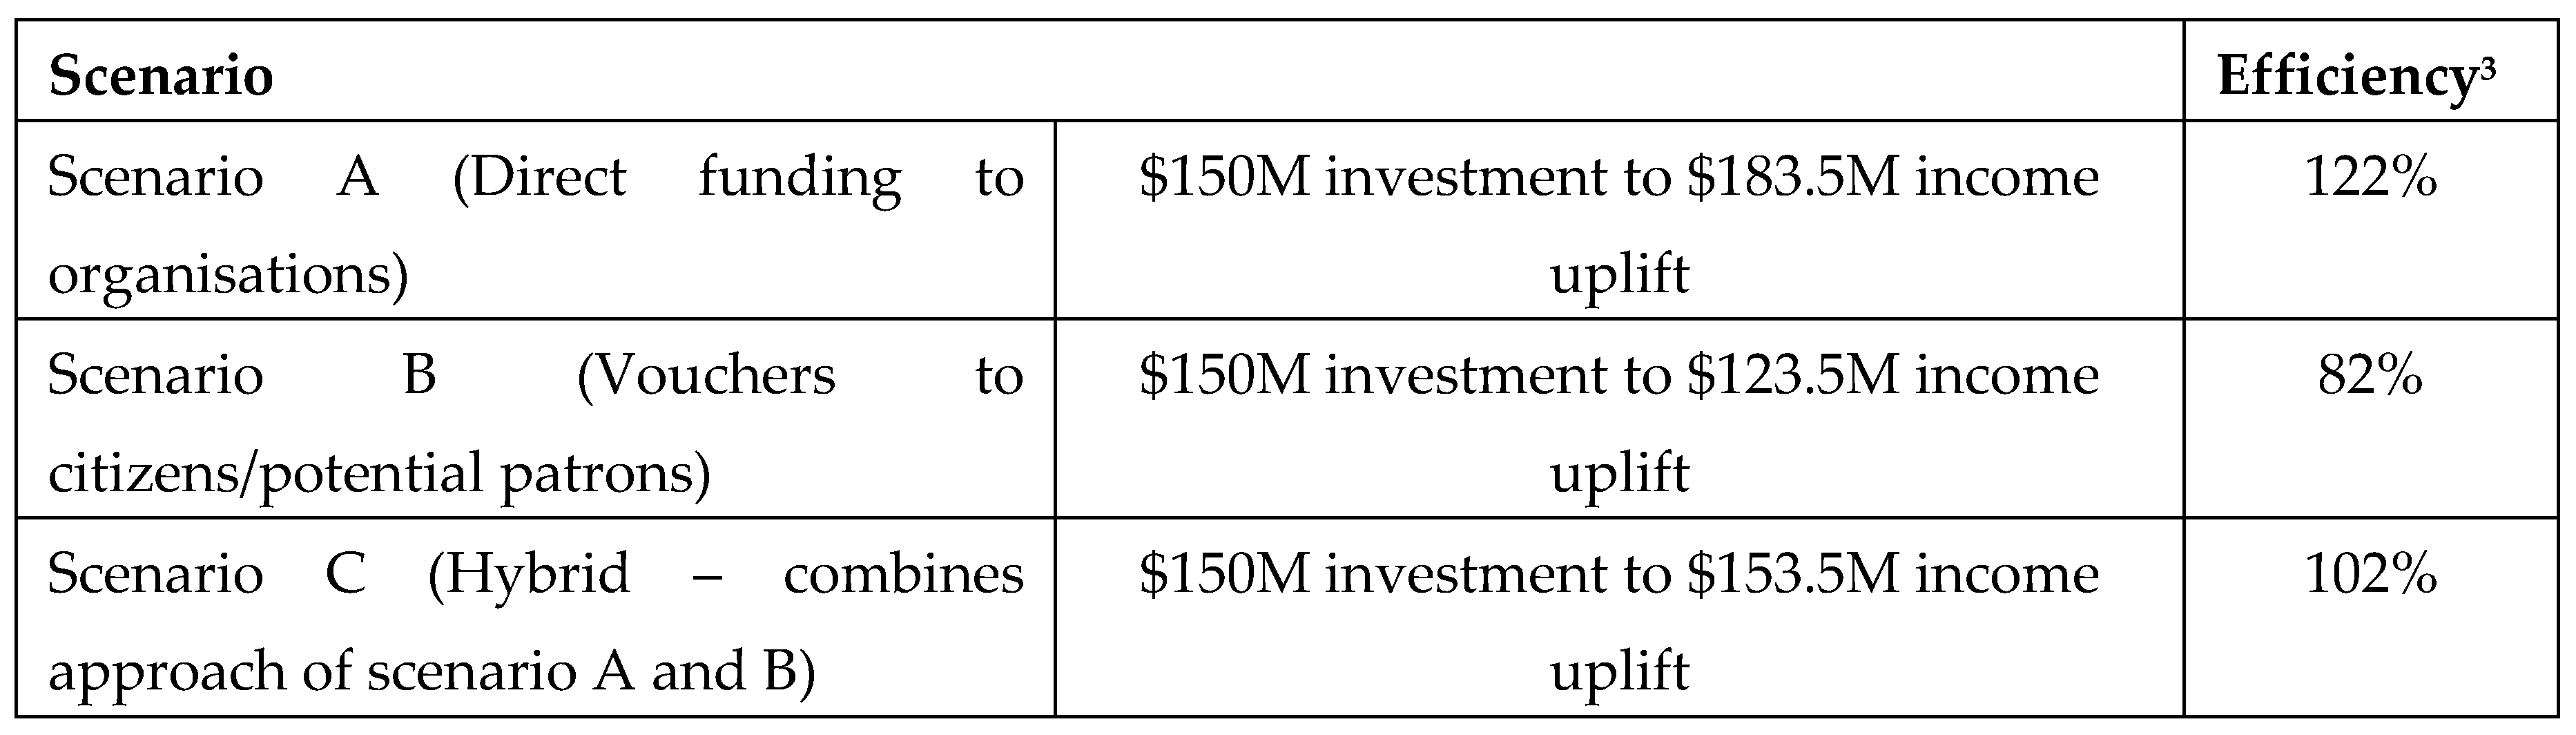
Direct Organisational Funding produced the greatest degree of change across all the indicators. Total income increased to $183.5 million (15.6% above baseline), supporting an additional 504 workers and an extra $28.5 in workforce expenditure. The $150 million funding was channelled into organisational income with little or no leakage, thus allowing immediate expansion of capacity.
Scenario B
Citizen-Directed Funding generated a modest level of growth. With a 60% pass-through rate, only $90 million out of a $150 million investment reaches the organisation, resulting in income increase of $123.5 million (10.5% above baseline). This supports an additional 339 workers and $19.2 million in work-force expenditure. Although this has lower efficiency than direct organisational funding, it does have its advantages, such as promoting citizen participation in cultural activities, inculcating a cultural consumption culture, and preferentially channels resource allocation towards organisations with greater cultural appeal to the public. according to appealing organisation audiences. The demand-driven nature of this approach would also stimulate organisational innovation, efficiency, and responsiveness.
Scenario C
The Hybrid Model produced intermediate outcomes, with an increase in income of $153.5m (13.0% above baseline), supporting an additional 422 workers, and $23.9m in workforce expenditure. This scenario combined the stability of direct organisational funding with the demand-driven benefits of voucher schemes. The hybrid approach is projected to deliver 83 more jobs than Scenario B whilst still retaining capacity to promote citizen participation in cultural activities.

5.4. Efficiency Comparison

Figure 1 illustrates the relative efficiency of each scenario in converting government investment into sector income.
The efficiency differences across scenarios reflected fundamental differences in funding mechanisms. Direct funding had achieved near-complete pass-through because all the money is channelled into organisational income immediately. Voucher schemes experienced leakage in numerous ways, such as non-redemption of vouchers and administrative costs. The hybrid model had achieved a balance with acceptable trade-offs, achieving moderate efficiency whilst preserving some of the benefits of a demand-driven approach.

5.5. Employment Impact Analysis

This study had also analysed the employment impact of each scenario. Table 4. breaks down the employment effects of each scenario.
Scenario A generatesd the most jobs in absolute terms (504 jobs for scenario A, 339 jobs for scenario B and 422 jobs for scenario C), but the jobs-per-dollar-of-income-uplift ratio is similar across all scenarios (approximately 2.75 jobs per S$1 million). This indicates that the employment-income relationship is stable regardless of funding mechanism. The differences in absolute job creation arises from the varying efficiency translation of funding into organisational income.
The employment impact findings have important policy implications: if employment generation is the primary objective, direct funding is most effective. However, if social goals such as audience development and cultural participation are desired, the lower employment impact of Scenario B may be acceptable in view of its social benefits.

6. Discussion

6.1. Theoretical Implications

This study’s findings illustrated trade-offs between supply-side and demand-side cultural funding. Direct organisational grants function as high-efficiency interventions which can immediately strengthen the sector capacity and workforce. Citizen-directed vouchers function as lower-efficiency demand-stimulation interventions, which have the capacity to raise cultural participation and market responsiveness.
These findings are consistent with broader economic theory on subsidy provision. Supply-side subsidies benefit vendors directly but may not alter consumer behaviour. Demand-side subsidies can influence consumer behaviour but outcome is more limited and heterogeneous. The hybrid model attempts to retain the benefits from both approaches whilst mitigating their respective limitations.

6.2. Policy Implications

The comparative scenario analysis yields several policy recommendations:
For immediate capacity stabilisation
Direct organisational funding (Scenario A) delivers the largest and most predictable impact. This approach is optimal when the policy priority is sustaining organisational capacity, maintaining employment, or enabling capital investments.
For long-term audience development
Citizen-directed funding (Scenario B) offers unique advantages despite lower efficiency. By subsidising consumption rather than production, voucher schemes can build cultural participation habits that persist beyond the subsidy period. This approach is optimal when the policy priority is expanding and diversifying audiences.
For balanced sector development
The hybrid model (Scenario C) is a compromise that addresses both organisational stability and demand cultivation. This approach is optimal when policymakers need to balance multiple objectives and circumvent the limitations of single-mechanism interventions.

6.3. Sensitivity to Assumptions

The crux of Scenario B and C projections is the assumed 60% pass-through rate. Sensitivity analysis reveals that outcomes change proportionally with this parameter. If the true pass-through rate is 40%, Scenario B would generate only $60 million in additional organisational income, supporting approximately 226 additional jobs. If the rate is 80%, it would generate $120 million in organisational income, supporting approximately 452 additional jobs.
This sensitivity highlights the importance of programme design in demand-side interventions. Factors influencing pass-through rates include voucher redemption requirements, eligible activity definitions, ease of utilisation, and marketing effectiveness. Policymakers implementing voucher schemes should prioritise design features that maximise redemption and minimise leakage.

6.4. Limitations and Future Research

This study’s primary limitation was the short time series (three years), which model complexity and confidence in long-term projections. As additional years of data become available, more complex models can be derived to take into account external variables such as seasonality and structural breaks.
Secondly, the analysis was segregated by sectors and did not factor in heterogeneity across organisation types, artistic disciplines, and locations. Future research should examine differential impacts across organisation categories, as voucher schemes may disproportionately benefit popular mainstream organisations whilst direct funding may better support niche or heritage-focused institutions.
Third, the study did not capture qualitative indicators such as artistic innovation, community engagement, or cultural diversity. Whilst financial indicators provide essential evidence for policy evaluation, they represent only one aspect of sector health. Mixed-methods research combining quantitative forecasting with qualitative assessment would provide further insights.
Finally, the pass-through rate assumption for Scenario B, whilst in keeping with international evidence, remains an estimate. More long-term data from Singapore’s Culture Pass programme will enable refinement of this parameter and validation of the scenario projections.

7. Conclusion

This study had demonstrated that government funding mechanisms significantly influence financial sustainability outcomes in the arts and heritage sector. Direct organisational grants generated larger and more immediate capacity uplift, whilst citizen-directed vouchers offered complementary benefits in audience development and market responsiveness. A hybrid approach provided a balance between these two approaches, providing a potentially optimal pathway for sustainable sector development.
The methodological contribution of this research lies in demonstrating the applicability of ARIMA forecasting and scenario-based regression analysis to cultural policy evaluation. Despite limited historical data, this approach yielded robust and policy-relevant projections. As cultural sectors worldwide navigate post-pandemic recovery and ongoing financial pressures, evidence-based forecasting tools become increasingly valuable for policy design.
For Singapore’s arts and heritage sector specifically, the findings suggested that a balanced funding strategy combining direct organisational support with targeted citizen incentives would maximise both short-term stability and long-term sustainability. Such an approach addressed the sector’s immediate capacity needs whilst simultaneously raising audience engagement and promoting revenue diversification.
Future research should extend this framework to examine longer time horizons, organisation-level heterogeneity, and include qualitative dimensions of sustainability to build more complex models.

Supplementary Materials

The following supporting information can be downloaded at the website of this paper posted on Preprints.org.

Conflicts of Interest

This study did not receive any funding and the authors declare that there is no conflict of interest in this study.

References

  1. Dalle Nogare, C.; Bertacchini, E. Emerging modes of public cultural spending: Direct support through production delegation. Poetics 2015, 49, 5–19. [Google Scholar] [CrossRef]
  2. Eppich, Rand; Grinda, José. Sustainable financial management of tangible cultural heritage sites. Journal of Cultural Heritage Management and Sustainable Development 2019, 9. [Google Scholar] [CrossRef]
  3. Jelinčić, D. A.; Šveb, M. Financial Sustainability of Cultural Heritage: A Review of Crowdfunding in Europe. Journal of Risk and Financial Management 2021, 14(3), 101. [Google Scholar] [CrossRef]
  4. Loots, E.; Betzler, D.; Bille, T.; et al. New forms of finance and funding in the cultural and creative industries. Introduction to the special issue. J Cult Econ 2022, 46, 205–230. [Google Scholar] [CrossRef] [PubMed]
  5. Mendoza, H. M.; Talavera, A. S. Governance Strategies for the Management of Museums and Heritage Institutions. Heritage 2025, 8(4), 127. [Google Scholar] [CrossRef]
  6. Müller, M.; Grieshaber, J. How sustainable are cultural organizations? A global benchmark. Sustainability: Science, Practice and Policy 2024, 20(1). [Google Scholar] [CrossRef]
  7. Radermecker, A. V. Art and culture in the COVID-19 era: for a consumer-oriented approach. SN business & economics 2021, 1(1), 4. [Google Scholar] [CrossRef]
  8. Scott-Lennox, J. A.; Blau, J. R.; Reid, H. M. Cultural supply, demand, and funding: A framework for the measurement of cultural indicators. Poetics 1993, 21(6), 481–498. [Google Scholar] [CrossRef]
  9. Throsby, D. The Production and Consumption of the Arts: A View of Cultural Economics. Journal of Economic Literature 1994, 32(1), 1–29. Available online: http://www.jstor.org/stable/2728421.
1
https://www.mccy.gov.sg/ Last accessed on 26 Dec 2025
2
All monetary figures are in USD, unless otherwise specified e.g. SGD
3
Efficiency calculated as (income uplift / investment) × 100. Values exceed 100% for Scenario A due to baseline income growth.
Figure 1. Funding Efficiency Scenario. 
Preprints 207759 g001
Table 1. Singapore Arts and Heritage Sector Indicators, FY2022–2024. 
Financial Year Total Employees Total Employee Costs ($)2 Total Income ($)
2022 4,979 449,774,644 1,080,324,038
2023 5,470 475,765,132 1,243,854,175
2024 5,260 469,210,511 1,212,337,730
Table 2. Baseline ARIMA Forecasts for FY2025. 
Indicator Point Forecast 80% Confidence Interval 95% Confidence Interval
Employees 5,236 4,921 – 5,552 4,753 – 5,719
Employee Costs S$464.9M S$447.6M – S$482.2M S$438.4M – S$491.4M
Income S$1.179B S$1.068B – S$1.290B S$1.009B – S$1.349B
Table 3. Scenario Projections for FY2025. 
Scenario Total Income (S$) Total Employees Employee Costs (S$) Income Uplift vs Baseline
Baseline 1,178,838,648 5,236 464,916,762
Scenario A (Direct) 1,362,337,730 5,740 493,449,892 +$183.5M (+15.6%)
Scenario B (Voucher) 1,302,337,730 5,575 484,120,212 +$123.5M (+10.5%)
Scenario C (Hybrid) 1,332,337,730 5,658 488,785,052 +$153.5M (+13.0%)
Table 4. Employment Impact Decomposition. 
Scenario Additional Jobs vs Baseline Jobs per S$1M Investment Jobs per S$1M Income Uplift
A 504 3.36 2.75
B 339 2.26 2.74
C 422 2.81 2.75
Disclaimer/Publisher’s Note: The statements, opinions and data contained in all publications are solely those of the individual author(s) and contributor(s) and not of MDPI and/or the editor(s). MDPI and/or the editor(s) disclaim responsibility for any injury to people or property resulting from any ideas, methods, instructions or products referred to in the content.
Copyright: This open access article is published under a Creative Commons CC BY 4.0 license, which permit the free download, distribution, and reuse, provided that the author and preprint are cited in any reuse.
Prerpints.org logo

Preprints.org is a free preprint server supported by MDPI in Basel, Switzerland.

Subscribe

Disclaimer

Terms of Use

Privacy Policy

Privacy Settings

© 2026 MDPI (Basel, Switzerland) unless otherwise stated